the Creative Commons Attribution 4.0 License.
the Creative Commons Attribution 4.0 License.
 | 15 Mar 2021
Statistical aerosol properties associated with fire events from 2002 to 2019 and a case analysis in 2019 over Australia
Xingchuan Yang
Yikun Yang
Wildfires are an important contributor to atmospheric aerosols in Australia and could significantly affect the regional and even global climate. This study investigates the impact of fire events on aerosol properties along with the long-range transport of biomass-burning aerosol over Australia using multi-year measurements from Aerosol Robotic Network (AERONET) at 10 sites over Australia, a satellite dataset derived from the Moderate Resolution Imaging Spectroradiometer (MODIS) and the Cloud-Aerosol Lidar with Orthogonal Polarization (CALIOP), reanalysis data from Modern-Era Retrospective analysis for Research and Applications version 2 (MERRA-2), and back-trajectories from the Hybrid Single Particle Lagrangian Integrated Trajectory (HYSPLIT) model. The fire count, fire radiative power (FRP), and aerosol optical depth (AOD) showed distinct and consistent interannual variations, with high values during September–February (biomass-burning period, BB period) and low values during March–August (non-biomass-burning period, non-BB period) every year. Strong correlation (0.62) was found between FRP and AOD over Australia. Furthermore, the correlation coefficient between AOD and fire count was much higher (0.63–0.85) during October–January than other months (−0.08 to 0.47). Characteristics of Australian aerosols showed pronounced differences between the BB period and non-BB period. AOD values significantly increased and fine-mode aerosol dominated during the BB period, especially in northern and southeastern Australia. Carbonaceous aerosol was the main contributor to total aerosols during the BB period, especially in September–December when carbonaceous aerosol contributed the most (30.08 %–42.91 %). Aerosol size distributions showed a bimodal character, with both fine and coarse aerosol particles generally increasing during the BB period. The megafires during the BB period of 2019/2020 further demonstrated the significant impact of wildfires on aerosol properties, such as the extreme increase in AOD for most of southeastern Australia, the dominance of fine particle aerosols, and the significant increase in carbonaceous and dust aerosols in southeastern and central Australia, respectively. Moreover, smoke was found to be the dominant aerosol type detected at heights from 2.5 to 12 km in southeastern Australia in December 2019 and at heights from roughly 6.2 to 12 km in January 2020. In contrast, dust was detected more frequently at heights from 2 to 5 km in November 2019 and January and February 2020. A case study emphasized that the transport of biomass-burning aerosols from wildfire plumes in eastern and southern Australia significantly impacted the aerosol loading, aerosol particle size, and aerosol type of central Australia.
- Article
(12856 KB) - Full-text XML
-
Supplement
(150 KB) - BibTeX
- EndNote


Biomass burning is a major global source of fine carbonaceous aerosols in the form of organic carbon (OC) and black carbon (BC) (Vermote et al., 2009). Biomass-burning aerosols are mainly generated by man-made fires, such as agricultural burning, deforestation, and biofuels combustion, and natural fires that include lightning-induced wildfires. The major global source regions of biomass-burning aerosols are sub-Saharan Africa, South America, Southeast Asia, northern Australia, and the boreal forest in the Northern Hemisphere (Ito and Penner, 2004; Mitchell et al., 2006). Abundant aerosols emitted from fires could affect the Earth's climate system through both direct and indirect effects (Jacobson, 2014). Aerosols such as biomass-burning aerosols and dust aerosols not only warm the atmosphere and cool the Earth's surface by reducing sunlight through absorption and scattering but also modify cloud microphysical properties by acting as cloud-condensation nuclei or ice nuclei (Garrett and Zhao, 2006; Wang et al., 2013; Fujii et al., 2015; Zhao and Garrett, 2015; Grandey et al., 2016; Jiang et al., 2018; Zhao et al., 2018; Yang et al., 2019; Liu et al., 2019). Moreover, biomass-burning aerosols can cause environmental pollution and thus affect public health (Crippa et al., 2016; He et al., 2016; Yang et al., 2016; Yang et al., 2018; Zhu et al.,2018; Yan et al., 2019; Rooney et al., 2020).
Tropical northern Australia is dominated by a savanna ecosystem with grassland and woodland, while southeastern Australia is largely vegetated by eucalyptus forest. Meyer et al. (2012) found that approximately 550 000 km2 of tropical and arid savannah is burned each year in Australia. Australia contributes about 6 %–8 % of global carbon emissions from biomass burning (van der Werf et al., 2006; Meyer et al., 2008). It is also found that biomass-burning aerosols are the dominant aerosol type in northern and southeastern Australia during spring and summer, respectively (Mitchell et al., 2013; Yang et al., 2020b). Northern Australia showed a distinct seasonal cycle in aerosol optical depth (AOD) and Ångström exponent (AE), with the highest aerosol loading occurring in spring (burning season) and the highest AE values occurring in August (Mitchell et al., 2013). Mitchell et al. (2006) investigated the characteristics and radiative impact of the smoke aerosol during the Canberra firestorm of January 2003. They found that the single-scattering albedo of the aerosols was ∼ 0.96 and the daily mean forcing during the week following the firestorm was a cooling of 50 W m−2. Additionally, air quality was also significantly affected by smoke from biomass burning over Australia (Meyer et al., 2008; Reisen et al., 2011; He et al., 2016).
During the period September 2019–February 2020, large areas of southeastern Australia were ravaged by deadly wildfire, causing extensive damage to the property and environment. According to the report of Filkov et al. (2020), a total of 55957.39 and 15050.04 km2 were burned, and 2475 and 396 houses were destroyed in New South Wales and Victoria during the 2019/2020 fire season, making it the most devastating fire season in either state's history. During the wildfire periods, a large amount of aerosols containing smoke, dust, and other burning material were uplifted into the atmosphere and were even transported around the world, which significantly affected regional and global atmospheric chemistry, the carbon cycle, and the surface radiation budget. For example, Torres et al. (2020) found that the megafires in New South Wales, Australia, injected a large amount of carbonaceous aerosols into the stratosphere. These wildfires significantly affected local air quality and visibility and were also transported to New Zealand, resulting in degraded air quality in some cities. Ohneiser et al. (2020) found that the smoke from extreme wildfires in southeastern Australia crossed the Pacific Ocean and arrived at Punta Arenas in South America.
There are many studies that have investigated the fire events and their association with enhancing aerosol loading and degrading air quality in Australia (Mitchell et al., 2006; Luhar et al., 2008; Meyer et al., 2008; Bouya and Box, 2011; Mitchell et al., 2013; Mallet et al., 2017; Chen et al., 2019). However, most of these studies are carried out based on observations at specific region or site or over a short time period. Long-term statistical analysis about the properties of fire-induced aerosols is highly demanded over a large domain. In addition, northern and southeastern Australia have frequently suffered from wildfires, especially during the fire season of 2019/2020. It is also highly valuable to fully understand the impacts of the huge fire events that occurred in 2019/2020 over southeastern Australia. In this study, multi-year aerosol products from ground-based observations (i.e., Aerosol Robotic Network, AERONET) and satellite-based techniques (e.g., Moderate Resolution Imaging Spectroradiometer, MODIS; Cloud-Aerosol Lidar and Infrared Pathfinder Satellite Observation, CALIPSO) are used to study the impacts of long-term fire events on aerosol properties over Australia. In addition, we further investigated the aerosol properties associated with the huge fire events in 2019/2020 over southeastern Australia, including the impacts on aerosols over central Australia caused by the long-range transport of biomass-burning aerosols.
The paper is organized as follows. Section 2 describes the study area, data, and method. Section 3 shows the long-term statistical aerosol properties associated with fire events in Australia, aerosol characteristics in Australia during the period in 2019/2020 with huge fire events, and the aerosol contribution for a case study from long-range transport of biomass-burning aerosols. Section 4 summarizes the findings of the study.
2.1 Study area
Australia is situated in the Southern Hemisphere between the Indian Ocean and southern Pacific Ocean. Australian climate varies greatly throughout its eight main states and territories and can be divided into six climatic zones (i.e., temperate, grassland, desert, subtropical, tropical, and equatorial) based on modified Köppen climate classification system (Fig. 1a). Northern Australia lies in the tropical zone and has a wet and dry season. Central Australia is a desert region with high temperature and evaporation and low amounts of rain during summer. Southern Australia belongs to the temperate zone, with hot dry summer and cold winter. In this study, the observations at 10 AERONET sites across Australia were adopted for analysis. Table 1 shows the detailed information of site locations and the available data period at each site. Figure 1b shows the kernel density estimation (KDE) of fire spots over Australia from June 2019 to May 2020, and the gray-shaded area is the selected domain for vertical profile analysis in this study.
Table 1Site location and data time period at each site used in this study.


Figure 1(a) Climatic zones of Australia defined by the Köppen climate classification system. The black stars represent 10 AERONET sites located in Australia. The classified climate zones of Australia were obtained from Australian Bureau of Meteorology (http://media.bom.gov.au, last access: 3 February 2021). (b) Kernel density estimation (KDE) of the number of wildfire events based on MCD14DL with a confidence level greater than 50 % over Australia from June 2019 to May 2020. The gray-shaded area is the selected domain for vertical profile analysis in this study.
2.2 Data
2.2.1 Ground-based data
AERONET is a global aerosol monitoring network based on ground-based sun–sky photometers. It autonomously measures direct-sun irradiance and directional sky radiance and provides long-term and high-quality datasets of aerosol optical, microphysical, and radiative properties (Holben et al., 1998; Yan et al., 2018). The uncertainty of AERONET direct measurement AOD is ±0.01 at visible wavelengths and ±0.02 at near-UV wavelengths (Dubovik et al., 2000). In this study, level 2.0 quality-controlled and cloud-screened data of the aerosol spectral deconvolution algorithm (SDA) AOD and AE from AERONET version 3 were used to understand the aerosol loading and aerosol particle size. The retrievals of aerosol microphysical properties such as particle volume size distribution (ddlnr) and single-scattering albedo (SSA) are used in this study. The detailed retrieval algorithm can be found in Dubovik et al. (2000) and Dubovik et al. (2006), and hence are not reintroduced in this paper. The retrieval errors of ddlnr did not exceed 10 % in the maxima of the ddlnr and may increase up to 35 % for the minimum values of the ddlnr in the intermediate particle size range ( µm). The retrieval error of ddlnr increased significantly for the edges of the particle size interval but did not significantly affect the derivation of the main features of the particle size distribution (Dubovik et al., 2002). Level 1.5 data were used from January 2018 to May 2020 due to the lack of level 2.0 data at a few sites during the period. In addition, the Canberra site in southeastern Australia ceased to provide data in August 2017, while the neighboring Tumbarumba site began providing observations from July 2019. Due to the similarity of aerosol sources at the two sites, we combined their data to analyze aerosol properties in southeastern Australia.
2.2.2 Satellite remote sensing data
The MODIS is a 36-band imaging radiometer onboard the NASA EOS (Earth Observation System) Terra and Aqua platforms and provides globally long-term atmospheric data to monitor the characteristics and dynamics of aerosols (Remer et al., 2005). Sayer et al. (2014) found that the terrain is arid and bright over much of Australia. The MODIS Dark Target (DT) algorithm often retrieves small positive or negative AOD, while the Deep Blue (DB) algorithm can retrieve more available values, with 85 % of AOD retrievals falling within the expected error envelope in Oceania. Therefore, in this study the dataset named “Deep_Blue_Aerosol_Optical_Depth_550_Land_Best_ Estimate” from Aqua MODIS C61 level 2 aerosol product (MYD04_l2) with a spatial resolution of 10 km during the period July 2002–May 2020 was used to investigate the AOD spatiotemporal variations. The MODIS active fire product (MCD14ML) data refer to the active fire hotspots determined using the thermal anomalies at 1 km pixel resolution (Giglio et al., 2016). The fire hotspot count and fire radiative power (FRP) from the MCD14ML data with a confidence level greater than 50 % from January 2002 to May 2020 were used to explore their relationship with AOD. The CALIPSO was launched in April 2006 equipped with CALIOP (Cloud-Aerosol Lidar with Orthogonal Polarization) and observes global aerosol cloud vertical distributions at 532 and 1064 nm during both day and night, which provides the possibility of studying the impact of clouds and atmospheric aerosols on the Earth's weather, climate, and air quality (Winker et al., 2003). Omar et al. (2013) found that when cloud cleared and quality-controlled extinction CALIOP data was compared with AERONET data with AOD less than 1.0 , the mean relative difference between the two measurements was 25 % of AERONET AOD. Additionally, the CALIPSO AOD showed a good agreement (R=0.65) with AERONET AOD at Lake Argyle in northern Australia. In this study, the vertical feature mask (VFM) data from the level 2 profile product (V4.20) were used to obtain the information about aerosol types (e.g., smoke, dust, polluted dust, etc.) over Australia.
2.2.3 Reanalysis data
The Modern-Era Retrospective analysis for Research and Applications version 2 (MERRA-2) is NASA's latest global atmospheric reanalysis product, produced by the NASA Global Modeling and Assimilation Office (GMAO) (Gelaro et al., 2017). MERRA-2 provides long-term aerosol assimilation with a horizontal resolution of 0.5∘ × 0.625∘ on 72 sigma-pressure hybrid layers between the surface and 0.01 hPa from 1980 to the present (Randles et al., 2017). In this study, the monthly MERRA-2 products were used to analyze the spatial and temporal variations of aerosols over Australia from January 2002 to May 2020. ECMWF (European Centre for Medium-Range Weather Forecasts) Reanalysis version 5 (ERA-5) (Hersbach and Dee, 2016) is the latest climate reanalysis product developed by the European Centre for Medium-Range Weather Forecasts. ERA-5 provides global hourly and monthly atmospheric data with a spatial resolution of 0.25∘ × 0.25∘ at 37 pressure levels, which is widely used in various studies (Zhao et al., 2018; Albergel et al., 2018; Wang et al., 2019). ERA-5 adds additional characteristics to ERA-Interim reanalysis, making it even richer in climate information (Albergel et al., 2018). In this study, monthly U-wind, V-wind, and total precipitation from ERA-5 dataset were used for meteorology analysis.
2.3 Method
The relationships among AOD, fire count, fire radiative power (FRP), and total precipitation over Australia were investigated by using MODIS AOD, fire hotspot count, and fire radiative power data from MCD14ML with a confidence level greater than 50 % and total precipitation data from ERA-5. The total AOD, fine-mode AOD, coarse-mode AOD, and AE from AERONET and the AOD products from MODIS and MERRA-2 were utilized to explore spatiotemporal variations associated with the fire events over Australia. A case of long-range transport of biomass-burning aerosols was selected for case study based on the AERONET observations at Birdsville. The 72 h back trajectories for the Birdsville site, with altitudes of 200 and 500 m above ground level (a.g.l.), were simulated by using HYSPLIT, which was driven by the 1∘ by 1∘ horizontal resolution meteorological fields from the Global Data Assimilation System (GDAS). Then, the Meteoinfo version 2.4.1 (http://meteothink.org/, last access: 3 February 2021) framework was employed to cluster the back trajectories by using the Euclidean distance method. The HYSPLIT back trajectories, the ERA-5 wind fields, and the MODIS and CALIOP AOD products were used to investigate the potential aerosol sources, spatial aerosol loading, and vertical features of the aerosol over central Australia during the case period.
To evaluate the accuracy of MERRA-2 monthly AOD products, the monthly AERONET AOD values were calculated based on the daily measurements. In this study, the quality-controlled and cloud-screened AOD from AERONET was used to evaluate the performance of MERRA-2 AOD only for cloud-free conditions, while MERRA-2 AOD provides the aerosol information in both cloud-free and cloudy conditions. Several statistical variables were used in this study for MERRA-2 AOD performance, including the correlation coefficient (R), the root-mean-square error (RMSE), and relative mean bias (RMB). R was used to analyze the correlation between AERONET and MERRA-2 AOD. The RMSE (Eq. 1) and RMB (Eq. 2) were used to evaluate the uncertainty of MERRA-2 monthly AOD products.
3.1 Long-term statistical aerosol properties associated with fire events in Australia
3.1.1 Variations and relationships between fire events, precipitation, and aerosol amount
The fire counts and FRP values provide information about the fire frequencies and emissions. The FRP is increasingly used to quantify the regional and global biomass consumption, trace gas, and aerosol amount (Boschetti and Roy, 2009). Figure 2a presents the monthly averaged FRP and fire counts detected by MODIS with a confidence level above 50 % during the period January 2002 to May 2020 over Australia. The fire counts and FRP both showed significant interannual variations, with monthly mean values of 18 014 and 71.26 MW over Australia, respectively. The high FRP values were observed from September to the following February with a maximum value of 104.62 MW in January. The fire counts showed a high occurrence during the period September–December, with a mean number of 31 006 over Australia. Figure 2b shows the monthly variations of MODIS AOD at 550 nm and total precipitation during the period from January 2002 to May 2020 over Australia. It was clear that the MODIS AOD exhibited distinct interannual variations with high values during the period September–February (0.038–0.063) and low values during the period March–August (0.025–0.034). The temporal AOD variations over Australia were well correlated with that of FRP (R=0.62) for the whole 19-year period, while the temporal AOD variations were weakly correlated with that of fire counts (R=0.43). Furthermore, the peak of the monthly mean AODs coincides with the FRP peak in the months of October–January each year (Table S1 in the Supplement). The correlation between AOD and fire counts was much higher (0.63–0.85) during the period of October–January than other months (−0.08 to 0.47). This was related to the intensive and frequent fires in the tropical savannas of northern Australia and the temperate area in southern Australia. It is worth mentioning that the frequent dust activities over central Australia also contributed to the increase in AOD in spring and summer, which may weaken the correlation coefficient between AOD and FRP or fire counts. The total precipitation was found with high values during the period December–March and low values in other months. In most cases, the peaks of AOD were observed earlier than the peaks of total precipitation during the period January 2002–May 2020, which was consistent with the fact that high AOD values (including the maxima) occur in the dry season (typically April–November).
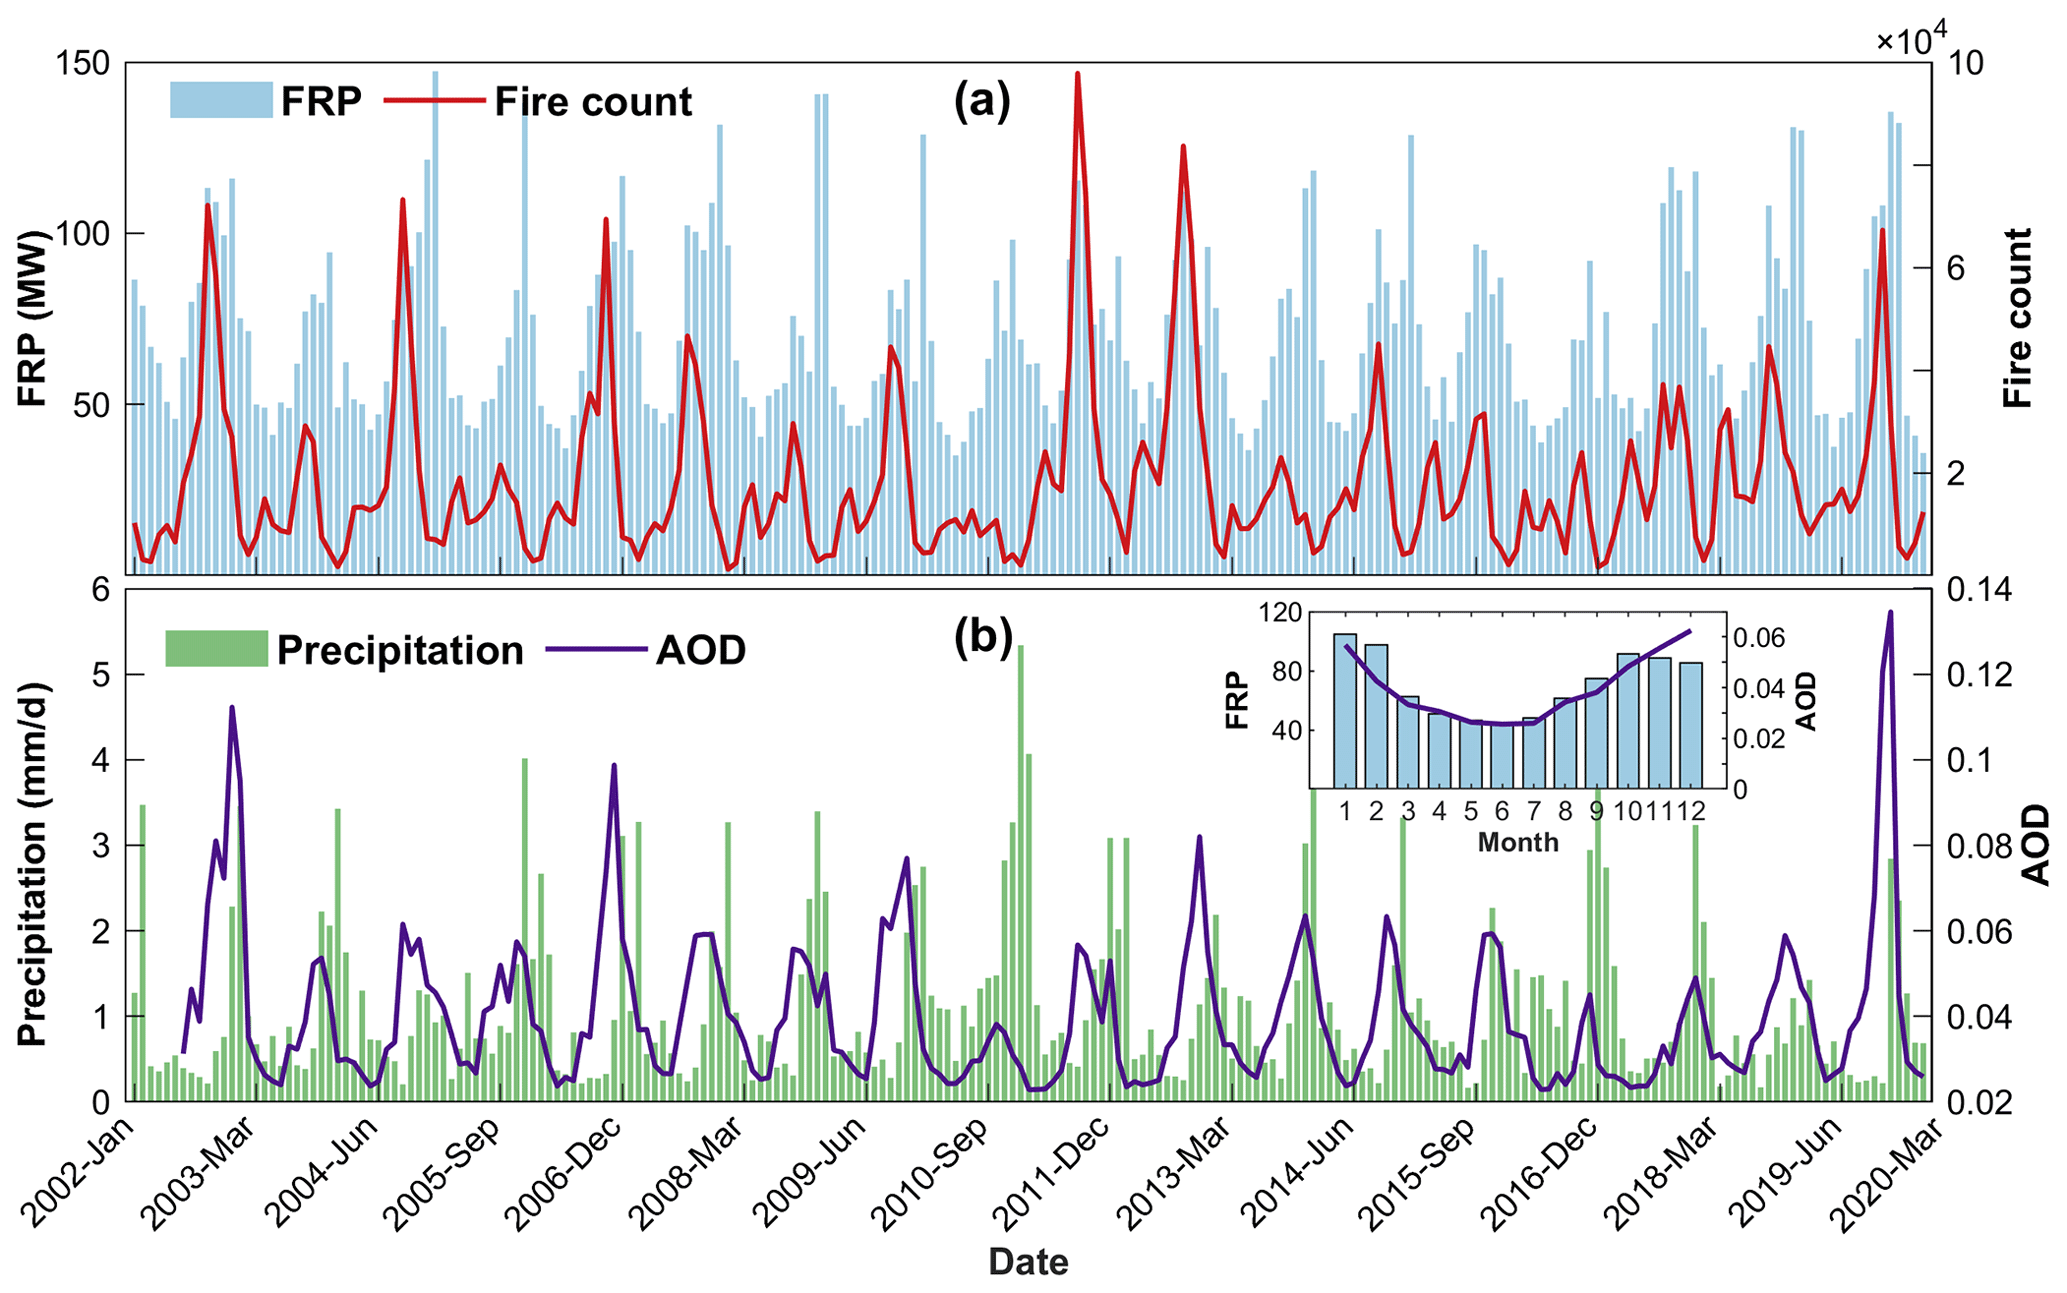
Figure 2Time series of monthly averaged fire radiative power (FRP), fire count from MCD14ML (a), and total precipitation from ERA-5 and Aqua MODIS DB AOD (b) in Australia.
3.1.2 Aerosol optical depth, size distribution, and single-scattering albedo
Generally, the seasonality of MODIS AOD and FRP over Australia showed that the high mean AODs coincided with the FRP during the period September–February every year. Moreover, the high fire counts were recorded during the period of September–December. Dutta et al. (2016) demonstrated that fire events were frequent and severe over Australia during the period September–February. Mitchell et al. (2013) showed that high AOD values (> 0.1) were observed at three sites (i.e., Lake Argyle, Jabiru, and Darwin) in northern Australia during the months September–February, with maximum values of ∼ 0.28 in October. Higher AOD values were also commonly observed during the months September–February in southeastern Australia (Mitchell et al., 2017; Yang et al., 2020b). Previous studies showed that biomass-burning aerosols dominated during this time in northern and southeastern Australia (Wardoyo et al., 2007; Mitchell et al., 2006; Radhi et al., 2012). Furthermore, the Australian continent was affected by biomass-burning aerosols due to the transport of smoke across the entire region (Mitchell et al., 2013; Yang et al., 2020b). Therefore, we defined the period of September–February as the biomass-burning (BB) period and the period of March–August as the non-biomass-burning (non-BB) period. Figure 3 shows the temporal variations of annual mean AERONET and MODIS AOD during the BB period and the non-BB period at 10 sites. In general, Aqua MODIS DB AOD and AERONET AOD showed similar annual variations during both the BB period and non-BB period at most sites. However, there were differences in the trends of MODIS AOD and AERONET AOD at a few sites (e.g., Adelaide Site 7, Birdsville, Lake Lefroy), which is mainly due to the missing observations of AERONET at those sites. For example, there was a significant difference between the trends in MODIS and AERONET AOD at Birdsville in 2006 and 2013–2014. This is related to the large amount of missing data of AERONET during the periods October–December in 2016 and October 2013–February 2014, which coincided with the periods of dust outbreak at Birdsville. From Fig. 3, it can be seen that both MODIS and AERONET observations showed higher AOD values during the BB period than the non-BB period at 10 sites in Australia. The range of the annual averaged AERONET (MODIS) AODs during the BB period was 0.067–0.206 (0.023–0.089), while the range during the non-BB period was 0.032–0.087 (0.020–0.067). The result indicated that the AOD during the BB period contributed dominantly to the annual AOD at 10 AERONET sites. The sites in the northern Australia (i.e., Jabiru and Lake Argyle) had higher averaged AOD values during both the BB period and non-BB period compared to other sites, which was related to the wildfire activities during the BB period and active sea salt production driven by strong winds during the non-BB period. Furthermore, the two sites exhibited significant interannual variations during the BB period, especially at Lake Argyle. Additionally, a significant increase in AOD was observed during the BB period of 2019/2020 at sites in southeastern Australia, such as Tumbarumba, Fowlers Gap, and Adelaide site 7, which can be explained by the intensive and frequent fire activities in this region during that period.
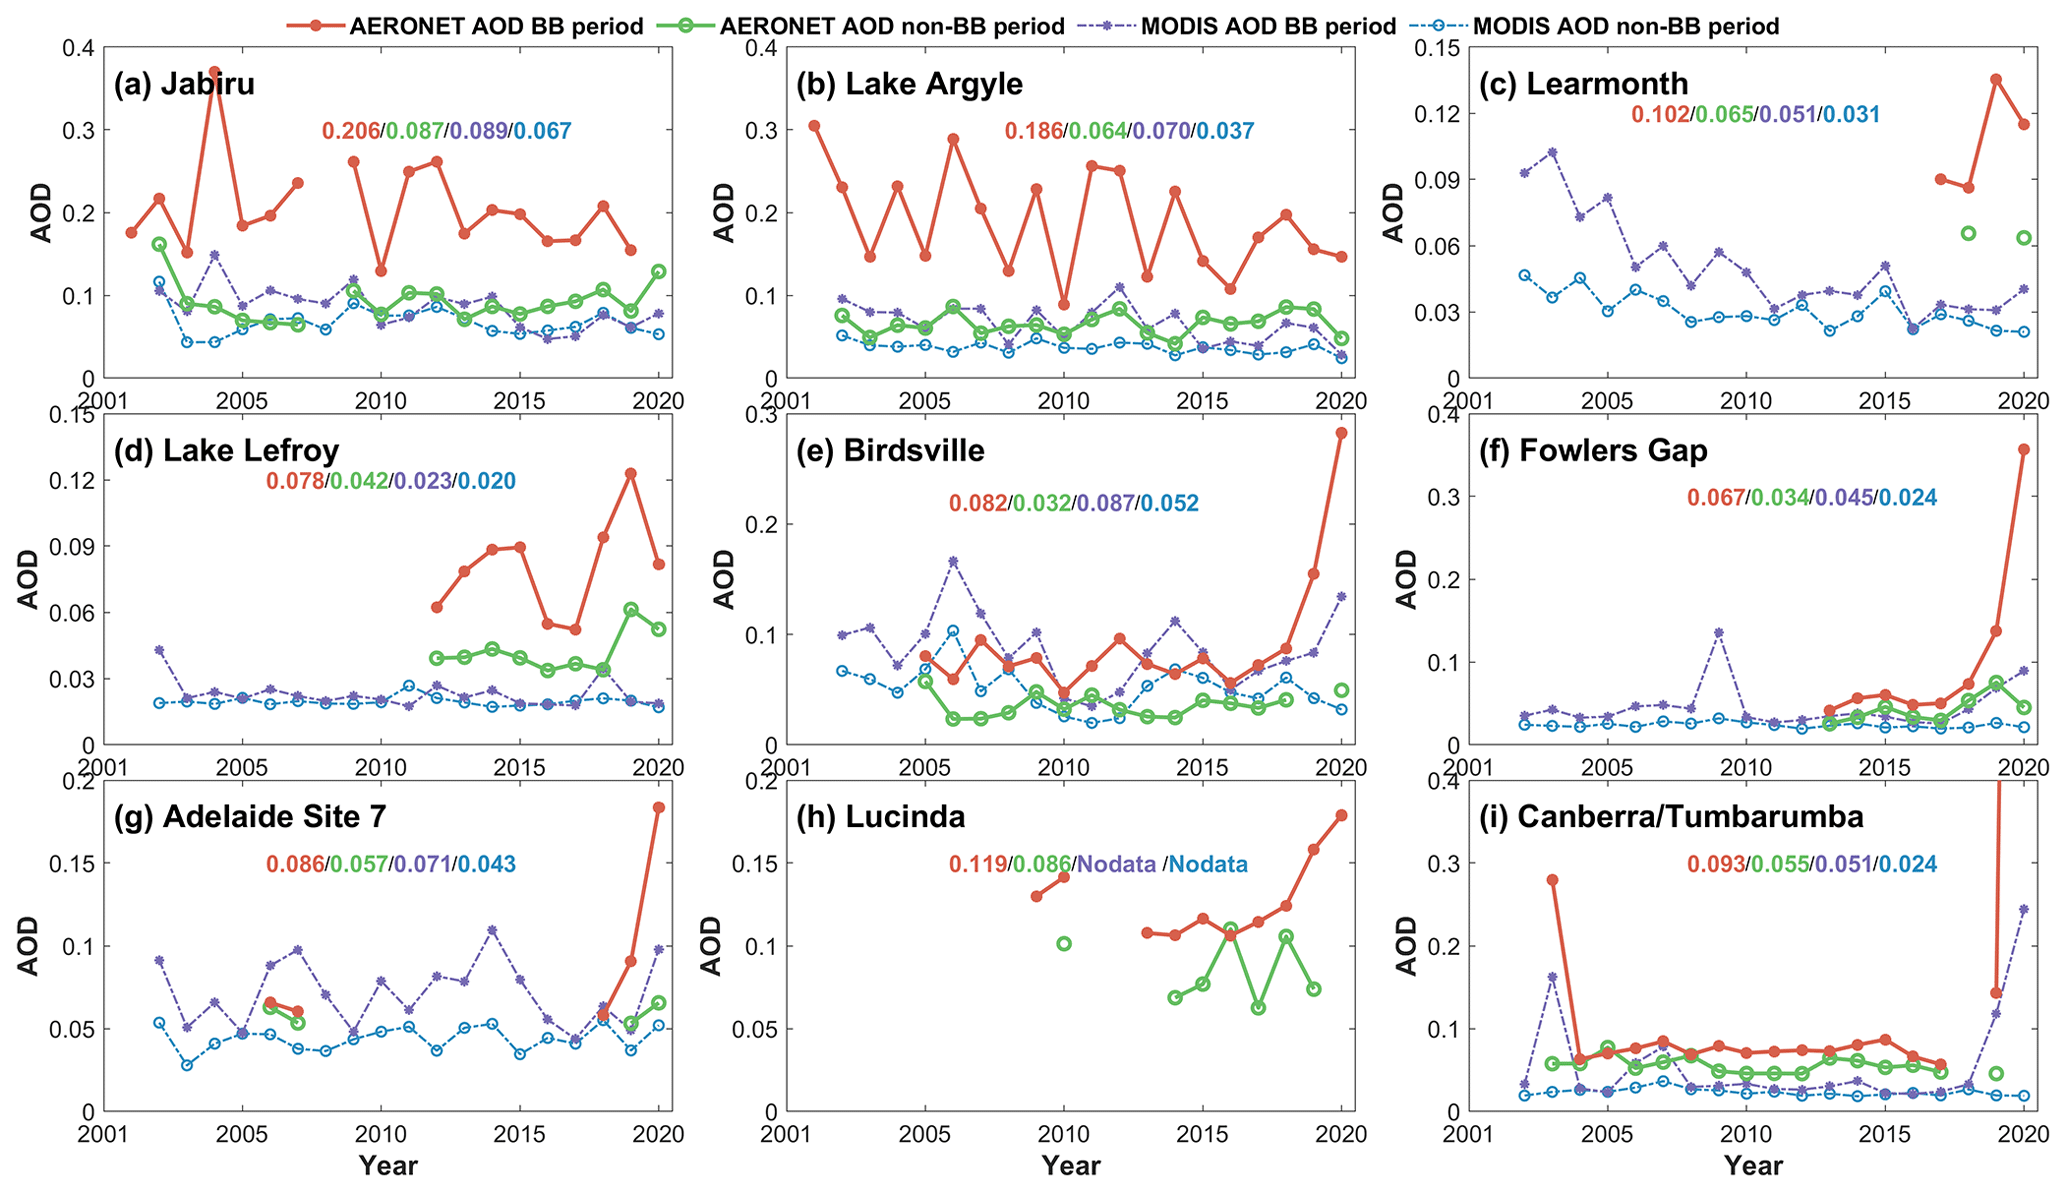
Figure 3Temporal variations of annual mean AERONET AOD at 500 nm and Aqua MODIS DB AOD at 550 nm during the BB period and the non-BB period at nine sites in Australia. The numbers above the graphs with different colors refer to the corresponding average values.
Figure 4 shows the spatial distributions of Aqua MODIS DB AOD averaged for all study periods (Fig. 4a), the non-BB periods during 2002–2020 (Fig. 4b), the BB periods during 2002–2018 (Fig. 4c), and the BB period of 2019/2020 (Fig. 4d). Overall, MODIS AODs averaged in different periods show similar spatial distributions but differ in their details. High AODs were observed in northern, southeastern, and central Australia, while low AODs were observed in the desert areas of western Australia. The result was in agreement with the earlier findings (Mehta et al., 2016, 2018). The multi-year average MODIS AOD was 0.040, with high AODs observed in eastern Australia (∼ 0.14) and a gradually decreasing trend westwards. During the non-BB period, the averaged MODIS AOD values remain low (0.030). The AOD values were less than 0.02 for most of western Australia with the highest value (0.045) observed in northern Australia. As huge fire events occurred in southeastern Australia during the BB period of 2019/2020, we compared the spatial distributions of MODIS AOD during the BB period between the periods of 2002–2018 and 2019/2020. The result showed that comparatively high aerosol loadings were observed during the BB period over Australia. The averaged MODIS AODs during the BB period of 2002–2018 and 2019/2020 were 0.051 and 0.073, respectively. The high AOD values larger than 0.1 were recorded over northern and southeastern Australia due to biomass burning, while the high AODs in central Australia were mainly due to dust events over the Lake Eyre basin during the BB period. This result also confirmed that the high aerosol loadings during the BB period contributed more to the annual AOD. Furthermore, many more AOD values higher than 0.15 were observed in southeastern Australia during the BB period of 2019/2020, as compared to the BB period of 2002–2018, which was consistent with the observations of AERONET in southeastern Australia.
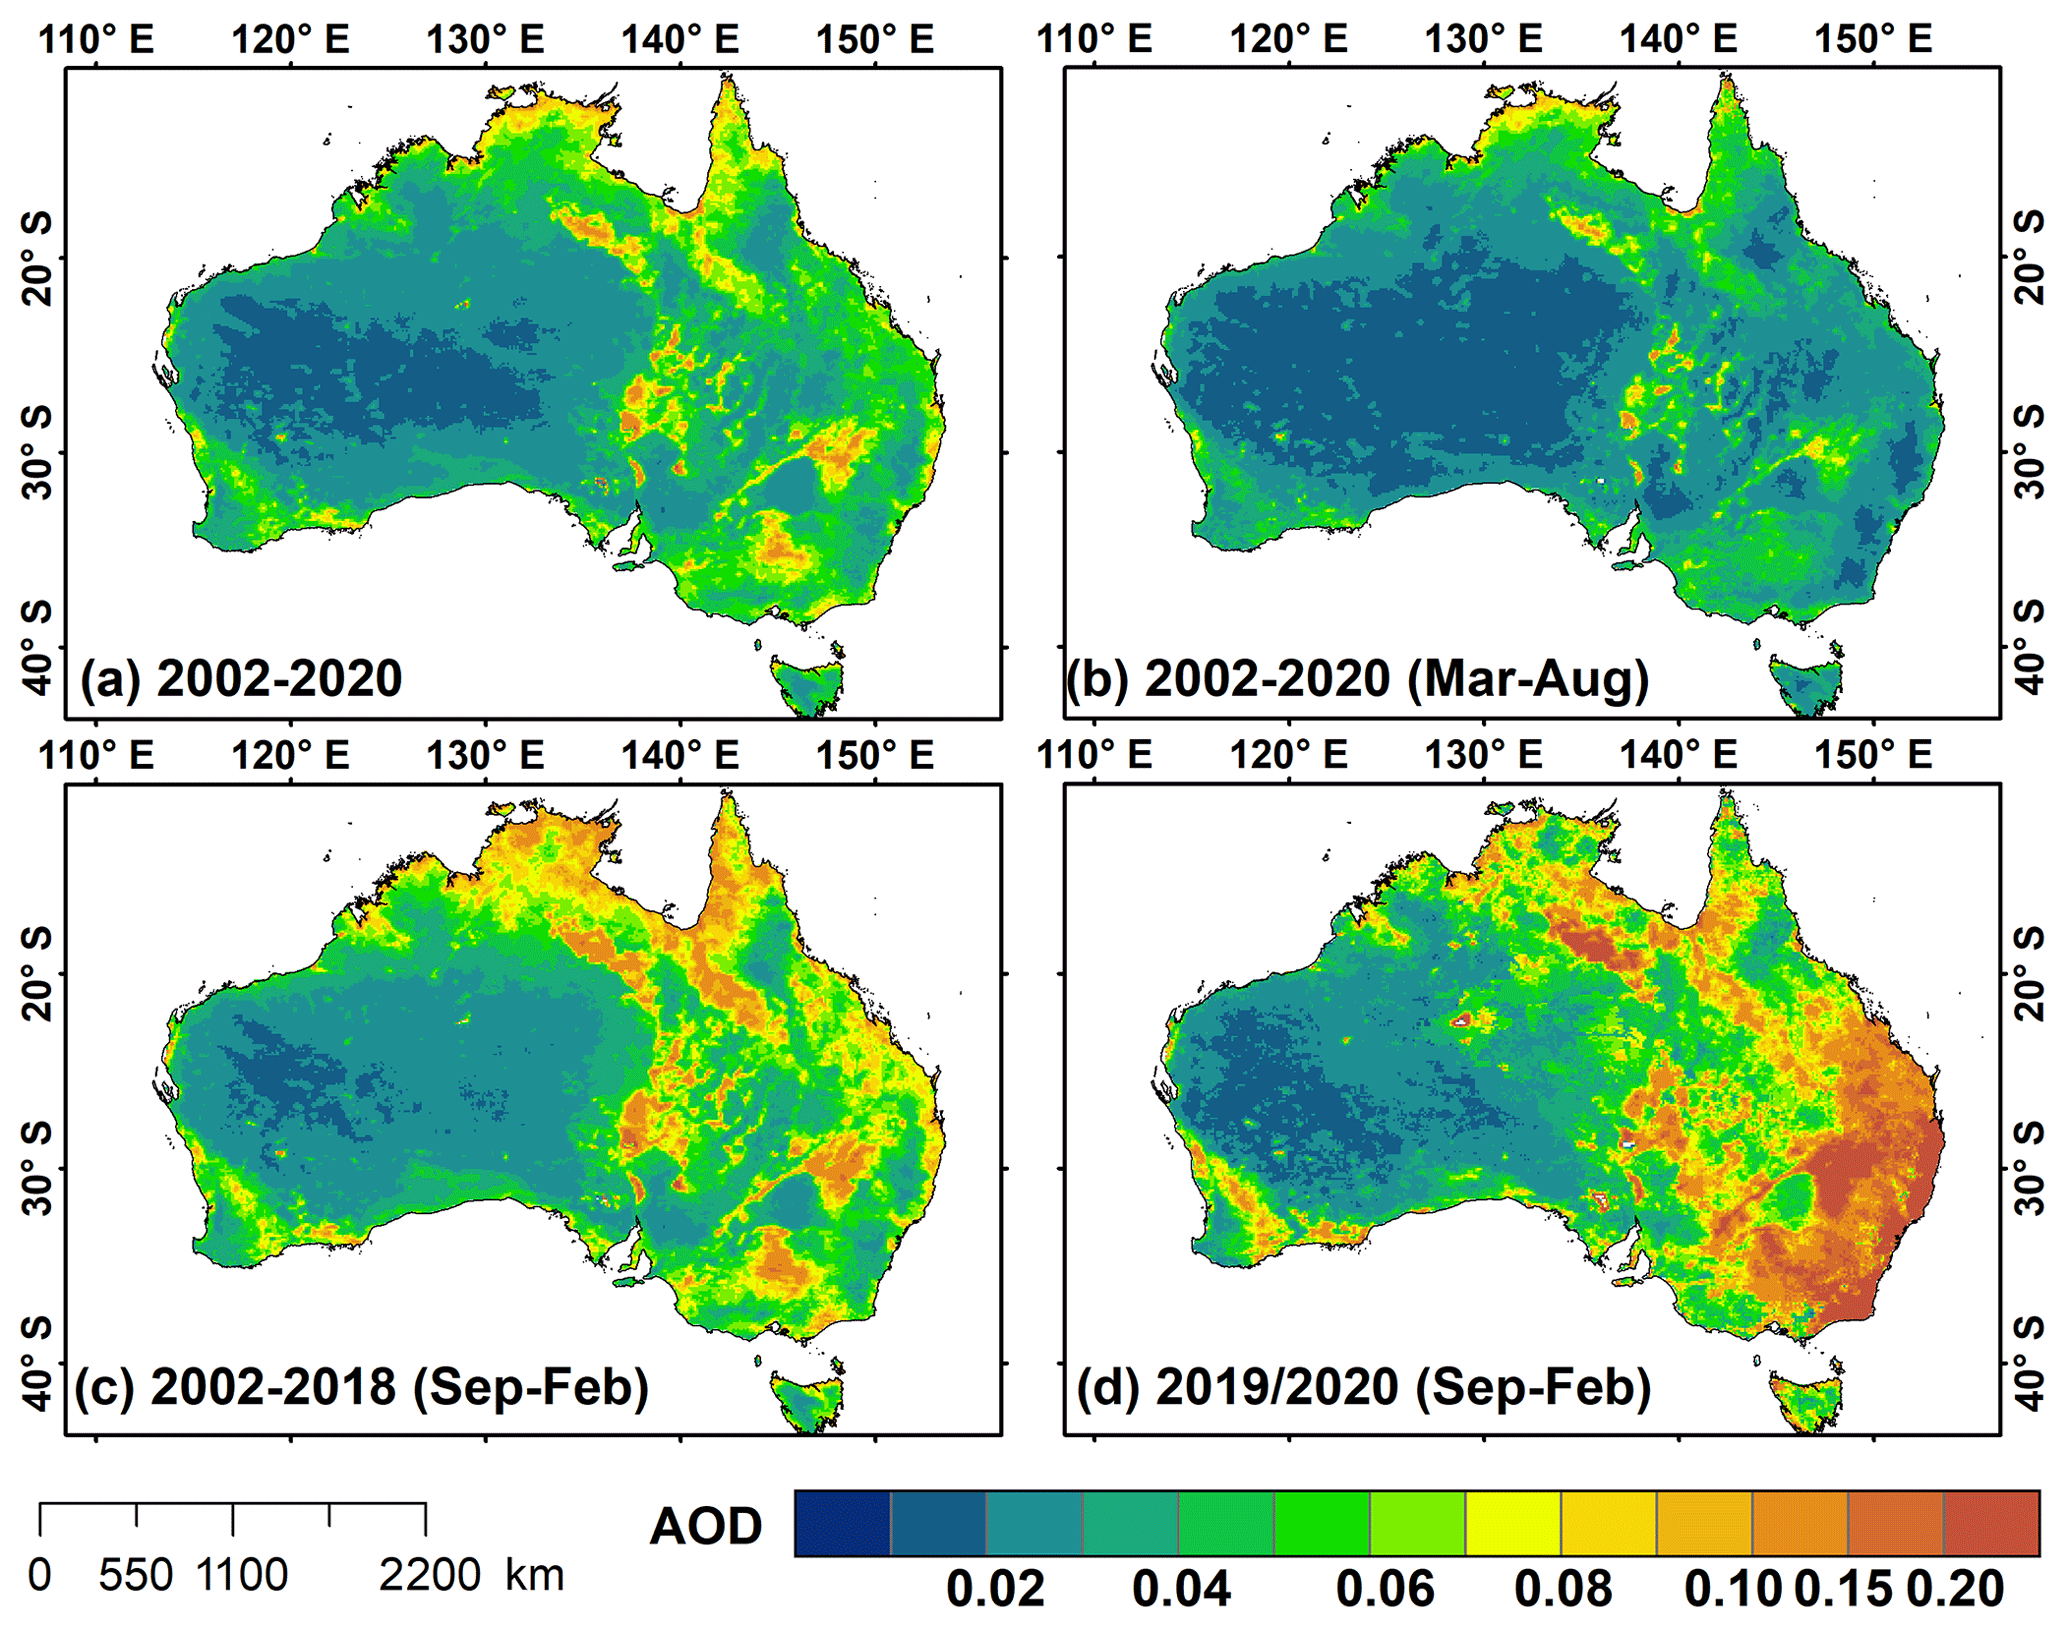
Figure 4Spatial distributions of Aqua MODIS DB AOD at 550 nm over Australia during the following periods between 2002 and 2020 in Australia: (a) July 2002–May 2020, (b) March–August (non-BB period) of 2002–2020, (c) September–February (BB period) of 2002–2018, and (d) the BB period of 2019/2020.
Figure 5 shows the monthly averaged aerosol volume size distribution at nine sites over Australia. In general, the aerosol particle size distributions showed a bimodal lognormal pattern with radius smaller than 0.6 µm as fine-mode aerosol and with radius larger than 0.6 µm as coarse-mode aerosol (Zheng et al., 2017; Zheng et al., 2019). It was clear that the volume sizes with peak volume concentrations for both fine-mode and coarse-mode aerosols were higher during the BB period than during the non-BB period at 10 sites. In northern Australia, the peak volume concentrations of fine-mode aerosols at Jabiru and Lake Argyle were the highest in November and October, with values of 0.029 and 0.046 µm3/µm2, while the peak volume concentrations of coarse-mode aerosols were the highest in December and January, with values of 0.041 and 0.032 µm3/µm2, respectively (Fig. 5a, b). The result indicated that both fine-mode and coarse-mode volume concentrations significantly increased during the BB period. During the BB period, fires cause a temporary reduction in vegetation cover, which can increase biomass-burning emissions, primarily fine aerosol particles. SSA also showed decreasing trends with increase in wavelengths in most months at Jabiru and Lake Argyle in northwestern Australia, especially during the BB period (Fig. 6a, b), which showed stronger absorption in the near-infrared bands. Fires also accelerate soil erosion by winds and promote dust emissions (Ravi et al.,2012). Coarse particles such as dust in northern Australia could have been entrained into the biomass-burning plume from local soil and have also been transported from central Australian deserts (Winton et al., 2016; Yang et al., 2020b). SSA values at Lake Argyle were lower (< 0.90 at 440 nm wavelength) during September–November, suggesting the relative dominance of absorbing aerosols such as dust and black carbon. Furthermore, the sea salt aerosols from the ocean would also contribute to the differences in volume size distributions and SSA among various sites or between BB and non-BB periods. For example, the peak volume concentration values of fine-mode (coarse-mode) aerosols at Jabiru were lower (higher) than those at Lake Argyle. Moreover, SSA values at Jabiru were higher during the BB period than the non-BB period. This was because of Jabiru's closer proximity to the coast, where sea salt aerosols have a greater impact on the atmosphere during the wet season (typically from November to April) (Radhi et al., 2012). In western Australia, the peak values of fine-mode (coarse-mode) aerosol volume concentration at Learmonth and Lake Lefroy were the highest in September (October), and the lowest in January (June) (Fig. 5c, d). The coarse-mode volume concentrations were obviously larger at Learmonth than at Lake Lefroy, peaking at 0.02 to 0.03 µm3/µm2 in October, compared with ∼ 0.005 to 0.015 µm3/µm2 at Lake Lefroy. SSA showed an ambiguous wavelength dependence (i.e., increasing or decreasing with wavelengths) at Learmonth due to the presence of aerosol mixture (Fig. 5c). However, the average SSA values were less than 0.90 at 440 nm wavelength during late spring and summer at Learmonth, showing absorbing properties of coarse particles, which was associated with the site's location in the northwestern dust pathway from the Australian interior deserts (e.g., the Gibson Desert and Great Victoria Desert). The average SSA values generally decreased with increasing spectral range at Lake Lefroy possibly due to the anthropogenic emissions and biomass burnings (Yang et al., 2020b) (Fig. 5d). In central Australia, there was a significant increase in volume concentrations of coarse-mode aerosols during the BB period at Birdsville, Fowlers Gap, and Adelaide site 7, consistent with the presence of dust activities during the period (Fig. 5e, f, g). The increase in coarse-mode aerosols during this period was consistent with the result from SSA at Birdsville and Fowlers Gap, which showed low SSA values (< 0.9) at all wavelengths during the BB period (Fig. 6e, f). Meanwhile, increases in volume concentrations of fine-mode aerosols were observed at the three sites, which may result from long-range transport of biomass-burning aerosols (Yang et al., 2020b). In eastern Australia, the coarse-mode aerosols were dominant in almost all seasons at Lucinda (Fig. 5h). The average SSA values generally increased with increasing spectral range, with low values (< 0.95) at Lucinda (Fig. 6h). However, the volume concentration of fine-mode aerosols increased during the BB period with peak value of 0.012 µm3/µm2 in November. The fine and coarse-mode volume concentrations were both higher in December–January at Canberra during the BB period (Fig. 5i). The increase in fine-mode volume concentrations was attributed to the forest fires in southeastern Australia, while the increase in coarse-mode volume concentrations was mostly related to dust particles from forest fires and transported from central Australian deserts, along with sea salt particles from the ocean (McGowan and Clark., 2008; Yang et al., 2020b). During the BB period of 2019/2020, the significant impact of the huge fires on aerosol particle size distributions in southeastern Australia was evident. The average SSA values decreased with increasing spectral range at Tumbarumba (Fig. 6i). Furthermore, a significant increase in fine-mode aerosol concentrations can be seen at Tumbarumba, which was located in the area with high frequency and intensity of fires, as well as at Fowlers Gap and Birdsville due to the regional transport of biomass-burning aerosols. Additionally, a significant increase in coarse-mode aerosol concentrations was found at Birdsville. Furthermore, during the BB period of 2019/2020, the peak value of coarse-mode aerosol volume concentration at Birdsville was much higher (∼ 0.058 µm3/µm2) than the multi-year averaged maximum in January (∼ 0.025 µm3/µm2).
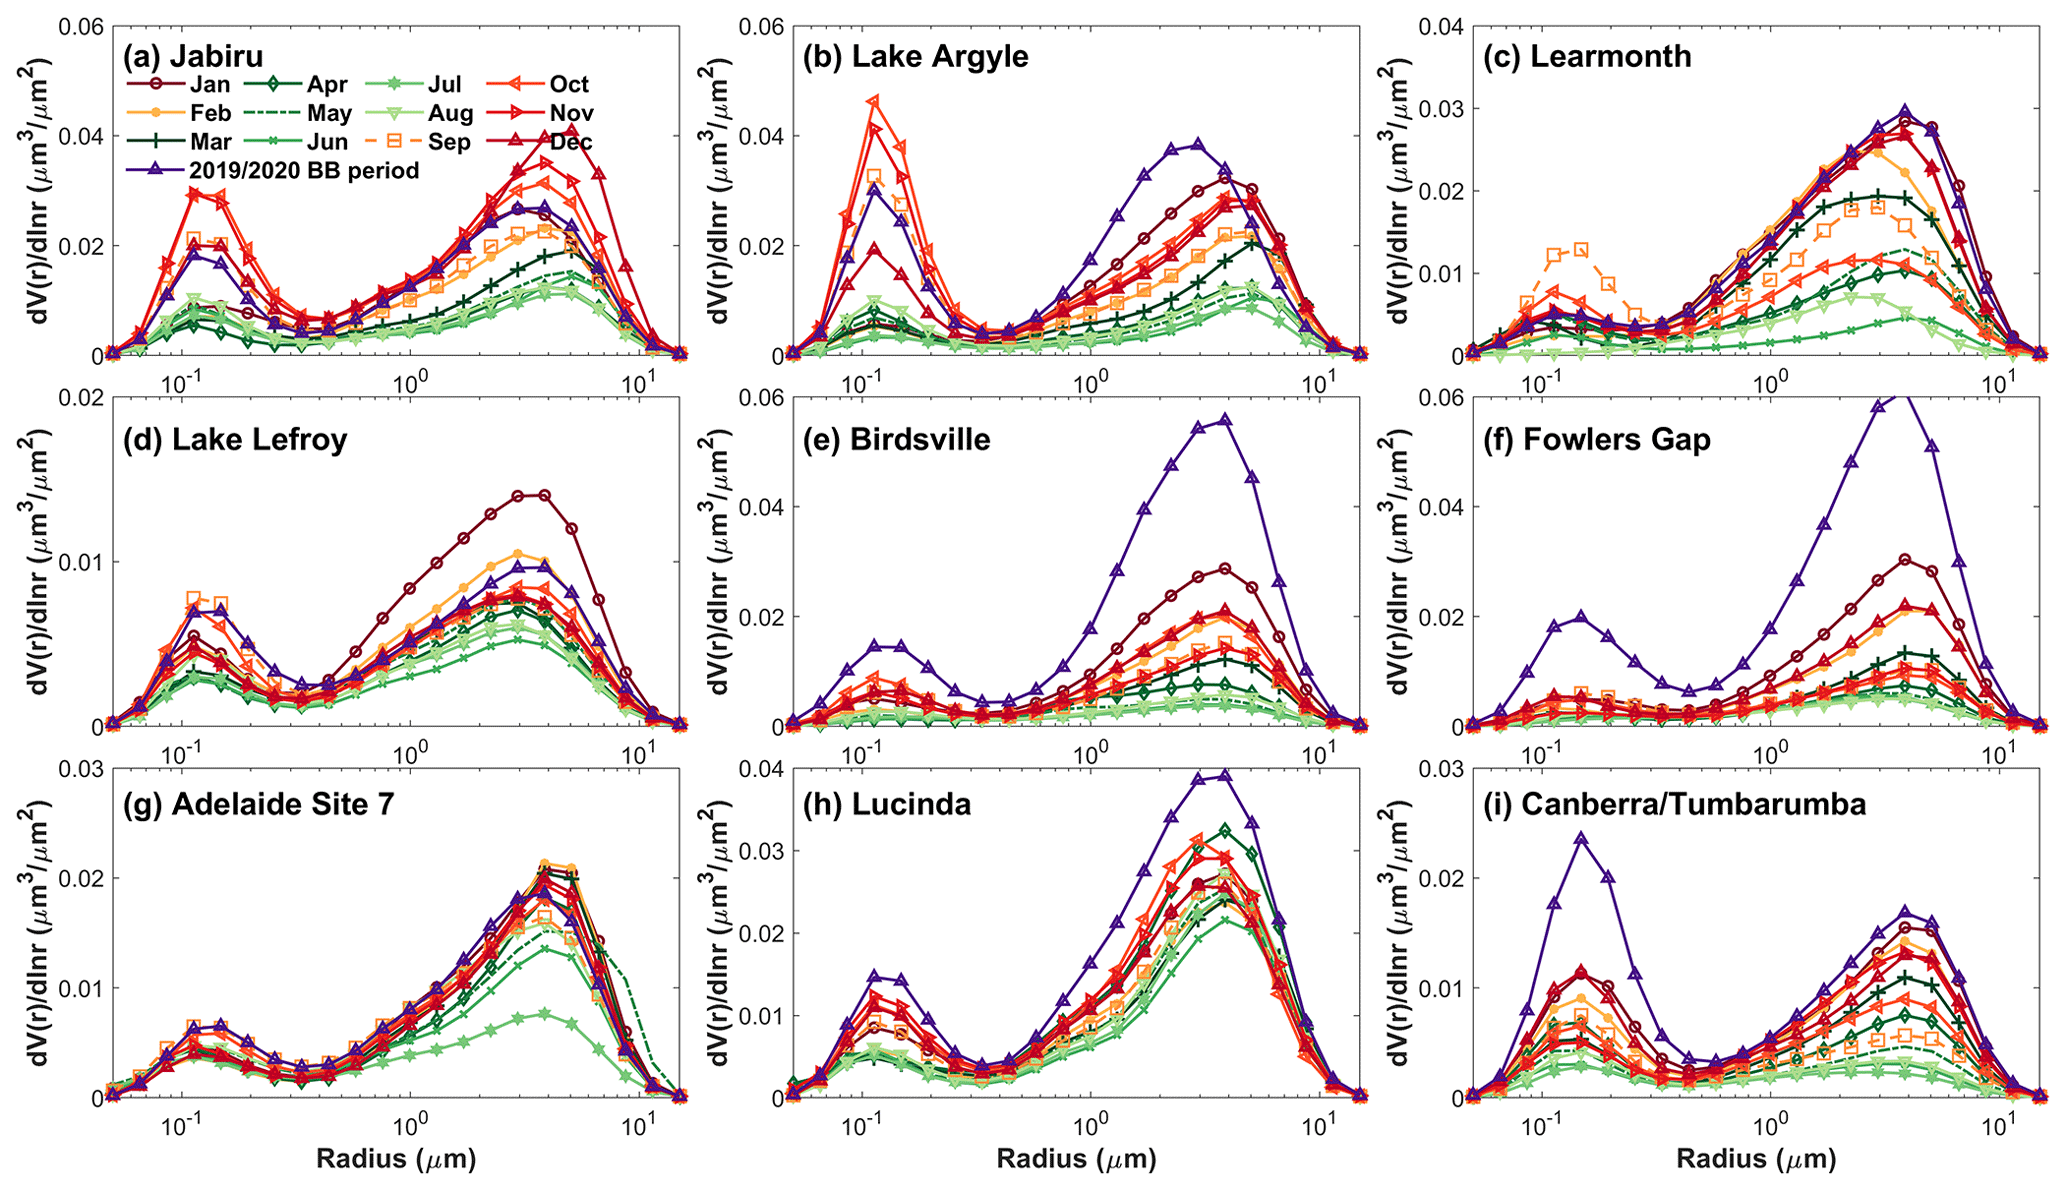
Figure 5Monthly averaged aerosol volume size distributions at the nine AERONET sites over Australia. The warm-toned and cold-toned lines represent the aerosol size distributions in the BB period and the non-BB period, respectively. The purple line represents the aerosol size distribution in the BB period of 2019/2020.
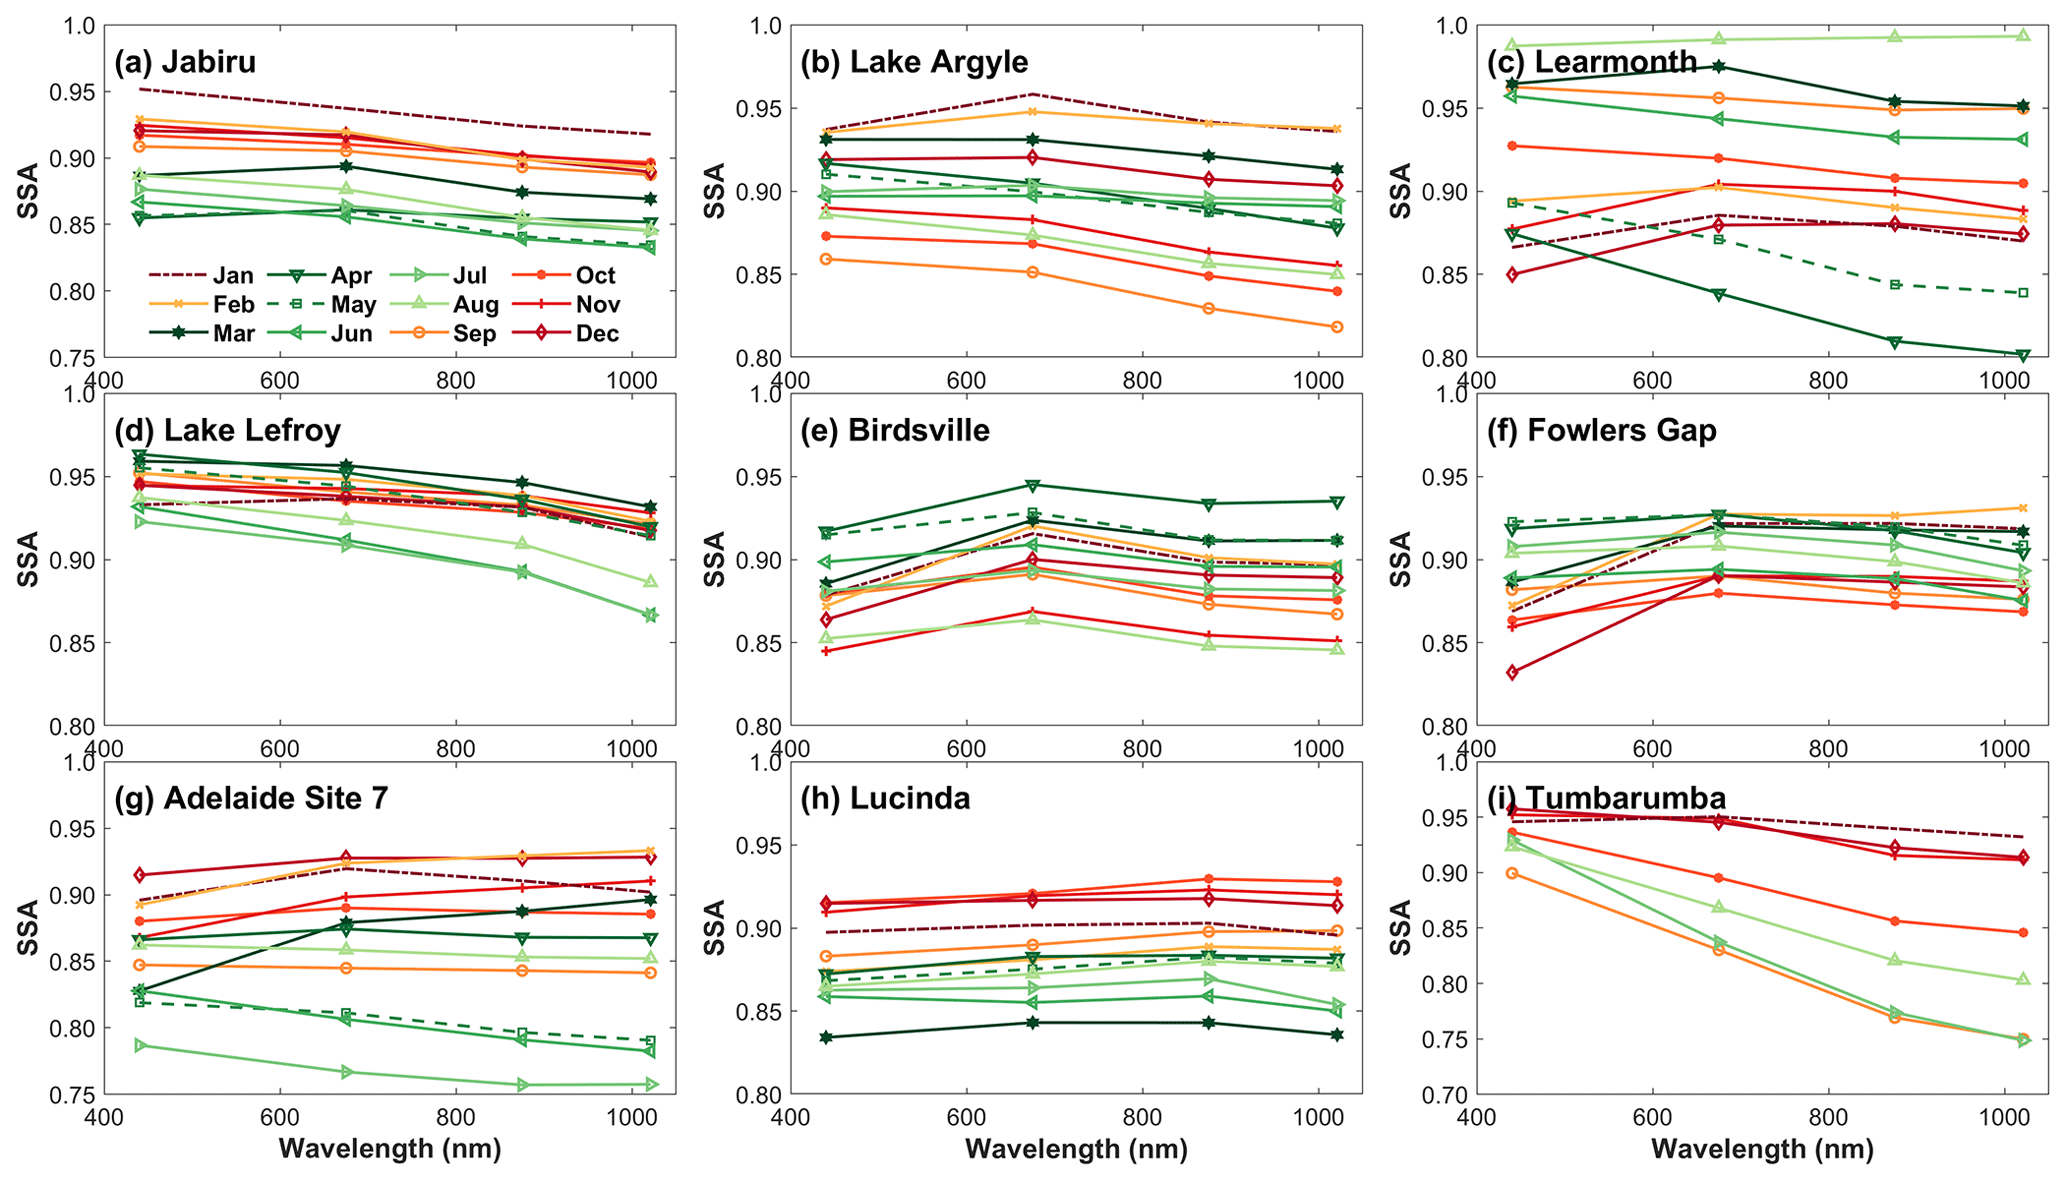
Figure 6Monthly averaged single-scattering albedo (SSA) at the nine AERONET sites over Australia. The warm-toned and cold-toned lines represent the aerosol size distributions in BB period and non-BB period, respectively. Note that only SSA data from Tumbarumba is used due to the lack of SSA data at Canberra.
3.1.3 Emission and optical properties of aerosol species
Figure 7 shows the comparisons between the monthly AERONET observations and MERRA-2 AOD products at nine sites over Australia during the period 2002–2020. The monthly AERONET and MERRA-2 AOD products showed good agreement with correlation coefficients (R) between 0.59 and 0.92 and with small RMSE values (0.02–0.05) at 10 sites. Compared to the AERONET observations, the monthly MERRA-2 AODs were slightly overestimated over Australia (RMB: 1.02–1.42), except for the central region, where highly overestimated AODs were found at Fowlers Gap (1.69) and Birdsville (2.12). Overall, the monthly MERRA-2 AOD products showed good performance. Therefore, we employed the monthly MERRA-2 AOD product to determine the contribution from different kinds of aerosols to the AOD over Australia during the period January 2002–May 2020. Figure 8 depicts the monthly averaged carbonaceous, dust, sulfate, and sea salt AODs from MERRA-2, along with the Aqua MODIS DB AOD over Australia. The monthly mean total AODs from MERRA-2 ranged from 0.044 to 0.213, with high values from September to February (i.e., the BB period) ranging from 0.097 (February) to 0.130 (November) and low values of 0.054–0.083 for the remaining months (i.e., the non-BB period). In contrast, the monthly MODIS AODs were significantly lower than the MERRA-2 total AODs. However, the MODIS AOD showed a good agreement with the MERRA-2 total AOD in temporal variation (R=0.80). The same as the result from MERRA-2, MODIS AODs showed higher values during the BB period (0.038–0.062) than those during the non-BB period (0.025–0.034) over Australia. Considering the similar emission sources of organic carbon and black carbon aerosols, carbonaceous aerosol is used in this study to refer to the summation of organic carbon and black carbon from MERRA-2. The contributions of carbonaceous, dust, sulfate, and sea salt aerosols to the total aerosols were 26.24 %, 23.38 %, 26.36 %, and 24.02 %, respectively, over Australia from January 2002 to May 2020. In general, carbonaceous aerosol was the major contributor to total aerosols during the BB period in each year. Carbonaceous aerosol accounted for 30.08 %–42.91 % of total aerosol from September to December, indicating that carbonaceous aerosol from biomass burning dominated the total aerosol loading during this period. In contrast, dust aerosol had a greater contribution (23.14 %–26.88 %) to total aerosol during December–March. Sulfate and sea salt aerosols were the most dominant (28.25 %–30.96 %) and the second most dominant (26.21 %–28.44 %) aerosol type during the months of March–July, respectively.
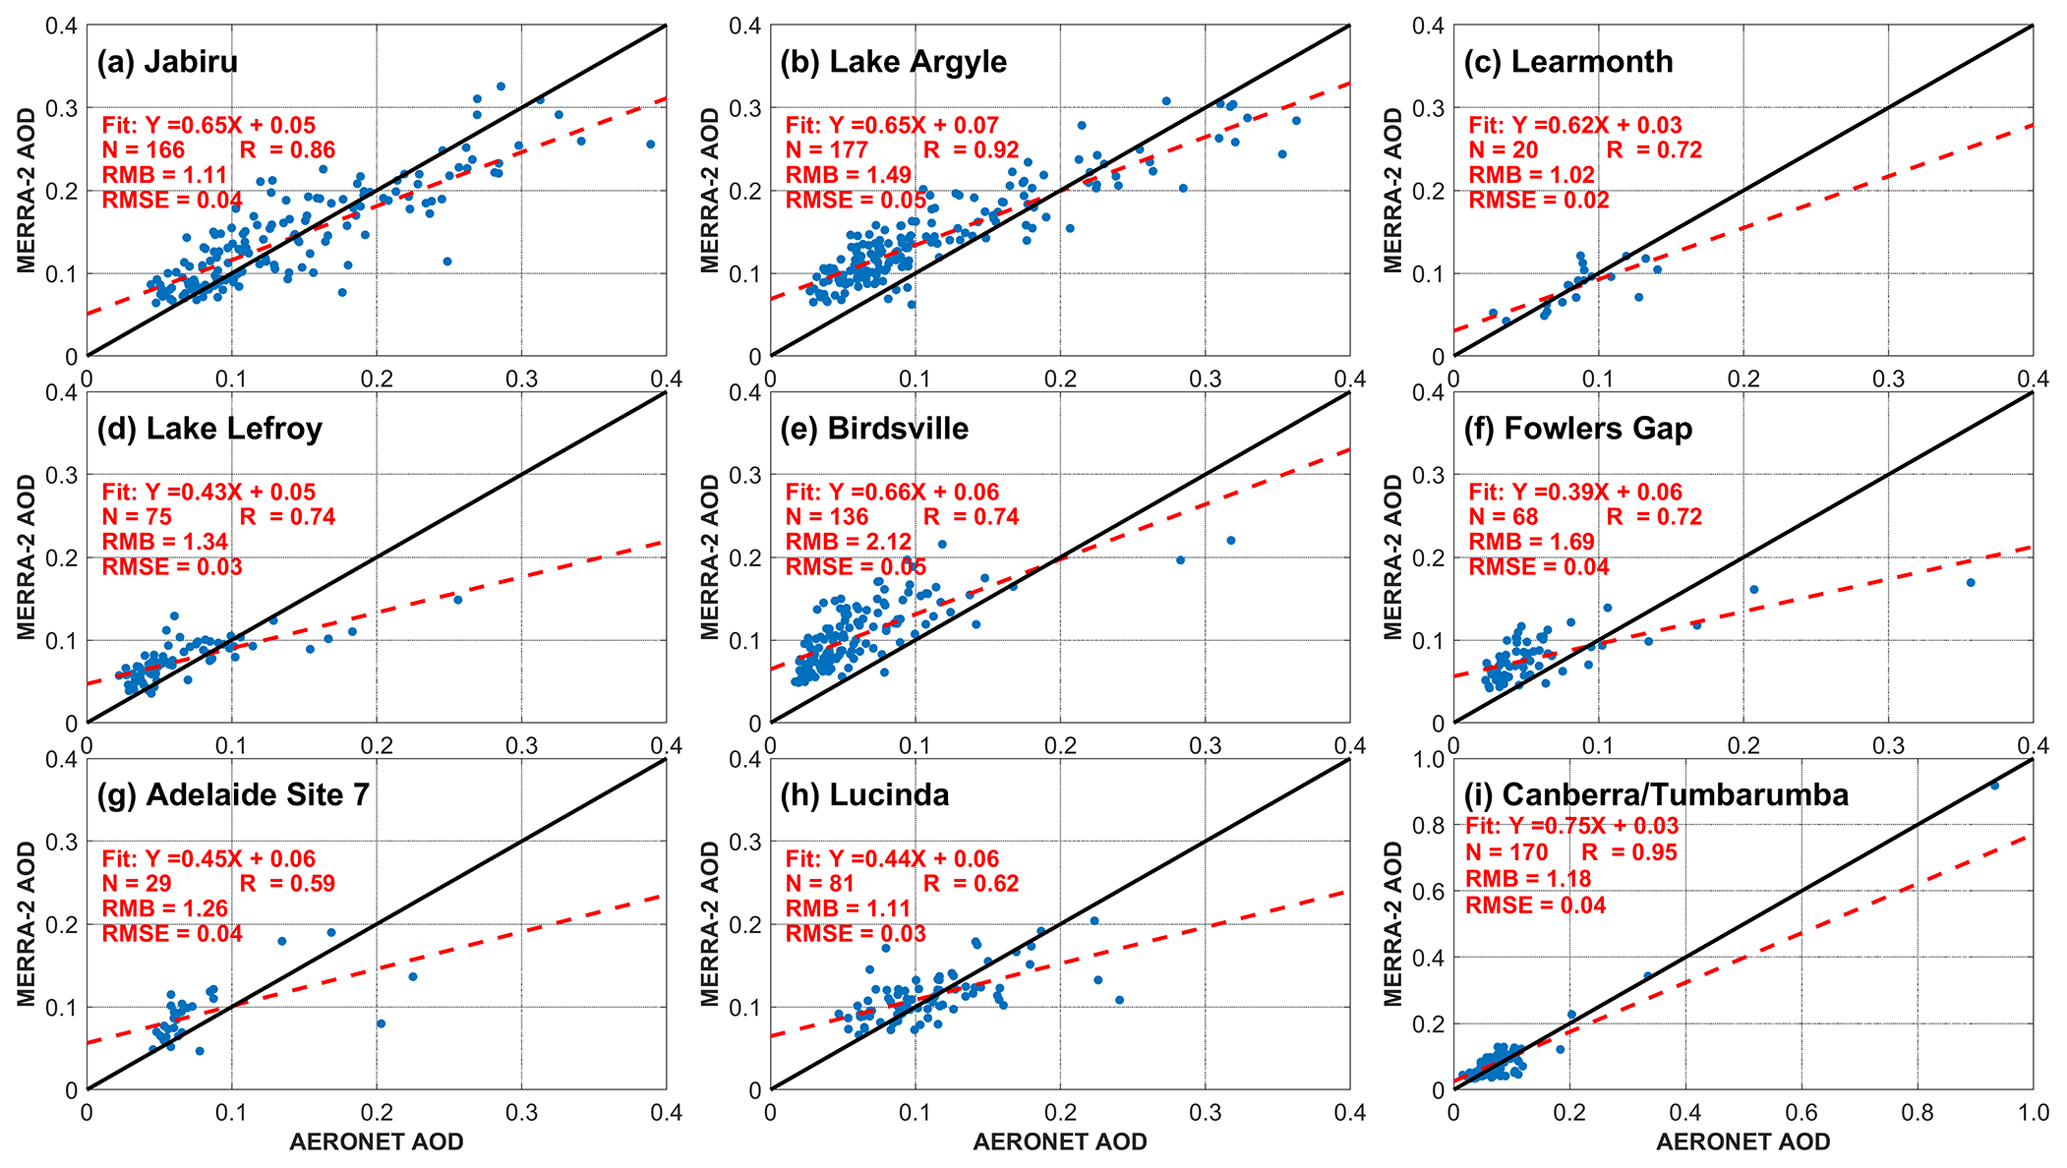
Figure 7The comparisons of monthly AODs between the MERRA-2 product and AERONET at nine AERONET sites in Australia during 2002–2020. Linear regression is shown as a dashed red line, and all the linear relationships are statistically significant at α=0.01. The solid black line is the 1:1 line.
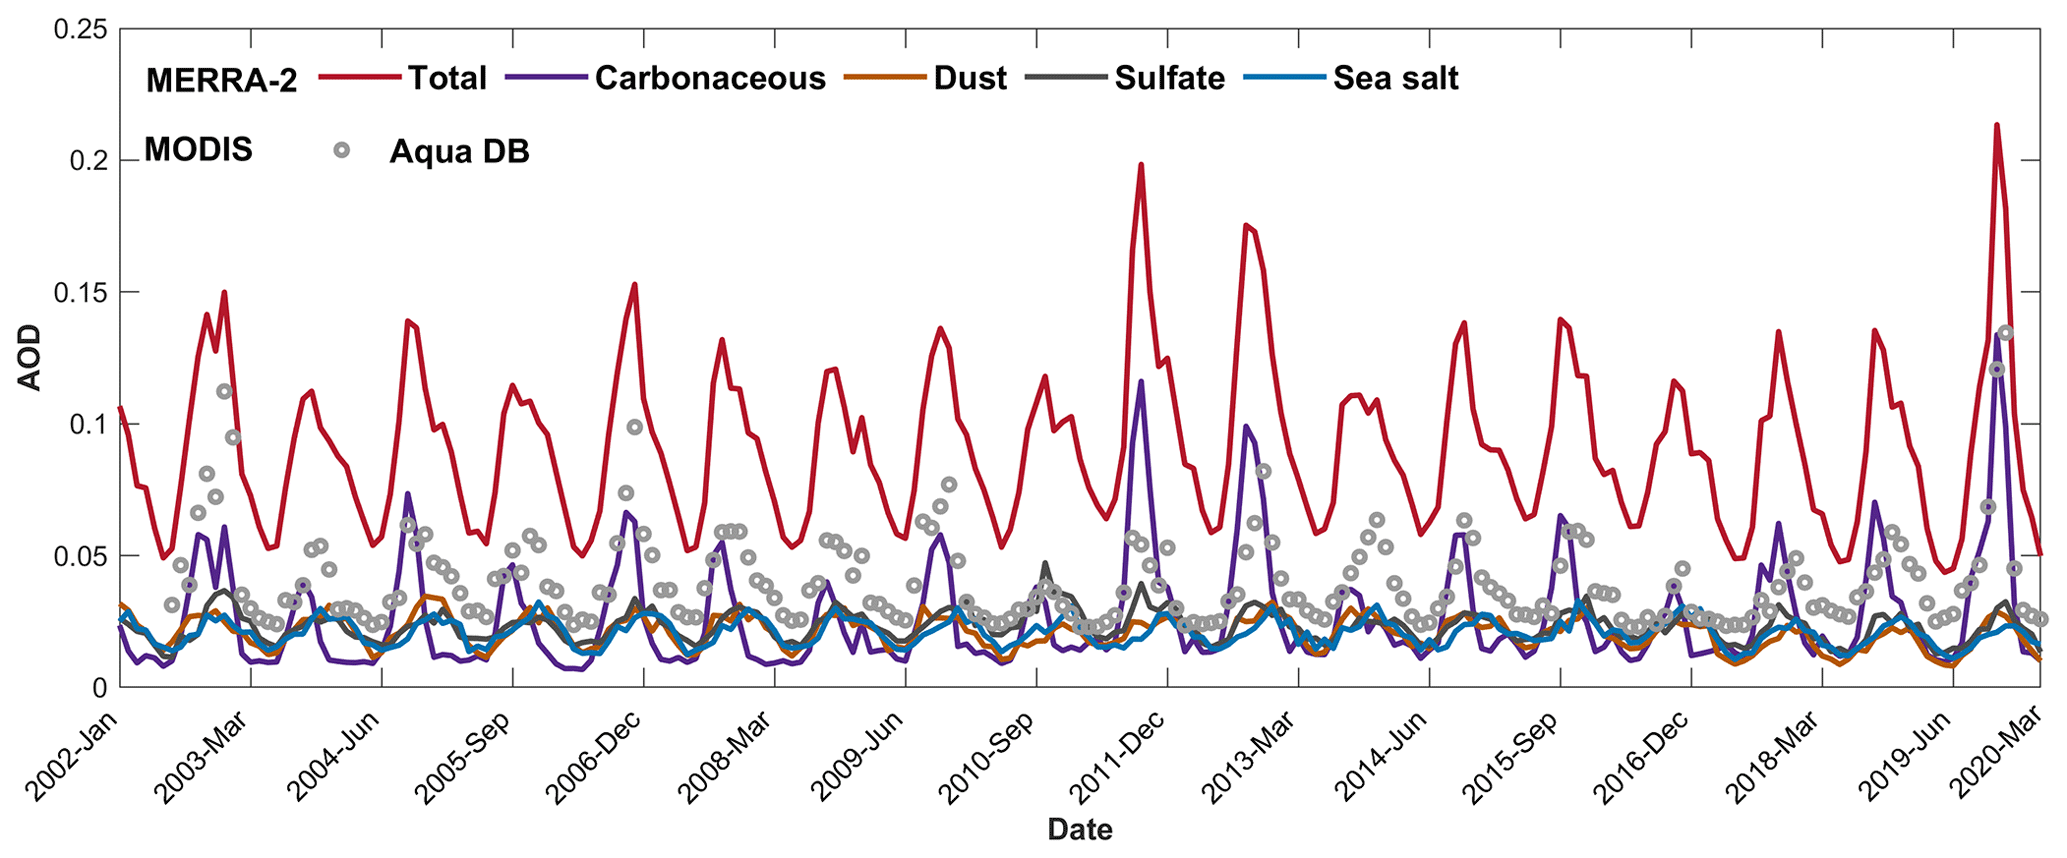
Figure 8Time series of monthly averaged carbonaceous, dust, sulfate, and sea salt AODs from MERRA-2, as well as the Aqua MODIS DB AOD, in Australia from January 2002 to May 2020.
Figure 9 presents the spatial distributions of averaged carbonaceous, dust, sulfate, and sea salt mass concentrations (Fig. 9a–h) and AODs (Fig. 9i–p) during the BB period and the non-BB period over the Australian continent. Generally, the spatial distribution of carbonaceous mass concentration can be characterized as high in northern and southeastern Australia and low in southwestern Australia. Northwestern Australia has always been a relatively high concentration region of carbonaceous aerosols during both the BB period and non-BB period. However, carbonaceous mass concentrations during the BB period (1.84 ) were much higher than those during the non-BB period (1.07 ), especially in northern and southeastern Australia, with concentrations exceeding 4.00 . This explained the relatively high volume concentrations of fine-mode aerosols during the BB period at three sites (i.e., Jabiru, Lake Argyle, and Canberra) located in regions with frequent fire activities in northern and southeastern Australia. High carbonaceous AODs (> 0.06) were also observed in northern and southeastern Australia during the BB period. The carbonaceous AODs decreased significantly during the non-BB period with AOD values less than 0.024 in most Australian regions. The high sulfate mass concentrations appeared in northwestern and southeastern coastal areas, with mean values exceeding 0.90 , while the low sulfate mass concentrations appeared in western Australia, with mean values around 0.24–0.50 . Similarly, the northwest and southeast coastal areas of Australia showed high sulfate AODs compared to the rest of the country. During the BB period, the concentrations and AODs of sulfate achieved high values (above 1.10 , above 0.035, respectively) in northwestern and southeastern coastal areas, which contain densely populated urban regions such as Darwin, Sydney, and Melbourne. Central Australia, especially the Lake Eyre basin, was a relatively high mass concentration region for dust, with mean values above 60 during the BB period and the non-BB period. The dust concentrations declined spatially from the high-value center region (i.e., Lake Eyre basin) to the coastal areas (< 40 ). Correspondingly, the dust AODs were greater than 0.048 in central Australia and declined a lot in the coastal areas. Additionally, dust concentrations and dust AODs were significantly higher during the BB period (24.01 ; 0.025) than during the non-BB period (16.81 ; 0.016). Australian coastal areas, particularly in the northeast, generally had higher sea salt concentrations and AODs than the continental interior region. The sea salt concentrations exceeded 30 over the coastal areas of northern Australia and achieved the highest values during the non-BB period (87 ). The averaged sea salt AODs and concentrations over Australia were higher during the BB period (0.024; 13.86 ) than during the non-BB period (0.017; 11.06 ).
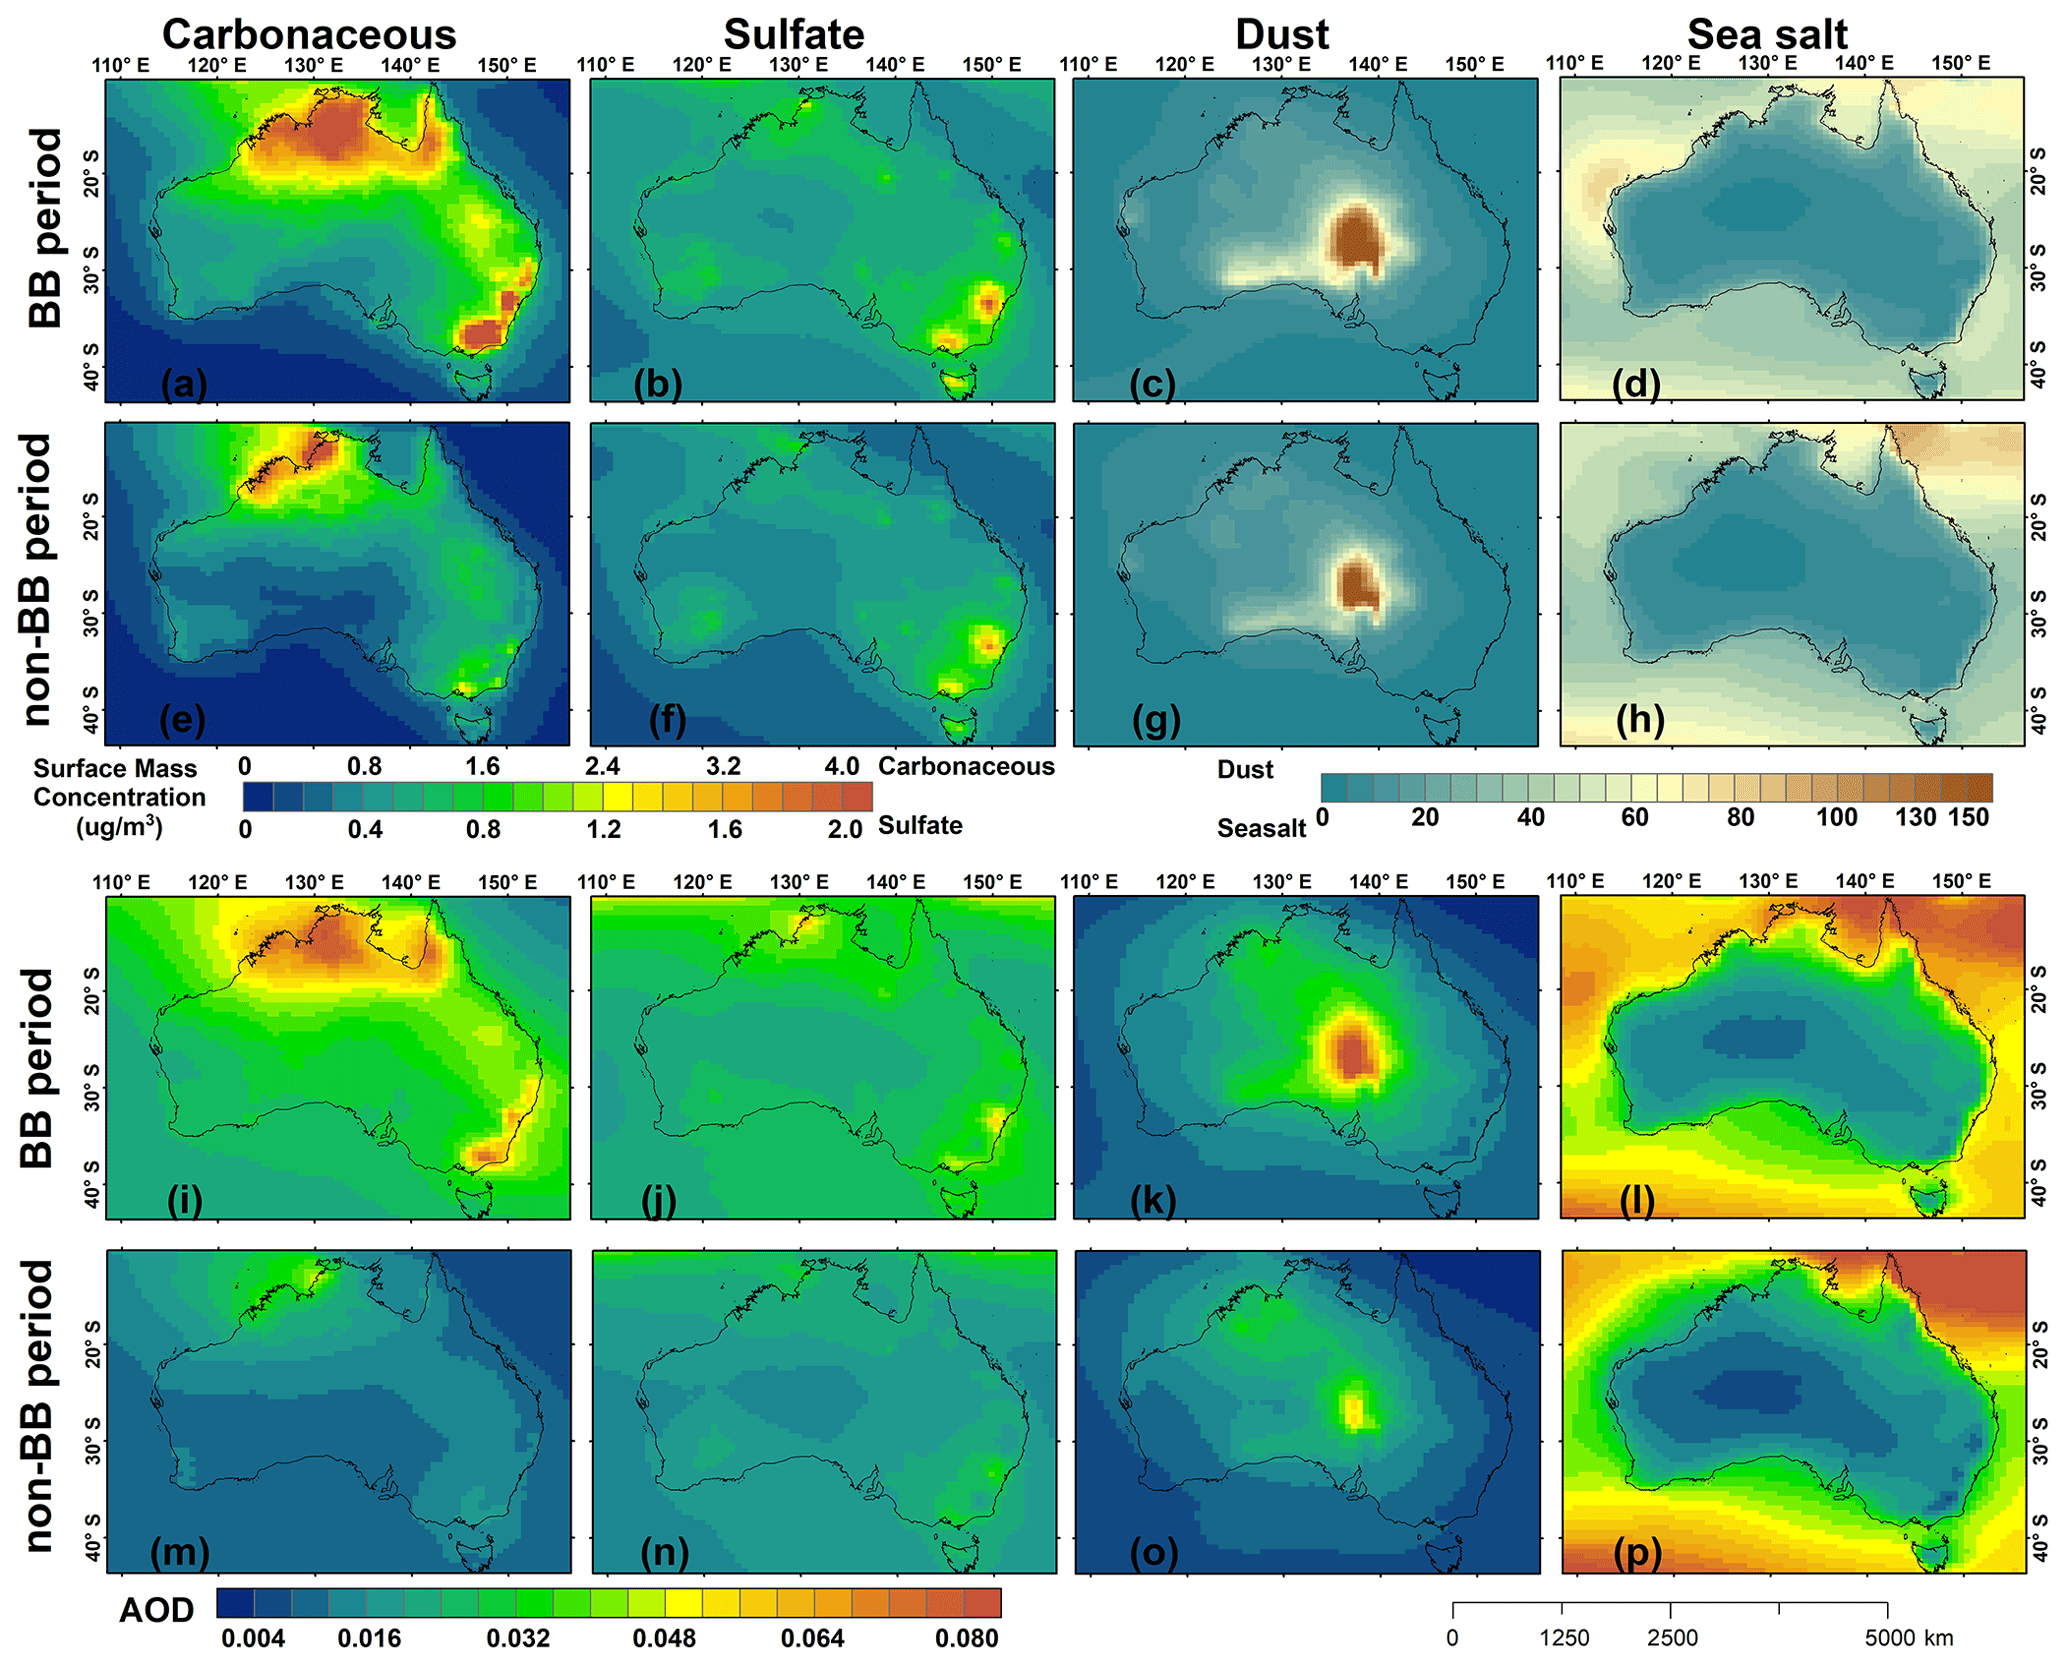
Figure 9Spatial distribution of carbonaceous, dust, sulfate, and sea salt mass concentrations near the surface (a–h) and AOD (i–p) estimated by MERRA-2 during the BB period and the non-BB period over Australia.
3.2 Aerosol properties over Australia during the 2019/2020 mega fire events
Figure 10 shows the monthly FRP and total active fire counts over Australia from June 2019 to May 2020. During the period June 2019–May 2020, the fire counts over Australia increased significantly from August (12 440) and peaked in December (67 272). The number of fire counts then gradually decreased from December to March, after which they increased again. The monthly averages of FRP showed a continuous increase from the lowest value in June (37.61 MW) to the highest value in January (135.47 MW), followed by a decrease from February (132.20 MW) to May (35.79 MW).

Figure 10Monthly FRP and total active fire counts in Australia from June 2019 to May 2020. The percentages of active fire detections in different climate zones of Australia from June 2019 to May 2020 are also shown in upper-left corner.
It is worth noting that a few fire counts were found in January and February with much higher FRP compared that of other months, which is mostly related to the intense forest fires in southern Australia during summer. Murphy et al. (2018) demonstrated that the fires in temperate southern Australia were less frequent and more severe with very high biomass consumption per fire. In contrast, fires in the tropical savannas of northern Australia were very frequent but less severe with lower biomass consumption per fire. The percentages of active fire counts in different climate zones of Australia from June 2019 to May 2020 were analyzed. Results showed that the temperate zone had the highest number of active fires, accounting for 38.76 % of the total number of fires, followed by the tropical zone (31.95 %), grassland (12.39 %), subtropical zone (7.42 %), and other zones (9.48 %).
Monthly spatial distributions of Aqua MODIS DB AOD from June 2019 to May 2020 are shown in Fig. 11. During the period June 2019–May 2020, the MODIS AOD over Australia was small (0.026) in June, increased and peaked in December (0.068), and then decreased from December to May (0.027). Correspondingly, the monthly averaged MODIS AODs over Australia were with higher magnitudes (0.059–0.068) in November–January. High AOD values that are larger than 0.30 began to appear in eastern New South Wales in September. From October to January, the regions with mean AOD values greater than 0.3 extended from eastern New South Wales to eastern and southeastern Australia (i.e., South Australia, Victoria, and the Australian Capital Territory). Moreover, the highest AOD values, ranging from 2.05 to 3.03, were observed in southeastern Australia during the months November–January, which was most likely caused by the extreme fires in this region. Additionally, high AOD values were also observed in central Australia, which may be related to the dust activities and long-range transport of biomass-burning aerosols.
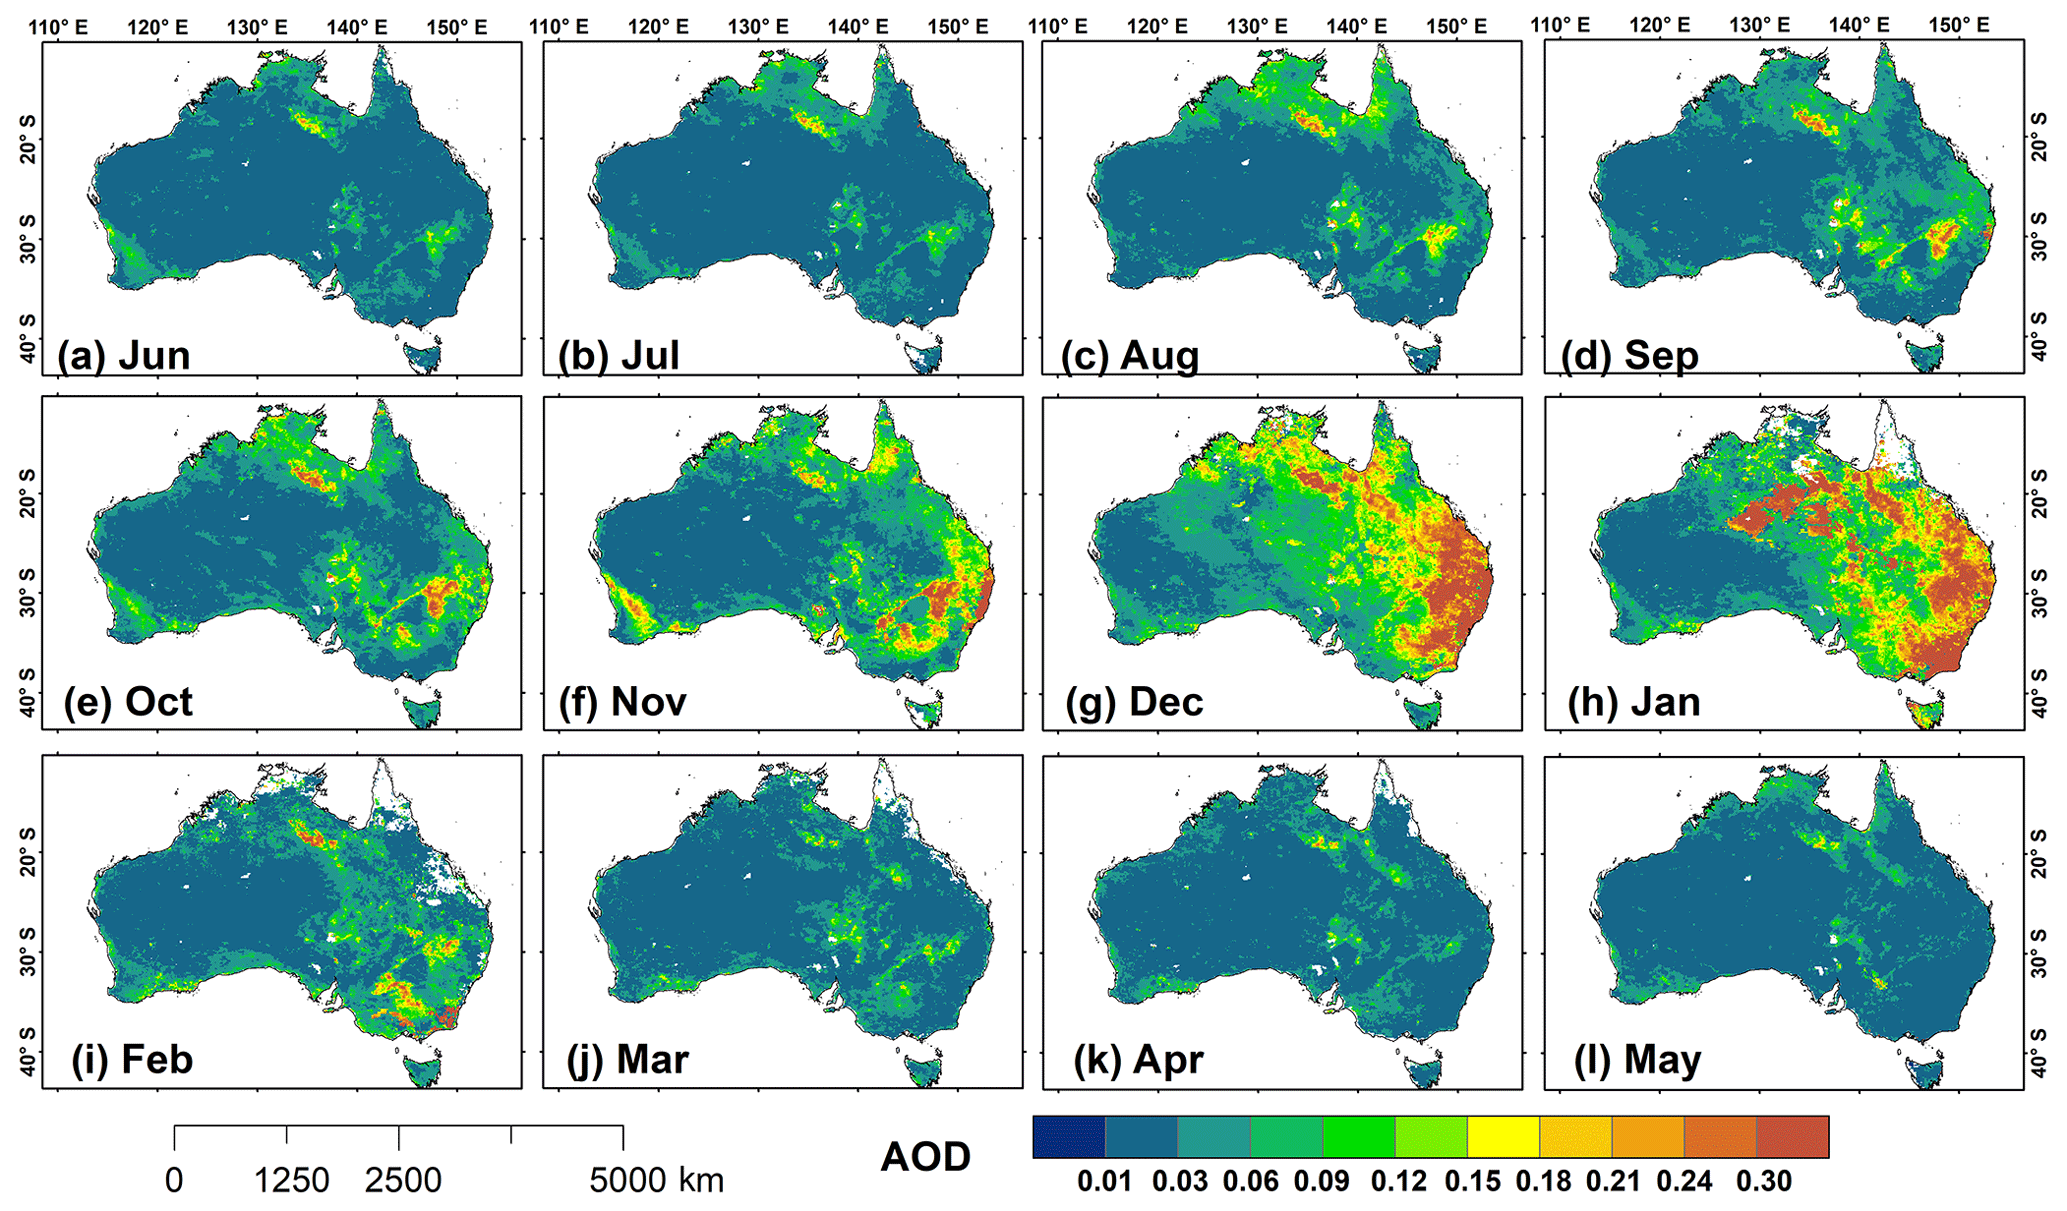
Figure 11Spatial distributions of monthly averaged Aqua MODIS DB AOD at 550 nm over Australia from June 2019 to May 2020.
Figures 10 and 11 showed high FRP and AOD values over Australia during the period September 2019–February 2020, indicating the significant impact of fires on aerosols, particularly in southeastern Australia. We further analyzed the daily averaged AOD at 500 nm from AERONET and Aqua MODIS DB AOD during the BB period of 2019/2020 at nine sites (Fig. 12). As shown above, AERONET and MODIS had varying degrees of missing observations at all sites except for Adelaide site 7. However, it was clear that AODs at nine sites during the BB period of 2019/2020 were higher than the multi-year average values for the same period, as shown in Fig. 3. Specifically, the AOD values at sites in southeastern Australia such as Tumbarumba, Adelaide site 7, Birdsville, and Fowlers Gap showed multiple peaks with AOD values larger than 0.7 after November. Fine-mode AOD showed even higher values (0.042–0.175) during the observation period than coarse-mode AOD (0.029–0.105) at nine sites, implying a significant increase of fine-mode aerosols at these sites during the fire events during the BB period of 2019/2020. The highest AOD value reached 4.42 with a fine-mode AOD of 4.40 and a coarse-mode AOD of 0.02 (not shown in Fig. 12i) on 2 January 2020 at the Tumbarumba site. The maximum values of total and fine-mode AODs were attributed to the fine particles that were generated by the biomass burning. In addition, dominance of fine-mode aerosols was observed at Birdsville and Fowlers Gap, which was primarily due to the long-range transport of biomass-burning aerosols from eastern and southeastern Australia and will be discussed in Sect. 3.3. Figure 13 shows the occurrence frequency profile of each aerosol type in each month during the period September 2019–February 2020 from CALIPSO observations over the selected domain in southeastern Australia (gray area in Fig. 1b). During this period, polluted dust was abundant at heights from roughly 0.5 to 4 km, with peak occurrence frequency at heights from 0.5 to 2 km. High occurrence frequency of elevated smoke was observed at heights from 2 to 4 km. During the strongest biomass-burning period (i.e., December), smoke was the dominant aerosol type detected at heights 2.5–12 km. Further, smoke was the dominant aerosol detected at heights roughly from 6.2 to 12 km in January. The result was consistent with the finding of Ohneiser et al. (2020), who reported that smoke injected over the source regions (i.e., southeastern Australia) at heights below 10 km widely remained in the troposphere and was then injected into higher heights (12–20 km) and transported to South America by eastward advection. In general, the dust occurrence frequency was higher at the heights of 0–2 km and decreased with the increase of height. However, the occurrence frequency of dust increased at heights from roughly 2 to 5 km in November, January, and February. Wagner et al. (2018) indicated that fire radiative energy released by the combustion of the vegetation leads to a significant increase in near-surface wind speed, atmospheric turbulence, and vortices. Moreover, the removal of vegetation during the burning process and the accompanied dehydration and modification of the soil could consequently enhance the dust mobilization and uplift potential, which finally influenced the concentration and the mean size of aerosol particles over the fire region. McGowan and Clark (2008) showed that dust from the Lake Eyre basin can potentially affect southeastern Australia through the southeast dust transport corridor. Therefore, the increase in the occurrence frequency of dust also explained the relatively high coarse-mode aerosol volume concentrations at the sites in southeastern Australia (Fig. 5), which was a result of the fire-induced dust emissions caused by the pyro-convection during extreme fire events and long-range transport of dust from the Lake Eyre basin. Clean marine aerosol was the dominant type detected below 0.5 km due to the proximity of this domain to the western Pacific Ocean. It was evident that the peak occurrence frequencies of clean marine aerosol decreased during the period December–January, which was also related to the strong fire activities.

Figure 12Time series of average total AOD, fine-mode AOD, and coarse-mode AOD at 500 nm from AERONET, as well as the Aqua MODIS DB AOD during September 2019–February 2020 at nine sites in Australia. The numbers above the graphs with different colors refer to the corresponding average values. Note that the data time period at each site is different.
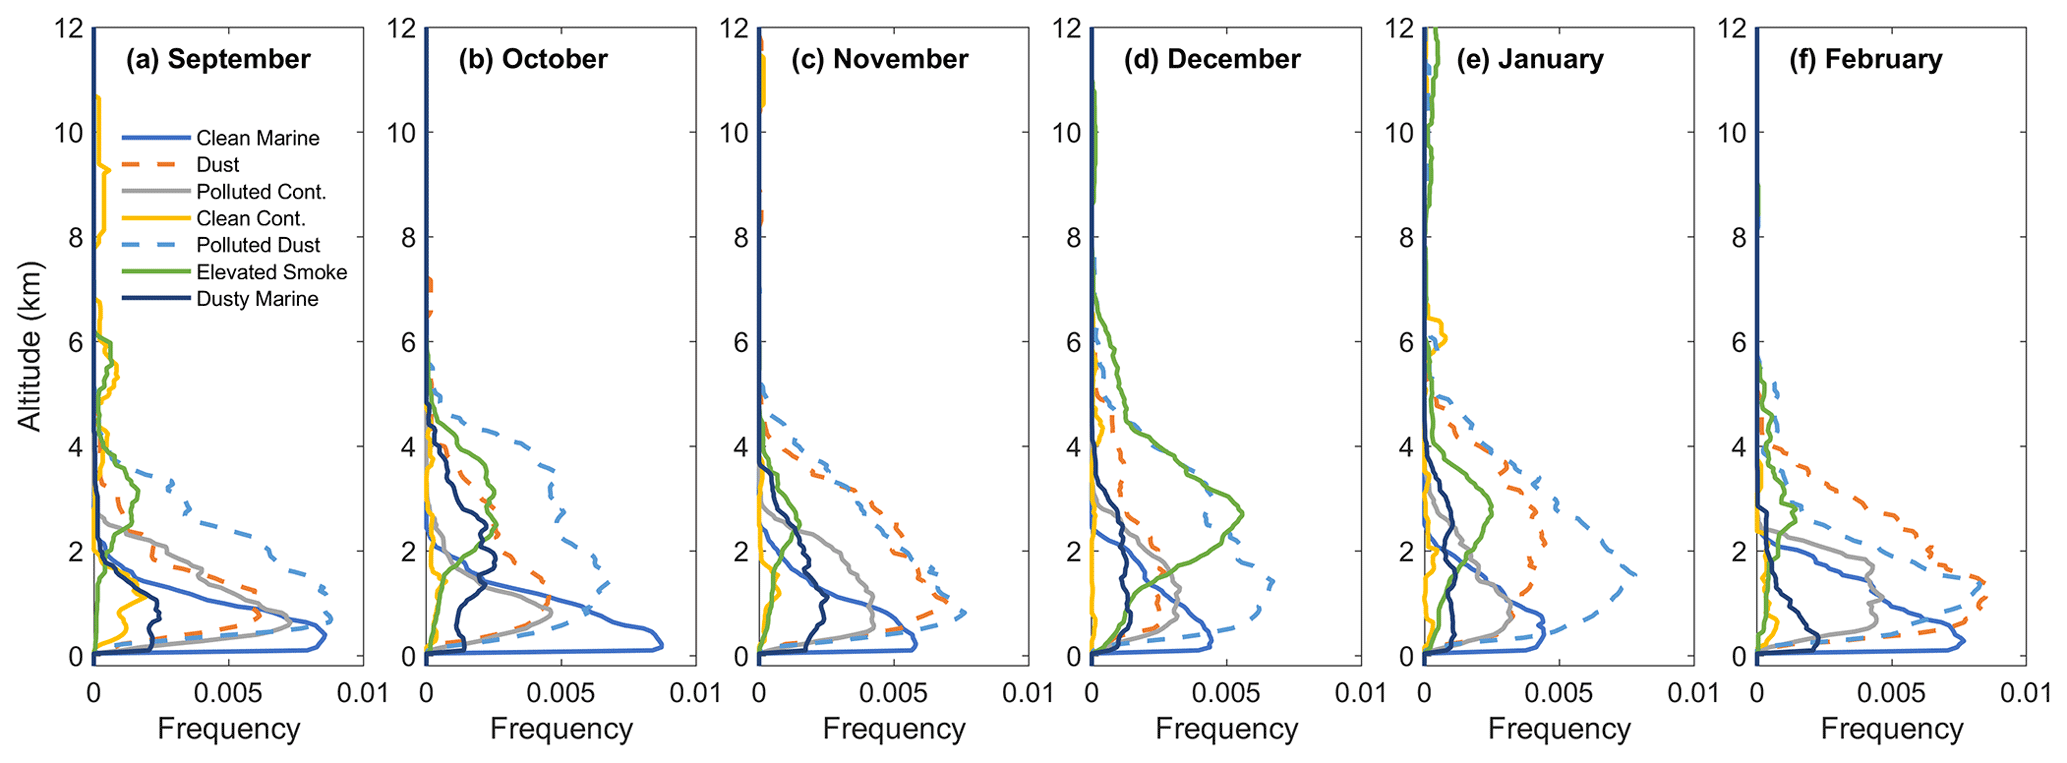
Figure 13Occurrence frequency profile of each aerosol type during the period September 2019–February 2020 from CALIPSO L3 aerosol profile data product in southeastern Australia (the selected domain is the gray area over southeastern Australia in Fig. 1b).
Observations from MODIS and AERONET revealed that the aerosol loading over the Australian continent, especially in southeastern Australia, significantly increased during the BB period of 2019/2020. Further, the spatial variations of different aerosol species during the BB periods of 2019/2020 and 2002–2018 were investigated based on MERRA-2 dataset (Fig. 14). It is evident that the carbonaceous AODs were greater than 0.08 across most of eastern and southeastern Australia, with a maximum value of 0.42 during the BB period of 2019/2020. The BB period of 2002–2018 showed high carbonaceous AOD values in northern Australia, which was consistent with the findings of Yang et al. (2020a). This was related to the biomass burning in savanna regions of northern Australia during the dry season. Large differences (> 0.04) were apparent between the two periods in southeastern and southwestern Australia, which can be attributed to the huge fires in those regions during the BB period of 2019/2020. The dust aerosols exhibited very similar spatial distributions in aerosol loadings but differ in their magnitudes during the BB periods of 2019/2020 and 2002–2018. The dust AODs were high in the Lake Eyre basin, with many values larger than 0.08, and decreased gradually towards the coastal areas during the two periods. The larger differences (> 0.02) in dust AOD for the two periods were also found in the Lake Eyre basin, while the smaller differences (< 0.01) were found in other regions. The result also confirmed the high coarse-mode aerosol volume concentration at Birdsville during the BB period of 2019/2020, as discussed in Sect. 3.1.2. The sulfate and sea salt AODs showed higher values in coastal areas and lower AOD values inland. Meanwhile, the differences of sulfate and sea salt AODs over Australia between the BB periods of 2019/2020 and 2002–2018 were small (< 0.01).
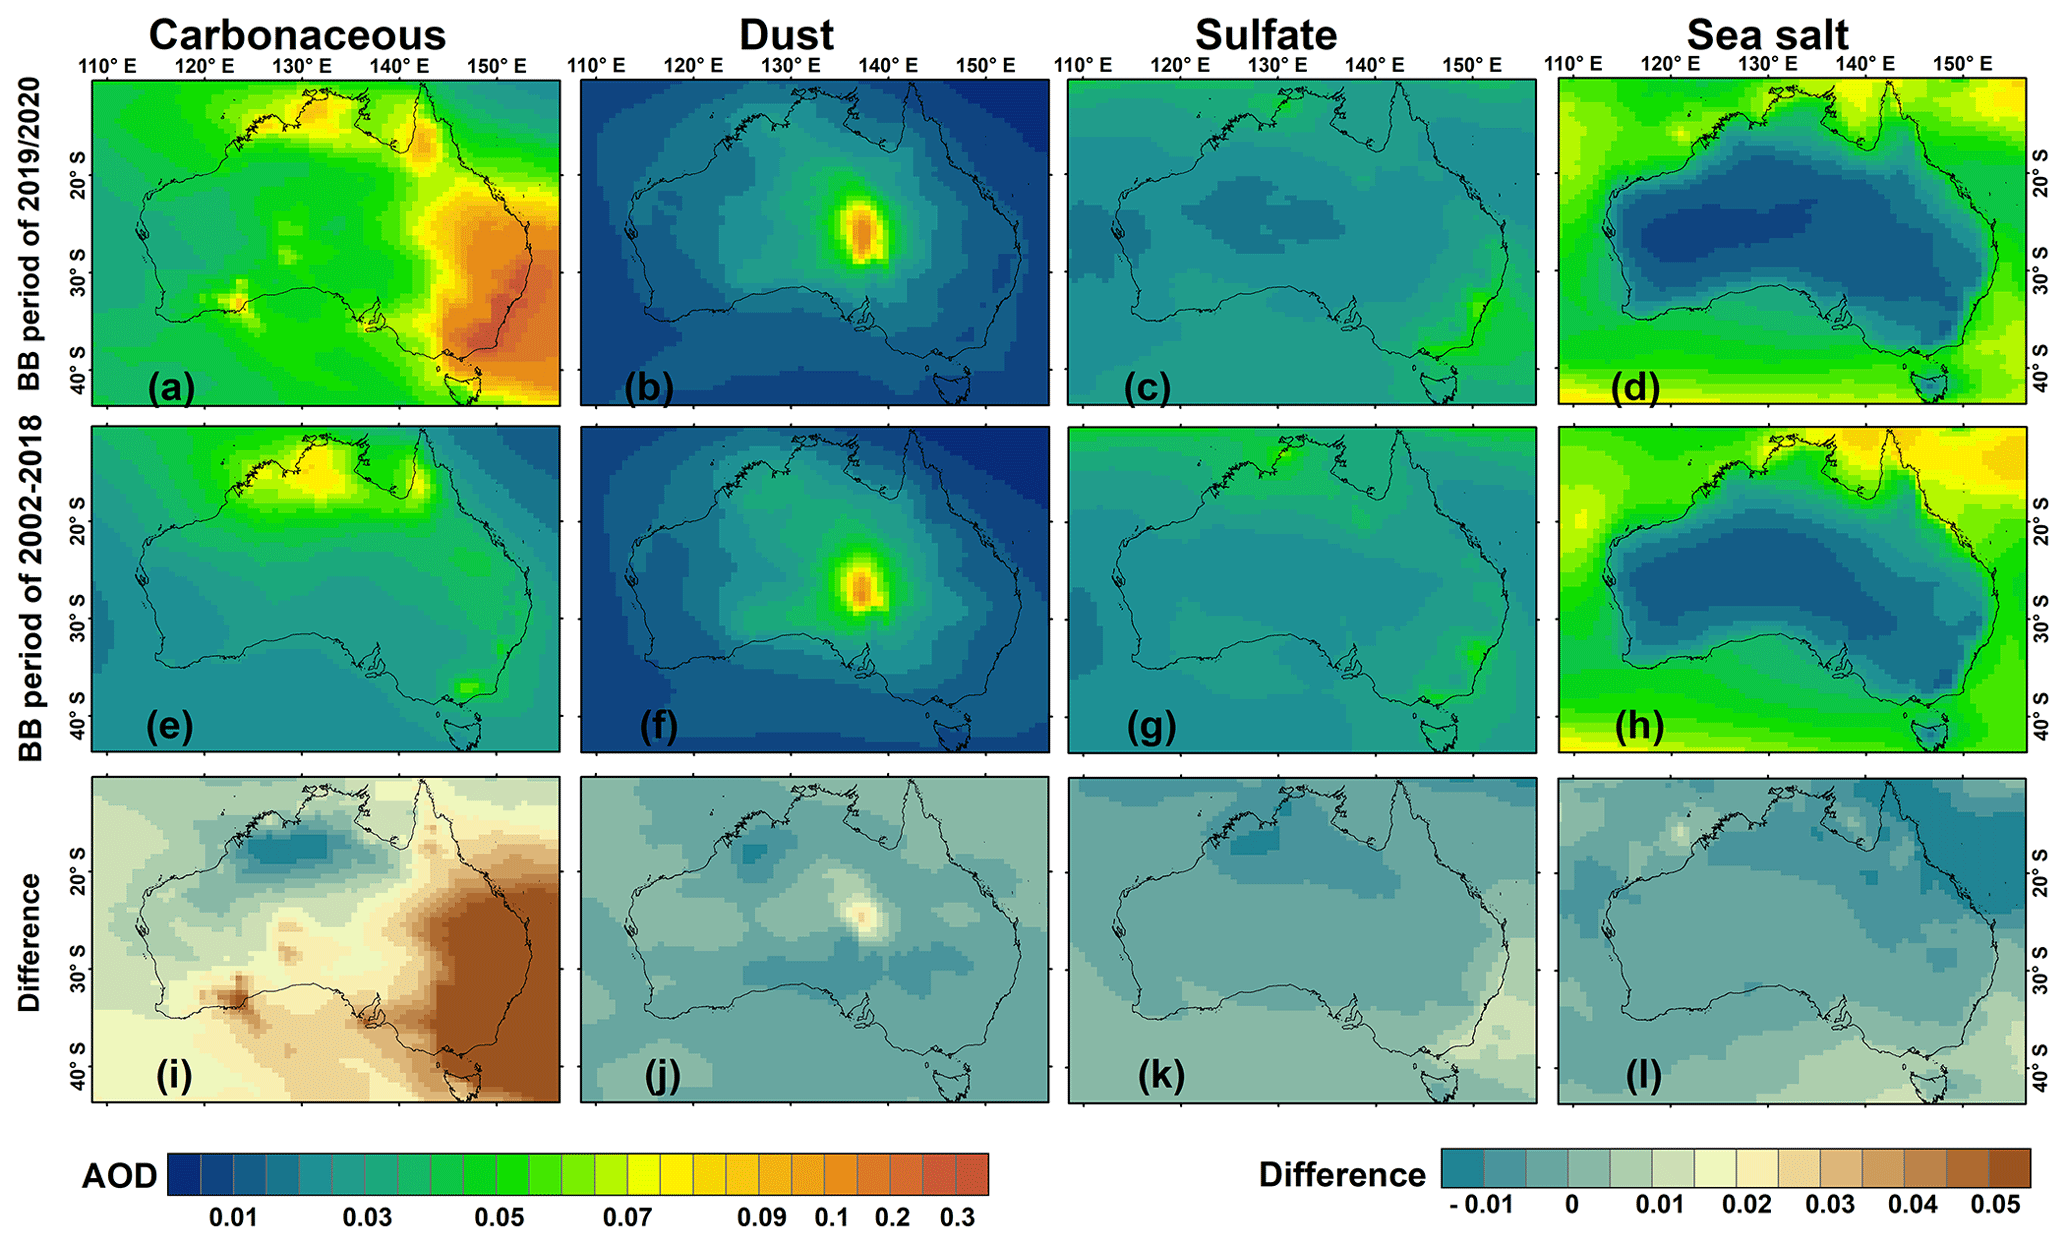
Figure 14Spatial distributions of carbonaceous, dust, sulfate, and sea salt AODs from MERRA-2 during the BB period of 2019/2020 (first row), the BB period of 2002–2018 (second row), and the differences between the two periods (third row) over Australia.
3.3 Case study of long-range transport of biomass-burning aerosol
Many studies showed that dust is the major type of atmospheric aerosol over central Australia (Qin and Mitchell, 2009; Mehta et al., 2018; Mukkavilli et al., 2019). However, central Australia is also affected by the long-range transport of biomass-burning aerosols during the BB period. During the BB period of 2019/2020, large amounts of smoke plumes produced by the southeastern Australian fires were found transported to the southern Pacific and even South America by the prevailing westerly winds (Ohneiser et al., 2020). Meanwhile, those smoke plumes may be transported inland and therefore affect regional aerosol properties over central Australia. From the information examined in Sect. 3.1 and 3.2, it is evident that the aerosols over central Australia were significantly affected by the fine-mode aerosols during the 2019/2020 fire events, implying the potential contribution from fire events. Here, we use a case study to illustrate the long-range transport of biomass-burning aerosols that occurred on 18–26 December 2019.
Figure 15 shows the daily AOD, AE, and aerosol volume size distributions on 18–26 December 2019 at Birdsville. The mean values of total AOD, fine-mode AOD, coarse-mode AOD, and AE were 0.382, 0.096, 0.286, and 1.366 at Birdsville, respectively. Further, higher fine-mode AOD values ranging from 0.095 to 0.650 were observed at Birdsville compared to coarse-mode AOD (0.026–0.227) on 18–26 December 2019, which indicated a higher contribution of AOD from fine-mode aerosols during this period. The peak values of fine-mode and coarse-mode AODs were 0.650 and 0.227 on 21 and 23 December 2019, respectively. Furthermore, the high volume concentrations of fine-mode aerosols were observed on 21 and 22 December 2019, while the high volume concentrations of coarse-mode aerosols were observed on 23 and 24 December 2019. These results suggested that Birdsville, which is located in the Lake Eyre basin, was likely significantly affected by the fine-mode aerosol transported over a long distance.

We next investigated how the fine-mode aerosol was produced and transported to the Birdsville site. Figure 16 shows the spatial distributions of fire spots and wind fields over Australia (first row); the MODIS AOD at 550 nm and 72 h back trajectories ending at Birdsville (second row); and the vertical feature mask of aerosols on 18, 21, and 26 December 2019 (third row). Fire spots were spread across the Australian continent, but few were located in the Lake Eyre basin in central Australia, where the Birdsville site is located. The highest density of fire spots was observed in southeastern and eastern Australia, indicating the intensive fire activities in those regions on 18, 21, and 26 December 2019. The easterly and southeasterly winds were observed at Birdsville on these 3 d, which may bring smoke plumes generated by the fires from eastern and southeastern Australia. The MODIS AOD showed high values (> 0.42) in eastern and southeastern Australia on these 3 d. It is clear that the high AOD values in eastern and southeastern Australia were caused by biomass burning during those days. The back trajectories ending at Birdsville were similar for both atmospheric levels at heights of 200 and 500 m. On 18 December, the air flows originated from southeastern Australia. However, the air masses on 21 and 26 December were from eastern Australia. The MODIS AOD and back trajectories indicated that the rapid increase in AOD at the Birdsville was associated with the transport of contaminated aerosols from eastern and southeastern Australia.

Figure 16Spatial distributions of fire spots (points) from MCD14ML and winds (arrows) from ERA-5 over Australia (first row); the Aqua MODIS DB AOD at 550 nm and 72 h back trajectories ending at two heights above ground level (500 m shown with red lines and 200 m shown with black lines) at Birdsville (second row); and the vertical feature mask of aerosol on 18, 21, and 26 December 2019 (third row) (CM: clean marine; DU: dust; PC: polluted continental; CC: clean continental; PD: polluted dust; SM: smoke; DM: dusty marine; CL: cloud). The black dot in the panels in the first and second rows represents the Birdsville site. The green lines in the panels in the second row represent the scanning orbit path of the CALIPSO satellite.
Furthermore, the measurements of aerosol subtype profiles from CALIPSO close to the Birdsville site were selected to examine the aerosol transport to Birdsville. On 18 December, the aerosol layer was a mixed of polluted dust and smoke aerosols and reached up to a height of 5 km at Birdsville and surrounding regions (∼ 26∘ S). The wind fields and back trajectories at Birdsville revealed that the airflows were from southeastern Australia that were regions with intensive fire events. Those airflows brought large amounts of smoke, which got mixed with the dust, resulting in large amounts of polluted dust. This result was also consistent with the observations from AERONET, showing the difference between fine-mode aerosol (0.095) and coarse-mode aerosol (0.060), which was small on 18 December. According the observation of AERONET, the total and fine-mode AOD increased on 18–19 and 20–22 December. On 21 December, the aerosol layer on the western side of the Birdsville site was smoke aerosol at the height of 4–7 km, which could be transported from the eastern Australia by the air flows. The result was consistent with that shown in Fig. 14, which showed high AOD values and high fine-mode aerosol volume concentrations on 21 December. On 26 December, the aerosol type on the west side of Birdsville was a mix of smoke and dust aerosol at the height of 0–5 km. Meanwhile, fine-mode aerosols coming from the regions with fire activities dominate at Birdsville under the influence of easterly wind. The result indicated that aerosol types at Birdsville and surrounding regions were still affected by the long-range transport of biomass-burning aerosols from eastern Australia. Overall, during the BB period of 2019/2020, central Australia was significantly affected by the long-range transport of biomass-burning aerosols, and both AOD values and the fine particle aerosol contribution significantly increased. This result was confirmed by the strong correlation between FRP and AOD over Australia. Moreover, the result also demonstrated that one reason for the strong correlation of AODs among widely separated sites over Australian continent, which was reported by Mitchell et al. (2013, 2017), was the regional transport of biomass-burning aerosols, especially during the BB period every year.
In this study, the impact of long-term fire events on aerosol properties in Australia were investigated by using MODIS fire products and ground-based and satellite-based aerosol products. Further, the spatiotemporal variations of aerosol properties during the 2019/2020 megafire events and a case study of long-range transport of biomass-burning aerosols over Australia were investigated. The main findings are as follows.
The fire count, FRP, and MODIS AOD exhibited distinct but consistent interannual variations with high values during the period September–February (BB period) every year. The correlations between fire count, FRP, and AOD were 0.43 and 0.62 over Australian continent, respectively. Furthermore, stronger correlation between AOD and fire count was found (0.63–0.85) during October–January than in other months (−0.08 to 0.47). The multi-year (2002–2020) averaged MODIS AOD over Australia was 0.040 with high values in eastern Australia (∼ 0.14) and gradually decreased westwards. MODIS AOD showed higher values during the BB period (0.051) than during the non-BB period (0.030) over Australia. The multi-year average contributions of carbonaceous, dust, sulfate, and sea salt aerosols to the total were 26.24 %, 23.38 %, 26.36 %, and 24.02 % over Australia, respectively. Carbonaceous aerosol was the major contributor to total aerosol during the BB period, especially during the months September–December when carbonaceous aerosol contributed the most (30.08 %–42.91 %). Results indicated that the AOD during the BB period dominantly contributed to the annual AOD with both fine-mode and coarse-mode aerosols increasing significantly during the BB period.
During the BB period of 2019/2020, the number of fire counts and FRP over Australia significantly increased from September and peaked in December and January, respectively. The megafires significantly affected aerosol properties in Australia, especially in southeastern Australia. The total AOD and fine-mode AOD values significantly increased, with extreme multi-peak values (e.g., 4.42 and 4.40 at Tumbarumba on 2 January 2020, respectively). During the months September–January, the regions with MODIS AOD values greater than 0.3 extended to eastern and southeastern Australia. Both fine and coarse aerosol particles generally increased in this period. Polluted dust was detected more frequently from 0.5 to 4 km. However, smoke was the dominant aerosol type detected at 2.5–12 km in December 2019 and the dominant aerosol type detected roughly from 6.2 to 12 km in January 2020, while dust was detected more frequently from 2 to 5 km in November 2019 and January and February 2020. Carbonaceous aerosols increased significantly in eastern and southeastern Australia, while dust aerosol increased in central Australia.
A case analysis emphasized that the long-range transport of biomass-burning aerosols from wildfire plumes in southeastern and eastern Australia significantly impacted central Australian desert regions, causing a significant increase in AOD and fine-mode aerosol contribution. The result demonstrated that an important reason for the strong correlations among fire count, FRP, and AOD, as well as among AODs at widely separated sites over Australian continent, was the regional transport of biomass-burning aerosols, especially during the BB period every year.
There are still some limitations in this study. First, 10 ground-based AERONET sites may not be sufficient to fully reveal the impact of wildfires on aerosol over Australia, which could have affected the statistics to some extent. Second, we distinguished and defined the BB period and non-BB period from perspective of the Australian continent based on high and low values of AOD and FRP, which could help create an understanding of the impact of wildfires on aerosols in Australia. However, the high fire frequencies occur during the dry season (generally April to November) in northern Australia, while the high fire frequencies occur in the austral spring and summer months (September–February) in southern and eastern Australia. Hence, future work will consider the difference of fire seasons on the Australian continent.
The AERONET dataset were obtained from https://aeronet.gsfc.nasa.gov/ (NASA, 2016). Aqua MODIS AOD data are available from the Atmosphere Archive and Distribution System Distributed Active Archive Center (LAADS DAAC; https://ladsweb.modaps.eosdis.nasa.gov/, Levy et al., 2015). HYSPLIT data are provided by the NOAA READY website (http://www.ready.noaa.gov, NOAA, 2016). MERRA-2 Reanalysis data were provided by the NASA Global Modeling and Assimilation Office (https://gmao.gsfc.nasa.gov/reanalysis/MERRA-2/, GMAO, 2015). ERA-5 Reanalysis data were provided by the European Centre for Medium Weather Forecasts (https://cds.climate.copernicus.eu/, Hersbach et al., 2019). CALIPSO data were acquired from NASA website (https://www-calipso.larc.nasa.gov/, NASA/LARC/SD/ASDC, 2019). The classified climate zones of Australia were obtained from Australian Bureau of Meteorology (http://media.bom.gov.au, Commonwealth of Australia, Bureau of Meteorology, 2005).
The supplement related to this article is available online at: https://doi.org/10.5194/acp-21-3833-2021-supplement.
CZ designed the research, and CZ and XCY carried out the research and wrote the manuscript. YY contributed to collecting and analyzing CALIPSO aerosol data. HF and XY provided constructive comments on this research. All authors made substantial contributions to this work.
The authors declare that they have no conflict of interest.
This research was supported by the National Natural Science Foundation of China (grant no. 41925022), the China National Key R&D Program (2019YFA0606803), and the State Key Laboratory of Earth Surface Processes and Resource Ecology. The authors would like to thank the AERONET team, NASA Goddard Space Flight Center (GSFC), NASA Global Modeling and Assimilation Office (GMAO), and CALIPSO team for providing aerosol optical property data. We also thank the LANCE-MODIS Archives and European Centre for Medium-Range Weather Forecasts teams for processing and distributing the active fire and ERA-5 data, respectively.
This research has been supported by the National Natural Science Foundation of China, National Outstanding Youth Science Fund Project of National Natural Science Foundation of China (grant no. 41925022), and the National Basic Research Program of China (973 Program) (grant no. 2019YFA0606803).
This paper was edited by Jianping Huang and reviewed by two anonymous referees.
Albergel, C., Dutra, E., Munier, S., Calvet, J.-C., Munoz-Sabater, J., de Rosnay, P., and Balsamo, G.: ERA-5 and ERA-Interim driven ISBA land surface model simulations: which one performs better?, Hydrol. Earth Syst. Sci., 22, 3515–3532, https://doi.org/10.5194/hess-22-3515-2018, 2018.
Boschetti, L. and Roy, D. P.: Strategies for the fusion of satellite fire radiative power with burned area data for fire radiative energy derivation, J. Geophys. Res.-Atmos., 114, D14S05, https://doi.org/10.1029/2008jd011645, 2009.
Bouya, Z. and Box, G. P.: Seasonal variation of aerosol size distributions in Darwin, Australia, J. Atmos. Sol.-Terr. Phy., 73, 2022–2033, https://doi.org/10.1016/j.jastp.2011.06.016, 2011.
Chen, Z., Schofield, R., Rayner, P., Zhang, T., Liu, C., Vincent, C., Fiddes, S., Ryan, R. G., Alroe, J., Ristovski, Z. D., Humphries, R. S., Keywood, M. D., Ward, J., Paton-Walsh, C., Naylor, T., and Shu, X.: Characterization of aerosols over the Great Barrier Reef: The influence of transported continental sources, Sci. Total Environ., 690, 426–437, https://doi.org/10.1016/j.scitotenv.2019.07.007, 2019.
Commonwealth of Australia, Bureau of Meteorology: Climate classifications (base climatological data sets), available at: http://www.bom.gov.au/jsp/ncc/climate_averages/climate-classifications (last access: 3 February 2021), 2005.
Crippa, P., Castruccio, S., Archer-Nicholls, S., Lebron, G. B., Kuwata, M., Thota, A., Sumin, S., Butt, E., Wiedinmyer, C., and Spracklen, D. V.: Population exposure to hazardous air quality due to the 2015 fires in Equatorial Asia, Sci. Rep.-UK, 6, 37074, https://doi.org/10.1038/srep37074, 2016.
Dubovik, O., Smirnov, A., Holben, B. N., King, M. D., Kaufman, Y. J., Eck, T. F., and Slutsker, I.: Accuracy assessments of aerosol optical properties retrieved from Aerosol Robotic Network (AERONET) Sun and sky radiance measurements, J. Geophys. Res.-Atmos., 105, 9791–9806, https://doi.org/10.1029/2000jd900040, 2000.
Dubovik, O., Holben, B., Eck, T. F., Smirnov, A., Kaufman,Y. J., King, M. D., Tanré, D., and Slutsker, I.: Variability of Absorption and Optical Properties of Key Aerosol Types Observed in Worldwide Locations, J. Atmos. Sci., 59, 590–608, https://doi.org/10.1175/1520-0469(2002)059<0590:voaaop>2.0.co;2, 2002.
Dubovik, O., Sinyuk, A., Lapyonok, T., Holben, B. N., Mishchenko, M., Yang, P., Eck, T. F., Volten, H., Muñoz, O., Veihelmann, B., van der Zande, W. J., Leon, J.-F., Sorokin, M., and Slutsker, I.: Application of spheroid models to account for aerosol particle nonsphericity in remote sensing of desert dust, J. Geophys. Res.-Atmos., 111, D11208, https://doi.org/10.1029/2005JD006619, 2006.
Dutta, R., Das, A., and Aryal, J.: Big data integration shows Australian bush-fire frequency is increasing significantly, Roy. Soc. Open Sci., 3, 150241, https://doi.org/10.1098/rsos.150241, 2016.
Filkov, A. I., Ngo, T., Matthews, S., Telfer, S., and Penman, T. D.: Impact of Australia's catastrophic 2019/20 bushfire season on communities and environment. Retrospective analysis and current trends, J. Safety Sci. Resilience, 1, 44–56, https://doi.org/10.1016/j.jnlssr.2020.06.009, 2020.
Fujii, Y., Kawamoto, H., Tohno, S., Oda, M., Iriana, W., and Lestari, P.: Characteristics of carbonaceous aerosols emitted from peatland fire in Riau, Sumatra, Indonesia (2): Identification of organic compounds, Atmos. Environ., 110, 1–7, https://doi.org/10.1016/j.atmosenv.2015.03.042, 2015.
Garrett, T. J. and Zhao, C.: Increased Arctic cloud longwave emissivity associated with pollution from mid-latitudes, Nature, 440, 787–789, https://doi.org/10.1038/nature04636, 2006.
Gelaro, R., McCarty, W., Suárez, M. J., Todling, R., Molod, A., Takacs, L., Randles, C. A., Darmenov, A., Bosilovich, M. G., Reichle, R., Wargan, K., Coy, L., Cullather, R., Draper, C., Akella, S., Buchard, V., Conaty, A., da Silva, A. M., Gu, W., Kim, G.-K., Koster, R., Lucchesi, R., Merkova, D., Nielsen, J. E., Partyka, G., Pawson, S., Putman, W., Rienecker, M., Schubert, S. D., Sienkiewicz, M., and Zhao, B.: The Modern-Era Retrospective Analysis for Research and Applications, Version 2 (MERRA-2), J. Climate, 30, 5419–5454, https://doi.org/10.1175/jcli-d-16-0758.1, 2017.
Giglio, L., Schroeder, W., and Justice, C. O.: The collection 6 MODIS active fire detection algorithm and fire products, Remote Sens. Environ., 178, 31–41, https://doi.org/10.1016/j.rse.2016.02.054, 2016.
Global Modeling and Assimilation Office (GMAO): MERRA-2 tavgM_2d_aer_Nx: 2d, Monthly mean, Time-averaged, Single-Level, Assimilation, Aerosol Diagnostics V5.12.4, Greenbelt, MD, USA, Goddard Earth Sciences Data and Information Services Center (GES DISC), https://doi.org/10.5067/FH9A0MLJPC7N, 2015.
Grandey, B. S., Lee, H.-H., and Wang, C.: Radiative effects of interannually varying vs. interannually invariant aerosol emissions from fires, Atmos. Chem. Phys., 16, 14495–14513, https://doi.org/10.5194/acp-16-14495-2016, 2016.
He, C., Miljevic, B., Crilley, L. R., Surawski, N. C., Bartsch, J., Salimi, F., Uhde, E., Schnelle-Kreis, J., Orasche, J., Ristovski, Z., Ayoko, G. A., Zimmermann, R., and Morawska, L.: Characterisation of the impact of open biomass burning on urban air quality in Brisbane, Australia, Environ. Int., 91, 230–242, https://doi.org/10.1016/j.envint.2016.02.030, 2016.
Hersbach, H. and Dee, D.: ERA5 reanalysis is in production, ECMWF Newsletter No. 147, 2016.
Hersbach, H., Bell, B., Berrisford, P., Biavati, G., Horányi, A., Muñoz Sabater, J., Nicolas, J., Peubey, C., Radu, R., Rozum, I., Schepers, D., Simmons, A., Soci, C., Dee, D., and Thépaut, J.-N.: ERA5 monthly averaged data on single levels from 1979 to present, Copernicus Climate Change Service (C3S) Climate Data Store (CDS), https://doi.org/10.24381/cds.f17050d7, 2019.
Holben, B. N., Eck, T. F., Slutsker, I., Tanré, D., Buis, J. P., Setzer, A., Vermote, E., Reagan, J. A., Kaufman, Y. J., Nakajima, T., Lavenu, F., Jankowiak, I., and Smirnov, A.: AERONET – A Federated Instrument Network and Data Archive for Aerosol Characterization, Remote Sens. Environ., 66, 1–16, https://doi.org/10.1016/S0034-4257(98)00031-5, 1998.
Ito, A. and Penner, J. E.: Global estimates of biomass burning emissions based on satellite imagery for the year 2000, J. Geophys. Res.-Atmos., 109, D14S05, https://doi.org/10.1029/2003jd004423, 2004.
Jacobson, M. Z.: Effects of biomass burning on climate, accounting for heat and moisture fluxes, black and brown carbon, and cloud absorption effects, J. Geophys. Res.-Atmos., 119, 8980–9002, https://doi.org/10.1002/2014jd021861, 2014.
Jiang, J. H., Su, H., Huang, L., Wang, Y., Massie, S., Zhao, B., Omar, A., and Wang, Z.: Contrasting effects on deep convective clouds by different types of aerosols, Nat. Commun., 9, 3874, https://doi.org/10.1038/s41467-018-06280-4, 2018.
Levy, R., Hsu, C., and MODIS Atmosphere Science Team: Aerosol Retrieval Group/MODIS Adaptive Processing System (MODAPS), MODIS Atmosphere L2 Aerosol Product, Goddard Space Flight Center, USA, https://doi.org/10.5067/MODIS/MYD04_L2.061, 2015.
Liu, Y., Zhu, Q., Huang, J., Hua, S., and Jia, R.: Impact of dust-polluted convective clouds over the Tibetan Plateau on downstream precipitation, Atmos. Environ., 209, 67–77, https://doi.org/10.1016/j.atmosenv.2019.04.001, 2019.
Luhar, A. K., Mitchell, R. M., Meyer, C. P., Qin, Y., Campbell, S., Gras, J. L., and Parry, D.: Biomass burning emissions over northern Australia constrained by aerosol measurements: II – Model validation, and impacts on air quality and radiative forcing, Atmos. Environ., 42, 1647–1664, https://doi.org/10.1016/j.atmosenv.2007.12.040, 2008.
Mallet, M. D., Desservettaz, M. J., Miljevic, B., Milic, A., Ristovski, Z. D., Alroe, J., Cravigan, L. T., Jayaratne, E. R., Paton-Walsh, C., Griffith, D. W. T., Wilson, S. R., Kettlewell, G., van der Schoot, M. V., Selleck, P., Reisen, F., Lawson, S. J., Ward, J., Harnwell, J., Cheng, M., Gillett, R. W., Molloy, S. B., Howard, D., Nelson, P. F., Morrison, A. L., Edwards, G. C., Williams, A. G., Chambers, S. D., Werczynski, S., Williams, L. R., Winton, V. H. L., Atkinson, B., Wang, X., and Keywood, M. D.: Biomass burning emissions in north Australia during the early dry season: an overview of the 2014 SAFIRED campaign, Atmos. Chem. Phys., 17, 13681–13697, https://doi.org/10.5194/acp-17-13681-2017, 2017.
McGowan, H. and Clark, A.: Identification of dust transport pathways from Lake Eyre, Australia using Hysplit, Atmos. Environ., 42, 6915–6925, https://doi.org/10.1016/j.atmosenv.2008.05.053, 2008.
Mehta, M., Singh, R., Singh, A., Singh, N., and Anshumali: Recent global aerosol optical depth variations and trends – A comparative study using MODIS and MISR level 3 datasets, Remote Sens. Environ., 181, 137–150, https://doi.org/10.1016/j.rse.2016.04.004, 2016.
Mehta, M., Singh, N., and Anshumali: Global trends of columnar and vertically distributed properties of aerosols with emphasis on dust, polluted dust and smoke – inferences from 10-year long CALIOP observations, Remote Sens. Environ., 208, 120–132, https://doi.org/10.1016/j.rse.2018.02.017, 2018.
Meyer, C. P., Luhar, A. K., and Mitchell, R. M.: Biomass burning emissions over northern Australia constrained by aerosol measurements: I – Modelling the distribution of hourly emissions, Atmos. Environ., 42, 1629–1646, https://doi.org/10.1016/j.atmosenv.2007.10.089, 2008.
Meyer, C. P., Cook, G. D., Reisen, F., Smith, T. E. L., Tattaris, M., Russell-Smith, J., Maier, S. W., Yates, C. P., and Wooster, M. J.: Direct measurements of the seasonality of emission factors from savanna fires in northern Australia, J. Geophys. Res.-Atmos., 117, D20305, https://doi.org/10.1029/2012jd017671, 2012.
Mitchell, R. M., O'Brien, D. M., and Campbell, S. K.: Characteristics and radiative impact of the aerosol generated by the Canberra firestorm of January 2003, J. Geophys. Res.-Atmos., 111, D02204, https://doi.org/10.1029/2005jd006304, 2006.
Mitchell, R. M., Forgan, B. W., Campbell, S. K., and Qin, Y.: The climatology of Australian tropical aerosol: Evidence for regional correlation, Geophys. Res. Lett., 40, 2384–2389, https://doi.org/10.1002/grl.50403, 2013.
Mitchell, R. M., Forgan, B. W., and Campbell, S. K.: The Climatology of Australian Aerosol, Atmos. Chem. Phys., 17, 5131–5154, https://doi.org/10.5194/acp-17-5131-2017, 2017.
Mukkavilli, S. K., Prasad, A. A., Taylor, R. A., Huang, J., Mitchell, R. M., Troccoli, A., and Kay, M. J.: Assessment of atmospheric aerosols from two reanalysis products over Australia, Atmos. Res., 215, 149–164, https://doi.org/10.1016/j.atmosres.2018.08.026, 2019.
Murphy, B. P., Prior, L. D., Cochrane, M. A., Williamson, G. J., and Bowman, D. M. J. S.: Biomass consumption by surface fires across Earth's most fire-prone continent, Glob. Change Biol., 25, 254–268, https://doi.org/10.1111/gcb.14460, 2018.
NASA: AEROSOL OPTICAL DEPTH (V3) – SOLAR and AEROSOL INVERSIONS (V3), Goddard Space Flight Center, USA, available at: https://aeronet.gsfc.nasa.gov/ (last access: 3 February 2021), 2016.
NASA/LARC/SD/ASDC: CALIPSO Lidar Level 3 Tropospheric Aerosol Profiles, Cloud Free Data, Standard V4-20 [Data set], NASA Langley Atmospheric Science Data Center DAAC, https://doi.org/10.5067/CALIOP/CALIPSO/CAL_LID_L3_Tropospheric_APro_CloudFree-Standard-V4-20, 2019.
NOAA: GDAS – Daily Tar Files (1∘ by 1∘), NCEI's NOAA National Operational Model Archive and Distribution System (NOMADS), available at: ftp://ftp.arl.noaa.gov/pub/archives/gdas1 (last access: 3 February 2021), 2016.
Ohneiser, K., Ansmann, A., Baars, H., Seifert, P., Barja, B., Jimenez, C., Radenz, M., Teisseire, A., Floutsi, A., Haarig, M., Foth, A., Chudnovsky, A., Engelmann, R., Zamorano, F., Bühl, J., and Wandinger, U.: Smoke of extreme Australian bushfires observed in the stratosphere over Punta Arenas, Chile, in January 2020: optical thickness, lidar ratios, and depolarization ratios at 355 and 532 nm, Atmos. Chem. Phys., 20, 8003–8015, https://doi.org/10.5194/acp-20-8003-2020, 2020.
Omar, A. H., Winker, D. M., Tackett, J. L., Giles, D. M., Kar, J., Liu, Z., Vaughan, M. A., Powell, K. A., and Trepte, C. R.: CALIOP and AERONET aerosol optical depth comparisons: One size fits none, J. Geophys. Res.-Atmos., 118, 4748–4766, https://doi.org/10.1002/jgrd.50330, 2013.
Qin, Y. and Mitchell, R. M.: Characterisation of episodic aerosol types over the Australian continent, Atmos. Chem. Phys., 9, 1943–1956, https://doi.org/10.5194/acp-9-1943-2009, 2009.
Radhi, M., Box, M. A., Box, G. P., and Mitchell, R. M.: Biomass burning aerosol over Northern Australia, Aust. Meteorol. Ocean., 62, 25–33, 2012.
Randles, C. A., da Silva, A. M., Buchard, V., Colarco, P. R., Darmenov, A., Govindaraju, R., Smirnov, A., Holben, B., Ferrare, R., Hair, J., Shinozuka, Y., and Flynn, C. J.: The MERRA-2 Aerosol Reanalysis, 1980 Onward. Part I: System Description and Data Assimilation Evaluation, J. Climate, 30, 6823–6850, https://doi.org/10.1175/jcli-d-16-0609.1, 2017.
Ravi, S., Baddock, M. C., Zobeck, T. M., and Hartman, J.: Field evidence for differences in post-fire aeolian transport related to vegetation type in semiarid grasslands, Aeolian Res., 7, 3–10,2012.
Reisen, F., Meyer, C. P., McCaw, L., Powell, J. C., Tolhurst, K., Keywood, M. D., and Gras, J. L.: Impact of smoke from biomass burning on air quality in rural communities in southern Australia, Atmos. Environ., 45, 3944–3953, https://doi.org/10.1016/j.atmosenv.2011.04.060, 2011.
Remer, L. A., Kaufman, Y. J., Tanré, D., Mattoo, S., Chu, D. A., Martins, J. V., Li, R.-R., Ichoku, C., Levy, R. C., Kleidman, R. G., Eck, T. F., Vermote, E., and Holben, B. N.: The MODIS Aerosol Algorithm, Products, and Validation, J. Atmos. Sci., 62, 947–973, https://doi.org/10.1175/jas3385.1, 2005.
Rooney, B., Wang, Y., Jiang, J. H., Zhao, B., Zeng, Z.-C., and Seinfeld, J. H.: Air quality impact of the Northern California Camp Fire of November 2018, Atmos. Chem. Phys., 20, 14597–14616, https://doi.org/10.5194/acp-20-14597-2020, 2020.
Sayer, A. M., Munchak, L. A., Hsu, N. C., Levy, R. C., Bettenhausen, C., and Jeong, M.-J.: MODIS Collection 6 aerosol products: Comparison between Aqua's e-Deep Blue, Dark Target, and “merged” data sets, and usage recommendations, J. Geophys. Res.-Atmos., 119, 13965–13989, https://doi.org/10.1002/2014JD022453, 2014.
Torres, O., Jethva, H., Ahn, C., Jaross, G., and Loyola, D. G.: TROPOMI aerosol products: evaluation and observations of synoptic-scale carbonaceous aerosol plumes during 2018–2020, Atmos. Meas. Tech., 13, 6789–6806, https://doi.org/10.5194/amt-13-6789-2020, 2020.
van der Werf, G. R., Randerson, J. T., Giglio, L., Collatz, G. J., Kasibhatla, P. S., and Arellano Jr., A. F.: Interannual variability in global biomass burning emissions from 1997 to 2004, Atmos. Chem. Phys., 6, 3423–3441, https://doi.org/10.5194/acp-6-3423-2006, 2006.
Vermote, E., Ellicott, E., Dubovik, O., Lapyonok, T., Chin, M., Giglio, L., and Roberts, G. J.: An approach to estimate global biomass burning emissions of organic and black carbon from MODIS fire radiative power, J. Geophys. Res.-Atmos., 114, D18205, https://doi.org/10.1029/2008jd011188, 2009.
Wagner, R., Jähn, M., and Schepanski, K.: Wildfires as a source of airborne mineral dust – revisiting a conceptual model using large-eddy simulation (LES), Atmos. Chem. Phys., 18, 11863–11884, https://doi.org/10.5194/acp-18-11863-2018, 2018.
Wang, C., Graham, R. M., Wang, K., Gerland, S., and Granskog, M. A.: Comparison of ERA5 and ERA-Interim near-surface air temperature, snowfall and precipitation over Arctic sea ice: effects on sea ice thermodynamics and evolution, The Cryosphere, 13, 1661–1679, https://doi.org/10.5194/tc-13-1661-2019, 2019.
Wang, Y., Khalizov, A., and Misti Levy, R. Z.: New Directions: Light absorbing aerosols and their atmospheric impacts, Atmos. Environ., 81, 713–715, 2013.
Wardoyo, A. Y. P., Morawska, L., Ristovski, Z. D., Jamriska, M., Carr, S., and Johnson, G.: Size distribution of particles emitted from grass fires in the Northern Territory, Australia, Atmos. Environ., 41, 8609–8619, 2007.
Winker, D., Pelon, J., and McCormick, M.: The CALIPSO mission: spaceborne lidar for observation of aerosols and clouds, Proc. SPIE Int. Soc. Opt. Eng., 4893, 1–11, https://doi.org/10.1117/12.466539, 2003.
Winton, V. H. L., Edwards, R., Bowie, A. R., Keywood, M., Williams, A. G., Chambers, S. D., Selleck, P. W., Desservettaz, M., Mallet, M. D., and Paton-Walsh, C.: Dry season aerosol iron solubility in tropical northern Australia, Atmos. Chem. Phys., 16, 12829–12848, https://doi.org/10.5194/acp-16-12829-2016, 2016.
Yan, X., Li, Z., Luo, N., Shi, W., Zhao, W., Yang, X., and Jin, J.: A minimum albedo aerosol retrieval method for the new-generation geostationary meteorological satellite Himawari-8, Atmos. Res., 207, 14–27, https://doi.org/10.1016/j.atmosres.2018.02.021, 2018.
Yan, X., Li, Z., Luo, N., Shi, W., Zhao, W., Yang, X., Liang, C., Zhang, F., and Cribb, M.: An improved algorithm for retrieving the fine-mode fraction of aerosol optical thickness. Part 2: Application and validation in Asia, Remote Sens. Environ., 222, 90–103, https://doi.org/10.1016/j.rse.2018.12.012, 2019.
Yang, X., Zhao, C., Guo, J., and Wang, Y.: Intensification of aerosol pollution associated with its feedback with surface solar radiation and winds in Beijing, J. Geophys. Res.-Atmos., 121, 4093–4099, https://doi.org/10.1002/2015jd024645, 2016.
Yang, X., Jiang, L., Zhao, W., Xiong, Q., Zhao, W., and Yan, X.: Comparison of Ground-Based PM2.5 and PM10 Concentrations in China, India, and the U.S, Int. J. Env. Res. Pub. He., 15, 1382, https://doi.org/10.3390/ijerph15071382, 2018.
Yang, X., Zhao, C., Luo, N., Zhao, W., Shi, W., and Yan, X.: Evaluation and Comparison of Himawari-8 L2 V1.0, V2.1 and MODIS C6.1 aerosol products over Asia and the oceania regions, Atmos. Environ., 220, 117068, https://doi.org/10.1016/j.atmosenv.2019.117068, 2020a.
Yang, X., Zhao, C., and Yang, Y.: Long-term multi-source data analysis about the characteristics of aerosol optical properties and types over Australia, Atmos. Chem. Phys. Discuss. [preprint], https://doi.org/10.5194/acp-2020-921, in review, 2020b.
Yang, Y., Zhao, C., Dong, X., Fan, G., Zhou, Y., Wang, Y., Zhao, L., Lv, F., and Yan, F.: Toward understanding the process-level impacts of aerosols on microphysical properties of shallow cumulus cloud using aircraft observations, Atmos. Res., 221, 27–33, https://doi.org/10.1016/j.atmosres.2019.01.027, 2019.
Zhao, C. and Garrett, T. J.: Effects of Arctic haze on surface cloud radiative forcing, Geophys. Res. Lett., 42, 557–564, https://doi.org/10.1002/2014gl062015, 2015.
Zhao, C., Lin, Y., Wu, F., Wang, Y., Li, Z., Rosenfeld, D., and Wang, Y.: Enlarging Rainfall Area of Tropical Cyclones by Atmospheric Aerosols, Geophys. Res. Lett., 45, 8604–8611, 10.1029/2018gl079427, 2018.
Zheng, C., Zhao, C., Zhu, Y., Wang, Y., Shi, X., Wu, X., Chen, T., Wu, F., and Qiu, Y.: Analysis of influential factors for the relationship between PM2.5 and AOD in Beijing, Atmos. Chem. Phys., 17, 13473–13489, https://doi.org/10.5194/acp-17-13473-2017, 2017.
Zheng, Y., Che, H., Xia, X., Wang, Y., Wang, H., Wu, Y., Tao, J., Zhao, H., An, L., Li, L., Gui, K., Sun, T., Li, X., Sheng, Z., Liu, C., Yang, X., Liang, Y., Zhang, L., Liu, C., Kuang, X., Luo, S., You, Y., and Zhang, X.: Five-year observation of aerosol optical properties and its radiative effects to planetary boundary layer during air pollution episodes in North China: Intercomparison of a plain site and a mountainous site in Beijing, Sci. Total Environ., 674, 140–158, https://doi.org/10.1016/j.scitotenv.2019.03.418, 2019.
Zhu, Q., Liu, Y., Jia, R., Hua, S., Shao, T., and Wang, B.: A numerical simulation study on the impact of smoke aerosols from Russian forest fires on the air pollution over Asia, Atmos. Environ., 182, 263–274, https://doi.org/10.1016/j.atmosenv.2018.03.052, 2018.