the Creative Commons Attribution 4.0 License.
the Creative Commons Attribution 4.0 License.
 | 12 Mar 2021
Speciation of VOC emissions related to offshore North Sea oil and gas production
Shona E. Wilde
Pamela A. Dominutti
Grant Allen
Stephen J. Andrews
Prudence Bateson
Stephane J.-B. Bauguitte
Ralph R. Burton
Ioana Colfescu
James France
James R. Hopkins
Langwen Huang
Anna E. Jones
Tom Lachlan-Cope
James D. Lee
Alastair C. Lewis
Stephen D. Mobbs
Alexandra Weiss
Stuart Young
The North Sea is Europe's key oil and gas (O&G) basin with the output currently meeting 3 %–4 % of global oil supply. Despite this, there are few observational constraints on the nature of atmospheric emissions from this region, with most information derived from bottom-up inventory estimates. This study reports on airborne measurements of volatile organic compounds (VOCs) emitted from O&G-producing regions in the North Sea. VOC source emission signatures for the primary extraction products from offshore fields (oil, gas, condensate, mixed) were determined in four geographic regions. Measured iso-pentane to n-pentane (iC5 nC5) ratios were 0.89–1.24 for all regions, used as a confirmatory indicator of O&G activities. Light alkanes (ethane, propane, butane, pentane) were the dominant species emitted in all four regions; however, total OH reactivity was dominated by unsaturated species, such as 1,3-butadiene, despite their relatively low abundance. Benzene to toluene ratios indicated the influence of possible terrestrial combustion sources of emissions in the southern, gas-producing region of the North Sea, seen only during south or south-westerly wind episodes. However, all other regions showed a characteristic signature of O&G operations. Correlations between ethane (C2H6) and methane (CH4) confirmed O&G production to be the primary CH4 source. The enhancement ratio (ΔC2HCH4) ranged between 0.03–0.18, indicating a spatial dependence on emissions with both wet and dry CH4 emission sources. The excess mole fraction demonstrated that deepwater oil extraction resulted in a greater proportion of emissions of higher carbon number alkanes relative to CH4, whereas gas extraction, typically from shallow waters, resulted in a less complex mix of emissions dominated by CH4. The VOC source profiles measured were similar to those in the UK National Atmospheric Emissions Inventory (NAEI) for oil production, with consistency between the molar ratios of light alkanes to propane. The largest discrepancies between observations and the inventory were for mono-aromatic compounds, highlighting that these species are not currently fully captured in the inventory. These results demonstrate the applicability of VOC measurements to distinguish unique sources within the O&G sector and give an overview of VOC speciation over the North Sea.
- Article
(4006 KB) - Full-text XML
- BibTeX
- EndNote


Emissions from offshore oil and gas (O&G) production have been little studied in comparison to those from onshore production. Globally, offshore oil production accounted for around 30 % of the overall production in 2015 (EIA, 2016a). The North Sea is home to the largest number of offshore rigs worldwide with 184 operational installations as of January 2018 (Statistica, 2018). These are located across a number of different regions in the territorial waters of the United Kingdom (UK), Norway and the Netherlands. UK O&G production reached a 7-year high in 2018 with an increase of more than 4 % from 2017 (Oil and Gas Authority, 2019), meaning production from the UK Continental Shelf (UKCS) met 59 % of the O&G demand of the UK as of 2018 (Oil and Gas UK, 2019). The Norwegian sector is an evolving region of the North Sea with around 20 projects in various stages of development on the Norwegian Continental Shelf. Oil output is expected to grow by 43 % from 2019 to 2024 as production from new fields begins and older facilities are upgraded (Norwegian Petroleum Directorate, 2020a). The Netherlands was the second largest producer of natural gas in the EU in 2018 (Eurostat, 2019). The onshore Groningen field is by far the largest; however, production is set to cease by 2022 due to induced seismicity above the field, meaning offshore, small-field production may become increasingly important for the Dutch sector.
The release of air pollutants from O&G production has led to growing environmental and public scrutiny. Emissions of greenhouse gases such as methane (CH4) are often the focus due to its high global warming potential (Miller et al., 2013). Interest in emissions of volatile organic compounds (VOCs) from regions of O&G production arises because of their role as precursors to tropospheric ozone (Kemball-Cook et al., 2010; Edwards et al., 2014) and secondary organic aerosols. Both of these secondary pollutants have associated health and ecosystem effects (McKenzie et al., 2012). Detailed measurements and quantification of VOCs and their subsequent reaction products is therefore needed in order to mitigate these air quality concerns (Koss et al., 2017). Emissions of VOCs can arise at all stages of the production process, such that crude oil processing was considered to be capable of emitting around 16 % of the total global VOC emissions into the atmosphere in the late 20th century (Masnadi et al., 2018). Sources include power generation sets, compressors, pumps, flaring off excess gas, cold venting during tank loading for transport on shuttle vessels and general fugitive emissions. Previous studies conducted in the United States have reported high VOC emissions for onshore wells and pads (Ghosh, 2018; Gilman et al., 2013; Koss et al., 2017; Simpson et al., 2010; Warneke et al., 2014; Pétron et al., 2012). These studies have shown that comprehensive VOC characterization is crucial for source identification and to aid the estimation of effects of those emissions on air quality in the surrounding regions.
The VOC composition of O&G emissions can be influenced by several variables, including the product being extracted (e.g. oil, gas or condensate), geological composition of the reservoir, extraction techniques, age of the rig and infrastructure components. Offshore O&G emissions are naturally more difficult to measure due to lack of access to the installations and the large number of potential sources due to the complexity of offshore extraction. Offshore platforms are different to onshore well pads and their purpose and function are extremely varied; therefore it should not be assumed that studies quantifying onshore emissions will adequately represent emissions from the offshore sector. Few studies have examined VOC emissions from offshore facilities, whilst many of those that have follow “disaster” events, such as the Deepwater Horizon oil spill in the Gulf of Mexico in 2010 (Camilli et al., 2010; Ryerson et al., 2011) and the Elgin platform gas uncontrolled release in the North Sea in 2012 (Lee et al., 2018). Events such as these are uncommon and are therefore unlikely to be representative of VOC emissions from the offshore sector as a whole.
Offshore emissions are explicitly identified and reported in the UK National Atmospheric Emissions Inventory (NAEI). O&G operators are responsible for the self-reporting of these emissions for each offshore production platform. Whilst emissions of CH4 are allocated to individual sources, only a total mass of VOC emission is reported for each point source platform, with no information relating to emissions of individual compounds. Some estimation of the relative speciation of VOCs is made in the inventory using historical speciation profiles; however, these are generalized across source sectors and the overall uncertainties in these source profiles are not quantified. To date, VOCs in the North Sea have not been extensively studied. In this context, an improvement in the knowledge of VOC emissions from offshore O&G facilities is needed, in order to assess the potential impacts that these emissions can have in the atmosphere as well as to improve the accuracy of emissions inventories.
Here we report measurements of VOCs made from research aircraft downwind of O&G installations over the course of multiple research flights across all regions of the North Sea. To the best of our knowledge, this is the first time that intensive airborne VOC measurements have been made regarding O&G installations in the North Sea. Our study evaluates the general emission sources as well as a more detailed evaluation of speciation as it relates to the production of oil, gas and condensate. The source signatures of each primary extraction product were quantified using enhancement ratios to expose the spatial differences in emissions. Finally, a comparison has been made to the UK emissions inventory in order to evaluate commonalities and discrepancies in the VOC speciation of source profiles for the O&G sector.
2.1 Measurement location and context
Measurements from a BAe-146 aircraft operated by the Facility for Airborne Atmospheric Measurements (FAAM) and a DHC6 Twin Otter operated by the British Antarctic Survey (BAS) were made over a 4-year period, beginning in 2015 and ending in summer 2019. The data used here were associated with a range of different projects: baseline (http://data.ceda.ac.uk/badc/faam/data/2015/b907-may-13, last access: 9 February 2021), Methane Observation and Yearly Assessment (MOYA) (http://data.ceda.ac.uk/badc/faam/data/2019/c191-jul-29, last access: 9 February 2021), Climate and Clean Air Coalition (CCAC) (http://data.ceda.ac.uk/badc/bas-aircraft/data, last access: 9 February 2021) and Assessing Atmospheric Emissions from the Oil and Gas Industry (AEOG) (http://data.ceda.ac.uk/badc/faam/data/2018/c099-apr-25, last access: 9 February 2021). The flights surveyed a large number of O&G installations distributed across the whole of the North Sea. Data from a total of 28 flights (approximately 128 flying hours) across multiple airborne experiments were unified to generate a single dataset for this analysis and are summarized in Table A1.
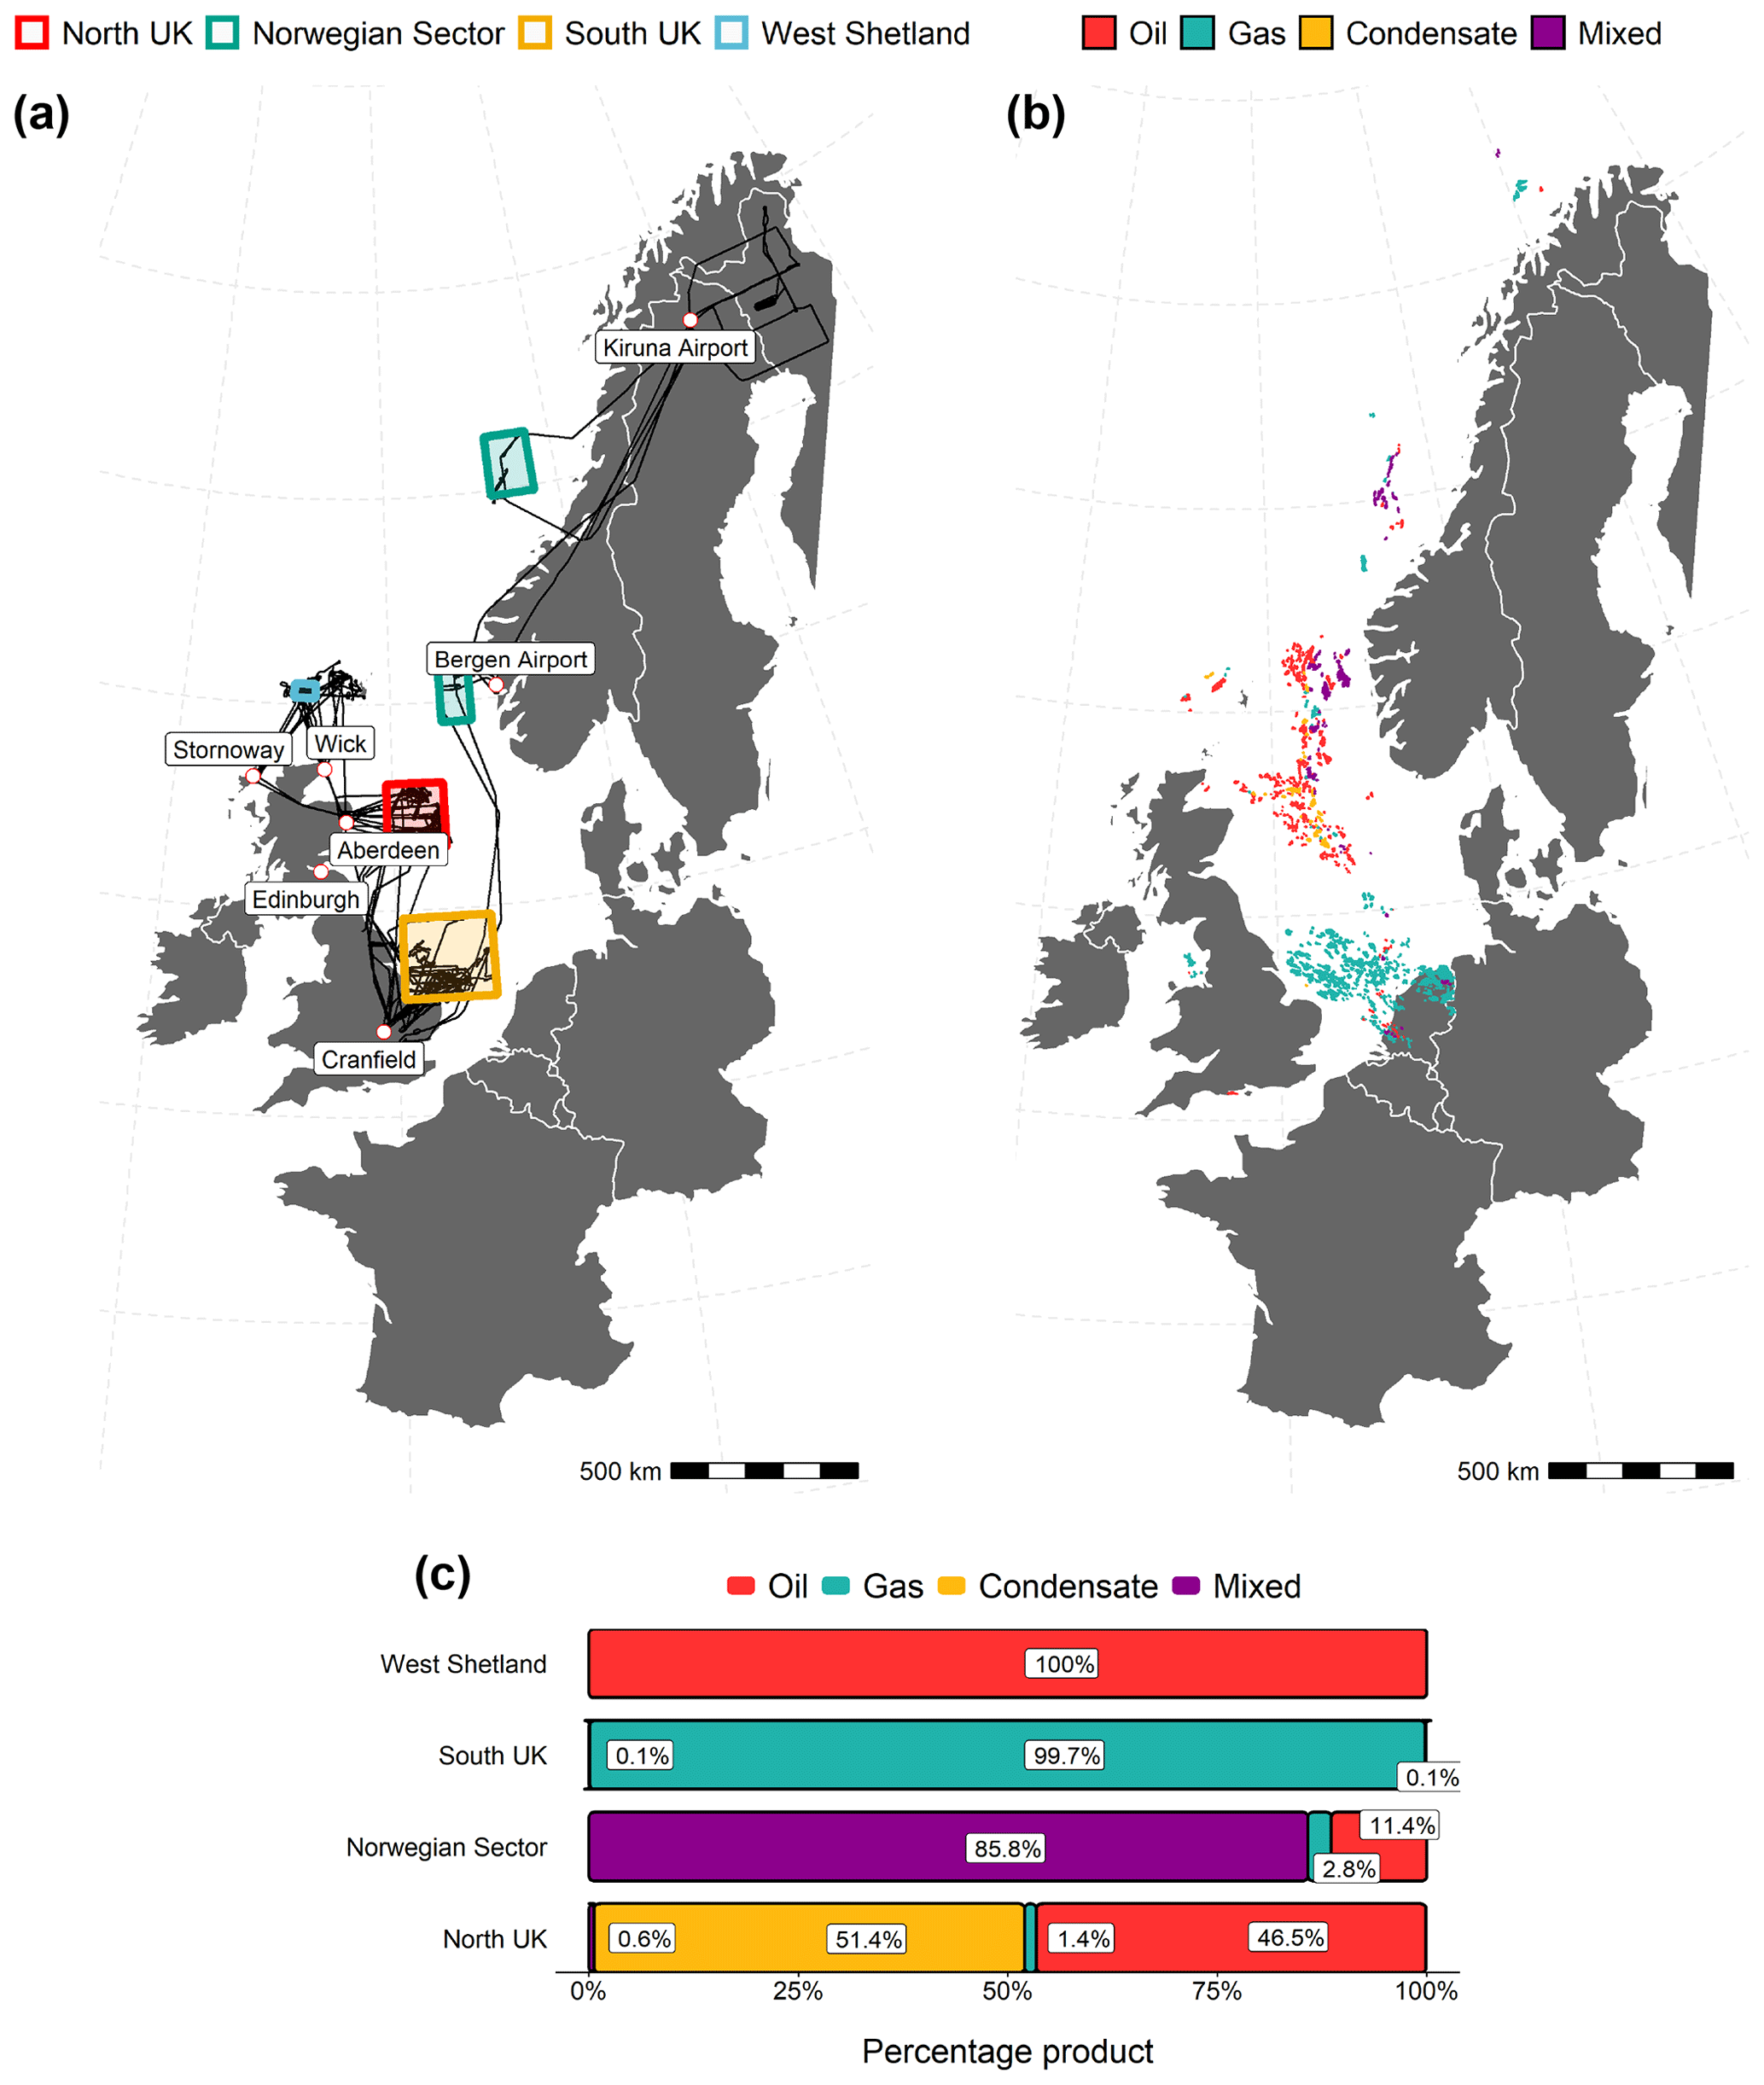
Figure 1(a) Regions of the North Sea defined for analysis. The black lines represent the flight tracks of the research aircraft. (b) Location of all offshore fields in the North Sea. Each polygon is coloured by the extraction product from each field. (c) Percentage contribution of each offshore field type to the total area of all fields in each region. Country polygons were obtained using the “rnaturalearth” R package (South, 2017).
The spatial distribution of emissions attributed to O&G operations was evaluated by dividing the North Sea into four distinct regions, shown by the coloured boxes in Fig. 1a. The regions were chosen for extended sampling because they contain high densities of offshore platforms and geologically distinct fossil-fuel-producing reservoirs (Fig. 1b), allowing for comparison of source signatures. The northern UK region comprises oil-, gas- and condensate-producing platforms serviced from Aberdeen and Hartlepool. The Britannia gas field, located 130 miles north-east of Aberdeen, is one of the largest fields in the North Sea (Hill and Palfrey, 2003). The Norwegian sector encompasses platforms in both the North and Norwegian seas. Fields include Oseberg and Asgard, which are Norway's seventh and eight biggest fields respectively. The southern UK region includes a combination of fields located in the UK and Dutch sections of the North Sea. This region has the highest number of platforms. The largest field in this region is Leman, which has a current estimated production of 5.7×10⁶ m3 of gas per day (Glennie, 2001). Finally, the West Shetland region is a term that incorporates platforms located in the Schiehallion, Foinaven, Clair, Alligin, Lancaster and Solan oil fields. The surveyed area lies approximately 190 km west of the Shetland Isles. Recoverable reserves are estimated to be in the region of 250–600 million barrels of oil (BP Exploration Company Ltd., 2019).
Offshore field outlines and corresponding field types were obtained from the respective O&G authorities: the Oil and Gas Authority for UK fields (, ), the Norwegian Petroleum Directorate for Norwegian fields (Norwegian Petroleum Directorate, 2020b), and the Geological Survey of The Netherlands for fields in the Dutch sector (, ). Each listed offshore field is assigned a field type of either oil, gas, condensate or a mixture. Often the dominant product of a field can change over time as reservoirs are depleted; therefore it is assumed that the field type listed is that of the most recent extraction product. Each region has distinct fossil-fuel-producing reservoirs, shown in Fig. 1c. West Shetland is entirely an oil-producing region, whereas the southern UK is dominated by gas production. The northern UK is approximately a 50:50 mix of oil and condensate fields with a minor percentage of gas fields. The Norwegian sector contains an array of all offshore field types, which are assigned as mixed, where multiple products are extracted from the same well.
2.2 Instrumentation
Both aircraft were equipped with a suite of chemical and meteorological instrumentation. Basic atmospheric measurements including thermodynamic properties, wind and turbulence were included on both aircraft, from which information about the height, stability and structure of the atmosphere can be derived. Measurements of carbon dioxide (CO2), CH4 and ethane (C2H6) at 1 Hz, along with a whole air sampling (WAS) system for the collection of VOCs, were available on both aircraft. Additional measurements of nitrogen oxides (NOx), carbon monoxide (CO) and ozone (O3) were available on some but not all of the flights. Details about FAAM instruments can be found on the FAAM (http://www.faam.ac.uk, last access: 9 February 2021) and Twin Otter (https://www.bas.ac.uk, last access: 9 February 2021) websites. Instrumentation and set-up of the BAS Twin Otter aircraft are also detailed elsewhere (France et al., 2021).
2.2.1 Aircraft whole air samples
Discrete ambient air samples were collected in evacuated canisters via an external inlet using unique sampling systems on board each aircraft. Both systems are based on the same principles and contain comparable components. In each system, evacuated stainless steel canisters, sealed with pneumatically actuated bellows valves (Swagelok, SS-BNVS4-C), were filled and pressurized in-flight by drawing air from the main sampling manifold using an all-stainless-steel assembly double-headed bellows pump. Air was continuously flushed through the internal manifold of the cases prior to filling. More specifically, the WAS system used on the FAAM aircraft (baseline, AEOG and MOYA campaigns; Appendix Table A1) consists of 64 silica passivated stainless steel canisters of 3 L internal volume (Thames Restek UK) fitted to the rear hold of the aircraft. The Son of Whole Air Sampler (SWAS) is a new, updated version of the parent WAS system and was used on Twin Otter flights only (CCAC campaigns, Table A1). Cases of Silonite-coated (Entech) canisters are grouped together modularly within the aircraft cabin. The SWAS has additional functionality, where cases comprise either 16 × 1.4 L canisters or 8 × 2 L canisters. The 1.4 L version has a single valve and was filled from vacuum to 3 atm gauge pressure. The 2 L version has valves at each end and could be filled either from vacuum or by flowing through at a variably set back-pressure before filling. The latter allowed greater control for the capture of rapidly changing atmospheric events such as narrow pollutant plumes. Canisters from both systems were deployed during the campaigns and took approximately 10–20 s to fill, corresponding to roughly 1–2 km of horizontal flight.
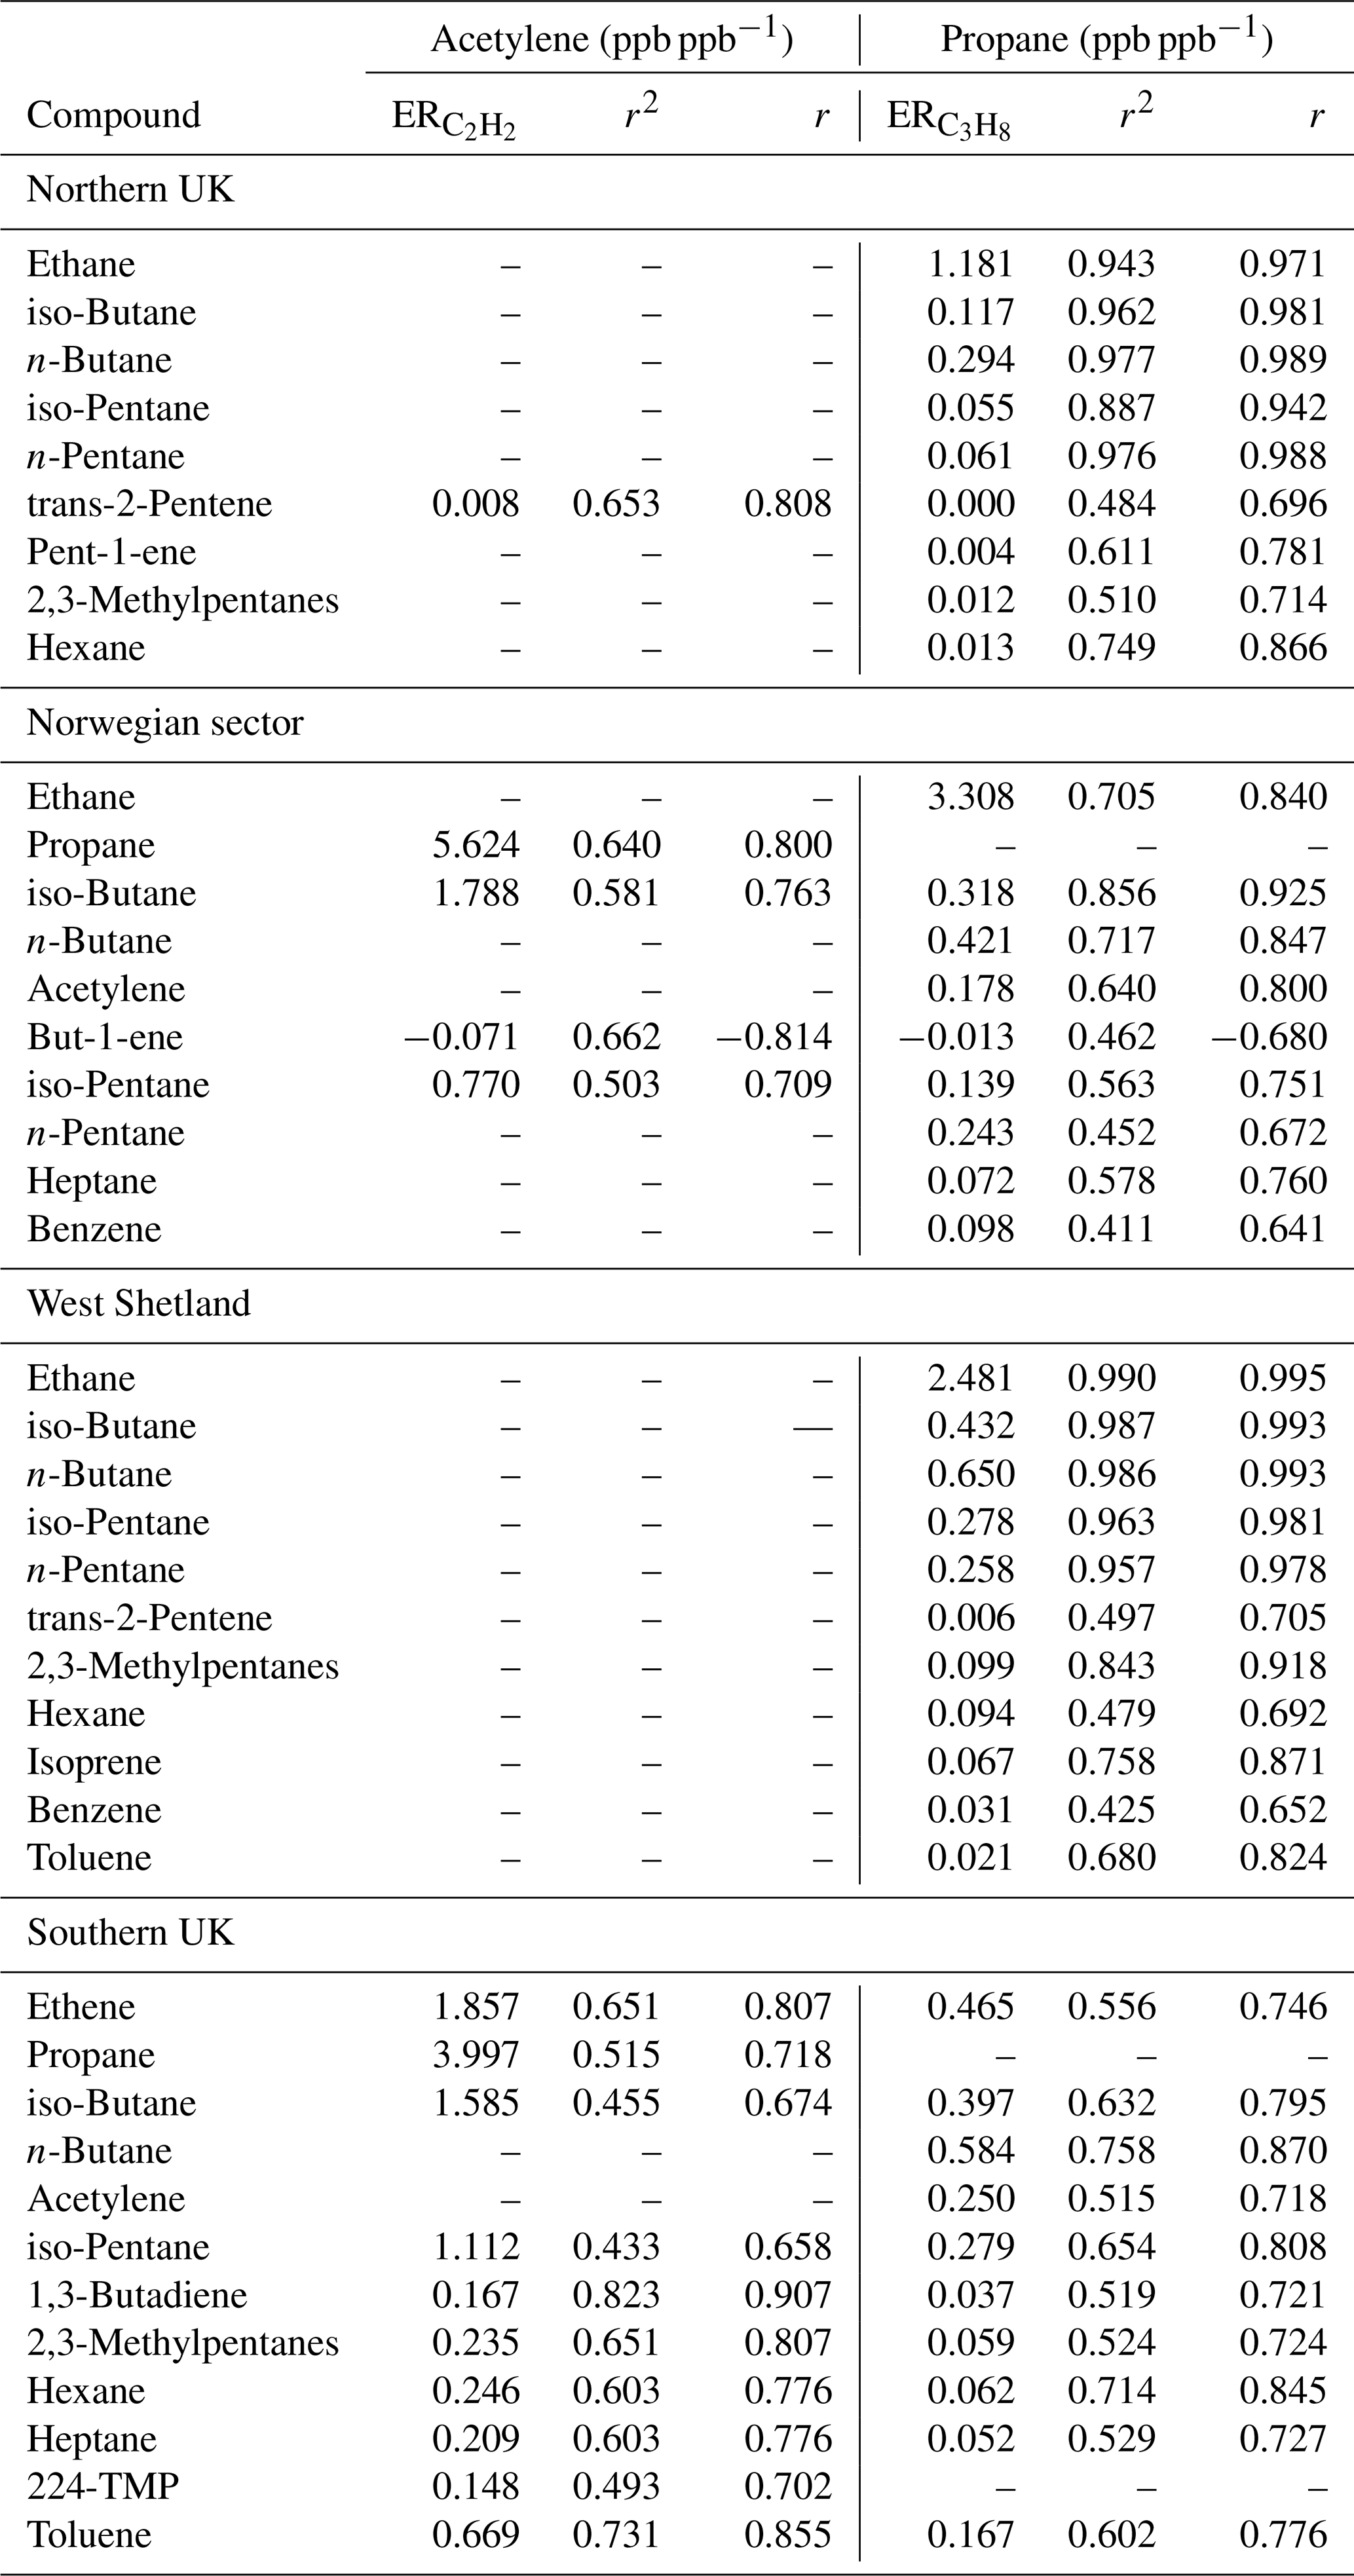
Table 1Emission ratios (ERs) from the slope of the linear fit using reduced major-axis regression, r2 values and Pearson correlation coefficients (r) for tracer compounds with listed VOCs in each sampling region. Values are only shown for compounds which had correlations with tracer compounds with an r2>0.4.
2.2.2 Laboratory analysis of VOCs
The whole air samples were analysed post-flight using a dual-channel gas chromatograph with flame ionization detection (GC-FID) (Hopkins et al., 2003) housed at the University of York. Aliquots of air (700 mL) were withdrawn from the sample canister and dried using a condensation finger held at −30 ∘C. Samples were pre-concentrated onto a multi-bed carbon adsorbent ozone precursor trap provided by Markes International Ltd. before being transferred to the columns within the gas chromatograph in a stream of helium. The trap was held at −27 ∘C during sample collection and then heated to 325 ∘C at a rate of 20 ∘C s−1 during transfer to the GC. The eluent was injected onto an aluminium oxide (Al2O3, NaSO4 deactivated) porous layer open tubular (PLOT) column for analysis of VOCs. Peak identification was made by reference to a National Physical Laboratory (NPL) calibration gas standard containing a known amount of 30 non-methane hydrocarbons (NMHCs) ranging from C2–C9 (NPL30, D600145-2018, UK). Peak integration, blank correction and the application of calibration data to calculate mixing ratios was conducted using GC Soft, Inc software. VOC extended uncertainties during our analyses ranged from 0.72 % to 8.37 %, with the highest values obtained for octane (5.80 %), acetylene (6.61 %) and toluene (8.37 %). Uncertainties were calculated based on the accuracy and precision resulting from multiple injections of the standard into the GC-FID and were multiplied by a coverage factor of 2 to give 95 % confidence intervals.
2.2.3 Ancillary measurements
CH4 and CO2 mole fractions were measured by a fast 10 Hz G2311-f Picarro (France et al., 2021) on the Twin Otter (precision at 5 s intervals of < 0.5 ppb for CH4) and by a Los Gatos Research Fast Greenhouse Gas Analyzer (Lee et al., 2018) on the FAAM aircraft (FGGA, precision of < 2 ppb for CH4). Full details of the measurement principles and the implementation of the instrument on board the aircraft, including an assessment of the instrument performance, are presented elsewhere (Cain et al., 2017; O'Shea et al., 2013). Calibration took place in-flight using standards traceable to the WMO greenhouse gas scale.
Atmospheric C2H6 was monitored by a Tunable Infrared Laser Direct Absorption Spectrometer (TILDAS, Aerodyne Research, Inc) (Yacovitch et al., 2014). This instrument applies a continuous wave laser operating in the mid-infrared region (at λ=3.3 µm). Rapid tuning sweeps of the laser frequency result in the collection of thousands of spectra per second, which are co-averaged. The resulting averaged spectrum is processed at a rate of 1 Hz using a non-linear least-squares fitting algorithm to determine mixing ratios. A path length of 76 m is achieved using a Herriott multipass cell in order to provide the sensitivity required for a trace gas measurement. The accuracy has been tested against two standards containing ethane in mixing ratios of 39.79 ± 0.14 and 2.08 ± 0.02 ppb (high concentration standard and target gas, respectively). Water vapour corrections were applied within the instrument software to account for changes in humidity during the flight (Pitt et al., 2016). The instrument has a quoted precision of 50 ppt for an averaging time of 10 s.
2.3 Data selection
All flights took place in the daytime (between 08:00–17:00 local time). Flight data were filtered such that only observations contained within the boundaries of the defined regions (Fig. 1) and within the planetary boundary layer (PBL) were used in further analysis. Aircraft profiles at the beginning and end of each flight were used to determine the PBL depth. PBL profiles were generally conducted upwind of the area of interest and typically spanned an altitude range of 15–1500 m. Sharp decreases in the mole fractions of H2O and CH4 at a given altitude were used to indicate the PBL height, as a marker of transition to the free troposphere (typically < 500 m above sea level). Background concentrations of CH4, CO2 and C2H6 were determined using 1 Hz data during straight and level aircraft runs upwind of emission sources. Concentrations of pollutants were averaged over the whole run to give a value for each species per flight (Fig. A1). Canister samples were captured solely within the PBL on each flight. A minimum of one sample was taken upwind of the area of interest in order to assess background VOC concentrations. There were two types of flight modes implemented across this dataset; survey flights and plume-targeted flights. Since some data are likely to be biased high due to the oversampling of plumes, a comparison of the absolute VOC mixing ratios is not performed here; instead the analysis is focused on hydrocarbon ratios since these should be unaffected by repeated sampling of high values. The number of samples obtained in each sampling region are shown in Table A2.
3.1 VOC source attribution
3.1.1 Isomeric pentane ratio
Anthropogenic emission sources have distinctive VOC signatures, and therefore their mixing ratios with respect to each other can be used for source identification and characterization. Emissions from O&G operations can specifically be identified by examining the iso-pentane to n-pentane (iC5 nC5) enhancement ratio. This ratio is defined as the slope term obtained by the linear fit of their scatter plot (Gilman et al., 2013). These species are positional isomers meaning they have similar reactivity with respect to the hydroxyl radical (OH), which is the dominant sink of atmospheric alkanes (Atkinson, 1997), and consequently similar atmospheric lifetimes of around 65 h at [OH] and T=260 K (Hong et al., 2019). Branched alkanes are also preferentially oxidized by nitrate radicals (NO3); however, the nitrate is readily photolysed by sunlight meaning concentrations are heavily suppressed during the day. Since all flights in this work took place in the daytime and transport times were of the order of a few hours, oxidation due to nitrate is assumed to have a negligible affect on the observed pentane ratios. As a result the ratio is largely independent of photochemical processing. Both species are also similarly affected by air mass mixing and dilution; therefore the ratio remains relatively unchanged during atmospheric transport and can be approximated to represent the ratio at the source of emission (Gilman et al., 2013).
The iC5 nC5 ratios for each region were calculated from the slope of a linear fit using reduced major-axis regression (Ayers, 2001). This method is applied when the distinction between the dependent and independent variables is uncertain and deviations between fitted and observed data occur in both the x and y directions. Figure 2 shows the observed iCC5 ratios for each sampling region in the North Sea. Results of the Pearson's correlation indicated that there was a significant positive association for all regions (Norwegian sector: r(38) = 0.83, p<0.001; West Shetland: r(91) = 1.00, p<0.001; northern UK: r(147) = 0.95, p<0.001; southern UK: r(338) = 0.98, p<0.001). The iCC5 ratios observed were 1.12 for the Norwegian sector, 1.08 for West Shetland, 0.89 for the northern UK and 1.24 for the southern UK.
Numerous studies have been conducted characterizing the iCC5 emission ratio from both urban and O&G sources. A study by the United States Geological Survey (USGS) reported enhancement ratios for 14 different wells, finding that the isomers were present in approximately equal amounts with ratios ranging from 1–1.28 (Ruppert et al., 2014). Similarly Simpson et al. (2010) observed a ratio of 1.10 in Alberta over oil sands mining operations. Gilman et al. (2013) reported a ratio of 0.89 at the Boulder Atmospheric Observatory (BAO), concluding that measurements at BAO are strongly influenced by O&G emissions from the Denver–Julesburg Basin (Gilman et al., 2013). These studies show that the iCC5 emission ratio is a robust indicator of O&G emissions for onshore environments. Of more relevance to this work are studies characterizing emissions ratios from basins outside the US and in particular those offshore. Ryerson et al. (2011) reported a ratio of 0.82 for the fluid released from the Deepwater Horizon explosion in the Gulf of Mexico. Few studies exist studying O&G emissions in the North Sea; however, a study into the composition of natural gas condensate from a basin in the North Sea reported an iCC5 ratio of 0.84 (Riaz et al., 2011).
The enhancement ratios calculated here are consistent with ratios reported in the literature for O&G emissions and significantly lower than those reported for urban and vehicular emissions (Gentner et al., 2009). Additional sources of emissions such as biomass burning are not expected to influence VOC concentrations in this region; therefore the iCC5 ratio is a suitable tool for the differentiation of urban and O&G emissions. The iCC5 ratio for urban and vehicular emissions is distinctly different to the ratio from O&G emissions. Amounts of branched alkanes such as iso-pentane are increased during the refining process; therefore in processed products such as gasoline, iso-pentane is enhanced relative to n-pentane, resulting in a higher iCC5 ratio (McGaughey et al., 2004). The highest iCC5 ratio was observed for the southern gas-producing region of the North Sea, suggesting a larger relative contribution of urban emissions to VOC concentrations. Anthropogenic emissions from the UK or continental Europe are likely to influence VOC concentrations here, resulting in a higher ratio. Literature values for urban centres in the UK have been reported as 2.97 by von Schneidemesser et al. (2010) at Marylebone Road, a roadside monitoring site located in the centre of London, UK. This agrees well with the vehicular emissions ratio of 2.95 reported in Dublin, Ireland (Broderick and Marnane, 2002). The lowest ratio of 0.89, observed for the northern UK, is in the lower range of ratios observed for O&G emissions but is similar to the value reported for North Sea condensate, consistent with the fact that more than 50 % of reservoirs in this region produce condensate. In summary, these results strongly indicate that the primary source of VOC emissions in the North Sea is from O&G operations.
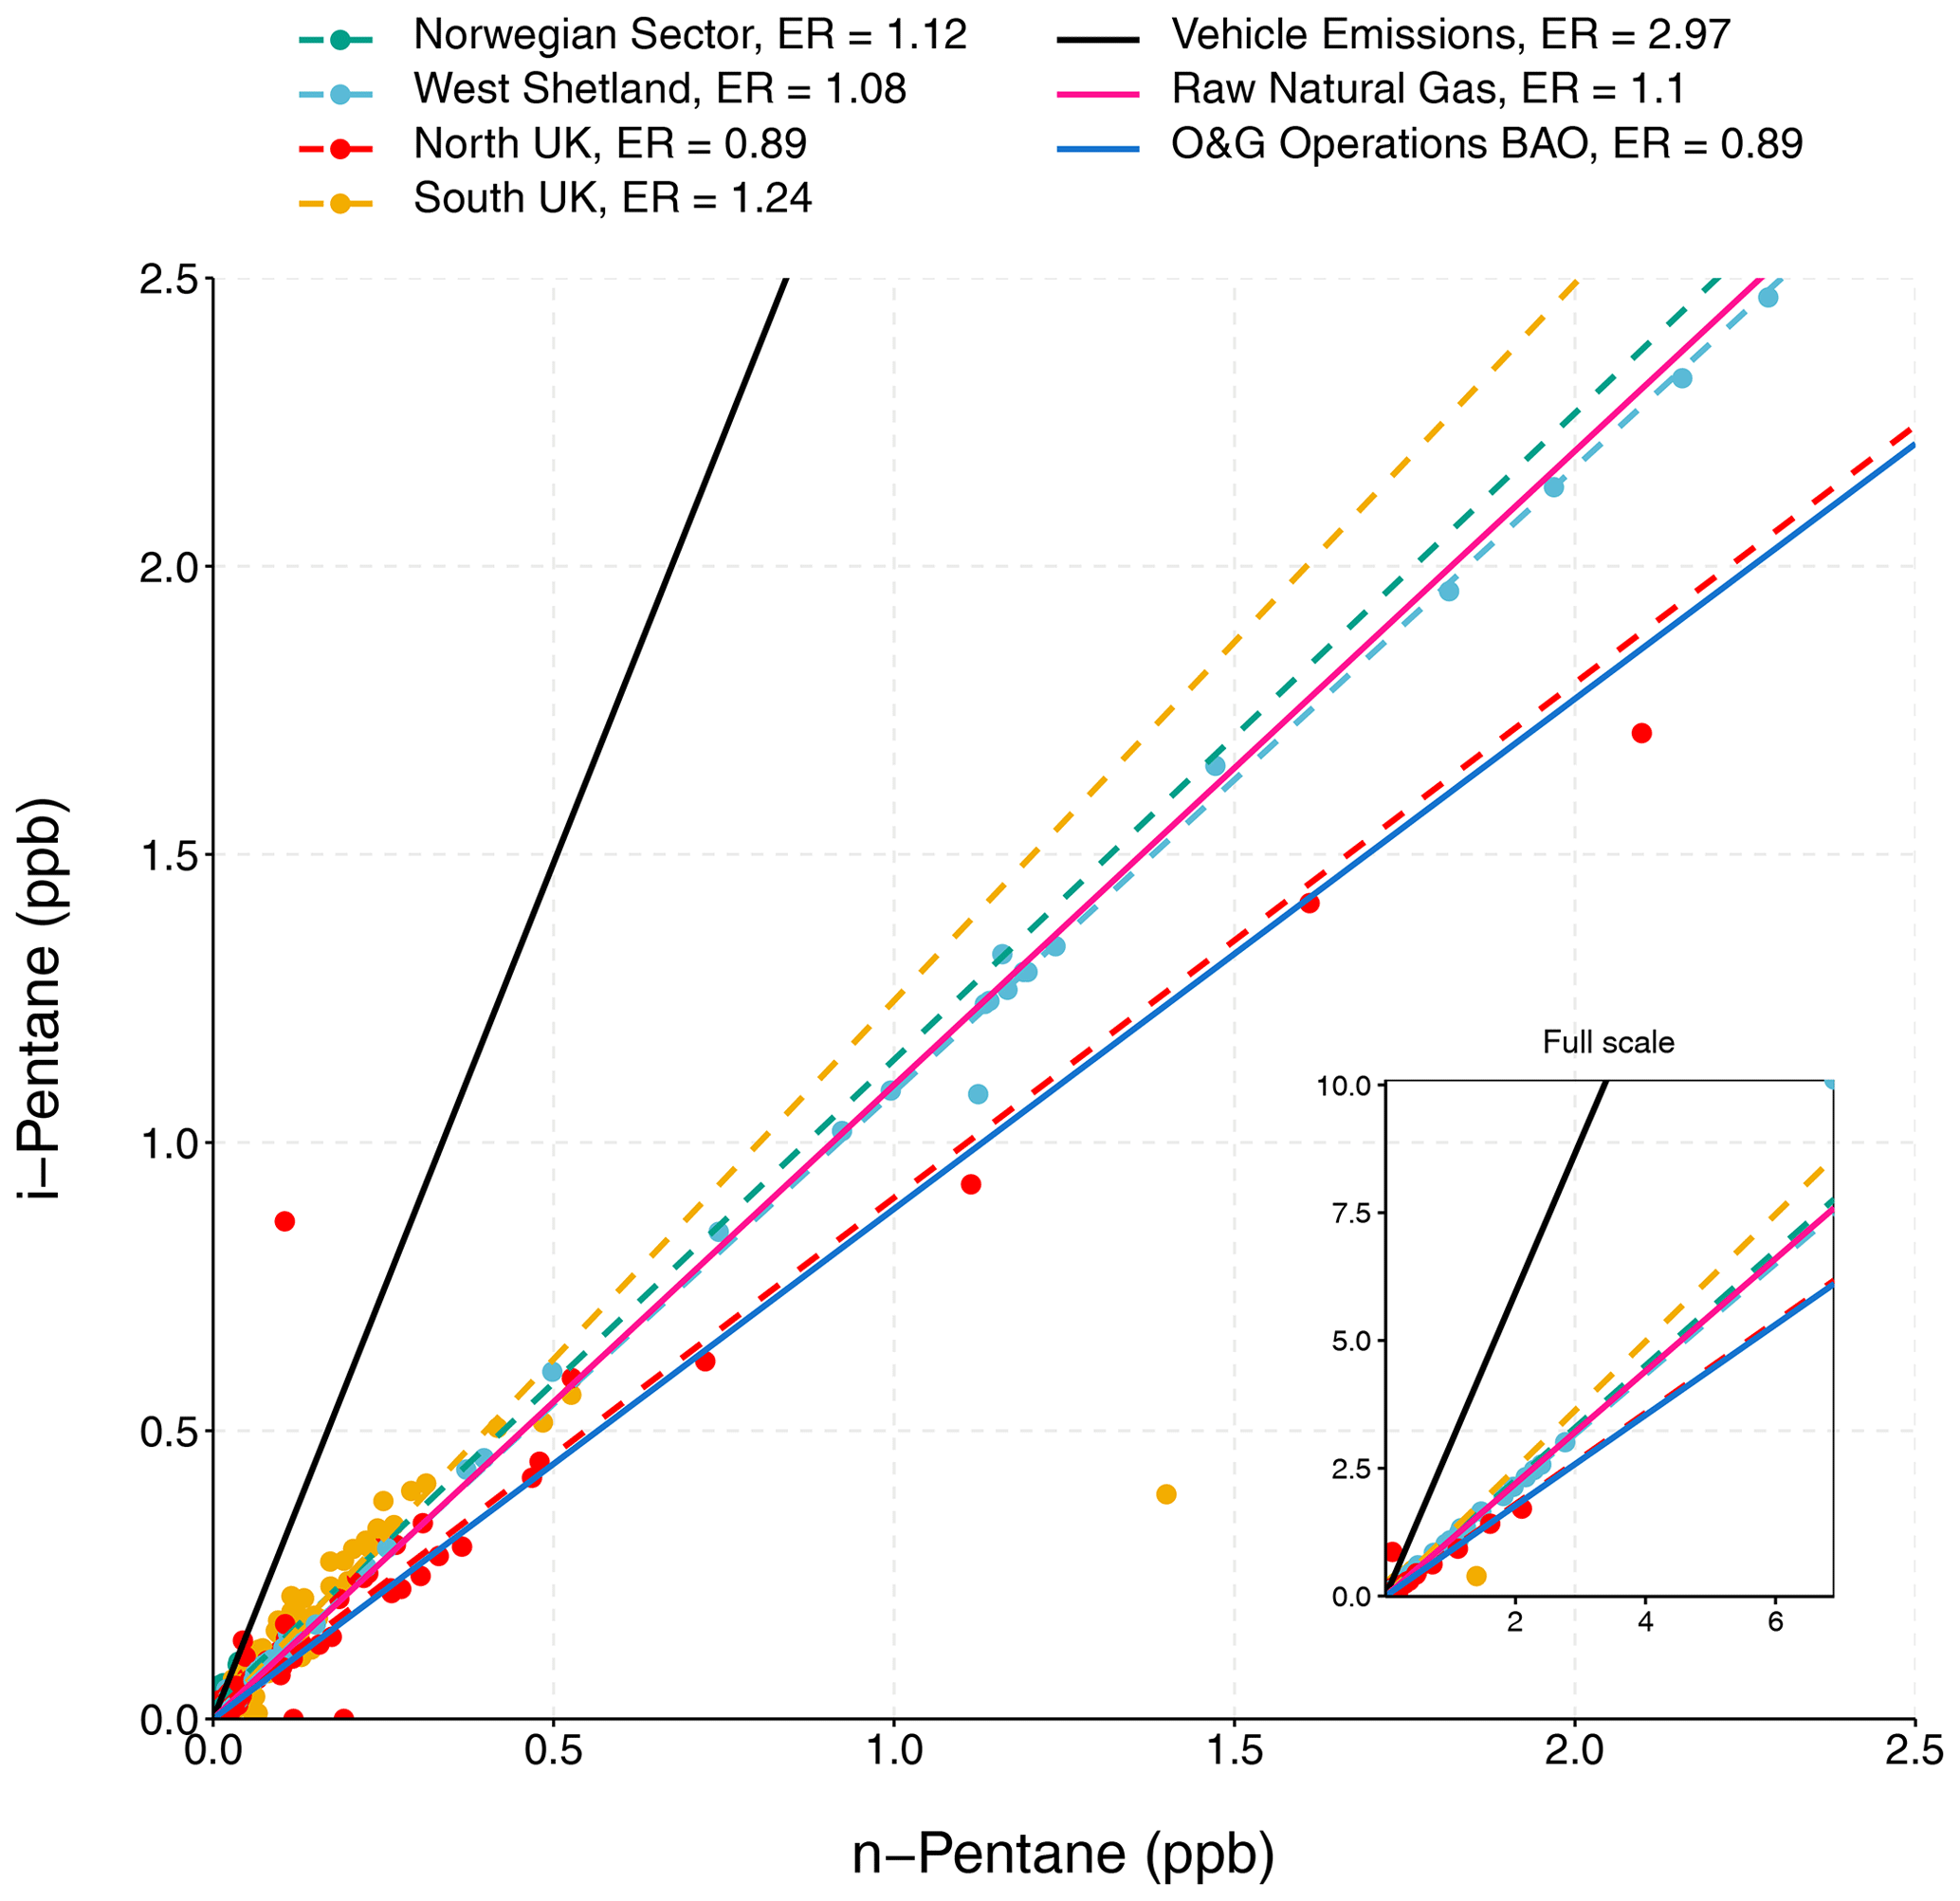
Figure 2Scatter plot of iso-pentane and n-pentane observations in each sampling region. Dashed lines indicate the linear fit for each region obtained by reduced major-axis regression. The solid black line indicates the ratio from vehicular emissions (von Schneidemesser et al., 2010), the solid pink line shows the ratio of raw natural gas in the North Sea obtained from the Department for Business, Energy and Industrial Strategy (BEIS), and the solid blue line indicates a typical ratio from O&G emission sources (Gilman et al., 2013). Inset shows the full range of observations.
3.1.2 Correlations with tracer compounds
In order to identify the specific sources of VOCs in the each region of the North Sea, emission ratios of VOCs with tracer compounds of particular sources were examined. Mixing ratios of propane are often elevated in regions of O&G production. Light alkanes are often co-emitted in such regions and since propane is a well known tracer for O&G operations, a strong correlation with propane indicates a common source (Ghosh, 2018). Acetylene is a common tracer for combustion emissions (Fortin et al., 2005) and is therefore used in this work to identify emissions from anthropogenic urban activity. Emission ratios were calculated from the slope of a linear fit using reduced major-axis regression for each region (Table 1). Species that were recorded below the limit of detection (LOD) of the GC-FID were classed as missing and hence those that were detected in less than half the samples from each region were excluded from the analysis. This only applied to samples obtained in the Norwegian sector, where in general mixing ratios of VOCs were significantly lower than other areas of the North Sea and thus similar to the LOD. Compounds affected from this sector included pent-1-ene, trans-2-pentene, 2,3-methylpentanes, isoprene, 2,2,4-TMP and octane.
Figure 3 shows the correlation of light alkanes with propane and acetylene, and the emission ratios for other species are shown in Table 1. Pearson correlation coefficients (r) and corresponding p values were also calculated for each compound. All C2-C5 alkanes (ethane, n-butane, iso-butane, n-pentane, iso-pentane) showed statistically significant correlations (p<0.001) with propane across all regions of the North Sea. These species were tightly correlated with propane () in the northern UK and West Shetland regions, suggesting they shared a common emission source. Furthermore, particularly weak correlations between C2–C5 alkanes and acetylene were observed in both the northern UK and West Shetland (r<0.53), supporting the conclusion that O&G activities were the dominant source of VOC emissions in these regions with little influence from other sources. Moderate correlations of light alkanes with propane () were observed in the Norwegian sector. However, by comparison, poor relationships with acetylene were observed, suggesting vehicular emissions did not play a major role.
Ethane was the only compound emitted in greater quantities than propane and hence emission ratios >1 were observed. Emission ratios with propane ranged from 1.18 in the northern UK to 3.31 in the Norwegian sector. Previous work reported enhancement ratios of 1.09 (Gilman et al., 2013) and 1.00 (Swarthout et al., 2013) at BAO downwind of onshore natural gas sources. Whilst a comparable ratio was observed in the northern UK, all other regions were found to exhibit ratios 2–3 times higher. Derwent et al. (2017) reported an ethane to propane ratio of 2.4 from natural gas leakage at Marylebone Road, London, suggesting that the high ratios observed in this work could be as a result of fugitive emissions of raw natural gas.
The weakest correlations between the light alkanes and propane were observed in the southern UK (). However, these species showed comparatively weaker correlations with acetylene (), indicating O&G activities were also a key driver of VOC concentrations in this region. This was the only region which had strong propane correlations with combustion tracers such as alkenes (ethene and 1,3-butadiene), C6+ alkanes (hexane and heptane) and aromatic species (toluene) (), suggesting a more complex mix of emission sources. These compounds were also well correlated with acetylene (r>0.78), indicating an urban emission source. Marine traffic is also a likely source of some emissions in this region due to its proximity to the UK shipping lanes, in particular the Strait of Dover, one of the busiest shipping routes in the world (European Environment Agency, 2013). A study of marine shipping emissions in China showed that alkanes and aromatics dominated the total identified VOCs from ship auxiliary engine exhausts, particularly alkanes with a carbon number greater than 7 (Xiao et al., 2018). Therefore, the stronger correlations of hexane, heptane and toluene with propane in the southern UK compared to other areas of the North Sea likely arise due to the influence of shipping on VOC measurements in this region.
Despite evidence of additional emission sources in the southern UK, the relative abundance of NMHCs revealed source profiles characteristic of those expected from regions of O&G production (Fig. A2). On a fractional basis, C2–C5 alkanes accounted for more than 83 % of the total measured VOC concentration (µg m−3) in all regions. This is comparable to measurements made in an onshore region of O&G production in north-eastern Colorado by Thompson et al. (2014), where saturated alkanes contributed 90 % at the gas field itself, 84 % on the periphery of a drilling area and significantly less in an urban area of Denver (64 %). Unsaturated and aromatic species typically account for a greater fraction of total VOC concentrations in urban areas. For example, Dominutti et al. (2016) show that aromatic species contributed close to 50 % of the total concentration at an urban site in São Paulo, which is also consistent with measurements made in Shanghai by Liu et al. (2019). In contrast, aromatic and unsaturated species accounted for less than 25 % of the total measured VOC in all regions of the North Sea, providing further evidence that emissions were driven by O&G activities.

Figure 3Correlation of light alkanes with (a) propane and (b) acetylene in each sampling region. The solid lines represent the linear fit using reduced major-axis regression. Note the log scale used on both axis.
3.1.3 Benzene–toluene ratio
The influence of urban emissions was further studied by utilizing the benzene toluene (B T) emission ratio. Toluene is often co-emitted with benzene and the ratio of the two compounds is dependent on the source of emissions. Both are present in primary vehicle exhaust emissions (Jobson et al., 2005) and from O&G sources as well as solvents, industry emissions and some natural emissions (Halliday et al., 2016; Thompson et al., 2014). Toluene has a shorter atmospheric lifetime with respect to OH; therefore the B T ratio can be used to estimate the photochemical age of an air mass (Warneke et al., 2001). The B T ratio can also be used to evaluate the emission sources of measured VOCs, and in particular to distinguish traffic emissions from O&G emissions as in Halliday et al. (2016), where ratios in the range of 0.41–0.83 indicate emissions originating from vehicles (Langford et al., 2009).
Figure 4a shows the relationship between benzene and toluene for each region. As before, emission ratios were calculated using reduced major-axis regression. Significant positive correlations (p<0.001) were observed for all regions. Strong correlations were observed in the northern UK, Norwegian sector and West Shetland with Pearson correlation coefficients of r(163) = 0.95, r(37) = 0.94 and r(92) = 0.94 respectively, implying these compounds have a common source. The observed B T emission ratio was 1.29 for the northern UK, 1.24 for the Norwegian sector and 1.20 for West Shetland (Table A3), suggesting vehicle emissions were not the dominant source of these compounds since these values are higher than the typical observed range (Langford et al., 2009). These values are consistent with findings from other O&G studies, which reported B T ratios of around 1 from regions of O&G production (Swarthout et al., 2013; Field et al., 2015). A much weaker albeit significant correlation between benzene and toluene was observed in the southern UK (r(357) = 0.56, p<0.001). It is evident from Fig. 4a that there are two distinct segments of data with unique correlations between the two species: the first with considerably lower B T ratios than observed in other regions of the North Sea, the second being characterized by enhancements in benzene mixing ratios and very small amounts of toluene.
Figure 4b shows the regression plot of benzene versus toluene for the southern UK coloured by wind direction sector. Data with a B T ratio between 0.41–0.83 (traffic emissions) are plotted with a diamond, accounting for 3.5 % of the observations in the southern region. A strong positive correlation was found to exist (r(14) = 0.92, p<0.001) for the traffic source, and the slope obtained from the linear fit was 0.60, in the centre of the range expected for vehicle emissions (Langford et al., 2009). The traffic source was primarily observed when the wind direction was from the south or south-west, suggestive of air transported from the UK or from continental Europe polluted by urban vehicular emissions. A similar traffic source is also visible in the northern UK data, similarly exclusively observed under southerly wind conditions. Air transported from the UK mainland or Europe is expected to reach the location of the aircraft flight tracks in less than a day. The estimated lifetimes for benzene and toluene are 2 weeks and 2 d respectively (Williams and Koppmann, 2007), meaning emissions of benzene and toluene from urban areas are expected to remain well correlated on this relatively short spatial scale since they are also similarly affected by dilution and mixing.
There is a section of highly correlated data (r(214) = 0.81, p<0.001) characterized by B T ratios > 4 (squares, Fig. 4b). High B T ratios can be indicative of aged emissions due to the high proportion of benzene relative to toluene. However, given that the benzene mixing ratios observed were among the largest for all the regions studied, this is more suggestive of an additional benzene source from the offshore platforms. Other compounds related to fossil fuel combustion and evaporation such as ethene and pent-1-ene were also enhanced in these samples, providing evidence of an additional combustion source enriched in benzene. There are a host of potential sources on drilling rigs including gas turbines, which are widely used for power generation and compressors, both of which have previously been linked to elevated benzene concentrations (Rich et al., 2014; Rich and Orimoloye, 2016). The remaining fraction of data (33 %) was attributed to O&G emissions and is plotted with a triangle in Fig. 4b. These data were tightly correlated (r(125) = 0.86, p<0.001) with an emission ratio of 1.12, in agreement with the range quoted by Swarthout et al. (2013) from a wind direction dominated by natural gas emissions.
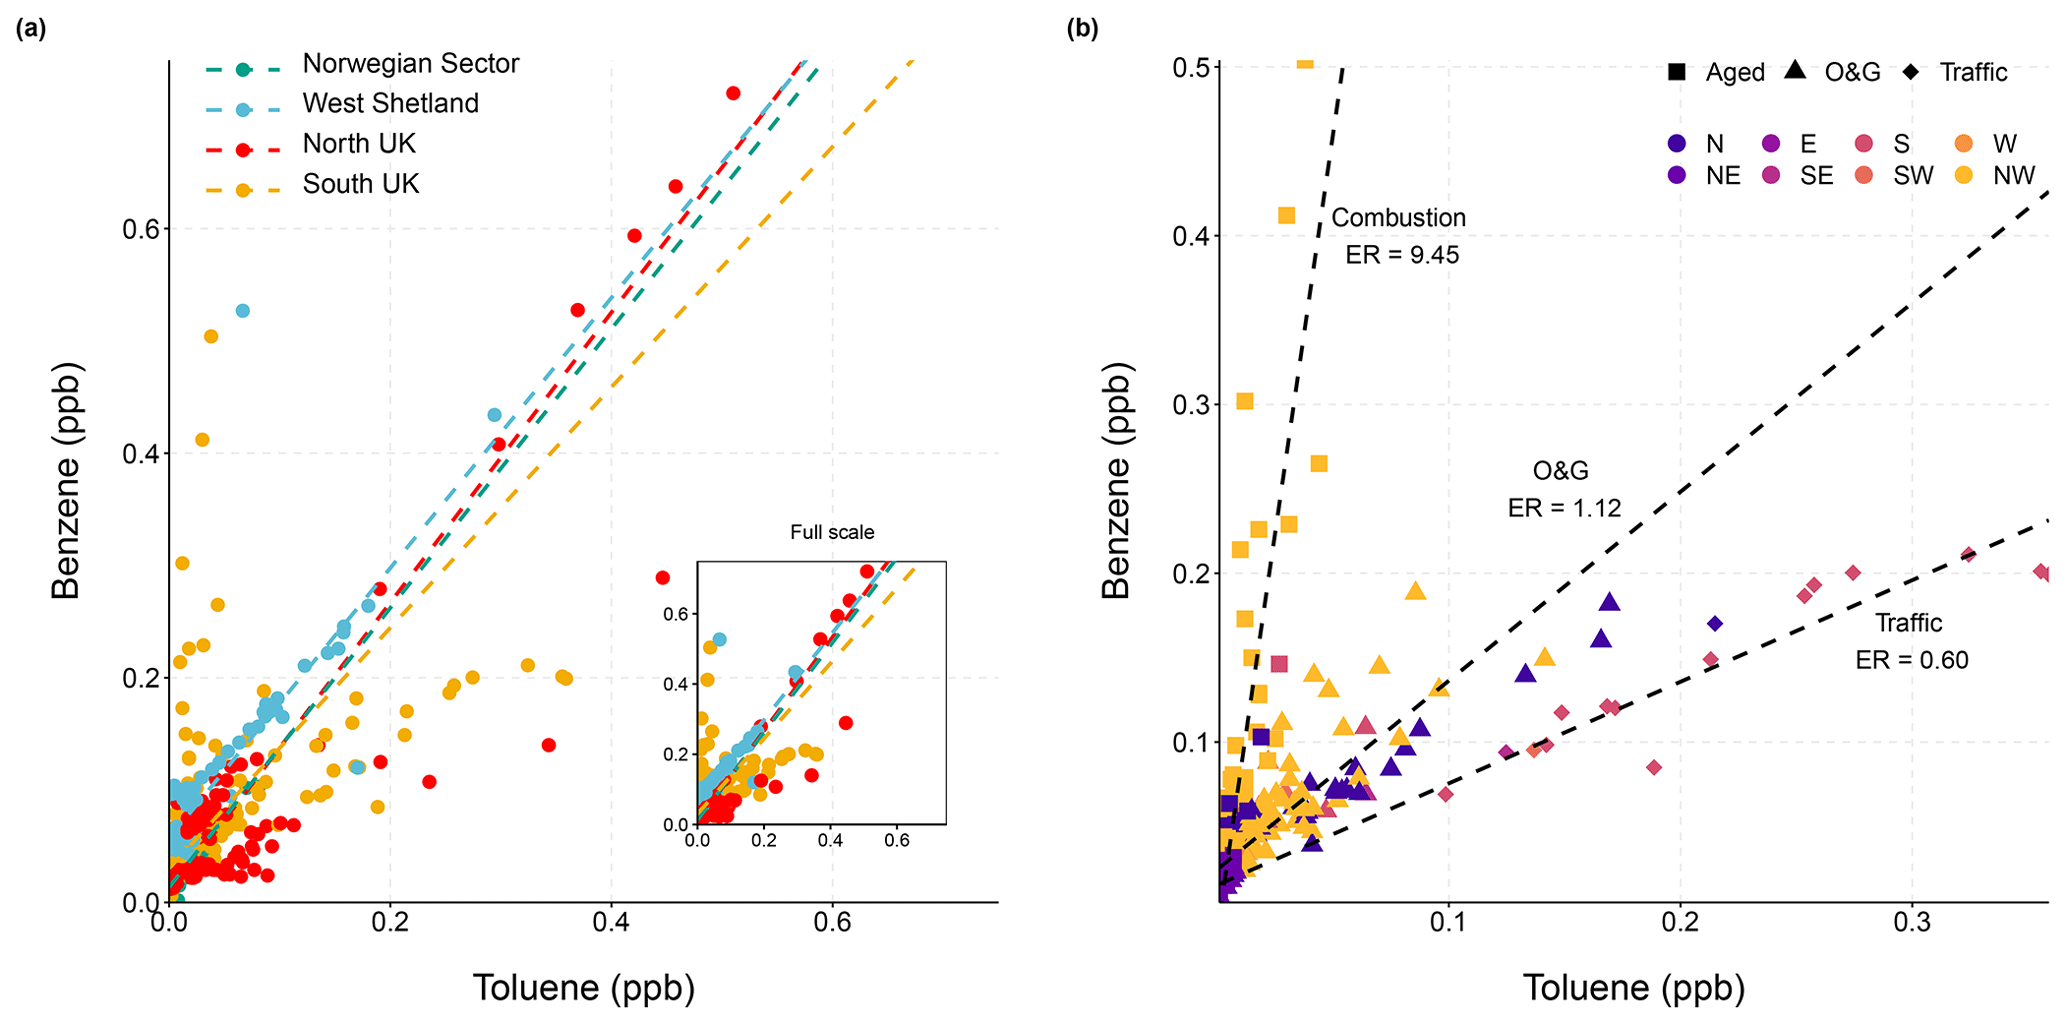
Figure 4(a) Scatter plot of benzene versus toluene for all sampling regions. Inset shows the full scale of observations. (b) The southern UK only, where the colour represents the average wind sector during the time the sample was taken and the shape represents identified emission sources. In both figures the dashed lines indicate the linear fit obtained by reduced major-axis regression.
3.2 Emission profiles of VOCs from offshore fields
Our results depict that O&G production is the dominant source of emissions in the North Sea. There are over 1000 individual offshore fields beneath the North Sea, each listed as a specific field type (Fig. 1b). To further investigate the spatial differences in emissions and to derive the VOC emission profiles from each classification of offshore field, each 1 Hz observation and each VOC measurement was spatially joined to a specific offshore field and hence field type. For each flight, the regional background of CH4, CO2 and C2H6 was calculated as an average of concentrations on straight and level aircraft runs upwind of any emission sources. Additionally, background VOC concentrations were calculated as the average of the lowest 1st percentile of measurement data for each flight. Whole air samples identified as being dominated by traffic emissions using the B T ratio (0.41 < B T < 0.83) were removed prior to this analysis in order to more robustly compare the emissions from one field type to another.
3.2.1 CH4 source identification
The molar enhancement ratio of C2H6 to CH4 is commonly used for CH4 source identification since C2H6 is emitted almost exclusively from fossil carbon sources, whereas CH4 has a mix of sources. The 1 Hz measurements of CH4 and C2H6 were used to characterize the CH4 sources in the North Sea. In this environment, a positive correlation implies that the CH4 originates primarily from O&G sources, whereas a weak correlation to no correlation suggests biogenic or industrial sources of CH4 (Ghosh, 2018). These other sources include landfills, water treatment and cattle and are only associated with very low levels of C2H6, typically < 0.2 % (Yacovitch et al., 2014). CH4 from O&G sources is often co-emitted with tracers such as C2H6, resulting in considerably higher ratios ranging from 0.01–0.30 (Yacovitch et al., 2014).
The enhancement ratio (ΔC2H6 (ppb) ΔCH4 (ppb)) for each field type was obtained by first subtracting the average background estimates for each species during each flight from the observed enhancements over the North Sea. Any enhancement of CH4 due to an anthropogenic combustion source was removed by utilizing the ΔCH4 ΔCO2 enhancement ratio, which is the slope of the linear regression fit of enhanced mixing ratios of CH4 and CO2 (Nara et al., 2014). The predominant wind direction in the UK is from the south-west, meaning that our measurements likely represent emissions from both offshore platforms and onshore coastal sources. Observations at remote offshore sites show that air masses dominated by anthropogenic-combustion-related emissions typically have ΔCH4 ΔCO2 ratios of less than 20 ppb ppm−1 (Conway and Steele, 1989). Consequently this filter was applied to our data to remove the influence of anthropogenic emissions. Data with enhancement ratios above 20 ppb ppm−1 were assumed to be a mix of flaring and fugitive emissions and were therefore used in further analysis to compare the signatures of individual field types (Fig. A3).
The ΔC2H6 ΔCH4 enhancement ratios were calculated using reduced major-axis regression and the correlations were evaluated through the calculation of the Pearson's correlation coefficient. Figure 5 shows the scatter plot of C2H6 and CH4 enhancements. Strong, positive correlations for field types of condensate, gas and oil were observed (r(878) = 0.98, r(1433) = 0.93 and r(3385) = 0.81) respectively, with p<0.001 in all cases), suggesting O&G emissions were the dominant source of CH4. Mixed fields showed a weak but statistically significant correlation (r(1256) = 0.28, p<0.001) along with notably smaller CH4 enhancements compared to the other field types. CH4 enhancements were observed with a wide range of C2H6 enhancements, with ratios ranging from 0.03–0.18. Gas fields had the lowest enhancement ratio of 0.03, indicating dry-gas emissions dominated by CH4 (Yacovitch et al., 2014). The highest emission ratio of 0.18 was observed for oil fields. Emission ratios > 0.06 have previously been observed from wet gas wells and are associated with gas containing a larger fraction of NMHCs (Yacovitch et al., 2014). Significant variability (smallest r) in the scatter of the data from oil fields was noted compared to other field types. Noticeably, oil fields in the West Shetland region had a higher C2H6 content (31 %) than those in the northern UK region (13 %). This could be related to the difference in the transportation methods of the extracted oil in these two regions. In the northern UK, pipelines are typically used to carry oil to shore, whereas West Shetland largely relies on shuttle tankers for oil export. VOC emissions associated with tanker loading can occur when oil is transferred from floating production storage and offloading (FPSO) vessels into shuttle tankers. During loading, light hydrocarbons dissolved in the crude oil vaporize from the liquid and accumulate in the vapour space of the tank. This increases the pressure inside the tank, and therefore vapours are vented to the atmosphere (Climate and Clean Air Coalition, 2017). Additionally, high enhancement ratios > 0.85 have previously been attributed to condensate tank flash emissions (Goetz et al., 2015); therefore the increased enhancements of C2H6 observed here possibly arise due to venting of light hydrocarbons during loading. The range of emission ratios observed across the North Sea suggests that there is a significant spatial variability in the composition of natural gas and highlights the heterogeneity of emissions across the O&G sector.
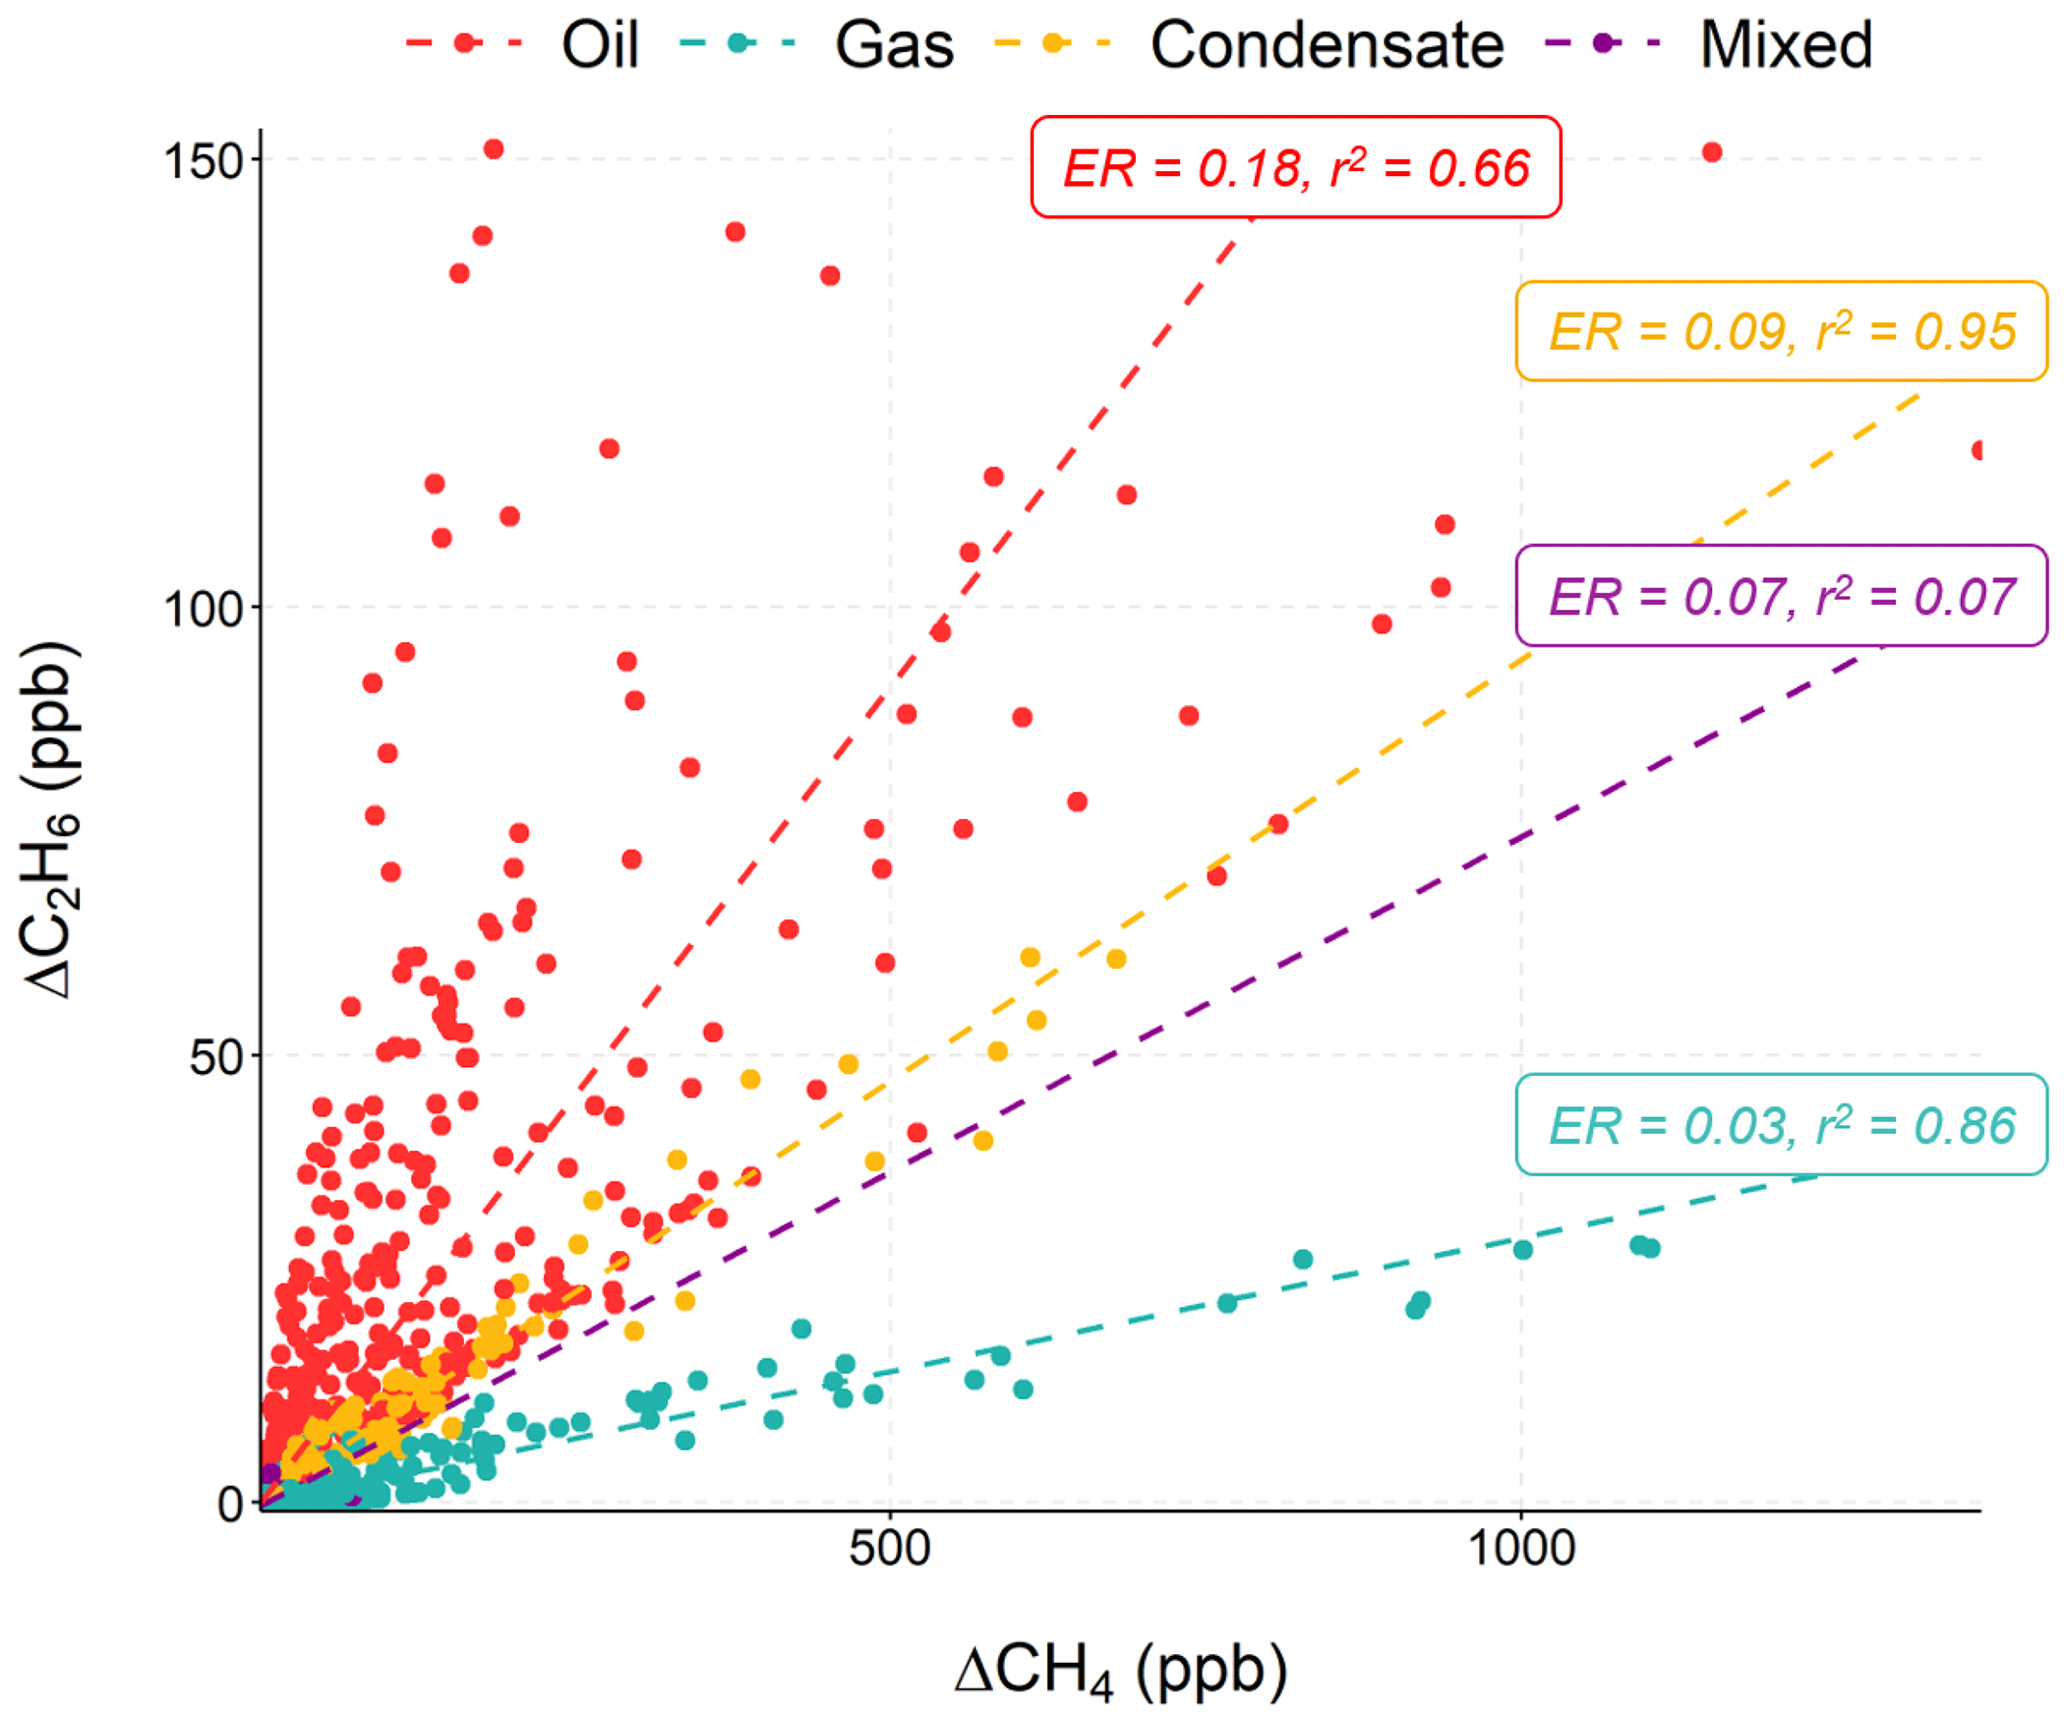
Figure 5Scatter plot of ΔC2H6 vs. ΔCH4 for each offshore field type. Observations were filtered to those with a ΔCH4 ΔCO2 ratio greater than 20 ppb ppm−1 as these were considered to be uninfluenced by anthropogenic urban emission sources. Dashed lines indicate the linear fit obtained from reduced major-axis regression.
3.2.2 VOC composition
The whole air samples obtained during our measurements showed significant variations in VOC concentrations. Total hydrocarbon concentrations in a single sample ranged from 1.73 to 155 µg m−3, reflecting the difference between a sample in clean background air and a sample captured within a plume. To broadly compare the different offshore field types, VOCs were grouped into categories: light alkanes (C2–C5), heavy alkanes (C6+), unsaturated and aromatic. Mixing ratios were first converted to concentrations (µg m−3) in order to investigate which species contributed most to the total mass measured. Figure 6a shows the contribution of the VOC categories to total VOC concentrations for each field type. Among all the species quantified, C2–C5 alkanes (ethane, propane, n-butane, iso-butane, n-pentane and iso-pentane) were the most abundant group for all field types, accounting for, on average, 70.2 % of the total measured mass. The largest contribution was for oil fields and the contributions of light alkanes in individual samples ranged from 14.0 % to 98.4 %, where ethane and propane were the dominant species. This is somewhat expected since elevated concentrations of short-chain alkanes are characteristic of emissions from the O&G sector (Gilman et al., 2013). The contributions of heavy alkanes (hexane, heptane, octane, 2,3-methyl-pentanes, 224-trimethylpentane) were small for all field types (< 8 %), suggesting O&G production was not a key source of these compounds. Aromatic and unsaturated species made similar average contributions to total VOC concentrations of 12.4 % and 12.2 % respectively. The aromatic contribution for condensate fields was twice as high as any other field type (20.7 %). Closer inspection revealed that this was driven by particularly high aromatic contributions observed from the Erskine field, located in the northern UK region of the North Sea. The variation in individual samples from this field were small compared to the field-to-field variability, suggesting the difference in emissions is largely due to different practices and equipment on individual platforms, a point also raised by Warneke et al. (2014) for onshore well pads. Contributions from unsaturated species ranged from 7.3 % to 15.1 %. Ethene and acetylene (ethyne) were the dominant species within this group, which is suggestive of more general industrial point sources, possibly combustion generators (Washenfelder et al., 2020).
3.2.3 OH reactivity
Oxidation of VOCs by the hydroxyl radical (OH) to form peroxy radicals is the rate-determining step in the formation of tropospheric ozone. The potential of a VOC to form ozone can be estimated by using the OH reactivity as a simple metric to identify the key species that most readily form peroxy radicals (Darnall et al., 1976). The OH reactivity (ROH−X) for VOCs measured in the North Sea was calculated as the product of the rate constant for the reaction of VOC “X” with OH (kOH+X) and the VOC mixing ratio (X, molecule cm−3) using Eq. (1) and a method outlined in Abeleira et al. (2017). Rate constants were obtained from Atkinson and Aschmann (1984) and Atkinson and Arey (2003).
Figure 6b shows the contribution of each VOC class, along with CH4, to total OH reactivity for each offshore field type. Unsaturated compounds made the highest contribution to OH reactivity for all field types, contributing on average 55.5 %, despite a low contribution of 12.2 % to total VOC concentrations. Of all the compounds in this group, 1,3-butadiene made the largest contribution to OH reactivity since it is highly reactive towards OH, making it important for ozone production despite being present in low concentrations. Light alkanes were the second most important contributor to OH reactivity for all field types. Despite being the most abundant group of compounds, contributions to OH reactivity were approximately half that of unsaturated species, with an average contribution of 31.8 %. Contributions of these species became increasingly important in the order: gas < oil < condensate, indicating the prevalence of these compounds in emissions from oil extraction. Previous studies conducted onshore have identified alkanes to be the largest contributors to OH reactivity in regions of O&G production, with alkenes and biogenics as minor contributors due to their relatively low abundance (Gilman et al., 2013). However, Fig. 6b indicates that in the more remote offshore environment, where there are significantly fewer emission sources and VOC concentrations are generally lower, OH reactivity is dominated by fast-reacting species with OH. These are likely emitted as a result of the more general combustion sources that exist on O&G platforms. By comparison, the contribution of CH4 to total OH reactivity was minor for all field types, despite being the primary component of natural gas, exposing the importance of non-methane VOCs (NMVOCs) in regard to O3 formation. The greatest CH4 contribution was observed for gas fields (2.87 %), owing to the characteristics of dry-gas emissions, which are predominantly CH4. Due to their slower reaction rates, alkanes such as CH4 and ethane are likely to contribute to O3 formation on larger spatial scales, rather than in the local environment. This is potentially more significant in regions of oil or condensate production where alkanes made a heavier contribution to total OH reactivity.

Figure 6Percentage contribution of different VOC categories to (a) total VOC concentrations by mass and (b) total VOC–OH reactivity measured for each field type. The contribution of CH4 is shown only for OH reactivity to demonstrate the relative importance of the other VOCs in terms of O3 formation.
3.2.4 Excess mole fraction
In order to compare the emission profile of VOCs measured for each field type and to provide some general quantification of emissions, the relative abundance of VOCs to CH4 was calculated. The “excess mole fraction” (EMF) is defined as the relative abundance of NMHCs to the sum of CH4 and non-CH4 mixing ratios (Bourtsoukidis et al., 2019). The background NMHC mixing ratios (NMHCBG) were defined as the lowest 1 % of samples during each flight within each sampling region in the PBL and were subtracted from the total mixing ratios. Only compounds that were quantified on all flights were included in this analysis in order to keep the number of compounds making up the total NMHC concentration consistent. This resulted in the exclusion of isoprene, pent-1-ene, trans-2-pentene and 2,2,4-TMP. The excess mole fraction was calculated for each field type using Eq. (2).
Figure 7a shows the mean EMF calculated for each field type. Oil fields had the highest EMF of 28.3 %. This indicates that the VOC mixture emitted by oil fields consists of heavier compounds compared to gas or condensate fields. Gas fields had a much smaller amount of VOCs relative to CH4 compared to oil or condensate fields, with an average EMF of 12.6 %, representing the fact that natural gas is 70 %–90 % CH4. This is consistent with a study in the Uintah Basin by Warneke et al. (2014) who found that oil wells had a higher VOC to CH4 ratio than gas wells due to the heavier composition of hydrocarbons extracted by oil pads compared to gas. This is also consistent with Fig. 6, where oil fields had the highest percentage contribution (82 %) of C2–C5 alkanes to total VOC concentrations. Similarly Bourtsoukidis et al. (2019) assigned high EMFs in the Arabian Peninsula to air originating from the oil fields and refineries of Iran and low EMFs to the gas fields of Turkmenistan. The EMF for condensate fields sits in the middle of those for O&G fields, with a mean value of 16.4 %. This is somewhat expected since gas condensate is a mixture of low-boiling hydrocarbon liquids and is predominantly made up of pentane isomers with relatively small amounts of CH4 or ethane (Speight, 2019). Mixed fields had the lowest mean EMF of 12.3 % but the highest standard error of 2.55 %. Fields listed as mixed are solely located in the Norwegian sector, where the term defines reservoirs where more than one fossil fuel product is extracted over the field's lifetime. The EMFs for individual fields in this region ranged from 2.5 % to 33 % (Fig. A4) reflecting the individual characteristics of each reservoir and the differences in the types of production across this region.
The EMF can be related to water depth as displayed by Fig. 7b, which shows the relative density distributions (smoothed histogram) of water depths for platforms in the North Sea. Generally the EMF increases with increasing water depth. Gas extraction principally occurs in water depths less than 100 m, which results in low EMFs and emissions dominated by CH4. North Sea condensate is typically extracted in water depths between 50 and 200 m, resulting in an increase in emissions of light alkanes relative to CH4. Oil production is more greatly associated with deepwater extraction. The greatest water depths were in the West Shetland region, with extraction taking place in water deeper than 400 m. Subsequently, when broken down by study region as well as field type, the highest EMF of 38.1 % was also observed for West Shetland, showing that deepwater extraction results in emissions richer in higher molecular weight hydrocarbons relative to CH4. Deepwater extraction is increasing worldwide (EIA, 2016b) and whilst one study found that deepwater facilities had moderate emission rates compared to shallow water sites (Yacovitch et al., 2020), the difference in the composition of emissions could be significant in terms of O3 production, since longer-chain alkanes have shorter lifetimes with respect to OH than CH4. This work shows that the EMF can be a useful tool in separating emissions from oil, gas or condensate exploitation and supports the conclusion that wet natural gas contains a more complex mix of NMHCs than dry natural gas.
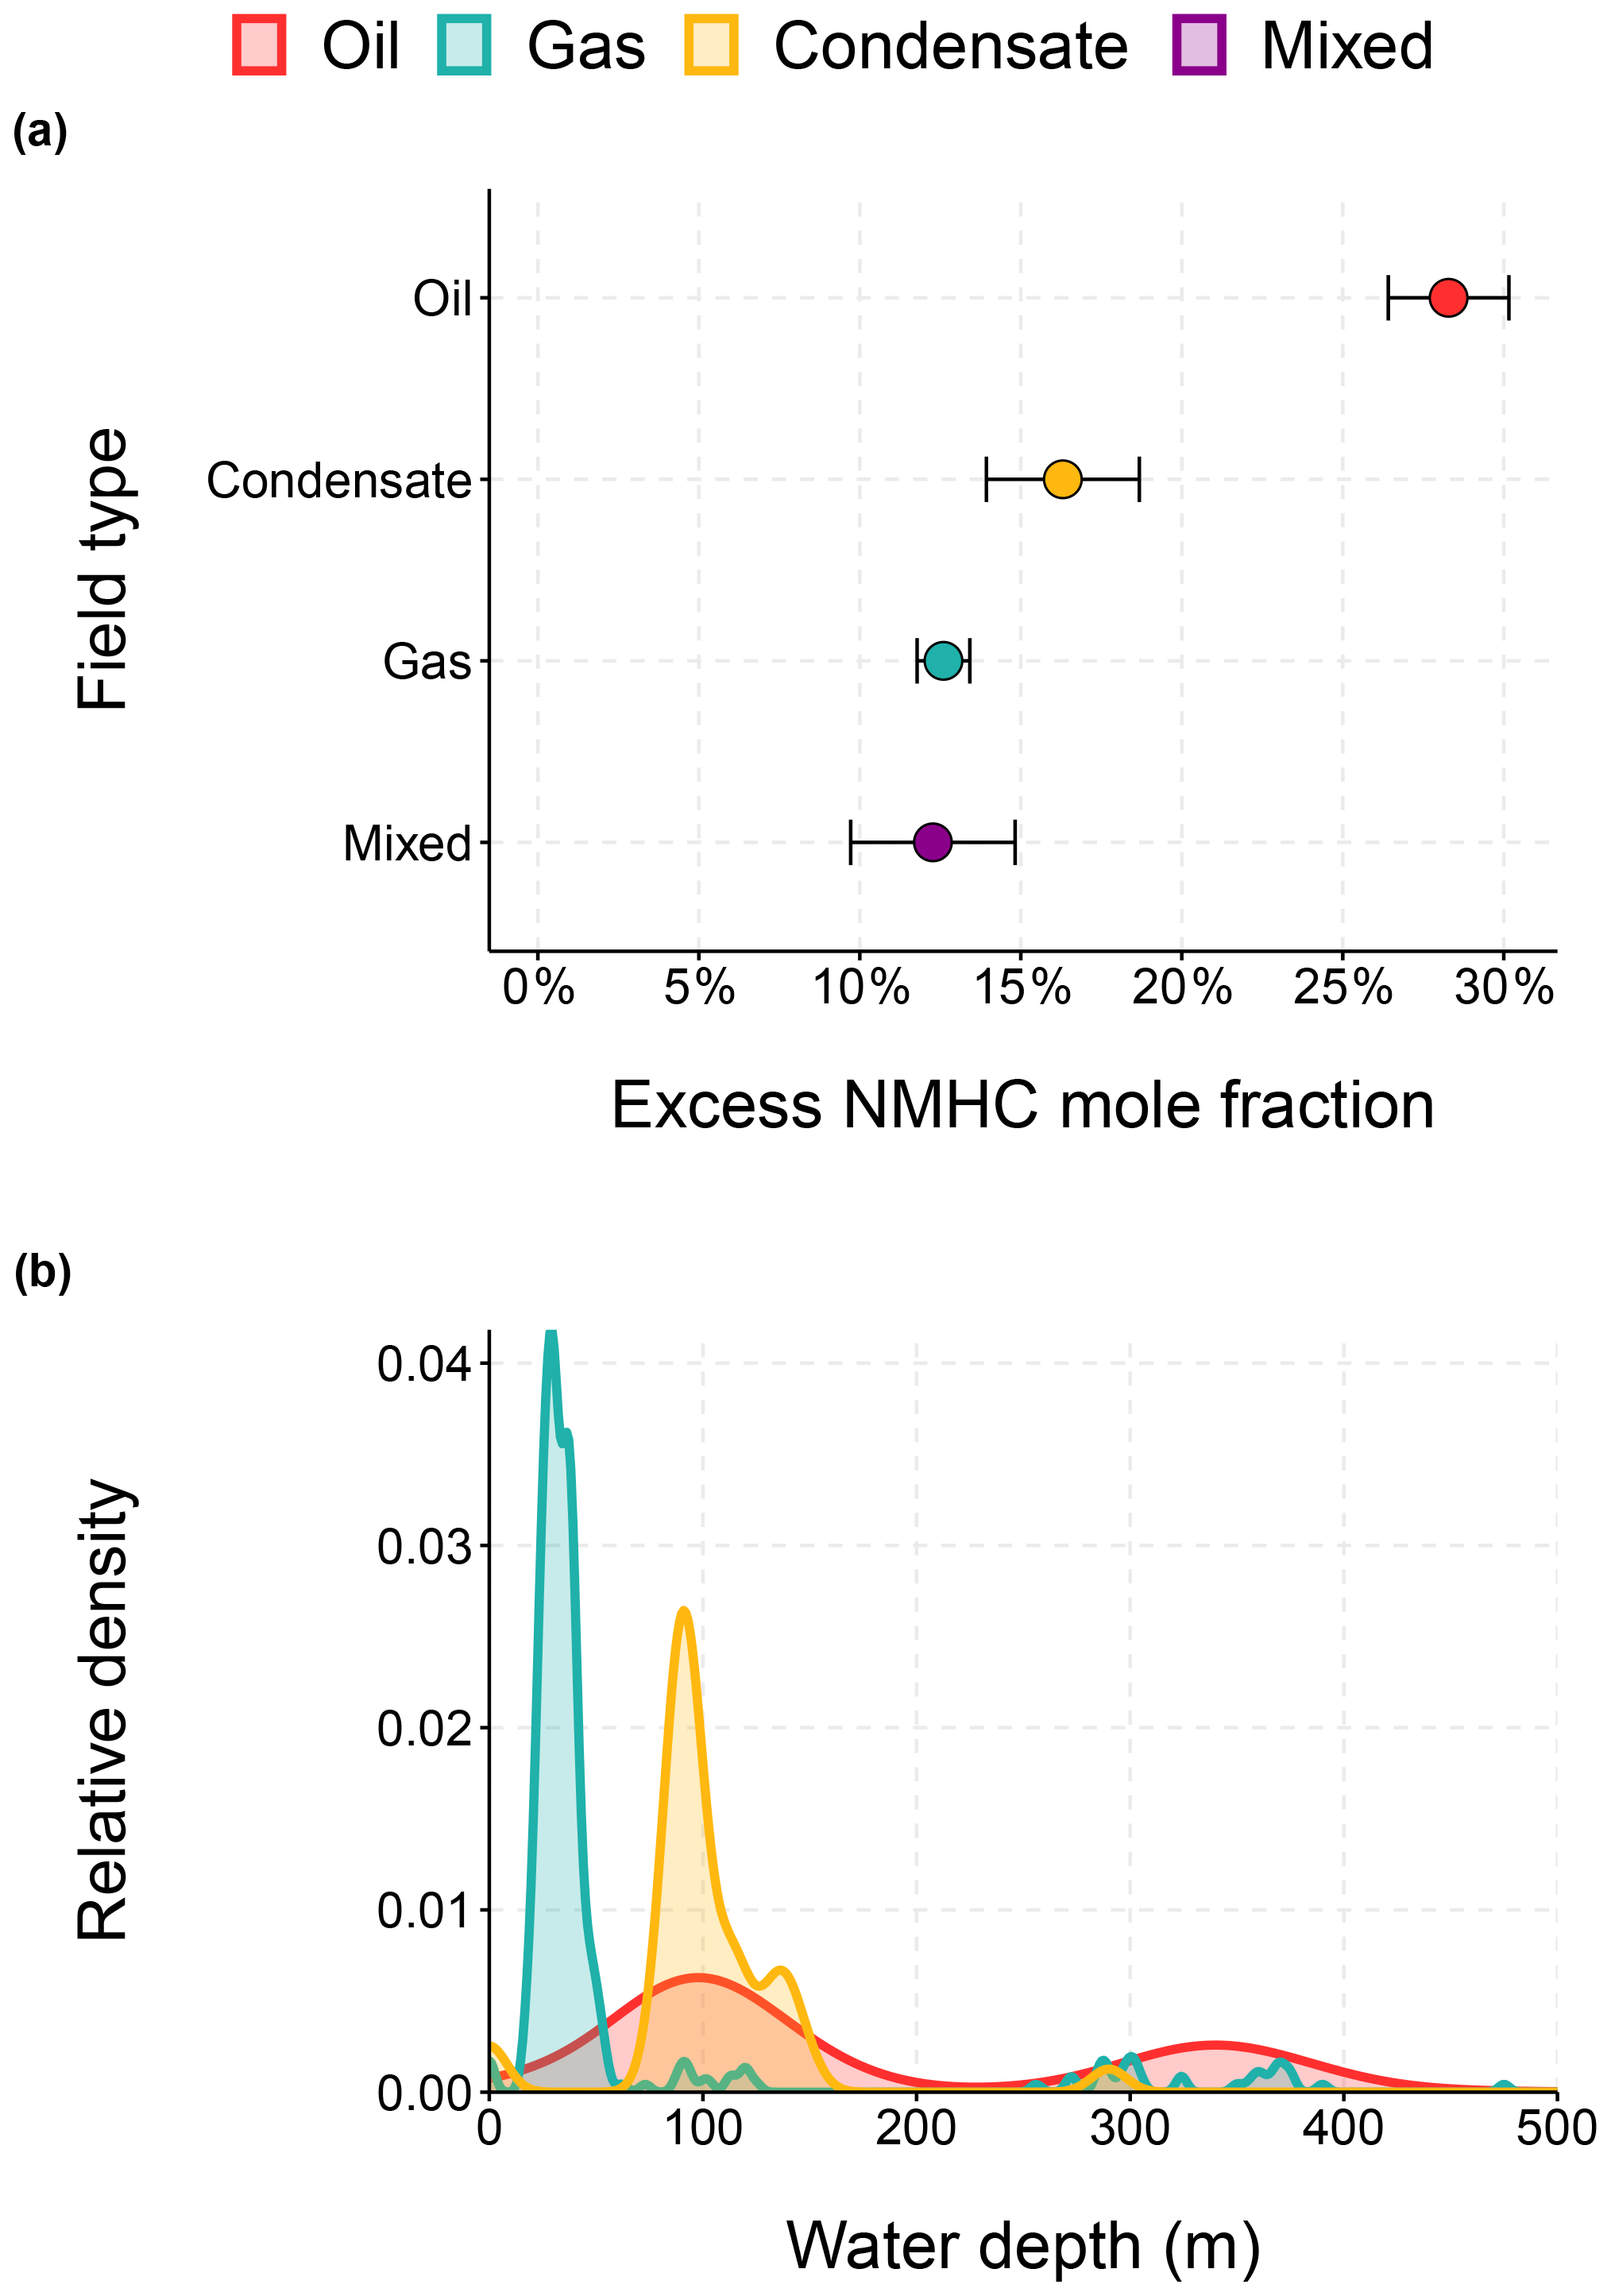
Figure 7(a) Mean excess mole fraction for each offshore field type. Error bars represent 1 standard error. (b) Smoothed density distribution of water depth obtained for each offshore field in the North Sea, coloured by field type. A depth of 305 m (1000 ft) defines deepwater.
3.3 Comparison of VOC speciation to emission inventories
The UK NAEI is the primary source of inventory information for the UK. The inventory provides pollutant-specific gridded emissions at a 1 km × 1 km resolution. Emissions are split into source sectors such as road transport, waste, agriculture and offshore. Point source emissions are also included, such as individual offshore platforms or power plants. VOCs are generally represented in the form of total NMVOCs, with the exception of carcinogenic compounds benzene and 1,3-butadiene, which are quantified in the point source inventory. In order to extract specific VOC emissions estimates, the total NMVOC estimate can be combined with source profiles from Passant (2002). This includes a series of NMVOC species profiles which describe the VOC composition from each source, given as a percentage contribution to total NMVOC emissions. The speciation profiles include over 600 different compounds from around 250 different sources. For each year in the NAEI the profiles are held constant and are applied to a new total VOC inventory. For well known sectors, constant profiles are assumed to be a reasonable approximation. However, for less well known sources, this could introduce uncertainty into emissions estimations, specifically in the context of modelling tropospheric ozone as the results are sensitive to the VOC speciation, which is used as model inputs. Incorrect speciation means it is difficult to accurately assess the impact of emissions.
In terms of offshore VOC speciation, four relevant profiles from Passant (2002) were identified. These are listed as crude oil production, crude oil distribution, industrial combustion of gas and natural gas flares. Multiple sources are represented by a single profile meaning these profiles are used to represent the entire offshore sector, including emissions from flaring, venting, loading and storage. Figure 8 compares the emission ratios of VOCs to propane for these profiles to the North Sea measurements from this work. (Note the flaring profile was not included here due to the lack of common species between measurements and inventory.) All offshore field types show a consistent trend in Fig. 8 with the VOC to propane ratio generally decreasing with increasing molecular weight, highlighting how O&G emissions are dominated by light alkanes. However, the absolute values vary significantly, again exposing the non-uniform nature of emissions from the O&G sector.
Our measurements resemble the oil production VOC profile from the NAEI most closely, shown in Fig. 8, particularly for emission ratios of some light alkanes (n-butane, n-pentane, iso-butane), which are both qualitatively and quantitatively consistent. Obvious differences are observed for species with a carbon number greater than 5. The enhancement ratio for hexane is enhanced in the oil production profile compared to our measurements, with the largest discrepancy seen for condensate fields. The opposite is true for the mono-aromatic species (benzene and toluene), where the enhancement ratio in the inventory profile is significantly lower than the measurement data for benzene, and emissions of toluene are not included at all, suggesting the inventory may be lacking in some information. The gas combustion profile appears to capture similar trends to the measurements and also includes aromatic compounds benzene and toluene. However, this profile shows a higher contribution of VOCs relative to propane compared to observations for all species, potentially leading to the overestimation of some species should these profiles be used in the estimation of individual VOC emissions. The oil distribution profile is sparse in terms of the number of species reported, only including alkanes up to C5 and no mono-aromatics. In addition, the quantitative values of emission ratios are dissimilar to both the observations and the other inventory profiles, suggesting this profile does not represent offshore O&G emissions well.
This work shows that VOC emissions are unique to their source, and therefore using a single profile to represent multiple emission sources will likely mean emissions are poorly described in the inventory. We recognize, however, that the measurements made here represent an accumulation of emissions from all potential sources located on offshore platforms, and therefore it is unlikely that any one source-specific profile will agree entirely. Despite this, it is clear that the profiles are not inclusive of all species and that considerable variability exists in emissions from the O&G sector, which is not currently reflected in the inventory. In order to assess the accuracy of the NAEI source profiles, more detailed study of specific sources and activities is needed.
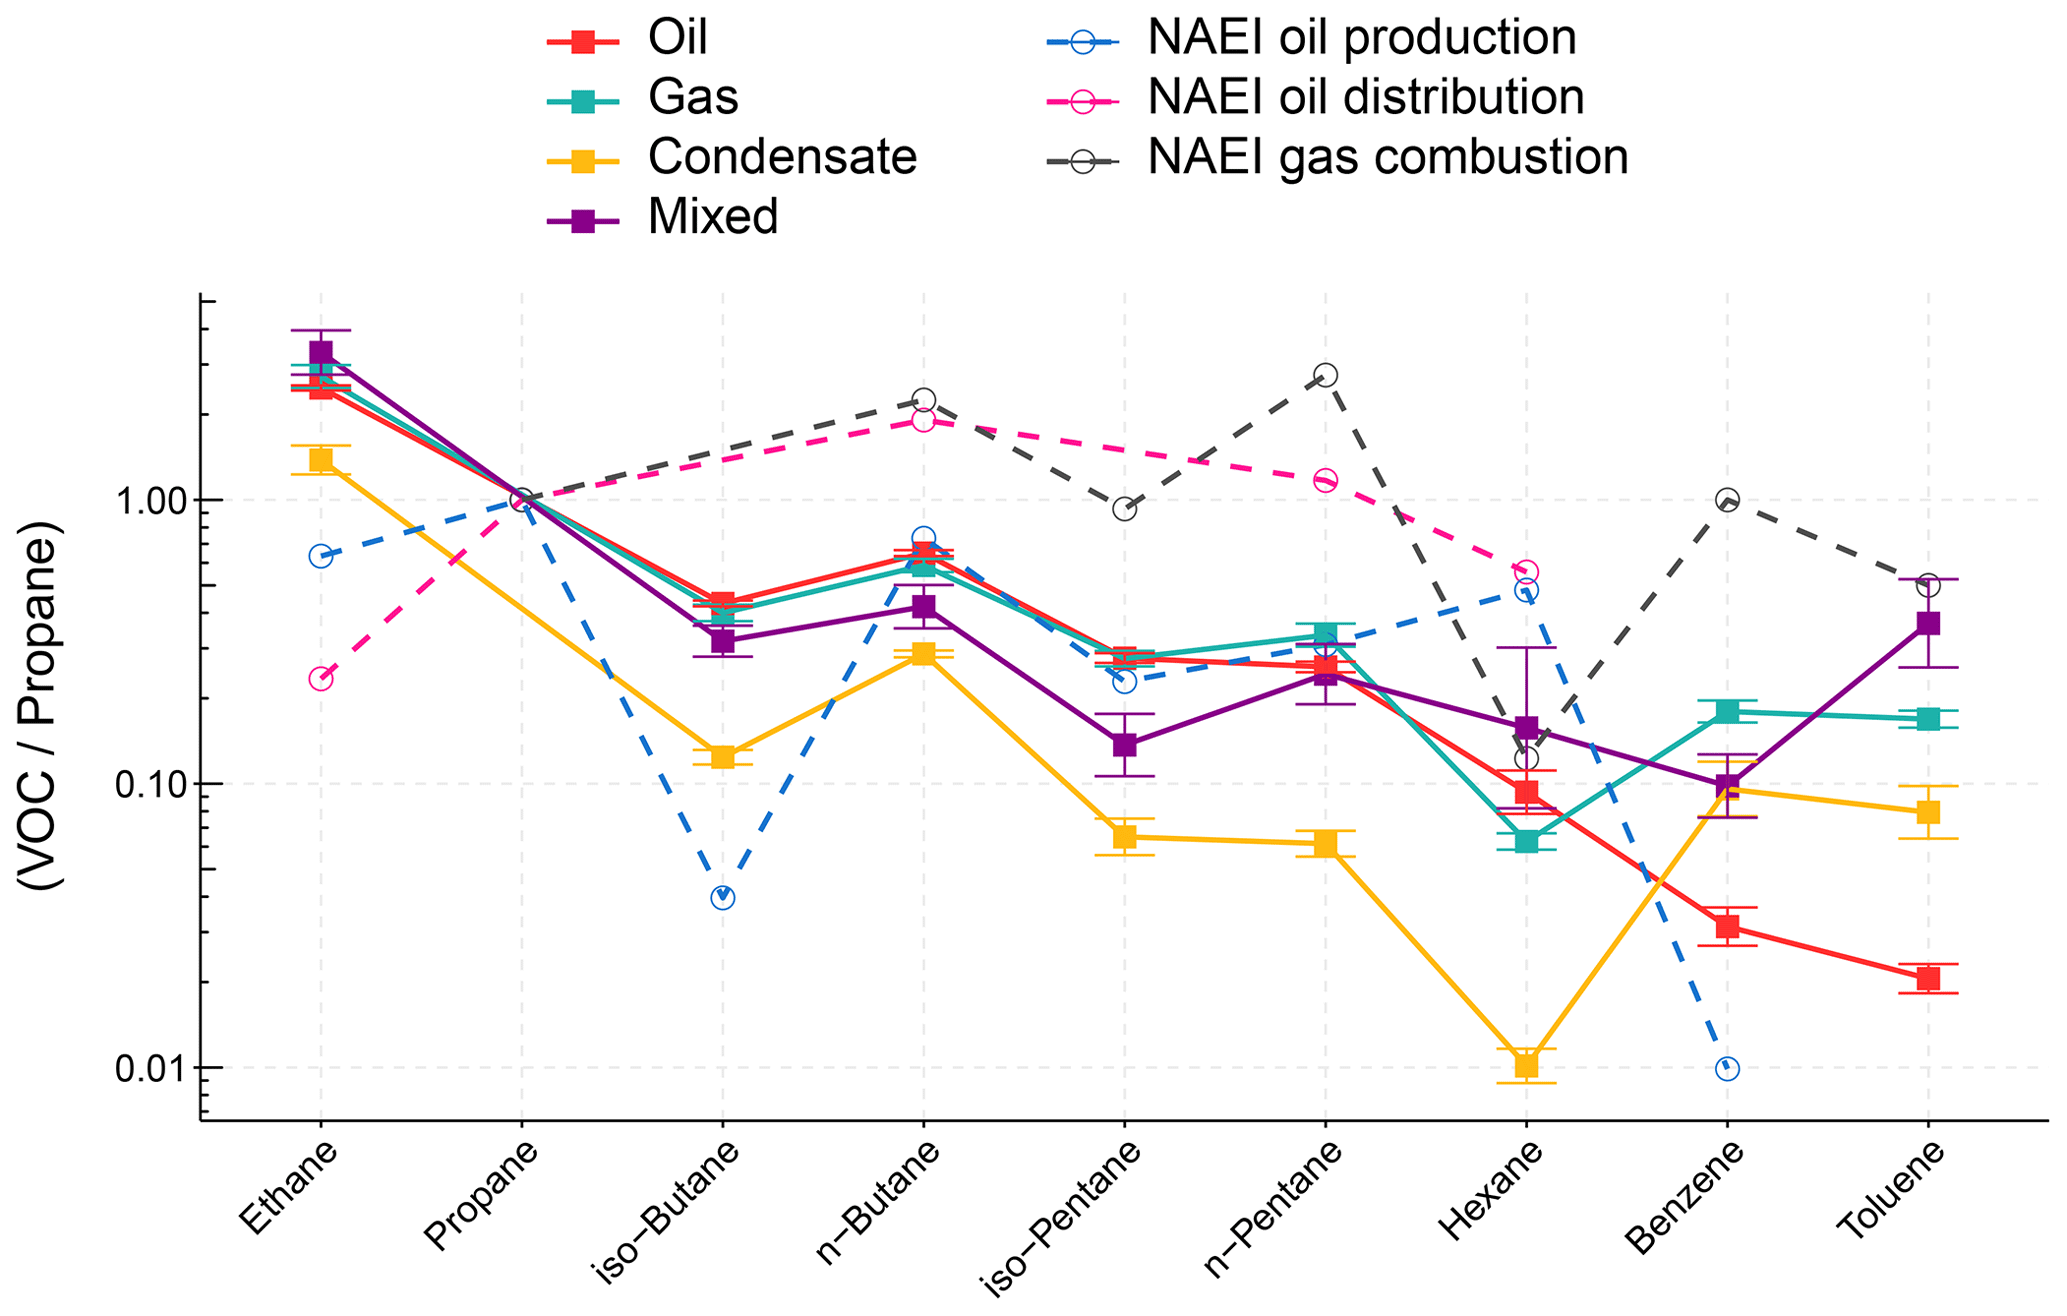
Figure 8Emission ratios of VOC with propane calculated by reduced major-axis regression for each offshore field type (note the log scale). Error bars represent the 95 % confidence intervals. The dashed lines show the ratio obtained from the NAEI speciation profiles in Passant (2002) for oil production, oil distribution and gas combustion.
This study presents an overview of VOCs emitted from O&G operations in the North Sea, which is a rarely investigated but rapidly changing region. Data from 28 research flights were aggregated to provide a representative picture of the spatial distribution of VOCs across all regions of the North Sea. Enhancement ratios between pentane isomers identify O&G activities to be the dominant source. Characteristic enhancements of iso-pentane over n-pentane of 0.89, 1.08 and 1.12 in the northern UK, West Shetland and Norwegian sector, respectively, are consistent with literature values identifying emissions from O&G activities. A ratio of 1.24 ppb observed in the southern UK provides evidence of an urban influence on emissions since branched isomers are more prevalent in refined products such as petrol. Enhancement ratios of individual VOCs with specific tracer compounds were utilized to determine the contribution from unique emission sources. Propane was used as an O&G tracer while acetylene was used to identify vehicular emissions. Strong correlations of light alkanes with propane and generally weak correlations with acetylene confirmed that hydrocarbon concentrations in the North Sea are primarily influenced by O&G production. Emissions originating from urban traffic sources were identified in the southern UK through use of the benzene to toluene enhancement ratio, where approximately 4 % of data from this region was characterized by a B T ratio of 0.6, typical of traffic emissions (Langford et al., 2009).
The source profiles of offshore field types were investigated in terms of the primary product; oil, gas, condensate or a mix of them. The C2H6 to CH4 enhancement ratio highlighted the significant spatial variability in the composition of emissions from offshore O&G production. Ratios ranging from 0.03 to 0.18 indicated “wet” emission sources containing high ethane content as well as “dry” emissions primarily composed of CH4. The distribution of individual VOCs was similar for all field types, with C2–C5 alkanes being the dominant species; however, the relative contribution of VOCs to CH4 was unique to each extraction product. The importance of studying VOCs in addition to CH4 was exposed through calculations of VOC–OH reactivity, which showed unsaturated species, followed by light alkanes, were the most important in terms of local O3 formation. CH4 contributed less than 3 % despite its dominance in terms of emissions from this sector. Through calculation of the excess mole fraction, the diversity in emissions from O&G activities was emphasized. Deepwater oil extraction resulted in emissions of hydrocarbon-rich, associated gas, whereas gas extraction in shallow waters yields emissions of CH4-rich, non-associated gas. EMFs typically increased with water depth, suggesting that emissions of VOCs from O&G activities may become increasingly important relative to CH4 in terms of their impact on air quality as current reservoirs are depleted and exploration shifts to more challenging, deeper waters.
A comparison of our results to the source profiles found in the UK NAEI revealed several discrepancies in terms of relative speciation. The VOC to propane ratio for common species was compared to profiles relating to gas combustion, oil production and oil distribution. Whilst the profile for oil production agrees fairly well with measured molar ratios of light alkanes, deviations occurred for the higher carbon number hydrocarbons, particularly hexane, which was higher relative to propane in the inventory compared to measurements. Considerable differences were also seen for benzene and the absence of other aromatic species and alkenes in the inventory profiles suggest these sources are not completely characterized in the current inventory, although the overall mass of emissions may still be correct.
Overall, this work uses novel and unique data to provide a better understanding of a relatively understudied source of emissions from North Sea O&G production, which has the potential to impact local and regional air quality. The VOC speciation profiles established here could be used to update the current inventory, providing a set of observational-based profiles specific to each fossil fuel product.
Table A1Summary of flight data used in this study. MOYA – Methane Observation and Yearly Assessment, CCAC – Climate and Clean Air Coalition, AEOG – Assessing Atmospheric Emissions from the Oil and Gas Industry. Baseline refers to a set of initial flights conducted in 2015 to serve as a comparison in future work. Regions are those defined in Fig. 1a.
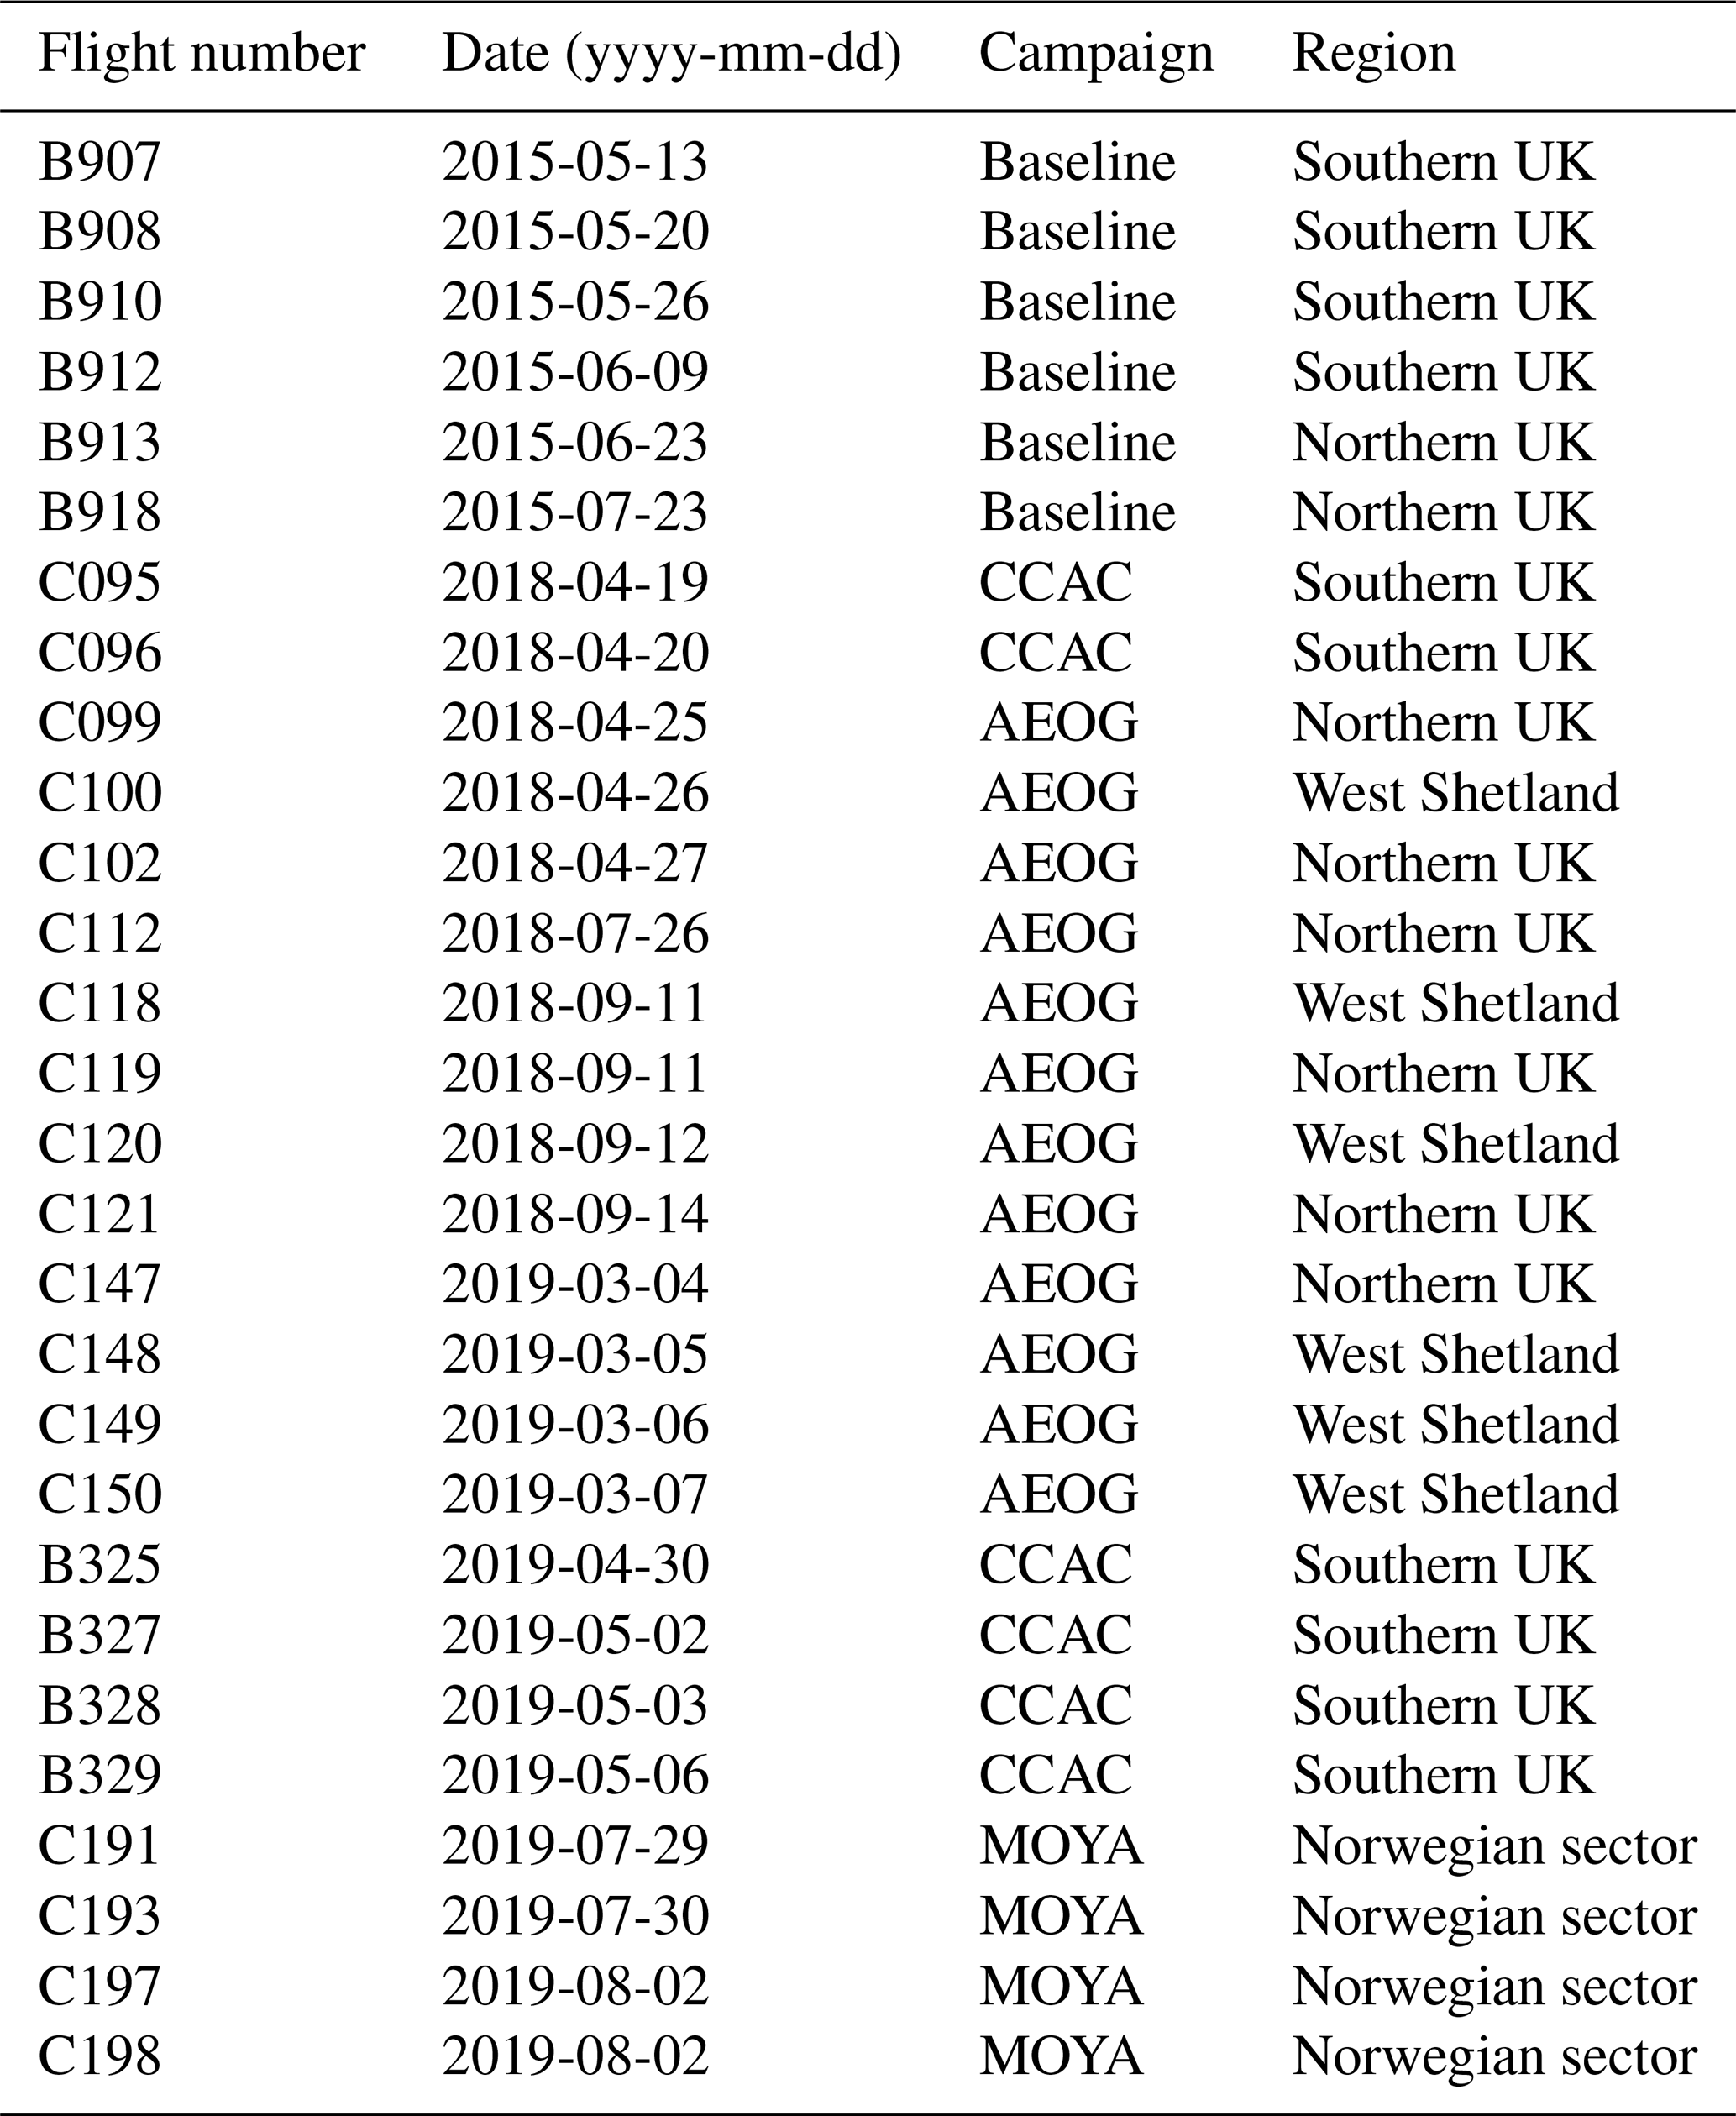
Table A2Number of whole air samples obtained in each defined region.
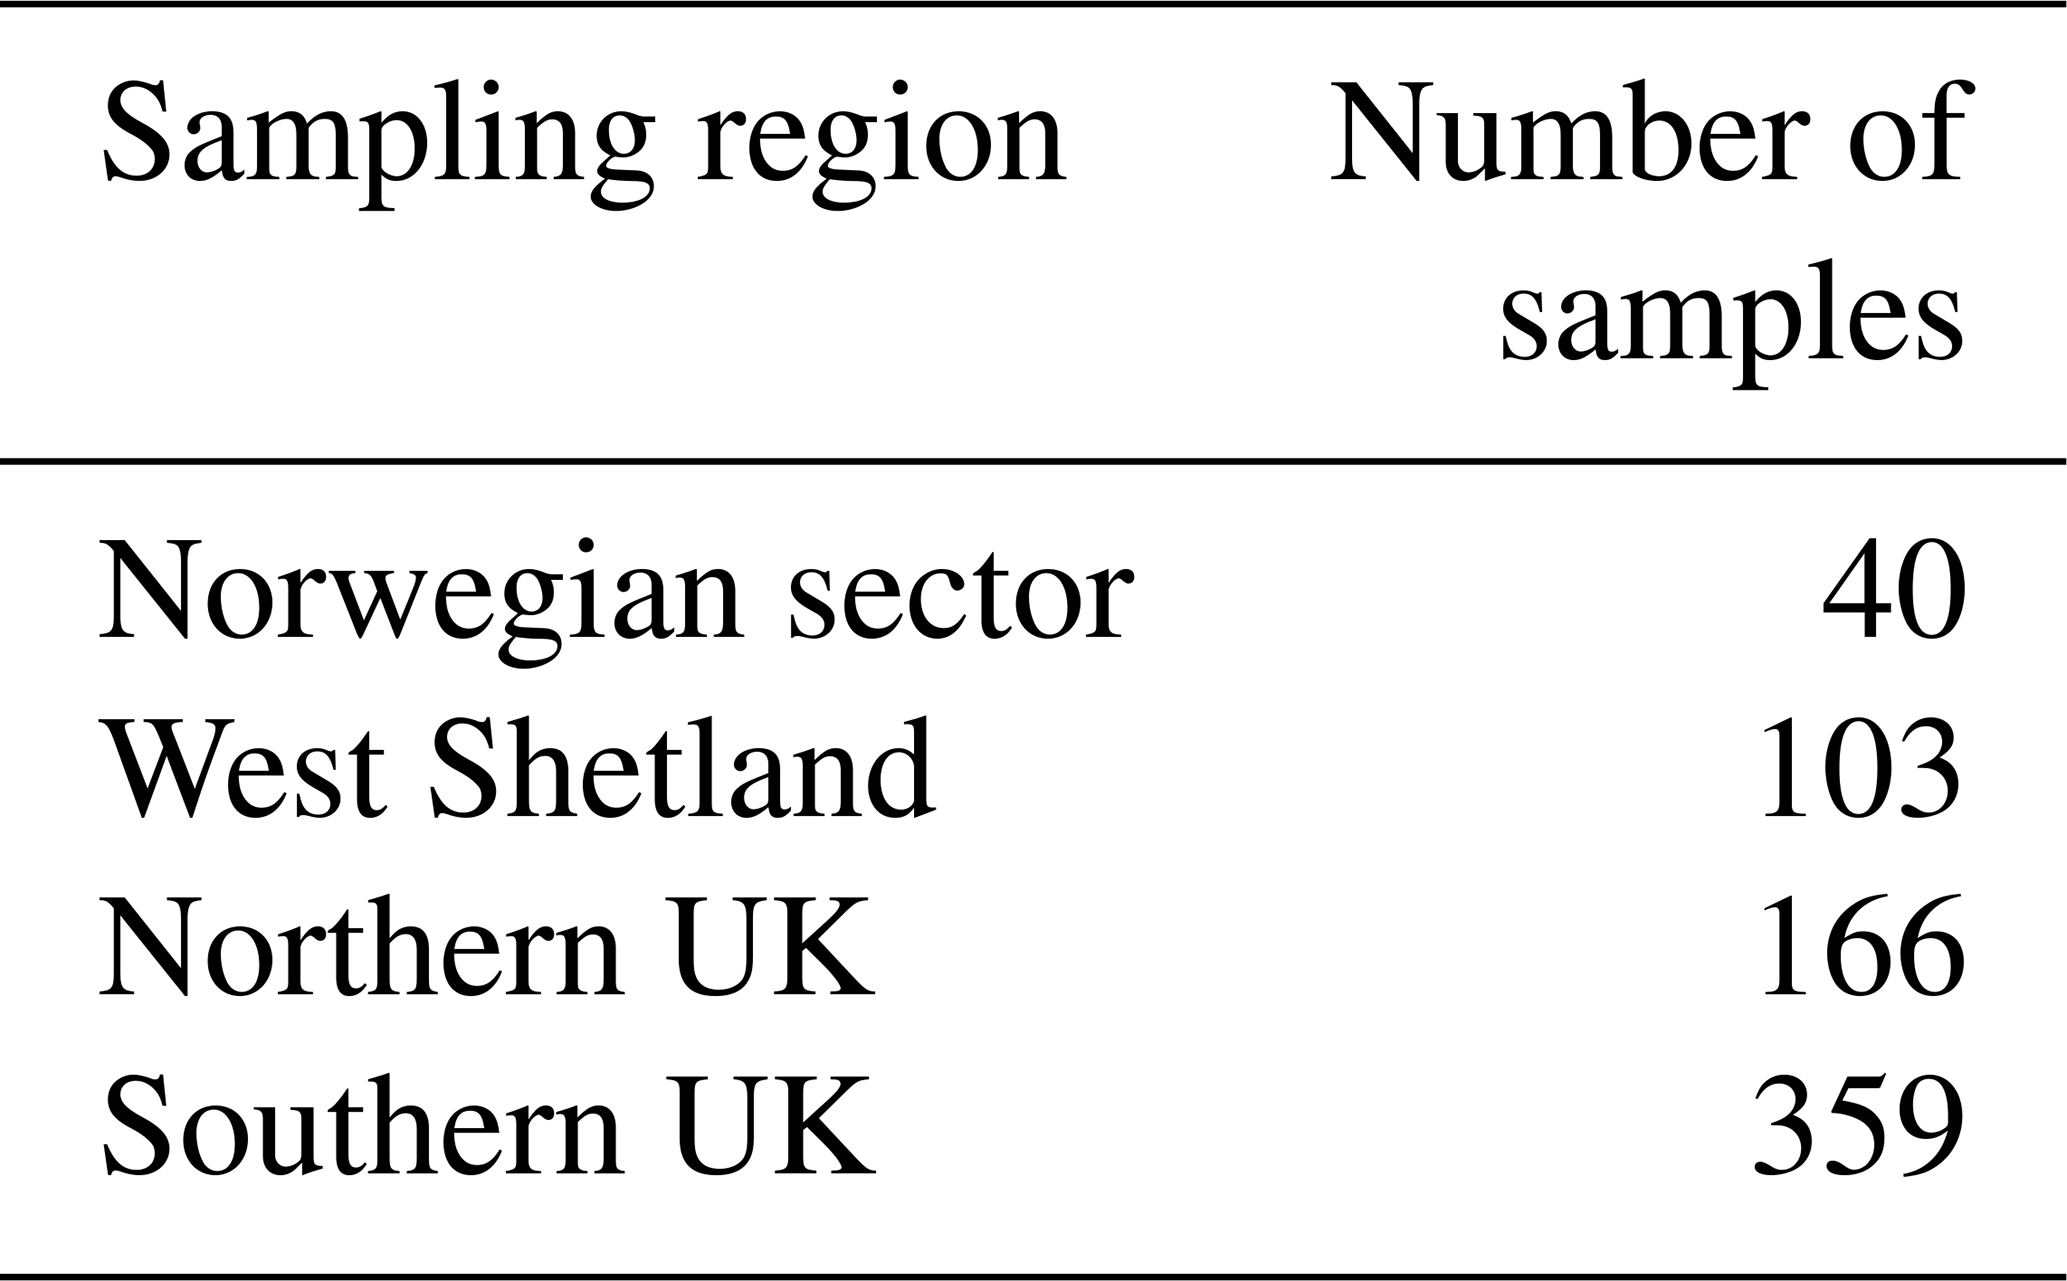
Table A3Benzene to toluene emission ratios (ERs) for each sampling region along with corresponding r2 values and Pearson correlation coefficients (r).
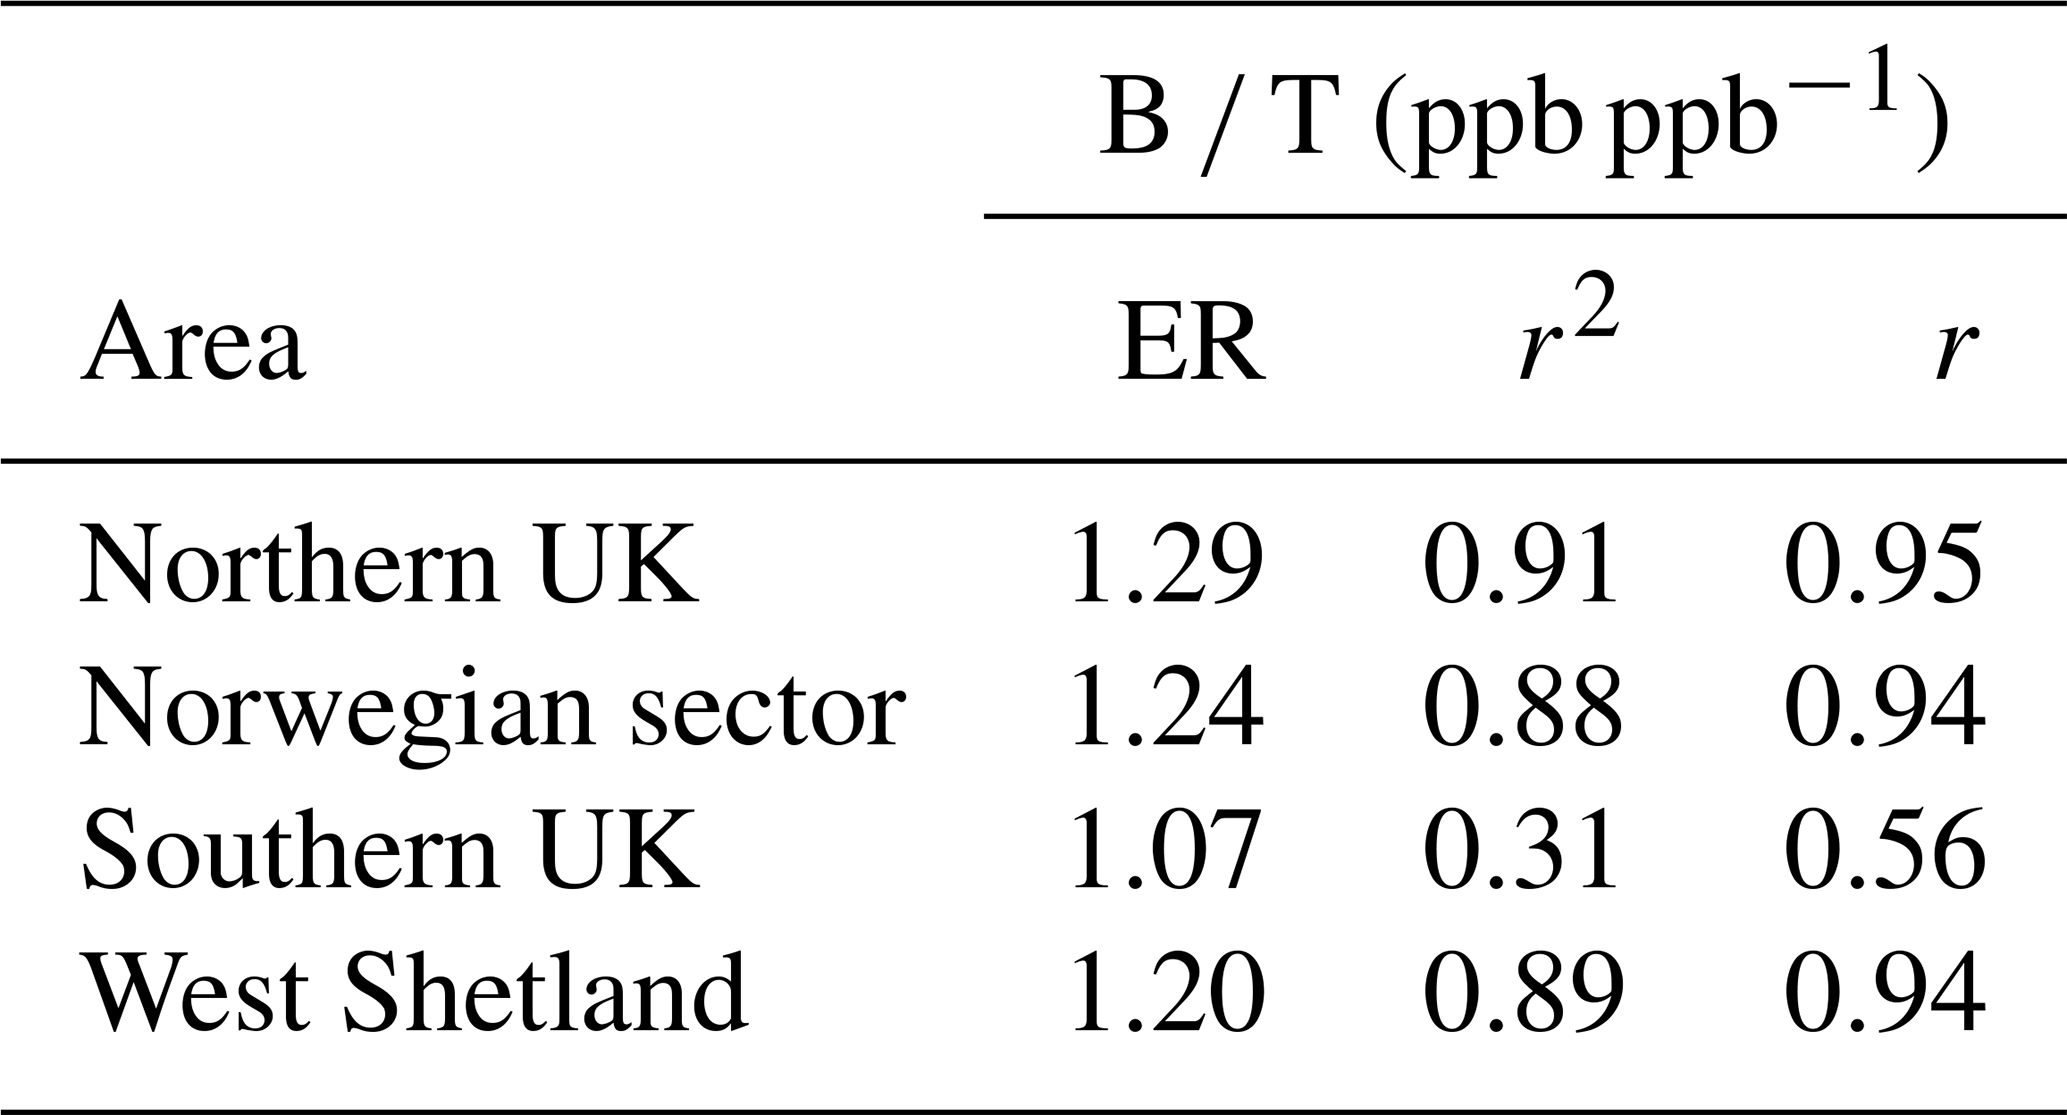
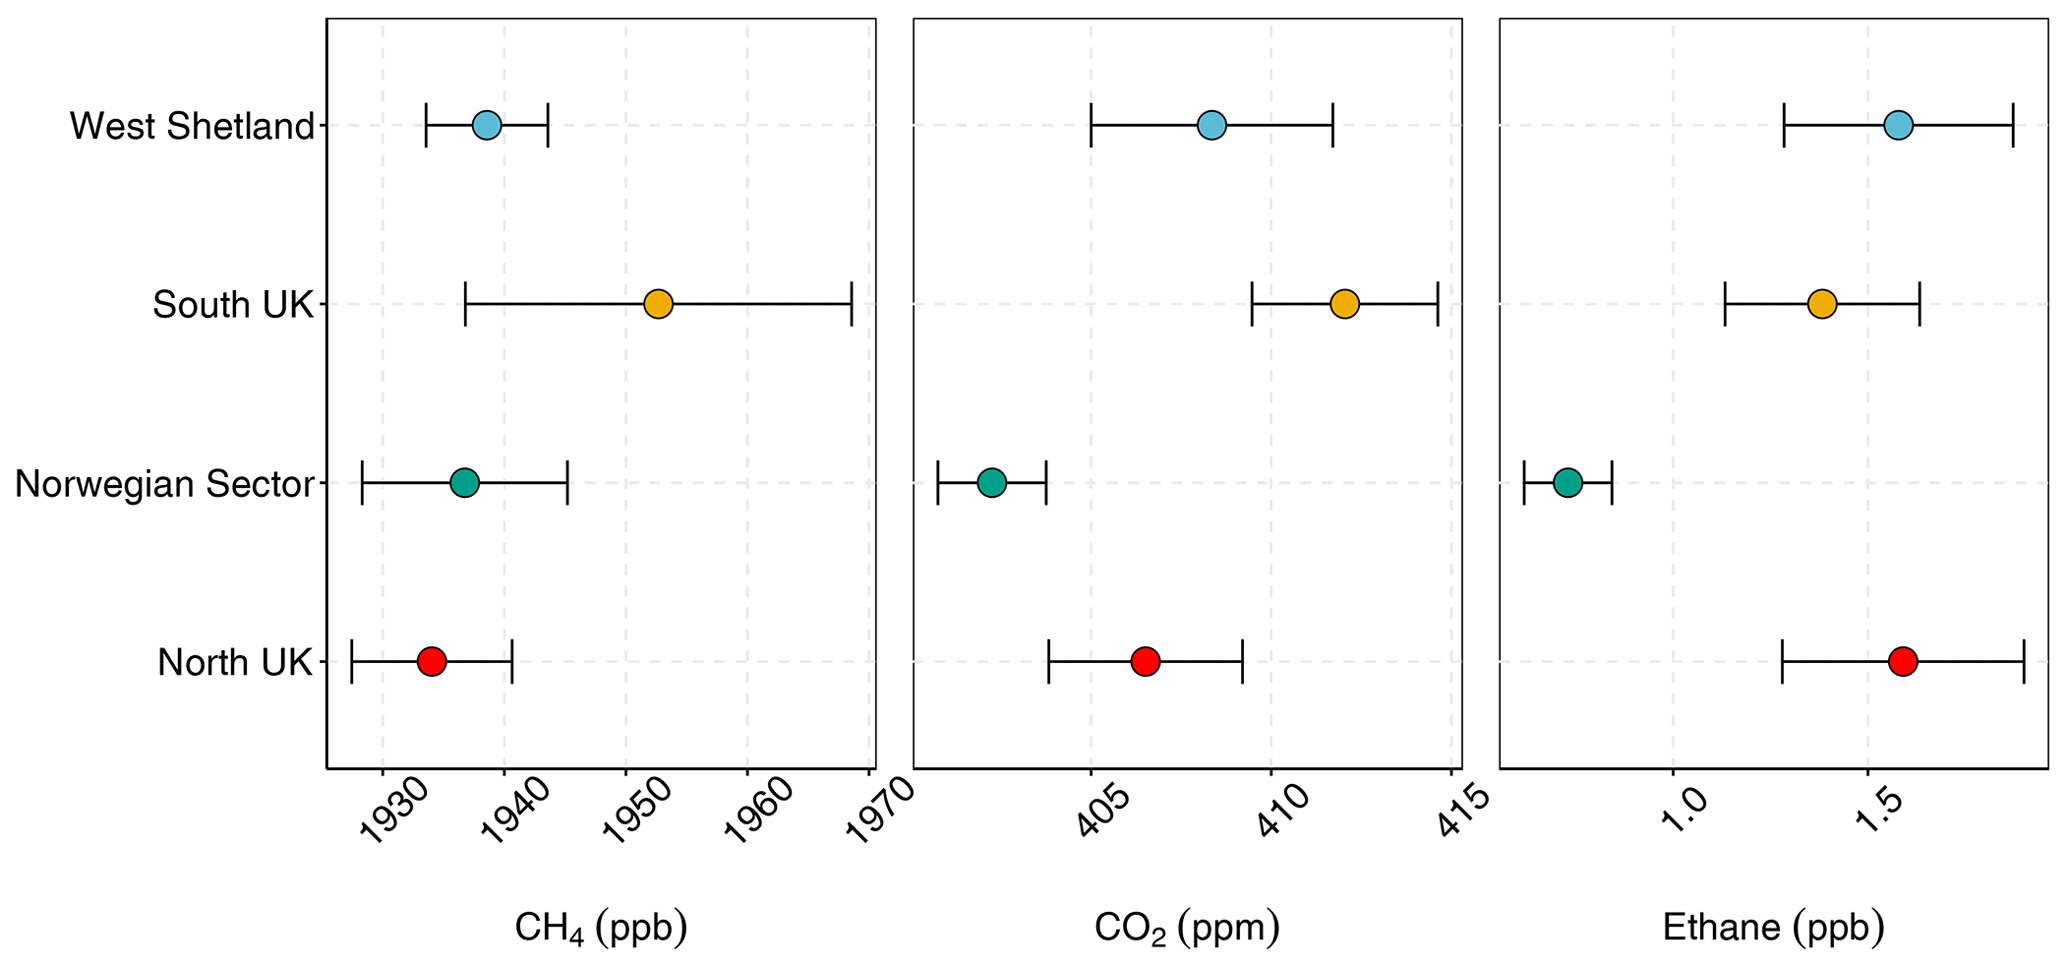
Figure A1Mean background mixing ratios of CH4, CO2 and ethane from all flights in each sampling region. Error bars represent 1 standard error.
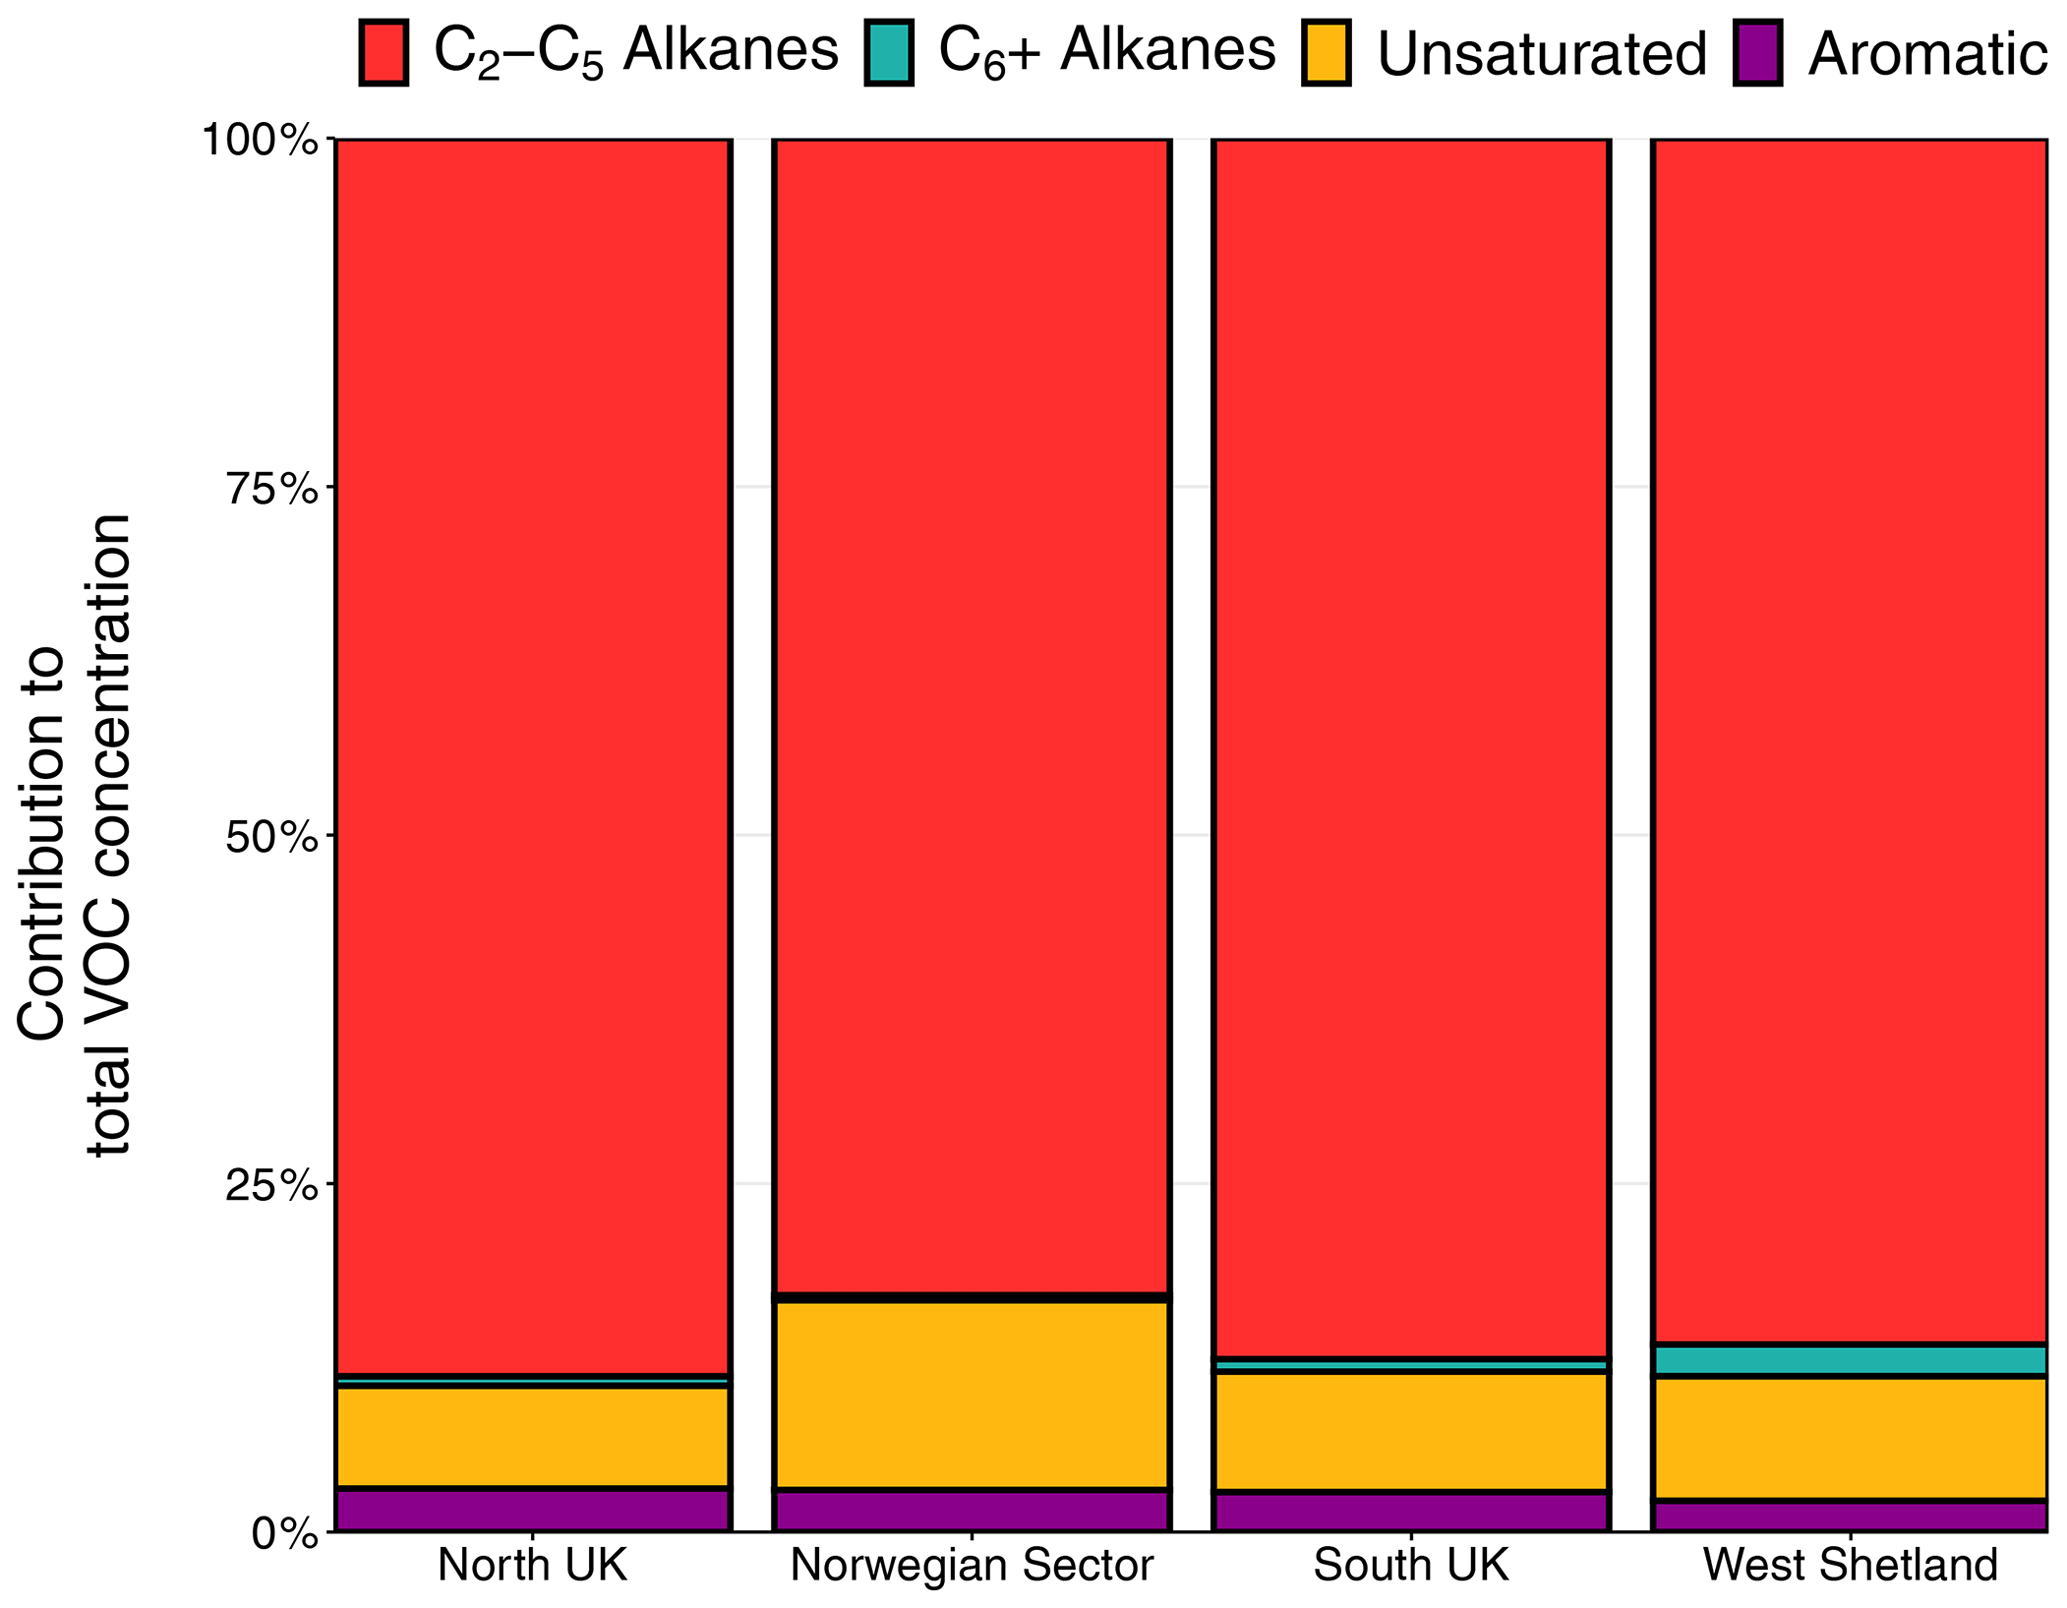
Figure A2Percentage contribution of each VOC group to total VOC concentrations in each region of the North Sea.

Figure A3Scatter plot of ΔCH4 versus ΔCO2. The dashed line shows an emission ratio of 20 ppb ppm−1, which was used for filtering data to remove the influence of anthropogenic emissions.
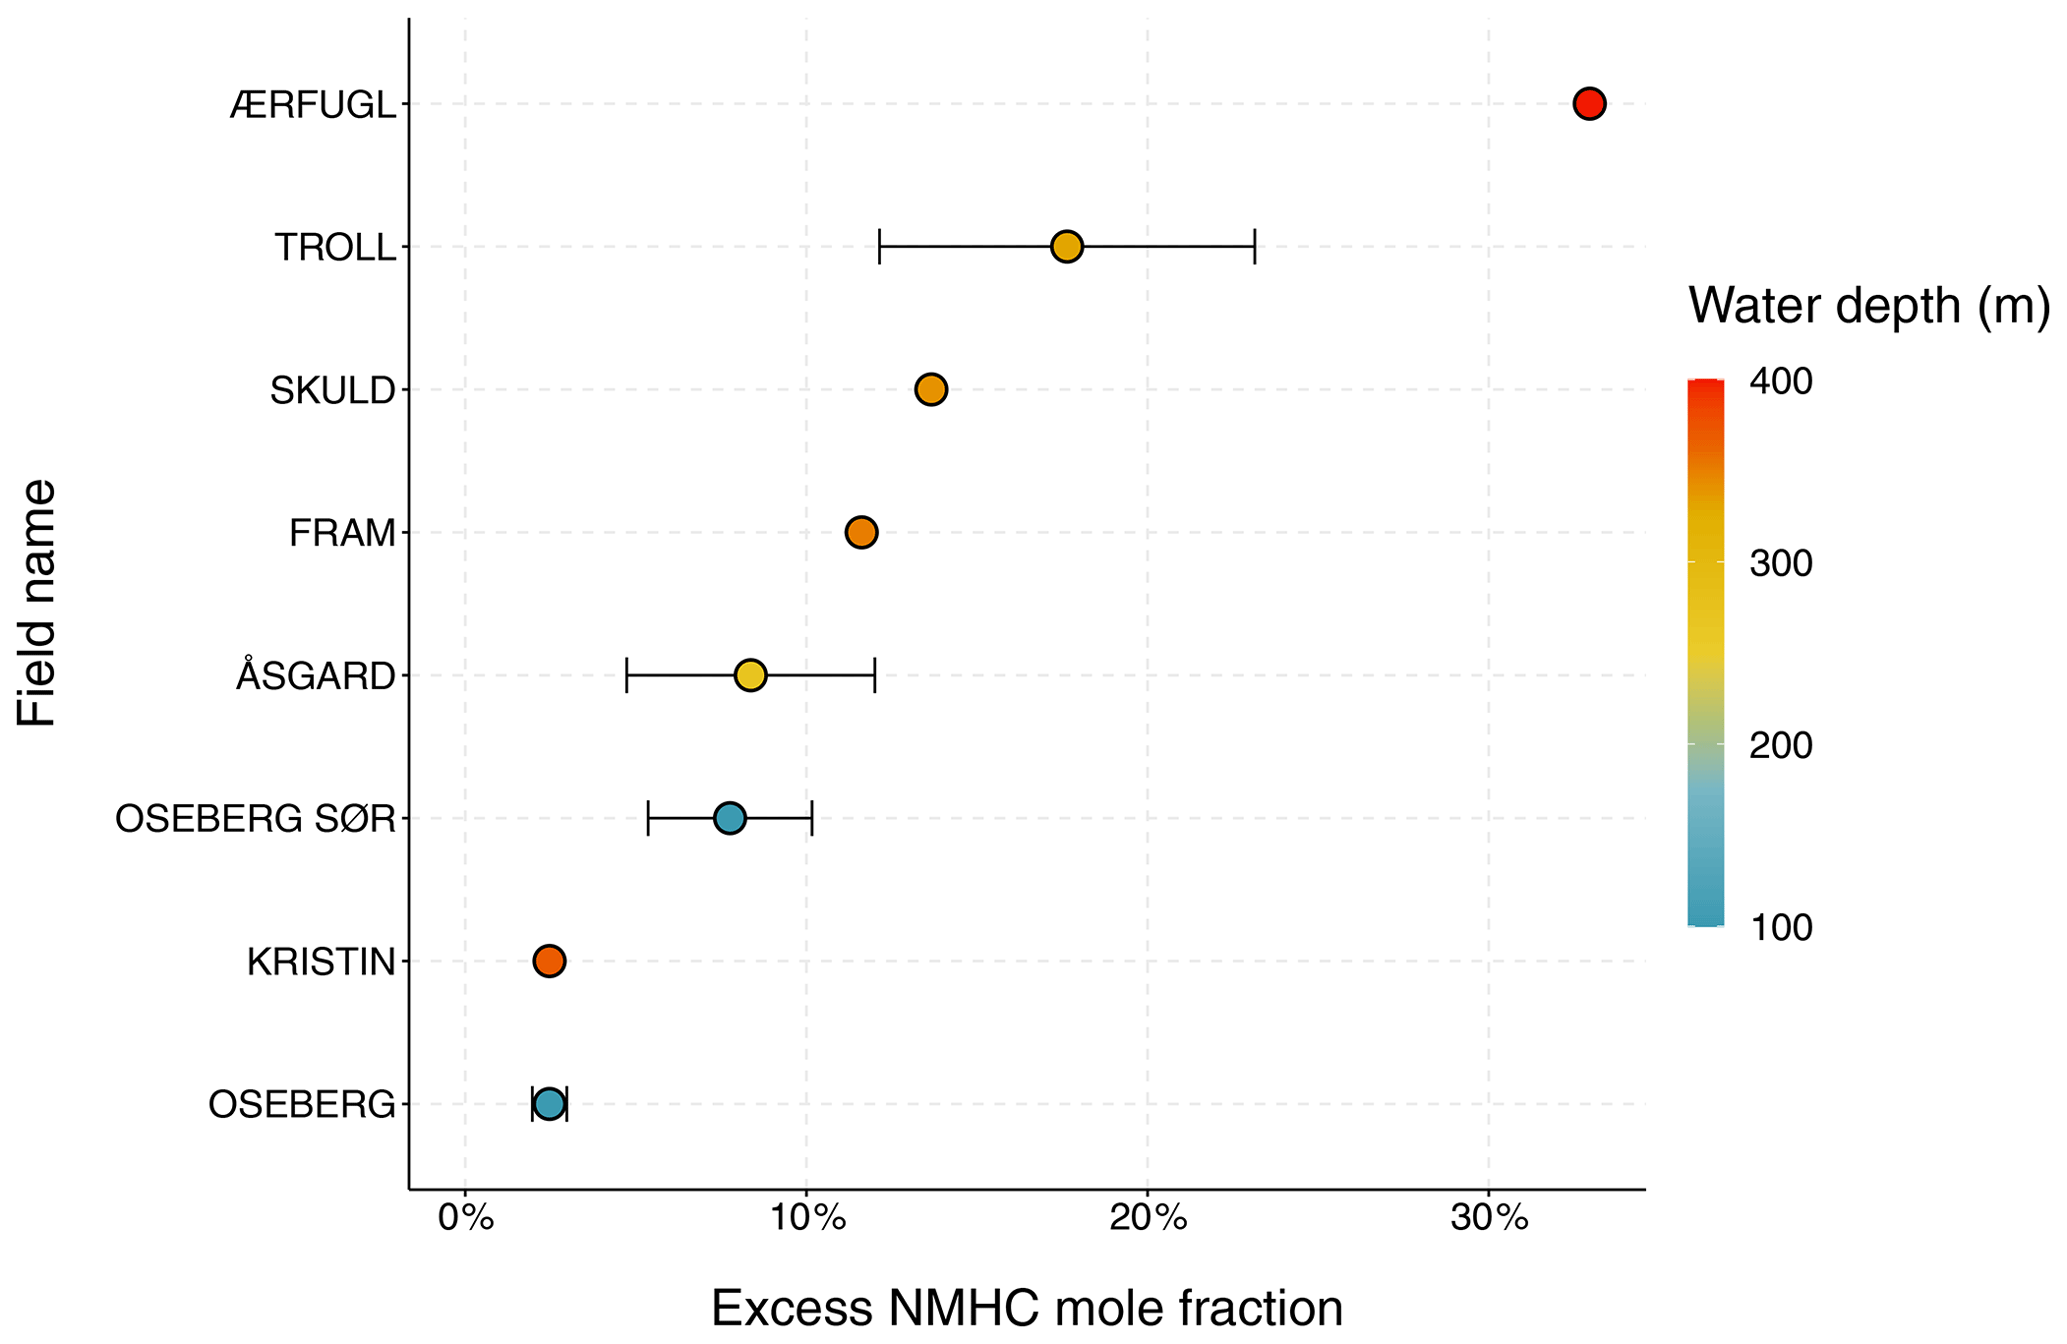
Figure A4Mean excess mole fraction for individual offshore fields in the Norwegian sector of the North Sea coloured by water depth. Error bars represent 1 standard error.
Data can be obtained upon request from the authors or from the URLs provided for each project.
The paper was drafted, data were analysed and figures were produced by SEW with help from PAD, RMP, JDL, JRH and AEL. Experimental design and flight planning was carried out by JDL, RMP, SEW, SDM, RRB, IC, GA and PB. Aircraft set-up, in-flight measurements and data processing were performed by SEW, PAD, SJA, SJBB, JF, AEJ, TLC, AW, JL, SY, RMP, PB and LH. Laboratory measurements were made by SEW, PAD and JRH. Reviewing and editing were carried out by ACL, JRH, JDL, JF and RMP.
The authors declare that they have no conflict of interest.
Airborne data were obtained using the BAe-146-301 Atmospheric Research Aircraft (ARA) flown by Airtask Ltd. and managed by FAAM Airborne Laboratory, jointly operated by UK Research and Innovation (UKRI) and the University of Leeds, and a DCH6 Twin Otter operated by the British Antarctic Survey (BAS). The FAAM aircraft data were collected as part of the Demonstration Of A Comprehensive Approach To Monitoring Emissions From Oil and Gas Installations (AEOG) project, the Improved understanding of accidental releases from oil and gas industries offshore project, and the Methane Observations and Yearly Assessments (MOYA) project, all funded by the Natural Environment Research Council (NERC). The Twin Otter aircraft campaigns were funded under the Climate and Clean Air Coalition (CCAC) Oil and Gas Methane Science Studies (MSS), hosted by the United Nations Environment Programme. Funding was provided by the Environmental Defense Fund, Oil and Gas Climate Initiative, European Commission, and CCAC. We also acknowledge the Offshore Petroleum Regulator for Environment and Decommissioning (OPRED) and Ricardo Energy & Environment for their involvement as project partners on the AEOG project.
This research has been supported by the Natural Environment Research Council (grant nos. NE/R01454X/1, NE/N016211/1 and NE/M007146/1) and the Climate and Clean Air Coalition (CCAC) (grant no. DTIE18-EN018).
This paper was edited by Christopher Cantrell and reviewed by Jessica Gilman and one anonymous referee.
Abeleira, A., Pollack, I. B., Sive, B., Zhou, Y., Fischer, E. V., and Farmer, D. K.: Source characterization of volatile organic compounds in the Colorado Northern Front Range Metropolitan Area during spring and summer 2015, J. Geophys. Res.-Atmos., 122, 3595–3613, https://doi.org/10.1002/2016jd026227, 2017. a
Atkinson, R.: Gas-Phase Tropospheric Chemistry of Volatile Organic Compounds: 1. Alkanes and Alkenes, J. Phys. Chem. Ref. Data, 26, 215–290, https://doi.org/10.1063/1.556012, 1997. a
Atkinson, R. and Arey, J.: Atmospheric Degradation of Volatile Organic Compounds, Chem. Rev., 103, 4605–4638, https://doi.org/10.1021/cr0206420, 2003. a
Atkinson, R. and Aschmann, S. M.: Rate constants for the reactions of O3 and OH radicals with a series of alkynes, Int. J. Chem. Kinet., 16, 259–268, https://doi.org/10.1002/kin.550160308, 1984. a
Ayers, G.: Comment on regression analysis of air quality data, Atmos. Environ., 35, 2423–2425, https://doi.org/10.1016/S1352-2310(00)00527-6, 2001. a
Bourtsoukidis, E., Ernle, L., Crowley, J. N., Lelieveld, J., Paris, J.-D., Pozzer, A., Walter, D., and Williams, J.: Non-methane hydrocarbon (C2–C8) sources and sinks around the Arabian Peninsula, Atmos. Chem. Phys., 19, 7209–7232, https://doi.org/10.5194/acp-19-7209-2019, 2019. a, b
BP Exploration Company Ltd.: North Sea Region, available at: https://www.bp.com/content/dam/bp/country-sites/en_gb/united-kingdom/home/pdf/bp-north-sea-portfolio-2019.pdf (last access: 8 March 2021), 2019. a
Broderick, B. and Marnane, I.: A comparison of the C2-C9 hydrocarbon compositions of vehicle fuels and urban air in Dublin, Ireland, Atmos. Environ., 36, 975–986, https://doi.org/10.1016/S1352-2310(01)00472-1, 2002. a
Cain, M., Warwick, N. J., Fisher, R. E., Lowry, D., Lanoisellé, M., Nisbet, E. G., France, J., Pitt, J., O'Shea, S., Bower, K. N., Allen, G., Illingworth, S., Manning, A. J., Bauguitte, S., Pisso, I., and Pyle, J. A.: A cautionary tale: A study of a methane enhancement over the North Sea, J. Geophys. Res.-Atmos., 122, 7630–7645, https://doi.org/10.1002/2017jd026626, 2017. a
Camilli, R., Reddy, C. M., Yoerger, D. R., Van Mooy, B. A. S., Jakuba, M. V., Kinsey, J. C., McIntyre, C. P., Sylva, S. P., and Maloney, J. V.: Tracking Hydrocarbon Plume Transport and Biodegradation at Deepwater Horizon, Science, 330, 201–204, https://doi.org/10.1126/science.1195223, 2010. a
Climate and Clean Air Coalition: Unstabilized Hydrocarbon Liquid Storage Tanks, Technical Guidance Document Number 6, available at: https://ccacoalition.org/en/resources/technical-guidance-document-number-6-unstabilized-hydrocarbon-liquid-storage-tanks (last access: 8 March 2021), 2017. a
Conway, T. J. and Steele, L. P.: Carbon dioxide and methane in the Arctic atmosphere, J. Atmos. Chem., 9, 81–99, https://doi.org/10.1007/BF00052826, 1989. a
Darnall, K. R., Lloyd, A. C., Winer, A. M., and Pitts, J. N.: Reactivity scale for atmospheric hydrocarbons based on reaction with hydroxyl radical, Environ. Sci. Technol., 10, 692–696, https://doi.org/10.1021/es60118a008, 1976. a
Derwent, R., Field, R., Dumitrean, P., Murrells, T., and Telling, S.: Origins and trends in ethane and propane in the United Kingdom from 1993 to 2012, Atmos. Environ., 156, 15–23, https://doi.org/10.1016/j.atmosenv.2017.02.030, 2017. a
Dominutti, P. A., Nogueira, T., Borbon, A., Andrade, M. D. F., and Fornaro, A.: One-year of NMHCs hourly observations in São Paulo megacity: meteorological and traffic emissions effects in a large ethanol burning context, Atmos. Environ., 142, 371–382, https://doi.org/10.1016/j.atmosenv.2016.08.008, 2016. a
Edwards, P. M., Brown, S. S., Roberts, J. M., Ahmadov, R., Banta, R. M., deGouw, J. A., Dubé, W. P., Field, R. A., Flynn, J. H., Gilman, J. B., Graus, M., Helmig, D., Koss, A., Langford, A. O., Lefer, B. L., Lerner, B. M., Li, R., Li, S.-M., McKeen, S. A., Murphy, S. M., Parrish, D. D., Senff, C. J., Soltis, J., Stutz, J., Sweeney, C., Thompson, C. R., Trainer, M. K., Tsai, C., Veres, P. R., Washenfelder, R. A., Warneke, C., Wild, R. J., Young, C. J., Yuan, B., and Zamora, R.: High winter ozone pollution from carbonyl photolysis in an oil and gas basin, Nature, 514, 351–354, https://doi.org/10.1038/nature13767, 2014. a
EIA: Offshore production nearly 30% of global crude oil output in 2015, available at: https://www.eia.gov/todayinenergy/detail.php?id=28492 (last access: 22 June 2020), 2016a. a
EIA: Offshore oil production in deepwater and ultra-deepwater is increasing, available at: https://www.eia.gov/todayinenergy/detail.php?id=28552 (last access: 19 August 2020), 2016b. a
European Environment Agency: The impact of international shipping on European air quality and climate forcing, Technical Report, European Environment Agency, København, Denmark, 84 pp., https://doi.org/10.2800/75763, 2013. a
Eurostat: Natural gas supply statistics, available at: https://ec.europa.eu/eurostat/statistics-explained/pdfscache/10590.pdf (last access: 23 June 2020), 2019. a
Field, R. A., Soltis, J., McCarthy, M. C., Murphy, S., and Montague, D. C.: Influence of oil and gas field operations on spatial and temporal distributions of atmospheric non-methane hydrocarbons and their effect on ozone formation in winter, Atmos. Chem. Phys., 15, 3527–3542, https://doi.org/10.5194/acp-15-3527-2015, 2015. a
Fortin, T. J., Howard, B. J., Parrish, D. D., Goldan, P. D., Kuster, W. C., Atlas, E. L., and Harley, R. A.: Temporal Changes in U.S. Benzene Emissions Inferred from Atmospheric Measurements, Environ. Sci. Technol., 39, 1403–1408, https://doi.org/10.1021/es049316n, 2005. a
France, J. L., Bateson, P., Dominutti, P., Allen, G., Andrews, S., Bauguitte, S., Coleman, M., Lachlan-Cope, T., Fisher, R. E., Huang, L., Jones, A. E., Lee, J., Lowry, D., Pitt, J., Purvis, R., Pyle, J., Shaw, J., Warwick, N., Weiss, A., Wilde, S., Witherstone, J., and Young, S.: Facility level measurement of offshore oil and gas installations from a medium-sized airborne platform: method development for quantification and source identification of methane emissions, Atmos. Meas. Tech., 14, 71–88, https://doi.org/10.5194/amt-14-71-2021, 2021. a, b
Gentner, D. R., Harley, R. A., Miller, A. M., and Goldstein, A. H.: Diurnal and Seasonal Variability of Gasoline-Related Volatile Organic Compound Emissions in Riverside, California, Environ. Sci. Technol., 43, 4247–4252, https://doi.org/10.1021/es9006228, 2009. a
Ghosh, B.: Impact of Changes in Oil and Gas Production Activities on Air Quality in Northeastern Oklahoma: Ambient Air Studies in 2015–2017, Environ. Sci. Technol., 52, 3285–3294, https://doi.org/10.1021/acs.est.7b05726, 2018. a, b, c
Gilman, J. B., Lerner, B. M., Kuster, W. C., and de Gouw, J. A.: Source Signature of Volatile Organic Compounds from Oil and Natural Gas Operations in Northeastern Colorado, Environ. Sci. Technol., 47, 1297–1305, https://doi.org/10.1021/es304119a, 2013. a, b, c, d, e, f, g, h, i
Glennie, K. W.: Exploration activities in the Netherlands and North-West Europe since Groningen, Neth. J. Geosci., 80, 33–52, https://doi.org/10.1017/s0016774600022150, 2001. a
Goetz, J. D., Floerchinger, C., Fortner, E. C., Wormhoudt, J., Massoli, P., Knighton, W. B., Herndon, S. C., Kolb, C. E., Knipping, E., Shaw, S. L., and DeCarlo, P. F.: Atmospheric Emission Characterization of Marcellus Shale Natural Gas Development Sites, Environ. Sci. Technol., 49, 7012–7020, https://doi.org/10.1021/acs.est.5b00452, 2015. a
Halliday, H. S., Thompson, A. M., Wisthaler, A., Blake, D. R., Hornbrook, R. S., Mikoviny, T., Müller, M., Eichler, P., Apel, E. C., and Hills, A. J.: Atmospheric benzene observations from oil and gas production in the Denver-Julesburg Basin in July and August 2014, J. Geophys. Res.-Atmos., 121, 11055–11074, https://doi.org/10.1002/2016JD025327, 2016. a, b
Hill, P. J. and Palfrey, A. J.: The Britannia Field, Blocks 15/29a, 15/30, 16/26, 16/27a, 16/27b, UK North Sea, Geol. Soc. Lond. Mem., 20, 415–429, https://doi.org/10.1144/GSL.MEM.2003.020.01.34, 2003. a
Hong, Z., Li, M., Wang, H., Xu, L., Hong, Y., Chen, J., Chen, J., Zhang, H., Zhang, Y., Wu, X., Hu, B., and Li, M.: Characteristics of atmospheric volatile organic compounds (VOCs) at a mountainous forest site and two urban sites in the southeast of China, Sci. Total Environ., 657, 1491–1500, https://doi.org/10.1016/j.scitotenv.2018.12.132, 2019. a
Hopkins, J. R., Lewis, A. C., and Read, K. A.: A two-column method for long-term monitoring of non-methane hydrocarbons (NMHCs) and oxygenated volatile organic compounds (o-VOCs), J. Environ. Monit., 5, 8–13, https://doi.org/10.1039/B202798D, 2003. a
Jobson, B., Alexander, M., Maupin, G., and Muntean, G.: On-line analysis of organic compounds in diesel exhaust using a proton transfer reaction mass spectrometer (PTR-MS), Int. J. Mass Spectrom., 245, 78–89, https://doi.org/10.1016/j.ijms.2005.05.009, 2005. a
Kemball-Cook, S., Bar-Ilan, A., Grant, J., Parker, L., Jung, J., Santamaria, W., Mathews, J., and Yarwood, G.: Ozone Impacts of Natural Gas Development in the Haynesville Shale, Environ. Sci. Technol., 44, 9357–9363, https://doi.org/10.1021/es1021137, 2010. a
Koss, A., Yuan, B., Warneke, C., Gilman, J. B., Lerner, B. M., Veres, P. R., Peischl, J., Eilerman, S., Wild, R., Brown, S. S., Thompson, C. R., Ryerson, T., Hanisco, T., Wolfe, G. M., Clair, J. M. St., Thayer, M., Keutsch, F. N., Murphy, S., and de Gouw, J.: Observations of VOC emissions and photochemical products over US oil- and gas-producing regions using high-resolution H3O+ CIMS (PTR-ToF-MS), Atmos. Meas. Tech., 10, 2941–2968, https://doi.org/10.5194/amt-10-2941-2017, 2017. a, b
Langford, B., Davison, B., Nemitz, E., and Hewitt, C. N.: Mixing ratios and eddy covariance flux measurements of volatile organic compounds from an urban canopy (Manchester, UK), Atmos. Chem. Phys., 9, 1971–1987, https://doi.org/10.5194/acp-9-1971-2009, 2009. a, b, c, d
Lee, J. D., Mobbs, S. D., Wellpott, A., Allen, G., Bauguitte, S. J.-B., Burton, R. R., Camilli, R., Coe, H., Fisher, R. E., France, J. L., Gallagher, M., Hopkins, J. R., Lanoiselle, M., Lewis, A. C., Lowry, D., Nisbet, E. G., Purvis, R. M., O'Shea, S., Pyle, J. A., and Ryerson, T. B.: Flow rate and source reservoir identification from airborne chemical sampling of the uncontrolled Elgin platform gas release, Atmos. Meas. Tech., 11, 1725–1739, https://doi.org/10.5194/amt-11-1725-2018, 2018. a, b
Liu, Y., Wang, H., Jing, S., Gao, Y., Peng, Y., Lou, S., Cheng, T., Tao, S., Li, L., Li, Y., Huang, D., Wang, Q., and An, J.: Characteristics and sources of volatile organic compounds (VOCs) in Shanghai during summer: Implications of regional transport, Atmos. Environ., 215, 116902, https://doi.org/10.1016/j.atmosenv.2019.116902, 2019. a
Masnadi, M. S., El-Houjeiri, H. M., Schunack, D., Li, Y., Englander, J. G., Badahdah, A., Monfort, J.-C., Anderson, J. E., Wallington, T. J., Bergerson, J. A., Gordon, D., Koomey, J., Przesmitzki, S., Azevedo, I. L., Bi, X. T., Duffy, J. E., Heath, G. A., Keoleian, G. A., McGlade, C., Meehan, D. N., Yeh, S., You, F., Wang, M., and Brandt, A. R.: Global carbon intensity of crude oil production, Science, 361, 851–853, https://doi.org/10.1126/science.aar6859, 2018. a
McGaughey, G. R., Desai, N. R., Allen, D. T., Seila, R. L., Lonneman, W. A., Fraser, M. P., Harley, R. A., Pollack, A. K., Ivy, J. M., and Price, J. H.: Analysis of motor vehicle emissions in a Houston tunnel during the Texas Air Quality Study 2000, Atmos. Environ., 38, 3363–3372, https://doi.org/10.1016/j.atmosenv.2004.03.006, 2004. a
McKenzie, L. M., Witter, R. Z., Newman, L. S., and Adgate, J. L.: Human health risk assessment of air emissions from development of unconventional natural gas resources, Sci. Total Environ., 424, 79–87, https://doi.org/10.1016/j.scitotenv.2012.02.018, 2012. a
Miller, S. M., Wofsy, S. C., Michalak, A. M., Kort, E. A., Andrews, A. E., Biraud, S. C., Dlugokencky, E. J., Eluszkiewicz, J., Fischer, M. L., Janssens-Maenhout, G., Miller, B. R., Miller, J. B., Montzka, S. A., Nehrkorn, T., and Sweeney, C.: Anthropogenic emissions of methane in the United States, P. Natl. Acad. Sci. USA, 110, 20018–20022, https://doi.org/10.1073/pnas.1314392110, 2013. a
Nara, H., Tanimoto, H., Tohjima, Y., Mukai, H., Nojiri, Y., and Machida, T.: Emissions of methane from offshore oil and gas platforms in Southeast Asia, Sci. Rep., 4, 6503, https://doi.org/10.1038/srep06503, 2014. a
NLOG: The Netherlands oil and gas field outlines, available at: https://worldmap.harvard.edu/data/geonode:netherlands_oil_and_gas_field_outlines_4p0 (last access: 21 January, 2020), 2014. a
Norwegian Petroleum Directorate: Production Forecasts, available at: https://www.norskpetroleum.no/en/production-and-exports/production-forecasts/ (last access: 23 June 2020), 2020a. a
Norwegian Petroleum Directorate: Map services, available at: https://www.npd.no/en/about-us/information-services/available-data/map-services/ (last access: 20 January 2020), 2020b. a
OGA: Offshore Fields WGS84, available at: https://data-ogauthority.opendata.arcgis.com/datasets/oga-offshore-fields-wgs84 (last access: 13 November 2019), 2019. a
Oil and Gas Authority: Projections of UK Oil and Gas Production and Expenditure, available at: https://www.ogauthority.co.uk/news-publications/publications/2019/projections-of-uk-oil-and-gas-production-and-expenditure-2018-report/ (last access: 8 March 2021), 2019. a
Oil and Gas UK: Environment report, availble at: https://oilandgasuk.co.uk/wp-content/uploads/2019/07/Environment-Report-2019-under-embargo-24-July.pdf (last access: 8 March 2021), 2019. a
O'Shea, S. J., Bauguitte, S. J.-B., Gallagher, M. W., Lowry, D., and Percival, C. J.: Development of a cavity-enhanced absorption spectrometer for airborne measurements of CH4 and CO2, Atmos. Meas. Tech., 6, 1095–1109, https://doi.org/10.5194/amt-6-1095-2013, 2013. a
Passant, N. R.: Speciation of UK emissions of non-methane volatile organic compounds. AEA Technology Report ENV-0545, Culham, Abingdon, UK, 2002. a, b, c
Pétron, G., Frost, G., Miller, B. R., Hirsch, A. I., Montzka, S. A., Karion, A., Trainer, M., Sweeney, C., Andrews, A. E., Miller, L., Kofler, J., Bar-Ilan, A., Dlugokencky, E. J., Patrick, L., Moore Jr., C. T., Ryerson, T. B., Siso, C., Kolodzey, W., Lang, P. M., Conway, T., Novelli, P., Masarie, K., Hall, B., Guenther, D., Kitzis, D., Miller, J., Welsh, D., Wolfe, D., Neff, W., and Tans, P.: Hydrocarbon emissions characterization in the Colorado Front Range: A pilot study, J. Geophys. Res.-Atmos., 117, D04304, https://doi.org/10.1029/2011JD016360, 2012. a
Pitt, J. R., Le Breton, M., Allen, G., Percival, C. J., Gallagher, M. W., Bauguitte, S. J.-B., O'Shea, S. J., Muller, J. B. A., Zahniser, M. S., Pyle, J., and Palmer, P. I.: The development and evaluation of airborne in situ N2O and CH4 sampling using a quantum cascade laser absorption spectrometer (QCLAS), Atmos. Meas. Tech., 9, 63–77, https://doi.org/10.5194/amt-9-63-2016, 2016. a
Riaz, M., Kontogeorgis, G. M., Stenby, E. H., Yan, W., Haugum, T., Christensen, K. O., Løkken, T. V., and Solbraa, E.: Measurement of Liquid-Liquid Equilibria for Condensate + Glycol and Condensate + Glycol + Water Systems, J. Chem. Eng. Data, 56, 4342–4351, https://doi.org/10.1021/je200158c, 2011. a
Rich, A., Grover, J. P., and Sattler, M. L.: An exploratory study of air emissions associated with shale gas development and production in the Barnett Shale, J. Air Waste Manag. Assoc., 64, 61–72, https://doi.org/10.1080/10962247.2013.832713, 2014. a
Rich, A. L. and Orimoloye, H. T.: Elevated Atmospheric Levels of Benzene and Benzene-Related Compounds from Unconventional Shale Extraction and Processing: Human Health Concern for Residential Communities, Environmental Health Insights, 10, 75–82, https://doi.org/10.4137/EHI.S33314, 2016. a
Ruppert, L. F., Ryder, R. T., Survey, U. S. G., Burruss, R. A., and Ryder, R. T.: Composition of natural gas and crude oil produced from 14 wells in the Lower Silurian “Clinton” Sandstone and Medina Group Sandstones, northeastern Ohio and northwestern Pennsylvania: Chapter G.6 in Coal and petroleum resources in the Appalachian basin: distribution, geologic framework, and geochemical character, Technical Report, US Geological Review, Reston, USA, 38 pp., 2014. a
Ryerson, T. B., Aikin, K. C., Angevine, W. M., Atlas, E. L., Blake, D. R., Brock, C. A., Fehsenfeld, F. C., Gao, R.-S., de Gouw, J. A., Fahey, D. W., Holloway, J. S., Lack, D. A., Lueb, R. A., Meinardi, S., Middlebrook, A. M., Murphy, D. M., Neuman, J. A., Nowak, J. B., Parrish, D. D., Peischl, J., Perring, A. E., Pollack, I. B., Ravishankara, A. R., Roberts, J. M., Schwarz, J. P., Spackman, J. R., Stark, H., Warneke, C., and Watts, L. A.: Atmospheric emissions from the Deepwater Horizon spill constrain air-water partitioning, hydrocarbon fate, and leak rate, Geophys. Res. Lett., 38, L07803, https://doi.org/10.1029/2011GL046726, 2011. a, b
Simpson, I. J., Blake, N. J., Barletta, B., Diskin, G. S., Fuelberg, H. E., Gorham, K., Huey, L. G., Meinardi, S., Rowland, F. S., Vay, S. A., Weinheimer, A. J., Yang, M., and Blake, D. R.: Characterization of trace gases measured over Alberta oil sands mining operations: 76 speciated C2–C10 volatile organic compounds (VOCs), CO2, CH4, CO, NO, NO2, NOy, O3 and SO2, Atmos. Chem. Phys., 10, 11931–11954, https://doi.org/10.5194/acp-10-11931-2010, 2010. a, b
South, A.: rnaturalearth: World Map Data from Natural Earth, r package version 0.1.0, available at: https://CRAN.R-project.org/package=rnaturalearth (last access: 14 January 2021), 2017. a
Speight, J. G.: Unconventional gas, in: Natural Gas, edited by: Speight, J. G., Gulf Professional Publishing, Boston, USA, 59–98, https://doi.org/10.1016/B978-0-12-809570-6.00003-5, 2019. a
Statistica: Number of offshore rigs worldwide as of January 2018 by region, available at: https://www.statista.com/statistics/279100/number-of-offshore-rigs-worldwide-by-region/ (last ccess: 22 June 2020), 2018. a
Swarthout, R. F., Russo, R. S., Zhou, Y., Hart, A. H., and Sive, B. C.: Volatile organic compound distributions during the NACHTT campaign at the Boulder Atmospheric Observatory: Influence of urban and natural gas sources, J. Geophys. Res.-Atmos., 118, 10614–10637, https://doi.org/10.1002/jgrd.50722, 2013. a, b, c
Thompson, C. R., Hueber, J., and Helmig, D.: Influence of oil and gas emissions on ambient atmospheric non-methane hydrocarbons in residential areas of Northeastern Colorado, Elem. Sci. Anth., 3, 35, https://doi.org/10.12952/journal.elementa.000035, 2014. a, b
von Schneidemesser, E., Monks, P. S., and Plass-Duelmer, C.: Global comparison of VOC and CO observations in urban areas, Atmos. Environ., 44, 5053–5064, https://doi.org/10.1016/j.atmosenv.2010.09.010, 2010. a, b
Warneke, C., van der Veen, C., Luxembourg, S., de Gouw, J., and Kok, A.: Measurements of benzene and toluene in ambient air using proton-transfer-reaction mass spectrometry: calibration, humidity dependence, and field intercomparison, Int. J. Mass Spectrom., 207, 167–182, https://doi.org/10.1016/S1387-3806(01)00366-9, 2001. a
Warneke, C., Geiger, F., Edwards, P. M., Dube, W., Pétron, G., Kofler, J., Zahn, A., Brown, S. S., Graus, M., Gilman, J. B., Lerner, B. M., Peischl, J., Ryerson, T. B., de Gouw, J. A., and Roberts, J. M.: Volatile organic compound emissions from the oil and natural gas industry in the Uintah Basin, Utah: oil and gas well pad emissions compared to ambient air composition, Atmos. Chem. Phys., 14, 10977–10988, https://doi.org/10.5194/acp-14-10977-2014, 2014. a, b, c
Washenfelder, R. A., Trainer, M., Frost, G. J., Ryerson, T. B., Atlas, E. L., de Gouw, J. A., Flocke, F. M., Fried, A., Holloway, J. S., Parrish, D. D., Peischl, J., Richter, D., Schauffler, S. M., Walega, J. G., Warneke, C., Weibring, P., and Zheng, W.: Characterization of NOx, SO2, ethene, and propene from industrial emission sources in Houston, Texas, J. Geophys. Res., 115, D16311, https://doi.org/10.1029/2009jd013645, 2020. a
Williams, J. and Koppmann, R.: Volatile Organic Compounds in the Atmosphere: An Overview, John Wiley and Sons, Hoboken, New Jersey, USA, https://doi.org/10.1002/9780470988657.ch1, 2007. a
Xiao, Q., Li, M., Liu, H., Fu, M., Deng, F., Lv, Z., Man, H., Jin, X., Liu, S., and He, K.: Characteristics of marine shipping emissions at berth: profiles for particulate matter and volatile organic compounds, Atmos. Chem. Phys., 18, 9527–9545, https://doi.org/10.5194/acp-18-9527-2018, 2018. a
Yacovitch, T. I., Herndon, S. C., Roscioli, J. R., Floerchinger, C., McGovern, R. M., Agnese, M., Pétron, G., Kofler, J., Sweeney, C., Karion, A., Conley, S. A., Kort, E. A., Nähle, L., Fischer, M., Hildebrandt, L., Koeth, J., McManus, J. B., Nelson, D. D., Zahniser, M. S., and Kolb, C. E.: Demonstration of an Ethane Spectrometer for Methane Source Identification, Environ. Sci. Technol., 48, 8028–8034, https://doi.org/10.1021/es501475q, 2014. a, b, c, d, e
Yacovitch, T. I., Daube, C., and Herndon, S. C.: Methane Emissions from Offshore Oil and Gas Platforms in the Gulf of Mexico, Environ. Sci. Technol., 54, 3530–3538, https://doi.org/10.1021/acs.est.9b07148, 2020. a