the Creative Commons Attribution 4.0 License.
the Creative Commons Attribution 4.0 License.
 | 10 Mar 2021
Source apportionment and impact of long-range transport on carbonaceous aerosol particles in central Germany during HCCT-2010
Benjamin Fahlbusch
Gerald Spindler
Konrad Müller
Dominik van Pinxteren
Zhijun Wu
Yoshiteru Iinuma
Wolfram Birmili
Alfred Wiedensohler
The identification of different sources of the carbonaceous aerosol (organics and black carbon) was investigated at a mountain forest site located in central Germany from September to October 2010 to characterize incoming air masses during the Hill Cap Cloud Thuringia 2010 (HCCT-2010) experiment. The near-PM1 chemical composition, as measured by a high-resolution time-of-flight aerosol mass spectrometer (HR-ToF-AMS), was dominated by organic aerosol (OA; 41 %) followed by sulfate (19 %) and nitrate (18 %). Source apportionment of the OA fraction was performed using the multilinear engine (ME-2) approach, resulting in the identification of the following five factors: hydrocarbon-like OA (HOA; 3 % of OA mass), biomass burning OA (BBOA; 13 %), semi-volatile-like OA (SV-OOA; 19 %), and two oxygenated OA (OOA) factors. The more oxidized OOA (MO-OOA, 28 %) was interpreted as being influenced by aged, polluted continental air masses, whereas the less oxidized OOA (LO-OOA, 37 %) was found to be more linked to aged biogenic sources. Equivalent black carbon (eBC), measured by a multi-angle absorption photometer (MAAP) represented 10 % of the total particulate matter (PM). The eBC was clearly associated with HOA, BBOA, and MO-OOA factors (all together R2=0.83). Therefore, eBC's contribution to each factor was achieved using a multi-linear regression model. More than half of the eBC (52 %) was associated with long-range transport (i.e., MO-OOA), whereas liquid fuel eBC (35 %) and biomass burning eBC (13 %) were associated with local emissions, leading to a complete apportionment of the carbonaceous aerosol. The separation between local and transported eBC was well supported by the mass size distribution of elemental carbon (EC) from Berner impactor samples.
Air masses with the strongest marine influence, based on back trajectory analysis, corresponded with a low particle mass concentration (6.4–7.5 µg m−3) and organic fraction (≈30 %). However, they also had the largest contribution of primary OA (HOA ≈ 4 % and BBOA 15 %–20 %), which was associated with local emissions. Continental air masses had the highest mass concentration (11.4–12.6 µg m−3), and a larger fraction of oxygenated OA (≈45 %) indicated highly processed OA. The present results emphasize the key role played by long-range transport processes not only in the OA fraction but also in the eBC mass concentration and the importance of improving our knowledge on the identification of eBC sources.
- Article
(5018 KB) - Full-text XML
-
Supplement
(1924 KB) - BibTeX
- EndNote


Atmospheric aerosol particles affect global climate, through direct and indirect radiative forcing (IPCC, 2013), human health (Lelieveld et al., 2015; Burnett et al., 2014; Pope et al., 2011) and the ecosystems (Bohlmann et al., 2005; Jickells et al., 2005). The chemical composition of atmospheric particles at a specific sampling place (e.g., rural, urban, or marine environment) not only depends on the local environment and sources but is also influenced by the history of the particles reaching the sampling site. During transport, so-called aging processes not only modify the chemical composition of the particles but also affect their physical properties (e.g., size distribution, volatility, hygroscopicity, cloud condensation nuclei (CCN) activity, and optical properties; Donahue et al., 2014; Farmer et al., 2015; Moise et al., 2015). As a consequence, aerosol particles at a specific location result from a complex mixture of different sources combined with complex processing.
Carbonaceous aerosol particles are a dominant fraction of total particle mass and are made of a large number of chemical species, which can be divided into organic aerosol (OA) and black carbon (BC; e.g., Cabada et al., 2002). One of the most significant aerosol particle components influenced by atmospheric aging processes is the OA fraction, which can represent up to 90 % of the fine aerosol particle mass (e.g., Zhang et al., 2007). To better understand the origins of OA, source apportionment analysis is commonly applied to distinguish primary organic sources (e.g., related to fossil fuel, biomass, or coal combustion) from secondary organic aerosol (SOA) sources, based on either online measurements (e.g., Zhang et al., 2011; Canonaco et al., 2013), offline chemical analysis (e.g., van Pinxteren et al., 2016; Srivastava et al., 2018), or a combination of both (Srivastava et al., 2019). Black carbon is associated with primary emissions from the combustion processes of either anthropogenic (car, household heating, and industry) or biogenic (e.g., wildfires) origins. In contrast to OA, the identification of the different sources of BC is sparse, and only the recent development of an aethalometer model approach now allows us to distinguish equivalent BC (eBC) related to traffic emissions from wood combustion eBC (e.g., Sandradewi et al., 2008; Laborde et al., 2013; Zhu et al., 2018; Martinsson et al., 2017; Liakakou et al., 2020). Not only local sources drive the aerosol particle chemical composition; long-range transport, influenced by air mass origin, also plays an important role in local number size distribution and aerosol particle chemical composition (e.g., van Pinxteren et al., 2016, 2019; Waked et al., 2018). Therefore, not all the eBC mass concentration has to be linked to local sources, and a significant fraction can be attributed to long-range transport (e.g., Healy et al., 2012; van Pinxteren et al., 2019).
The present work investigates the aerosol particle chemical composition and the different sources of carbonaceous particles reaching a site close to the village of Goldlauter in the Thuringian forest in central Germany. The measurements took place during September–October 2010 as part of the Hill Cap Cloud Thuringia 2010 (HCCT-2010) experiment, which aimed to investigate the impact of cloud processing on aerosol physico-chemical properties. The Goldlauter site served as upwind site for studying air masses before they entered hill cap clouds at the Schmücke mountain. The present study focuses on an in-depth characterization at this site, while companion papers have related upwind site data to the other experiment sites (see, e.g., Harris et al., 2013, and https://www.atmos-chem-phys.net/special_issue287.html; last access: 15 February 2021). The presented results speak for themselves but can also be used to further interpret HCCT-2010 results and guide associated modeling and future experimental studies in the Schmücke area.
2.1 Site
For the Hill Cap Cloud Thuringia 2010 (HCCT-2010) experiment, the same places were used as for the FEBUKO/MODMEP experiments in 2001–2002 (Herrmann et al., 2005). This work is focused on measurements performed at the upwind site (10∘45'20” E, 50∘38'25” N; 605 m above sea level) and approximately 6 km from the nearest city of Suhl. The sampling place is located on the outskirts of the forest in front of the mountain site of Schmücke, under the prevailing southwesterly (SW) wind direction and about 350 m below the mountain site of Schmücke (see Tilgner et al., 2014, for more details). In the following, the upwind-site will be referred to as Goldlauter (GL). All times in the paper are given in central European summer time (CEST).
2.2 Instrumentation
A large setup of online and offline instruments was deployed during HCCT-2010, covering both gas and particle phases. Online instruments were positioned in two nearby laboratory containers and were operated continuously during the entire campaign. On the other hand, offline sampling systems were applied only during specific intensive observation periods (IOPs) associated with the following two different conditions: (1) SW wind direction and the presence of cloud at the Schmücke mountain site for the full cloud events (FCEs) and (2) SW or northeasterly (NE) wind direction and no clouds or fog at any site for the non-cloud events (NCEs). A detailed overview of these events is given by Tilgner et al. (2014).
2.2.1 Gas-phase measurements
The trace gases O3, SO2, and NOx (NO and NO2) were quantified continuously using standard gas monitor systems for the duration of the experiment (Table SI-1 in the Supplement). Non-methane hydrocarbon sampling (NMHC) was carried out with stainless steel containers every 2 h during IOP events only. Ambient air was sucked into the container for 3 min before closing the valves. Analysis of the NMHC was carried out by the German Federal Environmental Protection Agency (UBA) at their laboratory at Schmücke (UBA and Global Atmosphere Watch (GAW) site), within 72 h after sampling, using a gas chromatography flame ionization detector analysis (Rappenglück et al., 2006). The cleaning of the stainless-steel container was carried out overnight through heating and evacuating.
Additionally, a Monitor for AeRosol and Gases in Ambient Air (MARGA 1S ADI 208; Metrohm AG, Switzerland; Rumsey et al., 2014; Twigg et al., 2015; Stieger et al., 2017 ) connected to a Teflon-coated PM10 inlet was deployed for the detection of the major water-soluble inorganic compounds in both the gas phase and particle phase. A good correlation for the MARGA SO2 and the UV fluorescence monitor was reported to be in agreement with previous works from Makkonen et al. (2012) and Stieger et al. (2017).
2.2.2 Aerosol particle measurements
Online aerosol particle measurements
The online physico-chemical characterization of the ambient aerosol particles was performed using a large set of instruments, including a high-resolution time-of-flight aerosol mass spectrometer (HR-ToF-AMS, later referred to as AMS; Aerodyne Research, Inc.; DeCarlo et al., 2006), a dual mobility particle size spectrometer (TROPOS-type T-MPSS; Birmili et al., 1999), a multi-angle absorption photometer (MAAP; model 5012, Thermo Fisher Scientific; Petzold and Schönlinner, 2004), and a three-wavelength nephelometer (model 3563; TSI Incorporated; Heintzenberg et al., 2006). All of these instruments were located in the same laboratory container and connected to the same sampling inlet consisting of a PM10 inlet, located approximately 6 m above ground level, directly followed by an automatic aerosol diffusion dryer system maintaining the relative humidity in the sampling line below 30 % (Tuch et al., 2009). Moreover, water-soluble PM10 inorganic ions were also measured by MARGA.
AMS data analysis and positive matrix factorization
The AMS data were processed with SQUIRREL, version 1.52L, and PIKA, version 1.13B (downloaded from http://cires.colorado.edu/jimenez-group/ToFAMSResources/ToFSoftware, last access: 15 February 2021), using the Igor Pro software package (WaveMetrics, Inc., Portland, OR, USA). A chemical-dependent collection efficiency (CDCE) correction was applied on the AMS mass concentration according to Middlebrook et al. (2012). Quality assurance on the AMS data was achieved by comparing it to the MARGA and Berner impactors (sum of the first three stages) for individual species, while mass closure of the PM1 aerosol particle chemical mass concentration, as measured by the AMS and MAAP, was achieved by comparing it to the estimated mass concentration from the T-MPSS and Berner impactors. Description and results can be found in Sect. 3.1.2 and 3.1.3 and in the Supplement SI-3 (AMS data validation; see Figs. SI-1 to SI-5).
Source apportionment was performed on the high-resolution organic mass spectra data set using the multi-linear engine (ME-2) model developed by Paatero (1999) and using the source finder tool (Sofi4.9; Canonaco et al., 2013) developed at the Paul Scherrer Institute (PSI, Switzerland). Prior to analysis, the high-resolution organic mass spectra matrix was prepared according to the recommendations of Ulbrich et al. (2009). Isotope ions, which are calculated as a constant fraction of the parent ion, were removed. A minimum counting error was applied, and ions with a signal-to-noise (SNR) ratio between 0.2 < SNR <2 were downweighted by a factor of 2, and ions with SNR <0.2 were downweighted by a factor of 10. Finally, ions related to CO were also downweighted since they are calculated as a fraction of the ion CO (Allan et al., 2004). The source apportionment was made following the recommendation of Crippa et al. (2014). In a first step, a non-constrained model approach was investigated. Since primary factors were not properly resolved during this first approach, a partially constrained approach was then investigated. Elemental analysis of the identified mass spectra was performed using the analytical procedure for elemental separation (APES 1.06), based on Aiken et al. (2008) and including the improved approach from Canagaratna et al. (2015). A detailed description of the source apportionment analysis can be found in Sect. SI-5.
Offline aerosol collection by five-stage Berner impactors and laboratory analysis
Parallel to the online measurements, a five-stage Berner low-pressure impactor (LPI 80/0.05/2.9; Hauke–MP GmbH, Austria; Berner and Lurzer, 1980) was used to collect PM size segregated, during the IOPs, using a humidity-controlled inlet (RH <80 %). Water-soluble ions, organic carbon (OC), elemental carbon (EC), sugar, and anhydrosaccharide analyses were performed. Details on the sampling conditions, sample preparation, and analytical methods can be found in the Supplement (Sect. SI-2). In the following, only the results of IOPs longer than 2 h are considered in order to collect enough material on each stage of the impactor. Details on the sampling period for each considered IOP are provided in a dedicated section in the Supplement and in Table SI-2.
2.3 Back trajectories and cluster calculations
The 96 h back trajectories were used to determine the influence of the air mass origin of aerosol. The trajectories were calculated for every hour from 13 September 2010 until 24 October 2010 for the altitude of 500 m above model ground with the NOAA Hybrid Single Particle Lagrangian Integrated Trajectory (HYSPLIT 4) model (http://www.ready.noaa.gov/ready/hysplit4.html, last access: 15 February 2021; Draxler and Hess, 2004), using the 1∘ resolution Global Data Assimilation System (GDAS) input data. The different back trajectory clusters were calculated using the program R (http://www.r-project.org/, last access: 15 February 2021; R Core Team, 2013) with the openair package (https://davidcarslaw.github.io/openair/, last access: 15 February 2021; Carslaw and Ropkins, 2012; Ropkins and Carslaw, 2012). The same GDAS input data were used to retrieve the boundary layer height (BLH) at the sampling site from the HYSPLIT model output.
Data analysis will first focus on the overall aerosol particle chemical composition and mass closure. The second part will discuss the source apportionment of both organic aerosol and eBC. Finally, the third section will investigate the influence of the air mass origins on aerosol particle chemical composition and size distribution.
3.1 Aerosol particle chemical composition
3.1.1 Overall AMS–MAAP time series
Aerosol particle chemical composition (mass concentration and mass fraction), as measured by AMS and MAAP, and the particle number size distribution over the entire time period are shown in Fig. 1. On average, the near-PM1 particulate chemical composition was principally made up of organic aerosol (OA; 41 % of the total mass; Fig. 1). Sulfate and nitrate have quite similar contributions (19 % and 18 %, respectively). The rest of the aerosol particle mass concentration was made up of ammonium (11 %), eBC (10.0 %), and chloride (1 %). Despite their similar contribution to the particle mass fraction, sulfate and nitrate showed a clear time dependency (Fig. 1). Although sulfate dominates the inorganic fraction at the beginning of the measurement period, nitrate becomes more important over time. This can be directly linked to a decrease in temperature during the sampling period (Fig. SI-6), which induces a change in the nitrate partitioning between gas and particle phase. A last factor that must be considered is the decrease in solar radiation from summer to winter, which influences the photochemical formation of sulfate. A variation in the BLH over the sampling period can also influence the local PM mass concentration (Fig. 1). At the beginning of the campaign, the BLH reached above 1000 m during daytime, while the maximum altitude of the BLH decreased to below 800 m later on. This decrease in the maximum altitude of the BLH certainly contributes to the observed increase in the overall PM mass concentration during the day by reducing the ventilation effect. However, it is important to note that high uncertainties with respect to the absolute value of the BLH for such a mountainous area have to be expected due to the 1∘ resolution of the GDAS input data. Variations of the organics and eBC mass concentration over the sampling period will be discussed in Sect. 3.2 and 3.3, respectively.
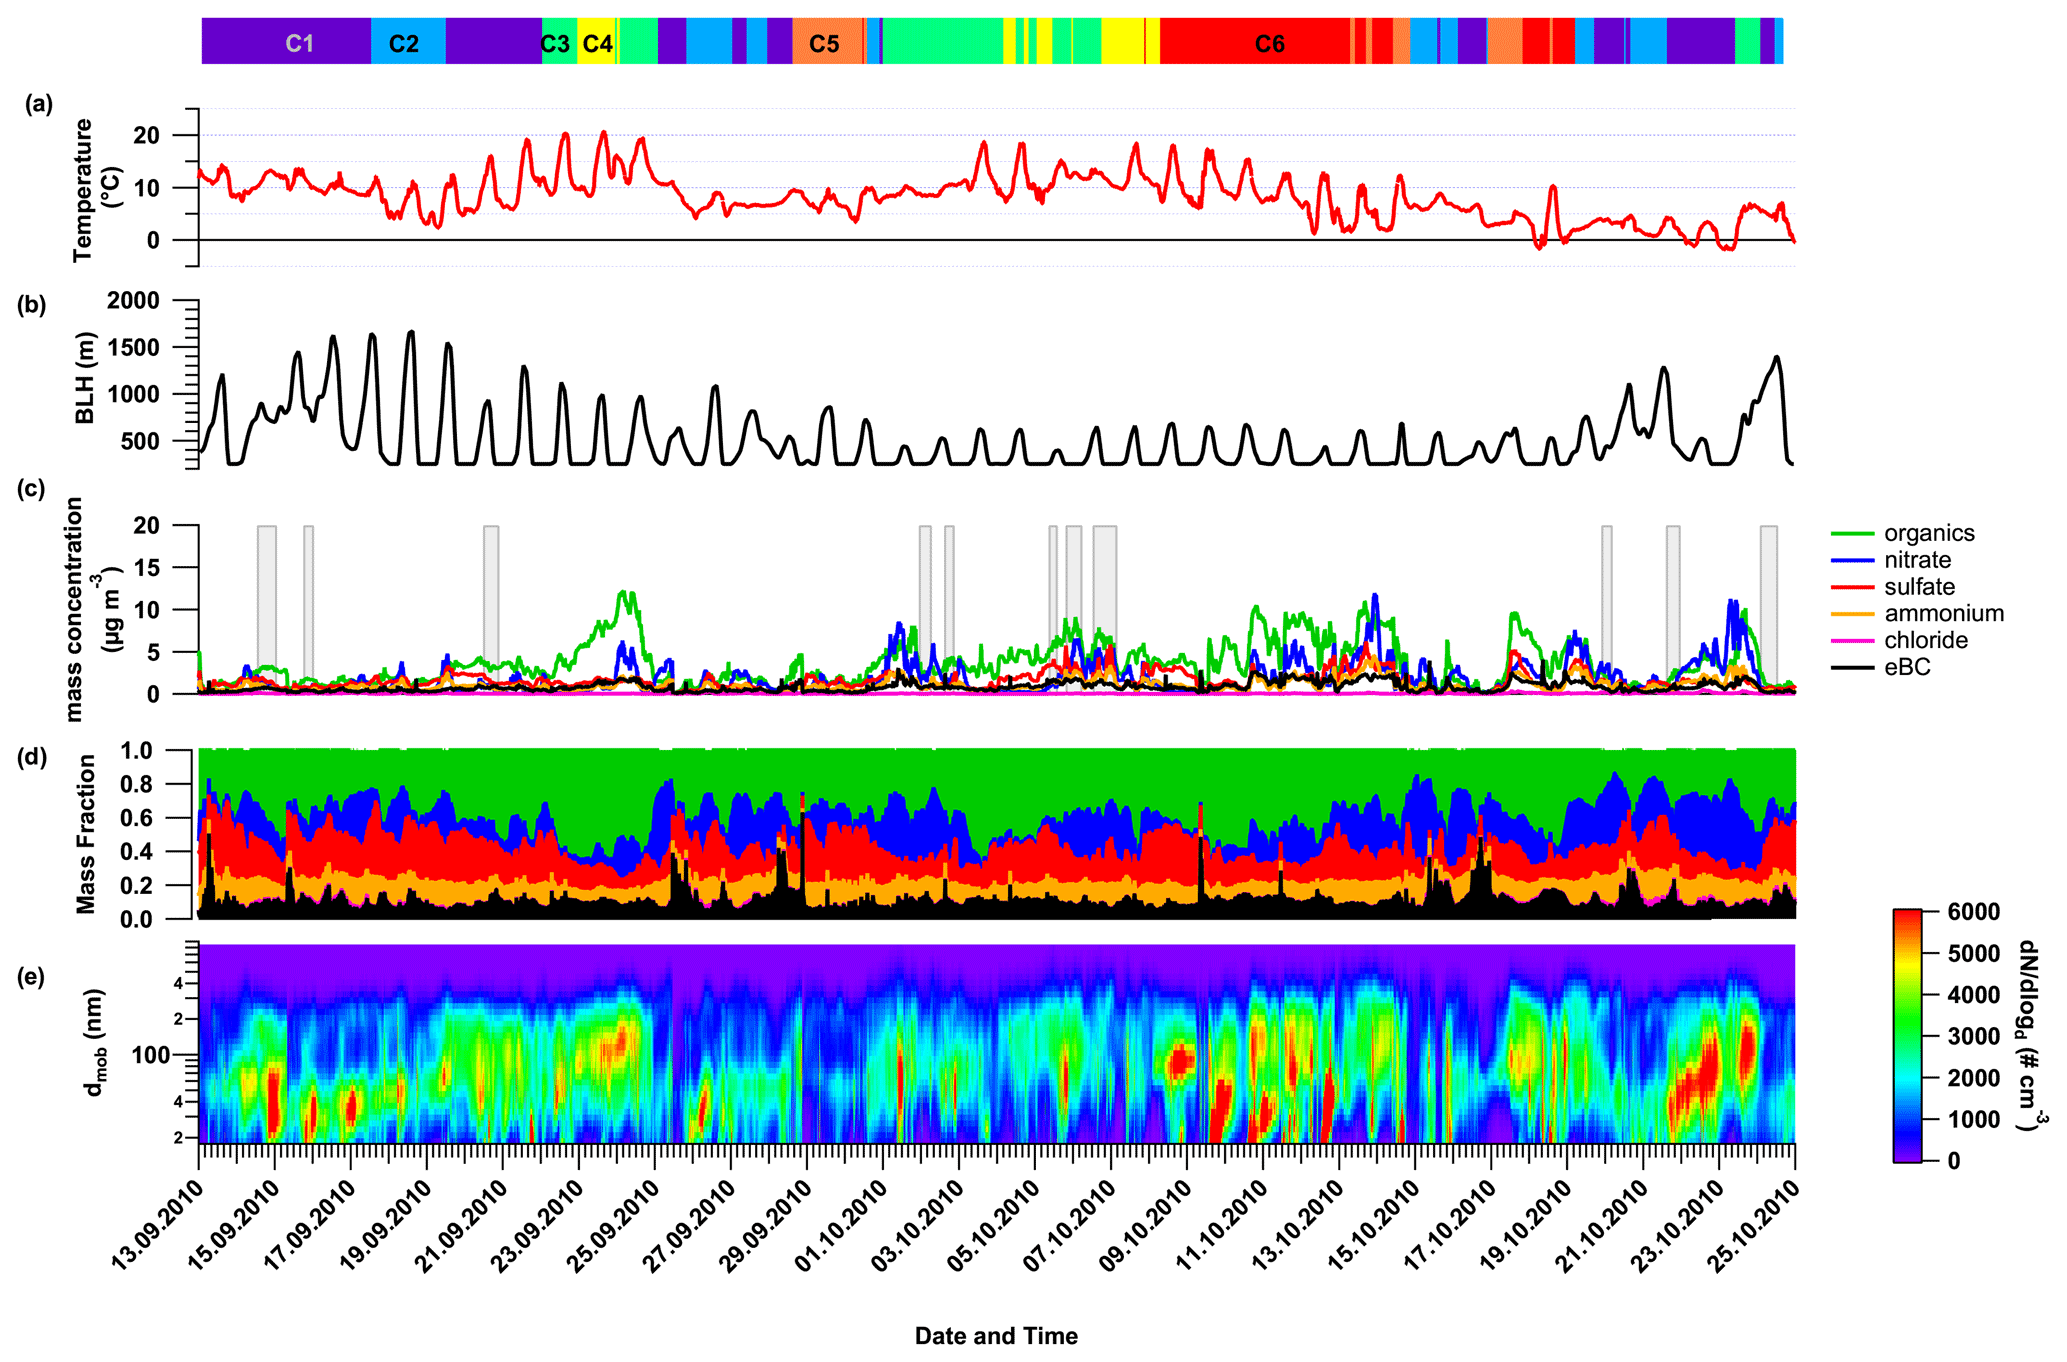
Figure 1Time series of the ambient temperature (a), estimated boundary layer height (BLH) obtained from HYSPLIT GDAS input (b), the particulate near-PM1 chemical composition as measured by the AMS and completed by MAAP for equivalent black carbon (c), the corresponding mass fraction (d), and the particle number size distribution (e) during HCCT-2010 at the site of Goldlauter. The colored bars and numbers at the top refer to the six different air mass clusters (see Sect. 3.4), and the gray bars refer to the different cloud and non-cloud events, as defined in Table SI-2.
3.1.2 Berner impactor data
Parallel to the online measurements, the Berner impactor provides size-resolved chemical composition up to 10 µm (Fig. 2). Over the samples, PM1.2 mass concentration (sum of the first three stages) represents more than 75 % of the PM10. The only exceptions are for FCE 1.1, NCE 0.1, NCE 0.2, and NCE 0.3, which are all associated with back trajectory clusters C1 (west) and maritime air masses (see Sect. 3.4). However, it is important to note that such aged maritime air masses do not systematically include an important super-µm fraction (e.g., FCE 22.1). A simple reason for that is that there is a washout of the air mass during rain events before it reaches the sampling site. A systematic look at the PM1.2 to PM10 ratio for the main aerosol component shows that EC and sulfate are principally present in the PM1.2 (>80 % each), while OC-PM1.2 represents more than 60 % of the PM10 mass concentration. Nitrate is the only species that has a strong variability in the PM1.2 to PM10 ratio, ranging from 20 to >90 %).
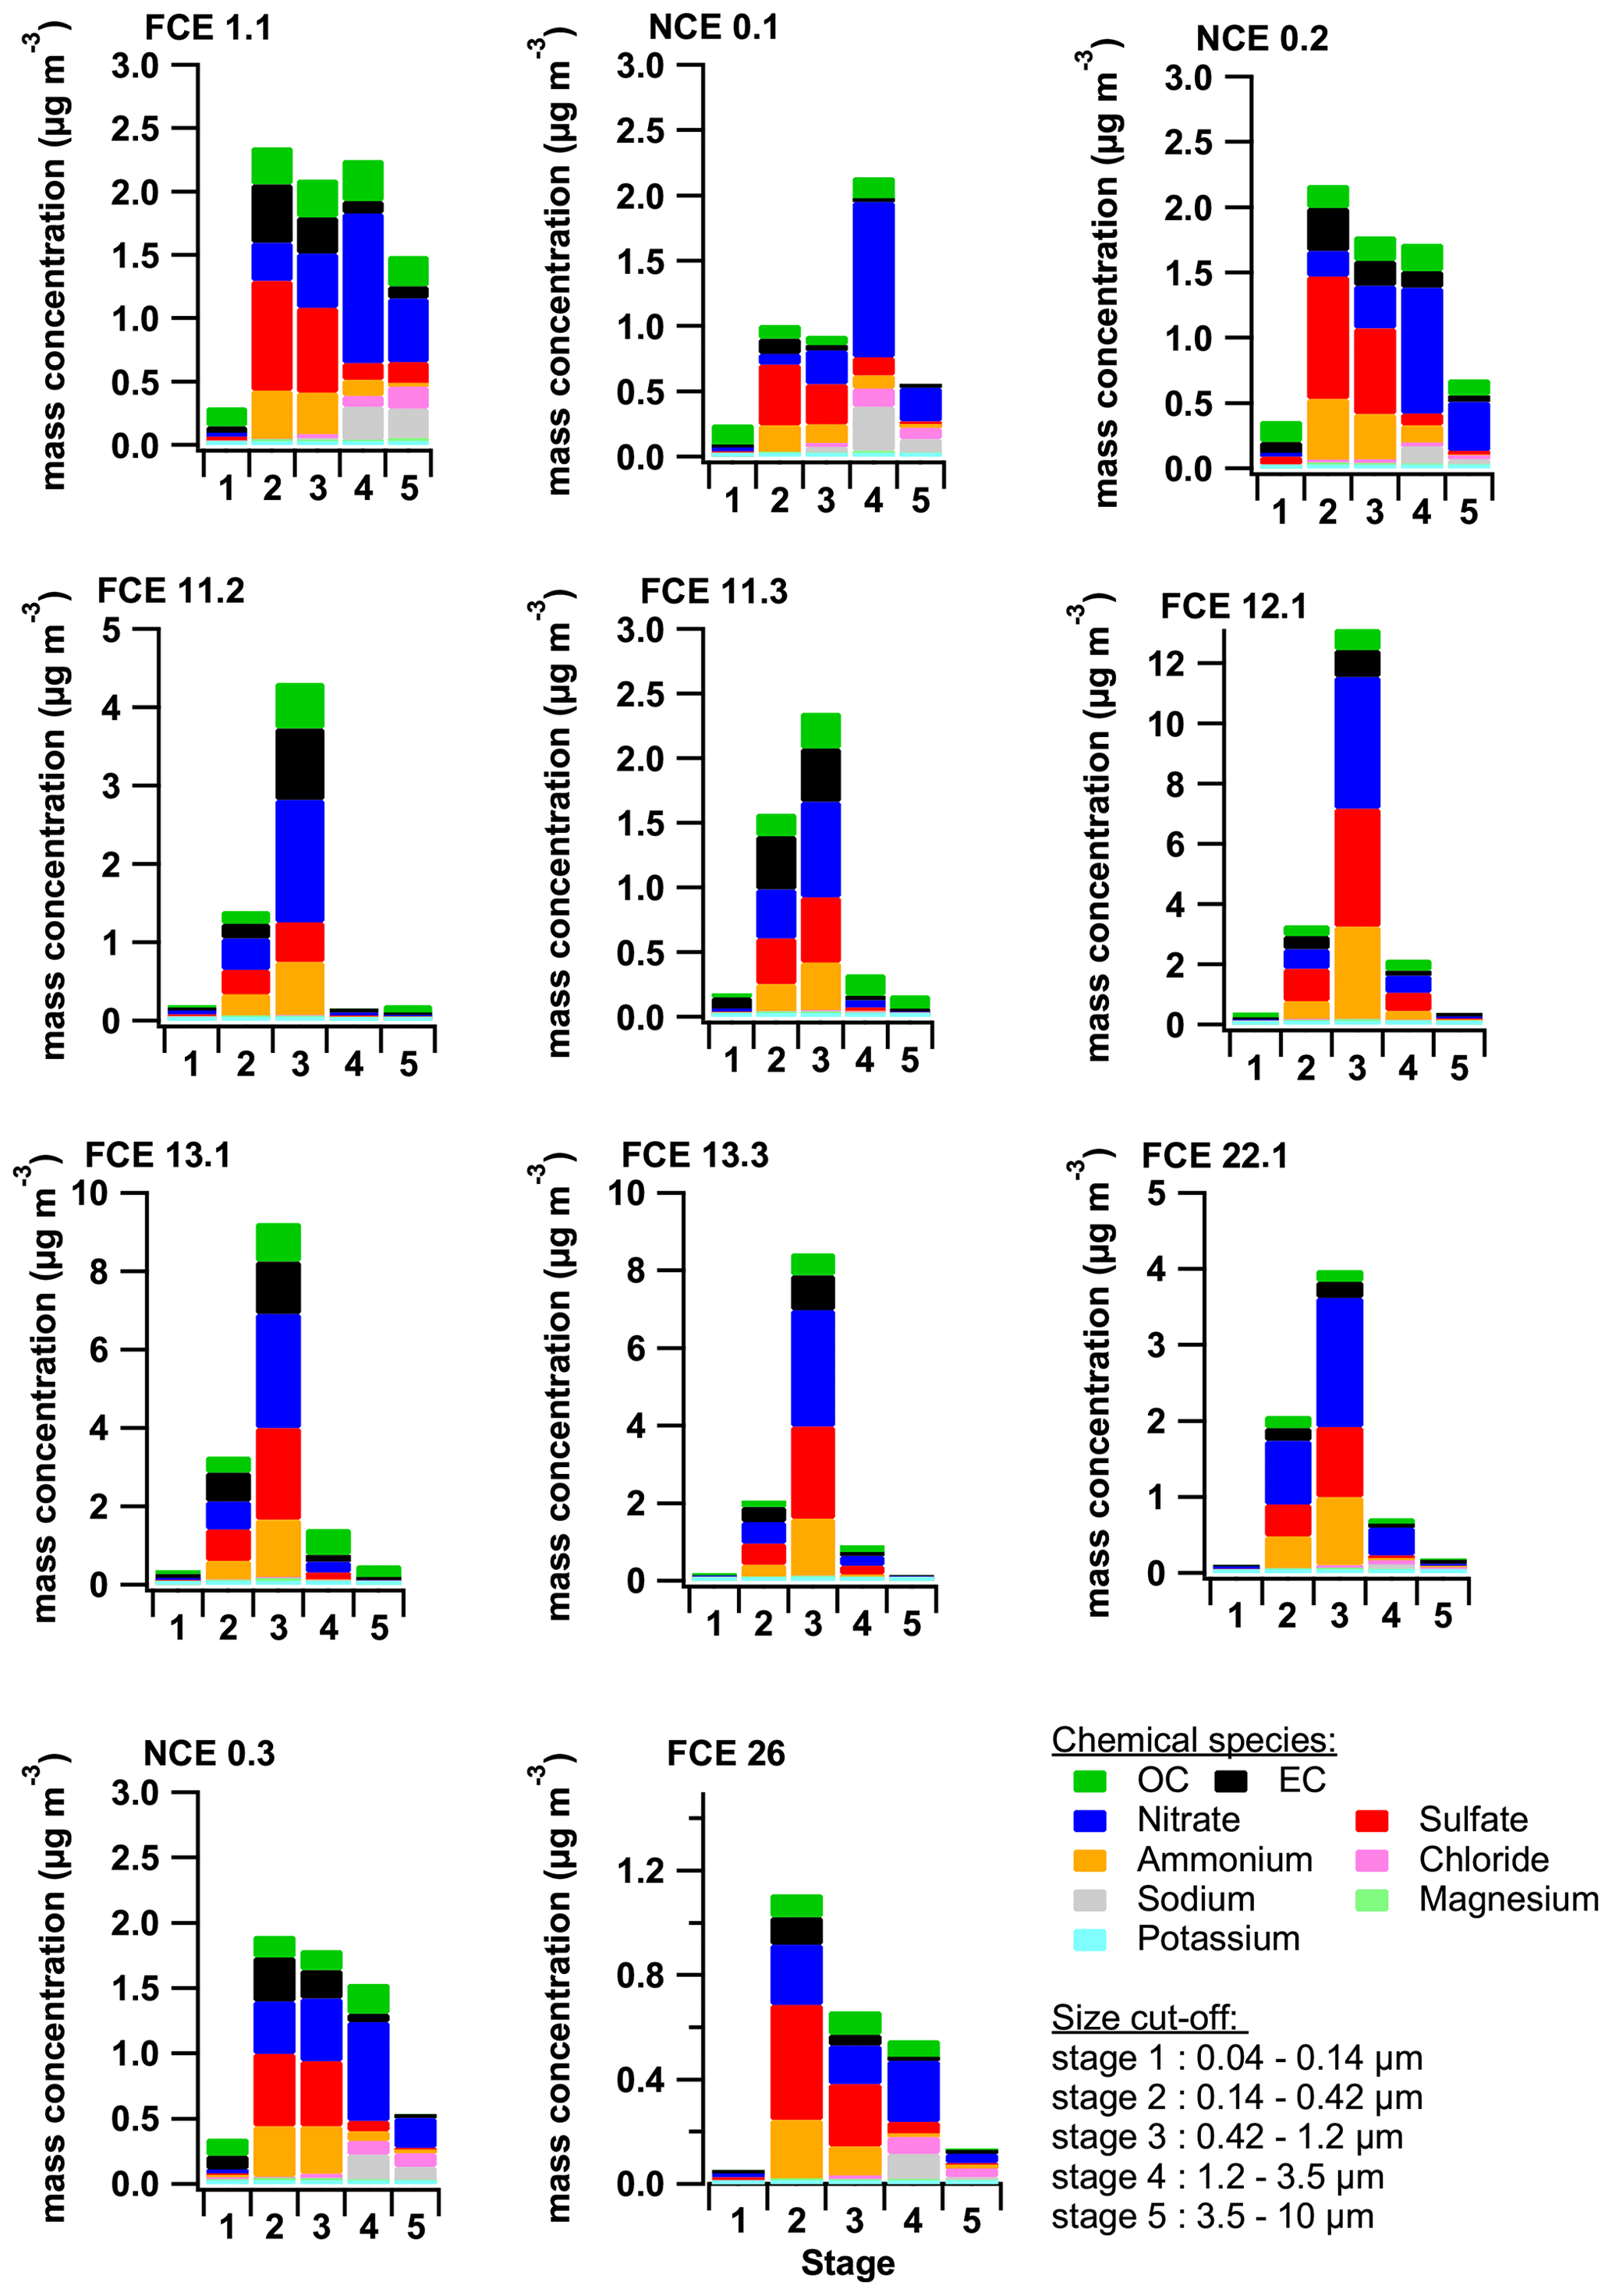
Figure 2Size distribution of OC, EC, and major water-soluble ions from Berner impactor measurements for the different full cloud events (FCE) and non-cloud events (NCE).
3.1.3 AMS comparison with MARGA
According to the large contribution of the PM1.2 mass concentration to PM10 discussed above, and despite their respective size cut-off, AMS and MARGA were successfully compared for ammonium, nitrate, and sulfate (Figs. 3, SI-2 and SI-3), indicating that these compounds were principally present in the PM1 size range. In spite of the observed agreement, certain limitations must be considered. For example, the presence of organo-nitrates (ONs) and organo-sulfates (OSs) can interfere with the quantification of inorganic nitrate and sulfate by the AMS (Farmer et al., 2010; Bruns et al., 2010). The presence of such compounds might explain the slight overestimation of the AMS nitrate (Fig. 3) and sulfate (Fig. SI-2) that happens from time to time when they are compared to MARGA.
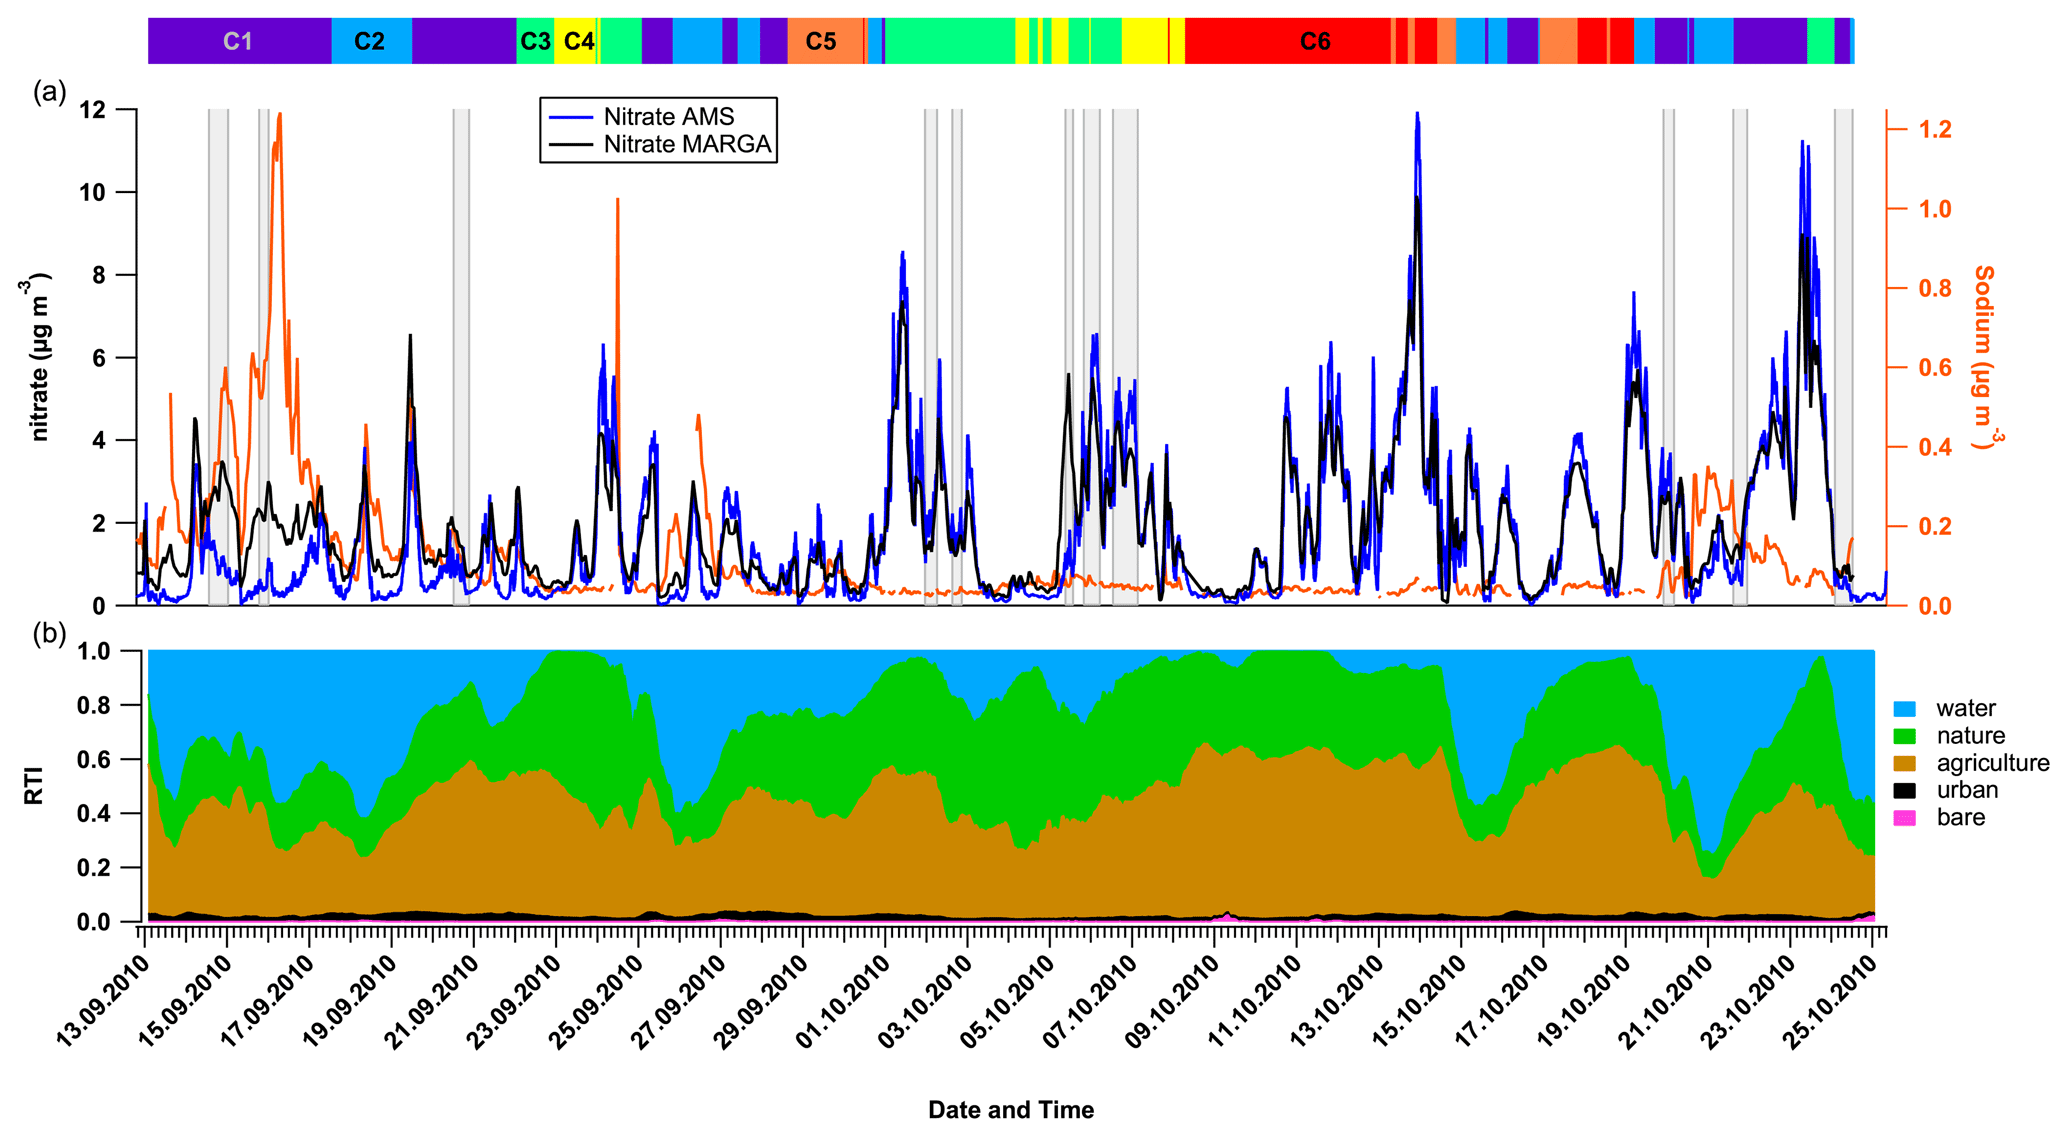
Figure 3Influence of marine air masses on nitrate size distribution. (a) Nitrate mass concentrations measured by AMS and MARGA and sodium mass concentrations by MARGA. (b) The residence time index (RTI) of the 96 h backward trajectories above different land cover, as developed by van Pinxteren et al. (2010). The colored bars and numbers at the top refer to the six different air mass clusters (see Sect. 3.4), and the gray bars refer to the different cloud and non-cloud events, as defined in Table SI-2.
Additionally, some specific periods were also found in which the nitrate mass concentration measured by the MARGA appears to be higher and not related to the one measured by the AMS (Fig. 3). This clearly indicates a larger contribution of super-µm particles that are not detected by the AMS, as previously reported for the Berner impactor samples. During these periods, MARGA's nitrate contains a larger fraction of sodium nitrate, which originates during the aging of marine aerosol when it crosses polluted areas (e.g., Dasgupta et al., 2007), as confirmed by both the concomitant increase in sodium mass concentration, and the attribution of these periods to marine influence clusters (C1 – west; C2 – northwest) with RTIwater above 0.5 (Fig. 3 and further discussion in Sect. 3.4). Stieger et al. (2018) drew similar conclusions by comparing the MARGA PM10 measurements with an aerosol chemical speciation monitor (ACSM) at the research site of Melpitz in rural Germany. The very good results for the sulfate are also supported by its size distribution inside the Berner impactor samples.
3.1.4 Overall result of PM analysis
AMS, MARGA, and MAAP measurements provide complementary information on the aerosol particle chemical composition. Therefore, eBC from MAAP, organics from AMS, and inorganic ions from MARGA were combined to provide a comprehensive picture of the ambient PM10 particle composition (Fig. 4) in a similar way to Schlag et al. (2016). The main advantage of combining these three instruments is to provide a more detailed description of the ambient particles than if they were used individually. However, the following limitations must be considered: (i) crustal material is detected neither by MARGA nor AMS and, therefore, will not be considered at all in the following discussion, and (ii) the use of different upper size cut-offs for the OA might lead to an underestimation of the total OA mass as expected from the OC distribution. However, the resulting PM10 estimation correlates very well with the PM10 mass concentration measured by the Berner impactor (slope of 0.98; R2=0.96; Fig. 4), indicating a minor contribution of non-considered species (i.e., dust, calcium, magnesium, and trace metals) to the total PM10 mass and a lower organic contribution to the super-µm size range. Although the estimated PM10 mass was validated only during the IOPs, it appears to be reasonable to consider it as accurate over the entire experiment within the previously mentioned limitations.

Figure 4Estimation of the PM10 mass concentration by combining AMS, MAAP, and MARGA. (a) Comparison with total PM10 mass concentration measured by Berner impactors during intensive sampling periods. (b) Mass concentration time series. (c) Mass fraction of the main components. The size of the point on the scatter plot (a) refers to the sampling duration of the Berner impactor. The red line in the inset represents the regression fit by the least orthogonal distance fit forced to zero.
3.2 Organic aerosol source apportionment
An investigation of the organic aerosol source apportionment highlights the presence of five different factors which were identified based on their individual time series, mass spectra, diurnal variability, and comparison with external measurements (Fig. 5). A detailed description of the different steps of the analysis and the identification of the different factors is given in the Supplement (Sect. SI-5). Briefly, in a first step, a non-constrained model was run, and, in a second step, a series of partly constrained runs were investigated in order to better distinguish the different primary organic factors. The selected final solution results in a partially constrained model with two primary organic factors, namely hydrocarbon-like organic aerosol (HOA) and biomass burning organic aerosol (BBOA). HOA was constrained using the mass spectra reported by Mohr et al. (2012) in Barcelona (Spain) and is available on the AMS mass spectra database (http://cires.colorado.edu/jimenez-group/HRAMSsd/; last access: 15 February 2021; Ulbrich et al., 2009). For BBOA, the mass spectra identified during the source analysis process itself was used (see details in Sect. SI-5). In addition to these two primary OA factors, three distinct oxygenated organic aerosols (OOAs) were identified as semi-volatile OOA (SV-OOA), low oxidized OOA (LO-OOA), and more oxidized OOA (MO-OOA; Fig. 5). It is important to note that the three OOA factors were already identified in the first step of the source apportionment analysis during the non-constrained approach.
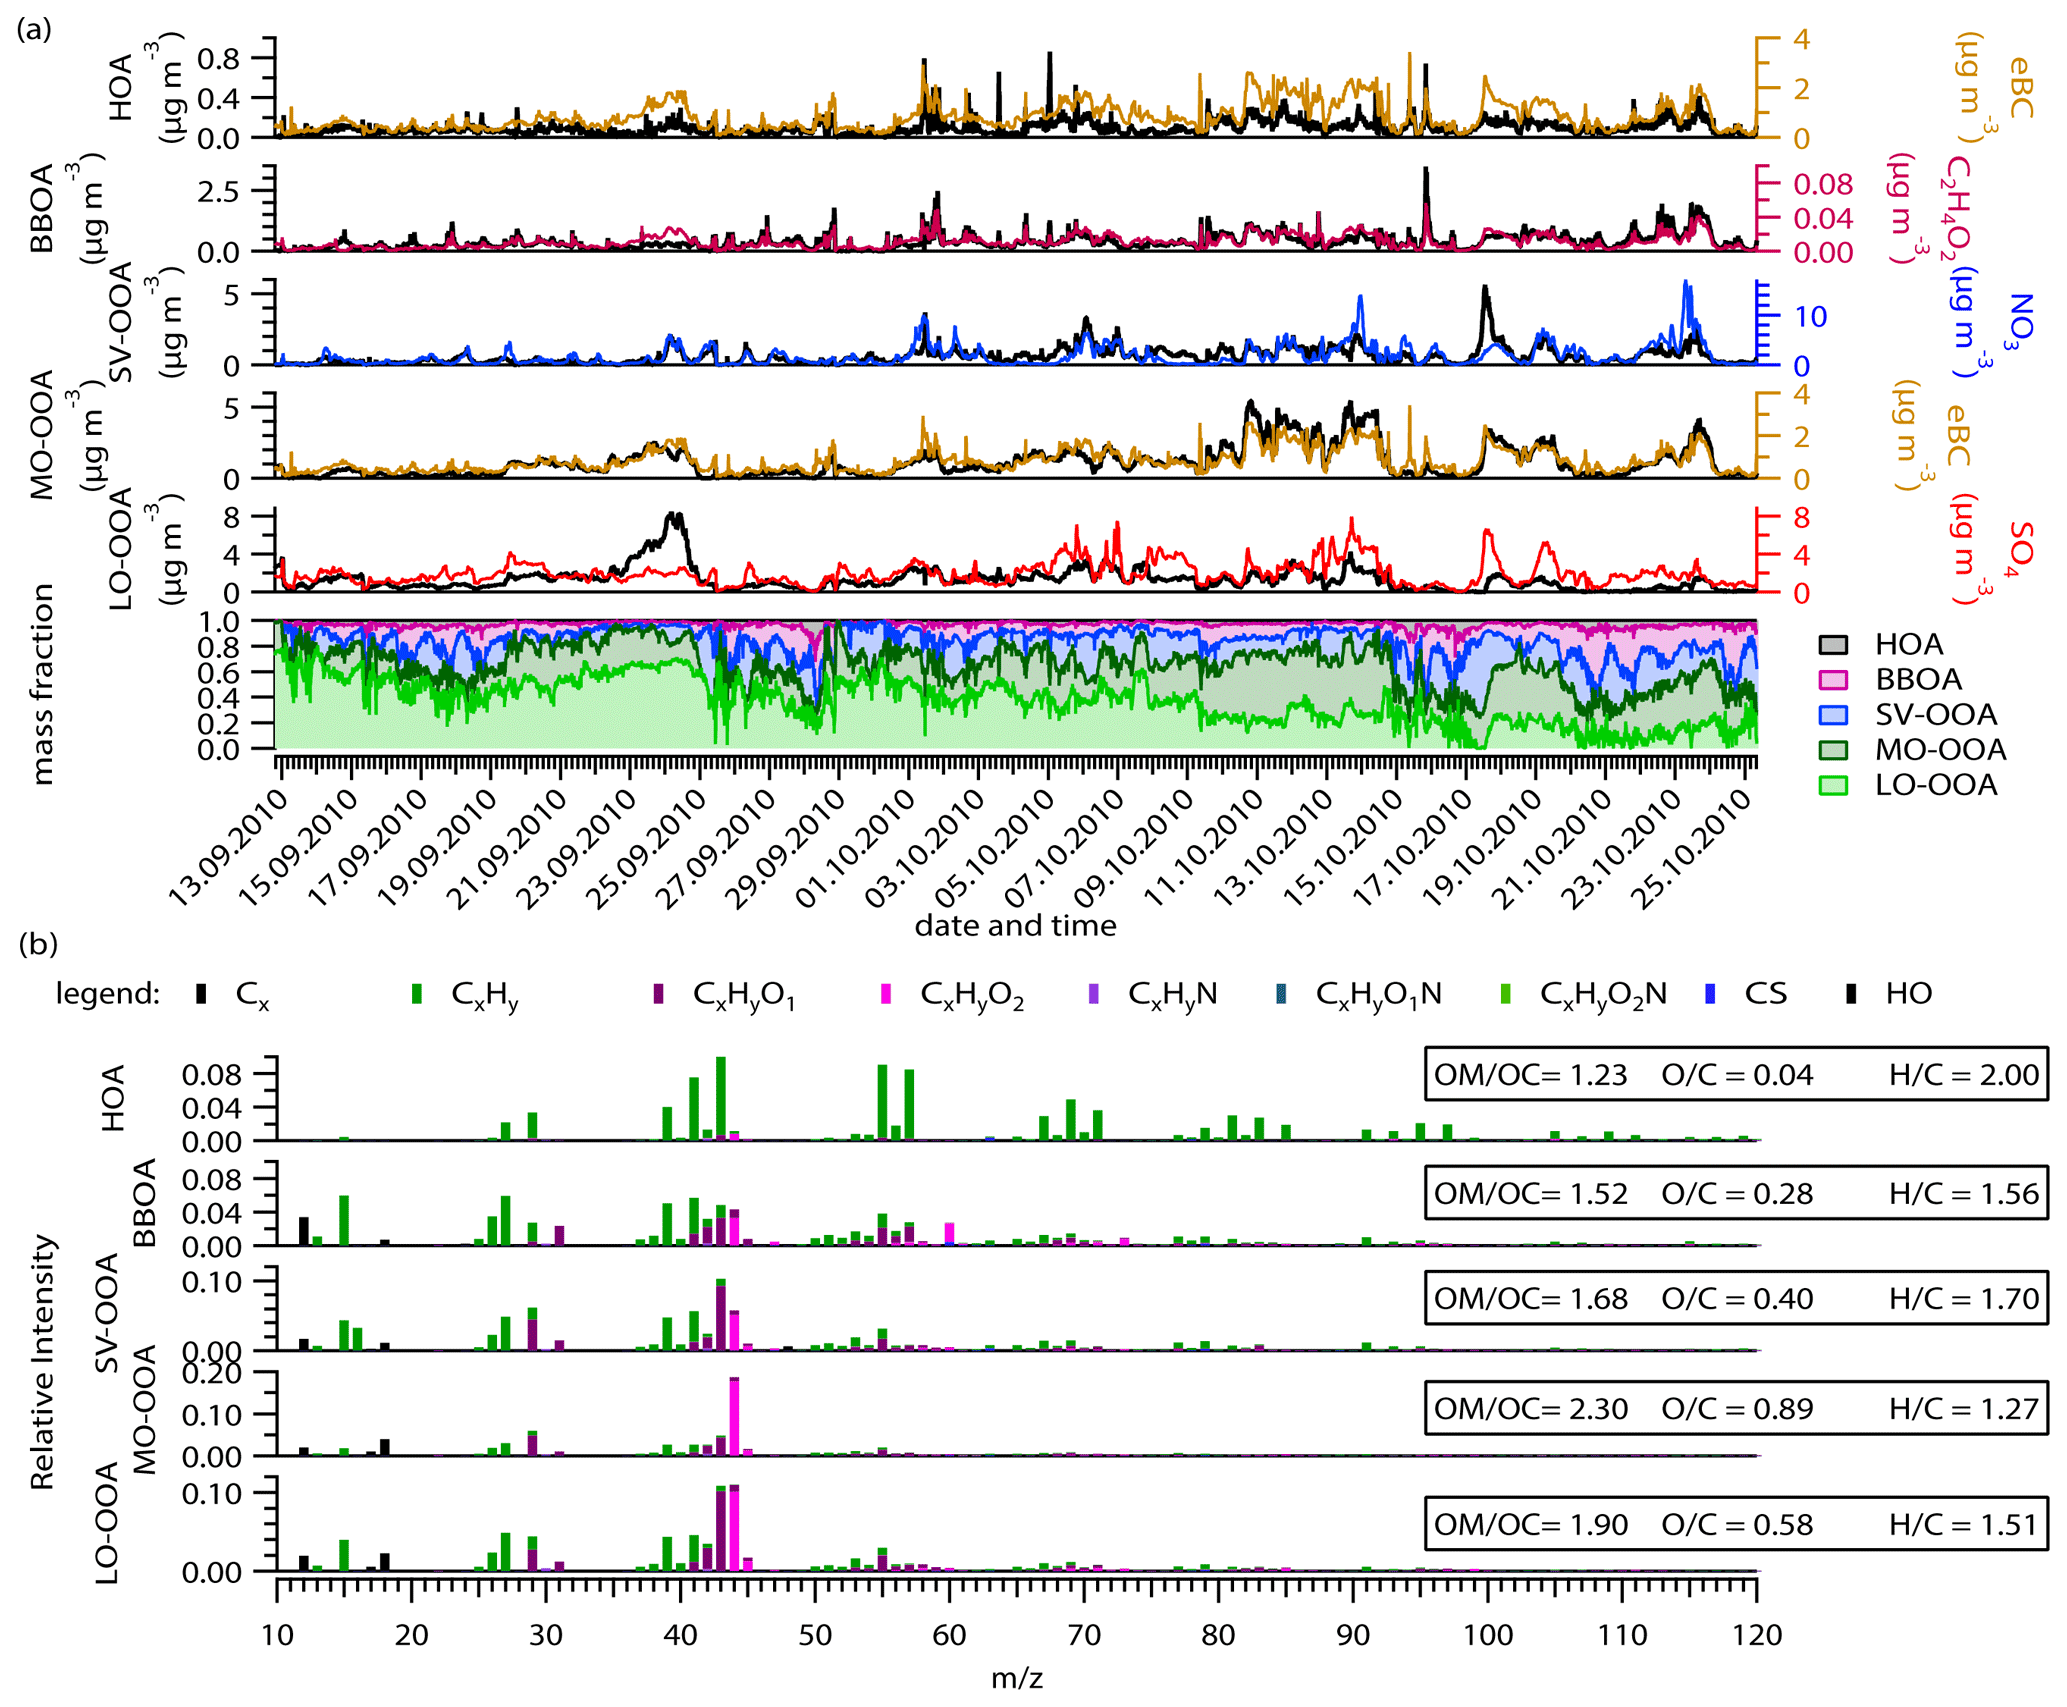
Figure 5Overview of the ME-2 results. (a) Time series of the five-factor solution mass concentration and their corresponding tracers and the mass fraction of each factor throughout the experiment. (b) High-resolution mass spectra colored by the different groups of fragments and the elemental ratios of the identified factors.
3.2.1 HOA
HOA is commonly considered a surrogate for fossil fuel combustion emissions and is especially related to traffic emissions. The HOA mass spectrum is characterized by a larger contribution of hydrocarbon-like ions (CxH fragments; Fig. 5) resulting in a low O : C (0.04) and high H : C (2.00), which is in agreement with previously reported values from Canagaratna et al. (2015). HOA correlates reasonably with trans-2-pentene (R2=0.43), cis-2-pentene (R2=0.56), eBC (R2=0.45), benzene (R2=0.62), toluene (R2=0.35), NO2 (R2=0.31), and CO (R2=0.25; Fig. SI-17). Moreover, eBC, CO, and NOx have similar diurnal patterns to HOA, with two maxima (early in the morning, 09:00, and early in the evening, 18:00; Fig. SI-18) which are typical for car emissions and/or household heating using fossil fuel. The correlation between HOA and eBC must be carefully interpreted, since periods with similar trends alternate with periods of very different covariance (Fig. 5). This clearly indicates the presence of other eBC-related sources, as will be discussed later on. On average, over the whole period, HOA contributed 3 ± 3 % (i.e., mean ± standard deviation) of the total organic mass concentration, designating HOA as a minor source of OA at the sampling place. A clear dependency of the HOA contribution on OA and temperature was observed (Fig. 6), ranging from around 1 % during the warmest period to 5 % for the coldest period. This temperature dependency indicates that HOA should be mostly associated with local residential, household heating rather than a significant increase in car emissions. Moreover, the low-temperature period can also lead to an artificial increase in the HOA concentration by slowing down the evaporation process of the emitted particles and their oxidation processes. Finally, the cold period was also associated with low wind speed and stable stratification (Fig. 1; Tilgner et al., 2014), which might also contribute to higher concentrations of locally emitted aerosol by reducing both the mixing and transport processes.
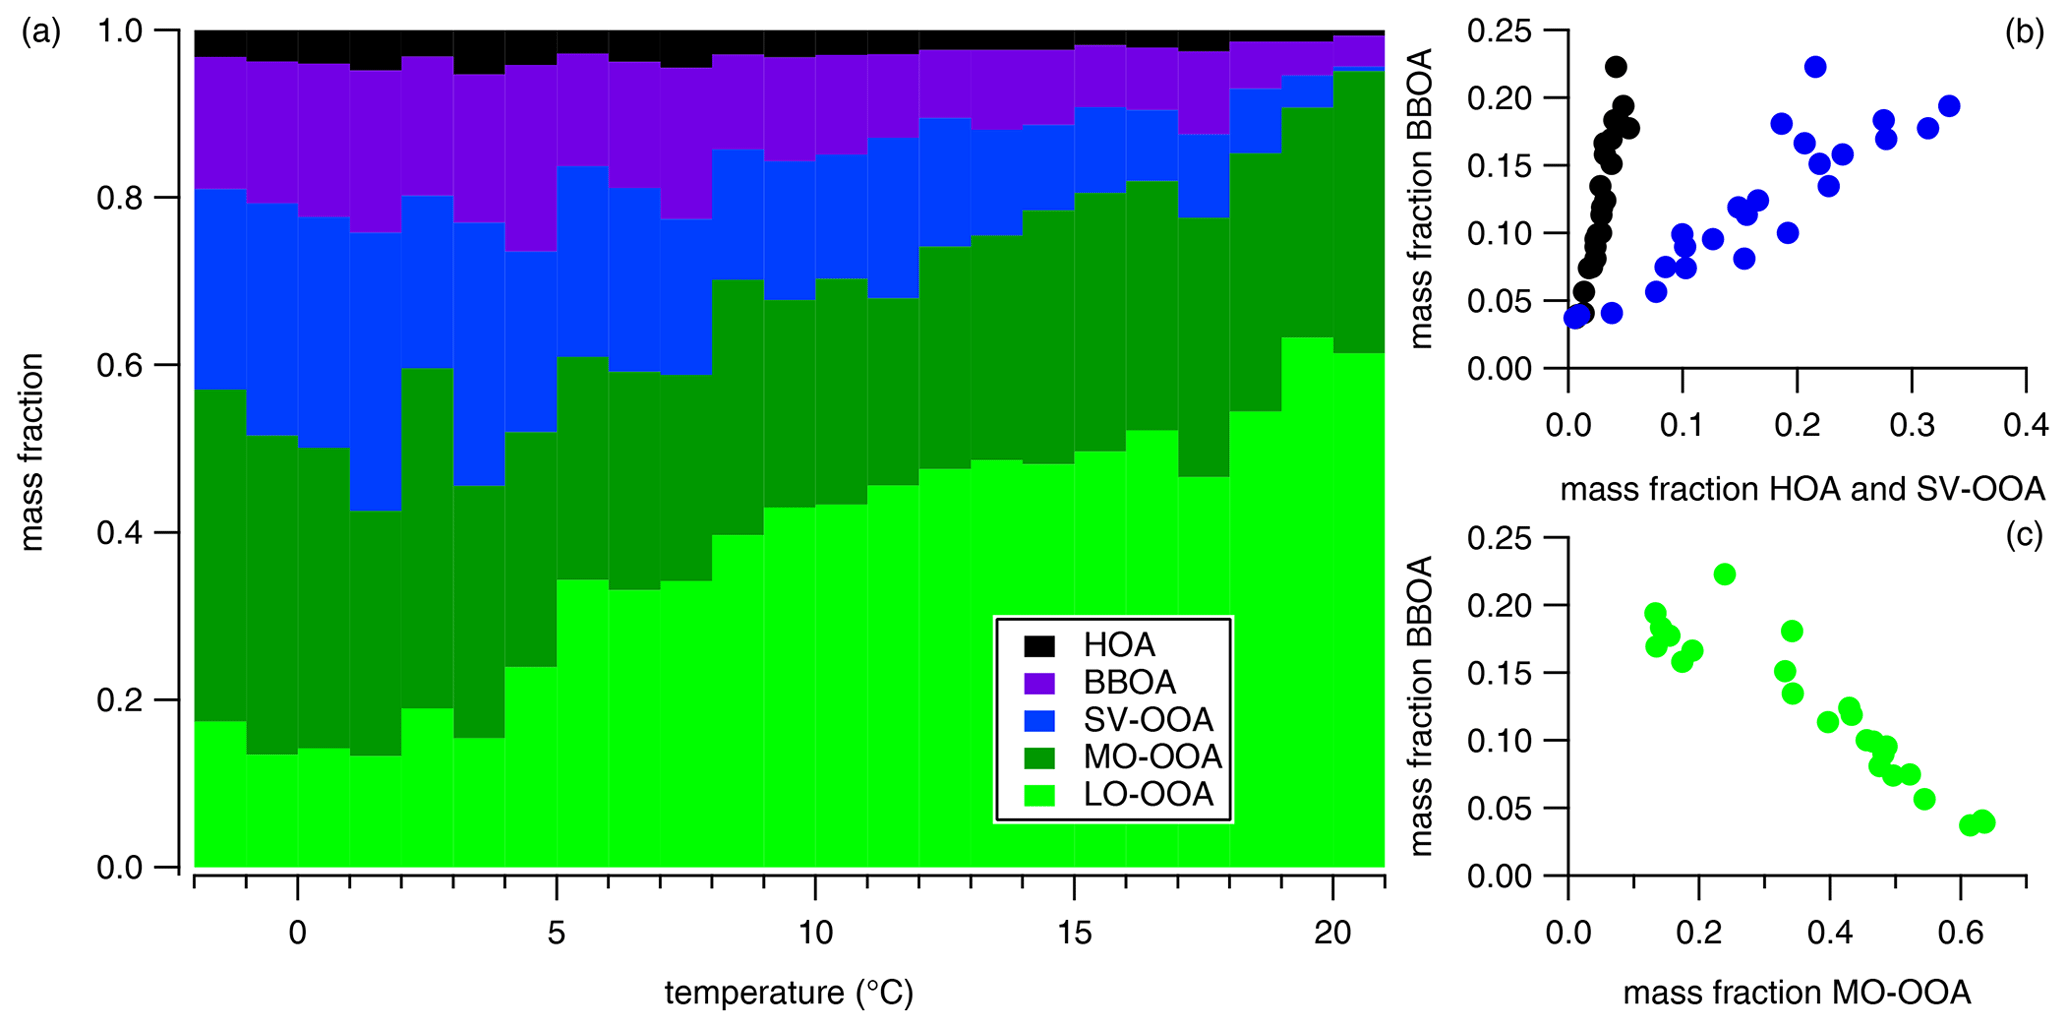
Figure 6Temperature dependency of the identified factors' contribution to OA (a), and their individual correlations (b, c). The OA mass concentrations were averaged to a 1∘C resolution.
3.2.2 BBOA
The BBOA factor (13.3±10.0 % of the total OA) is related to biomass burning emissions, and its mass spectrum is characterized by the presence of two specific fragments, namely C2H4O at 60 and C3H5O at 73 (Fig. 5); they are known to be related to anhydrous sugars like levoglucosan (e.g., Schneider et al., 2006). This is confirmed by the correlation observed in offline levoglucosan (R2=0.84; Fig. SI-17). The elemental ratios of the BBOA factor correspond with the lower range of all the reported values in Canagaratna et al. (2015). Although BBOA mass spectrum is influenced by the type of wood used, the combustion conditions and the wetness of the wood (Ortega et al., 2013) together with the low O : C value of the BBOA factor indicates that it is mostly freshly emitted. BBOA also correlates with specific NMHC compounds like ethane (R2=0.34), ethylene (R2=0.55), m,p-xylene (R2=0.32), and, more generally, with the total alkenes (R2=0.40), as previously reported by Gaeggeler et al. (2008) and Schauer and Cass (2000). Similar to HOA, the BBOA fraction to total OA increases with the decrease in the temperature, representing almost 20 % of the OA during the coldest period (Fig. 6). The correlation between BBOA and HOA (R2=0.86) clearly indicates that these two factors are emitted from a similar origin. This supports our conclusions of the HOA as being mostly associated with residential, household heating.
Wood combustion used for residential, household heating dominates the local anthropogenic emissions in the surrounding area of the sampling place. This is in agreement with the reported BBOA contribution of 20 % for a similar place in Germany in winter (Poulain et al., 2011). The predominance of biomass burning emissions compared to liquid fuel is also supported by the benzene to toluene ratio value during the IOPs (mean 1.1, min 0.47, max 2.65), which is comparable to the ratio reported by Gaeggeler et al. (2008) for a similar location in Switzerland.
Overall, the sum of the primary OA (POA = HOA + BBOA) was principally associated with back trajectory clusters C1 (west) and C2 (northwest) (20 %–25 % of OA; see Sect. 3.4), while they only contribute <11 % to the other clusters. Consequently, taking all of them together, the C1 (west) and C2 (northwest) clusters might be impacted by the village of Goldlauter, as discussed later in Sect. 3.4.
3.2.3 SV-OOA
The SV-OOA was identified according to the relative similarity of its time series with nitrate (R2=0.40) and its diurnal profile, which shows the highest concentrations during nighttime, a decrease in the early morning hours, and a minimum during daytime (Fig. SI-18). The SV-OOA mass spectrum is characterized by a higher contribution of the ions C2H3O+ ( 43) compared to CO ( 44). The elemental analysis of the SV-OOA mass spectra shows an O : C of 0.40 and a H : C of 1.70 (Fig. 5), which is in the lowest range of the reported SV-OOA values from Canagaratna et al. (2015). Its mass spectra is also similar to the median SV-OOA mass spectra based on 25 AMS measurements over Europe (R2=0.69) described by Crippa et al. (2014). The difference was mainly attributed to a smaller contribution of the CO ion ( 44) to our factor. On average, throughout the entire sampling period, SV-OOA represented 19±11 % of the total OA, ranging from 12 % to 22 %, with a clear temperature dependency similar to the POAs (Fig. 6). Nevertheless, this is in agreement with the fact that SV-OOA is generally associated with the gas-to-particle partitioning of semi-volatile organic compounds (e.g., Ulbrich et al., 2009; Zhang et al., 2011). Consequently, it has to be related to a more local and/or regional influence. Interestingly, SV-OOA also correlates with anthropogenic NMHC gases like toluene (R2=0.55), i-pentane (R2=0.52), benzene (R2=0.46), and the sum of aromatic NMHC (R2=0.60; Fig. SI-19). This correlation may be a consequence of the presence of semi-volatile organic compounds and intermediate volatility organic compounds (VOCs and IVOCs, respectively) being either directly emitted from anthropogenic sources or resulting from the dilution of the POA (e.g., Lipsky and Robinson, 2006; May et al., 2013). Ambient relative humidity and, subsequently, aerosol liquid water content seem to be two of the essential parameters driving the partitioning of the anthropogenic VOCs and IVOCs in the particle phase (Murphy et al., 2017). Therefore, correlations between SV-OOA and NMHC might result from the condensation of semi-volatile compounds emitted by anthropogenic sources.
3.2.4 OOAs
Finally, the two OOAs referred to as low oxidized oxygenated organic aerosol (LO-OOA) and more oxidized oxygenated organic aerosol (MO-OOA) were identified during an early stage of the source apportionment analysis, as discussed in the Supplement (Sect. SI-5). They present two distinct time series and mass spectra, indicating two different sources rather than an artificial splitting by the model (Fig. 5). Both are characterized by a high contribution of mass 44 (mostly CO, while only LO-OOA has a strong contribution of 43 (mostly C2H3O+). Their elemental ratios reflect this difference. MO-OOA is more oxygenated (O : C = 0.89) than LO-OOA (O : C =0.58). The difference between the two OOAs might be related to either different precursors or aging processes.
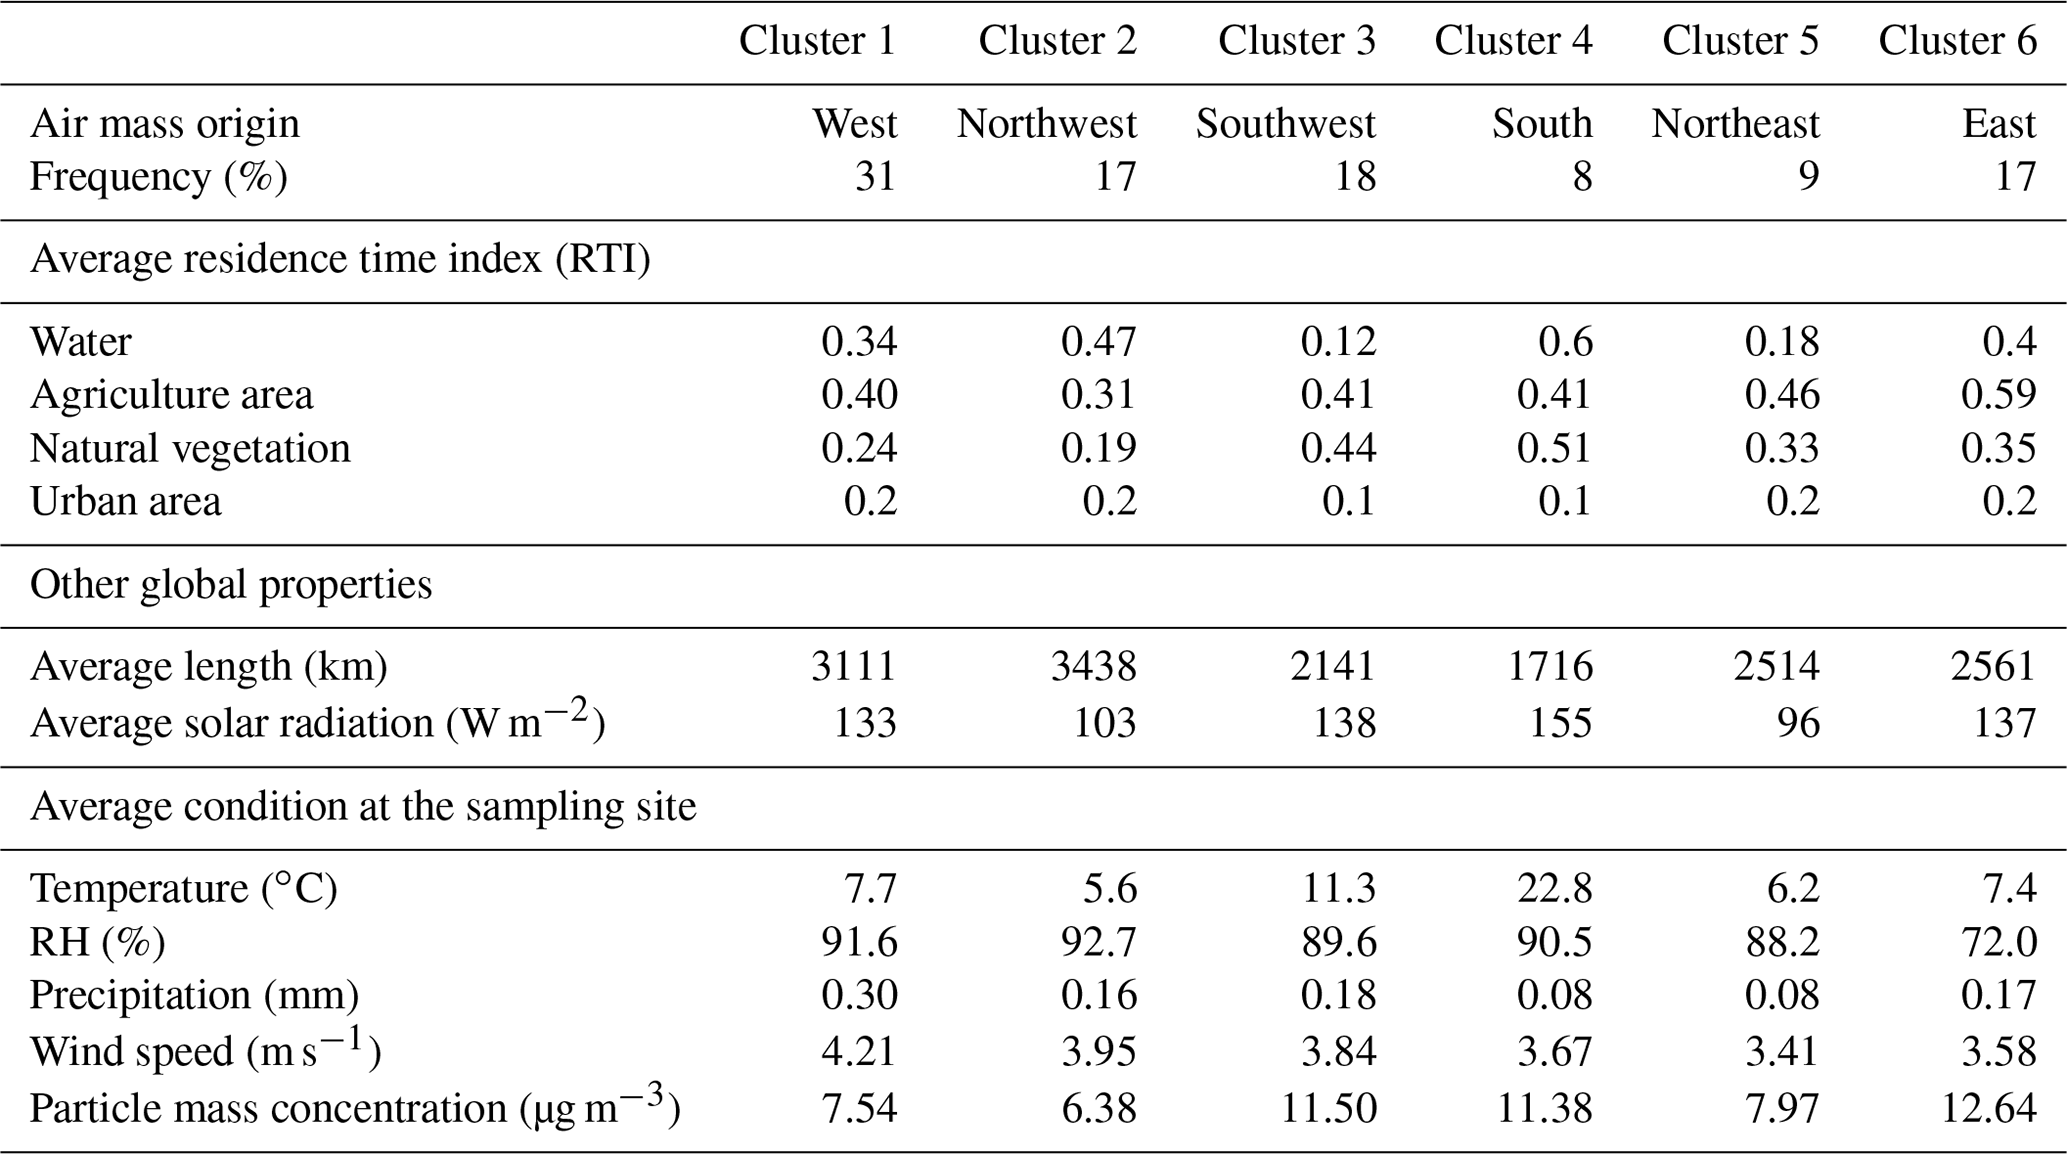
The two OOAs are the two most important contributors to the total OA fraction (28±12 % and 37±18 % of the OA for MO-OOA and LO-OOA, respectively). However, their individual relative contributions strongly vary over time. LO-OOA dominated at the beginning of the measurement period and contributed up to around 60 % of OA (Fig. 5). The fragment C7H ( 91) was frequently associated with biogenic SOA, even though it cannot be considered as a specific tracer (Lee et al., 2016). C7H arises from the fragmentation of aromatic compounds and can, therefore, have several sources. Here, the contribution of C7H to total OA (f91) is higher in LO-OOA than MO-OOA, which might indicate a larger contribution of biogenic SOA to LO-OOA. Contrary to the anthropogenic-related factors, the mass fraction of LO-OOA decreases with the decrease in temperature (Fig. 6). This can be associated with the decrease in the biogenic VOC emissions from late summer to early winter (Helmig et al., 2013). The impact of biogenic sources is also supported by the air mass cluster analysis, which associated the highest fraction of LO-OOA with a cluster with the highest RTI over natural vegetation (Table 1 and discussion in Sect. 3.4).
In contrast, MO-OOA does not show a pronounced temperature dependency, but it strongly correlates with eBC (R2=0.79; Figs. 5 and SI-17), which is higher than the coefficient correlation for the POA factors. MO-OOA also correlates better with oxalic acid (R2=0.81) than LO-OOA (R2=0.65; not shown). Moreover, MO-OOA correlates moderately with SO2 (R2=0.35), suggesting an anthropogenic influence. It is known that the aging of primary OA leads to mass spectra with a similar pattern to OOA (Jimenez et al., 2009). Consequently, MO-OOA can be identified as being related to processed polluted/anthropogenic air masses from long-range transport.
3.3 Equivalent black carbon (eBC) source apportionment
As mentioned before, eBC correlated with three different organic factors (HOA, BBOA, and MO-OOA) identified during source apportionment analysis. Taken together, the sum of these factors correlates strongly with eBC (R2=0.83), as shown in Fig. 7a. Therefore, using a multilinear regression model, the different sources of eBC were assessed for each factor, following Laborde et al. (2013) and Zhu et al. (2018). The assumption made here is that the eBC mass is attributed to the individual contribution of each OA factor (i.e., eBCHOA, eBCBBOA, and eBCMO−OOA) at any time as in the following:
The eBC emission related to each source is assumed to be proportional to the individual source mass concentration released (mHOA, mBBOA, and mMO−OOA, respectively). Therefore, the multilinear regression model could be explained as follows:
where a, b, and c, respectively, represent the linear regression coefficient for mHOA, mBBOA, and mMO−OOA, which will be used to estimate the respective eBC contribution towards each OA factor.
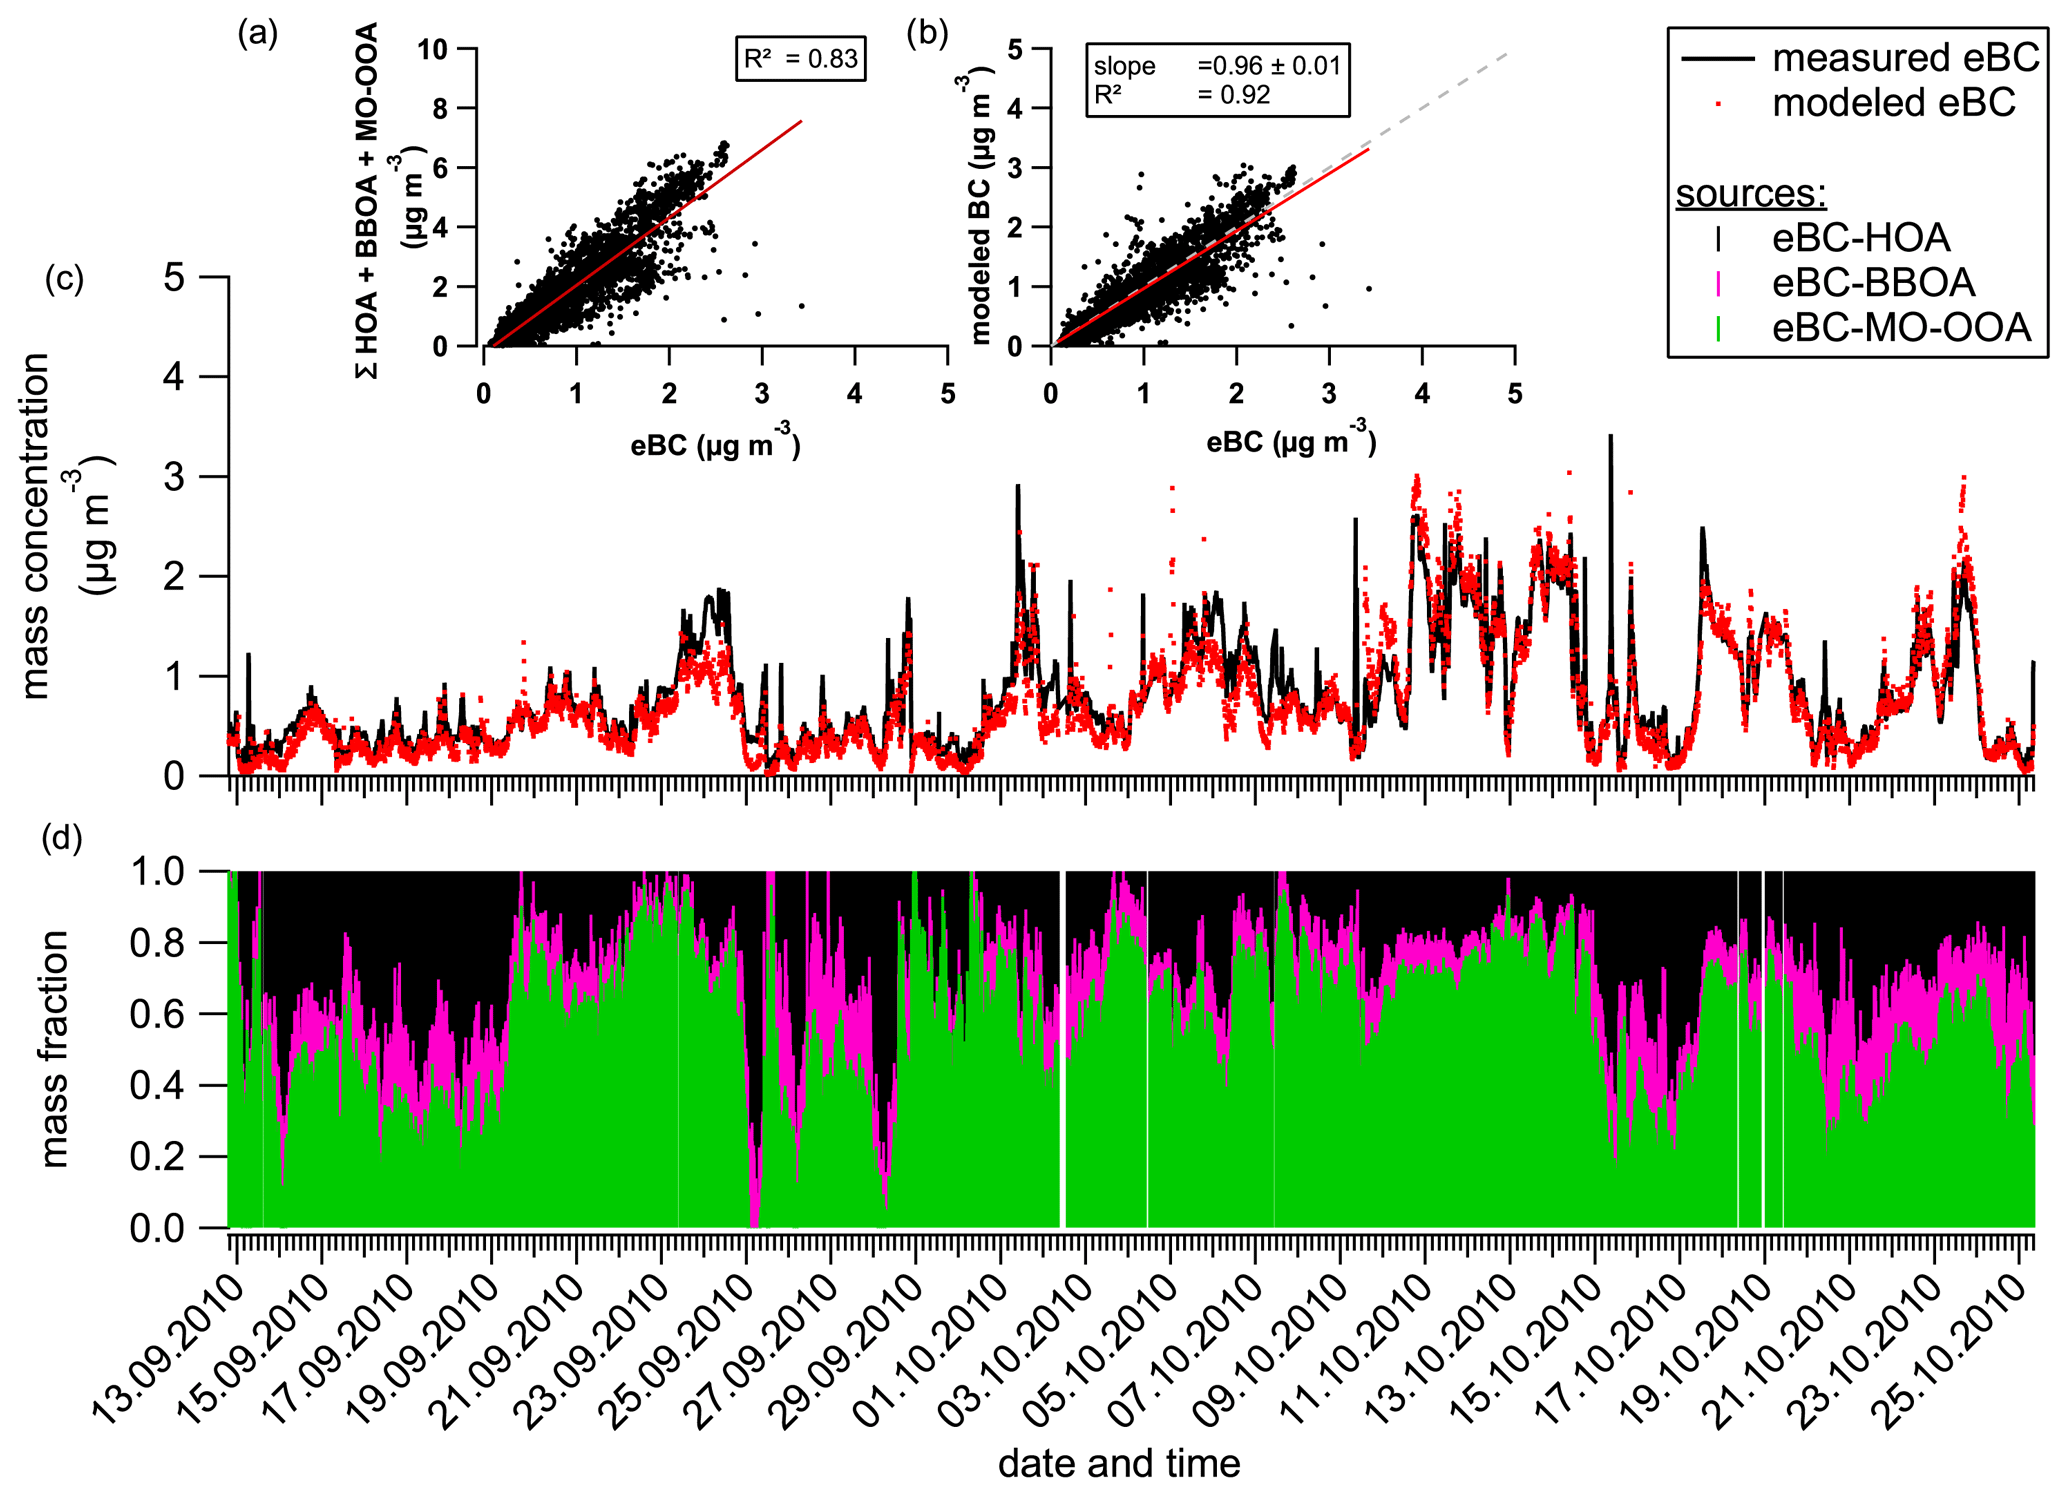
Figure 7Contribution of the different organic factors to the eBC mass concentration. The scatter plots present the correlation between the sum of the OA factors and the measured eBC (a) and the estimated eBC concentration compared to the measured one (b). Time series show comparisons between measured and modeled eBC (c) and contributions of each source to the modeled eBC concentration (d). The correlation curves (red lines) were calculated using the least orthogonal distance fit method.
A very good correlation between measured and modeled eBC was obtained (Fig. 7b), and modeled eBC explained 96 % of the measured one. Based on this approach, long-range transport particles associated with MO-OOA are the largest source of eBC during the measurement period, contributing to half of it (52 %), while eBC associated with local emissions of HOA and BBOA represents 35 % and 13 %, respectively. Considering only local eBC sources, fossil fuel combustion dominates the eBC fraction (73 % for eBCHOA and 27 % for eBCBBOA), which is in agreement with previous works (e.g., Healy et al., 2012; Herich et al., 2011).
Using single-particle mass spectrometer measurements, Healy et al. (2012) reported that size distribution of EC can also directly be used to apportion soot sources. A local EC source was related to particles with a vacuum aerodynamic diameter (dva) of <400 nm, while continental transported soot was related to particles with dva> of 400 nm. A similar cut-off diameter was applied to the Berner impactor measurements to split the EC into freshly emitted and transported, assuming that the first two stages (i.e., aerodynamic diameter ranging from 50 to 420 nm) were associated with the local EC and the three larger ones (i.e., diameter ranging from 420 nm to 10 µm) with continental transport (Fig. 8). The resulting EC classification provides quite similar results than the one discussed before, and using the multilinear regression approach (Fig. 8), with an uncertainty of approximately 20 % (mean ratio between the two approaches excluding FCE 11.2), supports our conclusions. Only FCE 11.2 provides completely different results between the two approaches without any clear explanation. In summary, comparisons between the two approaches (multilinear regression and impactor size cut-off) support each other, and both confirm the importance of a minimum near 400 nm (in aerodynamic diameter) in the EC size distribution for distinguishing freshly emitted from long-range transported soot. The importance of the long-range continental transport of soot is also in agreement with the measurements made by Roth et al. (2016) at the summit station by the ALABAMA. The authors reported that soot was mainly found in particles with diameters larger than 450 nm, which corresponds with aged/processed soot.
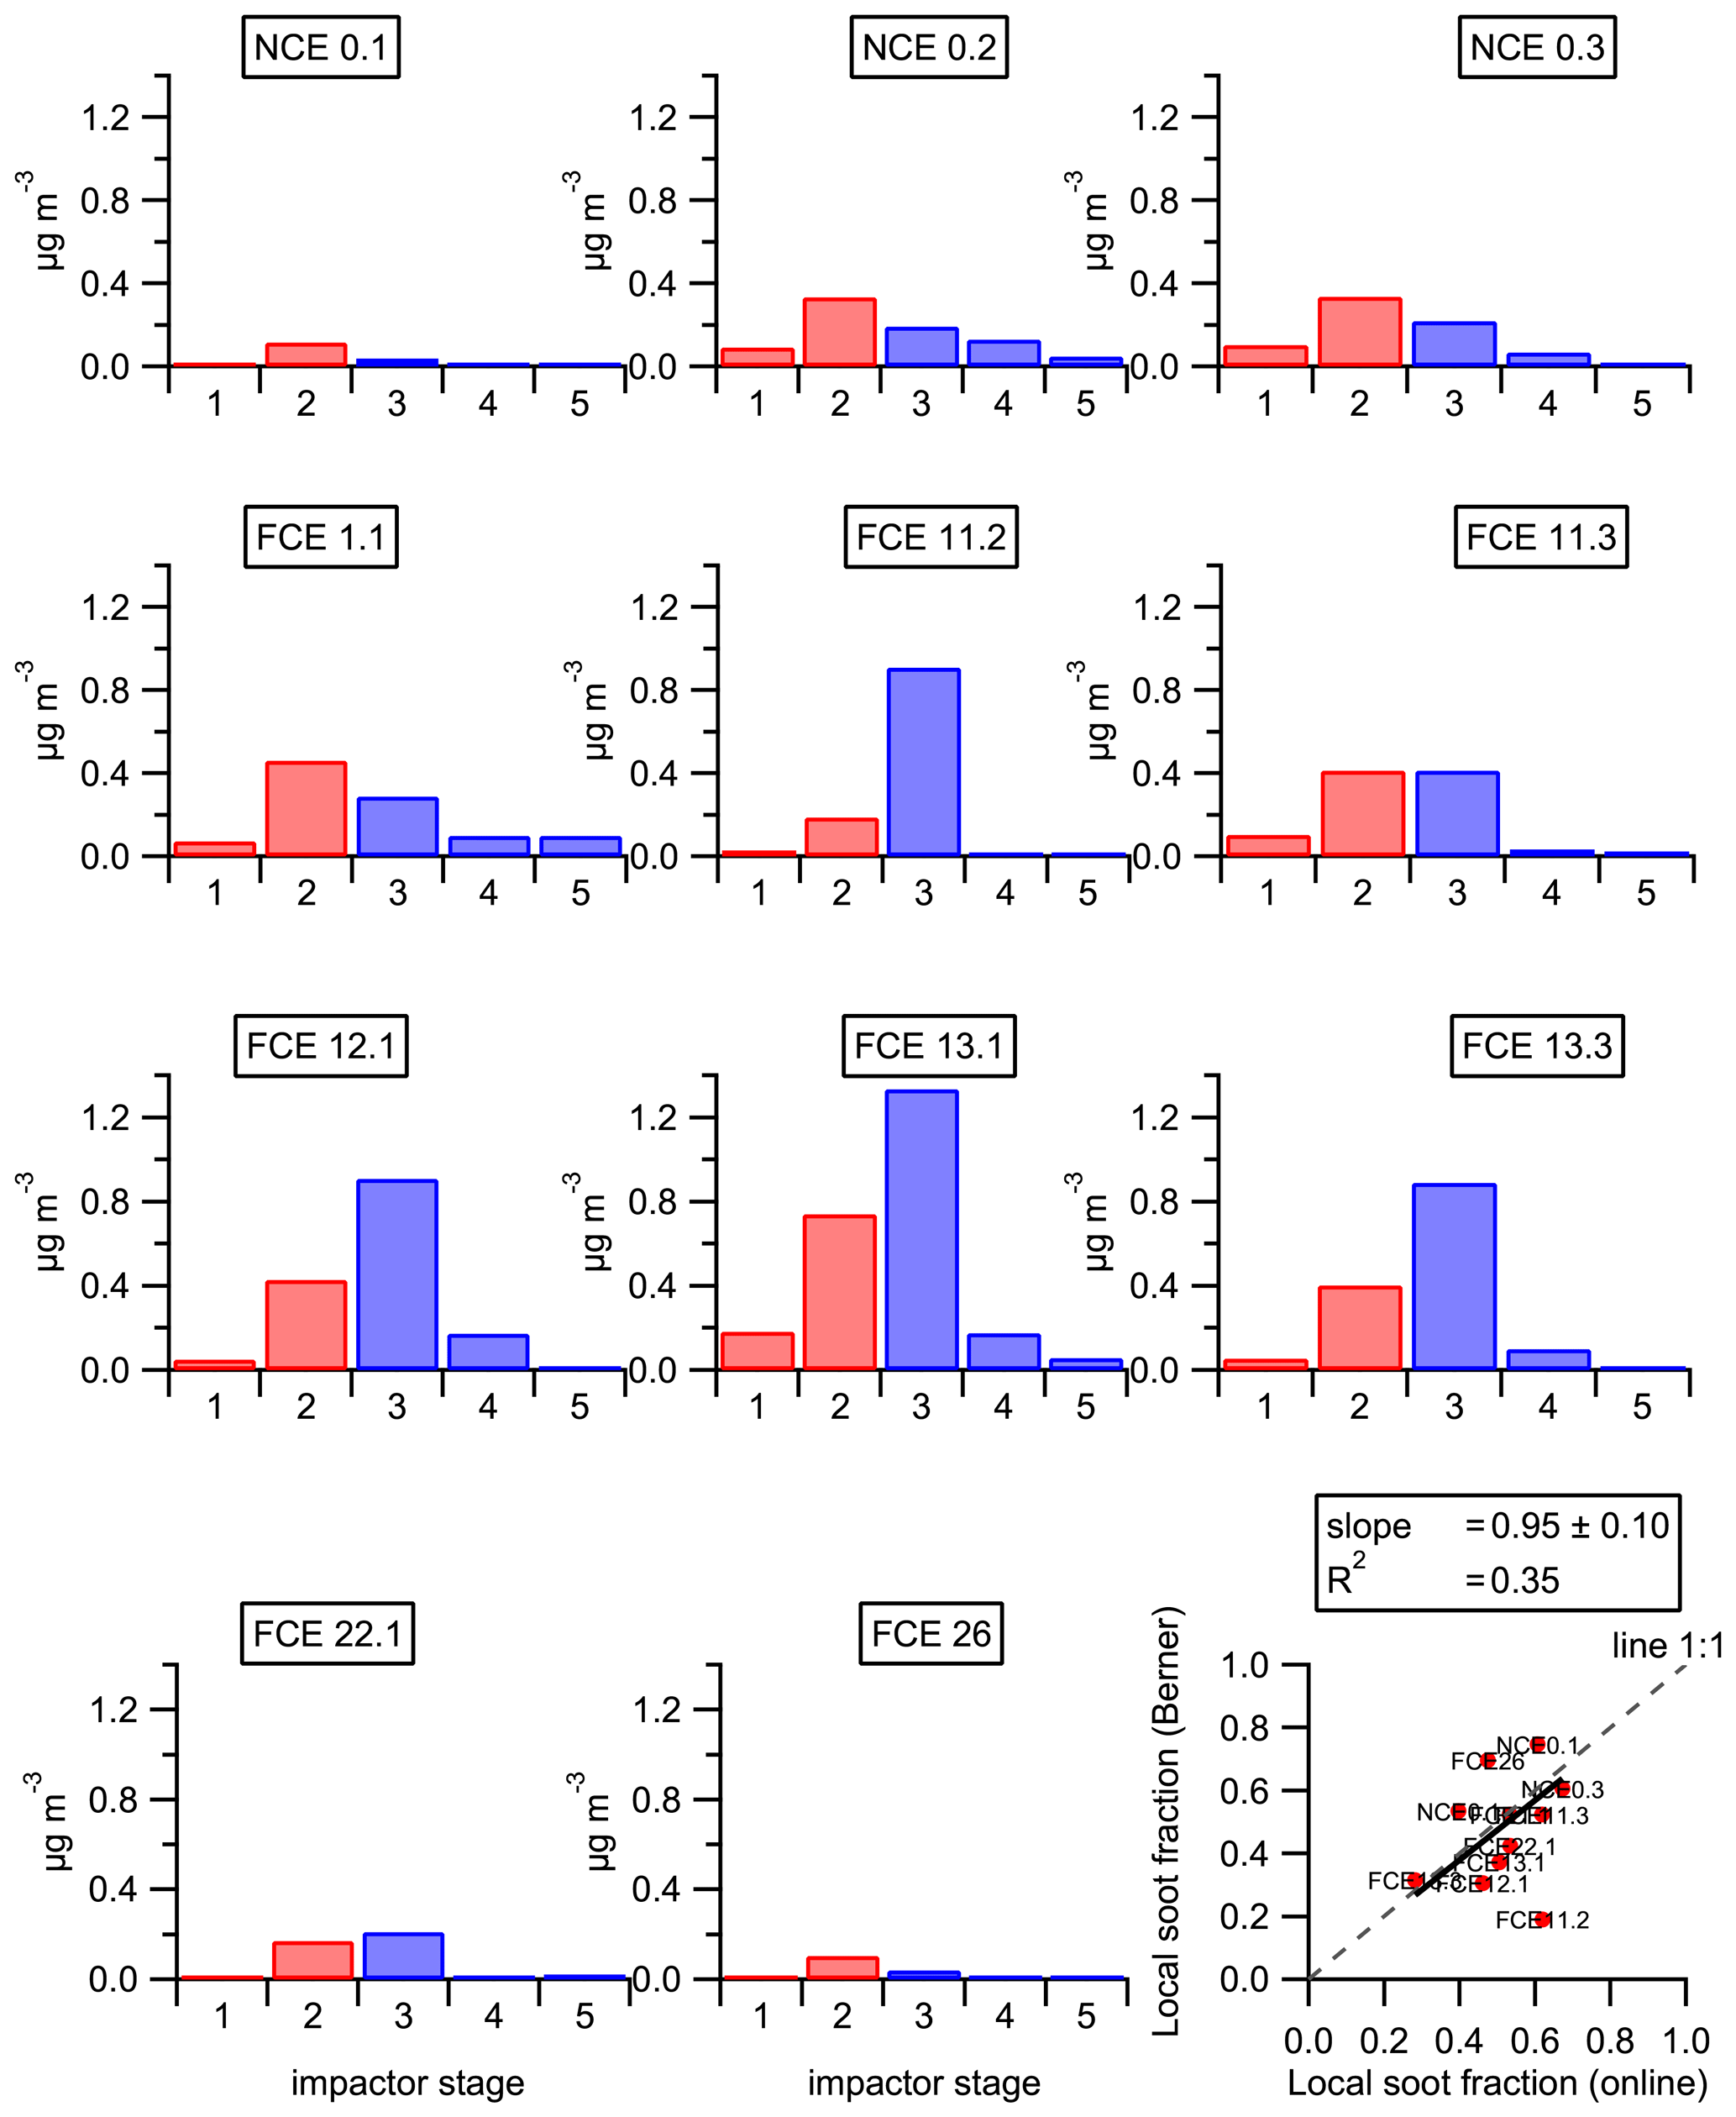
Figure 8Overview of the EC size distribution measured by the five-stage Berner impactor. Colors correspond to the following EC classifications: red is local, and blue is regional/transport. The scatter plot on the bottom right shows the comparison between the local soot fractions estimated using the two different approaches, namely the Berner impactor (y axis) and online multilinear regression (x axis). Regression (black line) was made using the least orthogonal distance fit method.
3.4 Influence of air mass origin on chemical composition and particle number size distribution
A total of six clusters was obtained based on 96 h backward air mass trajectories (Fig. 9), and they are characterized in Table 1 by their residence time index (RTI) over different types of ground before reaching the sampling place, based on the approach described in van Pinxteren et al. (2010) and their meteorological conditions. Clusters C1 (west) and C2 (northwest) correspond to two different types of marine-influenced air masses with RTIwater of 0.34 and 0.47, respectively. C1 (west) starts near Iceland, while C2 (northwest) comes from the Norwegian Sea. These trajectories occurred during 31 % and 17 %, respectively, of the measurement period. Although the cluster C3 (southwest; 18 % of the time) also contains a maritime component at the starting point of the air masses (RTIwater=0.12), it is dominated by an RTI associated with continental areas (France and southern Germany). Cluster C4 (south) is characteristic of southern Europe, coming from an industrial and polluted area of northern Italy via Austria and the south of Germany. It also presents the highest RTI (0.51) related to natural vegetation (i.e., forest). Furthermore, it corresponds to the warm period. However, this cluster only occurs for a short period (8 % of the total sampling period). Cluster C5 (northeast) is an issue of the boreal area (north of Sweden), and it spends some time over the Baltic Sea (near Finnish, Latvian, and Polish coasts) before entering the north of Germany. Although it might also contain a small maritime component (RTIwater=0.18), this cluster mostly follows coastal areas. Therefore, it should present an important continental and polluted aspect. Similar to C4 (south), it is not very common (9 % of the sampling period). Finally, C6 (east) clearly represents continental air masses coming from the eastern side of Europe (crossing Russia, Ukraine, Poland, and the Czech Republic). The sampling site was under its influence 17 % of the time, mostly during the second part of the experiment. Not surprisingly, the air mass clusters with the highest continental background (C3, southwest, C4, south, and C6, east) also correspond with the ones with the highest aerosol particle mass concentrations (Table 1).
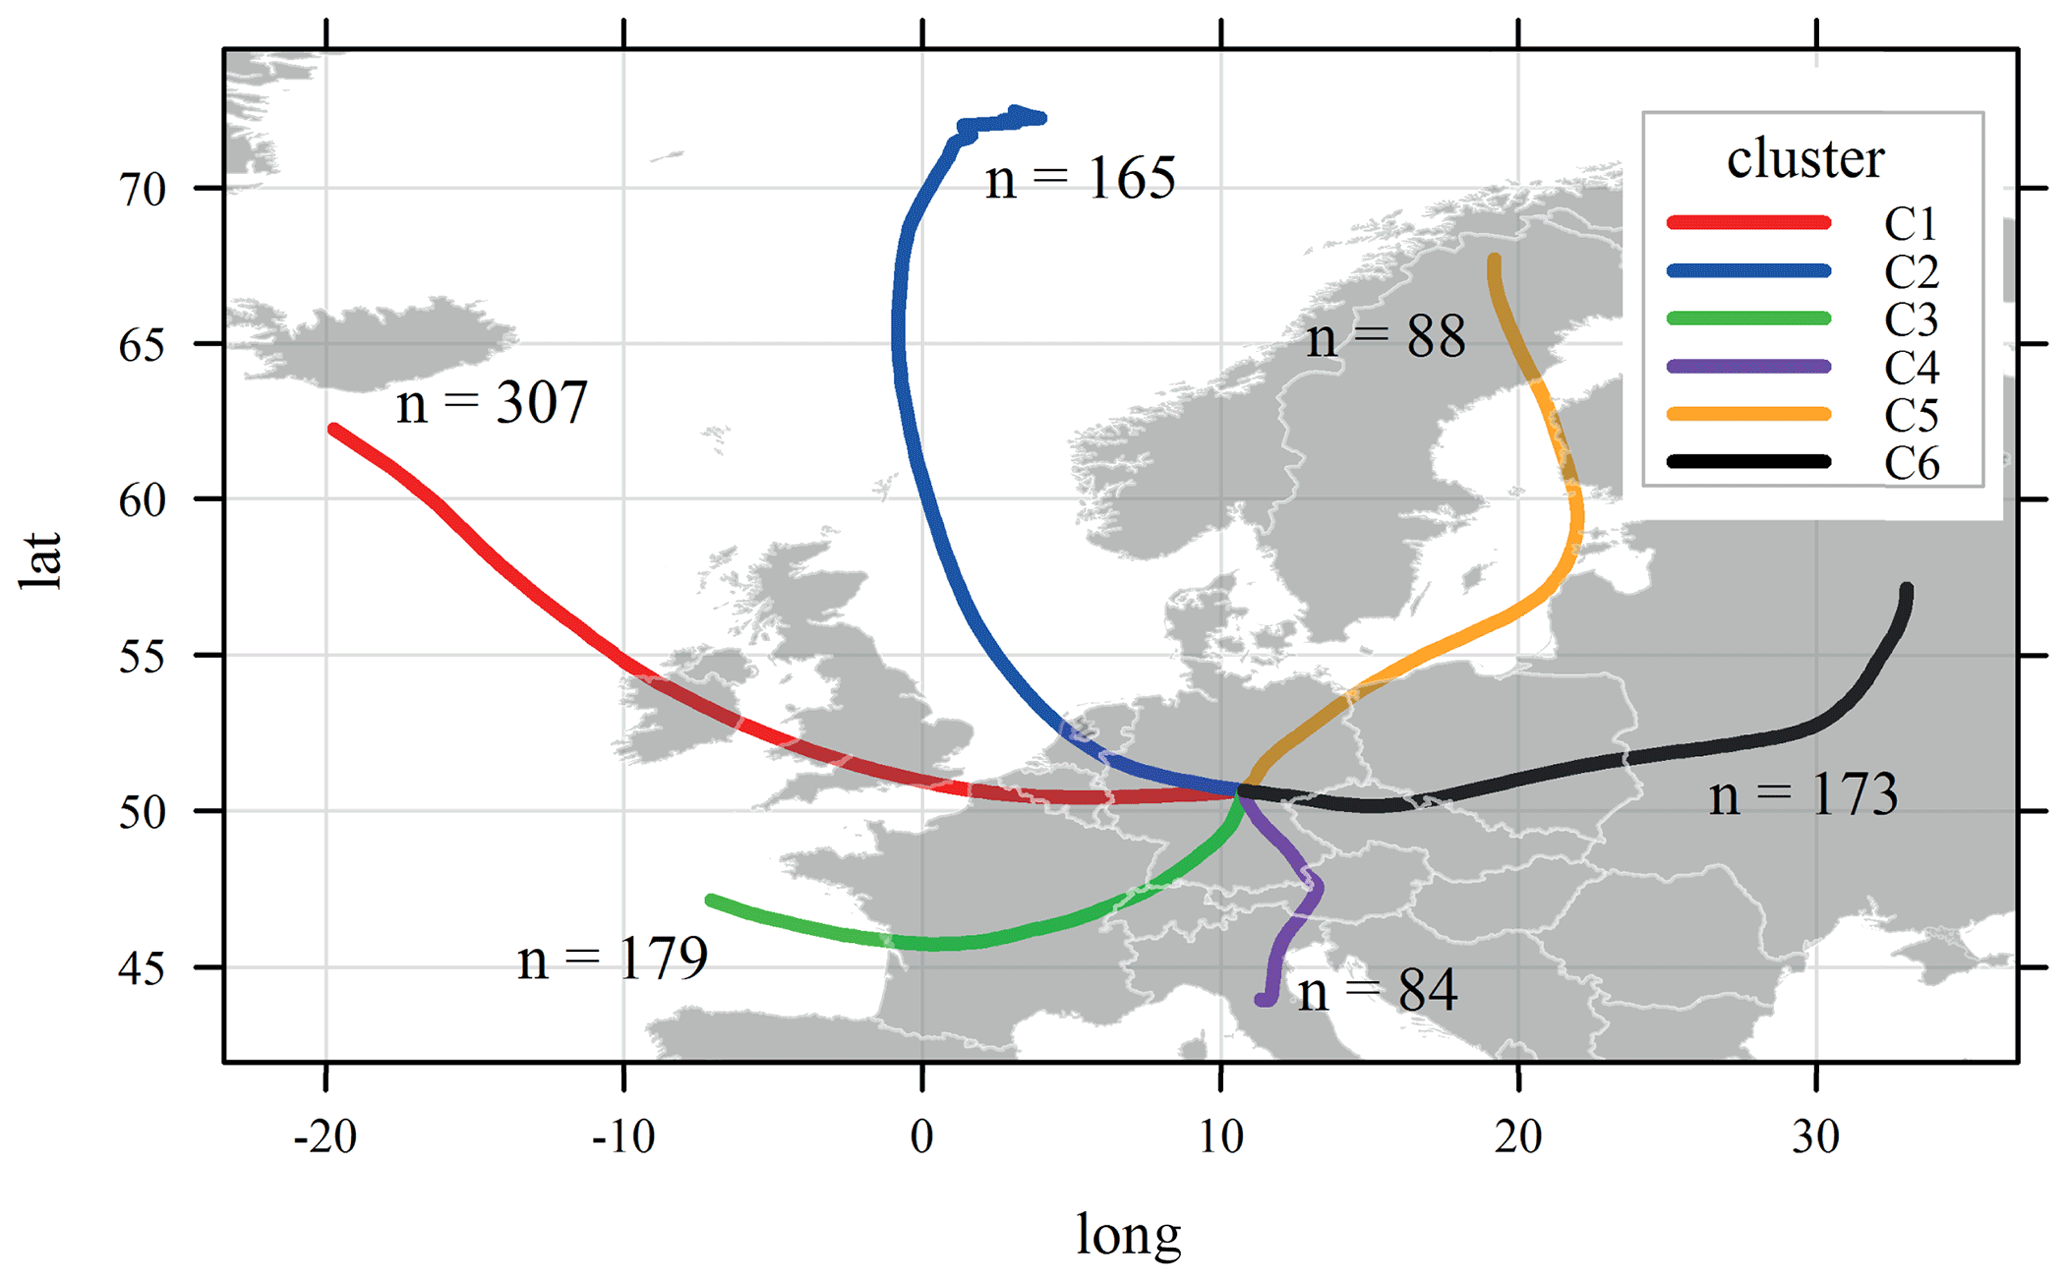
Figure 9Cluster results of the 96 h backward air mass trajectories calculated for the entire sampling period. n indicates the sum of the air mass trajectories associated with each cluster.
The aerosol particle chemical composition, number size distribution (PNSD), and trace gases were averaged according to the different air mass clusters and are presented in Fig. 10 and summarized in the Supplement (Table SI-4). The highest particle mass concentrations were observed for clusters with the strongest continental influence (i.e., C3, southwest – 11.5 µg m−3; C4, south – 11.4 µg m−3; C6, east – 12.6 µg m−3). The largest mass concentrations of chloride, sodium, and potassium salts were associated with C1 (west) and C2 (northwest), which have the largest marine influence (Fig. 10 and Table 1). These two clusters also correspond to the periods with the lowest particle mass (7.5 and 6.4 µg m−3, respectively) and trace gas concentrations (Table SI-4). Although the lowest absolute and relative mass concentrations of organics (≈30 %) and eBC (7 %–8 %) were also observed for these two clusters, they show the largest fraction of anthropogenic sources (HOA ≈ 4 % and BBOA 15 %–20 % of OA). The average particle number size distributions for these two clusters present the highest concentration of Aitken mode particles (centering on 40–50 nm), supporting the influence of local anthropogenic emissions.

Figure 10Overview of the chemical composition and the PNSD for each cluster (1–6). The left column shows the mean estimated PM10 aerosol particle chemical composition. The middle column shows the averaged particle number size distribution (± standard deviation in gray). The right column shows the source apportionment results for organic aerosol (top graph) and eBC (bottom graph).
Increasing the RTI value of the air masses over continental areas leads to an increase in the carbonaceous fraction in both absolute and relative mass concentrations. The highest mass concentrations of OA and eBC are associated with C4, south (5.4 and 1.0 µg m−3, respectively), and C6, east (5.8 and 1.3 µg m−3, respectively). The averaged particle size distribution for C3 (southwest) and C4 (south) are almost unimodal, centering on 100 nm, indicating that well-processed particles are not impacted by local anthropogenic sources. The highest mass concentrations of eBC and OA are both linked to air masses coming from eastern Europe (C6 – east). This is also true with regard to gas composition, since C6 (east) also shows the highest concentrations of SO2, HNO3, and O3 (Table SI-4). Interestingly, the different nucleation events observed during the sampling period (Wu et al., 2015) were mainly connected to C5 (northeast) and C6 (east), as reflected by the large contribution of the smallest particle diameters (nucleation mode) to their respective PNSD profiles, which did not appear on the other clusters. Nucleation processes strongly depend on the sulfuric acid formation (Kulmala et al., 2004; Birmili et al., 2003), which is certainly promoted by the SO2 concentration. Finally, the two continental eastern clusters also show a large particle mode (approximately 200 nm), indicating long-range processed particles in agreement with the large fraction of MO-OOA and its associated eBC. Taken together, the aerosol particle and trace gas compositions of C6 (east) confirm the strong anthropogenic influence on air masses originating from this sector, which is in agreement with long-term measurements performed at the German station of Melpitz, located approximately 250 km to the northeast of the Goldlauter site (Spindler et al., 2013).
In the frame of the HCCT-2010 campaign, a detailed description of the aerosol particle chemical composition reaching the site of Goldlauter was made by combining continuous online measurements (AMS, MARGA, MAAP, and MPSS) with offline impactor samples performed during specific IOPs. Merging online results from the AMS, MAAP, and MARGA together provides an hourly, time-resolved chemical picture of the ambient PM10 composition. The consistency with the merged total PM10 mass and the one measured by the Berner impactor highlights the fact that OA on the super-µm size range should be low, and non-considered species (i.e., dust, calcium, magnesium, and trace metals) should play a minor role in the total PM10 mass during our study. A total of five factors were identified from the source apportionment of the OA, including two primary organic aerosols related to fossil fuel combustion, namely HOA (3 % of total OA), biomass burning combustion BBOA (13 %), and three oxygenated organic aerosols, including a semi-volatile SV-OOA (19 %), a MO-OOA (28 %) associated with long-range transport of polluted continental air masses, and a LO-OOA (37 %) related to aged biogenic aerosol. Using the correlation between HOA, BBOA, and MO-OOA with eBC, a multilinear regression approach was applied to perform the source apportionment of eBC. This analysis highlights eBC contributions related to the sources of HOA (35 %), BBOA (13 %), and MO-OOA (52 %). It was, therefore, possible to distinguish local eBC emissions (48 % of the total eBC) dominated by fossil fuel combustion (73 % of the local eBC) from long-range transported eBC. Size-resolved EC from the Berner impactor supports our findings and confirms the applicability of the size cut-off at 400 nm for distinguishing local EC (<400 nm) from transported EC (>400 nm), as mentioned by Healy et al. (2012). Local sources of organic aerosol appear to play a smaller role compared to long-range transport, which is responsible for 65 % of OA. These results confirm the importance of long-range transport to the total mass concentration of OA and eBC and not only during high-pollution events (e.g., van Pinxteren et al., 2019; Petit et al., 2017; Waked et al., 2018). HOA and BBOA are properly depicted by the primary anthropogenic sources of liquid fuel and biomass burning emissions, respectively. However, during their transport, aging processes will lead to signatures closer to OOA (Jimenez et al., 2009). A direct consequence is that the MO-OOA, associated with long-range transport of polluted air masses, might result from such aging processes of anthropogenic sources, and it highlights the complexity of the internal chemical composition of the OOAs. Consequently, further efforts should be made in the future to improve the identification of OOAs in order to properly distinguish between biogenic SOA and anthropogenic SOA and between locally formed and transported SOA, which could be critical for rural and remote stations.
All data are available from the corresponding author upon request.
The supplement related to this article is available online at: https://doi.org/10.5194/acp-21-3667-2021-supplement.
LP, FB, GS, KM, DvP, ZW, and YI collected the data, and LP performed data analysis on the AMS. FB, GS, KM, DvP, ZW, and YI contributed to the evaluation of the offline chemical analysis data set, and WB evaluated the MPSS data set. All coauthors participated in the interpretation of the results. LP led the writing of the paper, with contributions from all authors.
The authors declare that they have no conflict of interest.
This article is part of the special issue “HCCT-2010: a complex ground-based experiment on aerosol-cloud interaction”. It is not associated with a conference.
This research has been supported by the Deutsche Forschungsgemeinschaft (grant no. He 3086/15-1).
The publication of this article was funded by the
Open Access Fund of the Leibniz Association.
This paper was edited by Lea Hildebrandt Ruiz and reviewed by two anonymous referees.
Aiken, A. C., Decarlo, P. F., Kroll, J. H., Worsnop, D. R., Huffman, J. A., Docherty, K. S., Ulbrich, I. M., Mohr, C., Kimmel, J. R., Sueper, D., Sun, Y., Zhang, Q., Trimborn, A., Northway, M., Ziemann, P. J., Canagaratna, M. R., Onasch, T. B., Alfarra, M. R., Prevot, A. S. H., Dommen, J., Duplissy, J., Metzger, A., Baltensperger, U., and Jimenez, J. L.: and ratios of primary, secondary, and ambient organic aerosols with high-resolution time-of-flight aerosol mass spectrometry, Environ. Sci. Technol., 42, 4478–4485, https://doi.org/10.1021/es703009q, 2008.
Allan, J., Delia, A. E., Coe, H., Bower, K. N., Alfarra, R. M., Jimenez, J. L., Middlebrook, A. M., Drewnick, F., Onasch, T. B., Canagaratna, M. R., Jayne, J. T., and Worsnop, D. R.: A generalised method for the extraction of chemically resolved mass spectra from Aerodyne aerosol mass spectrometer data, J. Aerosol Sci., 35, 909–922, https://doi.org/10.1016/j.jaerosci.2004.02.007, 2004.
Berner, A. and Lurzer, C.: Mass Size Distributions of Traffic Aerosols at Vienna, J. Phys. Chem.-US, 84, 2079–2083, https://doi.org/10.1021/j100453a016, 1980.
Birmili, W., Stratmann, F., and Wiedensohler, A.: Design of a DMA-based size spectrometer for a large particle size range and stable operation, J. Aerosol Sci., 30, 549–553, https://doi.org/10.1016/S0021-8502(98)00047-0, 1999.
Birmili, W., Berresheim, H., Plass-Dülmer, C., Elste, T., Gilge, S., Wiedensohler, A., and Uhrner, U.: The Hohenpeissenberg aerosol formation experiment (HAFEX): a long-term study including size-resolved aerosol, H2SO4, OH, and monoterpenes measurements, Atmos. Chem. Phys., 3, 361–376, https://doi.org/10.5194/acp-3-361-2003, 2003.
Bohlmann, N., Meissner, R., Bernsdorf, S., Bohme, F., Russow, R., and Wegener, U.: Studies of atmospheric nitrogen deposition in a mire of the German National Park Hochharz Mountains using two different methods, Water Air Soil Poll., 168, 17–32, https://doi.org/10.1007/s11270-005-0587-0, 2005.
Bruns, E. A., Perraud, V., Zelenyuk, A., Ezell, M. J., Johnson, S. N., Yu, Y., Imre, D., Finlayson-Pitts, B. J., and Alexander, M. L.: Comparison of FTIR and Particle Mass Spectrometry for the Measurement of Particulate Organic Nitrates, Environ. Sci. Technol., 44, 1056–1061, https://doi.org/10.1021/Es9029864, 2010.
Burnett, R. T., Pope, C. A., Ezzati, M., Olives, C., Lim, S. S., Mehta, S., Shin, H. H., Singh, G., Hubbell, B., Brauer, M., Anderson, H. R., Smith, K. R., Balmes, J. R., Bruce, N. G., Kan, H. D., Laden, F., Pruss-Ustun, A., Michelle, C. T., Gapstur, S. M., Diver, W. R., and Cohen, A.: An Integrated Risk Function for Estimating the Global Burden of Disease Attributable to Ambient Fine Particulate Matter Exposure, Environ. Health Perspect., 122, 397–403, 2014.
Cabada, J. C., Pandis, S. N., and Robinson, A. L.: Sources of atmospheric carbonaceous particulate matter in Pittsburgh, Pennsylvania, J. Air Waste Manage., 52, 732–741, https://doi.org/10.1080/10473289.2002.10470811, 2002.
Canagaratna, M. R., Jimenez, J. L., Kroll, J. H., Chen, Q., Kessler, S. H., Massoli, P., Hildebrandt Ruiz, L., Fortner, E., Williams, L. R., Wilson, K. R., Surratt, J. D., Donahue, N. M., Jayne, J. T., and Worsnop, D. R.: Elemental ratio measurements of organic compounds using aerosol mass spectrometry: characterization, improved calibration, and implications, Atmos. Chem. Phys., 15, 253–272, https://doi.org/10.5194/acp-15-253-2015, 2015.
Canonaco, F., Crippa, M., Slowik, J. G., Baltensperger, U., and Prévôt, A. S. H.: SoFi, an IGOR-based interface for the efficient use of the generalized multilinear engine (ME-2) for the source apportionment: ME-2 application to aerosol mass spectrometer data, Atmos. Meas. Tech., 6, 3649–3661, https://doi.org/10.5194/amt-6-3649-2013, 2013.
Carslaw, D. C. and Ropkins, K.: openair – An R package for air quality data analysis, Environ. Modell. Softw., 27–28, 52–61, 2012.
Crippa, M., Canonaco, F., Lanz, V. A., Äijälä, M., Allan, J. D., Carbone, S., Capes, G., Ceburnis, D., Dall'Osto, M., Day, D. A., DeCarlo, P. F., Ehn, M., Eriksson, A., Freney, E., Hildebrandt Ruiz, L., Hillamo, R., Jimenez, J. L., Junninen, H., Kiendler-Scharr, A., Kortelainen, A.-M., Kulmala, M., Laaksonen, A., Mensah, A. A., Mohr, C., Nemitz, E., O'Dowd, C., Ovadnevaite, J., Pandis, S. N., Petäjä, T., Poulain, L., Saarikoski, S., Sellegri, K., Swietlicki, E., Tiitta, P., Worsnop, D. R., Baltensperger, U., and Prévôt, A. S. H.: Organic aerosol components derived from 25 AMS data sets across Europe using a consistent ME-2 based source apportionment approach, Atmos. Chem. Phys., 14, 6159–6176, https://doi.org/10.5194/acp-14-6159-2014, 2014.
Dasgupta, P. K., Campbell, S. W., Al-Horr, R. S., Ullah, S. M. R., Li, J. Z., Amalfitano, C., and Poor, N. D.: Conversion of sea salt aerosol to NaNO3 and the production of HCl: Analysis of temporal behavior of aerosol chloride/nitrate and gaseous HCl/HNO3 concentrations with AIM, Atmos. Environ., 41, 4242–4257, https://doi.org/10.1016/j.atmosenv.2006.09.054, 2007.
DeCarlo, P. F., Kimmel, J. R., Trimborn, A., Northway, M. J., Jayne, J. T., Aiken, A. C., Gonin, M., Fuhrer, K., Horvath, T., Docherty, K. S., Worsnop, D. R., and Jimenez, J. L.: Field-deployable, high-resolution, time-of-flight aerosol mass spectrometer, Anal. Chem., 78, 8281–8289, https://doi.org/10.1021/ac061249n, 2006.
Donahue, N. M., Robinson, A. L., Trump, E. R., Riipinen, I., and Kroll, J. H.: Volatility and Aging of Atmospheric Organic Aerosol, in: Atmospheric and Aerosol Chemistry, edited by: McNeill, V. F. and Ariya, P. A., Springer, Berlin, Heidelberg, 97–143, 2014.
Draxler, R. and Hess, G.: Description of the HYSPLIT4 modeling system, NOAA Technical Memorandum, ERL, ARL-224, available at: https://www.arl.noaa.gov/documents/reports/arl-224.pdf (last access: 15 February 2021), 2004.
Farmer, D. K., Matsunaga, A., Docherty, K. S., Surratt, J. D., Seinfeld, J. H., Ziemann, P. J., and Jimenez, J. L.: Response of an aerosol mass spectrometer to organonitrates and organosulfates and implications for atmospheric chemistry, P. Natl. Acad. Sci. USA, 107, 6670–6675, https://doi.org/10.1073/pnas.0912340107, 2010.
Farmer, D. K., Cappa, C. D., and Kreidenweis, S. M.: Atmospheric Processes and Their Controlling Influence on Cloud Condensation Nuclei Activity, Chem. Rev., 115, 4199–4217, https://doi.org/10.1021/cr5006292, 2015.
Gaeggeler, K., Prevot, A. S. H., Dommen, J., Legreid, G., Reimann, S., and Baltensperger, U.: Residential wood burning in an Alpine valley as a source for oxygenated volatile organic compounds, hydrocarbons and organic acids, Atmos. Environ., 42, 8278–8287, https://doi.org/10.1016/j.atmosenv.2008.07.038, 2008.
Harris, E., Sinha, B., van Pinxteren, D., Tilgner, A., Fomba, K. W., Schneider, J., Roth, A., Gnauk, T., Fahlbusch, B., Mertes, S., Lee, T., Collett, J., Foley, S., Borrmann, S., Hoppe, P., and Herrmann, H.: Enhanced Role of Transition Metal Ion Catalysis During In-Cloud Oxidation of SO2, Science, 340, 727–730, https://doi.org/10.1126/science.1230911 2013.
Healy, R. M., Sciare, J., Poulain, L., Kamili, K., Merkel, M., Müller, T., Wiedensohler, A., Eckhardt, S., Stohl, A., Sarda-Estève, R., McGillicuddy, E., O'Connor, I. P., Sodeau, J. R., and Wenger, J. C.: Sources and mixing state of size-resolved elemental carbon particles in a European megacity: Paris, Atmos. Chem. Phys., 12, 1681–1700, https://doi.org/10.5194/acp-12-1681-2012, 2012.
Heintzenberg, J., Wiedensohler, A., Tuch, T. M., Covert, D. S., Sheridan, P., Ogren, J. A., Gras, J., Nessler, R., Kleefeld, C., Kalivitis, N., Aaltonen, V., Wilhelm, R. T., and Havlicek, M.: Intercomparisons and aerosol calibrations of 12 commercial integrating nephelometers of three manufacturers, J. Atmos. Ocean. Tech., 23, 902–914, 2006.
Helmig, D., Daly, R. W., Milford, J., and Guenther, A.: Seasonal trends of biogenic terpene emissions, Chemosphere, 93, 35–46, https://doi.org/10.1016/j.chemosphere.2013.04.058, 2013.
Herich, H., Hueglin, C., and Buchmann, B.: A 2.5 year's source apportionment study of black carbon from wood burning and fossil fuel combustion at urban and rural sites in Switzerland, Atmos. Meas. Tech., 4, 1409–1420, https://doi.org/10.5194/amt-4-1409-2011, 2011.
Herrmann, H., Wolke, R., Müller, K., Bruggemann, E., Gnauk, T., Barzaghi, P., Mertes, S., Lehmann, K., Massling, A., Birmili, W., Wiedensohler, A., Wierprecht, W., Acker, K., Jaeschke, W., Kramberger, H., Svrcina, B., Bachmann, K., Collett, J. L., Galgon, D., Schwirn, K., Nowak, A., van Pinxteren, D., Plewka, A., Chemnitzer, R., Rud, C., Hofmann, D., Tilgner, A., Diehl, K., Heinold, B., Hinneburg, D., Knoth, O., Sehili, A. M., Simmel, M., Wurzler, S., Majdik, Z., Mauersberger, G., and Muller, F.: FEBUKO and MODMEP: Field measurements and modelling of aerosol and cloud multiphase processes, Atmos. Environ., 39, 4169–4183, 2005.
IPCC: Climate Change 2013: The Physical Science Basis, Contribution of Working Group I to the Fifth Assessment Report of the Intergovernmental Panel on Climate Change, Cambridge University Press, Cambridge, United Kingdom and New York, USA, 1535 pp., 2013.
Jickells, T. D., An, Z. S., Andersen, K. K., Baker, A. R., Bergametti, G., Brooks, N., Cao, J. J., Boyd, P. W., Duce, R. A., Hunter, K. A., Kawahata, H., Kubilay, N., la Roche, J., Liss, P. S., Mahowald, N., Prospero, J. M., Ridgwell, A. J., Tegen, I., and Torres, R.: Global iron connections between desert dust, ocean biogeochemistry, and climate, Science, 308, 67–71, https://doi.org/10.1126/science.1105959, 2005.
Jimenez, J. L., Canagaratna, M. R., Donahue, N. M., Prevot, A. S. H., Zhang, Q., Kroll, J. H., DeCarlo, P. F., Allan, J. D., Coe, H., Ng, N. L., Aiken, A. C., Docherty, K. S., Ulbrich, I. M., Grieshop, A. P., Robinson, A. L., Duplissy, J., Smith, J. D., Wilson, K. R., Lanz, V. A., Hueglin, C., Sun, Y. L., Tian, J., Laaksonen, A., Raatikainen, T., Rautiainen, J., Vaattovaara, P., Ehn, M., Kulmala, M., Tomlinson, J. M., Collins, D. R., Cubison, M. J., Dunlea, E. J., Huffman, J. A., Onasch, T. B., Alfarra, M. R., Williams, P. I., Bower, K., Kondo, Y., Schneider, J., Drewnick, F., Borrmann, S., Weimer, S., Demerjian, K., Salcedo, D., Cottrell, L., Griffin, R., Takami, A., Miyoshi, T., Hatakeyama, S., Shimono, A., Sun, J. Y., Zhang, Y. M., Dzepina, K., Kimmel, J. R., Sueper, D., Jayne, J. T., Herndon, S. C., Trimborn, A. M., Williams, L. R., Wood, E. C., Middlebrook, A. M., Kolb, C. E., Baltensperger, U., and Worsnop, D. R.: Evolution of organic aerosols in the atmosphere, Science, 326, 1525–1529, https://doi.org/10.1126/science.1180353, 2009.
Kulmala, M., Vehkamaki, H., Petaja, T., Dal Maso, M., Lauri, A., Kerminen, V. M., Birmili, W., and McMurry, P. H.: Formation and growth rates of ultrafine atmospheric particles: a review of observations, J. Aerosol Sci., 35, 143–176, https://doi.org/10.1016/j.jaerosci.2003.10.003, 2004.
Laborde, M., Crippa, M., Tritscher, T., Jurányi, Z., Decarlo, P. F., Temime-Roussel, B., Marchand, N., Eckhardt, S., Stohl, A., Baltensperger, U., Prévôt, A. S. H., Weingartner, E., and Gysel, M.: Black carbon physical properties and mixing state in the European megacity Paris, Atmos. Chem. Phys., 13, 5831–5856, https://doi.org/10.5194/acp-13-5831-2013, 2013.
Lee, A. K. Y., Abbatt, J. P. D., Leaitch, W. R., Li, S.-M., Sjostedt, S. J., Wentzell, J. J. B., Liggio, J., and Macdonald, A. M.: Substantial secondary organic aerosol formation in a coniferous forest: observations of both day- and nighttime chemistry, Atmos. Chem. Phys., 16, 6721–6733, https://doi.org/10.5194/acp-16-6721-2016, 2016.
Lelieveld, J., Evans, J. S., Fnais, M., Giannadaki, D., and Pozzer, A.: The contribution of outdoor air pollution sources to premature mortality on a global scale, Nature, 525, 367–371, 2015.
Liakakou, E., Kaskaoutis, D. G., Grivas, G., Stavroulas, I., Tsagkaraki, M., Paraskevopoulou, D., Bougiatioti, A., Dumka, U. C., Gerasopoulos, E., and Mihalopoulos, N.: Long-term brown carbon spectral characteristics in a mediterranean city (Athens), Sci. Total Environ., 708, 135019, https://doi.org/10.1016/j.scitotenv.2019.135019, 2020.
Lipsky, E. M. and Robinson, A. L.: Effects of dilution on fine particle mass and partitioning of semivolatile organics in diesel exhaust and wood smoke, Environ. Sci. Technol., 40, 155–162, https://doi.org/10.1021/es050319p, 2006.
Makkonen, U., Virkkula, A., Mäntykenttä, J., Hakola, H., Keronen, P., Vakkari, V., and Aalto, P. P.: Semi-continuous gas and inorganic aerosol measurements at a Finnish urban site: comparisons with filters, nitrogen in aerosol and gas phases, and aerosol acidity, Atmos. Chem. Phys., 12, 5617–5631, https://doi.org/10.5194/acp-12-5617-2012, 2012.
Martinsson, J., Abdul Azeem, H., Sporre, M. K., Bergström, R., Ahlberg, E., Öström, E., Kristensson, A., Swietlicki, E., and Eriksson Stenström, K.: Carbonaceous aerosol source apportionment using the Aethalometer model – evaluation by radiocarbon and levoglucosan analysis at a rural background site in southern Sweden, Atmos. Chem. Phys., 17, 4265–4281, https://doi.org/10.5194/acp-17-4265-2017, 2017.
May, A. A., Levin, E. J. T., Hennigan, C. J., Riipinen, I., Lee, T., Collett, J. L., Jimenez, J. L., Kreidenweis, S. M., and Robinson, A. L.: Gas-particle partitioning of primary organic aerosol emissions: 3. Biomass burning, J. Geophys. Res.-Atmos., 118, 11327–11338, https://doi.org/10.1002/jgrd.50828, 2013.
Middlebrook, A. M., Bahreini, R., Jimenez, J. L., and Canagaratna, M. R.: Evaluation of Composition-Dependent Collection Efficiencies for the Aerodyne Aerosol Mass Spectrometer using Field Data, Aerosol Sci. Tech., 46, 258–271, https://doi.org/10.1080/02786826.2011.620041, 2012.
Mohr, C., DeCarlo, P. F., Heringa, M. F., Chirico, R., Slowik, J. G., Richter, R., Reche, C., Alastuey, A., Querol, X., Seco, R., Peñuelas, J., Jiménez, J. L., Crippa, M., Zimmermann, R., Baltensperger, U., and Prévôt, A. S. H.: Identification and quantification of organic aerosol from cooking and other sources in Barcelona using aerosol mass spectrometer data, Atmos. Chem. Phys., 12, 1649–1665, https://doi.org/10.5194/acp-12-1649-2012, 2012.
Moise, T., Flores, J. M., and Rudich, Y.: Optical Properties of Secondary Organic Aerosols and Their Changes by Chemical Processes, Chem. Rev., 115, 4400–4439, 2015.
Murphy, B. N., Woody, M. C., Jimenez, J. L., Carlton, A. M. G., Hayes, P. L., Liu, S., Ng, N. L., Russell, L. M., Setyan, A., Xu, L., Young, J., Zaveri, R. A., Zhang, Q., and Pye, H. O. T.: Semivolatile POA and parameterized total combustion SOA in CMAQv5.2: impacts on source strength and partitioning, Atmos. Chem. Phys., 17, 11107–11133, https://doi.org/10.5194/acp-17-11107-2017, 2017.
Ortega, A. M., Day, D. A., Cubison, M. J., Brune, W. H., Bon, D., de Gouw, J. A., and Jimenez, J. L.: Secondary organic aerosol formation and primary organic aerosol oxidation from biomass-burning smoke in a flow reactor during FLAME-3, Atmos. Chem. Phys., 13, 11551–11571, https://doi.org/10.5194/acp-13-11551-2013, 2013.
Paatero, P.: The multilinear engine – A table-driven, least squares program for solving multilinear problems, including the n-way parallel factor analysis model, J. Comput. Graph. Stat., 8, 854–888, https://doi.org/10.2307/1390831, 1999.
Petit, J. E., Amodeo, T., Meleux, F., Bessagnet, B., Menut, L., Grenier, D., Pellan, Y., Ockler, A., Rocq, B., Gros, V., Sciare, J., and Favez, O.: Characterising an intense PM pollution episode in March 2015 in France from multi-site approach and near real time data: Climatology, variabilities, geographical origins and model evaluation, Atmos. Environ., 155, 68–84, https://doi.org/10.1016/j.atmosenv.2017.02.012, 2017.
Petzold, A. and Schönlinner, M.: Multi-angle absorption photometry – a new method for the measurement of aerosol light absorption and atmospheric black carbon, J. Aerosol Sci., 35, 421–441, https://doi.org/10.1016/j.jaerosci.2003.09.005, 2004.
Pope, C. A., Brook, R. D., Burnett, R. T., and Dockery, D. W.: How is cardiovascular disease mortality risk affected by duration and intensity of fine particulate matter exposure? An integration of the epidemiologic evidence, Air Qual. Atmos. Hlth., 4, 5–14, 2011.
Poulain, L., Iinuma, Y., Müller, K., Birmili, W., Weinhold, K., Brüggemann, E., Gnauk, T., Hausmann, A., Löschau, G., Wiedensohler, A., and Herrmann, H.: Diurnal variations of ambient particulate wood burning emissions and their contribution to the concentration of Polycyclic Aromatic Hydrocarbons (PAHs) in Seiffen, Germany, Atmos. Chem. Phys., 11, 12697–12713, https://doi.org/10.5194/acp-11-12697-2011, 2011.
Rappenglück, B., Apel, E., Bauerfeind, M., Bottenheim, J., Brickell, P., Cavolka, P., Cech, J., Gatti, L., Hakola, H., Honzak, J., Junek, R., Martin, D., Noone, C., Plass-Dülmer, C., Travers, D., and Wang, D.: The first VOC intercomparison exercise within the Global Atmosphere Watch (GAW), Atmos. Environ., 40, 7508–7527, 2006.
Ropkins, K. and Carslaw, D. C.: openair – Data Analysis Tools for the Air Quality Community, R J., 4, 20–29, 2012.
Roth, A., Schneider, J., Klimach, T., Mertes, S., van Pinxteren, D., Herrmann, H., and Borrmann, S.: Aerosol properties, source identification, and cloud processing in orographic clouds measured by single particle mass spectrometry on a central European mountain site during HCCT-2010, Atmos. Chem. Phys., 16, 505–524, https://doi.org/10.5194/acp-16-505-2016, 2016.
Rumsey, I. C., Cowen, K. A., Walker, J. T., Kelly, T. J., Hanft, E. A., Mishoe, K., Rogers, C., Proost, R., Beachley, G. M., Lear, G., Frelink, T., and Otjes, R. P.: An assessment of the performance of the Monitor for AeRosols and GAses in ambient air (MARGA): a semi-continuous method for soluble compounds, Atmos. Chem. Phys., 14, 5639–5658, https://doi.org/10.5194/acp-14-5639-2014, 2014.
Sandradewi, J., Prevot, A. S. H., Szidat, S., Perron, N., Alfarra, M. R., Lanz, V. A., Weingartner, E., and Baltensperger, U.: Using aerosol light absorption measurements for the quantitative determination of wood burning and traffic emission contributions to particulate matter, Environ. Sci. Technol., 42, 3316–3323, https://doi.org/10.1021/Es702253m, 2008.
Schauer, J. J. and Cass, G. R.: Source apportionment of wintertime gas-phase and particle-phase air pollutants using organic compounds as tracers, Environ. Sci. Technol., 34, 1821–1832, 2000.
Schlag, P., Kiendler-Scharr, A., Blom, M. J., Canonaco, F., Henzing, J. S., Moerman, M., Prévôt, A. S. H., and Holzinger, R.: Aerosol source apportionment from 1-year measurements at the CESAR tower in Cabauw, the Netherlands, Atmos. Chem. Phys., 16, 8831–8847, https://doi.org/10.5194/acp-16-8831-2016, 2016.
Schneider, J., Weimer, S., Drewnick, F., Borrmann, S., Helas, G., Gwaze, P., Schmid, O., Andreae, M. O., and Kirchner, U.: Mass spectrometric analysis and aerodynamic properties of various types of combustion-related aerosol particles, Int. J. Mass Spectrom., 258, 37–49, https://doi.org/10.1016/j.ijms.2006.07.008, 2006.
Spindler, G., Grüner, A., Müller, K., Schlimper, S., and Herrmann, H.: Long-term size-segregated particle (PM10, PM2.5, PM1) characterization study at Melpitz – influence of air mass inflow, weather conditions and season, J. Atmos. Chem., 70, 165–195, https://doi.org/10.1007/s10874-013-9263-8, 2013.
Srivastava, D., Tomaz, S., Favez, O., Lanzafame, G. M., Golly, B., Besombes, J. L., Alleman, L. Y., Jaffrezo, J. L., Jacob, V., Perraudin, E., Villenave, E., and Albinet, A.: Speciation of organic fraction does matter for source apportionment, Part 1: A 1-year campaign in Grenoble (France), Sci. Total Environ., 624, 1598–1611, https://doi.org/10.1016/j.scitotenv.2017.12.135, 2018.
Srivastava, D., Favez, O., Petit, J. E., Zhang, Y., Sofowote, U. M., Hopke, P. K., Bonnaire, N., Perraudin, E., Gros, V., Villenave, E., and Albinet, A.: Speciation of organic fractions does matter for aerosol source apportionment, Part 3: Combining off-line and on-line measurements, Sci. Total Environ., 690, 944–955, https://doi.org/10.1016/j.scitotenv.2019.06.378, 2019.
Stieger, B., Spindler, G., Fahlbusch, B., Muller, K., Gruner, A., Poulain, L., Thoni, L., Seitler, E., Wallasch, M., and Herrmann, H.: Measurements of PM10 ions and trace gases with the online system MARGA at the research station Melpitz in Germany – A five-year study, J. Atmos. Chem., 75, 33–70, https://doi.org/10.1007/s10874-017-9361-0, 2018.
Stieger, B., Spindler, G., Fahlbusch, B., Müller, K., Gruner, A., Poulain, L., Thoni, L., Seitler, E., Wallasch, M., and Herrmann, H.: Measurements of PM10 ions and trace gases with the online system MARGA at the research station Melpitz in Germany – A 5-year study, J. Atmos. Chem., 75, 33–70, https://doi.org/10.1007/s10874-017-9361-0, 2018.
Tilgner, A., Schöne, L., Bräuer, P., van Pinxteren, D., Hoffmann, E., Spindler, G., Styler, S. A., Mertes, S., Birmili, W., Otto, R., Merkel, M., Weinhold, K., Wiedensohler, A., Deneke, H., Schrödner, R., Wolke, R., Schneider, J., Haunold, W., Engel, A., Wéber, A., and Herrmann, H.: Comprehensive assessment of meteorological conditions and airflow connectivity during HCCT-2010, Atmos. Chem. Phys., 14, 9105–9128, https://doi.org/10.5194/acp-14-9105-2014, 2014.
Tuch, T. M., Haudek, A., Müller, T., Nowak, A., Wex, H., and Wiedensohler, A.: Design and performance of an automatic regenerating adsorption aerosol dryer for continuous operation at monitoring sites, Atmos. Meas. Tech., 2, 417–422, https://doi.org/10.5194/amt-2-417-2009, 2009.
Twigg, M. M., Di Marco, C. F., Leeson, S., van Dijk, N., Jones, M. R., Leith, I. D., Morrison, E., Coyle, M., Proost, R., Peeters, A. N. M., Lemon, E., Frelink, T., Braban, C. F., Nemitz, E., and Cape, J. N.: Water soluble aerosols and gases at a UK background site – Part 1: Controls of PM2.5 and PM10 aerosol composition, Atmos. Chem. Phys., 15, 8131–8145, https://doi.org/10.5194/acp-15-8131-2015, 2015.
Ulbrich, I. M., Canagaratna, M. R., Zhang, Q., Worsnop, D. R., and Jimenez, J. L.: Interpretation of organic components from Positive Matrix Factorization of aerosol mass spectrometric data, Atmos. Chem. Phys., 9, 2891–2918, https://doi.org/10.5194/acp-9-2891-2009, 2009.
van Pinxteren, D., Brüggemann, E., Gnauk, T., Müller, K., Thiel, C., and Herrmann, H.: A GIS based approach to back trajectory analysis for the source apportionment of aerosol constituents and its first application, J. Atmos. Chem., 67, 1–28, https://doi.org/10.1007/s10874-011-9199-9, 2010.
van Pinxteren, D., Fomba, K. W., Spindler, G., Müller, K., Poulain, L., Iinuma, Y., Loschau, G., Hausmann, A., and Herrmann, H.: Regional air quality in Leipzig, Germany: detailed source apportionment of size-resolved aerosol particles and comparison with the year 2000, Faraday Discuss., 189, 291–315, https://doi.org/10.1039/c5fd00228a, 2016.
van Pinxteren, D., Mothes, F., Spindler, G., Fomba, K. W., and Herrmann, H.: Trans-boundary PM10: Quantifying impact and sources during winter 2016/2017 in eastern Germany, Atmos. Environ., 200, 119–130, https://doi.org/10.1016/j.atmosenv.2018.11.061, 2019.
Waked, A., Bourin, A., Michoud, V., Perdrix, E., Alleman, L. Y., Sauvage, S., Delaunay, T., Vermeesch, S., Petit, J. E., and Riffault, V.: Investigation of the geographical origins of PM10 based on long, medium and short-range air mass back-trajectories impacting Northern France during the period 2009–2013, Atmos. Environ., 193, 143–152, https://doi.org/10.1016/j.atmosenv.2018.08.015, 2018.
Wu, Z. J., Poulain, L., Birmili, W., Größ, J., Niedermeier, N., Wang, Z. B., Herrmann, H., and Wiedensohler, A.: Some insights into the condensing vapors driving new particle growth to CCN sizes on the basis of hygroscopicity measurements, Atmos. Chem. Phys., 15, 13071–13083, https://doi.org/10.5194/acp-15-13071-2015, 2015.
Zhang, Q., Jimenez, J. L., Worsnop, D. R., and Canagaratna, M. R.: A case study of urban particle acidity and its influence on secondary organic aerosol, Environ. Sci. Technol., 41, 3213–3219, https://doi.org/10.1021/es061812j, 2007.
Zhang, Q., Jimenez, J. L., Canagaratna, M. R., Ulbrich, I. M., Ng, N. L., Worsnop, D. R., and Sun, Y. L.: Understanding atmospheric organic aerosols via factor analysis of aerosol mass spectrometry: a review, Anal. Bioanal. Chem., 401, 3045–3067, 2011.
Zhu, Q., Huang, X.-F., Cao, L.-M., Wei, L.-T., Zhang, B., He, L.-Y., Elser, M., Canonaco, F., Slowik, J. G., Bozzetti, C., El-Haddad, I., and Prévôt, A. S. H.: Improved source apportionment of organic aerosols in complex urban air pollution using the multilinear engine (ME-2), Atmos. Meas. Tech., 11, 1049–1060, https://doi.org/10.5194/amt-11-1049-2018, 2018.