the Creative Commons Attribution 4.0 License.
the Creative Commons Attribution 4.0 License.
 | 04 Mar 2021
Shallow cumulus cloud feedback in large eddy simulations – bridging the gap to storm-resolving models
Thorsten Mauritsen
Cathy Hohenegger
The response of shallow trade cumulus clouds to global warming is a leading source of uncertainty in projections of the Earth's changing climate. A setup based on the Rain In Cumulus over the Ocean field campaign is used to simulate a shallow trade wind cumulus field with the Icosahedral Nonhydrostatic Large Eddy Model in a control and a perturbed 4 K warmer climate, while degrading horizontal resolution from 100 m to 5 km. As the resolution is coarsened, the base-state cloud fraction increases substantially, especially near cloud base, lateral mixing is weaker, and cloud tops reach higher. Nevertheless, the overall vertical structure of the cloud layer is surprisingly robust across resolutions. In a warmer climate, cloud cover reduces, alone constituting a positive shortwave cloud feedback: the strength correlates with the amount of base-state cloud fraction and thus is stronger at coarser resolutions. Cloud thickening, resulting from more water vapour availability for condensation in a warmer climate, acts as a compensating feedback, but unlike the cloud cover reduction it is largely resolution independent. Therefore, refining the resolution leads to convergence to a near-zero shallow cumulus feedback. This dependence holds in experiments with enhanced realism including precipitation processes or warming along a moist adiabat instead of uniform warming. Insofar as these findings carry over to other models, they suggest that storm-resolving models may exaggerate the trade wind cumulus cloud feedback.
- Article
(2573 KB) - Full-text XML
- BibTeX
- EndNote


How shallow cumulus clouds respond to global warming has been recognized as a critical source of uncertainty to process- or model-based estimates and interpretations of the Earth's changing climate (Bony and Dufresne, 2005; Vial et al., 2013; Zelinka et al., 2020; Flynn and Mauritsen, 2020; Sherwood et al., 2020). Most frequently, shallow cumulus clouds are observed in the tropical trade wind region and thus often called trade wind cumuli, even if they appear in most regions on Earth. Due to their widespread occurrence over the world's oceans, shallow cumuli are, though small in size, crucial to the Earth's radiative balance and act to cool the Earth by reflecting shortwave radiation (Hartmann et al., 1992). Their response to global warming is therefore important for the global-mean cloud feedback. Actually, it is their differing response to warming that explains much of the disagreement in climate sensitivity across climate models (Bony and Dufresne, 2005; Webb et al., 2006; Vial et al., 2013; Boucher et al., 2013; Medeiros et al., 2015; Zelinka et al., 2020; Flynn and Mauritsen, 2020). Most global climate models (GCMs) simulate a positive low cloud feedback primarily due to reduction of cloud cover in response to warming. In models probed in the fifth phase of the Coupled Model Intercomparison Project (CMIP5), the low-level cloud feedback varies between 0.16 and 0.94 W m−2, with most of the spread coming from the low-cloud amount feedback, the latter with values ranging between −0.09 and 0.63 W m−2 (Boucher et al., 2013; Zelinka et al., 2016).
Emerging tools to advance understanding are global high-resolution models that – unlike climate models – explicitly simulate convective motions instead of parameterizing them (Stevens et al., 2020). In past studies of shallow cumulus clouds and their response to a warmer climate, mostly large eddy simulations (LESs) resolving hectometre-scale motions have been applied (Rieck et al., 2012; Blossey et al., 2013; Bretherton et al., 2013; Vogel et al., 2016; Stevens et al., 2001; Siebesma et al., 2003; van Zanten et al., 2011). LES is a turbulence modelling technique in which most of the energy-containing motions are explicitly resolved, but because of their computational expense LES studies have been limited in their domain size and timescales. Due to increasing computational power, it has become possible to run simulations on global domains, albeit at kilometre scales (e.g. Tomita, 2005; Stevens et al., 2019). These models are often called cloud-resolving or convection-permitting models (Prein et al., 2015), but here they are referred to as storm-resolving models (SRMs) following Klocke et al. (2017) and Stevens et al. (2019); see also Satoh et al. (2019) for a discussion of naming. Global SRMs provide the opportunity to study cloud feedbacks without having to rely on an uncertain convective parameterization and while interacting with the large-scale environment, but at a typical grid spacing of a few kilometres shallow convection remains poorly resolved.
This study aims to bridge the gap between findings based on limited-area large eddy simulations that typically use hectometre or finer grid spacings and emerging global storm-resolving models that apply kilometre grid spacings. It investigates how the representation of shallow cumuli and their climate feedback is affected by the choice of horizontal resolution. To do so, a setup based on the Rain In Cumulus over the Ocean field campaign is used (Rauber et al., 2007). A shallow trade cumulus field is simulated with the ICOsahedral Nonhydrostatic Large Eddy Model (ICON-LEM) (Dipankar et al., 2015; Heinze et al., 2017) in a control and a perturbed 4 K warmed climate while degrading horizontal resolution from 100 m to 5 km. The results are discussed by initially looking at the effect of resolution on the representation of shallow cumulus clouds in a control climate in Sect. 3 and subsequently on the response of shallow cumulus clouds to a warming climate in Sect. 4.
Experiments are conducted with ICON-LEM. ICON was developed in collaboration between the Max Planck Institute for Meteorology and the German Weather Service, and it solves the equations of motions on an unstructured triangular Arakawa C grid. For global applications, it is based on successive refinements of a spherical icosahedron (Zängl et al., 2015), but here instead a two-way cyclic torus domain is used. A detailed description of the LES version (ICON-LEM) can be found in Dipankar et al. (2015). In the specific ICON-LEM setup for this study, subgrid-scale turbulence is modelled based on the classical Smagorinsky scheme with modifications by Lilly (1962). For microphysical properties, the simple saturation adjustment scheme is used in experiments where precipitation is prohibited. In experiments with precipitation processes, a one-moment microphysics scheme including cloud water, rain, snow and ice with a constant cloud droplet concentration of 200 cm−3 (Doms et al., 2011) is applied. Radiation is computed with the Rapid Radiative Transfer Model (RRTM; Mlawer et al., 1997) scheme. A simple all-or-nothing scheme is applied for cloud fraction (Sommeria and Deardorff, 1977).
The setup is based on the Rain In Cumulus over the Ocean (RICO) measurement campaign (Rauber et al., 2007). The RICO case developed by van Zanten et al. (2011) prescribes large-scale forcings and initial profiles characteristic of the broader trades and serves as a control experiment representative of present climate conditions. Figure 1 shows the profiles used for initialization of potential temperature θ, specific humidity qv and the horizontal winds u and v. The large-scale forcing is prescribed with time-invariant profiles of the subsidence rate and temperature and moisture tendencies due to radiative cooling and horizontal advection. As a modification to the case defined by van Zanten et al. (2011), radiation is computed interactively online to be able to calculate cloud radiative effects, which requires a model top of about 20 km in ICON-LEM. Below 4 km height, initial profiles and large-scale forcings as in van Zanten et al. (2011), besides the radiative cooling, are applied; above, they are expanded accordingly, mostly with piecewise linear extrapolation; see Appendix A1 for details. Sea surface temperature is fixed at 299.8 K as in the RICO setup, and bulk aerodynamics formulas parameterize the surface momentum and thermodynamic fluxes. Simulations are performed on a pseudo-torus grid with doubly periodic boundary conditions and flat geometry. The domain is fixed over a central latitude of 18∘ N. In the vertical, 175 levels are used with grid spacings of 40 to 60 m beneath 5 km height, stretching to approximately 300 m at the model top of 22 km. Duration of the simulations is 48 h, and statistics shown are the second-day mean.
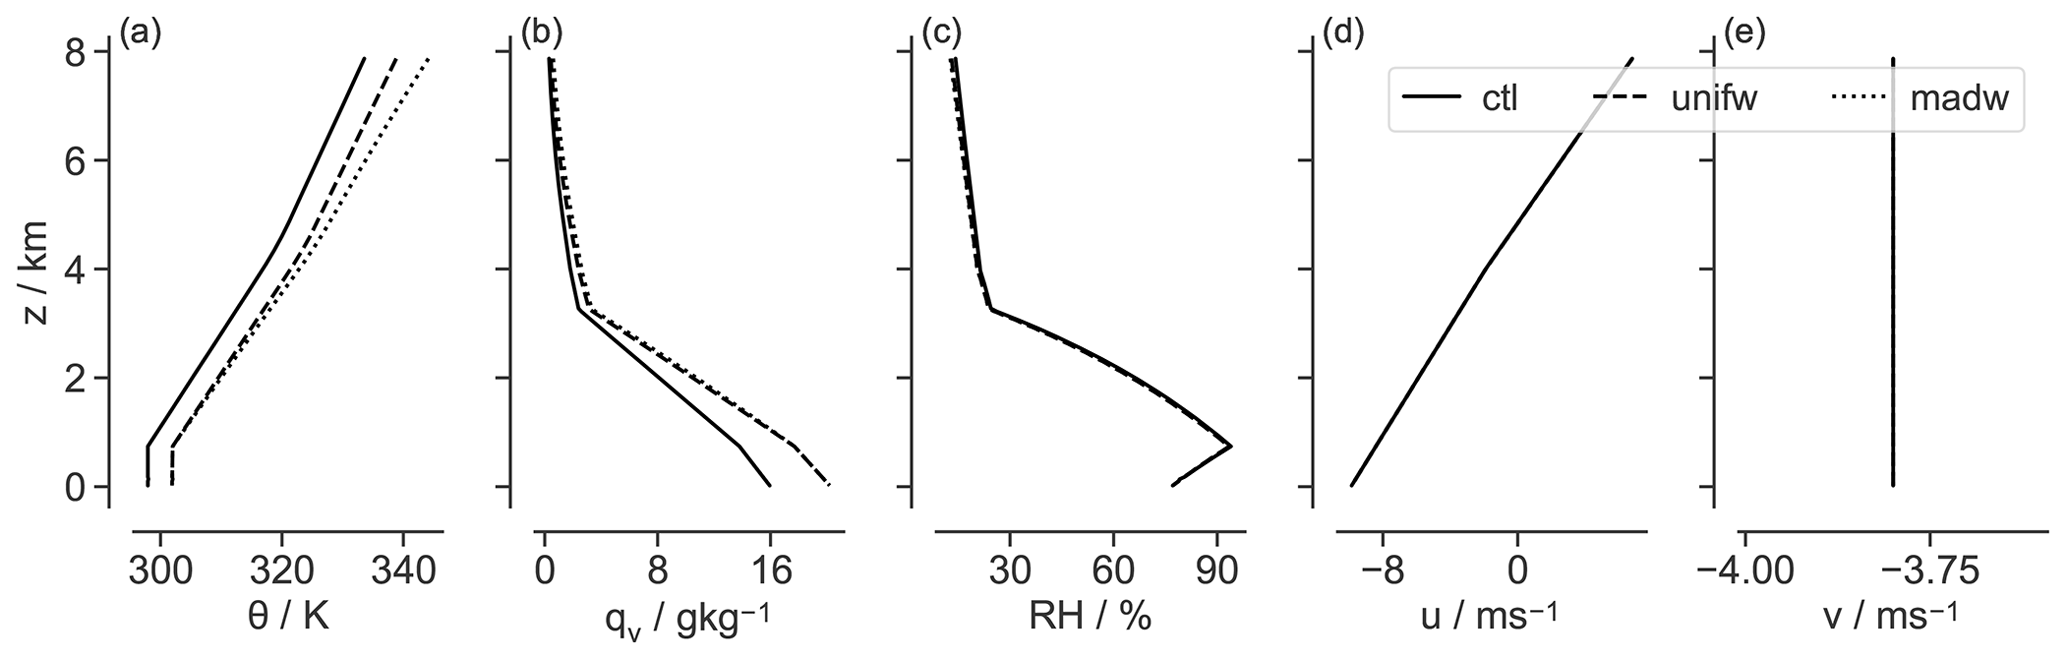
Figure 1Initial profiles of (a) potential temperature θ, (b) specific humidity qv, (c) relative humidity (RH), (d–e) horizontal winds u and v for the control (solid line) and the perturbed (vertically uniform warming, dashed line; warming following a moist adiabat, dotted line) climate states.
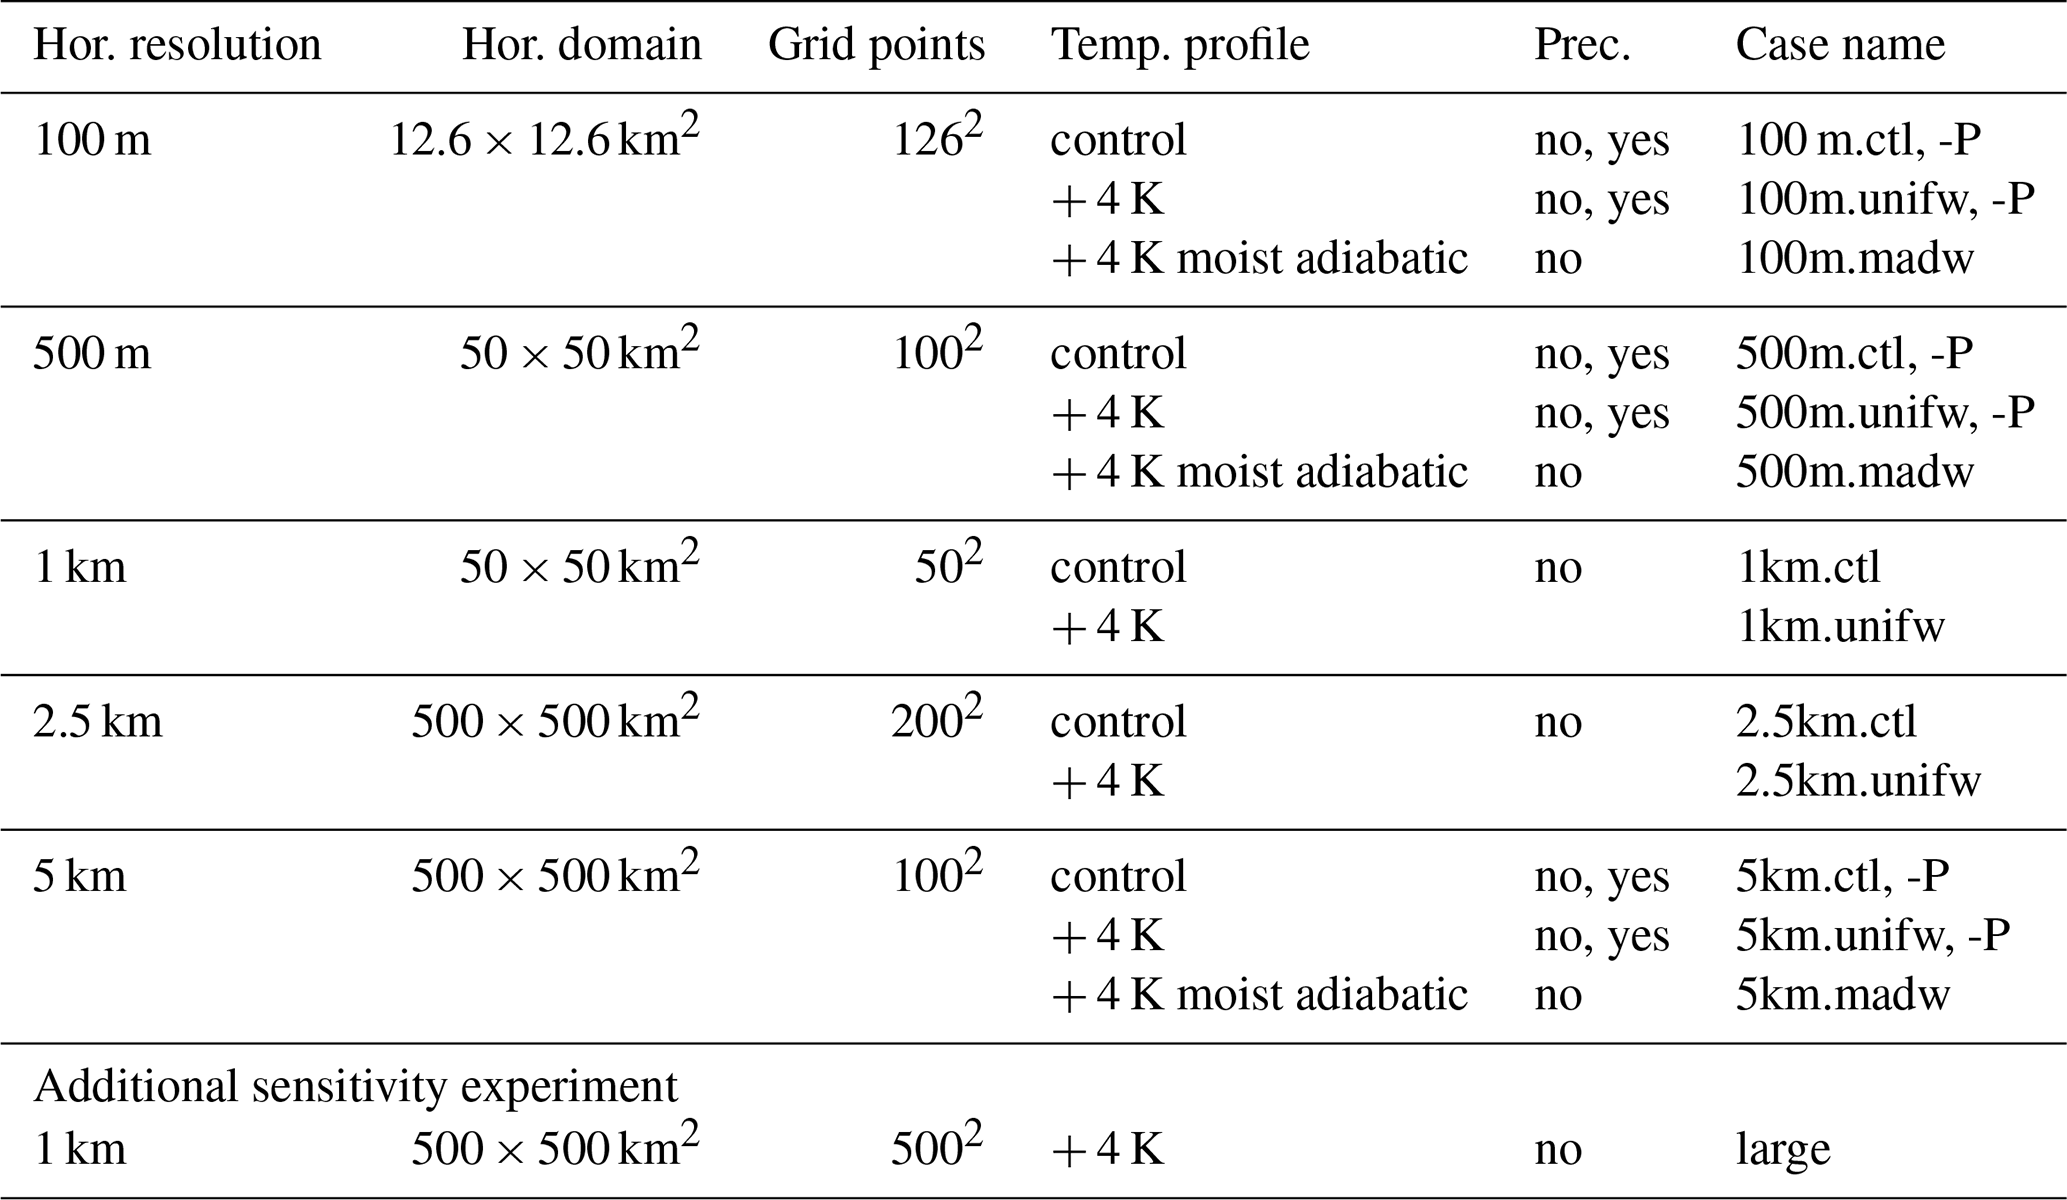
The warming experiment design follows a simple idealized climate change as used in, e.g. Rieck et al. (2012). It increases the temperature profile compared to the control run while keeping relative humidity constant. Simulations are run with five different horizontal resolutions: 100 m, 500 m, 1 km, 2.5 km and 5 km, employed on three different domain sizes. The domain sizes are chosen to be ideally suitable to run with two different horizontal resolutions. They span 50 to 200 points, resulting in domain sizes between 12 × 12 km and 500 × 500 km. The basic experiment inhibits precipitation and warms surface and atmosphere uniformly by 4 K as in Rieck et al. (2012). Furthermore, two refined experiments are conducted: one allowing precipitation to develop as in Vogel et al. (2016) and another one altering the vertical warming to follow a moist adiabat as in Blossey et al. (2013). These tests show how robust the findings are against simplifications made in the original experimental setup. See Table 1 for an overview of the different experiments.
Table 1Specifications used for the different perturbation experiments. Specific humidity in the perturbed runs (unifw and madw) is adjusted to keep the relative humidity constant compared to the control simulation.
In this section, we present characteristics of the simulated shallow cumulus regime in the control case and highlight similarities and differences as the resolution is coarsened. This lays out the groundwork to study in the following how shallow cumulus clouds respond to a perturbed warmer climate and how this depends on horizontal resolution (Sect. 4).
3.1 Standard case
At 100 m resolution, a typical trade wind cumuli field is simulated that is in line with the range of LES analysed in the RICO LES intercomparison case (van Zanten et al., 2011). Total cloud cover is 15 % (Fig. 2), which is slightly lower than the cloud cover of 17 % observed during the RICO field study (Nuijens et al., 2009) and the ensemble mean cloud cover of 19 % in the RICO intercomparison case (range of 9 %–38 %). The vertical structure is consistent with the general picture of trade wind cumuli cloud layers (Fig. 3). Cloud fraction peaks at cloud base (6 %) near 700 m, then decreases sharply with height, thereafter keeping a value of about 2 % through the cumulus layer until 2 km (Fig. 3). Above this height, cloud fraction increases again due to detrainment at cloud top before declining sharply under the trade inversion at around 2.5 km height, which develops as a result of the prescribed large-scale subsidence. Temperature increase and sharp humidity decrease mark the inversion and top of the cloud layer.
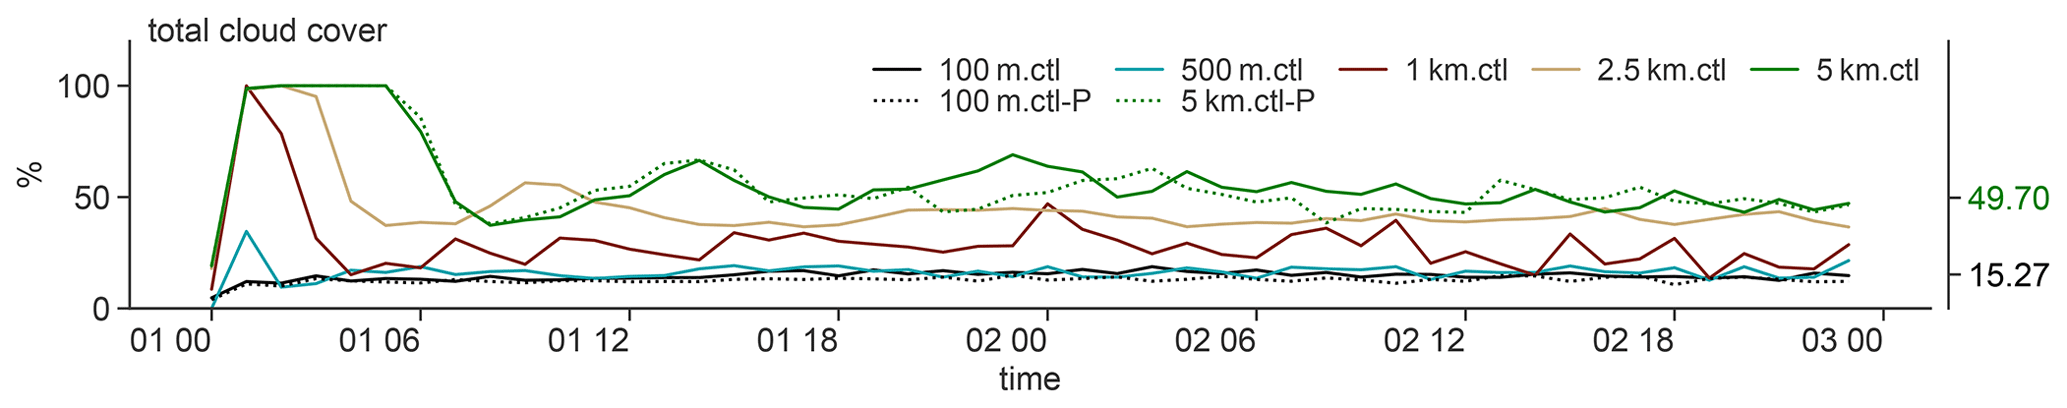
Figure 2Temporal evolution of total cloud cover in ctl at 100 m, 500 m, 1 km, 2.5 km and 5 km resolution (solid lines) and ctl-P at 100 m and 5 km resolution (dotted lines). Ordinates on the right axis display the second-day domain-averaged total cloud cover for 100m.ctl and 5km.ctl (see Tables 2 and 3 for more statistics).
At coarser resolutions, the overall structure of the boundary layer and cloud layer is surprisingly similar to the 100 m resolution simulation. The vertical structure of cloud fraction is in all experiments characterized by a dominant peak at cloud base and a second smaller peak near the inversion (Fig. 3). Therefore, at all resolutions, cloudiness at cloud base contributes most to total cloud cover. All experiments simulate a well-mixed subcloud layer, a transition layer which is most evident in the moisture gradients, a cloud layer and an inversion layer into which the clouds penetrate and detrain (Fig. 4). However, at coarser resolutions, the transition layer is more pronounced, exhibiting a stronger moisture gradient, and the inversion height is more distributed in the vertical. These variations translate into the most notable differences between the resolutions.
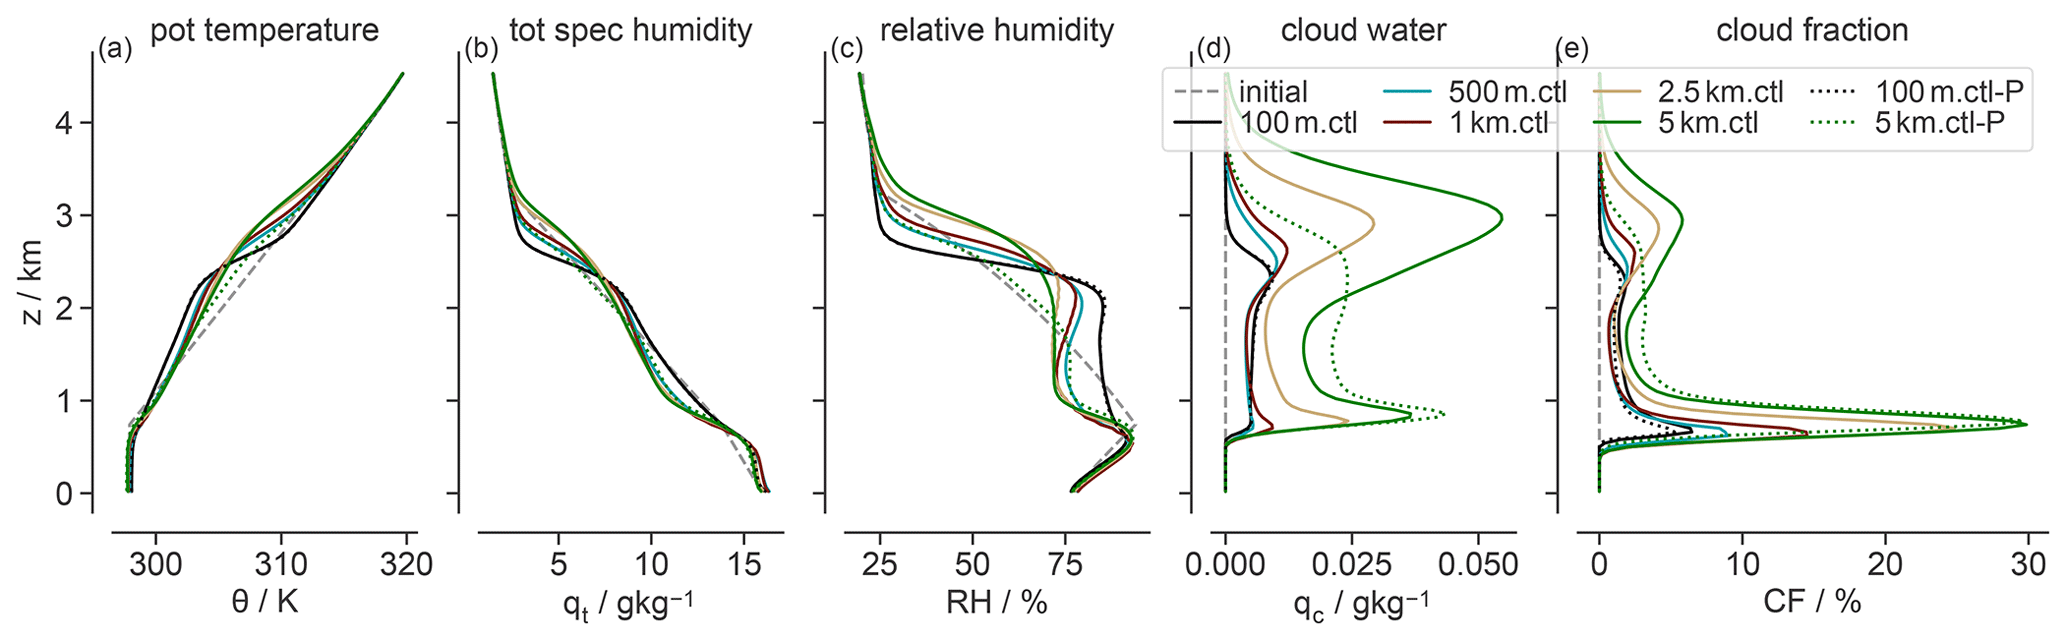
Figure 3Profiles of second-day domain-averaged (a) potential temperature θ, (b) total water specific humidity qt, (c) RH, (d) cloud water qc and (e) cloud fraction (CF) for different horizontal resolutions of the ctl (solid lines) and ctl-P simulations (dotted lines).
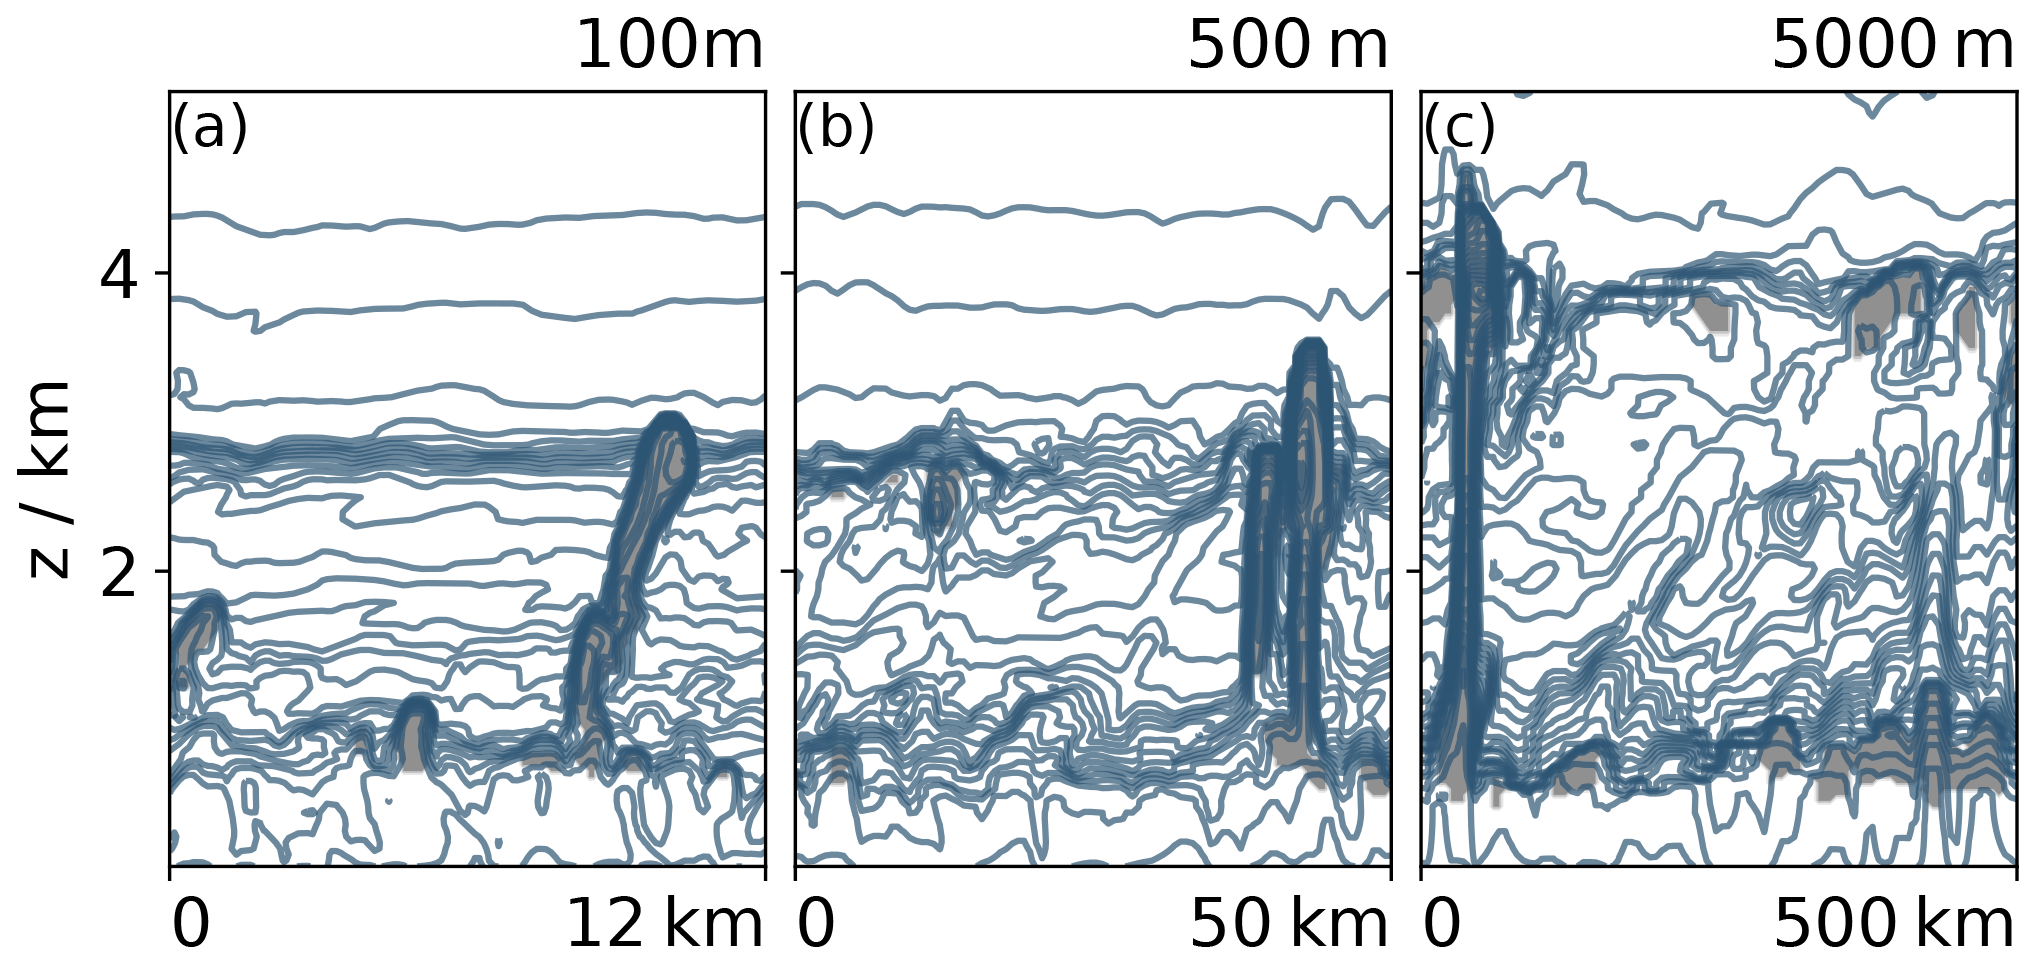
Figure 4Cross section (note the different horizontal extent) of total water specific humidity field and cloud cover at 42 h simulation time in the ctl simulations for three different horizontal resolutions: (a) 100 m, (b) 500 m, (c) 5 km. The total water specific humidity field is shown as contours evenly spaced every 0.5 g kg−1, and cloud fraction is shaded in grey.
Most importantly, we note that at coarser resolutions cloud cover is substantially enhanced (Fig. 2). This was similarly found in, e.g. Cheng et al. (2010). At 5 km resolution, total cloud cover is more than 3 times higher than at 100 m (50 % vs. 15 %). This increase in cloud cover is mostly due to enhanced cloudiness at cloud base and to a smaller extent an increase in cloud fraction near the inversion (Fig. 3). The ratio between cloudiness at cloud base and total cloud cover rises from 0.4 with the 100 m resolution to 0.6 with the 5 km resolution; that is, cloud base cloud fraction contributes more to total cloud cover in the coarser-resolution simulations. Further, at coarser resolutions, clouds reach higher (Fig. 3). At 5 km resolution, clouds deepen up to an inversion height of about 3.2 km, which is around 700 m higher than at the finest resolution. Both characteristics can be confidently linked to resolution and not domain size as a sensitivity experiment shows (see Appendix B1).
Table 2Averages of total cloud cover (CC), maximum vertical cloud fraction (CFmax), liquid water path (LWP), surface sensible heat flux (SH), surface latent heat flux (LH), inversion height (zi, representing the location of maximum θ gradients), cloud base height (zb, representing the minimum height where 50 % of CFmax is reached) and change in the shortwave cloud radiative effect (ΔSWCRE) at 100 m, 500 m and 5 km resolutions in the non-precipitating simulations of the ctl, unifw and madw climate states.
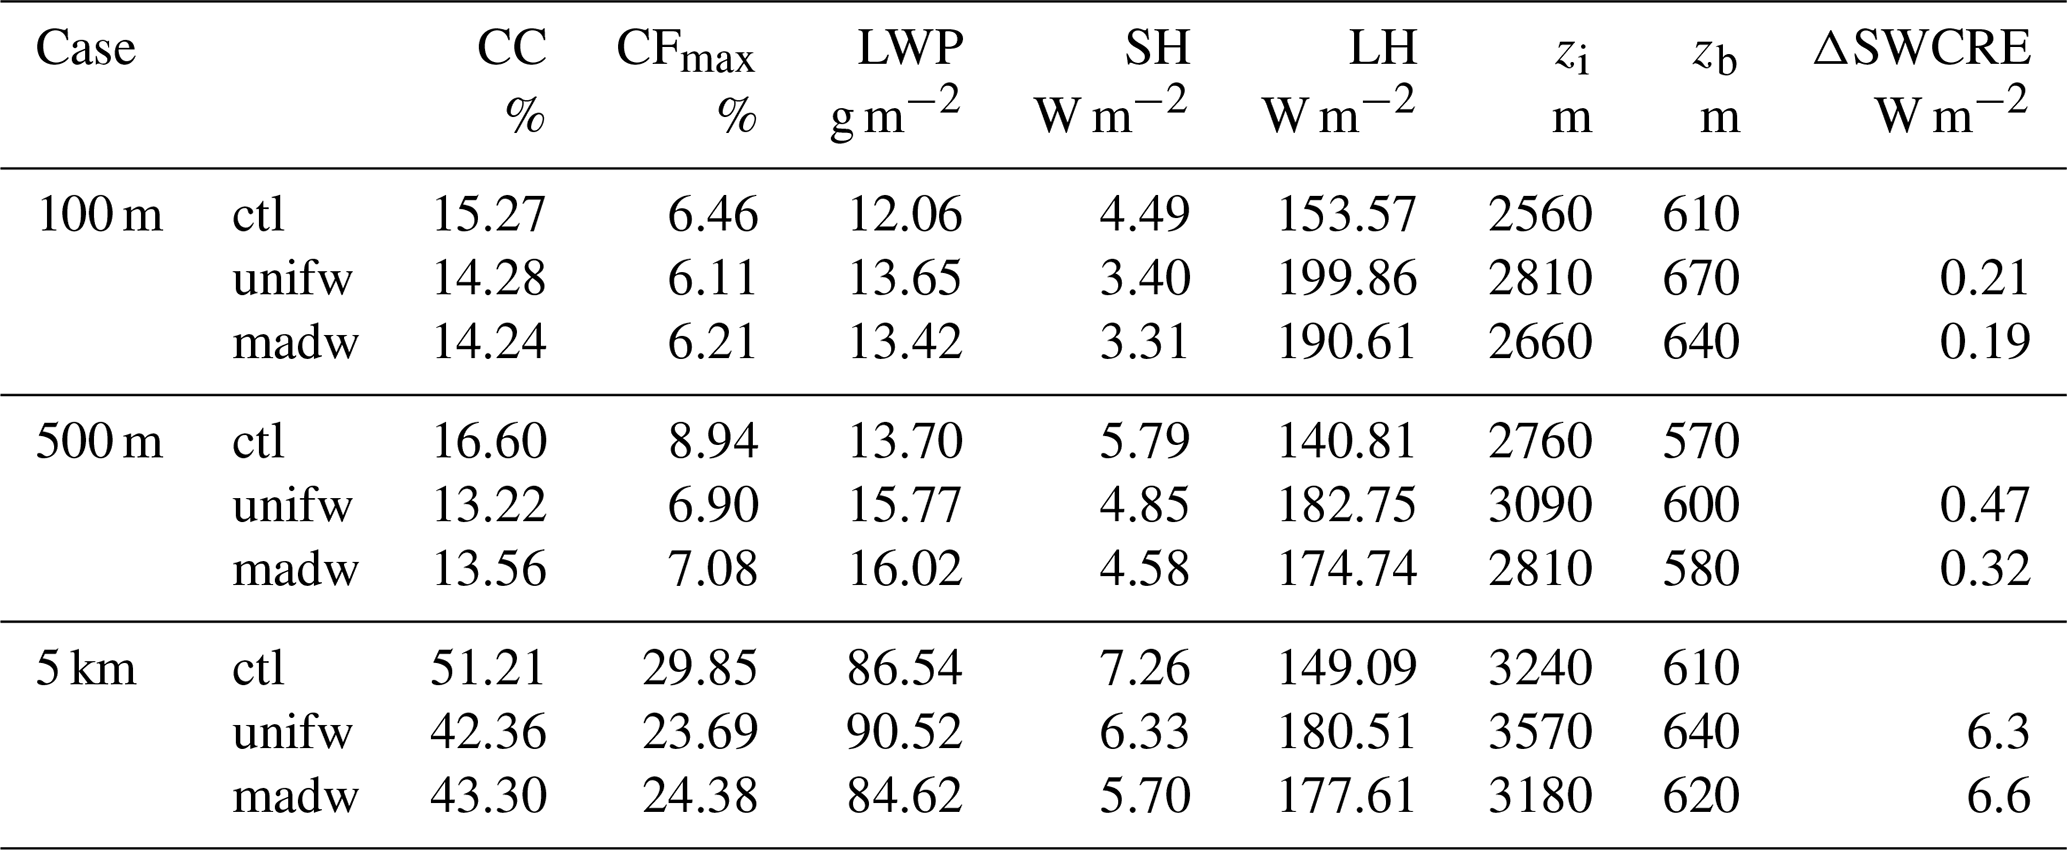
Larger cloud cover and higher cloud tops at coarser resolutions can be attributed to weaker small-scale mixing. At coarse resolutions, the subcloud layer ventilates less efficiently and the subcloud and cloud base layers are therefore moister and cooler and as a result associated with stronger surface sensible but weaker latent heat fluxes (Table 2). Moister and colder conditions are consistent with weaker cumulus mass fluxes and weaker entrainment of warm dry air from aloft. Because conditions are moister and colder in the boundary layer, relative humidity is enhanced and saturation is more likely to occur, leading to more widespread cloud formation at coarser resolutions. Hohenegger et al. (2020) found similar characteristics in global simulations with explicit convection and grid spacings ranging between 2.5 and 80 km.
Additionally, at coarser resolutions, small-scale lateral mixing between cumulus clouds and their environment is markedly weaker, which explains the higher cloud tops. Figure 5 displays the fractional entrainment and detrainment rates as a measure for lateral mixing intensity diagnosed after Stevens et al. (2001). The entrainment rate at 100 m resolution decreases from 2 km−1 near cloud base to 1.2 km−1 in the cloud layer, which is similar to the rates found in the RICO LES intercomparison case (van Zanten et al., 2011). At 500 m resolution, the mean entrainment rate in the cloud layer is around 0.8 km−1, in 5 km around 0.4 km−1 and thus notably weaker than at the finest resolution. This might be attributed to larger cloud structures that offer less surface area for dilution compared to smaller cloud structures that are resolved at finer resolutions. Because they dilute less, clouds retain more buoyancy and reach higher at coarser resolutions.
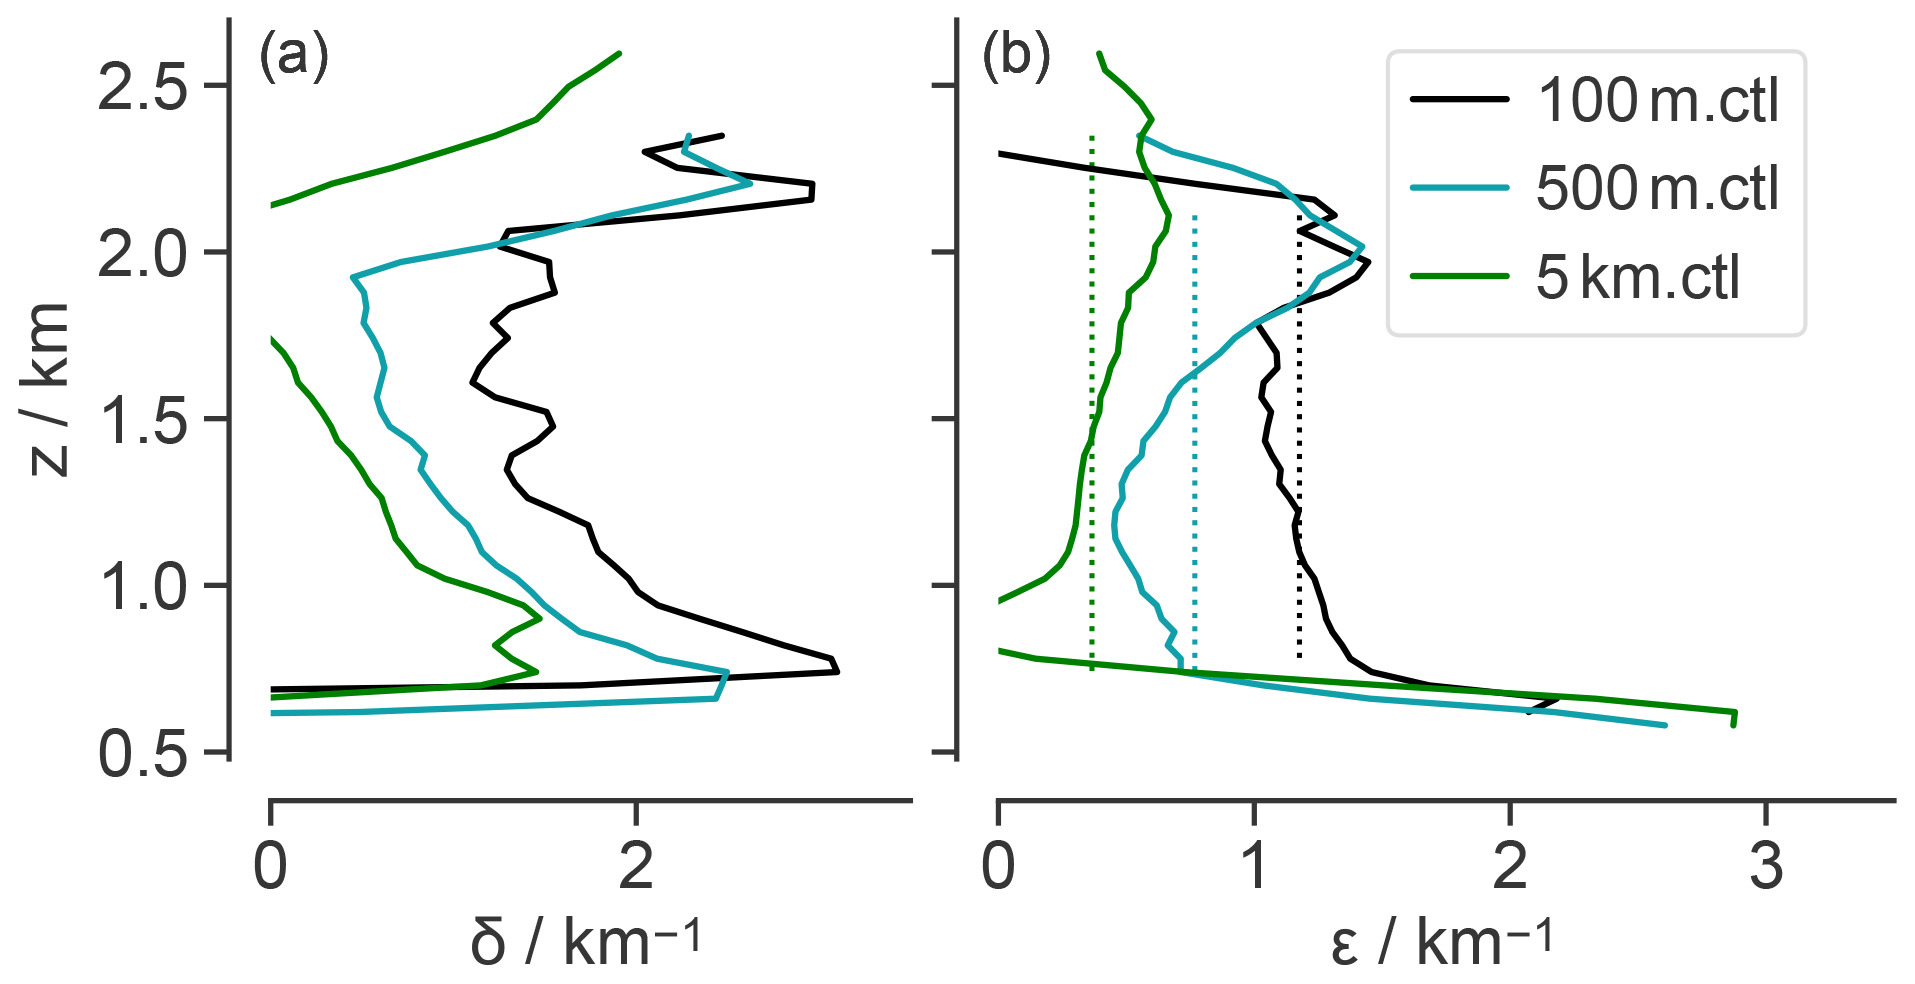
Figure 5(a) Fractional entrainment (ε) and (b) detrainment rate (δ) at 100 m, 500 m and 5 km resolution in CTL. The mean entrainment rate in the cloud layer is shown as dotted lines.
3.2 Precipitating case
Trade wind cumulus clouds rain frequently as observations show (Nuijens et al., 2009). We activate precipitation processes to test if the identified resolution dependence is robust in simulations with 100 m, 500 m and 1 km horizontal resolutions.
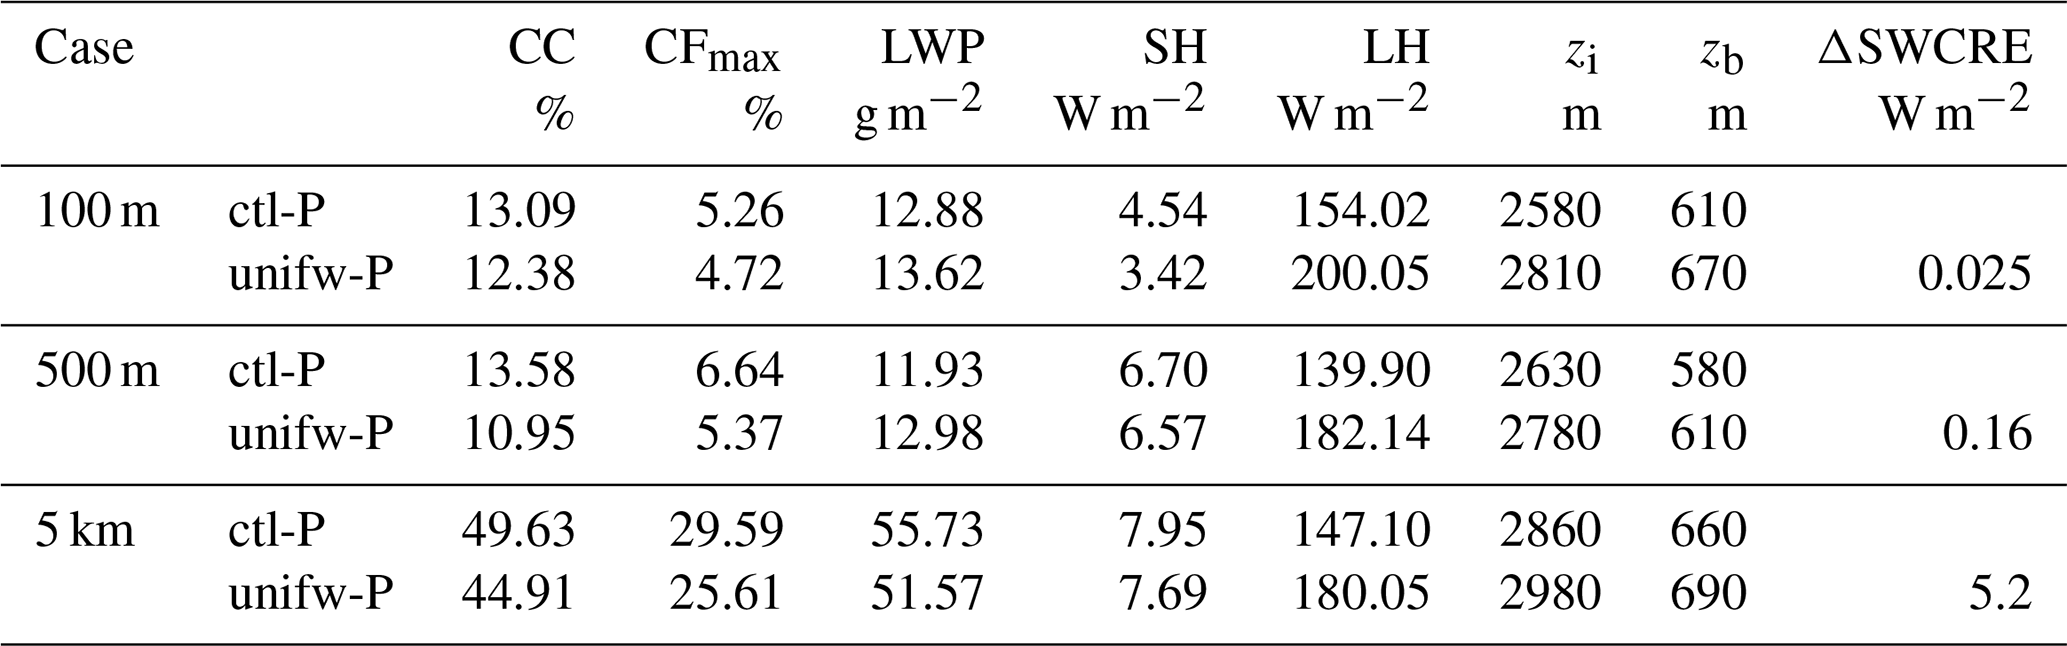
We find that including precipitation processes mainly acts to limit cloud layer deepening. Whereas the 100 m resolution simulations are very similar, the inversion height in the precipitating case with 500 m and 5 km resolutions is around 150 and 350 m lower, respectively, than in the non-precipitating case (Table 3). In the RICO LES intercomparison case, van Zanten et al. (2011) also found that precipitating simulations with 100 m resolution cause an approximate 100 m reduction in the depth of the cloud layer. Precipitation acts to limit cloud layer deepening because it removes moisture available for evaporation near the inversion (Albrecht, 1993). The precipitating cloud field is therefore also characterized by lower cloud fraction near the inversion (Fig. 3).
Table 3As in Table 2 but for the precipitating simulations (P) of the ctl and unifw climate states.
Furthermore, we find that the precipitating cloud fields exhibit a greater cloud fraction in the lower part of the cloud layer as compared to the non-precipitating cloud field (Fig. 3). Vogel et al. (2016) and van Zanten et al. (2011) both found a similar increase in cloud fraction and explained it by increased evaporation from precipitation concentrated in the cloud layer, noting that the evaporation of precipitation must not be confined to the subcloud layer. Due to this moistening, latent heat fluxes are moderately weaker, e.g. at 5 km around 2 W m−2 (compare Tables 2 and 3). Additionally, evaporation of falling raindrops induces a cooling in the subcloud layer, which results in stronger surface sensible heat fluxes.
Because liquid is removed through precipitation, and clouds are shallower, the precipitating simulations have a lower total cloud cover than the non-precipitating simulations at all resolutions (15 % vs. 13 % at 100 m, 16.6 % vs. 13.6 % at 500 m, 51.2 % vs. 49.7 % at 5 km; Tables 2 and 3). However, changes between the non-precipitating and precipitating cloud fields are small and additionally similar across resolution. Therefore, the resolution dependency remains dominant in the precipitating case: cloud cover is substantially enhanced and clouds are deeper at coarser resolutions.
Here, we investigate how the cloud field responds to warming in dependence of resolution. First, the response to a uniform temperature shift, which implies a fixed inversion strength and is commonly characterized as the SST dependence (Klein et al., 2017), in the standard non-precipitating case is discussed and how the resolution dependence of the basic state cloud field affects the cloud field's response to warming. Second, the robustness of our results is investigated by testing whether warming along a moist adiabat or in the precipitating case alters the response across resolution.
4.1 Response to uniform warming
At 100 m resolution, we find a slight cloud cover reduction as a response to uniform warming, in line with earlier LES-based studies (Rieck et al., 2012; Blossey et al., 2013; Vogel et al., 2016). Total cloud cover decreases from 15.3 % to 14.3 % (Table 2). It seems plausible that drying (Fig. 6), resulting from mixing due to the stronger vertical gradient in specific humidity within the warmer case, could explain much of this reduction in cloud cover (Bretherton, 2015; Brient and Bony, 2013). It has further been suggested that enhanced surface latent heat fluxes invigorate convection, deepening the cloud layer and leading to further drying by mixing (Stevens, 2007; Rieck et al., 2012). However, as more refined experiments (Sect. 4.2) do not result in substantial deepening, this process appears to be of secondary importance. The cloud cover reduction on its own constitutes a positive shortwave cloud feedback.
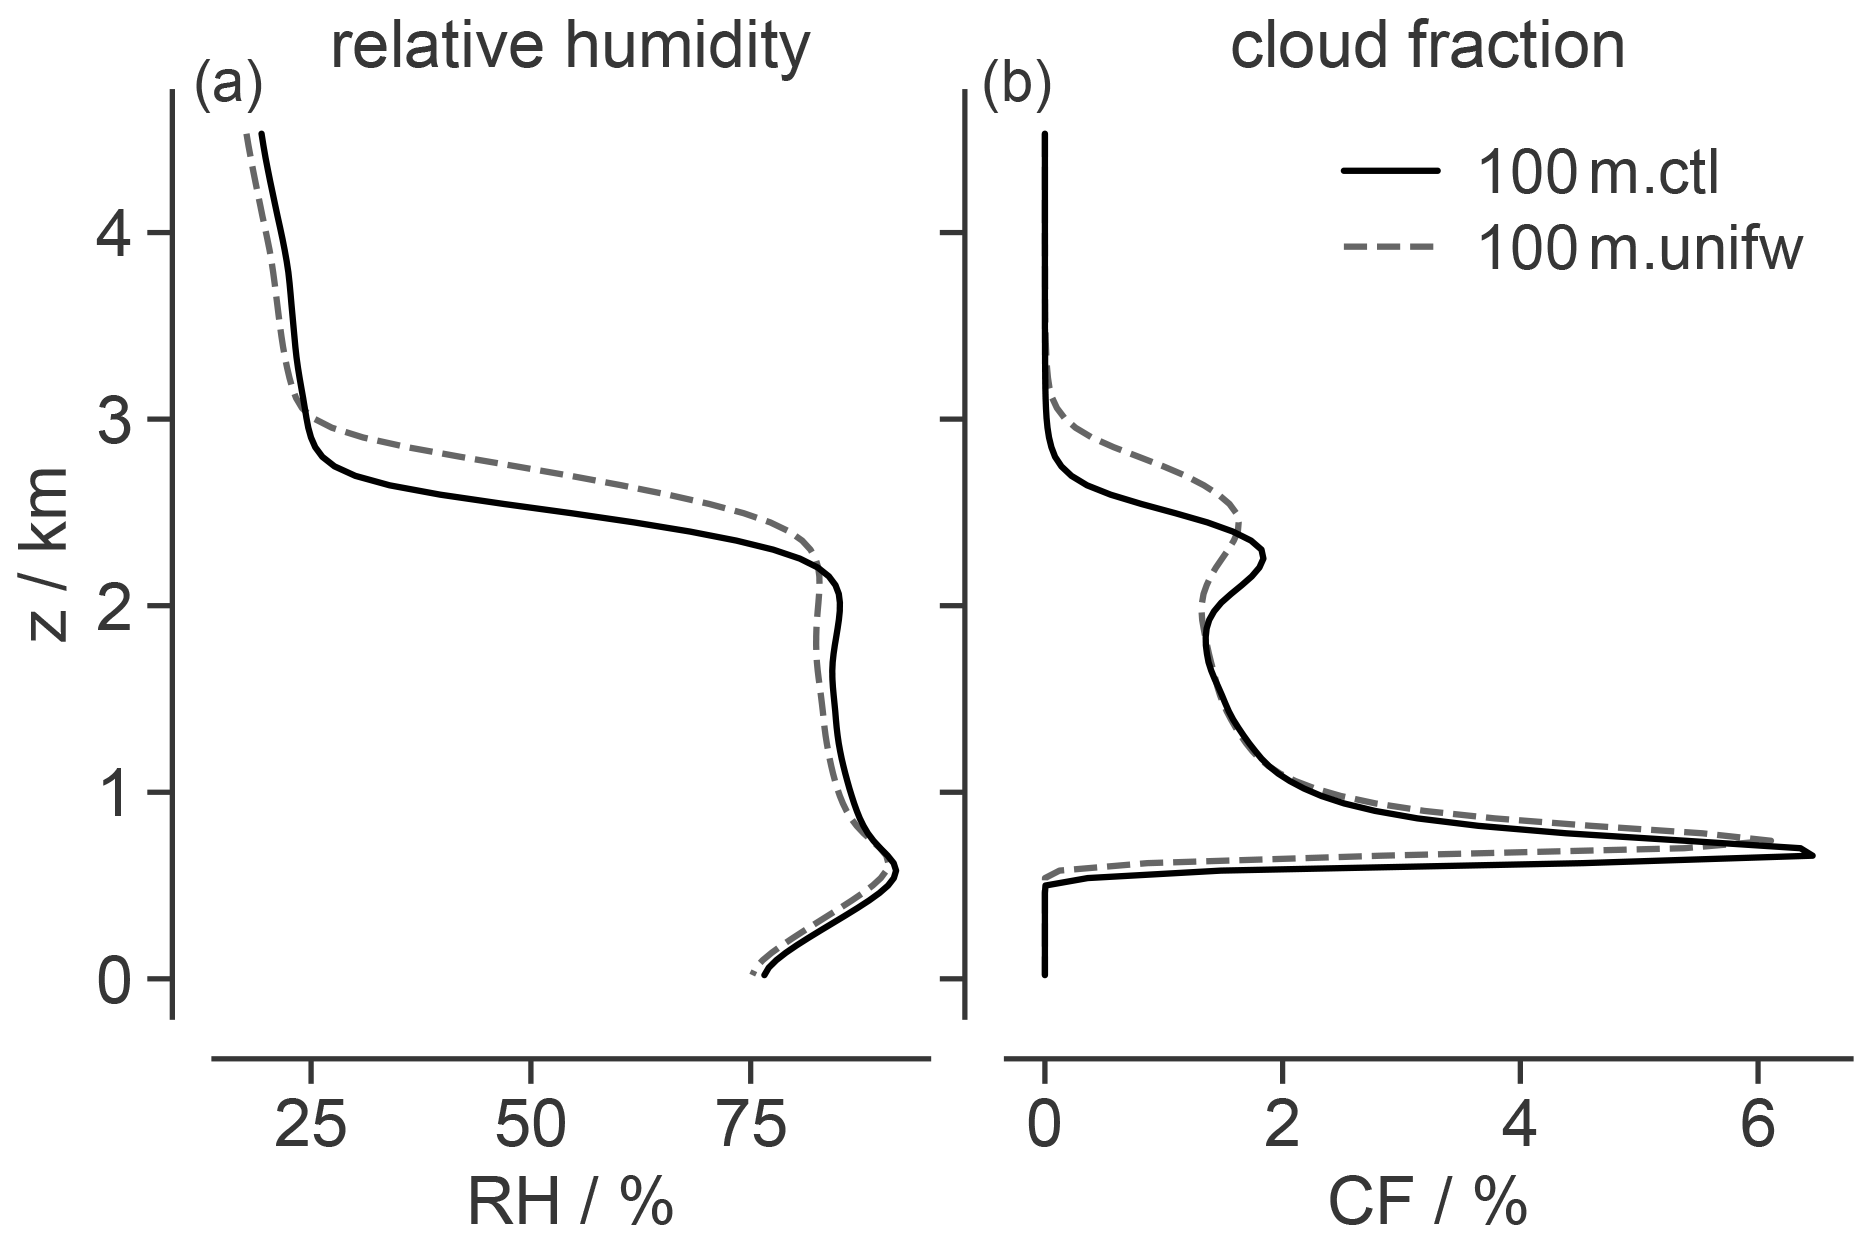
Figure 6Profiles of second-day domain-averaged (a) RH and (b) CF for the control (solid line) and vertically uniform warmed (dashed line) simulations at 100 m resolution.
Also at coarser resolutions, we find cloud cover reductions as a response to uniform warming (Table 2). Across resolutions, the cloud layer is drier, cloud cover is reduced and cloud tops reach higher (Fig. 7). The magnitude of cloud cover reduction, however, differs: at 100 m resolution, total cloud cover reduces by 1 % point, whereas at 5 km resolution total cloud cover reduces by roughly 9 % points. At coarse resolutions, it is distinctly cloud base cloudiness that reduces with warming. This low-resolution behaviour is in contrast to the results of previous high-resolution LES studies and observations which suggest a relatively invariant cloud base fraction (Nuijens et al., 2014; Siebesma et al., 2003) but is a common feature in global climate model simulations (Brient and Bony, 2013; Brient et al., 2015; Vial et al., 2016; Mauritsen and Roeckner, 2020). We find that the strength of cloud reduction correlates well with the amount of cloud cover in the basic state (Fig. 8): the more clouds are present in the basic state, the more cloudiness reduces in the warmer climate. Hence, because cloud cover increases at coarser resolutions, in particular near the cloud base, they show a stronger cloud cover reduction than at high resolutions.
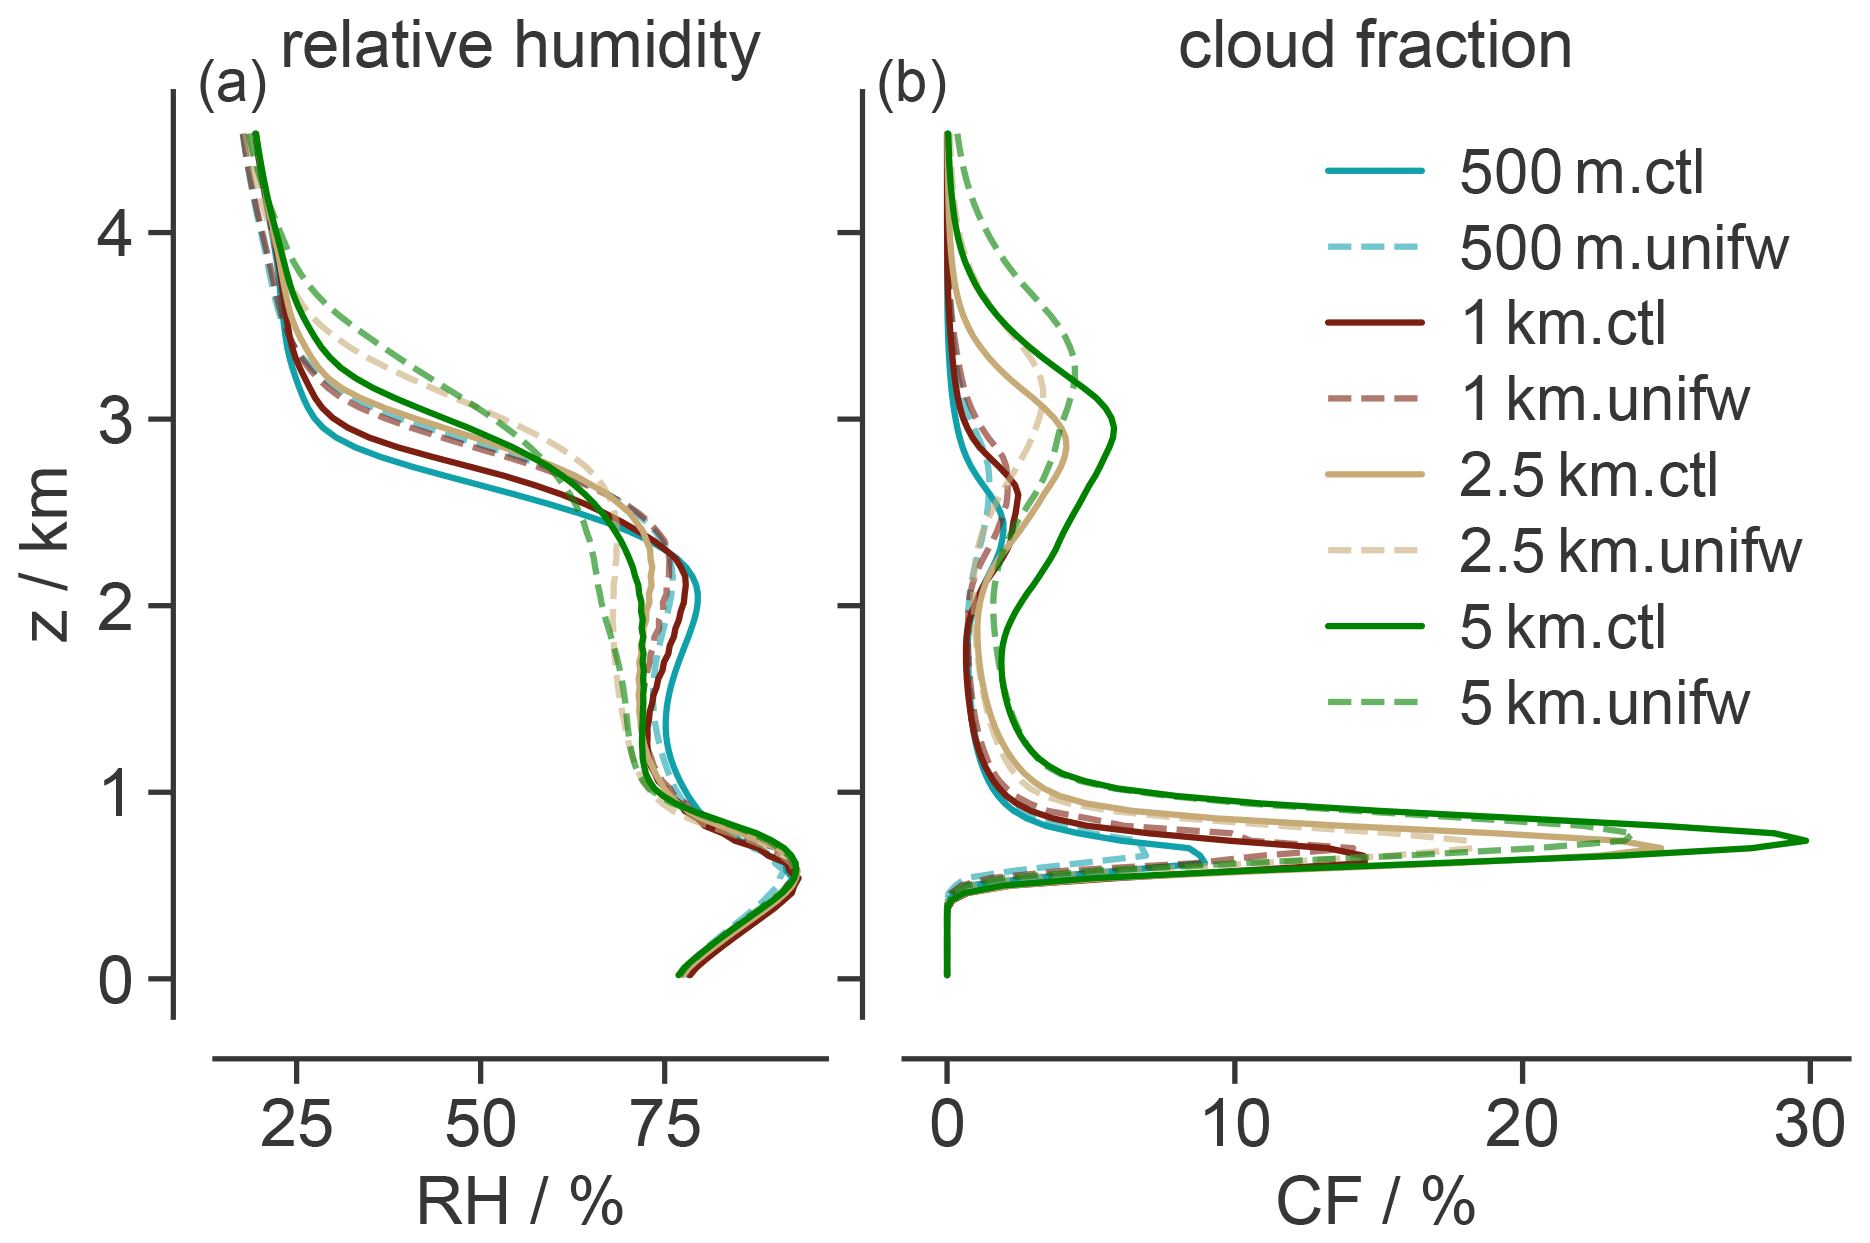
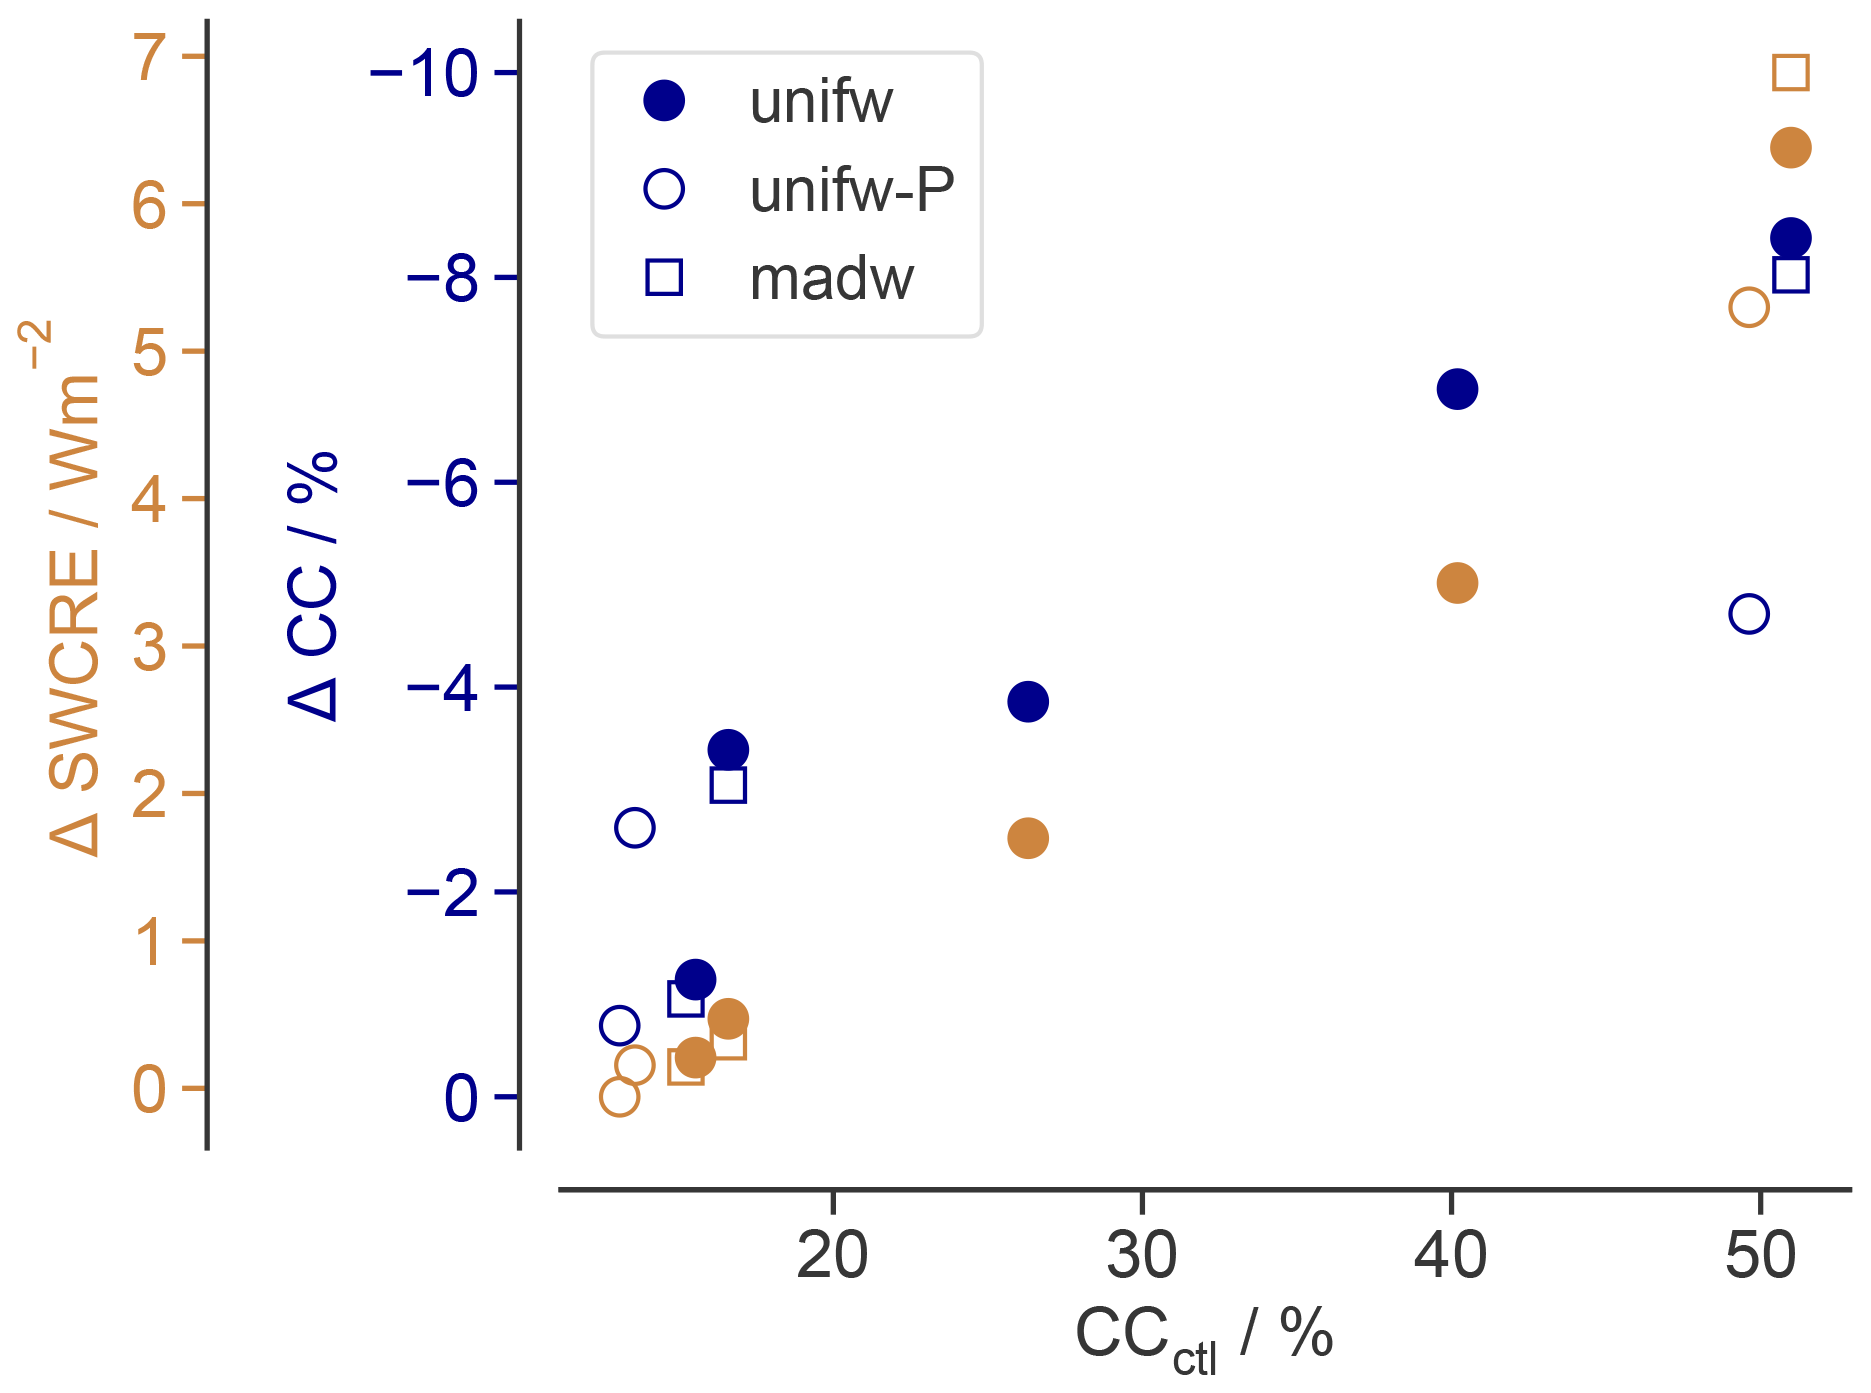
Figure 8Relationship between cloud cover amount in the control simulation (CCctl) and cloud cover reduction with warming (ΔCC) as well as ΔSWCRE across all simulations.
From the reduction in cloud amount, a positive shortwave feedback would be expected; however, the total shortwave feedback at high resolutions is close to zero, e.g. at 100 m with a value of 0.05 W m−2 K−1 (Fig. 9). This is due to a compensating cloud optical depth feedback. The cloud liquid water path increases at all resolutions with warming (Fig. 9), and therefore clouds become more reflective, contributing a negative shortwave feedback. In contrast to the cloud amount feedback, though, the cloud optical depth feedback is not strongly resolution dependent. An increasing cloud water content with warming is to be expected as more water vapour is available for condensation (Paltridge, 1980); this is an argument that is not reliant in any meaningful way on resolution. Consequently, the total shortwave feedback shows the same dependence on resolution as the cloud reduction and correlates well with the basic cloud cover, too (Fig. 8). Hence, the shortwave cloud feedback is weak or close to zero for high resolutions and positive for coarse resolutions.

Figure 9Shallow cumulus cloud feedback across resolutions: ΔSWCRE, ΔCC and ΔCLWP between the perturbed warmer and control simulations for all experiments.
4.2 Sensitivity of response to refined experimental setups
The base case studied above was admittedly simplistic in that there is no precipitation and a vertically uniform warming was applied. Here, we explore the effects of these simplifying assumptions. The free tropospheric temperature profile in the tropics is set by the regions of deep convection that are close to a moist adiabat. Therefore, the tropical temperature is expected to warm close to a moist adiabat, leading to more warming aloft than at the surface, and has been used in other modelling studies (e.g. Blossey et al., 2013; Bretherton et al., 2013). With moist adiabatic warming, an increase in dry static stability is introduced: the initial lower tropospheric stability () increases from 13.1 to 14.4 K, and as a result, with moist adiabatic warming, the cloud response near the trade inversion is muted (Fig. 10). Both the cloud top height and cloud fraction in the upper regions change only little. The inversion height in the moist adiabatic warming case varies compared to the control case by only around 50 to 100 m, whereas in the uniform warming case the inversion height increased markedly by around 300 m (Table 2). Therefore, cloud deepening is at all resolutions slightly weaker. Nevertheless, total cloud cover reduction is only slightly dampened (Fig. 9). Overall, the changes are small, though, and therefore the total shortwave cloud radiative feedback is only slightly reduced when applying the more realistic warming profile.

Figure 10Profiles of second-day domain-averaged cloud fraction at three different horizontal resolutions (a–c) for all experiments.
With precipitation processes activated, the cloud field in a warmer climate responds with a cloud amount reduction across all resolutions, similar to that of the non-precipitating case, though the reductions in total cloud cover are slightly smaller (Table 3 vs. Table 2). We are aware of two proposed mechanisms that could be contributing to the dampening. First, precipitation has a constraining effect on cloud deepening, noted by Blossey et al. (2013) and Bretherton et al. (2013). At 500 m resolution, the boundary layer deepening with warming is half and at 5 km only a third as much as in the non-precipitating simulations. Therefore, especially near the inversion, changes in cloud fraction are reduced (Fig. 10). Second, evaporation of precipitation in the lower cloud layer counteracts drying. Vogel et al. (2016) reported likewise that precipitation reduces deepening and drying with warming. In this way, precipitation is thought to promote the robustness of shallow cumulus clouds to warming. Regardless, though, we find the same dependency on resolution of how shallow cumulus cloud coverage responds to warming in both precipitating and non-precipitating simulations.
To summarize, the different experiments all exhibit the same horizontal resolution dependency on the representation and response of shallow cumulus clouds to warming (Fig. 9). The resolution-induced differences are larger than those between the different experimental setups. This confirms that horizontal resolution affects the representation and therewith response of shallow cumulus clouds to warming to first order: the simulated shortwave cloud radiative feedback differs between the resolutions mainly in proportion to the basic state cloud fraction (Fig. 8), and therefore the cloud feedback strength increases at coarse resolutions. Hohenegger et al. (2020), who investigated grid spacings ranging from 2.5 to 80 km, found that cloud cover increases up to 80 km horizontal resolution, which would, provided the results found here carry over also to even coarser resolutions, translate into further increased cloud feedback. At high resolutions, on the contrary, the trade wind cumulus cloud feedback converges to near-zero values in our simulations.
This study explores the representation and response of shallow trade wind convection to warming and how that depends on horizontal resolution by varying between 100 m and 5 km. Therewith, we aim to bridge the gap between findings based on existing large-eddy-resolving simulations and emerging global storm-resolving simulations. Based on the RICO case, simulations representative of trade wind conditions are compared to simulations with a 4 K warmed surface and atmosphere at constant relative humidity, representative of a simple idealized climate change. First, in a basic experiment, the representation of shallow trade wind cumuli and their response to a uniformly warmed state is explored. Second, the sensitivity to resolution is probed in refined experimental setups by including precipitation processes or warming along a moist adiabat in place of uniform warming.
At 100 m resolution, a typical trade wind cumuli field is simulated that is in line with observations (Nuijens et al., 2009) and the range of LES analysed in the RICO intercomparison case (van Zanten et al., 2011). Total cloud cover amounts to 15 % in the non-precipitating and 13 % in the precipitating case, with a prominent peak in all cases near cloud base. At coarser resolutions, cloud cover is substantially enhanced and clouds are deeper; in the most extreme case at 5 km resolution, total cloud cover is around 3 times more extensive. Cloud cover increases mostly due to enhanced cloudiness at cloud base. Weaker subcloud layer ventilation could explain the enhanced cloudiness, and a weaker lateral entrainment rate allows the clouds to reach higher. Nevertheless, the overall structure of the boundary and cloud layer bears surprising similarity across resolutions explored here, suggesting that, although distorted, the same set of processes acts in all cases.
In response to warming, a cloud reduction can be observed consistently across resolutions. However, whereas at 100 m grid spacing the cloud reduction is rather small, at coarse resolutions the reductions are substantially enhanced. A robust dependency between cloud cover amount and its change with warming emerges: the more clouds are present in the control climate, the more cloud cover reduces in a warmer climate. Including precipitation processes mainly acts to limit the cloud layer deepening by causing a net warming of the upper cloud layer and thereby stabilizing the lower troposphere. A similar effect is found when the warming is done along a moist adiabat. These more refined setups result in nearly constant cloud top height with warming, questioning the idea that a cloud deepening is critical to a positive cloud cover feedback (Rieck et al., 2012). Regardless, the resolution dependence pertaining to the cloud amount feedback is practically the same, also in these less idealized cases. On the contrary, a negative cloud optical depth feedback arises in all simulations due to an increasing cloud liquid water path. Although the magnitude of this feedback varies, there is no obvious dependence on resolution. This is to be expected since increasing amounts of water vapour available for condensation with warming at constant relative humidity are a fundamental physical fact.
All in all, the decrease of cloud cover (positive cloud amount feedback) and increase in cloud water (negative cloud optical depth feedback) with warming compensate and result in convergence to a near-zero trade wind cloud feedback at high resolution in these simulations. Both of these feedbacks appear physically appealing: a stronger vertical gradient in specific humidity results in a lowered relative humidity when mixing is activated and, all other things being equal, in a slight reduction of the areal fraction where condensation can occur, whereas more availability of water vapour in the boundary layer results in thicker clouds. Provided the identified resolution dependence of the cloud amount feedback carries over to other model codes, it then implies that storm-resolving models configured with a similar all-or-nothing cloud scheme may exaggerate the trade wind cumulus cloud feedback. Blossey et al. (2009), who also included a study of the effect of grid spacing on shallow cumulus clouds in two-dimensional simulations, came to the same conclusion while the setup was more complicated and the sign of the cloud response to warming was different: at higher resolutions, cloud fractions are smaller and the cloud response to warming weaker.
It is also interesting to compare with earlier studies, where LES simulations have previously suggested trade wind cumulus feedback in the range between 0.3 and 2.3 W m−2 K−1 (Bretherton, 2015; Nuijens and Siebesma, 2019), and observational studies up until recently have done so likewise (0.3–1.7 W m−2 K−1) (Klein et al., 2017). Recent observational studies, however, find a near-zero trade wind cumulus cloud feedback (Myers et al., 2021; Cesana and Del Genio, 2021), which is in line with our results. It is perhaps tempting to think that other LES studies were under-resolved; that is, if they had been run with higher resolutions, their estimated cloud feedback might have decreased. Although it seems likely that most LESs will exhibit a similar resolution dependence of the cloud amount feedback to that found here, it is not clear why they should all converge to a near-zero total feedback given their differences in, e.g. microphysics, and so no conclusions in this regard can be drawn here. It is, however, an interesting question for the community to address in the future.
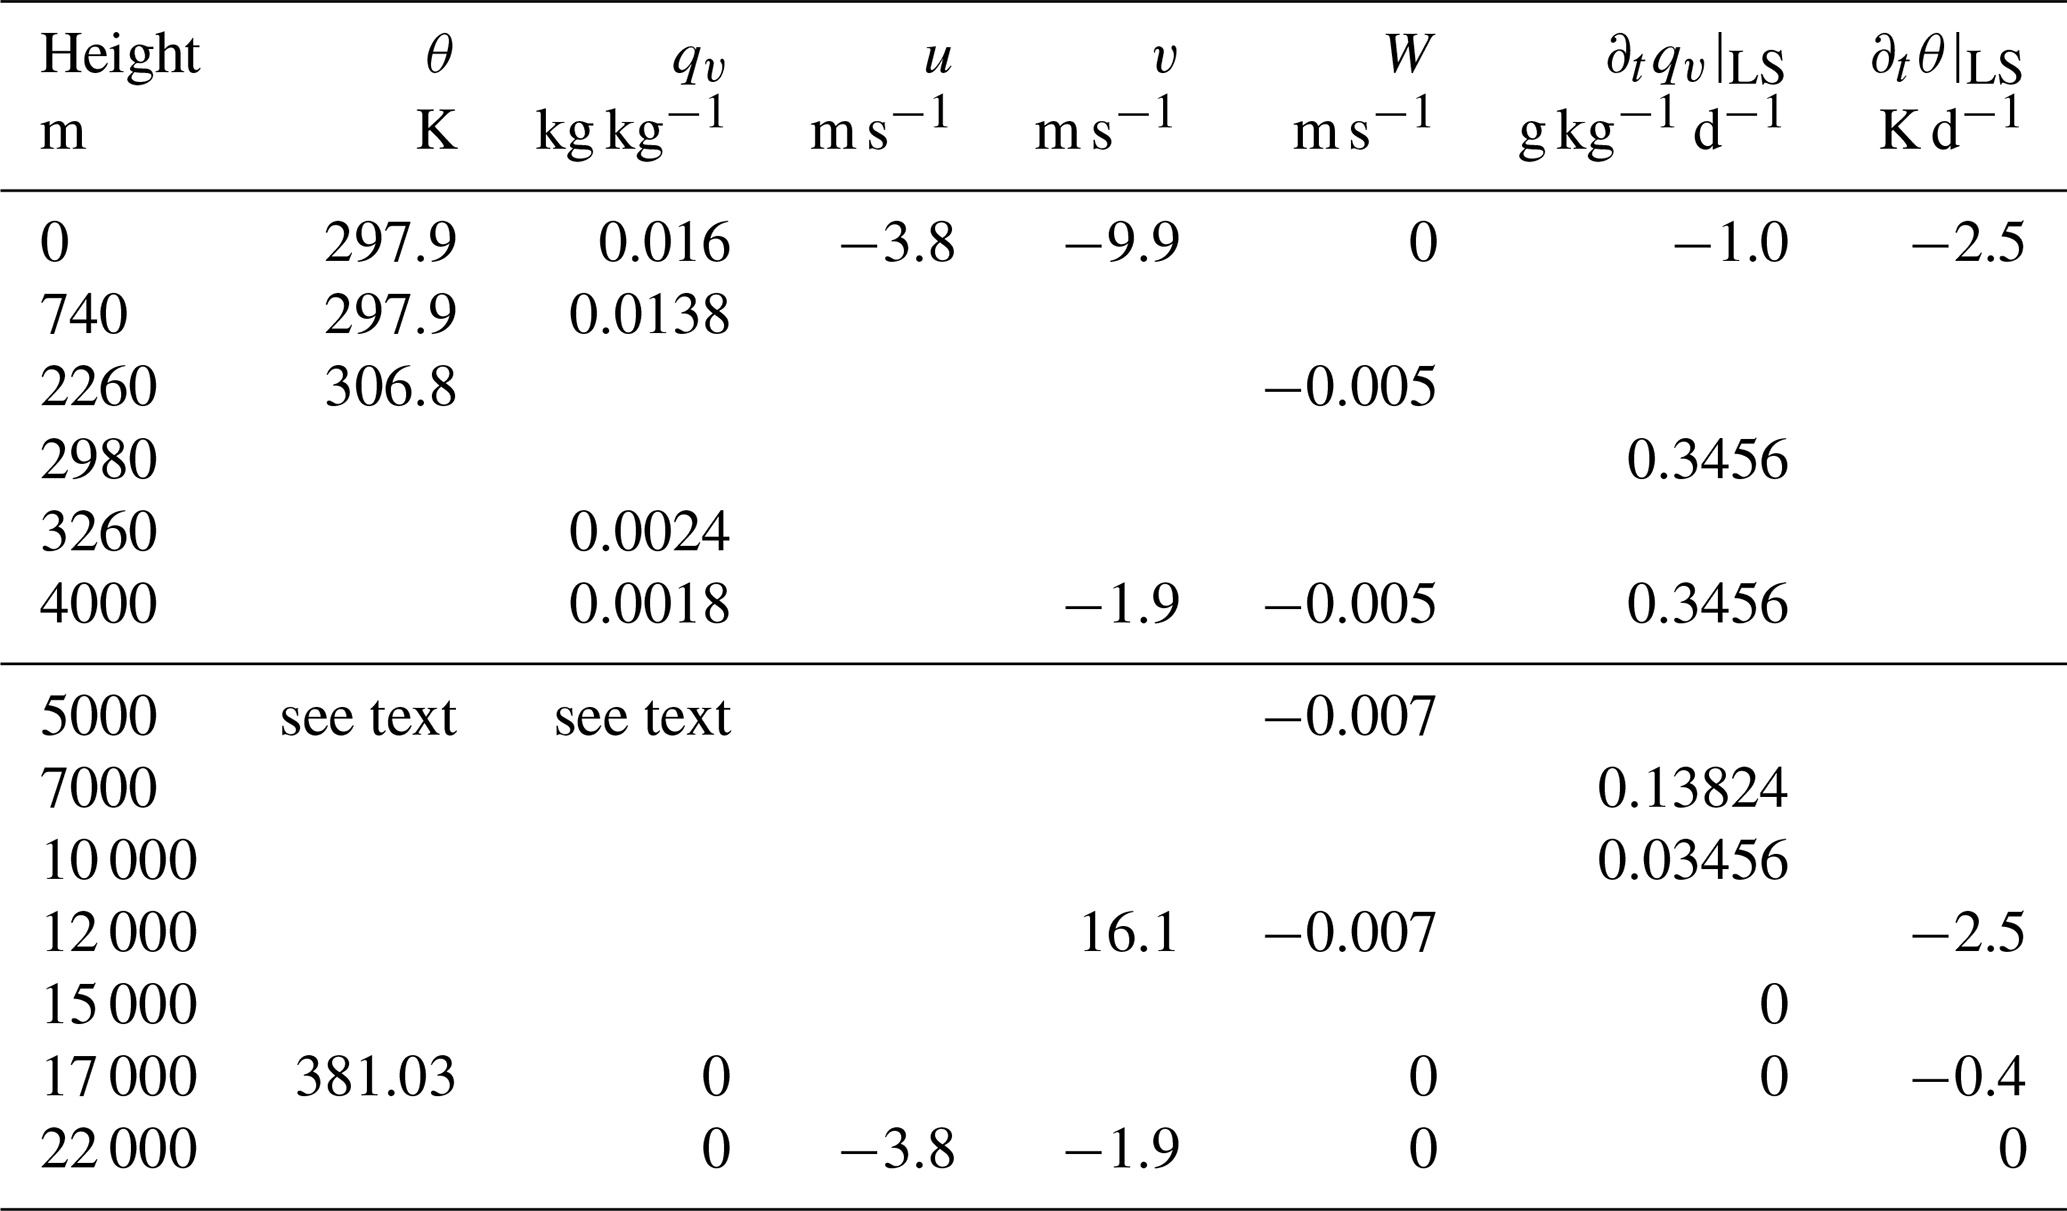
In the RICO case, van Zanten et al. (2011) constructed initial profiles as piecewise linear fits of radiosonde measurements up to a height of 4 km. As a modification to the case defined by van Zanten et al. (2011), radiation is computed interactively to be able to calculate shortwave cloud radiative effects, which requires a model top at about 20 km in ICON-LEM. Below 4 km height, initial profiles as in van Zanten et al. (2011) are applied, above they are expanded accordingly, mostly with piecewise linear extrapolation; see Table A1 for details. The free tropospheric lapse rate is chosen such that the imposed subsidence warming balances a radiative cooling of 2.5 K d−1 as suggested in the RICO setup. The temperature profile thus follows roughly a moist adiabat in the lower free troposphere. At 17 km, a tropopause of 195 K is included. The specific humidity profile is calculated from relative humidity following a linear decrease from 20 % at 4 km height to 1 % at 15 km and 0 % at 17 km height.
Table A1Fixed points for piecewise linear profiles of θ, qv, u, v, the subsidence rate W and the large-scale forcing of heat ∂tθ|LS and moisture ∂tqv|LS extended from the RICO case (van Zanten et al., 2011), from 4 to 22 km height.
In order to confidently link the observed differences to characteristics of the resolution and not of the domain size, a simulation at the same horizontal resolution (1 km) is performed on two different domain sizes (50 and 500 km). The simulations show that differences between the cloud field on the two domains are small (Fig. B1). With larger domain size, clouds are slightly deeper and show a narrower cloud fraction profile; total cloud cover is 1 % points less (1 km resolution). On the same domain, the cloud cover would hence be even larger with the coarser resolutions.
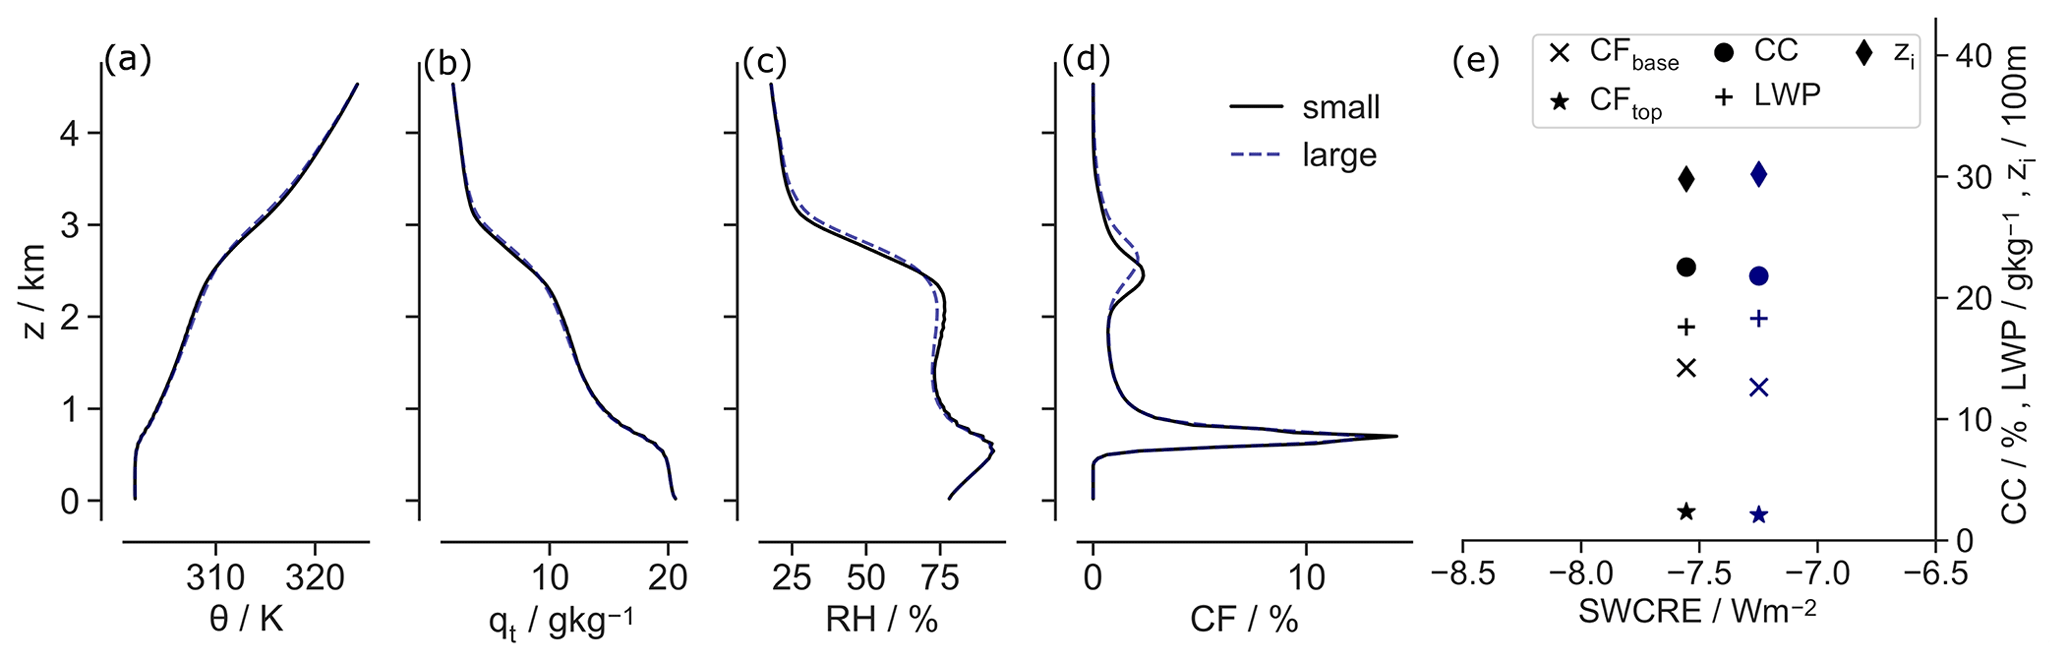
Figure B1Profiles of second-day domain-averaged (a) potential temperature θ, (b) specific humidity qt, (c) RH and (d) CF, as well as (e) mean values of total CC, cloud fraction at base (CFbase) and top (CFtop), LWP and inversion height (zi) at 1 km resolution on two different domain sizes: 50 × 50 km (black, small) and 500 × 500 km (dashed blue, large).
The ICON model source code is available for scientific use under an institutional or a personal non-commercial research license. Specific information on how to obtain the model code can be found under https://code.mpimet.mpg.de/projects/iconpublic/wiki/How_to_obtain_the_model_code (last access: 17 February 2021).
The original idea of this study was conceived by CH and TM, whereas all simulations and most analysis were conducted by JR. All authors contributed to the writing.
The authors declare that they have no conflict of interest.
This study was supported by the Max-Planck-Gesellschaft (MPG) and computational resources were made available by Deutsches Klimarechenzentrum (DKRZ) through support from the Bundesministerium für Bildung und Forschung (BMBF). This work was a contribution to the Cluster of Excellence “CLICCS – Climate, Climatic Change, and Society” and to the Center for Earth System Research and Sustainability (CEN) of Universität Hamburg. This study benefitted from discussions and technical support from Guido Cioni and Tobias Becker. We thank the editor (Johannes Quaas) and two anonymous referees for their comments that helped to improve our manuscript.
This research has been supported by the FP7 Ideas: European Research Council (grant no. 770765) and the H2020 European Research Council (CONSTRAIN (grant no. 820829)).
This paper was edited by Johannes Quaas and reviewed by two anonymous referees.
Albrecht, B. A.: Effects of precipitation on the thermodynamic structure of the trade wind boundary layer, J. Geophys. Res., , 98, 7327–7337, https://doi.org/10.1029/93JD00027, 1993. a
Blossey, P. N., Bretherton, C. S., and Wyant, M. C.: Subtropical Low Cloud Response to a Warmer Climate in a Superparameterized Climate Model. Part II: Column Modeling with a Cloud Resolving Model, J. Adv. Model. Earth Sy., 1, 8, https://doi.org/10.3894/JAMES.2009.1.8, 2009. a
Blossey, P. N., Bretherton, C. S., Zhang, M., Cheng, A., Endo, S., Heus, T., Liu, Y., Lock, A. P., de Roode, S. R., and Xu, K.-M.: Marine low cloud sensitivity to an idealized climate change: The CGILS LES intercomparison, J. Adv. Model. Earth Sy., 5, 234–258, https://doi.org/10.1002/jame.20025, 2013. a, b, c, d, e
Bony, S. and Dufresne, J.-L.: Marine boundary layer clouds at the heart of tropical cloud feedback uncertainties in climate models, Geophys. Res. Lett., 32, L20806, https://doi.org/10.1029/2005GL023851, 2005. a, b
Boucher, O., Randall, D., Artaxo, P., Bretherton, C., Feingold, G., Forster, P., Keminen, V.-M., Kondo, Y., Liao, H., Lohmann, U., Rasch, P., Satheesh, S. K., Sherwood, S., Stevens, B., and Zhang, X. Y.: Clouds and Aerosols, in: Climate change 2013: the physical science basis. Contribution of working group I to the fifth assessment report of the intergovernmental panel on climate change, vol. 5, 571–658, Cambridge University Press, Cambridge, https://doi.org/10.1017/CBO9781107415324.016, 2013. a, b
Bretherton, C. S.: Insights into low-latitude cloud feedbacks from high-resolution models, Philos. T. R. Soc. A, 373, 20140415, https://doi.org/10.1098/rsta.2014.0415, 2015. a, b
Bretherton, C. S., Blossey, P. N., and Jones, C. R.: Mechanisms of marine low cloud sensitivity to idealized climate perturbations: A single-LES exploration extending the CGILS cases, J. Adv. Model. Earth Sy., 5, 316–337, https://doi.org/10.1002/jame.20019, 2013. a, b, c
Brient, F. and Bony, S.: Interpretation of the positive low-cloud feedback predicted by a climate model under global warming, Clim. Dynam., 40, 2415–2431, https://doi.org/10.1007/s00382-011-1279-7, 2013. a, b
Brient, F., Schneider, T., Tan, Z., Bony, S., Qu, X., and Hall, A.: Shallowness of tropical low clouds as a predictor of climate models' response to warming, Clim. Dynam., 47, 433–449, https://doi.org/10.1007/s00382-015-2846-0, 2015. a
Cesana, G. V. and Del Genio, A. D.: Observational constraint on cloud feedbacks suggests moderate climate sensitivity, Nat. Clim. Change, https://doi.org/10.1038/s41558-020-00970-y, online first, 2021. a
Cheng, A., Xu, K.-M., and Stevens, B.: Effects of Resolution on the Simulation of Boundary-layer Clouds and the Partition of Kinetic Energy to Subgrid Scales, J. Adv. Model. Earth Sy., 2, 3, https://doi.org/10.3894/JAMES.2010.2.3, 2010. a
Dipankar, A., Stevens, B., Heinze, R., Moseley, C., Zängl, G., Giorgetta, M., and Brdar, S.: Large eddy simulation using the general circulation model ICON, J. Adv. Model. Earth Sy., 7, 963–986, https://doi.org/10.1002/2015MS000431, 2015. a, b
Doms, G., Förstner, J., Heise, E., Herzog, H. J., Mironov, D., Raschendorfer, M., Reinhardt, T., Ritter, B., Schrodin, R., Schulz, J.-P., and Vogel, G.: A description of the nonhydrostatic regional COSMO model part II: physical parameterization., Deutscher Wetterdienst: Offenbach, Germany, available at: http://www.cosmo-model.org/content/model/documentation/core/cosmo_physics_4.20.pdf (last access: 17 February 2021), 2011. a
Flynn, C. M. and Mauritsen, T.: On the climate sensitivity and historical warming evolution in recent coupled model ensembles, Atmos. Chem. Phys., 20, 7829–7842, https://doi.org/10.5194/acp-20-7829-2020, 2020. a, b
Hartmann, D. L., Ockert-Bell, M. E., and Michelsen, M. L.: The Effect of Cloud Type on Earth's Energy Balance: Global Analysis, J. Climate, 5, 1281–1304, https://doi.org/10.1175/1520-0442(1992)005<1281:TEOCTO>2.0.CO;2, 1992. a
Heinze, R., Dipankar, A., Henken, C. C., Moseley, C., Sourdeval, O., Trömel, S., Xie, X., Adamidis, P., Ament, F., Baars, H., Barthlott, C., Behrendt, A., Blahak, U., Bley, S., Brdar, S., Brueck, M., Crewell, S., Deneke, H., Di Girolamo, P., Evaristo, R., Fischer, J., Frank, C., Friederichs, P., Göcke, T., Gorges, K., Hande, L., Hanke, M., Hansen, A., Hege, H.-C., Hoose, C., Jahns, T., Kalthoff, N., Klocke, D., Kneifel, S., Knippertz, P., Kuhn, A., van Laar, T., Macke, A., Maurer, V., Mayer, B., Meyer, C. I., Muppa, S. K., Neggers, R. A. J., Orlandi, E., Pantillon, F., Pospichal, B., Röber, N., Scheck, L., Seifert, A., Seifert, P., Senf, F., Siligam, P., Simmer, C., Steinke, S., Stevens, B., Wapler, K., Weniger, M., Wulfmeyer, V., Zängl, G., Zhang, D., and Quaas, J.: Large-eddy simulations over Germany using ICON: a comprehensive evaluation, Q. J. Roy. Meteor. Soc., 143, 69–100, https://doi.org/10.1002/qj.2947, 2017. a
Hohenegger, C., Kornblueh, L., Klocke, D., Becker, T., Cioni, G., Engels, J. F., Schulzweida, U., and Stevens, B.: Climate statistics in global simulations of the atmosphere, from 80 to 2.5 km grid spacing, J. Meteorol. Soc. Jpn., 98, 73–91, https://doi.org/10.2151/jmsj.2020-005, 2020. a, b
Klein, S. A., Hall, A., Norris, J. R., and Pincus, R.: Low-Cloud Feedbacks from Cloud-Controlling Factors: A Review, Surv. Geophys., 38, 1307–1329, https://doi.org/10.1007/s10712-017-9433-3, 2017. a, b
Klocke, D., Brueck, M., Hohenegger, C., and Stevens, B.: Rediscovery of the doldrums in storm-resolving simulations over the tropical Atlantic, Nat. Geosci., 10, 891–896, https://doi.org/10.1038/s41561-017-0005-4, 2017. a
Lilly, D. K.: On the numerical simulation of buoyant convection, Tellus, 14, 148–172, https://doi.org/10.1111/j.2153-3490.1962.tb00128.x, 1962. a
Mauritsen, T. and Roeckner, E.: Tuning the MPI-ESM1.2 Global Climate Model to Improve the Match With Instrumental Record Warming by Lowering Its Climate Sensitivity, J. Adv. Model. Earth Sy., 12, e2019MS002037, https://doi.org/10.1029/2019MS002037, 2020. a
Medeiros, B., Stevens, B., and Bony, S.: Using aquaplanets to understand the robust responses of comprehensive climate models to forcing, Clim. Dynam., 44, 1957–1977, https://doi.org/10.1007/s00382-014-2138-0, 2015. a
Mlawer, E. J., Taubman, S. J., Brown, P. D., Iacono, M. J., and Clough, S. A.: Radiative transfer for inhomogeneous atmospheres: RRTM, a validated correlated-k model for the longwave, J. Geophys. Res.-Atmos., 102, 16663–16682, https://doi.org/10.1029/97JD00237, 1997. a
Myers, T. A., Scott, R. C., Zelinka, M. D., A., K. S., and Norris, J. R.: Extreme model climate sensitivities inconsistent with constraints on low cloud feedback, submitted, 2021. a
Nuijens, L. and Siebesma, A. P.: Boundary Layer Clouds and Convection over Subtropical Oceans in our Current and in a Warmer Climate, Curr. Clim. Change Rep., 5, 80–94, https://doi.org/10.1007/s40641-019-00126-x, 2019. a
Nuijens, L., Stevens, B., and Siebesma, A. P.: The Environment of Precipitating Shallow Cumulus Convection, J. Atmos. Sci., 66, 1962–1979, https://doi.org/10.1175/2008JAS2841.1, 2009. a, b, c
Nuijens, L., Serikov, I., Hirsch, L., Lonitz, K., and Stevens, B.: The distribution and variability of low-level cloud in the North Atlantic trades, Q. J. Roy. Meteor. Soc., 140, 2364–2374, https://doi.org/10.1002/qj.2307, 2014. a
Paltridge, G. W.: Cloud-radiation feedback to climate, Q. J. Roy. Meteor. Soc., 106, 895–899, https://doi.org/10.1002/qj.49710645018, 1980. a
Prein, A. F., Langhans, W., Fosser, G., Ferrone, A., Ban, N., Goergen, K., Keller, M., Tölle, M., Gutjahr, O., Feser, F., Brisson, E., Kollet, S., Schmidli, J., van Lipzig, N. P. M., and Leung, R.: A review on regional convection-permitting climate modeling: Demonstrations, prospects, and challenges, Rev. Geophys., 53, 323–361, https://doi.org/10.1002/2014RG000475, 2015. a
Rauber, R. M., Stevens, B., Ochs, H. T., Knight, C., Albrecht, B. A., Blyth, A. M., Fairall, C. W., Jensen, J. B., Lasher-Trapp, S. G., Mayol-Bracero, O. L., Vali, G., Anderson, J. R., Baker, B. A., Bandy, A. R., Burnet, E., Brenguier, J.-L., Brewer, W. A., Brown, P. R. A., Chuang, R., Cotton, W. R., Di Girolamo, L., Geerts, B., Gerber, H., Göke, S., Gomes, L., Heikes, B. G., Hudson, J. G., Kollias, P., Lawson, R. R., Krueger, S. K., Lenschow, D. H., Nuijens, L., O'Sullivan, D. W., Rilling, R. A., Rogers, D. C., Siebesma, A. P., Snodgrass, E., Stith, J. L., Thornton, D. C., Tucker, S., Twohy, C. H., and Zuidema, P.: Rain in Shallow Cumulus Over the Ocean: The RICO Campaign, B. Am. Meteorol. Soc., 88, 1912–1928, https://doi.org/10.1175/BAMS-88-12-1912, 2007. a, b
Rieck, M., Nuijens, L., and Stevens, B.: Marine Boundary Layer Cloud Feedbacks in a Constant Relative Humidity Atmosphere, J. Atmos. Sci., 69, 2538–2550, https://doi.org/10.1175/JAS-D-11-0203.1, 2012. a, b, c, d, e, f
Satoh, M., Stevens, B., Judt, F., Khairoutdinov, M., Lin, S.-J., Putman, W. M., and Düben, P.: Global Cloud-Resolving Models, Curr. Clim. Change Rep., 5, 172–184, https://doi.org/10.1007/s40641-019-00131-0, 2019. a
Sherwood, S. C., Webb, M. J., Annan, J. D., Armour, K. C., Forster, P. M., Hargreaves, J. C., Hegerl, G., Klein, S. A., Marvel, K. D., Rohling, E. J., Watanabe, M., Andrews, T., Braconnot, P., Bretherton, C. S., Foster, G. L., Hausfather, Z., von der Heydt, A. S., Knutti, R., Mauritsen, T., Norris, J. R., Proistosescu, C., Rugenstein, M., Schmidt, G. A., Tokarska, K. B., and Zelinka, M. D.: An Assessment of Earth's Climate Sensitivity Using Multiple Lines of Evidence, Rev. Geophys., 58, e2019RG000678, https://doi.org/10.1029/2019RG000678, 2020. a
Siebesma, A. P., Bretherton, C. S., Brown, A., Chlond, A., Cuxart, J., Duynkerke, P. G., Jiang, H., Khairoutdinov, M., Lewellen, D., Moeng, C.-H., Sanchez, E., Stevens, B., and Stevens, D. E.: A Large Eddy Simulation Intercomparison Study of Shallow Cumulus Convection, J. Atmos. Sci., 60, 1201–1219, https://doi.org/10.1175/1520-0469(2003)60<1201:ALESIS>2.0.CO;2, 2003. a, b
Sommeria, G. and Deardorff, J. W.: Subgrid-Scale Condensation in Models of Nonprecipitating Clouds, J. Atmos. Sc., 34, 344–355, https://doi.org/10.1175/1520-0469(1977)034<0344:SSCIMO>2.0.CO;2, 1977. a
Stevens, B.: On the Growth of Layers of Nonprecipitating Cumulus Convection, J. Atmos. Sci., 64, 2916–2931, https://doi.org/10.1175/JAS3983.1, 2007. a
Stevens, B., Ackerman, A. S., Albrecht, B. A., Brown, A. R., Chlond, A., Cuxart, J., Duynkerke, P. G., Lewellen, D. C., Macvean, M. K., Neggers, R. A. J., Sánchez, E., Siebesma, A. P., and Stevens, D. E.: Simulations of Trade Wind Cumuli under a Strong Inversion, J. Atmos. Sci., 58, 1870–1891, https://doi.org/10.1175/1520-0469(2001)058<1870:SOTWCU>2.0.CO;2, 2001. a, b
Stevens, B., Satoh, M., Auger, L., Biercamp, J., Bretherton, C. S., Chen, X., Düben, P., Judt, F., Khairoutdinov, M., Klocke, D., Kodama, C., Kornblueh, L., Lin, S. J., Neumann, P., Putman, W. M., Röber, N., Shibuya, R., Vanniere, B., Vidale, P. L., Wedi, N., and Zhou, L.: DYAMOND: the DYnamics of the Atmospheric general circulation Modeled On Non-hydrostatic Domains, Prog. Earth Planet. Sci., 6, 61, https://doi.org/10.1186/s40645-019-0304-z, 2019. a, b
Stevens, B., Acquistapace, C., Hansen, A., Heinze, R., Klinger, C., Klocke, D., Rybka, H., Schubotz, W., Windmiller, J., Adamidis, P., Arka, I., Barlakas, V., Biercamp, J., Brueck, M., Brune, S., Buehler, S. A., Burkhardt, U., Cioni, G., Costa-Surós, M., Crewell, S., Crüger, T., Deneke, H., Friederichs, P., Henken, C. C., Hohenegger, C., Jacob, M., Jakub, F., Kalthoff, N., Köhler, M., van LAAR, T. W., Li, P., Löhnert, U., Macke, A., Madenach, N., Mayer, B., Nam, C., Naumann, A. K., Peters, K., Poll, S., Quaas, J., Röber, N., Rochetin, N., Scheck, L., Schemann, V., Schnitt, S., Seifert, A., Senf, F., Shapkalijevski, M., Simmer, C., Singh, S., Sourdeval, O., Spickermann, D., Strandgren, J., Tessiot, O., Vercauteren, N., Vial, J., Voigt, A., and Zängl, G.: The added value of large-eddy and storm-resolving models for simulating clouds and precipitation, J. Meteorol. Soc. Jpn., 98, 395–435, https://doi.org/10.2151/jmsj.2020-021, 2020. a
Tomita, H.: A global cloud-resolving simulation: Preliminary results from an aqua planet experiment, Geophys. Res. Lett., 32, 3283, https://doi.org/10.1029/2005GL022459, 2005. a
van Zanten, M. C., Stevens, B., Nuijens, L., Siebesma, A. P., Ackerman, A. S., Burnet, F., Cheng, A., Couvreux, F., Jiang, H., Khairoutdinov, M., Kogan, Y., Lewellen, D. C., Mechem, D., Nakamura, K., Noda, A., Shipway, B. J., Slawinska, J., Wang, S., and Wyszogrodzki, A.: Controls on precipitation and cloudiness in simulations of trade-wind cumulus as observed during RICO, J. Adv. Model. Earth Sy., 3, M06001, https://doi.org/10.1029/2011MS000056, 2011. a, b, c, d, e, f, g, h, i, j, k, l, m
Vial, J., Dufresne, J.-L., and Bony, S.: On the interpretation of inter-model spread in CMIP5 climate sensitivity estimates, Clim. Dynam., 41, 3339–3362, https://doi.org/10.1007/s00382-013-1725-9, 2013. a, b
Vial, J., Bony, S., Dufresne, J.-L., and Roehrig, R.: Coupling between lower-tropospheric convective mixing and low-level clouds: Physical mechanisms and dependence on convection scheme, J. Adv. Model. Earth Sy., 8, 1892–1911, https://doi.org/10.1002/2016MS000740, 2016. a
Vogel, R., Nuijens, L., and Stevens, B.: The role of precipitation and spatial organization in the response of trade-wind clouds to warming, J. Adv. Model. Earth Sy., 8, 843–862, https://doi.org/10.1002/2015MS000568, 2016. a, b, c, d, e
Webb, M. J., Senior, C. A., Sexton, D. M., Ingram, W. J., Williams, K. D., Ringer, M. A., McAvaney, B. J., Colman, R., Soden, B. J., Gudgel, R., Knutson, T., Emori, S., Ogura, T., Tsushima, Y., Andronova, N., Li, B., Musat, I., Bony, S., and Taylor, K. E.: On the contribution of local feedback mechanisms to the range of climate sensitivity in two GCM ensembles, Clim. Dynam., 27, 17–38, https://doi.org/10.1007/s00382-006-0111-2, 2006. a
Zängl, G., Reinert, D., Rípodas, P., and Baldauf, M.: The ICON (ICOsahedral Non-hydrostatic) modelling framework of DWD and MPI-M: Description of the non-hydrostatic dynamical core, Q. J. Roy. Meteor. Soc., 141, 563–579, https://doi.org/10.1002/qj.2378, 2015. a
Zelinka, M. D., Zhou, C., and Klein, S. A.: Insights from a refined decomposition of cloud feedbacks, Geophys. Res. Lett., 43, 9259–9269, https://doi.org/10.1002/2016GL069917, 2016. a
Zelinka, M. D., Myers, T. A., McCoy, D. T., Po-Chedley, S., Caldwell, P. M., Ceppi, P., Klein, S. A., and Taylor, K. E.: Causes of Higher Climate Sensitivity in CMIP6 Models, Geophys. Res. Lett., 47, e2019GL085782, https://doi.org/10.1029/2019GL085782, 2020. a, b
- Abstract
- Introduction
- Model and setup
- Basic state dependency on resolution
- Cloud response to warming across resolutions
- Conclusions
- Appendix A: Initial profiles and large-scale forcing
- Appendix B: Impact of domain size
- Code availability
- Author contributions
- Competing interests
- Acknowledgements
- Financial support
- Review statement
- References