the Creative Commons Attribution 4.0 License.
the Creative Commons Attribution 4.0 License.
 | 23 Dec 2021
Variability and trends in surface solar spectral ultraviolet irradiance in Italy: on the influence of geopotential height and lower-stratospheric ozone
Ilias Fountoulakis
Anna Maria Siani
Alcide di Sarra
Daniela Meloni
Damiano M. Sferlazzo
The short- and long-term variability of the surface spectral solar ultraviolet (UV) irradiance is investigated across Italy using high-quality ground-based measurements from three locations: Aosta (45.7∘ N, 7.4∘ E, 570 m a.s.l.), Rome (41.9∘ N, 12.5∘ E, 15 75 m a.s.l.), and Lampedusa (35.5∘ N, 12.6∘ E, 50 m a.s.l.). The three sites are characterized by different environmental conditions and represent almost the full latitudinal extent of the Italian territory. Data of two periods were analysed: 2006–2020 (all sites) and 1996–2020 (Rome only). The main objective of this study is to quantify the effect of the geopotential height (GPH) at 250 hPa on total ozone, and spectral irradiance at 307.5 and 324 nm. We first show that monthly anomalies in GPH, total ozone, and spectral irradiances are correlated amongst the three sites, suggesting that Italy is often affected by the same synoptical weather systems. We further find statistically significant anticorrelations between GPH and monthly anomalies in total ozone for all stations and months. Conversely, we identify positive correlations between GPH and monthly anomalies in spectral irradiance at 307.5 nm for most months. The influence of GPH on short-term variability also hold for long-term trends. For example, long-term changes in total ozone over the period 2006–2020 were associated with changes in GPH for all stations. This suggests that observed negative trends in total ozone were mainly driven by changes in lower-stratospheric ozone as upper-stratospheric ozone was increasing over this period. For several months of the year, positive trends in UV irradiance were observed, and we found that these trends were predominantly caused by changes in clouds and/or aerosols instead of total ozone. For the longer period of 1996–2020, a statistically significant annualized decrease in total ozone of ∼ 0.1 % per year was identified for Rome and could subsequently be attributed to decreasing lower-stratospheric ozone. While positive trends in spectral irradiance at 307.5 nm were observed for several months of this extended period, the negative trend in total ozone did not lead to a positive trend in the spectral irradiance at 307.5 nm in the deseasonalized data. Our study provides evidence that dynamical processes taking place in the troposphere lead to significant variability in total ozone and surface solar UV irradiance.
- Article
(6893 KB) - Full-text XML
-
Supplement
(851 KB) - BibTeX
- EndNote


The amount of solar ultraviolet radiation (UVR) reaching the Earth's surface is an important environmental, ecological, and atmospheric parameter to be measured and studied. The relationship between UVR and biological effects has been well established. Exposure to UVR is vital for many living organisms, including humans; however, overexposure may result in detrimental effects in humans, animals, and plants (Paul and Gwynn-Jones, 2003; Caldwell et al., 1998; Bornman et al., 2019; Calkins and Thordardottir, 1980; Williamson et al., 2019; Häder et al., 1998). Photons with wavelengths below 290 nm are absorbed in the higher atmosphere, mainly by molecular oxygen (O2) and ozone (O3) and practically do not reach the Earth's surface. Most of the ultraviolet-B (UVB) irradiance (280–315 nm) is absorbed by ozone in the stratosphere (Bais et al., 1993; Griggs, 1968; Inn and Tanaka, 1953). Absorption by stratospheric ozone is more important than scattering by molecules and aerosols in the UVB spectral range, while scattering plays a relatively larger role than ozone absorption in the ultraviolet-A (UVA) (315–400 nm).
In the 1980s and 1990s, the increase in anthropogenic emissions of ozone-depleting substances (ODSs) led to the chemical destruction of ozone in the stratosphere mainly over Arctic and Antarctica and to reductions in stratospheric ozone at midlatitudes of the Southern and the Northern hemispheres (McConnell et al., 1992; Solomon et al., 1986). In turn, ozone reductions resulted in higher levels of UVB radiation at the Earth's surface (Kerr and McElroy, 1993; Madronich et al., 1998; Zerefos et al., 1995). Emissions of ODSs were regulated by the Montreal Protocol in 1987 and subsequent amendments and adjustments to the protocol, and since the mid-1990s the reduction in stratospheric ozone has decelerated. The first signs of recovery are now evident over higher latitudes (Solomon et al., 2016; Weber et al., 2018). Recent studies show that recovering ozone over Antarctica resulted in decreasing UVB radiation (Bernhard and Stierle, 2020). Over the Arctic, many studies report negative, but in most cases not significant, trends of UVB radiation in spring (Eleftheratos et al., 2015; Lakkala et al., 2017; Svendby et al., 2018). Due to the successful implementation of the Montreal Protocol the world avoided extremely high levels of solar UVB radiation (more than double with respect to the UVB levels in the 1970s over northern and southern midlatitudes by 2100) which would have been detrimental for the viability of ecosystems as well as for human health (McKenzie et al., 2019; Morgenstern et al., 2008; Newman and McKenzie, 2011; Young et al., 2021).
However, the future evolution of total-ozone concentration and subsequently of UVB radiation is still uncertain. Although decreasing ODSs since the mid-1990s have led to increasing ozone in the upper stratosphere (Sofieva et al., 2017; Steinbrecht et al., 1998), lower-stratospheric ozone at northern midlatitudes has been continuously decreasing, offsetting the increase occurring in the upper stratosphere (Ball et al., 2018; Wargan et al., 2018). Changes in lower-stratospheric ozone appear to have a strong spatial and seasonal variability, and the processes that drive them are not clear yet (Szela̧g et al., 2020). Furthermore, dynamical phenomena occasionally (once every few years) favour extensive destruction of Arctic stratospheric ozone in early spring (Dameris et al., 2021; Manney et al., 2011; Pommereau et al., 2018; Varotsos et al., 2012; Wohltmann et al., 2020), leading to reduced ozone over Northern Hemisphere high latitudes and midlatitudes (due to the transport of poor-ozone air masses from the poles towards midlatitudes) and subsequently to very high levels of solar UVB radiation at the Earth's surface (Bernhard and Stierle, 2020; Petkov et al., 2014). According to Bednarz et al. (2016) the relative role of dynamical processes for determining Arctic springtime ozone will increase in the future. Low-ozone episodes (Siani et al., 2002) not related to ozone over the poles can be also experienced. These episodes are characterized by significant ozone decreases over limited geographical regions and are associated with synoptic weather systems (at timescales of 1 to 3 d). As discussed in several studies (e.g. Dobson et al., 1946; Hoinka et al., 1996; Ohring and Muench, 1960; Reed, 1950; Steinbrecht et al., 1998; Varotsos et al., 2004; Vaughan and Price, 1991), changes in tropopause altitude are linked to inverse changes in the amount of total ozone. According to the studies by Varotsos et al. (2004) and Steinbrecht et al. (1998), positive trends in the height of the tropopause explain 25 %–30 % of the reduction in total ozone over Athens in 1984–2002 and Hohenpeissenberg in 1967–1997, respectively, due to the pushing up of air with the change in tropopause altitude (Vaughan and Price, 1991). Thus, an increasing altitude of the tropopause due to climate change related to the warming of the troposphere (e.g. Lin et al., 2017; Meng et al., 2021) would induce negative trends in lower-stratospheric ozone and subsequently positive trends in UVB. Over many midlatitude stations of the Northern Hemisphere, changes in aerosols and clouds – and not ozone – have been found to be the main drivers of the long-term changes in the UVB and the UVA irradiance (Chubarova et al., 2020; De Bock et al., 2014; Fitzka et al., 2012; Fountoulakis et al., 2016, 2018; Hooke et al., 2017; Lin et al., 2017; Zhang et al., 2019). Aerosols and clouds also play a significant role in the short-term variability of UVA and UVB irradiance (di Sarra et al., 2008; Kazadzis et al., 2009; Mateos et al., 2011, 2015). Two different studies (Raptis et al., 2021; Fragkos et al., 2016) report moderate or even low erythemal irradiance (Mckinlay and Diffey, 1987) during extremely low-ozone events because of a remarkably high aerosol load. The trends reported in different studies for the period between the mid-1990s to the present vary significantly even within a few hundreds of kilometres. Fountoulakis et al. (2020b) reported an average increase of 5 % per decade in irradiance at 307.5 nm for Uccle, Belgium, in 1996–2017 and for the same period an average decrease of 7 % per decade for Reading, UK, which is less than 400 km from Uccle. Other, independent studies report similar results for the two stations. Hooke et al. (2017) reported an 8 % decrease in erythemal doses for Chilton, UK (located a few kilometres from Reading) in 1991–2015, while De Bock et al. (2014) and Pandey et al. (2016) reported positive trends in Uccle (for 1991–2013 and 1995–2014, respectively).
The spatial variability in UV irradiance in Italy is very large, mainly due to the country's long latitudinal extent and complex topography (Meloni et al., 2000). Thus, atmospheric parameters may affect UVB and UVA irradiance in a different way at different locations (e.g. Fountoulakis et al., 2020b). Recent studies have shown that atmospheric parameters that significantly affect solar UV radiation, such as clouds (e.g. Manara et al., 2015, 2016; Mateos et al., 2015; Pfeifroth et al., 2018) and aerosol (Di Ianni et al., 2018; di Sarra et al., 2008; Masiol et al., 2017; Orza and Perrone, 2015; Putaud et al., 2014; Rizza et al., 2019), have changed in Italy in the last decades, either on a regional or on a country-wide scale. Although in Italy long-term continuous solar spectral UV (Diémoz et al., 2011) and total-ozone measurements (Siani et al., 2018) are available from three different stations across the country, they have never been used to study the long-term changes in UV irradiance at the surface and how they are affected by changes in total ozone. In this study, the long-term datasets of high-quality spectral UV and total-ozone measurements of three Italian sites (Aosta, Rome, and Lampedusa), located at quite different latitudes and affected by differing environmental conditions, are used to study the changes in solar UV irradiance and the extent by which they were driven by changes in total ozone. Furthermore, we examined whether and to what extent changes in synoptical atmospheric circulation affected the surface solar UV irradiance short- (e.g. yearly) and long-term variability.
The paper is structured as follows. In Sect. 2 the data and methods used for the study are described. In Sect. 3.1 the possible links between the short-term variability of UV irradiance and atmospheric dynamics are studied. In Sect. 3.2 the trends of spectral UV irradiance and total ozone for the three stations are analysed and their main drivers are discussed. Finally, in Sect. 4 the main findings and the conclusions of the study are summarized.
Long time series of high-quality spectral UV measurements are available from three Italian stations, providing a complete latitudinal coverage of Italy (Fig. 1). The Aosta monitoring station at the facilities of the Regional Environmental Protection Agency of the Aosta Valley (ARPA Valle d'Aosta) (45.7∘ N, 7.4∘ E, 570 m a.s.l.) is a semi-rural site (at Aosta–Saint-Christophe), in the north-western Alps. The site of the Physics Department of Sapienza University of Rome (41.9∘ N, 12.5∘ E, 75 m a.s.l.) is an urban site at a distance of about 25 km from the Tyrrhenian Sea. The Lampedusa Station for Climate Observations of the Italian Agency for the New Technologies, Energy and Sustainable Economic Development (ENEA), located on the island of Lampedusa (35.5∘ N, 12.6∘ E, 50 m a.s.l.) is a background remote (island) site.
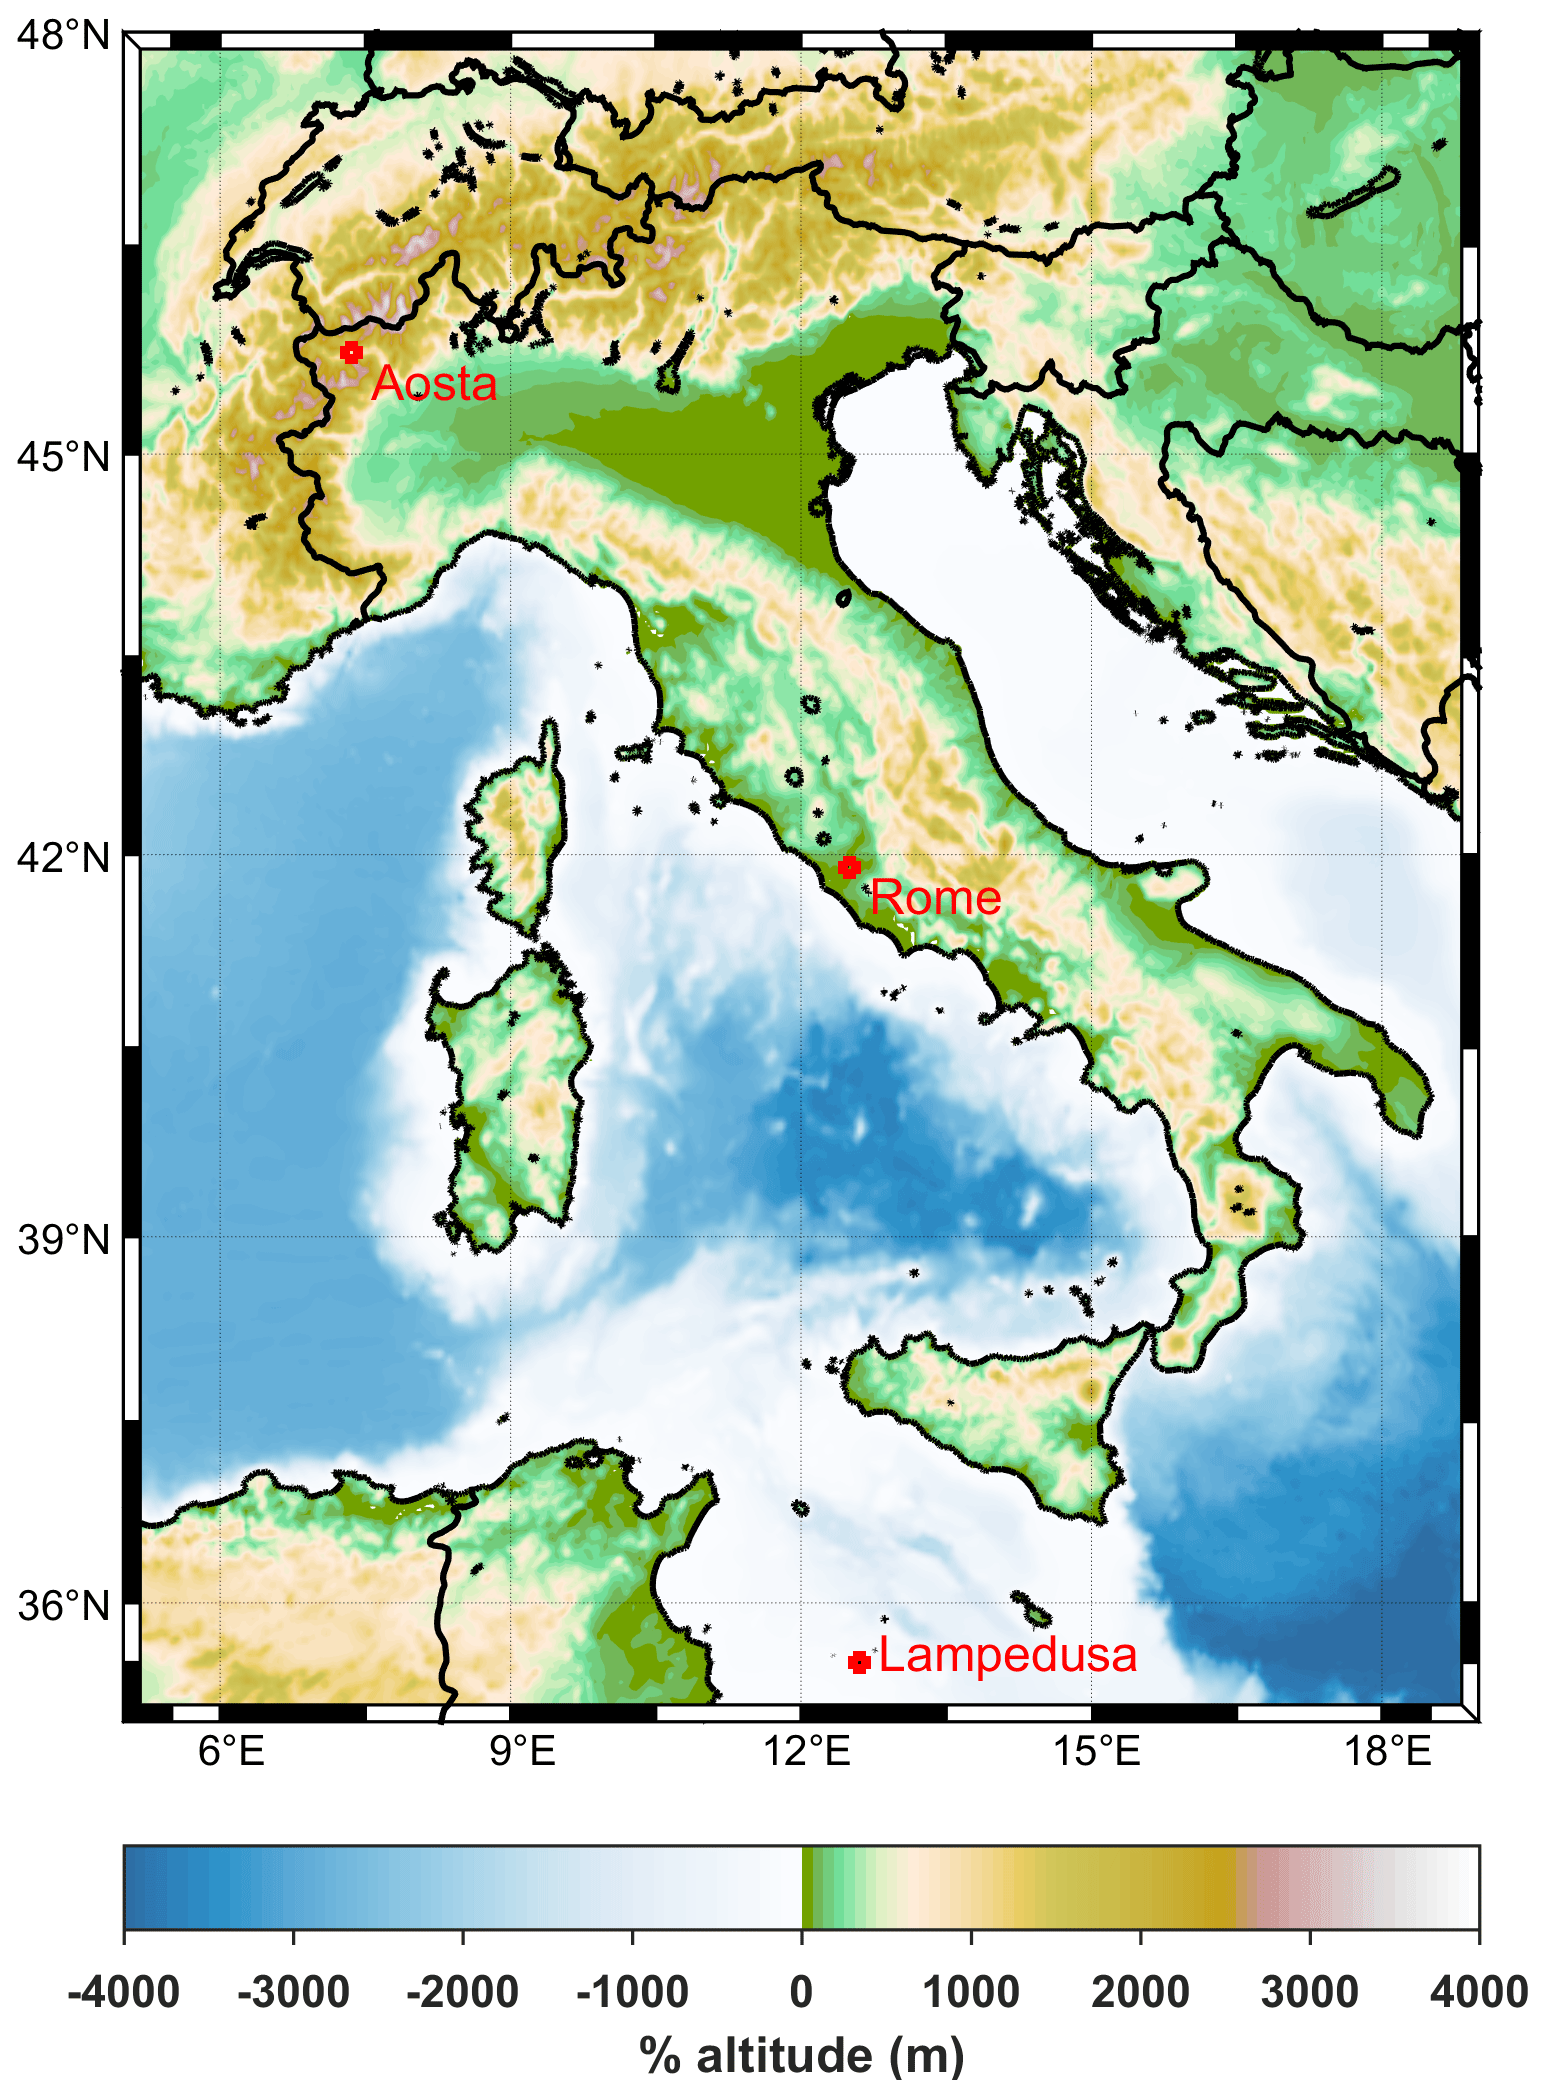
Figure 1Topographic map of Italy and the three sites for which measurements are analysed in the study.
At Rome the total column of ozone has been measured by a single monochromator Brewer (MkIV type) with the serial number 67 (Brewer#067) since 1992 (Siani et al., 2018). Measurements of the spectral irradiance have been performed by the same instrument since 1996, at wavelengths of 290–325 nm with a step of 0.5 nm and a resolution of ∼ 0.6 nm (Casale et al., 2000). The world travelling reference standard Brewer (Brewer#017) (maintained by the International Ozone Services Inc.; https://www.io3.ca/index.php, last access: 12 November 2021) transfers the ozone calibration from the reference triad maintained by Environment and Climate Change Canada (Fioletov et al., 2005; Zhao et al., 2021) to field instruments. Hereafter the travelling reference standard Brewer is referred to as the IOS standard. Intercomparisons between Brewer#067 and the IOS standard have been performed on an annual or biennial basis since the installation of Brewer#067, ensuring high-quality total-ozone measurements. At Rome UV calibrations were performed using IOS 1000 W lamps (traceable to the National Institute of Standards and Technology – NIST, Maryland, USA). Furthermore, the instrument was also compared with the travelling spectroradiometer QASUME (unit for the Quality Assurance of Spectral Ultraviolet Measurements in Europe: https://projects.pmodwrc.ch/qasume/, last access: 12 November 2021) (Gröbner and Sperfeld, 2005; Hülsen et al., 2016) during the UV intercomparison campaign in Arosa (Switzerland) in 2012 as well as at Rome in 2003 and 2008. Stability checks using 50 W lamps traceable to the IOS 1000 W lamps were regularly performed ensuring the consistency and homogeneity of the Rome UV time series during the whole period of study. For the present study measurements of total ozone and spectral UV irradiance for 1996–2020 have been used for Rome. Measurements for the first 6 months of 2018 were not used because operational problems induced increased uncertainty in the measurements.
At Lampedusa, measurements of total ozone and spectral UV irradiance have been performed since 1997 by a double monochromator Brewer (MkIII type) with the serial number 123 (Brewer#123) (di Sarra et al., 2002). Solar spectra are measured in the range of 286–363 nm with a step of 0.5 nm and a resolution of ∼0.55 nm. Calibrations of spectral UV measurements are performed four to five times per year with a field calibrator which uses 1000 W FEL lamps traceable to NIST (di Sarra et al., 2008). Regular intercomparisons (every 2–4 years since 1998) with the IOS standard ensure the good quality of total-ozone measurements. The Lampedusa spectral UV dataset has been recently subjected to quality assurance and quality control (QA/QC) for the period 2003–2020. For the present study measurements of the total ozone and spectral UV irradiance have been used for the period for which high-quality measurements were available for all three sites (i.e. 2006–2020).
At Aosta, spectral UV-visible measurements are performed by a double monochromator Bentham DTMc300 with the serial number 5541 (Bentham5541) in the range of 290–500 nm with a step of 0.25 nm and a resolution of ∼0.5 nm. Spectral UV measurements began in 2004. Since 2006 intercomparisons with QASUME were performed on an annual or biennial basis ensuring the high quality of the measurements. Recently the spectral UV dataset of Aosta was re-evaluated and homogenized for the period 2006–2020 (Fountoulakis et al., 2020a). Measurements of the total ozone are available since 2007 by a single monochromator Brewer (MkIV type) with the serial number 66 (Brewer#066). The quality of total-ozone measurements was ensured by intercomparisons with the IOS standard, which have been performed since 2007 on a biennial basis. Total ozone and spectral UV measurements for Aosta have been analysed for 2007–2020 and 2006–2020, respectively.
Intercomparisons between the IOS standard and the spectrophotometers at all three stations on an annual or biennial basis ensured the consistency between the total-ozone datasets recorded at the three stations. The good quality of the total ozone and spectral UV measurements was further ensured by performing stability checks and applying a number of QA/QC procedures on a regular (daily, weekly, or monthly basis) at each of the three sites described above (Fountoulakis et al., 2020b; Ialongo et al., 2010). The accuracy of total-ozone columns retrieved by measuring irradiances of direct sunlight radiation (DS mode) (Kerr, 2010) by well-maintained and calibrated Brewer spectrophotometers, such as those used in the present study, is of the order of 1 % (Vanicek, 2006). The consistency between measurements from different instruments (if they are well-maintained and calibrated) is also ∼1 % (Redondas et al., 2018). The standard uncertainty for spectral UV measurements at wavelengths longer than 305 nm from well-maintained and calibrated Brewer spectrophotometers is of the order of 5 % (Garane et al., 2006). The agreement between synchronous spectra from well-maintained and similarly calibrated spectrophotometers is also of the order of 5 % (standard deviation of the differences) (Bais et al., 2001). For wavelengths longer than 305 nm and solar zenith angles (SZAs) below 75∘ the standard uncertainty in the spectral UV measurements of Bentham5541 is smaller than 2.5 %. A detailed description of the uncertainties of the spectral UV measurements performed in Aosta can be found in Fountoulakis et al. (2020a). Intercomparisons between the instruments measuring total ozone and spectral UV irradiance at the three sites and the world reference standards resulted in all cases in an agreement within the desired accuracy limits.
Spectral measurements at 307.5 nm (306.5–308.5 nm average) and 324 nm (323–325 nm average) have been analysed for the three sites. Irradiance at 307.5 nm was chosen since it is strongly affected by total ozone, while the irradiance at 324 nm is weakly affected by ozone. Although ozone has a stronger effect on wavelengths shorter than 307.5 nm, the particular wavelength was chosen because it is less affected by noise and spectral stray light (relative to shorter wavelengths). For each spectrum, the ratio between the irradiance at the two wavelengths (307.5 and 324 nm) was also calculated (herein referred to as the nm ratio) because changes in the ratio should be strongly correlated with changes in total ozone. The ratio is also affected by other atmospheric factors such as high-altitude clouds (see Figs. S1 and S2 in the Supplement) and particular types of organic aerosols (e.g. Mok et al., 2016). However, the effect of these atmospheric parameters on the variability of the nm ratio is expected to be minor relative to the role of ozone. For each day, all spectra measured within ±2∘ around the selected SZAs were interpolated to the central SZAs of 65 and 45∘ using the empirical relationship proposed by Fountoulakis et al. (2016) and then averaged to calculate the irradiance. For Aosta, the SZA of 67∘ was used instead of 65∘ because the minimum (noon) SZA in most days of December and January is larger than 65∘, while at Rome and Lampedusa the SZA of 65∘ is reached throughout the year. Choosing the SZA of 67∘ also for Rome and Lampedusa would produce more gaps in their UV series due to the lower availability of measurements at 67∘ relative to 65∘. For months for which measurements at 65∘ were adequate for the calculation of monthly anomalies in Aosta, we performed the analysis for both SZAs (65 and 67∘) and the results were nearly identical (which was expected since monthly UV anomalies were used in the study instead of absolute UV irradiances). At all sites, the SZA of 45∘ is reached in the period April–September.
Monthly averages of the irradiances and the ratio were calculated for months for which measurements were available for at least 15 d (with the sub-criterion that measurements were available for at least 5 d for each of the following sub-periods: day 1–day 10, day 11–day 20, day 21–end). total-ozone daily averages were used for the calculation of monthly averages, again when measurements for at least 15 d were available. For all three stations, analyses were performed for the period September 2006–August 2020 (14 years), i.e. the longest period of overlapping measurements. For Rome, analyses were additionally performed for the period September 1996–August 2020 (24 years). In all cases, monthly climatological averages of each quantity were calculated for the whole available period (2006–2020 or 1996–2020). Monthly anomalies were calculated by subtracting the monthly climatological averages from the monthly average values. Calculation of trends was performed by applying a least square linear fit to the monthly anomalies and statistical significance was in all cases estimated by applying the Mann–Kendall test. Trends were not calculated when anomalies were available for less than 50 % of the months in the first half and 50 % of the months in the second half of each period.
In addition to the ground-based measurements, re-analysis products from Modern-Era Retrospective analysis for Research and Applications version 2 (MERRA-2) have been used, mainly for the investigation of changes in atmospheric conditions and ozone at different atmospheric levels. All MERRA-2 products used in the present study were provided at a grid resolution of 0.5∘ × 0.625∘ (latitude × longitude) and were downloaded from the Giovanni platform maintained by National Aeronautics and Space Administration (NASA) (https://giovanni.gsfc.nasa.gov/giovanni/, last access: 12 November 2021). Monthly average total ozone (GMAO, 2015b) for 1996–2020 and geopotential heights (GPHs) at 250 and 850 hPa (GMAO, 2015a) were downloaded and analysed for southern Europe. Several studies report a link between tropopause altitude and total ozone (e.g. Steinbrecht et al., 1998; Varotsos et al., 2004). In this study we tried to find the link between the GPH at 250 hPa and total ozone in order to investigate and highlight the relationship between synoptical tropospheric conditions (for which the 250 hPa GPH is a better proxy relative to the tropopause altitude) and total ozone. The 850 hPa GPH was chosen as a proxy for the dynamical conditions near the surface. It was chosen instead of the GPH at a higher pressure level (e.g. 1000 hPa) because it is less affected by the features of the surface. The GPH was linearly interpolated to the coordinates of Aosta, Rome, and Lampedusa in order to study its variability over these sites. Monthly average ozone mixing ratios (GMAO, 2015a) from MERRA-2, at different pressure levels between 150 and 3 hPa for 1996–2020 have been interpolated to the coordinates of the station of Rome. The version 7 Aqua/AIRS L3 Monthly Standard Physical Retrieval (AIRS-only) tropopause height product with 1∘ × 1∘ resolution (AIRS3STM) (AIRS, 2019) was also interpolated to the coordinates of the three stations for the period 2006–2020. The AIRS3STM was also downloaded from the same platform. As shown later, positive/negative anomalies in GPH at 250 and 850 hPa generally coincide with positive/negative anomalies of the tropopause altitude.
3.1 Short-term variability of UV irradiance and the role of changes in GPH
In this section, we investigate whether there is a correlation between the monthly anomalies of GPH at 250 hPa (hereafter named GPH unless otherwise specified) and the corresponding anomalies of UV irradiance (at 307.5 and 324 nm) and the nm ratio. Here, and in the following sections, the Pearson (i.e. linear) correlation coefficients are reported. For all cases in which a strong correlation was found, lines were fitted to scatter plots of the various parameters. The investigation was performed for all three stations for the period 2006–2020. For Rome, the analyses were also performed for the period 1996–2020.

Figure 2Scatter plots and correlation coefficients (cc) between the monthly anomalies of GPH (first row), irradiance at 307.5 nm (second row), irradiance at 324 nm (third row), the nm ratio (fourth row), and total ozone (fifth row) in terms of anomalies for the pairs Rome–Aosta (first column), Lampedusa–Rome (second column), and Lampedusa–Aosta (third column). Numbers in bold with asterisks denote statistical significance.
Figure 2 shows the sequence of the correlation analysis among the sites for the different atmospheric parameters. As shown in Fig. 2, the GPH at Aosta and Rome varies in a similar way despite the distance between the two locations and the fact that the two sites are in quite different environments. The correlation coefficient for GPH at the two sites (panel a) is ∼0.9 and indicates that to a great extent the two sites are affected by the same synoptical systems. This strong correlation is also found for the anomalies of total ozone (panel m) and subsequently for the anomalies of the 307.5 nm irradiance (panel d) and the nm ratio (panel j). The correlation for the 324 nm irradiance (panel g) is statistically significant but weak (∼0.28). The corresponding correlations between the same variables (with the exception of the 324 nm irradiance) at Rome and Lampedusa were also significant but weaker than for Rome and Aosta, which was expected since the latitudinal distance between Rome and Lampedusa (6.4∘) is larger than the distance between Rome and Aosta (3.8∘). Part of the differences could be also due to the fact that dust outbreaks play a more significant role in the variability of surface UVR over Lampedusa than in Rome and Aosta (e.g. Meloni et al., 2008). Weak but statistically significant correlation for GPH (∼0.5) and total ozone (∼0.4) was found between Aosta and Lampedusa. However, in this latter case the correlation found for total ozone and GPH is not reflected in the levels of UV irradiance. Further analyses showed that for GPH and total ozone the correlation between different sites was generally stronger in winter and weaker in summer. Even for summer, however, the correlations between the aforementioned parameters for the pairs Aosta–Rome and Rome–Lampedusa were statistically significant (in the case of total ozone the correlation was also significant for the pair Lampedusa–Aosta). What is interesting is that the strongest correlations for the 307.5 nm irradiance and the nm ratio between the three sites were found for summer, which shows that the levels of the 307.5 nm irradiance over all three sites varied in a similar way, mainly because total ozone also varied in a very similar way.
In Table 1 the correlation coefficients between GPH and the UV irradiance at 307.5 and 324 nm (for SZAs 67 and 45∘), GPH and the nm ratio (for SZA = 67∘ and SZA = 45∘), and GPH and total ozone are presented. The change (in DU) in total ozone and (in %) in the irradiances and the ratio for a 1 m change in GPH are also shown for the cases for which statistically significant correlations or anticorrelations were found. The latter changes were again calculated assuming linear correlation (or anticorrelation) between GPH and the aforementioned parameters. The monthly anomalies for each of the four seasons of the year (December, January, February for winter, March, April, May for spring, June, July, August for summer, and September, October, November for autumn) were used for the calculation of the correlation coefficients. Numbers in bold denote statistical significance (the Mann–Kendall method was used to determine statistical significance) at the 95 % confidence level (hereafter the statistical significance at the 95 % confidence level is referred as statistical significance).
Table 1Correlation coefficients between the anomalies of GPH and other parameters (total ozone, irradiance at 307.5 and 324 nm, and the nm ratio) for four different seasons of the year. Values in bold denote statistically significant correlation or anticorrelation. Values in parentheses represent the change (in DU for total ozone and in % for irradiance, for each parameter for which a statistically significant correlation or anticorrelation was found) for a 1 m change in GPH.

Variations in the GPH at 250 hPa are strongly correlated with variations in the tropopause altitude as well as with variations in the GPH at 850 hPa (i.e. near the surface) (see Fig. S3). Thus, the results presented in Table 1 partially confirm the findings of previous studies reporting correlation between tropospheric dynamics variability and total ozone, since a strong and statistically significant anticorrelation between total ozone and GPH was also found for all Italian stations and all seasons. The correlation was slightly lower in summer relative to other seasons (especially in Aosta). A possible explanation is that the relatively stable synoptical conditions in summer led to much smaller variability in GPH relative to other seasons of the year, which in turn had a weaker effect on total ozone relative to other phenomena. As discussed in the following sections, changes in GPH also played a significant role in the total-ozone long-term changes over Italy.
The anticorrelation between total ozone and GPH was associated with, in most cases, a statistically significant correlation between GPH and the nm ratio. The correlation between the GPH and the ratio was generally stronger for Aosta than for Lampedusa and Rome. This is possibly because variations in the GPH are linked to larger variations in the total ozone at higher latitudes, given that the amount and the variability of total ozone increase with increasing latitude. The correlation between GPH and the 307.5 nm irradiance was also statistically significant in most cases. In some cases (e.g. Aosta in autumn) the correlation between GPH and the nm ratio was much stronger than the correlation between GPH and the 307.5 nm irradiance. As already discussed, the variability of the ratio was mainly determined by the variability of total ozone, while the 307.5 nm irradiance was also affected by the variations in factors such as clouds and most types of aerosols which have a relatively flat spectral effect in the range of 307.5–324 nm.
It is interesting to note that in addition to the significant correlation between GPH and the 307.5 nm irradiance, strong and statistically significant correlation was found between GPH and the 324 nm irradiance for Rome. For the SZA of 45∘ the correlation was significant for spring and summer. For 67∘ the correlation was significant for all seasons for 2006–2020 and for all seasons except summer for 1996–2020. The correlation coefficients were generally larger for 2006–2020 relative to 1996–2020. Statistically significant correlation between the 324 nm irradiance and the GPH has been found for Lampedusa in winter and for Aosta in autumn. The strong link between GPH and the 324 nm irradiance may be related to changes in aerosols and clouds, associated with changes in synoptical meteorological conditions. Aerosol and clouds, in their turn, affect the levels of both UVB and UVA irradiances. Changes in GPH at 250 hPa were strongly correlated with changes in pressure near the surface and subsequently changes in GPH at 850 hPa (see Fig. S3), which were strongly linked to changes in cloudiness and wind patterns (both of which also affect aerosol load).
According to the results shown in Table 1, an increase of 1 m in the GPH induced a decrease of 0.2–0.5 DU in total ozone over Italy and a corresponding increase of 0.02 %–0.07 % in the nm ratio. The increase in the 307.5 nm irradiance due to a 1 m increase in GPH ranged between 0.01 % and 0.1 % depending on season and station. The results were similar for 324 nm (increase in the irradiance by 0.01 %–0.07 % for a 1 m increase in GPH) when a significant correlation with GPH was found.
3.2 Long-term variability of spectral UV irradiance and total ozone
3.2.1 Long-term variability in the period 2006–2020
In this section, the results of the analysis of the long-term changes for the same quantities as those discussed in Sect. 3.1 are presented and discussed for the period September 2006–August 2020, during which measurements were available for all three stations: Aosta, Rome, and Lampedusa. The estimated trends of the irradiances at 307.5 and 324 nm and the nm ratio at SZA = 65∘ (67∘ for Aosta) are presented in Fig. 3, while the corresponding trends for SZA = 45∘ are presented in Fig. 4. The trends were calculated separately and are presented for each month of the year. The estimated trends for total ozone (from ground-based measurements) and GPH are presented in Fig. 5.
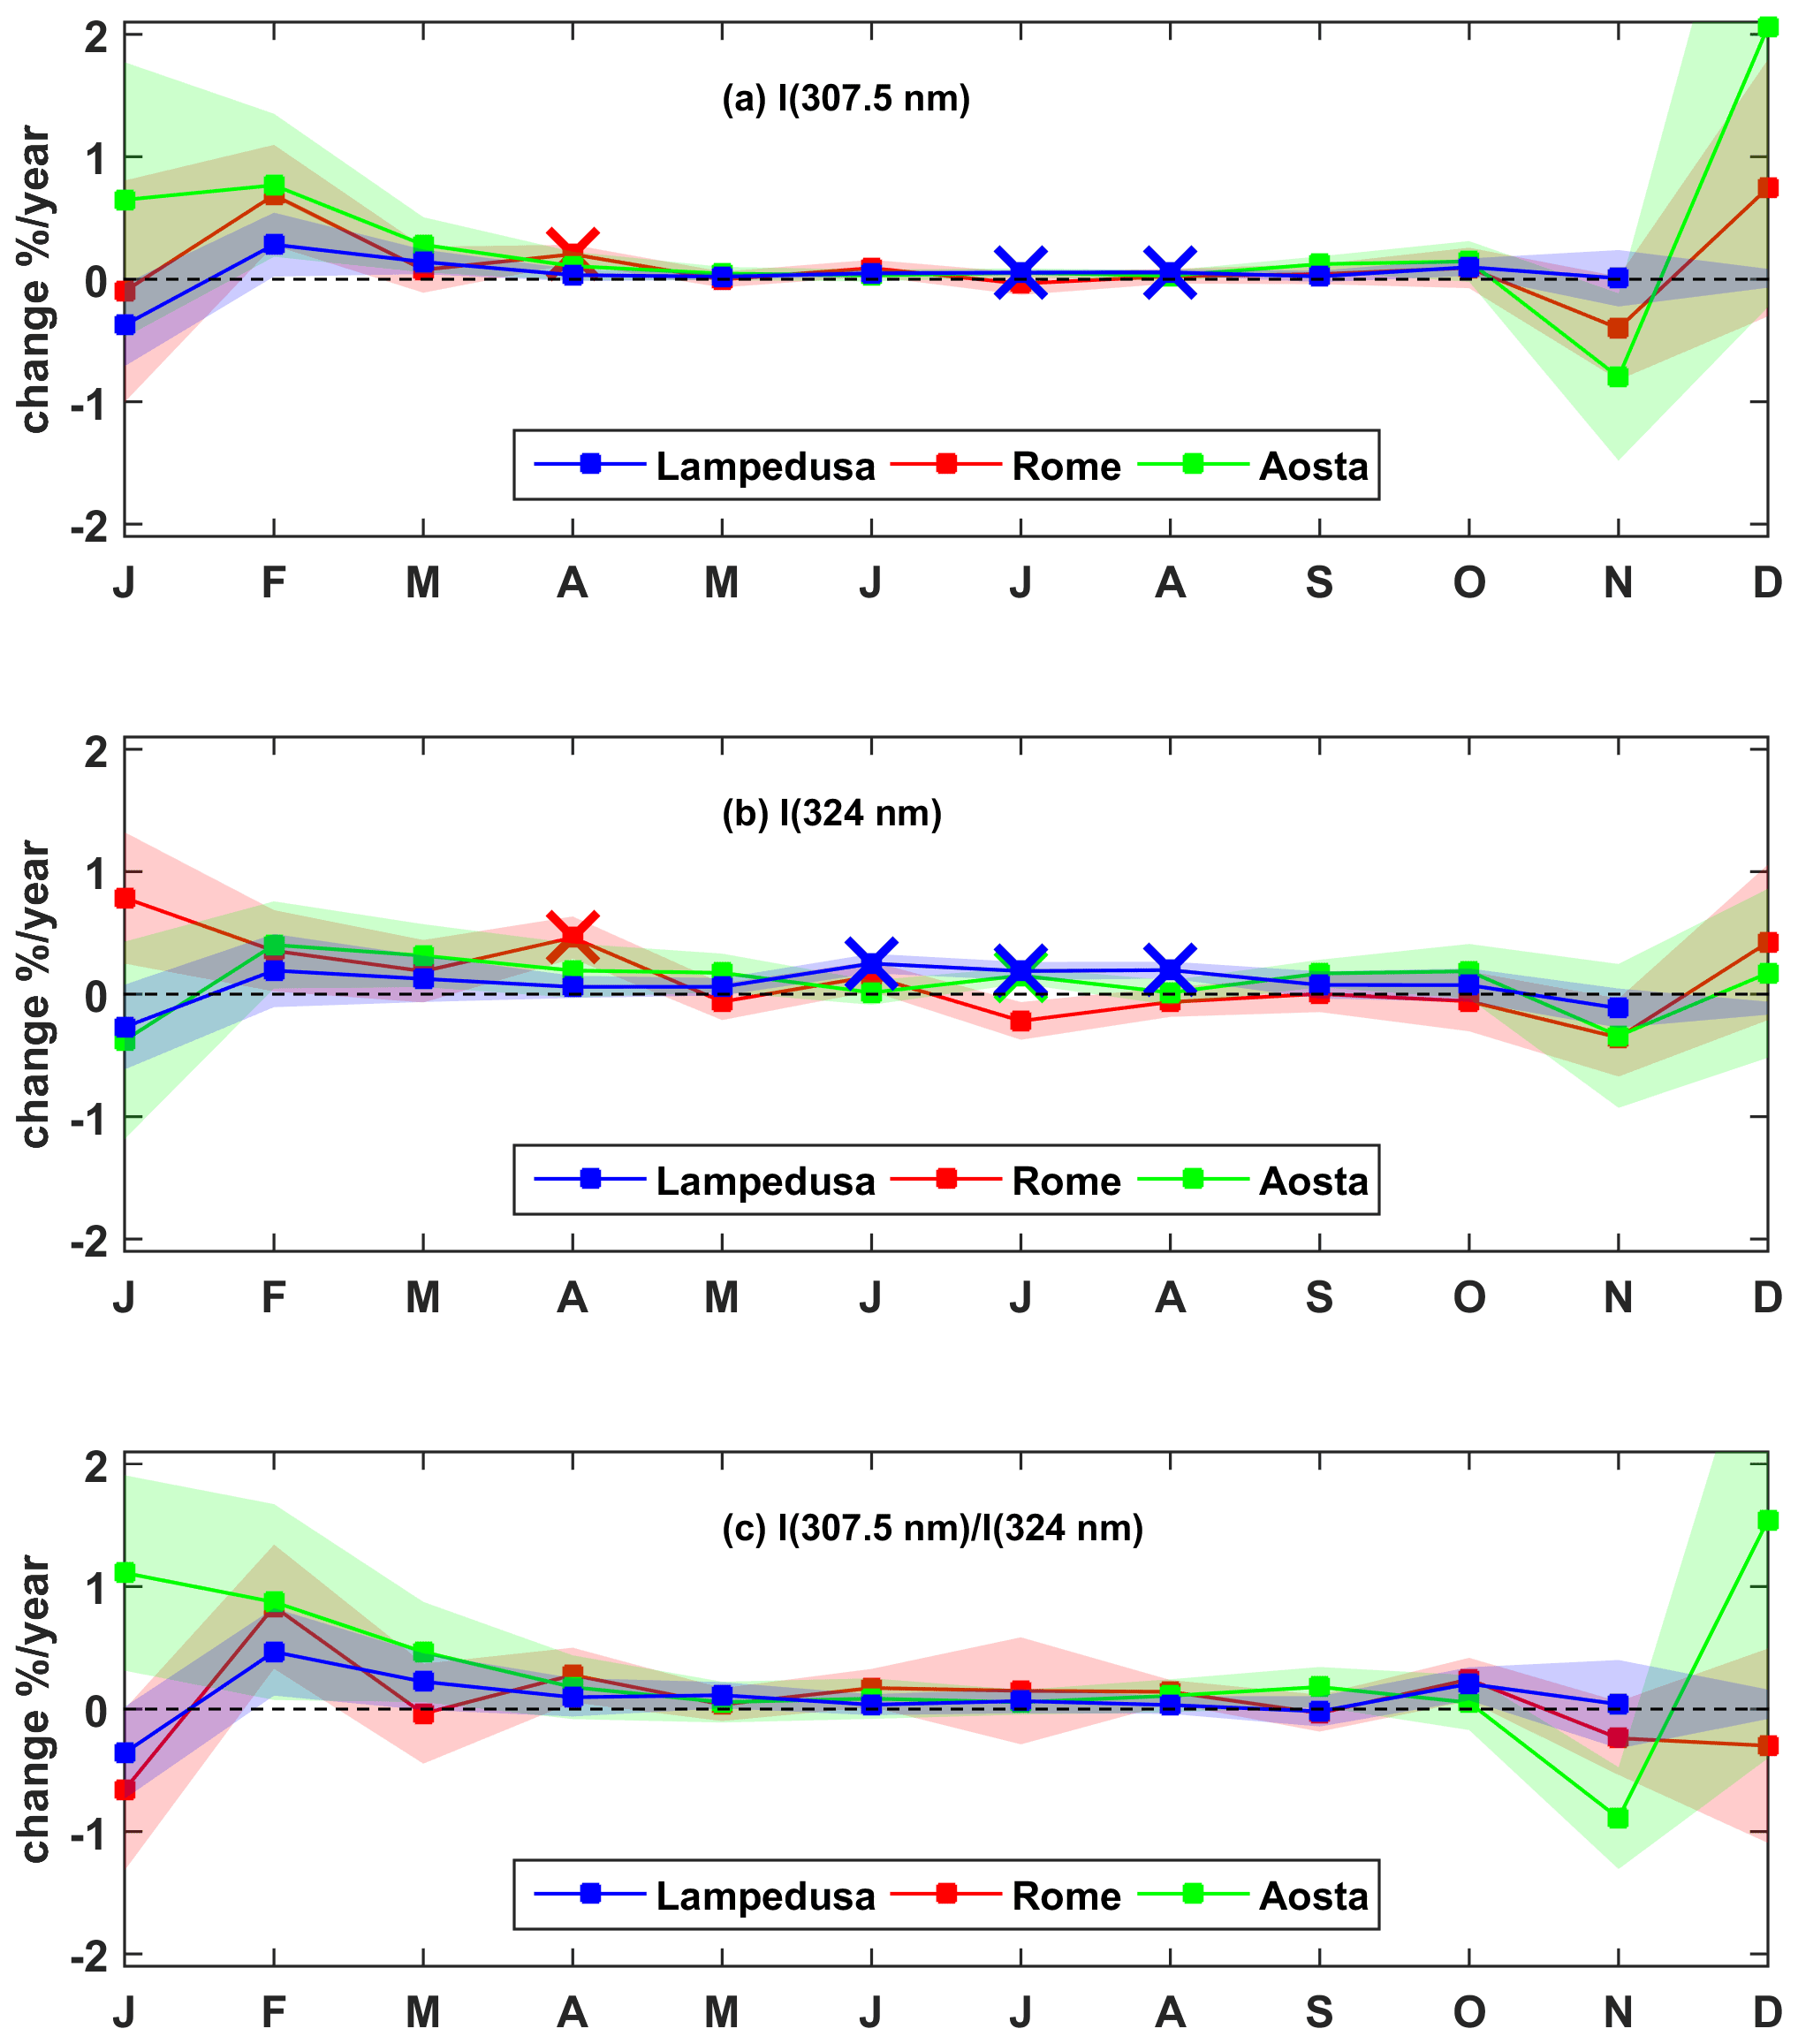
Figure 3Average change (%) per year of (a) irradiance at 307.5 nm, (b) irradiance at 324 nm, and (c) the nm ratio. Results are for SZA = 67∘ for the period 2006–2020. Statistically significant changes have been marked with ×. Shaded areas correspond to the 1σ standard deviation.

Figure 4Average (%) change per year of (a) irradiance at 307.5 nm, (b) irradiance at 324 nm, (c) and the ratio between the irradiances at 307.5 and 324 nm. Results are for 45∘ for the period 2006–2020. Statistically significant changes have been marked with ×. Shaded areas correspond to the 1σ standard deviation.

Figure 5Average (%) change per year of (a) total ozone and (b) GPH for the period 2006–2020. Statistically significant changes have been marked with ×.
For Aosta, no significant change in the 307.5 and 324 nm irradiances or of their ratio was found for the SZA of 67∘. At the SZA of 45∘ the 324 nm irradiance increased in August by 0.6 %/yr. In the same month total ozone did not change, which is consistent with the absence of a significant trend in the ratio. However, GPH increased significantly by 88 m/yr, which may be related to changes in cloudiness and/or aerosols (e.g. Manara et al., 2016). A possible explanation for the fact that, in August, the UV irradiance at 45∘ increases while it remains relatively stable at 67∘ is that the two SZAs correspond to different times of the day, in which cloudiness and/or aerosols may change differently. In November an increase in total ozone over Aosta of 0.7 %/yr was found, which again coincides with a (not significant) GPH decrease.
At Lampedusa, the UV irradiance increased significantly for SZA = 65∘ in summer. The irradiance at 324 nm increased by ∼0.2 %/yr in June, July, and August. The corresponding increase in the irradiance at 307.5 nm for the same months was ∼0.05 %/yr and was statistically significant only in July and August. It is possible that the detected changes in UV irradiance are due to changes in aerosols (e.g. dust) since clouds are rare at Lampedusa in summer. However, the overall change for the whole period of study (for summer at 65∘) is ∼3 % for 324 nm and ∼1 % for 307.5 nm, which is below the standard uncertainty in the measurements (∼5 %). Thus, the reported trends should be treated with caution. Total ozone did not change at Lampedusa for any of the 12 months despite the statistically significant increase in GPH in September.
The UV irradiance in April at Rome increased significantly at SZA = 65∘ for both 307.5 and 324 nm by ∼ 0.2 %/yr and ∼0.5 %/yr, respectively, at 65∘. The corresponding increase at SZA = 45∘ was by ∼1 %/yr at both wavelengths. The nm ratio also increased, but the increase was not statistically significant. These results show that changes in total ozone were not the dominant driver of changes in UV irradiance in April in 2006–2020 and that other factors such as aerosols and clouds played a more important role. No statistically significant changes were detected for any other months.
3.2.2 Long-term variability at Rome for the period 1996–2020
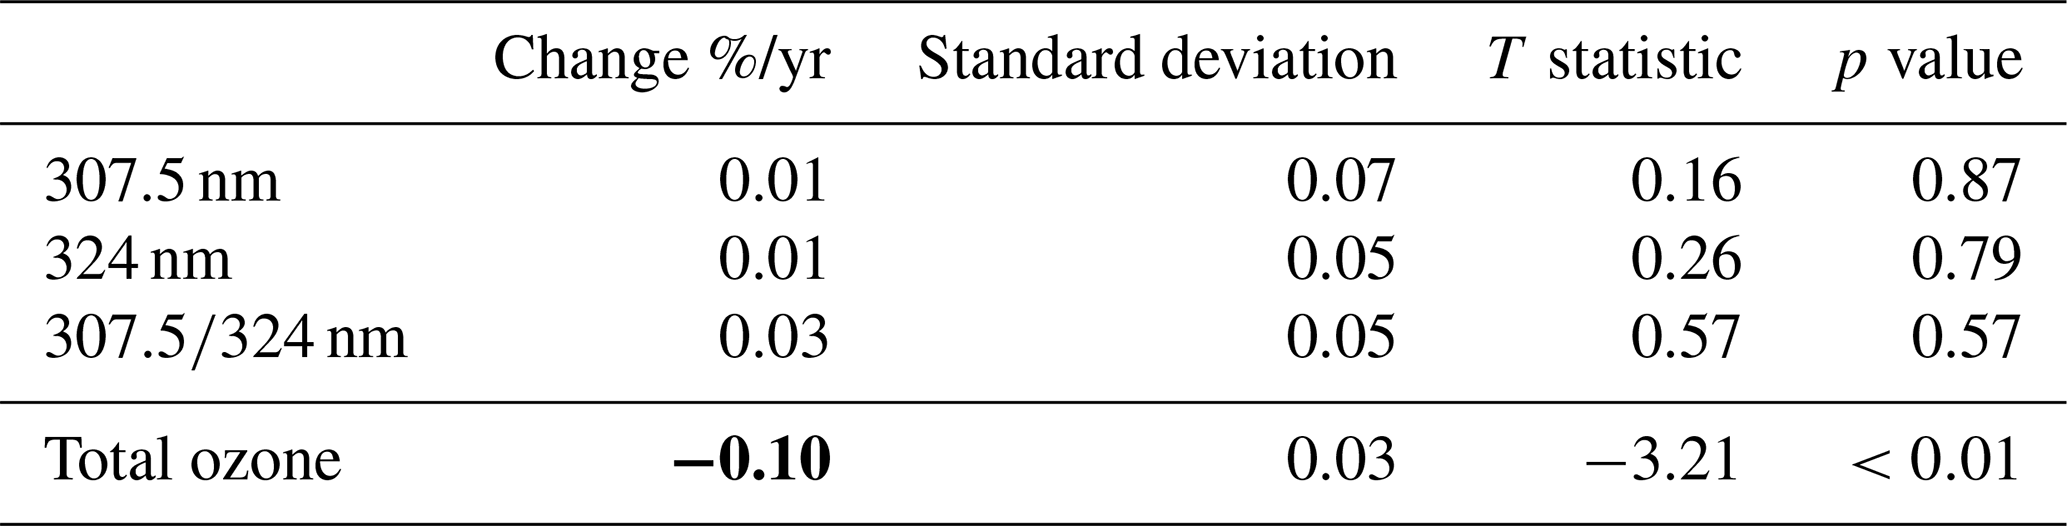
In Fig. 6, the monthly anomalies of the 307.5 nm irradiance, the 324 nm irradiance, the nm ratio, and the total ozone are presented for Rome for the period September 1996–August 2020 at the SZA of 65∘. Moving averages and linear trends for the four quantities are also presented in the same figure. The calculated trends and the corresponding p values are presented in Table 2. A negative, statistically significant trend of −0.1 %/yr was found for total ozone, corresponding to a decrease of 2.4 % during the 24-year period. Although total ozone decreased, neither the 307.5 nm irradiance nor the nm ratio increased.
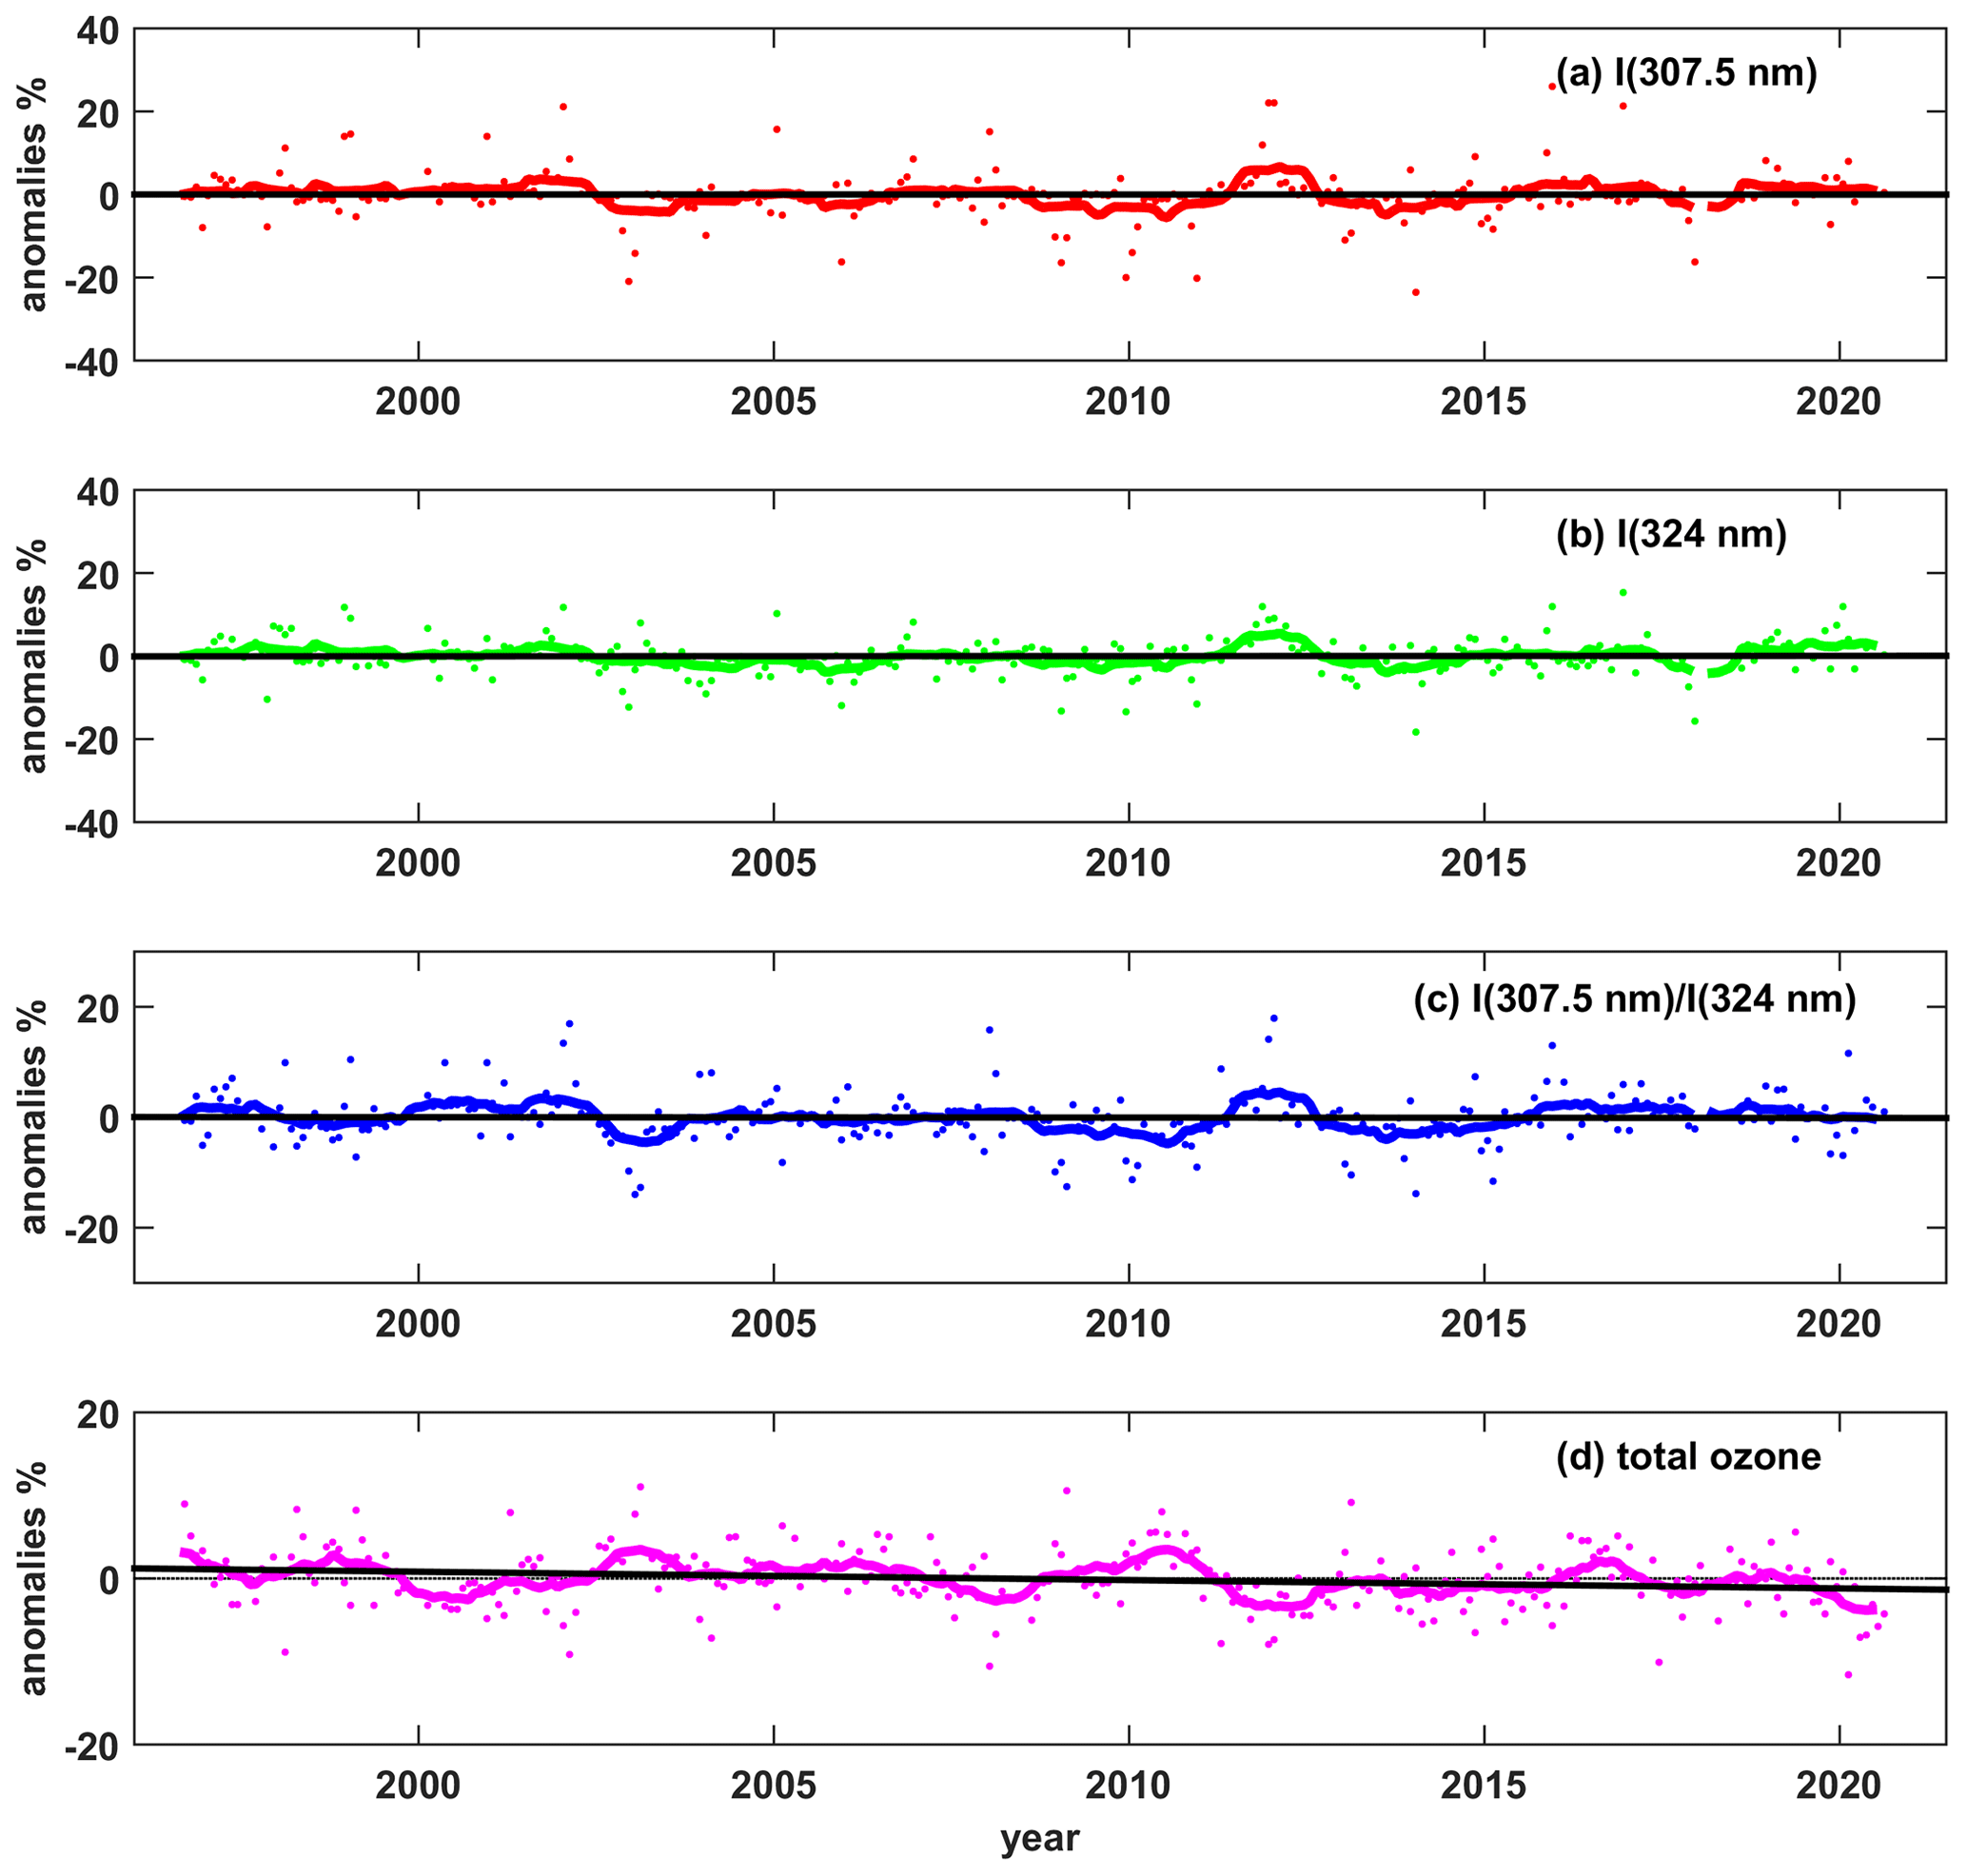
Figure 6Anomalies (% differences relative to the monthly climatological values, represented by dots), 12-month moving averages (thick coloured lines), and trends (black lines) for Rome, for the monthly averages of (a) the irradiance at 307.5 nm, (b) the irradiance at 324 nm, (c) the ratio between the 307.5 and 324 nm irradiances, and (d) the total ozone.
Table 2Trends and statistics for the 307.5 nm irradiance, the 324 nm irradiance, the nm ratio, and the total ozone for Rome in 1996–2020. Statistically significant trends are in bold.
The trends for each month were calculated for the 24-year period and are presented in Fig. 7. Analyses were performed for both SZAs, 65 and 45∘. In addition to the trends of spectral irradiance, the results for the nm ratio are presented. Trends for July at 65∘ are not shown because of the large number of missing values. The long-term changes in GPH and total ozone (measured by Brewer#067) were also investigated and are presented in Fig. 8.
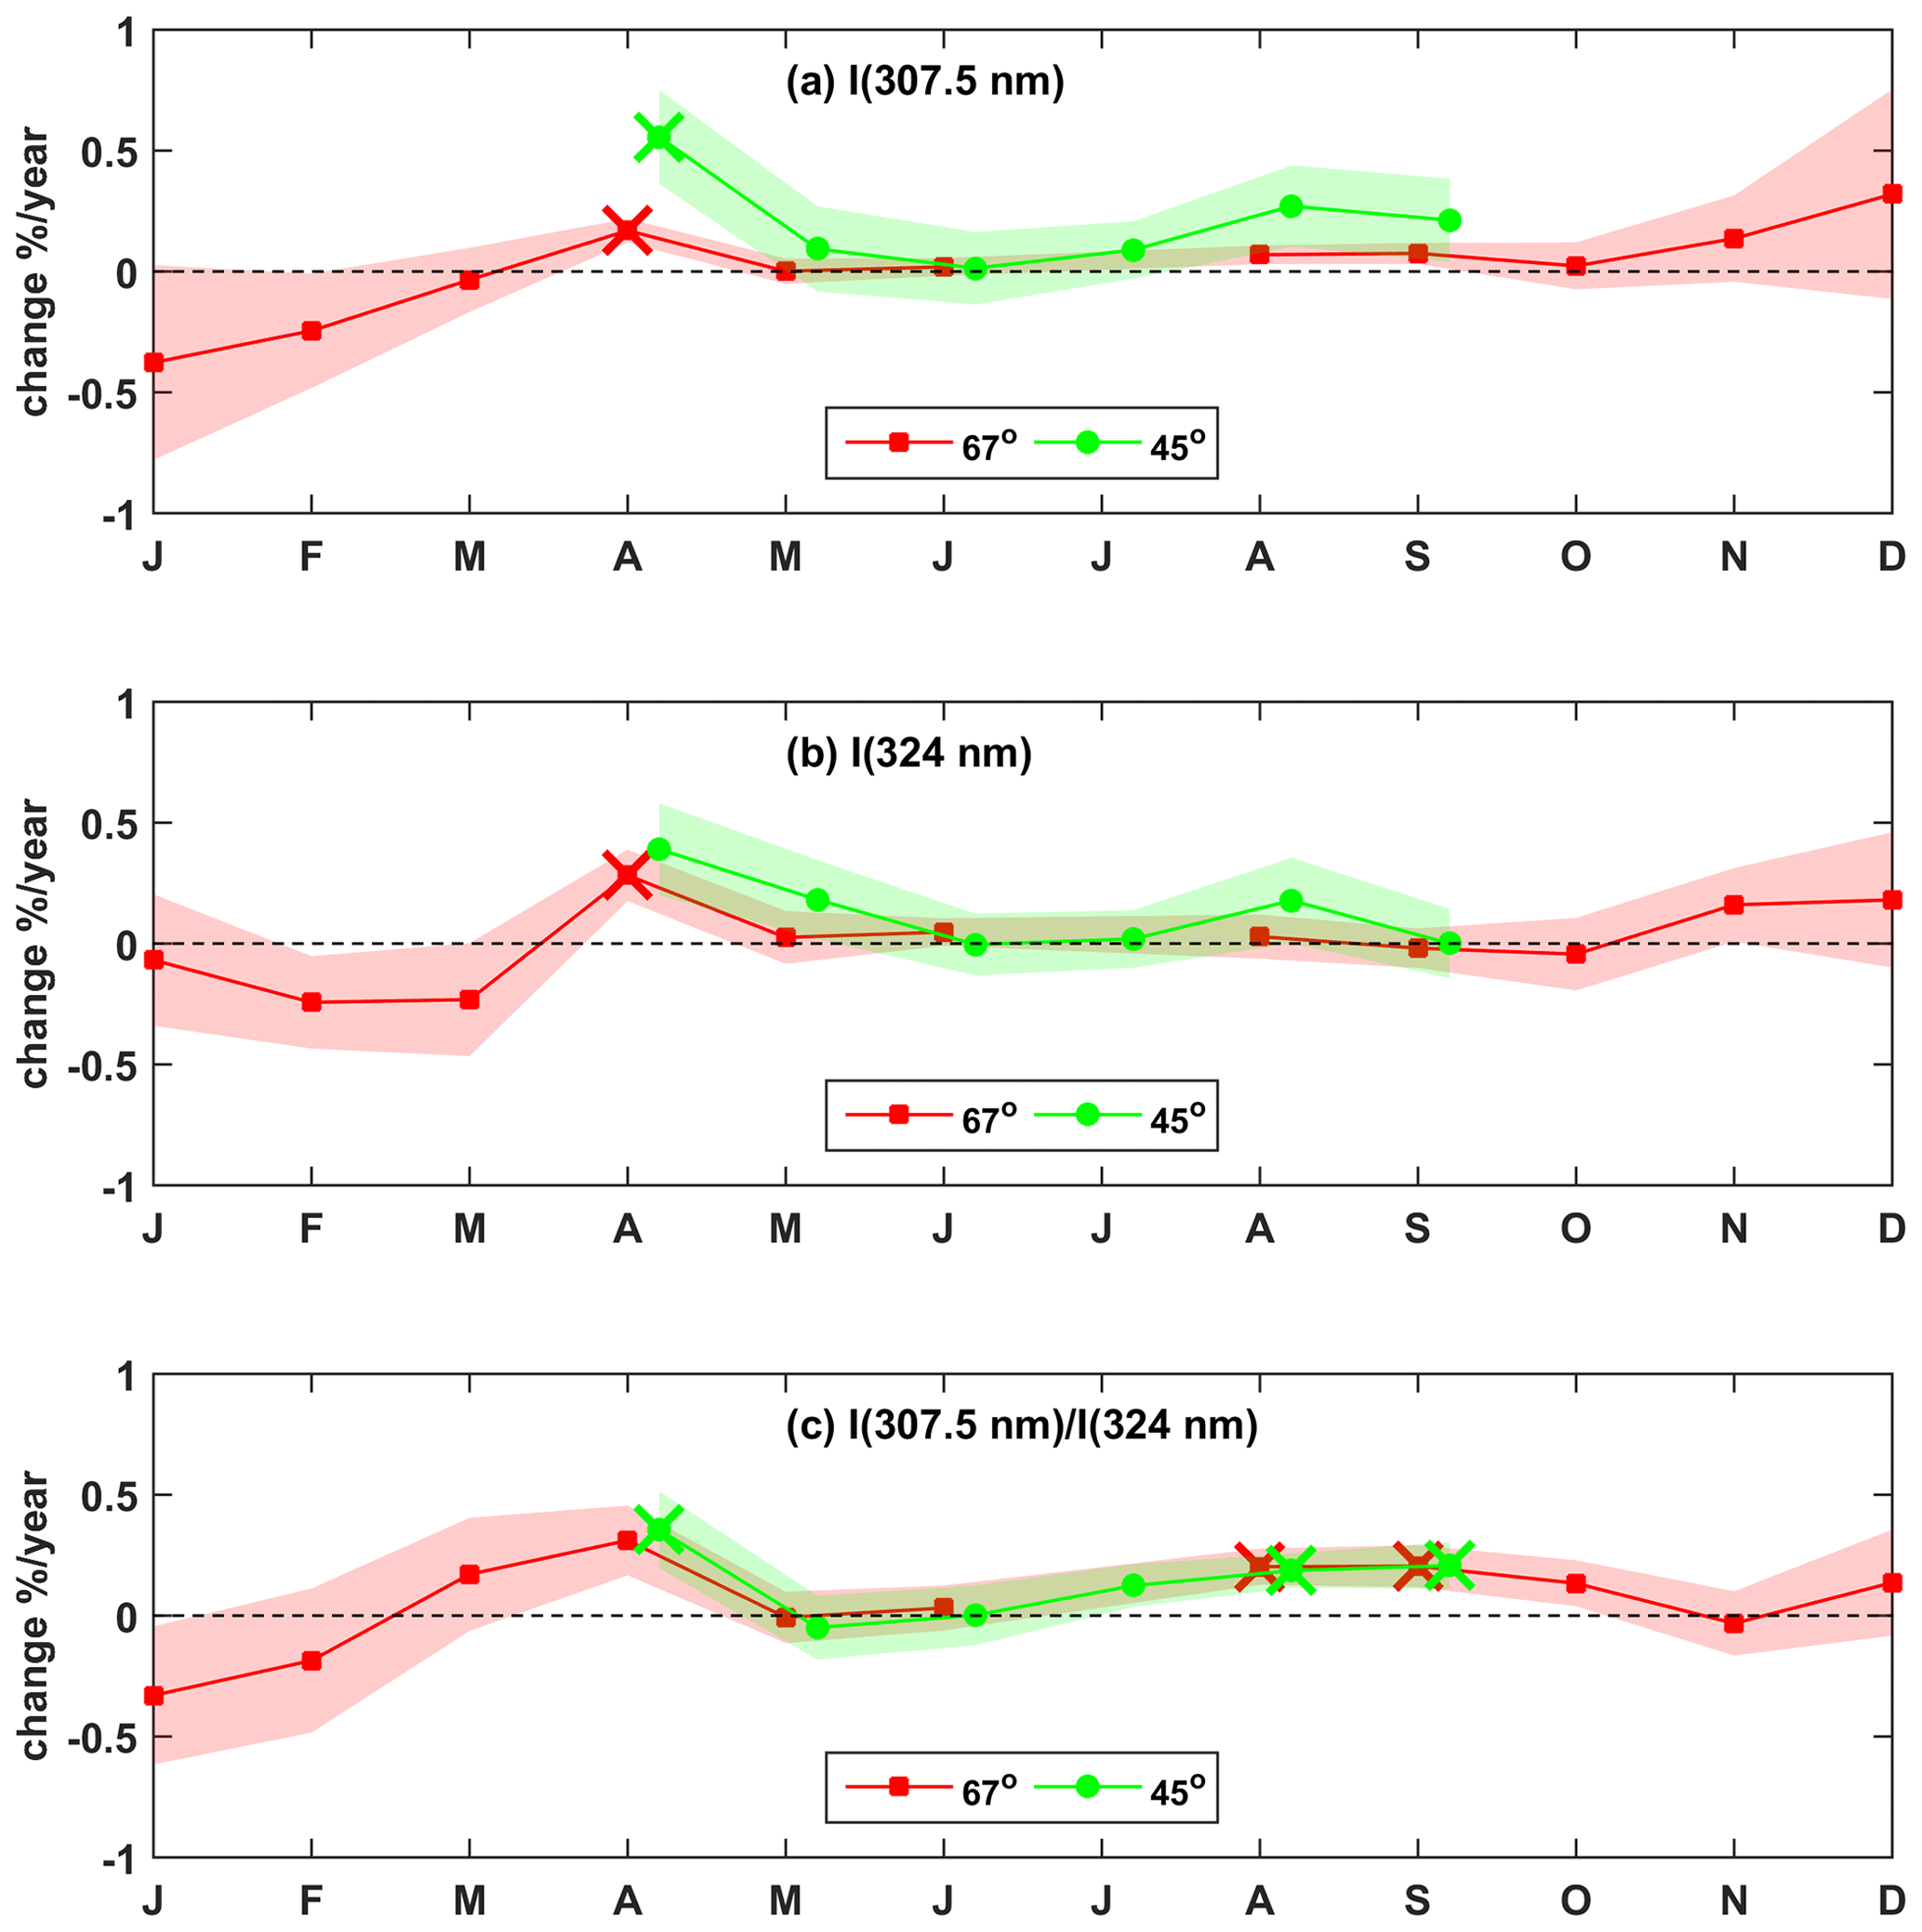
Figure 7Average (%) change per year of (a) irradiance at 307.5 nm, (b) irradiance at 324 nm, (c) and the ratio between the irradiances at 307.5 and 324 nm for Rome, for the period 1996–2020. Trends of the irradiances and the ratio are presented for the 45 and 67.5∘ SZAs. Statistically significant trends have been marked with ×. Shaded areas correspond to the 1σ standard deviation.
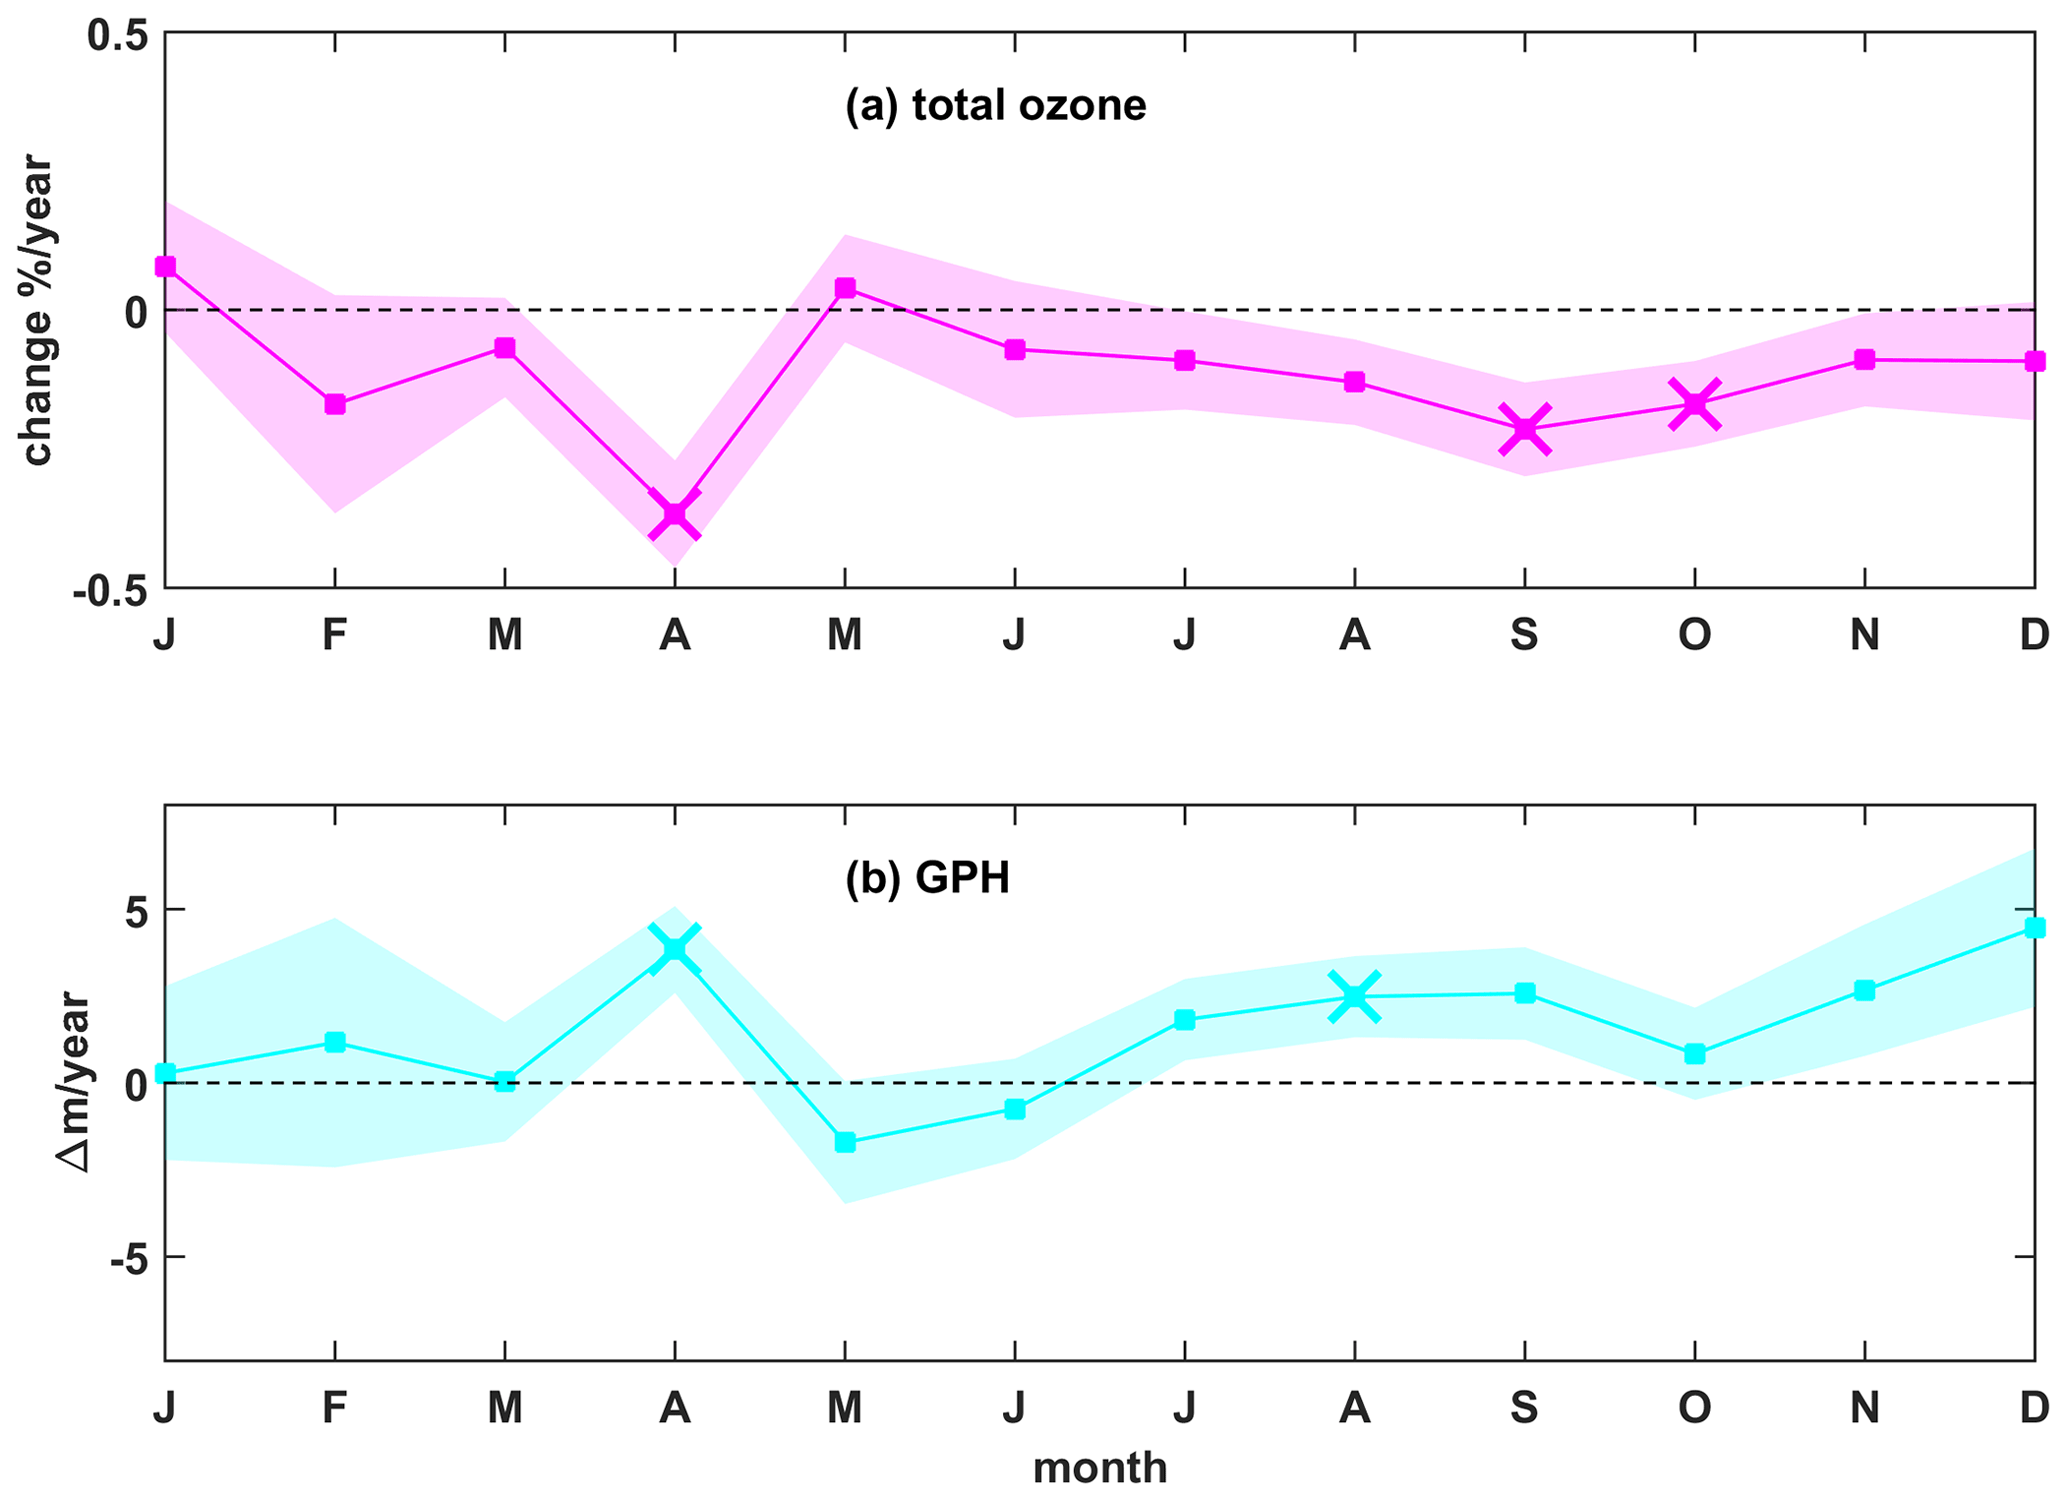
Figure 8Average (%) change per year of (a) total ozone and (b) GPH for Rome, for the period 1996–2020. Statistically significant trends have been marked with ×. Shaded areas correspond to the 1σ standard deviation.
For the SZA of 65∘, the irradiance at both wavelengths increased significantly in April by 0.2 %/yr at 307.5 nm and 0.3 %/year at 324 nm. In the same month the 307.5 nm irradiance at 45∘ also increased significantly by 0.5 %/yr. The ratio changed in the same way for both SZAs and increased significantly in April (by ∼ 0.35 %/yr), August, and September (for both months by 0.2 %/yr), inversely following the negative total-ozone trends. Total ozone decreased significantly in April (with an average rate of −0.4 %/yr), September (with an average rate of −0.2 %/yr), and October (with an average rate of −0.15 %/yr). A decrease in total ozone of −0.15 %/yr was also found for August, which however was not statistically significant.
It can be also perceived from Fig. 8 that trends in total ozone have the opposite sign as trends of GPH, which is a strong indication that trends in total ozone are related to dynamical changes in the troposphere and the lower stratosphere, which in turn shows that at least part of the trends was due to a reduction in ozone in the lower stratosphere. Based on the results shown in Table 1, we estimated that about 50 %–70 % of the long-term variability of total ozone and nm ratio for different months (shown in Figs. 7 and 8) is explained from the long-term variability of the GPH (shown in Fig. 8). Many recent studies show that in the midlatitudes of the Northern Hemisphere ozone increased in the upper stratosphere and decreased in the lower stratosphere (Ball et al., 2019; Eleftheratos et al., 2020; Sofieva et al., 2017; Staehelin et al., 2001). Thus, an explanation of the results presented in Figs. 6, 7, and 8 could be that the negative trends in lower-stratospheric ozone dominated over positive trends in upper-stratospheric ozone over Rome, resulting in an overall decrease in total ozone.
Qualitative analysis of the monthly average ozone mixing ratio at different pressure levels between 100 and 3 hPa for the period of study over Rome (see Fig. S4) confirmed that ozone increased at lower pressure levels and decreased at higher pressure levels, which agrees with the findings of previous studies. A detailed quantitative analysis is however beyond the scope of the present study.
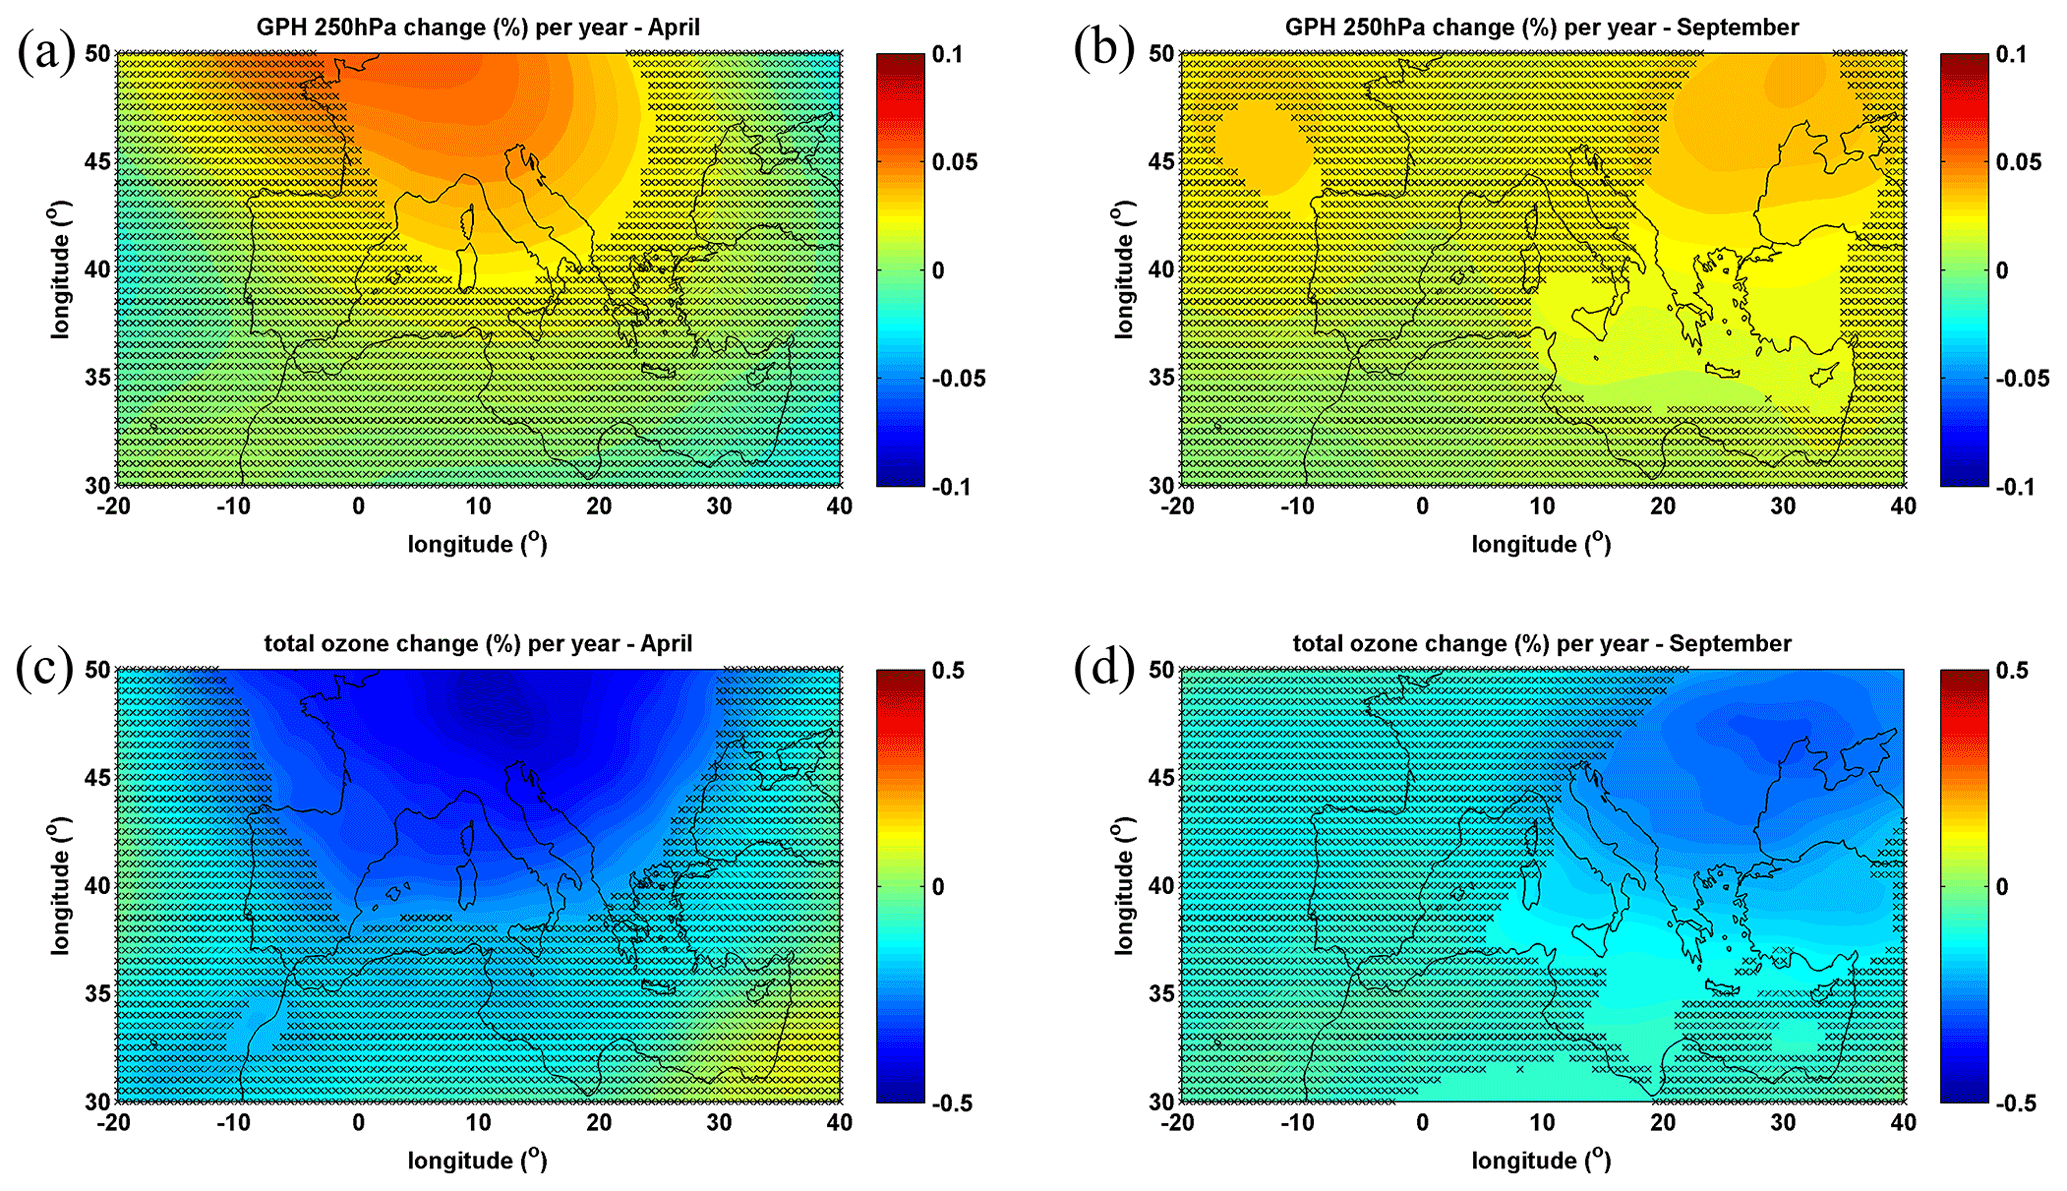
Figure 9Changes (%) of GPH at 250 hPa (a, b) and total ozone (c, d) and for April (a, c) and September (b, d). Areas over which changes are not statistically significant are covered by ×. Results are for 1996–2020.
Figure 9 shows the trends of total ozone (from MERRA-2) and GPH on a wider spatial scale for the months of April and September, for which statistically significant changes in total ozone were found. These plots suggest that changes over Rome were associated with changes that took place over wider spatial scales. Although deriving trends of the total ozone from MERRA-2 is more uncertain than deriving trends from good-quality ground-based measurements (Zhao et al., 2021), the graphs in Fig. 9 still show clearly that for the 2 months considered (April and September), negative trends in total ozone coincided with positive trends in the GPH (which denotes a shift of the tropopause towards higher altitudes) over wide areas. This was not the case for October, for which changes in GPH did not coincide spatially with changes in total ozone. Although it is not safe to draw quantitative conclusions from this analysis, it indicates that dynamical changes in the atmosphere could possibly play a significant role in affecting ozone changes.
In the present study, the variability of solar UV irradiance at 307.5 and 324 nm and the nm ratio was analysed with respect to the variability of total ozone and GPH. Analyses were performed for Rome, Aosta, and Lampedusa, where long-term and high-quality measurements of spectral irradiance and total ozone were available for the period 2006–2020. For Rome, analyses were also performed for 1996–2020.
Statistically significant anticorrelations were found between the year-to-year variability of GPH and total ozone for all three sites and all seasons of the year, which confirms the findings of studies reporting that variability in troposphere dynamics is strongly correlated with the variability in total ozone (e.g. Ball et al., 2019; Staehelin et al., 2001). The anticorrelation between total ozone and GPH induced corresponding positive correlations between GPH and the 307.5 nm irradiance and between GPH and the nm ratio, which in most cases was significant. Correlation between GPH and the 307.5 nm irradiance (and GPH and the nm ratio) was significant for all three sites but slightly stronger for Aosta relative to Rome and Lampedusa, which can be attributed (at least partially) to the fact that total ozone at higher latitudes generally reaches higher values. Thus, variations in GPH induced larger absolute changes in total ozone and subsequently the UVB irradiance. At Rome, the GPH was also correlated significantly with the 324 nm irradiance (for anomalies in 2006–2020 the correlation coefficients for all seasons were ∼0.4) because changes in GPH are potentially also linked to changes in clouds and aerosols.
The correlation between the GPH at Rome and Aosta was strong (∼0.9) and showed that the two sites were frequently affected by the same synoptical systems. The correlation between GPH at different sites resulted in a corresponding correlation between total-ozone anomalies and in many cases the anomalies of the 307.5 nm irradiance. In addition to the fact that there was a strong correlation between the monthly anomalies in the GPH (and subsequently between the total-ozone anomalies) in Aosta, Rome, and Lampedusa, the long-term trends in 2006–2020 at all three sites had the same sign (i.e, the GPH was either increasing or decreasing at all sites) for most months of the year.
In addition to the fact that there was a strong correlation between the monthly anomalies in the GPH (and subsequently between the total-ozone anomalies) in Aosta, Rome, and Lampedusa, the long-term trends in 2006–2020 at all three sites were in the same direction (i.e, the GPH was increasing/decreasing at all sites) for most months of the year.
During 2006–2020 the irradiance at 307.5 and 324 nm increased significantly in April at Rome by 0.2 %/yr–1 %/yr depending on wavelength and SZA and possibly due to changes in aerosols and/or cloudiness. Positive, statistically significant trends were also found for Lampedusa and Aosta for the summer months, possibly driven by changes in aerosols and/or clouds. Changes in troposphere dynamics in April and September, which took place on a wide spatial scale during 1996–2020, led to decreased total ozone over Rome, which in turn resulted in statistically significant increases in the nm ratio. The ratio also increased in August and October following the decrease in total ozone. In all the above cases the changes in total ozone and the nm ratio were in good agreement with the RAF (radiation amplification factor) of ∼1 for SZAs 45–65∘ reported by di Sarra et al. (2002).
Concluding, the present study shows that total ozone over the northern part of Italy decreased in the last decades mainly because of changes in the dynamics of the troposphere, the effect of which is dominant over the ozone recovery in the upper stratosphere. In particular months, total-ozone decrease resulted in increased UVB irradiance over Rome during 1996–2020. In 2006–2020 the levels of UV irradiance at Aosta, Rome, and Lampedusa generally increased due to changes in clouds and/or aerosols. Continuous rise of the tropopause in the Northern Hemisphere over 1980–2020 has been reported by Meng et al. (2021) due to tropospheric warming, which is consistent with our findings for the long-term changes in GPH. This study shows very clearly that changes in the troposphere can play a key role in modifying total ozone and surface UV radiation. Synoptical circulation patterns and changes were found to affect not only changes in total ozone but also UVB, and in some cases UVA, irradiance. Since significant changes in the dynamics of the troposphere are projected for the future (e.g. IPCC, 2013), thorough investigation is necessary in order to determine their possible impact on the future levels of surface solar UV radiation.
The ground-based total-ozone and spectral UV measurements used in this study can be made available upon request to the PIs of the stations. All re-analysis and satellite products used in the present study have been downloaded from the Giovanni platform maintained by the National Aeronautics and Space Administration (NASA) (https://giovanni.gsfc.nasa.gov/giovanni/, last access: 12 November 2021).
The supplement related to this article is available online at: https://doi.org/10.5194/acp-21-18689-2021-supplement.
IF and HD conceptualized the paper, and IF led the paper preparation. IF, HD, and AMS performed the data analysis. HD is responsible for the ground-based total-ozone and spectral UV measurements in Aosta. AMS is responsible for the ground-based total-ozone and spectral UV measurements in Rome. AdS, DM, and DMS are responsible for the ground-based total-ozone and spectral UV measurements in Lampedusa. All authors contributed to the writing of the paper.
The contact author has declared that neither they nor their co-authors have any competing interests.
Publisher's note: Copernicus Publications remains neutral with regard to jurisdictional claims in published maps and institutional affiliations.
Measurements at Lampedusa were maintained thanks to support from the Italian Ministry for University and Research through the projects NextData and Marine Hazard and the Italian Space Agency through the PRISCAV project. Observations also contribute to the Aerosol, Clouds and Trace Gases Research Infrastructure. Contributions by Francesco Monteleone and Giandomenico Pace are gratefully acknowledged. Part of the analyses used in this paper were produced with the Giovanni online data system, developed and maintained by the NASA GES DISC. We gratefully acknowledge the two anonymous reviewers for their comments, which helped us improve the paper substantially.
This paper was edited by Michel Van Roozendael and reviewed by two anonymous referees.
AIRS: Aqua/AIRS L3 Monthly Standard Physical Retrieval (AIRS-only) 1 degree ∘ 1 degree V7.0, Greenbelt, MD, USA, Goddard Earth Sciences Data and Information Services Center (GES DISC) [data set], https://doi.org/10.5067/UBENJB9D3T2H, 2019. a
Bais, A. F., Zerefos, C. S., Meleti, C., Ziomas, I. C., and Tourpali, K.: Spectral measurements of solar UVB radiation and its relations to total ozone, SO2, and clouds, J. Geophys. Res.-Atmos., 98, 5199–5204, https://doi.org/10.1029/92JD02904, 1993. a
Bais, A. F., Gardiner, B. G., Slaper, H., Blumthaler, M., Bernhard, G., McKenzie, R., Webb, A. R., Seckmeyer, G., Kjeldstad, B., Koskela, T., Kirsch, P. J., Gröbner, J., Kerr, J. B., Kazadzis, S., Leszczynski, K., Wardle, D., Josefsson, W., Brogniez, C., Gillotay, D., Reinen, H., Weihs, P., Svenoe, T., Eriksen, P., Kuik, F., and Redondas, A.: SUSPEN intercomparison of ultraviolet spectroradiometers, J. Geophys. Res.-Atmos., 106, 12509–12525, https://doi.org/10.1029/2000JD900561, 2001. a
Ball, W. T., Alsing, J., Mortlock, D. J., Staehelin, J., Haigh, J. D., Peter, T., Tummon, F., Stübi, R., Stenke, A., Anderson, J., Bourassa, A., Davis, S. M., Degenstein, D., Frith, S., Froidevaux, L., Roth, C., Sofieva, V., Wang, R., Wild, J., Yu, P., Ziemke, J. R., and Rozanov, E. V.: Evidence for a continuous decline in lower stratospheric ozone offsetting ozone layer recovery, Atmos. Chem. Phys., 18, 1379–1394, https://doi.org/10.5194/acp-18-1379-2018, 2018. a
Ball, W. T., Alsing, J., Staehelin, J., Davis, S. M., Froidevaux, L., and Peter, T.: Stratospheric ozone trends for 1985–2018: sensitivity to recent large variability, Atmos. Chem. Phys., 19, 12731–12748, https://doi.org/10.5194/acp-19-12731-2019, 2019. a, b
Bednarz, E. M., Maycock, A. C., Abraham, N. L., Braesicke, P., Dessens, O., and Pyle, J. A.: Future Arctic ozone recovery: the importance of chemistry and dynamics, Atmos. Chem. Phys., 16, 12159–12176, https://doi.org/10.5194/acp-16-12159-2016, 2016. a
Bernhard, G. and Stierle, S.: Trends of UV Radiation in Antarctica, Atmosphere, 11, 795–820, https://doi.org/10.3390/atmos11080795, 2020. a, b
Bornman, J. F., Barnes, P. W., Robson, T. M., Robinson, S. A., Jansen, M. A. K., Ballaré, C. L., and Flint, S. D.: Linkages between stratospheric ozone, UV radiation and climate change and their implications for terrestrial ecosystems, Photoch. Photobio. Sci., 18, 681–716, https://doi.org/10.1039/C8PP90061B, 2019. a
Caldwell, M. M., Björn, L. O., Bornman, J. F., Flint, S. D., Kulandaivelu, G., Teramura, A. H., and Tevini, M.: Effects of increased solar ultraviolet radiation on terrestrial ecosystems, J. Photoch. Photobio. B, 46, 40–52, https://doi.org/10.1016/S1011-1344(98)00184-5, 1998. a
Calkins, J. and Thordardottir, T.: The ecological significance of solar UV radiation on aquatic organisms, Nature, 283, 563–566, https://doi.org/10.1038/283563a0, 1980. a
Casale, G. R., Meloni, D., Miano, S., Palmieri, S., Siani, A. M., and Cappellani, F.: Solar UV-B irradiance and total ozone in Italy: Fluctuations and trends, J. Geophys. Res.-Atmos., 105, 4895–4901, https://doi.org/10.1029/1999JD900303, 2000. a
Chubarova, N. E., Pastukhova, A. S., Zhdanova, E. Y., Volpert, E. V., Smyshlyaev, S. P., and Galin, V. Y.: Effects of Ozone and Clouds on Temporal Variability of Surface UV Radiation and UV Resources over Northern Eurasia Derived from Measurements and Modeling, Atmosphere, 11, 59–87, https://doi.org/10.3390/atmos11010059, 2020. a
Dameris, M., Loyola, D. G., Nützel, M., Coldewey-Egbers, M., Lerot, C., Romahn, F., and van Roozendael, M.: Record low ozone values over the Arctic in boreal spring 2020, Atmos. Chem. Phys., 21, 617–633, https://doi.org/10.5194/acp-21-617-2021, 2021. a
De Bock, V., De Backer, H., Van Malderen, R., Mangold, A., and Delcloo, A.: Relations between erythemal UV dose, global solar radiation, total ozone column and aerosol optical depth at Uccle, Belgium, Atmos. Chem. Phys., 14, 12251–12270, https://doi.org/10.5194/acp-14-12251-2014, 2014. a, b
Di Ianni, A., Costabile, F., Barnaba, F., Di Liberto, L., Weinhold, K., Wiedensohler, A., Struckmeier, C., Drewnick, F., and Gobbi, G. P.: Black Carbon Aerosol in Rome (Italy): Inference of a Long-Term (2001–2017) Record and Related Trends from AERONET Sun-Photometry Data, Atmosphere, 9, 81–104, https://doi.org/10.3390/atmos9030081, 2018. a
di Sarra, A., Cacciani, M., Chamard, P., Cornwall, C., DeLuisi, J. J., Di Iorio, T., Disterhoft, P., Fiocco, G., Fuá, D., and Monteleone, F.: Effects of desert dust and ozone on the ultraviolet irradiance at the Mediterranean island of Lampedusa during PAUR II, J. Geophys. Res.-Atmos., 107, PAU 2-1–PAU 2-14, https://doi.org/10.1029/2000JD000139, 2002. a, b
di Sarra, A., Fua, D., Cacciani, M., Di Iorio, T., Disterhoft, P., Meloni, D., Monteleone, F., Piacentino, S., and Sferlazzo, D.: Determination of ultraviolet cosine-corrected irradiances and aerosol optical thickness by combined measurements with a Brewer spectrophotometer and a multifilter rotating shadowband radiometer, Appl. Optics, 47, 6142–6150, https://doi.org/10.1364/AO.47.006142, 2008. a, b, c
Diémoz, H., Siani, A. M., Casale, G. R., di Sarra, A., Serpillo, B., Petkov, B., Scaglione, S., Bonino, A., Facta, S., Fedele, F., Grifoni, D., Verdi, L., and Zipoli, G.: First national intercomparison of solar ultraviolet radiometers in Italy, Atmos. Meas. Tech., 4, 1689–1703, https://doi.org/10.5194/amt-4-1689-2011, 2011. a
Dobson, G. M. B., Brewer, A. W., and Cwilong, B. M.: Meteorology of the lower stratosphere, P. Roy. Soc. Med., 185, 144–175, https://doi.org/10.1098/rspa.1946.0010, 1946. a
Eleftheratos, K., Kazadzis, S., Zerefos, C. S., Tourpali, K., Meleti, C., Balis, D., Zyrichidou, I., Lakkala, K., Feister, U., Koskela, T., Heikkilä, A., and Karhu, J. M.: Ozone and Spectroradiometric UV Changes in the Past 20 Years over High Latitudes, Atmos.-Ocean, 53, 117–125, https://doi.org/10.1080/07055900.2014.919897, 2015. a
Eleftheratos, K., Kapsomenakis, J., Zerefos, C. S., Bais, A. F., Fountoulakis, I., Dameris, M., Jöckel, P., Haslerud, A. S., Godin-Beekmann, S., Steinbrecht, W., Petropavlovskikh, I., Brogniez, C., Leblanc, T., Liley, J. B., Querel, R., and Swart, D. P. J.: Possible Effects of Greenhouse Gases to Ozone Profiles and DNA Active UV-B Irradiance at Ground Level, Atmosphere, 11, 228–245, https://doi.org/10.3390/atmos11030228, 2020. a
Fioletov, V. E., Kerr, J. B., McElroy, C. T., Wardle, D. I., Savastiouk, V., and Grajnar, T. S.: The Brewer reference triad, Geophys. Res. Lett., 32, L20805, https://doi.org/10.1029/2005GL024244, 2005. a
Fitzka, M., Simic, S., and Hadzimustafic, J.: Trends in spectral UV radiation from long-term measurements at Hoher Sonnblick, Austria, Theor. Appl. Climatol., 110, 585–593, https://doi.org/10.1007/s00704-012-0684-0, 2012. a
Fountoulakis, I., Bais, A. F., Fragkos, K., Meleti, C., Tourpali, K., and Zempila, M. M.: Short- and long-term variability of spectral solar UV irradiance at Thessaloniki, Greece: effects of changes in aerosols, total ozone and clouds, Atmos. Chem. Phys., 16, 2493–2505, https://doi.org/10.5194/acp-16-2493-2016, 2016. a, b
Fountoulakis, I., Zerefos, C. S., Bais, A. F., Kapsomenakis, J., Koukouli, M.-E., Ohkawara, N., Fioletov, V., De Backer, H., Lakkala, K., Karppinen, T., and Webb, A. R.: Twenty-five years of spectral UV-B measurements over Canada, Europe and Japan: Trends and effects from changes in ozone, aerosols, clouds, and surface reflectivity, CR Geosci., 350, 393–402, https://doi.org/10.1016/j.crte.2018.07.011, 2018. a
Fountoulakis, I., Diémoz, H., Siani, A. M., Hülsen, G., and Gröbner, J.: Monitoring of solar spectral ultraviolet irradiance in Aosta, Italy, Earth Syst. Sci. Data, 12, 2787–2810, https://doi.org/10.5194/essd-12-2787-2020, 2020a. a, b
Fountoulakis, I., Diémoz, H., Siani, A.-M., Laschewski, G., Filippa, G., Arola, A., Bais, A. F., De Backer, H., Lakkala, K., Webb, A. R., De Bock, V., Karppinen, T., Garane, K., Kapsomenakis, J., Koukouli, M.-E., and Zerefos, C. S.: Solar UV Irradiance in a Changing Climate: Trends in Europe and the Significance of Spectral Monitoring in Italy, Environments, 7, 1–31, https://doi.org/10.3390/environments7010001, 2020b. a, b, c
Fragkos, K., Bais, A. F., Fountoulakis, I., Balis, D., Tourpali, K., Meleti, C., and Zanis, P.: Extreme total column ozone events and effects on UV solar radiation at Thessaloniki, Greece, Theor. Appl. Climatol., 126, 505–517, https://doi.org/10.1007/s00704-015-1562-3, 2016. a
Garane, K., Bais, A. F., Kazadzis, S., Kazantzidis, A., and Meleti, C.: Monitoring of UV spectral irradiance at Thessaloniki (1990–2005): data re-evaluation and quality control, Ann. Geophys., 24, 3215–3228, https://doi.org/10.5194/angeo-24-3215-2006, 2006. a
GMAO (Global Modeling and Assimilation Office): MERRA-2 instM_3d_ana_Np: 3d,Monthly mean,Instantaneous,Pressure-Level,Analysis,Analyzed Meteorological Fields V5.12.4, Greenbelt, MD, USA, Goddard Earth Sciences Data and Information Services Center (GES DIS) [data set], https://doi.org/10.5067/V92O8XZ30XBI, 2015a. a, b
GMAO (Global Modeling and Assimilation Office): MERRA-2 tavgM_2d_slv_Nx: 2d,Monthly mean,Time-Averaged,Single-Level,Assimilation,Single-Level Diagnostics V5.12.4, Greenbelt, MD, USA, Goddard Earth Sciences Data and Information Services Center (GES DISC) [data set], https://doi.org/10.5067/AP1B0BA5PD2K, 2015b. a
Griggs, M.: Absorption Coefficients of Ozone in the Ultraviolet and Visible Regions, J. Chem. Phys., 49, 857–859, https://doi.org/10.1063/1.1670152, 1968. a
Gröbner, J. and Sperfeld, P.: Direct traceability of the portable QASUME irradiance scale to the primary irradiance standard of the PTB, Metrologia, 42, 134–139, https://doi.org/10.1088/0026-1394/42/2/008, 2005. a
Häder, D.-P., Kumar, H. D., Smith, R. C., and Worrest, R. C.: Effects on aquatic ecosystems, J. Photoch. Photobio. B, 46, 53–68, https://doi.org/10.1016/S1011-1344(98)00185-7, 1998. a
Hoinka, K. P., Claude, H., and Köhler, U.: On the correlation between tropopause pressure and ozone above central Europe, Geophys. Res. Lett., 23, 1753–1756, https://doi.org/10.1029/96GL01722, 1996. a
Hooke, R. J., Higlett, M. P., Hunter, N., and O'Hagan, J. B.: Long term variations in erythema effective solar UV at Chilton, UK, from 1991 to 2015, Photoch. Photobio. Sci., 16, 1596–1603, https://doi.org/10.1039/C7PP00053G, 2017. a, b
Hülsen, G., Gröbner, J., Nevas, S., Sperfeld, P., Egli, L., Porrovecchio, G., and Smid, M.: Traceability of solar UV measurements using the Qasume reference spectroradiometer, Appl. Optics, 55, 7265–7275, https://doi.org/10.1364/AO.55.007265, 2016. a
Ialongo, I., Buchard, V., Brogniez, C., Casale, G. R., and Siani, A. M.: Aerosol Single Scattering Albedo retrieval in the UV range: an application to OMI satellite validation, Atmos. Chem. Phys., 10, 331–340, https://doi.org/10.5194/acp-10-331-2010, 2010. a
Inn, E. C. Y. and Tanaka, Y.: Absorption Coefficient of Ozone in the Ultraviolet and Visible Regions, J. Opt. Soc. Am., 43, 870–873, https://doi.org/10.1364/JOSA.43.000870, 1953. a
IPCC: Climate Change 2013: The Physical Science Basis. Contribution of Working Group I to the Fifth Assessment Report of the Intergovernmental Panel on Climate Change, edited by: Stocker, T. F., Qin, D., Plattner, G.-K., Tignor, M., Allen, S. K., Boschung, J., Nauels, A., and Xia, Y., Tech. rep., Cambridge University Press, Cambridge, United Kingdom and New York, NY, USA, ISBN 978-1-107-05799-1, 2013. a
Kazadzis, S., Kouremeti, N., Bais, A., Kazantzidis, A., and Meleti, C.: Aerosol forcing efficiency in the UVA region from spectral solar irradiance measurements at an urban environment, Ann. Geophys., 27, 2515–2522, https://doi.org/10.5194/angeo-27-2515-2009, 2009. a
Kerr, J. B.: The Brewer Spectrophotometer BT – UV Radiation in Global Climate Change: Measurements, Modeling and Effects on Ecosystems, 160–191, Springer Berlin Heidelberg, Berlin, Heidelberg, https://doi.org/10.1007/978-3-642-03313-1_6, 2010. a
Kerr, J. B. and McElroy, C. T.: Evidence for Large Upward Trends of Ultraviolet-B Radiation Linked to Ozone Depletion, Science, 262, 1032–1034, https://doi.org/10.1126/science.262.5136.1032, 1993. a
Lakkala, K., Heikkilä, A., Kärhä, P., Ialongo, I., Karppinen, T., Karhu, J. M., Lindfors, A. V., and Meinander, O.: 25 years of spectral UV measurements at Sodankylä, AIP Conference Proceedings, 1810, 110006, https://doi.org/10.1063/1.4975568, 2017. a
Lin, P., Paynter, D., Ming, Y., and Ramaswamy, V.: Changes of the Tropical Tropopause Layer under Global Warming, J. Climate, 30, 1245–1258, https://doi.org/10.1175/JCLI-D-16-0457.1, 2017. a, b
Madronich, S., McKenzie, R. L., Björn, L. O., and Caldwell, M. M.: Changes in biologically active ultraviolet radiation reaching the Earth's surface, J. Photoch. Photobio. B, 46, 5–19, https://doi.org/10.1016/S1011-1344(98)00182-1, 1998. a
Manara, V., Beltrano, M. C., Brunetti, M., Maugeri, M., Sanchez-Lorenzo, A., Simolo, C., and Sorrenti, S.: Sunshine duration variability and trends in Italy from homogenized instrumental time series (1936–2013), J. Geophys. Res.-Atmos., 120, 3622–3641, https://doi.org/10.1002/2014JD022560, 2015. a
Manara, V., Brunetti, M., Celozzi, A., Maugeri, M., Sanchez-Lorenzo, A., and Wild, M.: Detection of dimming/brightening in Italy from homogenized all-sky and clear-sky surface solar radiation records and underlying causes (1959–2013), Atmos. Chem. Phys., 16, 11145–11161, https://doi.org/10.5194/acp-16-11145-2016, 2016. a, b
Manney, G. L., Santee, M. L., Rex, M., Livesey, N. J., Pitts, M. C., Veefkind, P., Nash, E. R., Wohltmann, I., Lehmann, R., Froidevaux, L., Poole, L. R., Schoeberl, M. R., Haffner, D. P., Davies, J., Dorokhov, V., Gernandt, H., Johnson, B., Kivi, R., Kyrö, E., Larsen, N., Levelt, P. F., Makshtas, A., McElroy, C. T., Nakajima, H., Parrondo, M. C., Tarasick, D. W., von der Gathen, P., Walker, K. A., and Zinoviev, N. S.: Unprecedented Arctic ozone loss in 2011, Nature, 478, 469–475, https://doi.org/10.1038/nature10556, 2011. a
Masiol, M., Squizzato, S., Formenton, G., Harrison, R. M., and Agostinelli, C.: Air quality across a European hotspot: Spatial gradients, seasonality, diurnal cycles and trends in the Veneto region, NE Italy, Sci. Total Environ., 576, 210–224, https://doi.org/10.1016/j.scitotenv.2016.10.042, 2017. a
Mateos, D., di Sarra, A., Meloni, D., Di Biagio, C., and Sferlazzo, D. M.: Experimental determination of cloud influence on the spectral UV irradiance and implications for biological effects, J. Atmos. Sol.-Terr. Phy., 73, 1739–1746, https://doi.org/10.1016/j.jastp.2011.04.003, 2011. a
Mateos, D., di Sarra, A., Bilbao, J., Meloni, D., Pace, G., de Miguel, A., and Casasanta, G.: Spectral attenuation of global and diffuse UV irradiance and actinic flux by clouds, Q. J. Roy. Meteor. Soc., 141, 109–113, https://doi.org/10.1002/qj.2341, 2015. a, b
McConnell, J. C., Henderson, G. S., Barrie, L., Bottenheim, J., Niki, H., Langford, C. H., and Templeton, E. M. J.: Photochemical bromine production implicated in Arctic boundary-layer ozone depletion, Nature, 355, 150–152, https://doi.org/10.1038/355150a0, 1992. a
McKenzie, R., Bernhard, G., Liley, B., Disterhoft, P., Rhodes, S., Bais, A., Morgenstern, O., Newman, P., Oman, L., Brogniez, C., and Simic, S.: Success of Montreal Protocol Demonstrated by Comparing High-Quality UV Measurements with “World Avoided” Calculations from Two Chemistry-Climate Models, Sci. Rep.-UK, 9, 12332, https://doi.org/10.1038/s41598-019-48625-z, 2019. a
Mckinlay, A. and Diffey, B.: A reference action spectrum for ultraviolet induced erythema in human skin, CIE, 6, 17–22, 1987. a
Meloni, D., Casale, G. R., Siani, A. M., Palmieri, S., and Cappellani, F.: Solar UV Dose Patterns in Italy, Photochem. Photobiol., 71, 681–690, https://doi.org/10.1562/0031-8655(2000)0710681SUDPII2.0.CO2, 2000. a
Meloni, D., di Sarra, A., Monteleone, F., Pace, G., Piacentino, S., and Sferlazzo, D. M.: Seasonal transport patterns of intense Saharan dust events at the Mediterranean island of Lampedusa, Atmos. Res., 88, 134–148, https://doi.org/10.1016/j.atmosres.2007.10.007, 2008. a
Meng, L., Liu, J., Tarasick, D. W., Randel, W. J., Steiner, A. K., Wilhelmsen, H., Wang, L., and Haimberger, L.: Continuous rise of the tropopause in the Northern Hemisphere over 1980–2020, Sci. Adv., 7, eabi8065, https://doi.org/10.1126/sciadv.abi8065, 2021. a, b
Mok, J., Krotkov, N. A., Arola, A., Torres, O., Jethva, H., Andrade, M., Labow, G., Eck, T. F., Li, Z., Dickerson, R. R., Stenchikov, G. L., Osipov, S., and Ren, X.: Impacts of brown carbon from biomass burning on surface UV and ozone photochemistry in the Amazon Basin, Sci. Rep.-UK, 6, 36940, https://doi.org/10.1038/srep36940, 2016. a
Morgenstern, O., Braesicke, P., Hurwitz, M. M., O'Connor, F. M., Bushell, A. C., Johnson, C. E., and Pyle, J. A.: The World Avoided by the Montreal Protocol, Geophys. Res. Lett., 35, L16811, https://doi.org/10.1029/2008GL034590, 2008. a
Newman, P. A. and McKenzie, R.: UV impacts avoided by the Montreal Protocol, Photoch. Photobio. Sci., 10, 1152–1160, https://doi.org/10.1039/C0PP00387E, 2011. a
Ohring, G. and Muench, H. S.: RELATIONSHIPS BETWEEN OZONE AND METEOROLOGICAL PARAMETERS IN THE LOWER STRATOSPHERE, J. Atmos. Sci., 17, 195–206, https://doi.org/10.1175/1520-0469(1960)017<0195:RBOAMP>2.0.CO;2, 1960. a
Orza, J. A. G. and Perrone, M. R.: Trends in the aerosol load properties over south eastern Italy, IOP C. Ser. Earth Env., 28, 12011, https://doi.org/10.1088/1755-1315/28/1/012011, 2015. a
Pandey, P., Gillotay, D., and Depiesse, C.: Climatology of Ultra Violet (UV) irradiance as measured through the Belgian ground-based monitoring network during the time period of 1995–2014, Geophys. Res. Abstr., EPSC2016–13080, EGU General Assembly 2016, Vienna, Austria, 2016. a
Paul, N. D. and Gwynn-Jones, D.: Ecological roles of solar UV radiation: towards an integrated approach, Trend. Ecol. Evol., 18, 48–55, https://doi.org/10.1016/S0169-5347(02)00014-9, 2003. a
Petkov, B. H., Vitale, V., Tomasi, C., Siani, A. M., Seckmeyer, G., Webb, A. R., Smedley, A. R. D., Casale, G. R., Werner, R., Lanconelli, C., Mazzola, M., Lupi, A., Busetto, M., Diémoz, H., Goutail, F., Köhler, U., Mendeva, B. D., Josefsson, W., Moore, D., Bartolomé, M. L., Moreta González, J. R., Mišaga, O., Dahlback, A., Tóth, Z., Varghese, S., De Backer, H., Stübi, R., and Vaníček, K.: Response of the ozone column over Europe to the 2011 Arctic ozone depletion event according to ground-based observations and assessment of the consequent variations in surface UV irradiance, Atmos. Environ., 85, 169–178, https://doi.org/10.1016/j.atmosenv.2013.12.005, 2014. a
Pfeifroth, U., Sanchez-Lorenzo, A., Manara, V., Trentmann, J., and Hollmann, R.: Trends and Variability of Surface Solar Radiation in Europe Based On Surface- and Satellite-Based Data Records, J. Geophys. Res.-Atmos., 123, 1735–1754, https://doi.org/10.1002/2017JD027418, 2018. a
Pommereau, J.-P., Goutail, F., Pazmino, A., Lefèvre, F., Chipperfield, M. P., Feng, W., Van Roozendael, M., Jepsen, N., Hansen, G., Kivi, R., Bognar, K., Strong, K., Walker, K., Kuzmichev, A., Khattatov, S., and Sitnikova, V.: Recent Arctic ozone depletion: Is there an impact of climate change?, CR Geosci., 350, 347–353, https://doi.org/10.1016/j.crte.2018.07.009, 2018. a
Putaud, J. P., Cavalli, F., Martins dos Santos, S., and Dell'Acqua, A.: Long-term trends in aerosol optical characteristics in the Po Valley, Italy, Atmos. Chem. Phys., 14, 9129–9136, https://doi.org/10.5194/acp-14-9129-2014, 2014. a
Raptis, I.-P., Eleftheratos, K., Kazadzis, S., Kosmopoulos, P., Papachristopoulou, K., and Solomos, S.: The Combined Effect of Ozone and Aerosols on Erythemal Irradiance in an Extremely Low Ozone Event during May 2020, Atmosphere, 12, 145–160, https://doi.org/10.3390/atmos12020145, 2021. a
Redondas, A., Carreño, V., León-Luis, S. F., Hernández-Cruz, B., López-Solano, J., Rodriguez-Franco, J. J., Vilaplana, J. M., Gröbner, J., Rimmer, J., Bais, A. F., Savastiouk, V., Moreta, J. R., Boulkelia, L., Jepsen, N., Wilson, K. M., Shirotov, V., and Karppinen, T.: EUBREWNET RBCC-E Huelva 2015 Ozone Brewer Intercomparison, Atmos. Chem. Phys., 18, 9441–9455, https://doi.org/10.5194/acp-18-9441-2018, 2018. a
Reed, R. J.: THE ROLE OF VERTICAL MOTIONS IN OZONE-WEATHER RELATIONSHIPS, J. Atmos. Sci., 7, 263–267, https://doi.org/10.1175/1520-0469(1950)007<0263:TROVMI>2.0.CO;2, 1950. a
Rizza, U., Mancinelli, E., Morichetti, M., Passerini, G., and Virgili, S.: Aerosol Optical Depth of the Main Aerosol Species over Italian Cities Based on the NASA/MERRA-2 Model Reanalysis, Atmosphere, 10, 709–722, https://doi.org/10.3390/atmos10110709, 2019. a
Siani, A., Casale, G. R., and Galliani, A.: Investigation on a low ozone episode at the end of November 2000 and its effect on ultraviolet radiation, Optical Eng., 41, 3082–3089, https://doi.org/10.1117/1.1516821, 2002. a
Siani, A. M., Frasca, F., Scarlatti, F., Religi, A., Diémoz, H., Casale, G. R., Pedone, M., and Savastiouk, V.: Examination on total ozone column retrievals by Brewer spectrophotometry using different processing software, Atmos. Meas. Tech., 11, 5105–5123, https://doi.org/10.5194/amt-11-5105-2018, 2018. a, b
Sofieva, V. F., Kyrölä, E., Laine, M., Tamminen, J., Degenstein, D., Bourassa, A., Roth, C., Zawada, D., Weber, M., Rozanov, A., Rahpoe, N., Stiller, G., Laeng, A., von Clarmann, T., Walker, K. A., Sheese, P., Hubert, D., van Roozendael, M., Zehner, C., Damadeo, R., Zawodny, J., Kramarova, N., and Bhartia, P. K.: Merged SAGE II, Ozone_cci and OMPS ozone profile dataset and evaluation of ozone trends in the stratosphere, Atmos. Chem. Phys., 17, 12533–12552, https://doi.org/10.5194/acp-17-12533-2017, 2017. a, b
Solomon, S., Garcia, R. R., Rowland, F. S., and Wuebbles, D. J.: On the depletion of Antarctic ozone, Nature, 321, 755–758, https://doi.org/10.1038/321755a0, 1986. a
Solomon, S., Ivy, D. J., Kinnison, D., Mills, M. J., Neely, R. R., and Schmidt, A.: Emergence of healing in the Antarctic ozone layer, Science, 353, 269–274, https://doi.org/10.1126/science.aae0061, 2016. a
Staehelin, J., Harris, N. R. P., Appenzeller, C., and Eberhard, J.: Ozone trends: A review, Rev. Geophys., 39, 231–290, https://doi.org/10.1029/1999RG000059, 2001. a, b
Steinbrecht, W., Claude, H., Köhler, U., and Hoinka, K. P.: Correlations between tropopause height and total ozone: Implications for long-term changes, J. Geophys. Res.-Atmos., 103, 19183–19192, https://doi.org/10.1029/98JD01929, 1998. a, b, c, d
Svendby, T., Hansen, G., Bäcklund, A., and Dahlback, A.: Monitoring of the atmospheric ozone layer and natural ultraviolet radiation. Annual Report 2018, Tech. rep., NILU, Oslo, Norway, available at: https://www.nilu.com/pub/1724994/ (last access: 12 November 2021), 2018. a
Szeląg, M. E., Sofieva, V. F., Degenstein, D., Roth, C., Davis, S., and Froidevaux, L.: Seasonal stratospheric ozone trends over 2000–2018 derived from several merged data sets, Atmos. Chem. Phys., 20, 7035–7047, https://doi.org/10.5194/acp-20-7035-2020, 2020. a
Vanicek, K.: Differences between ground Dobson, Brewer and satellite TOMS-8, GOME-WFDOAS total ozone observations at Hradec Kralove, Czech, Atmos. Chem. Phys., 6, 5163–5171, https://doi.org/10.5194/acp-6-5163-2006, 2006. a
Varotsos, C., Cartalis, C., Vlamakis, A., Tzanis, C., and Keramitsoglou, I.: The long-term coupling between column ozone and tropopause properties, J. Climate, 17, 3843–3854, 2004. a, b, c
Varotsos, C. A., Cracknell, A. P., and Tzanis, C.: The exceptional ozone depletion over the Arctic in January–March 2011, Remote Sens. Lett., 3, 343–352, https://doi.org/10.1080/01431161.2011.597792, 2012. a
Vaughan, G. and Price, J. D.: On the relation between total ozone and meteorology, Q. J. Roy. Meteor. Soc., 117, 1281–1298, https://doi.org/10.1002/qj.49711750208, 1991. a, b
Wargan, K., Orbe, C., Pawson, S., Ziemke, J. R., Oman, L. D., Olsen, M. A., Coy, L., and Knowland, E.: Recent Decline in Extratropical Lower Stratospheric Ozone Attributed to Circulation Changes, Geophys. Res. Lett., 45, 5166–5176, https://doi.org/10.1029/2018GL077406, 2018. a
Weber, M., Coldewey-Egbers, M., Fioletov, V. E., Frith, S. M., Wild, J. D., Burrows, J. P., Long, C. S., and Loyola, D.: Total ozone trends from 1979 to 2016 derived from five merged observational datasets – the emergence into ozone recovery, Atmos. Chem. Phys., 18, 2097–2117, https://doi.org/10.5194/acp-18-2097-2018, 2018. a
Williamson, C. E., Neale, P. J., Hylander, S., Rose, K. C., Figueroa, F. L., Robinson, S. A., Häder, D.-P., Wängberg, S.-Å., and Worrest, R. C.: The interactive effects of stratospheric ozone depletion, UV radiation, and climate change on aquatic ecosystems, Photoch. Photobio. Sci., 18, 717–746, https://doi.org/10.1039/C8PP90062K, 2019. a
Wohltmann, I., von der Gathen, P., Lehmann, R., Maturilli, M., Deckelmann, H., Manney, G. L., Davies, J., Tarasick, D., Jepsen, N., Kivi, R., Lyall, N., and Rex, M.: Near-Complete Local Reduction of Arctic Stratospheric Ozone by Severe Chemical Loss in Spring 2020, Geophys. Res. Lett., 47, e2020GL089547, https://doi.org/10.1029/2020GL089547, 2020. a
Young, P. J., Harper, A. B., Huntingford, C., Paul, N. D., Morgenstern, O., Newman, P. A., Oman, L. D., Madronich, S., and Garcia, R. R.: The Montreal Protocol protects the terrestrial carbon sink, Nature, 596, 384–388, https://doi.org/10.1038/s41586-021-03737-3, 2021. a
Zerefos, C. S., Bais, A. F., Meleti, C., and Ziomas, I. C.: A note on the recent increase of Solar UV-B radiation over northern middle latitudes, Geophys. Res. Lett., 22, 1245–1247, https://doi.org/10.1029/95GL01187, 1995. a
Zhang, H., Wang, J., Castro García, L., Zeng, J., Dennhardt, C., Liu, Y., and Krotkov, N. A.: Surface erythemal UV irradiance in the continental United States derived from ground-based and OMI observations: quality assessment, trend analysis and sampling issues, Atmos. Chem. Phys., 19, 2165–2181, https://doi.org/10.5194/acp-19-2165-2019, 2019. a
Zhao, X., Fioletov, V., Brohart, M., Savastiouk, V., Abboud, I., Ogyu, A., Davies, J., Sit, R., Lee, S. C., Cede, A., Tiefengraber, M., Müller, M., Griffin, D., and McLinden, C.: The world Brewer reference triad – updated performance assessment and new double triad, Atmos. Meas. Tech., 14, 2261–2283, https://doi.org/10.5194/amt-14-2261-2021, 2021. a
Zhao, X., Fioletov, V., Brohart, M., Savastiouk, V., Abboud, I., Ogyu, A., Davies, J., Sit, R., Lee, S. C., Cede, A., Tiefengraber, M., Müller, M., Griffin, D., and McLinden, C.: The world Brewer reference triad – updated performance assessment and new double triad, Atmos. Meas. Tech., 14, 2261–2283, https://doi.org/10.5194/amt-14-2261-2021, 2021. a