the Creative Commons Attribution 4.0 License.
the Creative Commons Attribution 4.0 License.
 | 22 Dec 2021
The ice–vapour interface during growth and sublimation
Maria Cascajo-Castresana
Sylvie Morin
Alexander M. Bittner
We employed environmental scanning electron microscopy (ESEM) in low-humidity atmosphere to study the ice growth, coalescence of crystallites, polycrystalline film morphology, and sublimation, in the temperature range of −10 to −20 ∘C. First, individual ice crystals grow in the shape of micron-sized hexagonal columns with stable basal faces. Their coalescence during further growth results in substantial surface defects and forms thick polycrystalline films, consisting of large grains separated by grain boundaries. The latter are composed of 1 to 3 µm wide pores, which are attributed to the coalescence of defective crystallite surfaces. Sublimation of isolated crystals and of films is defect-driven, and grain boundaries play a decisive role. A scallop-like concave structure forms, limited by sharp ridges, which are terminated by nanoscale asperities. The motivation for this work is also to evaluate ESEM's ability to provide a clean and reproducible environment for future study of nucleation and growth on atmospherically relevant nucleators such as materials of biological origin and inorganic materials. Hence, extensive information regarding potential ESEM beam damage and effect of impurities are discussed.
- Article
(3242 KB) - Full-text XML
-
Supplement
(1242 KB) - BibTeX
- EndNote


Ice covers a much smaller area of our planet than liquid water. Some of this ice is subjected to large seasonal variations in temperature, giving rise to melting and sublimation. Understanding ice melt, flow, sublimation, and evaporation is key in fully understanding the impact of global warming. Here we focus exclusively on the study of ice–vapour interfaces, as present on snow, glaciers, permafrost soil, and sea ice and in clouds. Our low-humidity conditions are of special relevance for sublimation at the poles and in Greenland, where ice sheets are in contact with air of low humidity, at temperatures well below those of most glaciers on other continents (Bliss et al., 2011). The sublimation (and the redeposition) rate ultimately determines whether ice fields can exist at all.
The literature on ice growth and nucleation is vast and well documented in recent reviews (Bailey and Hallett, 2004; Murphy and Koop, 2005; Libbrecht, 2005; Bartels-Rausch et al., 2012, 2014). It covers a broad spectrum of disciplines related to the study of geology, atmospheric science, and planetary science, but it is usually restricted to the macro- and millimetre scale.
Under some conditions, especially in clouds, small water droplets transform into small nearly spherical ice crystals with well-rounded corners and edges. They are known as “droxtals”, a term that combines the words droplet and crystal (Takahashi and Mori, 2006; Gonda and Yamazaki, 1978). While the shape can be reminiscent of shapes also found at the ice–vapour interface, droxtal formation requires the presence of liquid water.
Ice growth from vapour requires that the water vapour reaches conditions of temperature T and water vapour pressure Pwater for which water freezing and sublimation are at equilibrium. However, ice nuclei formation needs to overcome the activation nucleation barrier, through water vapour supersaturation. Once ice is formed, the solid–vapour interface of ice is subject to freezing (growth, deposition, or desublimation) and sublimation (loss of water molecules), depending on temperature and pressure of the vapour phase. Summing up, the ice surface can grow when Pwater>Psat, and it will invariably lose material by sublimation when Pwater<Psat, where Psat corresponds to the vapour pressure on the sublimation line of the phase diagram. We define the relative humidity h by
This definition is valid for pure water vapour, but also for gas mixtures such as water vapour in air. Sublimation requires humidity values below 100 %, while above 100 %, i.e., at supersaturation, Pwater>Psat results in ice growth via deposition (Kiselev et al., 2017). For ambient pressure (and hence slow diffusion in the gas phase), Lamb and Scott (1974) provide an overview of experiments and theories for ice growth from −30 up to 0 ∘C. However, by restricting the water vapour pressure below that of the triple point (611.7 Pa), which is 165 times lower than ambient pressure, conditions of very fast diffusion in the gas phase are achieved (compare also Sei and Gonda, 1989).
Our experimental conditions explore the range from −20 to 0 ∘C, at low water vapour pressure (i.e., below the triple point pressure of 611.7 Pa). Sei and Gonda (1989) provide details for growth in 40 Pa of air, at several percent of supersaturation; altogether these conditions are comparable with that achievable in our ESEM. Their results nicely explain some of our data, especially the growth of high (long) hexagonal columns. Libbrecht discusses similar results (Libbrecht, 2004). It is also generally accepted that the growth velocity on the prism face is higher (this should result in plates) at −20 ∘C < T < −10 ∘C (Bailey and Hallett, 2009).
Why are the microstructure and its change during growth and coalescence (Nair et al., 2018) important? Grain boundaries show up, and in absence of impurities, typical microscale morphologies develop (Libbrecht, 2005; Sazaki et al., 2010; Asakawa et al., 2014; Kiselev et al., 2017) and rearrange (Krzyzak et al., 2007). Even supercooled water could exist (in highly curved nanoscale structures) (Nowak et al., 2008). In nature, impurities can concentrate in such defects (Baker et al., 2003; Bartels-Rausch et al., 2012, 2014), for example forming networks of water-filled microscale “veins”, sometimes of relevance as a habitat for organisms (Mader, 1992; Mader et al., 2006; Buford Price, 2000). Relevant structural details can already be observed on the nanoscale (Hondoh, 2009). This impurity effect has also been studied (or assumed to play a role) in micro- and nanoscale imaging (Cross, 1969, 1971; Mulvaney et al., 1988; Cullen and Baker, 2001; Rosenthal et al., 2007). Also, in this case, ions (from salts or acids) or dust particles in the crystals are thought to be the underlying cause for structures that develop during sublimation.
In this work, we modelled ice–vapour interfaces inside an environmental scanning electron microscope (ESEM), where temperature and humidity values can simulate conditions found in cold climates. Vapour freezing and ice sublimation give rise to micro- and nanoscale surface features that we characterize in detail. Freezing and sublimation depend on the microscopic ice morphology and on its dynamical changes. We thus contribute microscopic evidence for relevant processes in atmospheric physics. While we only consider the solid–vapour interface, for temperatures well below the melting point ice growth from vapour is not restricted to direct incorporation of molecules into the solid phase, and it can also proceed via a supercooled liquid phase (Sei and Gonda, 1989), which can be extended (e.g., as droplet) or located at the ice surface as a “quasi-liquid layer”.
The main goals of this work were to study ice morphologies, and how they are attained from microcrystals, how isolated ice crystals and polycrystalline ice films form in real time and sublime using ESEM (Kiselev et al., 2017; Ebert et al., 2002). Here we report all setup details, including the problematic control issues of temperature and pressure, beam damage on the nanoscale and on the microscale, and potential contamination issues. In addition, we wanted to evaluate ESEM's ability to provide a clean and reproducible environment for future study of nucleation and growth on atmospherically relevant nucleators such as materials of biological origin (Cascajo-Castresana et al., 2020) and inorganic materials.
2.1 Environmental scanning electron microscope (ESEM)
Images and movies of ice crystals during growth and sublimation on the wafer pieces were recorded in a FEG (field emission gun) ESEM (Quanta 250, FEI), operated in the wet mode (Toth et al., 2003). The sample stage temperature was adjusted between −10 and −20 ∘C by Peltier cooling. However, temperatures down to about −40 ∘C could be achievable, at least for small samples. Resistive heating allowed us to reach ambient temperature quickly after the experimental runs. A thermocouple was located inside the Peltier stage; hence all temperature values are reported for readings at that location. The imaging gas was pure water vapour, introduced via an automated leak valve into the sample chamber. The vapour was produced from a heated reservoir of water (18 M Ω cm, < 5 ppb total organic content, Millipore), also containing a platinum wire for the catalytic decomposition of organic contaminants. The relative humidity in the chamber was controlled by increasing or decreasing the pressure Pwater in small steps (< 5 Pa), in the range from ≈50 Pa up to ≈700 Pa.
Our beam voltage was set to values from 5 to 20 kV, the spot size was 3 to 5 (spot diameters ≈1 to 7 nm), and the aperture inside the column was kept at its smallest value, which reduces beam current and thus beam damage. The Supplement provides details on how to avoid beam damage, which can be mass loss (sublimation) or carbon deposition (from gas contamination) and melting (heating). In this way we avoided localized imaging artifacts.
Electron detection was achieved with the large field detector (LFD), placed some centimetres sideways (in the scanning electron microscopy (SEM) images this is always the right-hand side) and away from the pole piece, or with the gaseous secondary electron detector (GSED), a thin gold line, which encircled the pressure-limiting aperture. Standard settings were 1024×884 pixels with dwell times mainly of 10 to 30 µs for real-time images and about 10 times smaller for the fastest scans. For a beam current of 1.6 nA, applied to the smallest possible spot of 1 nm diameter, we obtain a maximal electron dose of 14 000 e/s (Alonso et al., 2013).
The saturation water vapour pressure over ice, Psat, was determined from the substrate temperature reading T in the ESEM, according to Murphy and Koop (Murphy and Koop, 2005):
for T>110 K. The humidity h is then simply the ratio of the measured pressure (which corresponds to Pwater) and Psat; see Eq. (1). The technical details of our ESEM setup do not allow for stable h>1 conditions. Any pressure (or temperature) adjustment to values in the P–T region of ice causes lowering of the pressure (pumping), or increase in temperature (heating of the sample), thus attaining the phase coexistence line at h=1. This automatic pressure control balances water vapour supply and removal by pumping, and allows us to reach h>1 only for short times (at best some minutes). Due to the size of the specimen chamber, most of the vapour is at 20 ∘C, but due to the very small flow rate, it attains the substrate temperature when it approaches the Peltier stage/sample assembly.
Potential temperature gradients from Peltier stage to the substrate (see below) are very small; we verified that sublimation occurs at the correct temperature, when the pressure is lowered slowly (several pascals per minute), and that first surface changes due to ice growth are observed at the same values when the pressure is increased even more slowly (1 Pa/min). Large pressure jumps (above ca. 50 Pa) often result in a short loss of temperature control, due to sublimation or deposition of large amounts of ice. The pressure in the sample chamber is stable to at least 0.1 Pa (the pressure gauge gives values in pascals with three decimals). When we slowly increase the pressure at constant temperature, the ice growth was very fast (seconds) at Pwater>1.1Psat (substantial supersaturation). Slow ice growth was observed exactly at Pwater=Psat. This requires waiting times in the range of minutes, as would be expected at equilibrium. From this observation we conclude that the pressure reading is exact, and we report values with one decimal. Although the pressure should read P=Psat at the onset of sublimation, this is harder to control for the instrument. We hypothesize that this is caused by a thick ice layer forming on cooled components of the sample holder. Here, we simply report the recorded data, translated into RH values.
2.2 Substrate
The experiments were carried out with a silica film grown on an n-doped silicon wafer. The silicon wafer ((111) orientation, thickness 0.27 mm, doped with phosphorus, resistivity 1 Ω cm) is cut into 4×4 mm2 pieces by a wafer dicing saw (Disco DAD321). The pieces are thoroughly cleaned by sonication in an ultrasonicator (VWR Ultrasonic Cleaner) for 15 min in a sequence of three solvents: isopropanol (LC-MS chromasolv®, Sigma-Aldrich), acetone (ACS reagent > 99.5 %, Sigma-Aldrich), and water (18 M Ω cm, <5 ppb total organic content, Millipore). They are blown dry with nitrogen and surface-oxidized in an oxygen plasma cleaner (Femto Diener) for approximately 8 min with a 10 sccm gas flow (10 Pa oxygen pressure). This surface treatment renders the wafers hydrophilic. For an experiment, liquid gallium–indium alloy is employed for bonding the wafer to a home-made copper stub. The stub is tightly fit into the Peltier stage by an aluminium foil spacer. For some experiments we used the surface of the copper stub, which is composed of copper oxide species.
While clean, flat oxidized silicon wafers (see Experiment section) are typically used in our work, relatively rough copper surfaces (exposed to ambient air and thus oxidized) were also suitable substrate to grow ice. Both oxidized surfaces are amorphous. In our experiments, the pressure is adjusted to <200 Pa (h≪1), and then the substrate temperature is lowered from ambient to the desired ice growth temperature ( ∘C). The pressure was then slowly increased until h=1. The rate of ice growth can be controlled by controlling the humidity in the chamber; for example, fast growth can be achieved by pressure jumps to h>1 (see Supplement) and stabilization at h≤1. The idea is to keep isobaric and isothermal conditions. However, small changes in sample temperature, which we carefully monitored, cannot be avoided. Subsequent sublimation requires h<1, again accompanied by slight temperature changes.
In air, we would expect plate morphology between −20 ∘C and −10 under our low-pressure conditions (i.e., at fast gas phase diffusion), but only for h≫1, at much slower gas phase diffusion, do dendritic snowflake crystals grow (Gonda and Yamazaki, 1978; Libbrecht, 2005; Takahashi and Mori, 2006; Bailey and Hallett, 2009). Between −10 and −5 ∘C, crystals can grow as columns or needles. We found mainly hexagonal plates and columns from −20 to −10 ∘C for low supersaturation (as discussed below). In accordance with Bailey and Hallett (2004), individual crystals are of hexagonal geometry with facets of equal lengths as well as hexagonal scalene crystals, with three dissimilar facet lengths.

Figure 1Ice growth examples recorded at 20 kV. (a) Isolated crystals grown on an oxidized silicon wafer substrate. Note that some grains have started to touch, producing polycrystalline ice. ESEM imaging conditions: P=135.1 Pa, ∘C, Psat=120.4 Pa, and h=1.12. (b) An individual hexagonal crystal of ice on a clean silicon wafer. The basal plane is nearly parallel to the substrate. The outer rim is bright, an effect that might indicate charging. ESEM imaging conditions: P=127.1 Pa, ∘C, Psat=117.0 Pa, and h=1.09.
3.1 Early stages of growth
By increasing the water vapour pressure (by 10 %–20 %) rapidly (in less than 5 s; see Supplement), the growth of individual hexagonal ice crystals is achieved on the oxidized silicon wafer, i.e., on an amorphous, OH-terminated silica surface. On the substrate, the orientation of ice crystals is random, with a few crystals having their c axis perpendicular to the surface plane. The ice nucleation is progressive and homogeneous for the pressure and temperature conditions reported here. A characteristic example of ice morphology is given in Fig. 1a, where randomly oriented isolated ice crystals are clearly visible, with a few features displaying highly defective crystal aggregates. These aggregates originate from the merging of nearby crystallites. The bright ridges in the image are usual for SEM (Castle and Zhdan, 1997; Nair et al., 2018) and correspond to a locally high flux of secondary electrons, due to higher emission rates from surfaces that point towards the detector. This is also the case for the prism faces on the left of Fig. 1b. This image also shows another typical effect, namely that flat surfaces appear to have a bright but blurry rim, in the vicinity of sharp edges. This is due to negative charges, which accumulate preferentially at sharp edges and corners. ESEM reduces these charges but cannot eliminate them completely (Toth et al., 2003). In order to investigate the effect of charging on ice growth (and sublimation), these processes were studied with the beam focused (and scanning) and not focused on the areas of interest. We observed that the presence of the beam resulted in no morphological changes in the ice crystal or film features. However, when prolonged scanning with a high beam voltage, beam damage and carbon deposition altered the growth and sublimation processes (see Supplement).
Our conditions result in slow growth rates where water molecules attach more readily to facets with high Miller indices, and ice growth is homogeneous on the prism faces, keeping the edges of crystals straight (Elbaum and Wettlaufer, 1993). Figure 1b shows a well-resolved hexagonal ice crystal with its basal plane (0001) oriented nearly parallel to the substrate. When the growth is monitored over time, a growth rate of ≈100 nm/s is observed at −18.7 ∘C and 127 Pa, hence at h=1.09 (9 % supersaturation). In this particular experiment, the growth direction was normal (90∘) to the plane of the prism faces (for more details see Supplement). Our conditions can be readily compared with those employed in other ESEM studies, but the growth rate reported varies substantially. For example, Pedersen et al. (2011) reported 300 nm/s at −20 ∘C (h not given), and Kiselev et al. (2017) reported 3000 nm/s at −22 ∘C (h=1.18).
Comparison of growth rates with other studies is very difficult, for example, other ESEM studies were carried out at temperatures at or below −30 ∘C (Pfalzgraff et al., 2010; Magee et al., 2014) and were concerned with qualitatively different growth modes. Above −10 ∘C, the growth rate is much higher, e.g., >10 000 nm/s at −7 ∘C and 450 Pa (Chen et al., 2017). This is based on enhanced gas phase diffusion at the higher temperature, while the mean free path remains nearly unchanged (Pruppacher and Klett, 1978). Other experiments, especially optical microscopy, employ moist air up to ambient pressure. The relatively high pressure of nitrogen and oxygen reduces the mean free path in the gas phase and thus alters the velocity distribution of the water molecules impacting the ice surface. In these studies, even lower growth rates were reported, which can yield different growth morphology; see for example Libbrecht and Rickerby (2013), where the very high growth rate at relatively high temperature is counterbalanced by diffusion in a much denser gas phase, i.e., resulting in a smaller mean free path (Pruppacher and Klett, 1978) (see Supplement). A better comparison is possible with ice growth in 40 Pa of (wet) air, reported by Sei and Gonda (1989), who find (macroscopic) results in very good agreement with the growth rate for the feature shown in Fig. 1b.
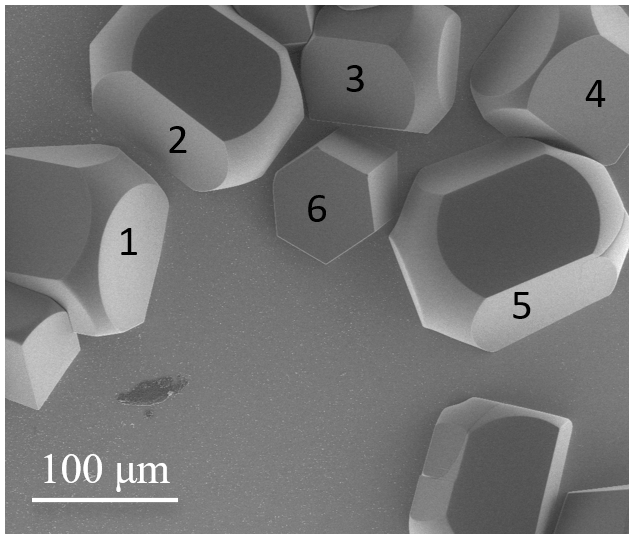
Figure 2Ice crystals on an oxidized silicon wafer substrate, imaged at 5 kV during growth. Hexagonal-like pillar morphologies are clearly identifiable. Some crystals display round edges. ESEM imaging conditions: P=148.1 Pa, ∘C, Psat=122.7 Pa, and h=1.21.
Some of the crystals in Fig. 1a also display rounding-off (“roughening”) of their edges. Under our experimental conditions this is associated with partial sublimation of existing crystals (Nelson, 1998) followed by their regrowth. These features are consistently observed for our imaging conditions (see Figs. 1a and 2 as well as the Supplement). Further evidence will be provided in Sect. 3.4. Close examination of our data points to fluctuations in pressure due to pumping cycles during imaging. Here and in the remainder of the text, we use roughening to describe the development of a macroscopically smooth, rounded shape. This is a dynamical process of the ice surface (Maruyama, 2005; Krzyzak, 2007; Asakawa et al., 2014; Magee et al., 2014). It is based on the gradual disappearance of flat surfaces (Nelson, 1998). Such macroscopically smooth surfaces are made up of high-index faces, which sublimate more rapidly than low-index (basal and prism) faces. Hence, rough surfaces appear during sublimation. While roughening occurs during sublimation (see Sect. 3.4 and 3.5), Fig. S10 (Supplement) illustrates how roughening can occur during a growth cycle due to loss of temperature control.
In Fig. 2, the basal planes of crystals 1 and 2 neither perpendicular nor parallel to the surface and correspond to a later stage of growth based on their relative sizes. Crystals 3 and 4 have basal planes oriented perpendicular to the surface, while the isolated crystal 5 has its basal plane nearly parallel to the surface plane. Each feature in Fig. 2 is ultimately based on a columnar crystal, but growing at very variable angles from the wafer surface (see, e.g., Fig. S9). Under our experimental conditions, i.e., forming ice from water vapour, the resulting morphology is not analogous to that of droxtals reported by Gonda and Yamazaki (1978).
Pfalzgraff et al. (2010) found pyramidal facets and curved (termed by the authors “conical non-facetted”) surfaces associated with ice growth. Pyramidal facets were not found, consistent with our observations. Pfalzgraff et al. (2010) grew their ice crystals typically between −30 and −45 ∘C and report growth rates as fast as 700 nm/s for the prism faces. They also used the onset of ice ablation as a function of temperature during a variable pressure SEM experiment to provide a way to relate the conditions in the SEM chamber to establish the frost point. Because pressure changes are reported as ratios of water vapour pressure at the ablation temperature over water vapour pressure at the cooling stage temperature, further comparison with our experimental conditions is difficult, in contrast to ESEM studies at higher temperatures (Nair et al., 2018; Chen et al., 2017).
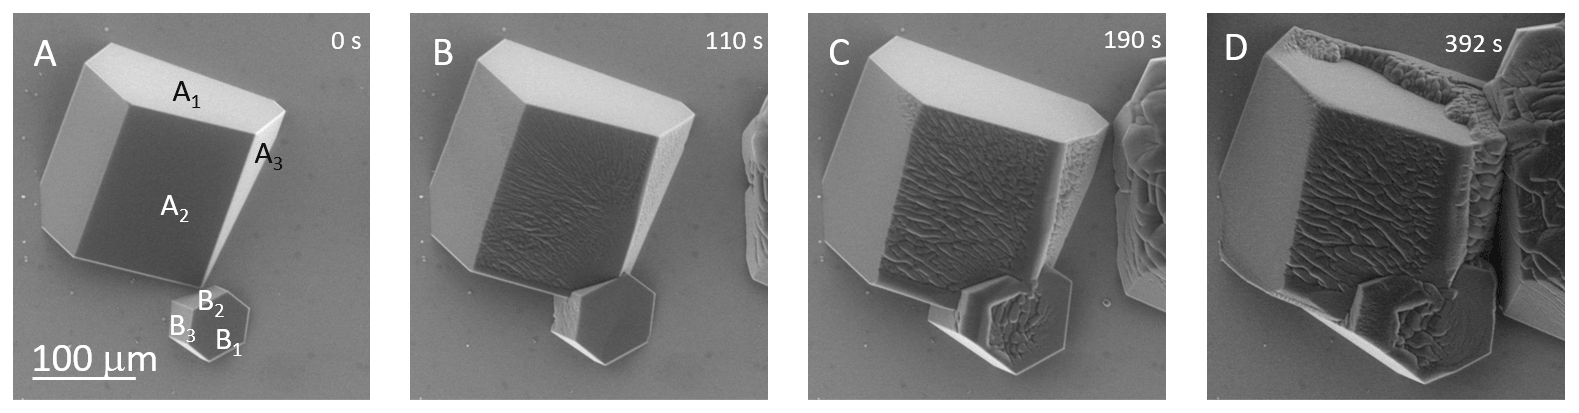
Figure 3Isolated crystals merging during growth. As soon as the crystals touch, the planes in contact show polycrystalline topography with a large density of grooves. ESEM imaging conditions: (a, b, c) P=130.2 Pa, ∘C, Psat=126.2 Pa, h=1.03; (d) P=126.8 Pa, ∘C, Psat=121.5 Pa, h=1.04. The images show the same area of the sample.
We measured local growth velocities at isolated and merging crystals shown in Fig. 3 (see Fig. S2). For our set of parameters (moderate supersaturation) we obtain values up to 200 nm/s. The values can be separated into max 100 nm/s at the six edges of the basal plane and 50 to 150 nm/s for some prism faces. Some edges, though, appear to be completely pinned, which is not due to contact with the substrate. However, some faces (e.g., the basal plane A1 in Fig. 3) expand only very slowly at their edges and practically not in the direction normal to the face (see A1 in Fig. 3). Even then, the center of the basal plane is preserved, as seen in Fig. 4a.
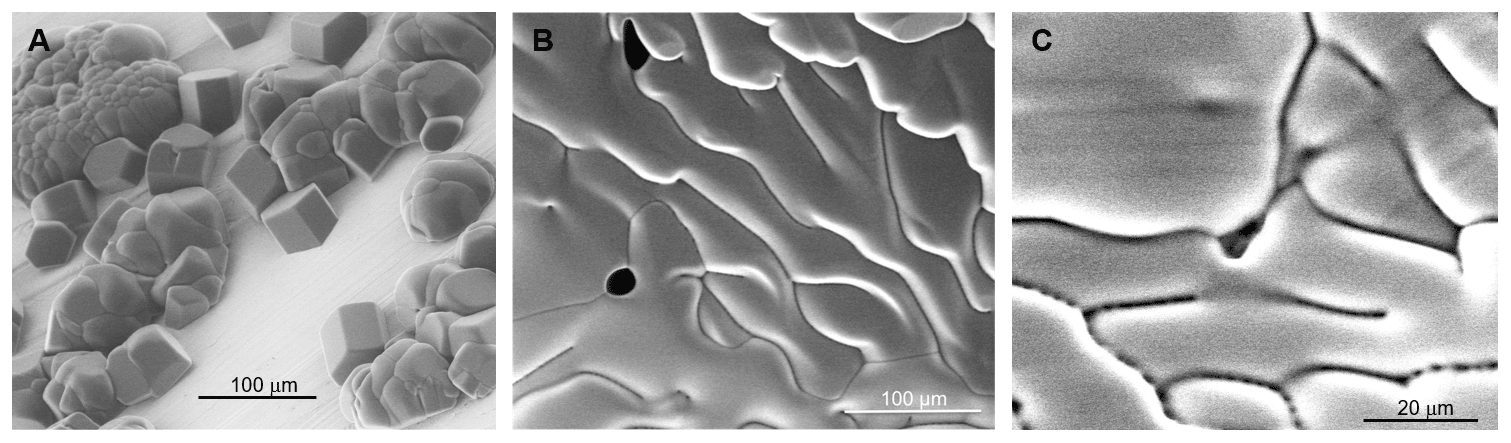
Figure 4(a) Hexagonal pillars of isolated crystals and polycrystalline ice films grown on an oxidized copper surface. ESEM imaging conditions: P=135.1 Pa, ∘C, Psat=127.4 Pa, and h=1.06. (b) Typical polycrystalline ice surface after growth and coalescence of the crystals on Si. The grains appear bright with typical shading effects. They are limited by 1 to 2 µm wide dark bands (“grooves”). Three grooves meet at angles of mainly 90 to 120∘. Each groove consists of aligned pores of ≈1–3 µm in diameter. P=438.4 Pa, ∘C, Psat=409.0 Pa, h=1.07. (c) Polycrystalline ice surface during growth. Circular pores aligned along grooves. P=287.3 Pa, ∘C, Psat=253.3 Pa, h=1.13.
When two growing crystals merge on the substrate, their relative orientation is usually at an angle, and a grain boundary forms. In the top view, a single grain boundary is not visible. But upon contact with other crystals, a large amount of strain energy is formed on the grain boundary, resulting in the formation of many defects. Hence, a corrugated surface formed during growth would result from such defects (see Fig. 3b, c). These “avalanche” defects (Pedersen et al., 2011) are formed very fast and appear even hundreds of micrometres away from the area of contact between two crystals, i.e., from the original single, straight grain boundary. The origin of the phenomenon is the mismatch of the structure found initially on A1 and B1 (see Figs. 3a, b and Fig. 1a). Merging of ice crystals and formation of grain boundaries was also observed with ESEM, reported by Magee et al. (2014) at much lower temperatures and pressures (below −20 ∘C) and by Pedersen et al. (2011) at conditions of pressure and temperature very similar to ours. Pedersen et al. propose that an avalanche of dislocations can originate at the newly forming grain boundary (Pedersen et al., 2011). This is evidenced by the presence of highly corrugated features (see for example A2) in Fig. 3b–d. In addition, in the early stages of the defective film growth, macro-steps are formed (see Fig. 3d).
Hence, our results are in agreement with well-known results at low pressures and at small supersaturation (Kiselev et al., 2017; Sei and Gonda, 1989). Higher pressures, i.e., admixture of air, could be an option for a high-pressure cell; higher supersaturations are a principal issue with these conditions. The fast growth rates and size of resulting features are more suitable for optical microscopy.
3.2 Growth of polycrystalline ice films
Crystal aggregation yields morphologies that differ from the general morphology of isolated crystals, at least in the early stages of growth (see Fig. 1). Merging of many isolated crystals (see Fig. 3 for an example of three crystallites) produces a polycrystalline surface (see Fig. 4a, where some crystals have merged). Ultimately, even the basal planes merge with other crystals, many grain boundaries and dislocations are expected to form, and facets are no longer visible (Fig. 4b). The formation of a continuous film of ice required deposits at least tens of micrometres thick. Such polycrystalline ice films show typical dark bands, which are assigned to gaps developing at grain boundaries from the merging of adjacent grains. We will be referring to these areas as grooves. The grooves often meet and display Y shapes (see Fig. 4b). This is in agreement with Krausko et al. (2014), who froze liquid water inside the ESEM specimen chamber but also performed ESEM studies of condensing water vapour (Nair et al., 2018; Chen et al., 2017). Grains can be nicely detected and assigned by EBDS (Montagnat et al., 2015), but measuring the depth of the grooves requires AFM. The typical groove depth range was found to be 0.05 to 0.5 µm (Krzyzak et al., 2007; Zepeda et al., 2001). In our films, we found groove depths of up to 10 µm (see Supplement), which could be due to different growth conditions, such as observation at a later stage of growth. The width of the grooves was 2 µm on average.

Figure 5Sublimation sequence of hexagonal crystals. (a, d) The basal plane of an isolated crystal. ESEM conditions: (a) P=180 Pa, ∘C, Psat=162.4 Pa, h=1.11; (b) P=139 Pa, ∘C, Psat=122.7 Pa, h=1.13; (c) P=123 Pa, ∘C, Psat=112.6 Pa, h=1.09; and (d) P=97 Pa, ∘C, Psat=102.4 Pa, h=0.95. All images have the same scale (see c). The time elapsed since the onset of sublimation is given in each figure. (e) Merged crystals, −18.3 ∘C, P=126.8 Pa, Psat=121.5 Pa, h=1.04. (f) The same area during the last stage before complete sublimation (6 min later). The bright grey background is the pure silicon wafer surface; all other features are ice crystals. Some facets are decorated with bright lines (strings of bright dots). ESEM imaging conditions: P=130.6 Pa, ∘C, Psat=136.1 Pa, and h=0.96.
The grooves' appearance is similar to that of veins in natural ice (Mader, 1992; Mader et al., 2006; Buford Price, 2000), and indeed our structures sometimes meet at angles around 120∘ (Fig. 4). However, the veins are larger, filled by brine (salt water of low freezing point), and more frequently oriented at relative angles of 120∘. This is because the large ice grains in nature grow and develop their shape more slowly.
3.3 Microscale “pores” inside the grooves
During our measurements on polycrystalline ice films, we observed features that appear as small circular dark spots, which we term “pores”, aligned inside the grooves (which are not to be confused with ice veins; Mader, 1992; Mader et al., 2006; Buford Price, 2000). Analogous features to our pores have been observed at ice–brine interfaces (Vetráková et al., 2019). The pores appear in ESEM as black dots (see Fig. 4) of 1 to 3 µm in diameter, which corresponds to the width of the grain boundaries. Under the chosen imaging conditions, pores appear in all the grain boundaries in Fig. 4, but they are not evenly distributed. These features are not due to beam damage (see our detailed discussion in the Supplement). Furthermore, under our experimental conditions it is unlikely that the pores are related to the veins reported in salt-contaminated ice (Mader, 1992; Mader et al., 2006; Buford Price, 2000) (see introduction). It is the first time these features are reported for similar growth conditions.
We postulate that pores form when corrugated faces merge. An example of this can be seen for a corrugated face merging with a flat one in Fig. 3b–d (see face labelled A2), a complex scenario that forms the base for polycrystalline growth from coalescing crystallites. The corrugated surface would then result in a large number of pores. Their diameter along a given groove would be related to the height of the uneven features (see Fig. S4c). The situation is more complex when two corrugated surfaces meet: now curved grooves form, filled by pores (Fig. 4). Occasionally observed larger holes (> 10 µm size; see Fig. 4 for two characteristic examples) can originate from large defects produced when growing grains merge laterally, while their vertical growth rate is too fast to allow for large gaps between the grains to be filled. Similar, but much smaller holes are known from epitaxial ice growth (Thürmer and Nie, 2013). The nanoscale morphology of the grooves is unknown, and beam damage precludes further analysis by ESEM (see Supplement).
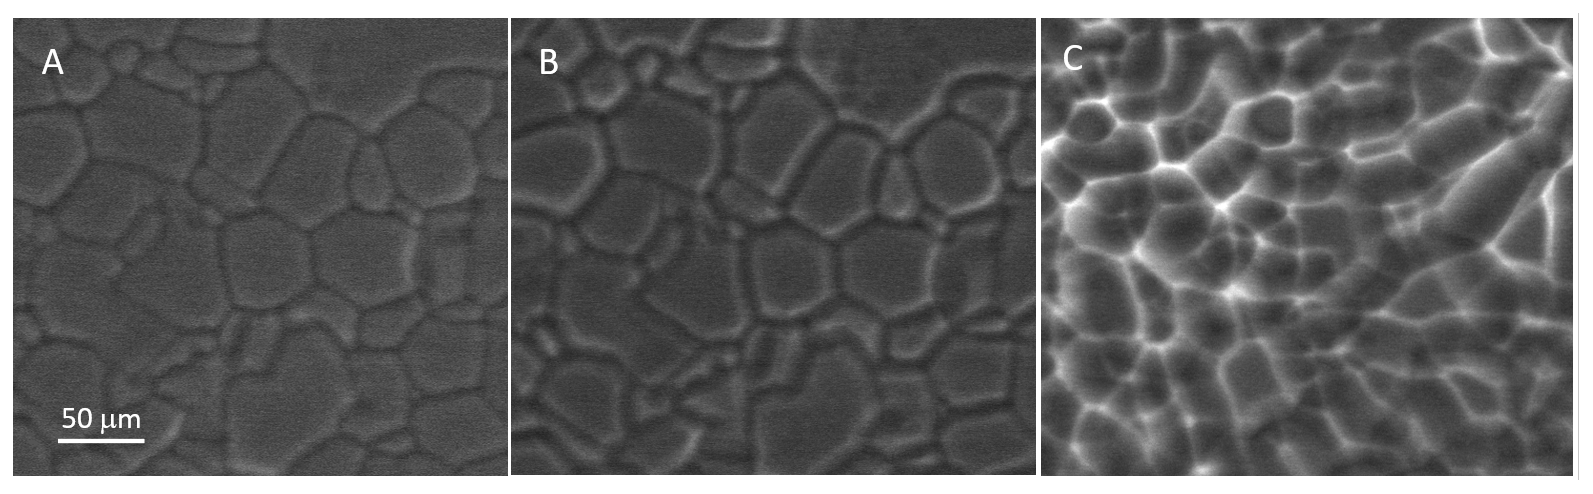
Figure 6A thick polycrystalline ice film during sublimation. The grooves widen substantially. The last image appears to show contrast inversion of the grooves. ESEM imaging conditions: (a) P=253.4 Pa, ∘C, Psat=255.5 Pa, h=0.99; (b) P=230.9 Pa, ∘C, Psat=257.8 Pa, h=0.90; and (c) P=232.8 Pa, ∘C, Psat=257.8 Pa, h=0.90. All images have the same scale (see a).
3.4 Sublimation of isolated ice crystals
Sublimation is achieved by lowering the pressure by at least a few pascals to h<1 (this can also work at readings of h>1 due to the issues discussed in the Experiment section). In the absence of apparent defects such as dislocation and grooves, water molecules can detach more readily from crystal edges where the prism and basal faces meet, as well as from the prism faces. Sublimation of the crystal shown in Fig. 5a does not proceed uniformly. Water detaches initially from the area near the edge of the top surface, and a rough surface is created (see Fig. 5a, b). In Fig. 5b, c, ridges and protrusions are clearly visible and often appear as bright high-contrast features (white) (see Gonda and Sei, 1987, for analogous behaviour observed by optical microscopy). This process extends to the prism faces and becomes more pronounced in Fig. 5c. As the sublimation proceeds further, the ridges delimit concave features seen mainly on what is left of the prism faces. These contrast changes are intrinsic (Nair et al., 2018), i.e., not related to the detector performance, which would result in a change in brightness over the whole image. The shape of the basal plane is more or less retained throughout this process (Fig. 5a–d). This hexagonal plate-like crystal shrank in both height and diameter after 7 min, and it completely disappeared in ≈13 min. The lateral sublimation rate was initially slow, 80 nm/s between Fig. 5b and c, but then it increased rapidly, as the crystal top surface attained an irregular morphology (ridges and protrusions) and as the crystal thickness decreased. The estimated lateral sublimation rate between Fig. 5c and d is 200 nm/s. For our temperature range (−20 to −10 ∘C) and crystals of the order of 100 µm in diameter, complete sublimation is achieved over several minutes, as found by Nelson with optical microscopy (Nelson, 1998). This value depends on temperature and pressure; related observations on single crystals sublimation are documented at −45 ∘C (Pfalzgraff et al., 2010), but also in our parameter range (Cross, 1969; Magee et al., 2014). A similar sublimation scenario is observed for several crystals in close contact and proximity, except for the presence of corrugations (Fig. 5e) giving rise to extensive ridges and scallop shape formation as seen in Fig. 5f. The formation of strings of bright dots on what is left of the grains is clearly visible in Fig. 5f. The morphological changes observed during sublimation are in excellent agreement with those of other studies (Nair et al., 2018; Cross, 1969; Magee et al., 2014), including the typical ridge or scallop morphology seen in Fig. 5c, f.
Closer inspection, but carefully avoiding beam damage (see Supplement), reveals that the bright ridges are entirely composed of sub-micrometre features, aligned along edges or grooves. Baker et al., (2003) found similar features at much lower temperature (Baker et al., 2003); however, they show a relation between the appearance of these features and the presence of contamination (in natural ice samples). This impurity effect has been studied by several authors who suggest that ions (from salts or acids) or dust particles in the crystals may be the underlying cause for the macroscopic structures that develop during sublimation (Cross, 1969, 1971; Mulvaney et al., 1988; Cullen and Baker, 2001; Rosenthal et al., 2007). In contrast, we exclude contamination; the few particles we found would by far not suffice to decorate all ridges during sublimation (see Supplement). Our bright ridges stem from localized high emission currents and must be linked to the above-mentioned asperities that appear during evaporation. We explain their presence not by contamination as in natural samples (Baker et al., 2003), but rather by the coexistence of concave “scallop”-like surfaces (Libbrecht, 2005) with convex asperities (Chen et al., 2017). The concave surfaces form by sublimation of faces of crystals (Libbrecht, 2005), and the convex ones are the tip-like asperities at the ridges, which delimit the concave areas (their curvature radii can reach the nanoscale; see Supplement). Whenever we zoomed into details of the asperities, we observed artifacts from beam damage (e.g., melting); it is thus likely that the smallest features are in the range of the beam diameter (several nanometres). The presence of both concave and convex features during sublimation is well established (hollow ice crystals; Gonda and Sei, 1987).
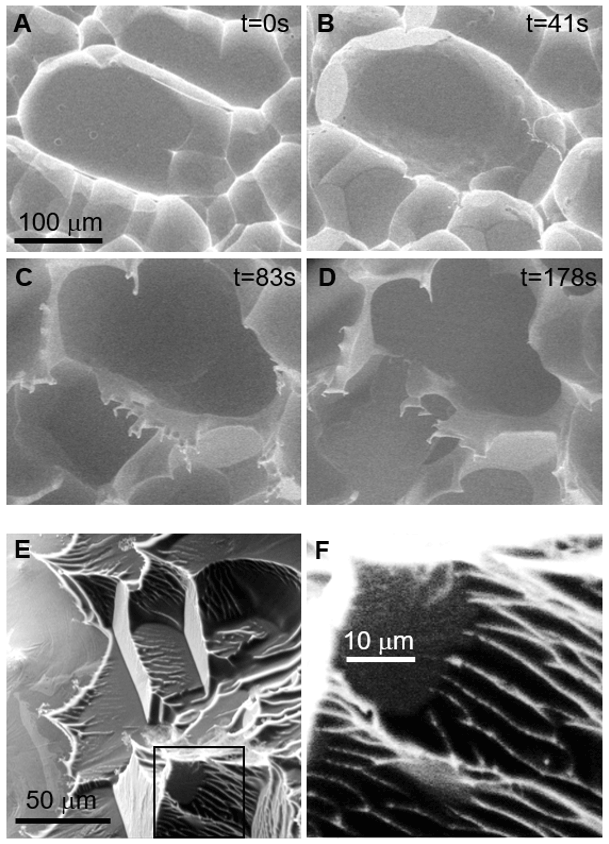
Figure 7A thick polycrystalline ice film during sublimation. Shapes reminiscent of isolated crystals appear. In the final stage, needles/spikes develop. The smallest radii of such structures is below 10 nm. ESEM imaging conditions: (a) P=137.0 Pa, ∘C, Psat=165.4 Pa, h=0.83; (b) P=147.3 Pa, ∘C, Psat=189.8 Pa, h=0.78; (c) P=142.0 Pa, ∘C, Psat=215.6 Pa, h=0.66; and (d) P=129.0 Pa, ∘C, Psat=267.1 Pa, h=0.48. The time from the onset of sublimation is given in the figures. All images have the same scale (see c). (e) −20 ∘C. The ice on the right-hand side part is much thicker than on the left and shows the typical concave scallop shape on the 10 µm scale. This is also replicated on the sub-micrometre scale. The ridges (white lines) and tips appear very bright due to the high local emission current. (f) Zoom of (e).
3.5 Sublimation of ice films
The principal features of the sublimation process of polycrystalline ice are very similar to the case of isolated crystals discussed above, as long as the parameters are not changed to much lower temperatures (Pfalzgraff, 2010; Magee et al., 2014). However, in our case, for rather flat ice crystallites (Fig. 4c), separated by grooves (dark lines), sublimation first causes “etching” and a widening of the grooves (Fig. 6a, b). Following the theory by Barnes et al. (2003), the etching of grain boundaries and grooves by sublimation should create ever widening channels. The widening of the grooves during sublimation can be visualized by optical microscopy (Barnes et al., 2003). We followed the etching in real time at −10 ∘C, where the widening is in the range of millimetres per minute, similar to findings by Chen et al. (2017). The grooves simply move vertically, together with the evaporating ice surface. When the grain boundary plane is not exactly normal to the surface, the grooves no longer mark the initial boundary location and also move laterally. As the sublimation proceeds further (from Fig. 6b, c), features reminiscent of isolated crystals appear (Nair et al., 2018; Cross, 1971; Chen et al., 2017). Quantification of this process is rather difficult. However, the rates of sublimation are of the order of hundreds of micrometres per minute, which appears to compare well with several images shown by other authors under similar conditions of temperature and pressure (Nair et al., 2018; Chen et al., 2017).
As sublimation proceeds (see Fig. 6b, c), the ice asperity density increases. In polycrystalline films, asperities form during sublimation at locations where grains were located (Thompson, 2000). Hence, this increase in asperities indicates an increase in ice grain density during the film sublimation. This is a common feature of a polycrystalline film formation for which the grain structure resulting from the nucleation, growth, and coalescence processes during the early stage of growth is retained at the near surface of the silicon wafer and where through competitive growth grains with preferred orientations are favoured as thickness increases. The result of the competitive growth is seen in the film morphology reported in Fig. 6a at the onset of sublimation, where fewer larger grains are visible at the surface of the film. Figure 6c also shows that at the later stages of sublimation (t=124 s) the groove contrast appears inverted, i.e., white, as for sublimation of an isolated crystal (see Fig. 5). In the discussion of Fig. 5, this phenomenon is synchronized with the appearance of sharp features.
The change of contrast in the ESEM image during sublimation of polycrystalline and isolated crystals can be explained by taking a closer look at the ice morphology during sublimation. Figure 7a–d show how ice features tens of micrometres large change during sublimation. The dark features corresponding to the grains are becoming concave during sublimation. These concave features are especially well imaged next to bare surface areas, similar to our findings for sublimation of isolated crystals. In the final stages of sublimation, where the substrate exerts some influence on the ice morphology, the features meet in sharp ridges and tips/asperities, with radii down to the nanometre range (similar to the features at evaporating brine; Yang et al., 2017). The interaction with the solid substrate has some stabilizing effect on these features, which could be mechanical (immobilization), but also thermal (good heat conduction against beam damage). However, the sharp tips also exist on the ice surface, at −20 ∘C and 100 Pa (Fig. 7e, f). The appearance of inverted contrast in Fig. 6c indicates that these sharp features also develop without apparent interaction with the solid substrate.
A specific problem here, but also more general, is contamination. We exclude contamination, and possible pinning of ice asperities at contamination spots, by testing growth and sublimation on large scales (see Supplement). Figure 7c and d show some examples, which are reminiscent of Cross' images for apparently thicker films (Cross, 1969, 1971). However, we have repeatedly found this morphology at up to −10 ∘C, at a much higher temperature than in Cross' work (his equilibrium pressure < 0.01 Pa translates to < −90 ∘C). The smallest radii might be well below 100 nm, but beam heating effects (see Supplement) hinder a closer observation. Whatever the nanoscale structure might be, the very appearance of the needles/spikes requires that the curvature on the surface changes from predominantly convex on the grains (except the relatively small area of the grooves) to a large fraction of concave features, as also observed in various ice crystal habits (Libbrecht, 2005).
We investigated the growth and sublimation of isolated ice crystals (hexagonal plates or columns and prisms), grown in random directions on oxidized silicon wafer, and of polycrystalline films, by real-time, in situ ESEM. We find that crystalline substrates are not required to grow isolated crystals, except if epitaxial orientation is sought. We present an analysis of the observed microscale surface morphology, including polycrystalline ice films. The observed growth scenarios are generally compatible with reports based on SEM studies (mainly at lower temperatures), with recent ESEM results, and with optical microscopy, which is usually carried out at ambient pressure.
Our spatial and temporal resolution revealed new details on dynamic phenomena during ice growth. Specifically, we demonstrate how merging of isolated crystals and the development of corrugated surfaces and of grooves ultimately creates films with typical polycrystalline ice surfaces. We thus documented the transition from single crystal to polycrystalline morphologies for the full scenario of vapour growth, i.e., from the initial nucleation over coalescence of crystallites, to the final smooth surface, which is dominated by grooves.
The appearance of small pores in grooves has not, to our knowledge, been documented before and is interpreted as interface of two corrugated merging crystallites having multiple imperfections at their surfaces. Their coalescence results in the formation of additional defects in the form of a string of dark pores, each of only 1–3 µm diameter.
We characterized the evolution of the ice morphology at the microscale and nanoscale, by following the evolution of rather complex micropatterns towards a concave scallop morphology. Each structure is lined by sharp ridges, which are composed of nanoscale asperities. Through careful control experiments, we know that contamination plays a minor role in their formation, different from natural samples that contain salts.
Further experiments call for technical improvements to prevent beam damage, especially since the nanostructures are prone to heating and thus melting. We suggest WetSTEM techniques, more sensitive detectors, and improved electron sources. A different issue is moving towards more realistic conditions for atmospheric and geoscience research. ESEM setups allow only for pure water vapour, but no additional gases. This limits investigation of environmentally relevant conditions, including air, and impurities. Furthermore, in practice, only small supersaturation is accessible, which means that solid–liquid interfaces are only accessible at rather low pressure, such that for example typical snow formation cannot be investigated. Local dosing of water vapour could be a simple alternative to achieve the required very high supersaturation, at least when highly dynamic growth scenarios are desired.
Further development of ESEM would afford more flexibility in experimental design and could include lower temperatures (down to −40 ∘C) and improved pressure control. A challenge is accessing the water–ice phase transition at relatively high pressure, and generally reaching the extreme values of temperature and pressure, and fast cooling rates. Ambient pressure would require a pressure cell with much loss of resolution. Another possibility would be the addition of traces of ice nucleators such as minerals (Vetráková et al., 2019) or biogenic matter (Cascajo-Castresana et al., 2020) to research cloud nucleation and frost formation. An in situ method such as the one proposed in our study would allow the observation of changes in morphology and determination of the role of defects as well as impurities in ice in real time. For example, the ESEM environment offers flexibility to approach brine-filled veins in ice (Vetráková et al., 2019). Moving towards mixtures, the interaction of carbon dioxide/water vapour with dry ice–water ice, relevant for the Martian atmosphere, can be in the range of an advanced instrument.
Data can be found in the data repository of York University under https://doi.org/10.5683/SP2/S2HBAR (last access: 12 December 2021, Cascajo-Castresana et al., 2021).
The supplement related to this article is available online at: https://doi.org/10.5194/acp-21-18629-2021-supplement.
All authors designed the experiments, carried them out, evaluated the results, and prepared the manuscript.
The contact author has declared that neither they nor their co-authors have any competing interests.
Publisher's note: Copernicus Publications remains neutral with regard to jurisdictional claims in published maps and institutional affiliations.
We are indebted to Chris Tollan, CIC nanoGUNE, for technical help with the ESEM. We are grateful to Heidy Mader, Bristol University for discussions on ice veins. We thank Andrey Chuvilin, CIC nanoGUNE, for discussing beam damage and contrast mechanisms. We acknowledge funding from FEI (Eindhoven, NL), Elkartek 2015 and 2019 (Basque government), the Spanish MINECO grants PID2019104650GB and MAT201346006R, Basque government grant Proyecto de Investigación PI201357, and the Maria de Maeztu “Units of Excellence” programme MDM20160618 (MINECO). Sylvie Morin acknowledges York University and CIC nanoGUNE for their support during her sabbatical and subsequent visits.
This research has been supported by the Ekonomiaren Garapen eta Lehiakortasun Saila, Eusko Jaurlaritza (grant no. PI2013-57), the Ekonomiaren Garapen eta Lehiakortasun Saila, Eusko Jaurlaritza (grant nos. Elkartek ng15 and Elkartek ng19), and the Ministerio de Economía, Industria y Competitividad, Gobierno de España (grant nos. PID2019-104650GB, MAT2013-46006-R, and Maria de Maeztu “Units of Excellence” programme MDM-2016-0618).
This paper was edited by Thorsten Bartels-Rausch and reviewed by three anonymous referees.
Alonso, J. M., Górzny, M. L., and Bittner, A. M.: The physics of tobacco mosaic virus and virus-based devices in biotechnology, Trends Biotechnol. 31, 530–538, https://doi.org/10.1016/j.tibtech.2013.05.013, 2013.
Asakawa, H., Sazaki, G., Yokoyama, E., Nagashima, K., Nakatsubo, S., and Furukawa, Y.: Roles of surface/volume diffusion in the growth kinetics of elementary spiral steps on ice basal faces grown from water vapor, Cryst. Growth Des., 14, 3210–3220, https://doi.org/10.1021/cg4014653, 2014.
Bailey, M. and Hallett, J.: Growth Rates and Habits of Ice Crystals between −20∘C and −70∘C, J. Atmos. Sci., 61, 514–544, https://doi.org/10.1175/1520-0469(2004)061<0514:GRAHOI>2.0.CO;2, 2004.
Bailey, M. P. and Hallett, J.: A Comprehensive Habit Diagram for Atmospheric Ice Crystals: Confirmation from the Laboratory, AIRS II, and Other Field Studies, J. Atmos. Sci., 66, 2888–2899, https://doi.org/10.1175/2009JAS2883.1, 2009.
Baker, I., Cullen, D., and Iliescu, D.: The microstructural location of impurities in ice, Can. J. Phys. 81, 1–9, https://doi.org/10.1139/p03-030, 2003.
Barnes, P. R. F., Wolff, E. W., Mallard, D. C., and Mader, H. M.: SEM studies of the morphology and chemistry of polar ice, Microsc. Res. Tech., 62, 62–69, https://doi.org/10.1002/jemt.10385, 2003.
Bartels-Rausch, T., Bergeron, V., Cartwright, J. H. E., Escribano, R., Finney, J. L., Grothe, H., Gutiérrez, P. J., Haapala, J., Kuhs, W. F., Pettersson, J. B. C., Price, S. D., Sainz-Díaz, C. I., Stokes, D. J., Strazzulla, G., Thomson, E. S., Trinks, H., and Uras-Aytemiz, N.: Ice structures, Patterns, and processes: A view across the icefields, Rev. Mod. Phys., 84, 885–944, https://doi.org/10.1103/RevModPhys.84.885, 2012.
Bartels-Rausch, T., Jacobi, H.-W., Kahan, T. F., Thomas, J. L., Thomson, E. S., Abbatt, J. P. D., Ammann, M., Blackford, J. R., Bluhm, H., Boxe, C., Domine, F., Frey, M. M., Gladich, I., Guzmán, M. I., Heger, D., Huthwelker, Th., Klán, P., Kuhs, W. F., Kuo, M. H., Maus, S., Moussa, S. G., McNeill, V. F., Newberg, J. T., Pettersson, J. B. C., Roeselová, M., and Sodeau, J. R.: A review of air–ice chemical and physical interactions (AICI): liquids, quasi-liquids, and solids in snow, Atmos. Chem. Phys., 14, 1587–1633, https://doi.org/10.5194/acp-14-1587-2014, 2014.
Bliss, A. K., Cuffey, K. M., and Kavanaugh, J. L.: Sublimation and surface energy budget of Taylor Glacier, Antarctica, J. Glaciol., 57, 684–696, https://doi.org/10.3189/002214311797409767, 2011.
Buford Price, P.: A habitat for psychrophiles in deep Antarctic ice, P. Natl. Acad. Sci. USA, 97, 1247–1251, https://doi.org/10.1073/pnas.97.3.1247, 2000.
Cascajo-Castresana, M., David, R. O., Iriarte-Alonso, M. A., Bittner, A. M., and Marcolli, C.: Protein aggregates nucleate ice: the example of apoferritin, Atmos. Chem. Phys., 20, 3291–3315, https://doi.org/10.5194/acp-20-3291-2020, 2020.
Cascajo-Castresana, M., Morin, S., and Bittner, A. M.: Data respository “The ice–vapour interface during growth and sublimation”, [data set], https://doi.org/10.5683/SP2/S2HBAR, last access: 12 December 2021.
Castle, J. E. and Zhdan, P. A.: Characterization of surface topography by SEM and SFM: problems and solutions, J. Phys. D. Appl. Phys., 30, 722, https://doi.org/10.1088/0022-3727/30/5/004, 1997.
Chen, X., Shu, J., and Chen, Q.: Abnormal gas-liquid-solid phase transition behaviour of water observed with in situ environmental SEM, Sci. Rep., 7, 46680, https://doi.org/10.1038/srep46680, 2017.
Cross, J. D.: Scanning Electron Microscopy of Evaporating Ice, Science, 164, 174–175, https://doi.org/10.1126/science.164.3876.174, 1969.
Cross, J. D.: The effect of impurities on the structure of evaporating ice, J. Glaciol., 59, 287–292, https://doi.org/10.3189/S0022143000013241, 1971.
Cullen, D. and Baker, I.: Observation of impurities in ice, Microsc. Res. Tech., 55, 198–207, https://doi.org/10.1002/jemt.10000, 2001.
Ebert, M., Inerle-Hof, M., and Weinbruch, S.: Environmental scanning electron microscopy as a new technique to determine the hygroscopic behaviour of individual aerosol particles, Atmos. Environ., 36, 5909–5916, https://doi.org/10.1016/S1352-2310(02)00774-4, 2002.
Elbaum, M. and Wettlaufer, J. S.: Relation of growth and equilibrium crystal shapes, Phys. Rev. E, 48, 3180–3184, https://doi.org/10.1103/PhysRevE.48.3180, 1993.
Gonda, T. and Yamazaki, T.: Morphology of ice droxtals frown from supercooled water droplets J. Cryst. Growth, 45, 66–69, https://doi.org/10.1016/0022-0248(78)90416-5, 1978.
Gonda, T. and Sei, T.: Evaporation form of ice crystals in subsaturated air and their evaporation mechanism, Proc. NIPR Symp. Polar. Meteorol. Glaciol., 1, 113–121, https://doi.org/10.15094/00003529, 1987
Hondoh, T.: An Overview of Microphysical Processes in Ice Sheets: Toward Nanoglaciology, Low Temp. Sci. Suppl. Issue, 68, 1–23, 2009.
Kiselev, A., Bachmann, F., Pedevilla, P., Cox, S. J., Michaelides, A., Gerthsen, D., and Leisner, T.: Active sites in heterogeneous ice nucleation – the example of Krich feldspars, Science, 355, 367–371, https://doi.org/10.1126/science.aai8034, 2017.
Krausko, J., Runštuk, J., Neděla, V., Klán, P., and Heger, D.: Observation of a brine layer on an ice surface with an environmental scanning electron microscope at higher pressures and temperatures, Langmuir, 30, 5441–5447, https://doi.org/10.1021/la500334e, 2014.
Krzyzak, M., Techmer, K., Faria, S., Genov, G., and Kuhs, W.: Atomic force microscopy of rearranging ice surfaces, in: Physics and Chemistry of Ice, edited by: Kuhs, W. F., RSC Publishing, https://doi.org/10.1039/9781847557773, 2007.
Lamb, D. and Scott, W. D. The Mechanism of Ice Crystal Growth and Habit Formation, J. Atmos. Sci., 31, 570–580, 1974.
Libbrecht, K. G.: A Critical Look at Ice Crystal Growth Data, available at: https://arxiv.org/abs/cond-mat/0411662 (last access: 2 December 2021), 2004.
Libbrecht, K. G.: The physics of snow crystals, Rep. Prog. Phys., 68, 855–895, https://doi.org/10.1088/0034-4885/68/4/R03, 2005.
Libbrecht, K. G. and Rickerby, M. E.: Measurements of surface attachment kinetics for faceted ice crystal growth, J. Cryst. Growth, 377, 1–8, https://doi.org/10.1016/j.jcrysgro.2013.04.037, 2013.
Mader, H. M.: Observations of the water-vein system in polycrystalline ice, J. Glaciol., 38, 333–347, https://doi.org/10.3189/S0022143000002227, 1992.
Mader, H. M., Petitt, M. E., Wadham, J. L., Wolff, E. W., and Parkes, R. J.: Subsurface ice as a microbial habitat, Geology, 34, 169–172, https://doi.org/10.1130/G22096.1, 2006.
Magee, N. B., Miller, A., Amaral, M., and Cumiskey, A.: Mesoscopic surface roughness of ice crystals pervasive across a wide range of ice crystal conditions, Atmos. Chem. Phys., 14, 12357–12371, https://doi.org/10.5194/acp-14-12357-2014, 2014.
Maruyama, M.: Roughening transition of prism faces of ice crystals grown from melt under pressure, J. Cryst. Growth, 275, 598–605, https://doi.org/10.1016/j.jcrysgro.2004.11.432, 2005.
Montagnat, M., Chauve, T., Barou, F., Tommasi, A., Beausir, B., and Fressengeas, C.: Analysis of Dynamic Recrystallization of Ice from EBSD Orientation Mapping, Front. Earth Sci., 3, 81, https://doi.org/10.3389/feart.2015.00081, 2015.
Mulvaney, R., Wolff, E. W., and Oates, K.: Sulphuric acid at grain boundaries in Antarctic ice, Nature, 331, 247–249, https://doi.org/10.1038/331247a0, 1988.
Murphy, D. M. and Koop, T.: Review of the vapour pressures of ice and supercooled water for atmospheric applications, Q. J. R. Meteorol. Soc., 131, 1539–1565 https://doi.org/10.1256/qj.04.94, 2005.
Nair, M., Husmann, A., Cameron, R. E., and Best, S. M.: In situ ESEM imaging of the vapor-pressure-dependent sublimation-induced morphology of ice, Phys. Rev. Mat., 2, 040401, https://doi.org/10.1103/PhysRevMaterials.2.040401, 2018.
Nelson, J.: Sublimation of ice crystals from the vapor, J. Atmos. Sci. 55, 910–919, 1998.
Nowak, D., Heuberger, M., Zäch, M., and Christenson, H. K.: Thermodynamic and kinetic supercooling of liquid in a wedge pore, J. Chem. Phys., 129, 154509, https://doi.org/10.1063/1.2996293, 2008.
Pedersen, C., Mihranyan, A., and Strømme, M.: Surface transition on ice induced by the formation of a grain boundary, PLoS One, 6, https://doi.org/10.1371/journal.pone.0024373, 2011.
Pfalzgraff, W. C., Hulscher, R. M., and Neshyba, S. P.: Scanning electron microscopy and molecular dynamics of surfaces of growing and ablating hexagonal ice crystals, Atmos. Chem. Phys., 10, 2927–2935, https://doi.org/10.5194/acp-10-2927-2010, 2010.
Pruppacher, H. R. and Klett, J. D.: Microphysics of Clouds and Precipitation, Reidel Publishing, Dordrecht, https://doi.org/10.1007/978-94-009-9905-3, 1978.
Rosenthal, W., Saleta, J., and Dozier, J.: Scanning electron microscopy of impurity structures in snow, Cold Reg. Sci. Technol., 47, 80–89, https://doi.org/10.1016/j.coldregions.2006.08.006, 2007.
Sazaki, G., Zepeda, S., Nakatsubo, S., Yokoyama, E., and Furukawa, Y.: Elementary steps at the surface of ice crystals visualized by advanced optical microscopy, P. Natl. Acad. Sci. USA, 107, 19702–19707, https://doi.org/10.1073/pnas.1008866107, 2010.
Sei, T. and Gonda, T.: The growth mechanism and the habit change of ice crystals growing from the vapor phase, J. Cryst. Growth, 94, 697–707, https://doi.org/10.1016/0022-0248(89)90094-8, 1989.
Takahashi, C. and Mori, M.: Growth of snow crystals from frozen water droplets, Atmos. Res., 82, 385–390, https://doi.org/10.1016/j.atmosres.2005.12.013, 2006.
Thompson, C. V.: Structure evolution during processing of polycrystalline films, Annu. Rev. Mater. Sci., 30, 159–190, https://doi.org/10.1146/annurev.matsci.30.1.159, 2000.
Thürmer, K. and Nie, S.: Formation of hexagonal and cubic ice during low-temperature growth, P. Natl. Acad. Sci. USA, 110, 11757–11762, https://doi.org/10.1073/pnas.1303001110, 2013.
Toth, M., Thiel, B. L., and Donald, A. M.: Interpretation of secondary electron images obtained using a low vacuum SEM, Ultramicroscopy, 94, 71–87, https://doi.org/10.1016/s0304-3991(02)00203-6, 2003.
Vetráková, L., Neděla, V., Runštuk, J., and Heger, D.: The morphology of ice and liquid brine in an environmental scanning electron microscope: a study of the freezing methods, The Cryosphere, 13, 2385–2405, https://doi.org/10.5194/tc-13-2385-2019, 2019.
Yang, X., Neděla, V., Runštuk, J., Ondrušková, G., Krausko, J., Vetráková, L., and Heger, D.: Evaporating brine from frost flowers with electron microscopy and implications for atmospheric chemistry and sea-salt aerosol formation, Atmos. Chem. Phys., 17, 6291–6303, https://doi.org/10.5194/acp-17-6291-2017, 2017.
Zepeda, S., Yeh, Y., and Orme, C. A.: Atomic force microscope chamber for in situ studies of ice, Rev. Sci. Instrum., 72, 4159, https://doi.org/10.1063/1.1406933, 2001.