the Creative Commons Attribution 4.0 License.
the Creative Commons Attribution 4.0 License.
 | 21 Dec 2021
Linkages between the atmospheric transmission originating from the North Atlantic Oscillation and persistent winter haze over Beijing
Muyuan Li
Ian Simmonds
Dehai Luo
Linhao Zhong
In this study, the persistent winter haze that occurred over Beijing during 1980 to 2016 is examined using reanalysis and station data. On both interannual and daily-to-weekly timescales, the winter haze weather in Beijing is found to be associated with a pronounced atmospheric teleconnection pattern from the North Atlantic to Eurasia (Beijing). A positive western-type North Atlantic Oscillation (WNAO+) phase and a positive East Atlantic/West Russia (EA/WR+) phase are observed as part of this teleconnection pattern (an arched wave train). This study focuses on the role of the WNAO pattern, because the WNAO+ pattern acts as the origin of the atmospheric transmission, 8–10 d before the persistent haze events. Further analyses reveal that the WNAO+ pattern can increase the number of haze days and persistent haze events on interannual and daily-to-weekly timescales. Specifically, strong WNAO+ winters (above the 95th percentile) can increase the number of haze days and persistent haze events by 26.0 % and 42.3 %, respectively. In addition, a high WNAO index for the 5 d average (above the 95th percentile) predicts a 16.9 % increase in the probability of haze days on Day 8 and a higher proportion of persistent haze days compared with an unknown WNAO state. Thus, the WNAO+ pattern is as a necessary prior background condition for the formation of the wave train and is a skillful predictor for persistent hazy weather. Corresponding to the WNAO+ pattern, intensified zonal wind and a north–south sea surface temperature tripolar mode over the North Atlantic also appear before persistent haze events on the daily-to-weekly timescale. On the interannual timescale, winters with a greater number of persistent haze days are also associated with a tripolar sea surface temperature (SST) mode over the North Atlantic that is situated farther northward.
- Article
(9370 KB) - Full-text XML
- BibTeX
- EndNote


Beijing is the capital city of China and is situated in the northeast of the country. It covers 16 410 km2 and has a permanent population of 21.542 million. In 2019, Beijing's gross domestic product reached CNY 3537 billion, which was an increase of 6.1 % over the previous year (http://www.stats.gov.cn, last access: 5 December 2021). Along with economic development, Beijing has experienced more frequent hazy weather, especially persistent haze in winter, over the past 60 years (Wang et al., 2014; Su et al., 2015; K. Li et al., 2018; Pei and Yan, 2018; Pei et al., 2018; Shi et al., 2019). Haze pollution is associated with a high concentration of particulate matter with a diameter of less than 2.5 µm (PM2.5) and low visibility, which is harmful to human health (e.g., cardiovascular and respiratory diseases and lung cancer) and puts pressure on, among other things, public transportation and economic activities (Wang et al., 2013).
The serious impacts of haze pollution in Beijing have been the topic of numerous studies. High emissions of haze pollutants (e.g., black carbon and organic matter) contribute greatly to the formation of hazy weather in Beijing (Li and Han, 2016; Wu et al., 2016; Li et al., 2017). In addition, the atmospheric and meteorological conditions as well as external and remote influences, such as Arctic sea-ice concentration (SIC), snow cover across Siberia and sea surface temperatures (SSTs), also need to be taken into consideration (An et al., 2019; Wang et al., 2020; Yin and Wang, 2016, 2018). Atmospheric circulations that are favorable for hazy weather in Beijing include a weak East Asian winter monsoon (EAWM), a shallow East Asian trough and a northward shift of the East Asian jet (Chen and Wang, 2015; Zou et al., 2017; Pei et al., 2018; Wang et al., 2020). These circulations tend to reduce the intrusion of cold air to Beijing and hence result in poor ventilation in winter (Zou et al., 2017; Pei et al., 2018). Furthermore, teleconnection patterns and wave trains also have potential impacts on haze over Beijing (Yin and Wang, 2017; Yin et al., 2017; Chen et al., 2019, 2020a, b; Zhang et al., 2019; Lu et al., 2020). Yin et al. (2017) analyzed the role of the positive phases of the East Atlantic/West Russia (EA/WR+) pattern, the western Pacific pattern and the Eurasia pattern in the increased number of hazy days over the North China Plain. They found that these climatic anomalies can lead to meteorological conditions that are conducive to the formation of haze pollution through modulating the anticyclonic anomalies over North China (Yin and Wang, 2017; Yin et al., 2017). The positive phase of the Arctic Oscillation (AO+) pattern can also increase the number of hazy days in Beijing (Lu et al., 2020). Years with a high AO index are accompanied by a weakened East Asian trough and a weakened Siberian High, which suppress the horizontal and vertical diffusion of haze pollutants (Lu et al., 2020). Chen et al. (2019) stressed the role of the positive phase of the North Atlantic Oscillation (NAO+), which is related to AO+, in inducing an anticyclone over northeast China, which favors haze pollution in North China in spring. Chen et al. (2020b) also studied autumn haze and found that the relative importance of the external drivers seems to differ across the individual months of September, October and November. In addition, the winter haze weather in Beijing is directly affected by the local meteorological conditions. Many studies have suggested that static and relatively warm air, weakened northerly or even southerly winds, temperature, inversion and downward air motion in the planetary boundary layer can suppress the dispersal and advection of haze pollutants (Wang et al., 2014; R. Zhang et al., 2014; Z. Zhang et al., 2016; Wu et al., 2017; H. Wang et al., 2019; Zhong et al., 2019; Callahan and Mankin, 2020).
In addition, a reduction in Arctic Sea ice in autumn (as documented by Simmonds and Li, 2021) can increase the number of subsequent winter haze days through weakening wave activity over eastern China (Wang and Zhang, 2015; Zou et al., 2017). Zou et al. (2017) also revealed that increased Eurasian snowfall in early winter leads to regional circulations unfavorable to the ventilation of pollutants. In addition, autumn Beaufort Sea ice is closely connected with the number of early winter haze days in North China (Yin et al., 2019a; Li and Yin, 2020), while an increase in early winter Chukchi Sea ice can intensify February haze pollution in North China (Yin et al., 2019b). The changes in sea ice in both the Beaufort Sea and the Chukchi Sea are linked to hazy weather in North China via modulated large-scale atmospheric circulations (e.g., the East Asian trough and teleconnections). SSTs in both the Atlantic and Pacific oceans have potential impacts on the occurrence of hazy weather (Xiao et al., 2015; Pei et al., 2018; J. Wang et al., 2019). Winter haze days in China are also associated with SST anomalies over the North Atlantic on decadal and interannual timescales via the Atlantic multidecadal oscillation, and they are also related to SSTs over the South Atlantic on the interannual timescale by anomalous southerly airflow (Xiao et al., 2015). Pei et al. (2018) found that positive SST anomalies over the northwest Pacific are conducive to more winter haze days in Beijing through weakening of the EAWM system. J. Wang et al. (2019) also suggested that the interannual variability in autumn haze days in the Beijing–Tianjin–Hebei region is associated with a wave train induced by SSTs in the subtropical North Atlantic and a local meridional cell induced by SSTs in the western North Pacific.
Persistent haze events correspond to continuous pollution for several days, which not only has a broad impact on human life (through traffic jams, for example) but also threatens human health in many ways. In this study, we gain a better understanding of the physical processes and mechanisms of the persistent haze over Beijing. Local meteorological conditions are directly associated with hazy weather and usually show diurnal variations (Zhang et al., 2014; J. Li et al., 2018; Li et al., 2019), while external influences, which vary slowly, play key roles in explaining the interannual and interdecadal variabilities in hazy weather (Wang et al., 2020). On intraseasonal timescales, large-scale atmospheric circulations (e.g., teleconnections and wave trains) can bridge the timescales of local meteorological conditions and external forces. Large-scale atmospheric circulations can be modulated by external forces and can influence local meteorological conditions. In previous studies, the atmospheric patterns associated with hazy weather were mainly obtained from linear correlation or composite analysis based on interannual or longer timescales (Yin and Wang, 2017; Yin et al., 2017; Chen et al., 2019; Lu et al., 2020). However, the evolution of the atmospheric circulations and their roles in the formation of hazy weather (especially persistent haze events) from daily to intraseasonal timescales are not clear. Thus, a more in-depth analysis of daily-to-weekly changes is needed to determine a more robust relationship between haze and atmospheric circulation and to test whether certain circulation patterns can help to improve the predictability of haze days and persistent haze events.
In this study, we focus on persistent winter haze over Beijing and the corresponding large-scale atmospheric circulations from the perspective of interannual and daily-to-weekly timescales. In particular, we examine the role of a western-type NAO+ pattern in the increase of haze on the interannual timescale and the improvement of forecast skill for winter haze on the daily-to-weekly timescale. Furthermore, we investigate the SST and Arctic Sea ice conditions that have been proposed as drivers of large-scale atmospheric circulations.
2.1 Data
The observed relative humidity and visibility at 20 stations across Beijing at four local times (02:00, 08:00, 14:00 and 20:00 LT) each day from 1980 to 2016 during the winter (December, January and February, denoted DJF) were obtained from quality-controlled station observations at the National Meteorological Information Center of China. The daily means of these variables were then calculated. Reanalysis data were taken from the European Centre for Medium-Range Weather Forecasts (ECMWF) ERA-Interim on a 1∘ × 1∘ grid (Dee et al., 2011). The variables included daily 500 hPa geopotential height (Z500), horizontal winds at 300 and 500 hPa, SST, SIC and sea-level pressure (SLP). We also used monthly SST and SIC data from the Hadley Centre Global Sea Ice and Sea Surface Temperature (HadISST) dataset (Rayner et al., 2003).
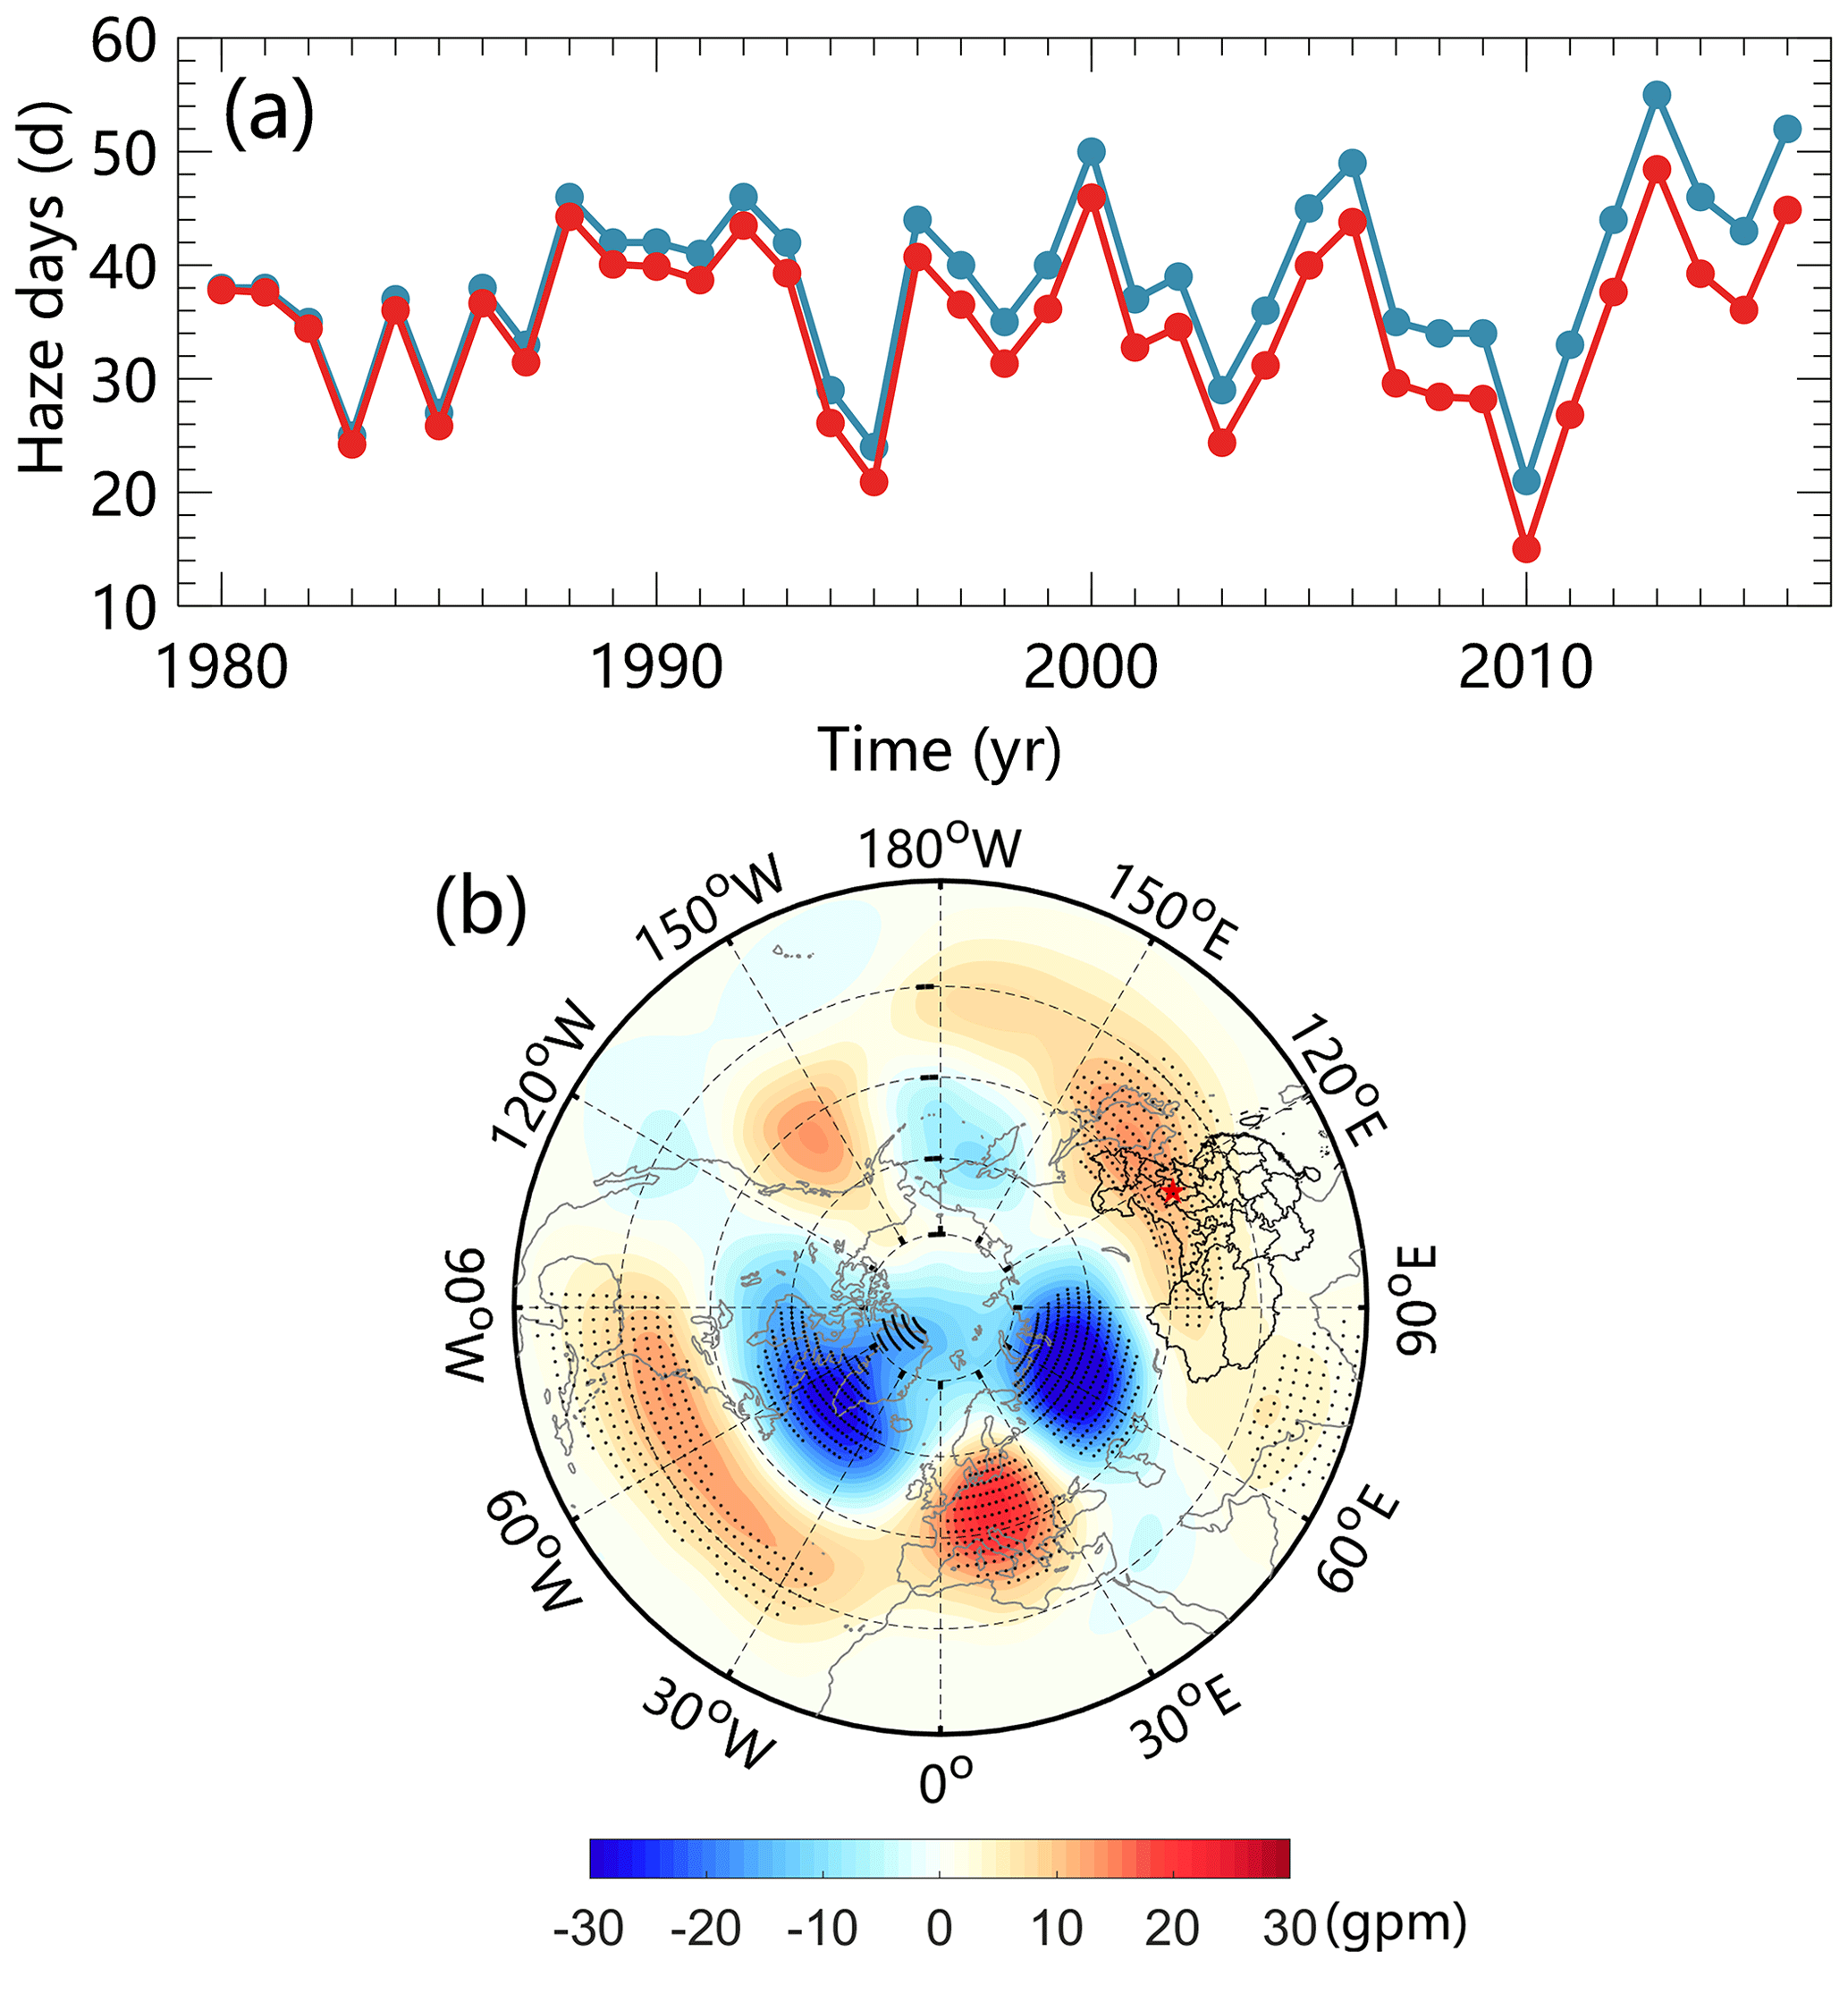
Figure 1(a) Time series of winter haze days (blue) and detrended winter haze days (red) in Beijing from 1980 to 2016. To aid visualization, a fixed value is added to all the detrended data so that the first values of both series coincide. (b) Regressed Z500 anomalies (shading; units: gpm) against the detrended winter haze days. The dotted areas show values that are above the 95 % confidence level based on a two-sided Student's t test. For all plots in this study, the red star denotes the location of Beijing.
We used the normalized NAO index and EA/WR index from the National Oceanic and Atmospheric Administration/Climate Prediction Center (NOAA/CPC). Our investigation also employs a second NAO index, which is a modification of the NAO index proposed by Li and Wang (2003). Their index was taken as the difference in the normalized SLP, zonally averaged from 80∘ W to 30∘ E, between 35 and 65∘ N. They commented that this measure “provides a much more faithful and optimal representation of the spatial–temporal variability associated with the NAO”. We have slightly modified the Li and Wang (2003) definition by conducting our sector averaging over 80–10∘ W, instead of the original 80∘ W–30∘ E, and the newly calculated index is called the western-type NAO (WNAO) index. This modification is made because the longitudinal range of Li and Wang (2003) includes both the North Atlantic and part of the European continent. Atmospheric circulations associated with Beijing haze in our investigation involve both a blocking anticyclone over Europe and an NAO+ pattern (Fig. 1a). When the anticyclone over Europe and the NAO+ pattern occur concurrently, the center of the north pole of the NAO+ pattern is shifted westward, which displays a western-type NAO+ pattern. Although the NAO pattern is coupled with the anticyclone over Europe, the modified WNAO index could better reflect the strength of the north–south dipole over the Atlantic, regardless of the impact of the anticyclone over Europe. This concept was first proposed by Yao and Luo (2014), who divided the NAO into the eastern-type NAO (ENAO) and the western-type NAO (WNAO). They proposed this definition for the purpose of revealing the different relationships between these two types of NAO and the downstream blocking (e.g., the Euro–Atlantic blocking), temperature and precipitation. Some detailed NAO studies (Yao and Luo, 2014; Luo et al., 2014; Yao et al., 2016) have also revealed the disadvantages of the conventional NAO indices in the identification of the spatial structures of the NAO pattern and have suggested that the zonal position and inclination of the NAO dipole could change the occurrence of extreme weather events. Below, we will see that the WNAO index has a closer relationship to the Beijing haze frequency and better represents the background circulation of the persistent haze events.
2.2 Definition of persistent haze events
Haze is generally defined in terms of relative humidity and visibility (World Meteorological Organization, China Meteorological Administration, UK Met Office). Some studies also define haze in terms of thresholds of PM2.5 concentrations (Cai et al., 2017; Callahan and Mankin, 2020). As the PM2.5 data are not available for a long time period and thus cannot cover our study period, we use a definition more applied to meteorological range. In the Specifications for surface meteorological observation compiled by the China Meteorological Administration (2004), haze is defined as a weather phenomenon with a large amount of extremely fine dust particles evenly floating in the air that reduces the horizontal visibility to less than 10 km. As visibility can also be reduced by fog, a relative humidity threshold is also applied to distinguish hazy weather from fog. Many previous studies (Wu, 2006, 2008; Yang et al., 2016; Pei et al., 2018; He et al., 2018) have proposed that fog is associated with a relative humidity greater than 90 %. Therefore, we use a daily mean relative humidity of less than 90 % and a visibility of less than 10 km as the criteria to define winter haze days in this study (Pei et al., 2018; Chang et al., 2020). Persistent haze events are defined as periods for which haze occurs for at least 5 consecutive days. The day with the minimum visibility within a persistent haze event is defined as Day 0, which is the most prominent haze day, and the days before (after) Day 0 signify the growth (decay) of the haze event.
3.1 Interannual timescale
To show the context of the relationship between Beijing winter haze weather and atmospheric circulations, in Fig. 1a we show the time series of the number of winter haze days (blue line) and detrended winter haze days (red line) from 1980 to 2016. The linear trend (+1.9 d decade−1) of the number of winter haze days in Beijing is not significantly different from zero (P=0.10), which is consistent with previous studies (Chen and Wang, 2015; Pei et al., 2018, 2020), and its interannual variability is quite large. Many factors could affect the interannual variation in the number of winter haze days, including changes in emissions, emission reduction measures and climate variables (e.g., meteorological conditions, atmospheric circulation and SSTs) (Dang and Liao, 2019; Wang et al., 2020; Pei et al., 2020). Pei et al. (2020) pointed out that anthropogenic emissions showed an increasing trend before 2012 and a decreasing trend thereafter, which can be attributed to a Clean Air Action Plan introduced in 2013, and these trends with opposite sign could explain the absence of a significant trend in the number of hazy days. Thus, we undertake our investigation with detrended data to explore the influences that are associated with the interannual variation in the number of hazy days. In addition, the long-term trends are removed for winter haze days and other variables in the following analyses.
We focus first on the role of atmospheric circulation in inducing hazy weather on the interannual timescale. The detrended winter haze days are significantly correlated with circulation patterns in the Z500 anomaly field (Fig. 1b). A wave train of wavenumber-3 structure dominates the mid–high latitudes; three cyclones are situated over the Greenland region, the Ural region and the Sea of Okhotsk with positive geopotential height anomalies in between. The NAO+ and EA/WR+ teleconnections patterns have been suggested to be connected with winter haze days in Beijing (Yin and Wang, 2017; Yin et al., 2017; Chen et al., 2019). Barnston and Livezey (1987) have shown that the NAO+ pattern is made up of negative geopotential height anomalies in the high latitudes of the North Atlantic (Greenland) and positive anomalies over the central North Atlantic, extending into the eastern United States and western Europe. The EA/WR+ pattern is associated with positive geopotential height anomalies over Europe and northern China and negative anomalies located over the central North Atlantic and the northern Caspian Sea. Following Barnston and Livezey (1987), we can say that Fig. 1b demonstrates a western-type NAO+ pattern over the North Atlantic, as this pattern is situated farther west and co-occurs with a blocking anticyclone over Europe. In addition, a quadrupole mode from the North Atlantic to northern China shares some similarities with an EA/WR+ pattern, but there are some differences. On the one hand, two negative geopotential height anomalies are located over the northern North Atlantic and the northern Ural region, which are farther north than the two cyclones of the EA/WR+ pattern. On the other hand, the EA/WR+ pattern shows a zonal wave train structure; only when the cyclone (north center of the western-type NAO+ pattern) over the North Atlantic is excluded can a tripolar mode from Europe to northern China manifest a zonal wave train structure.
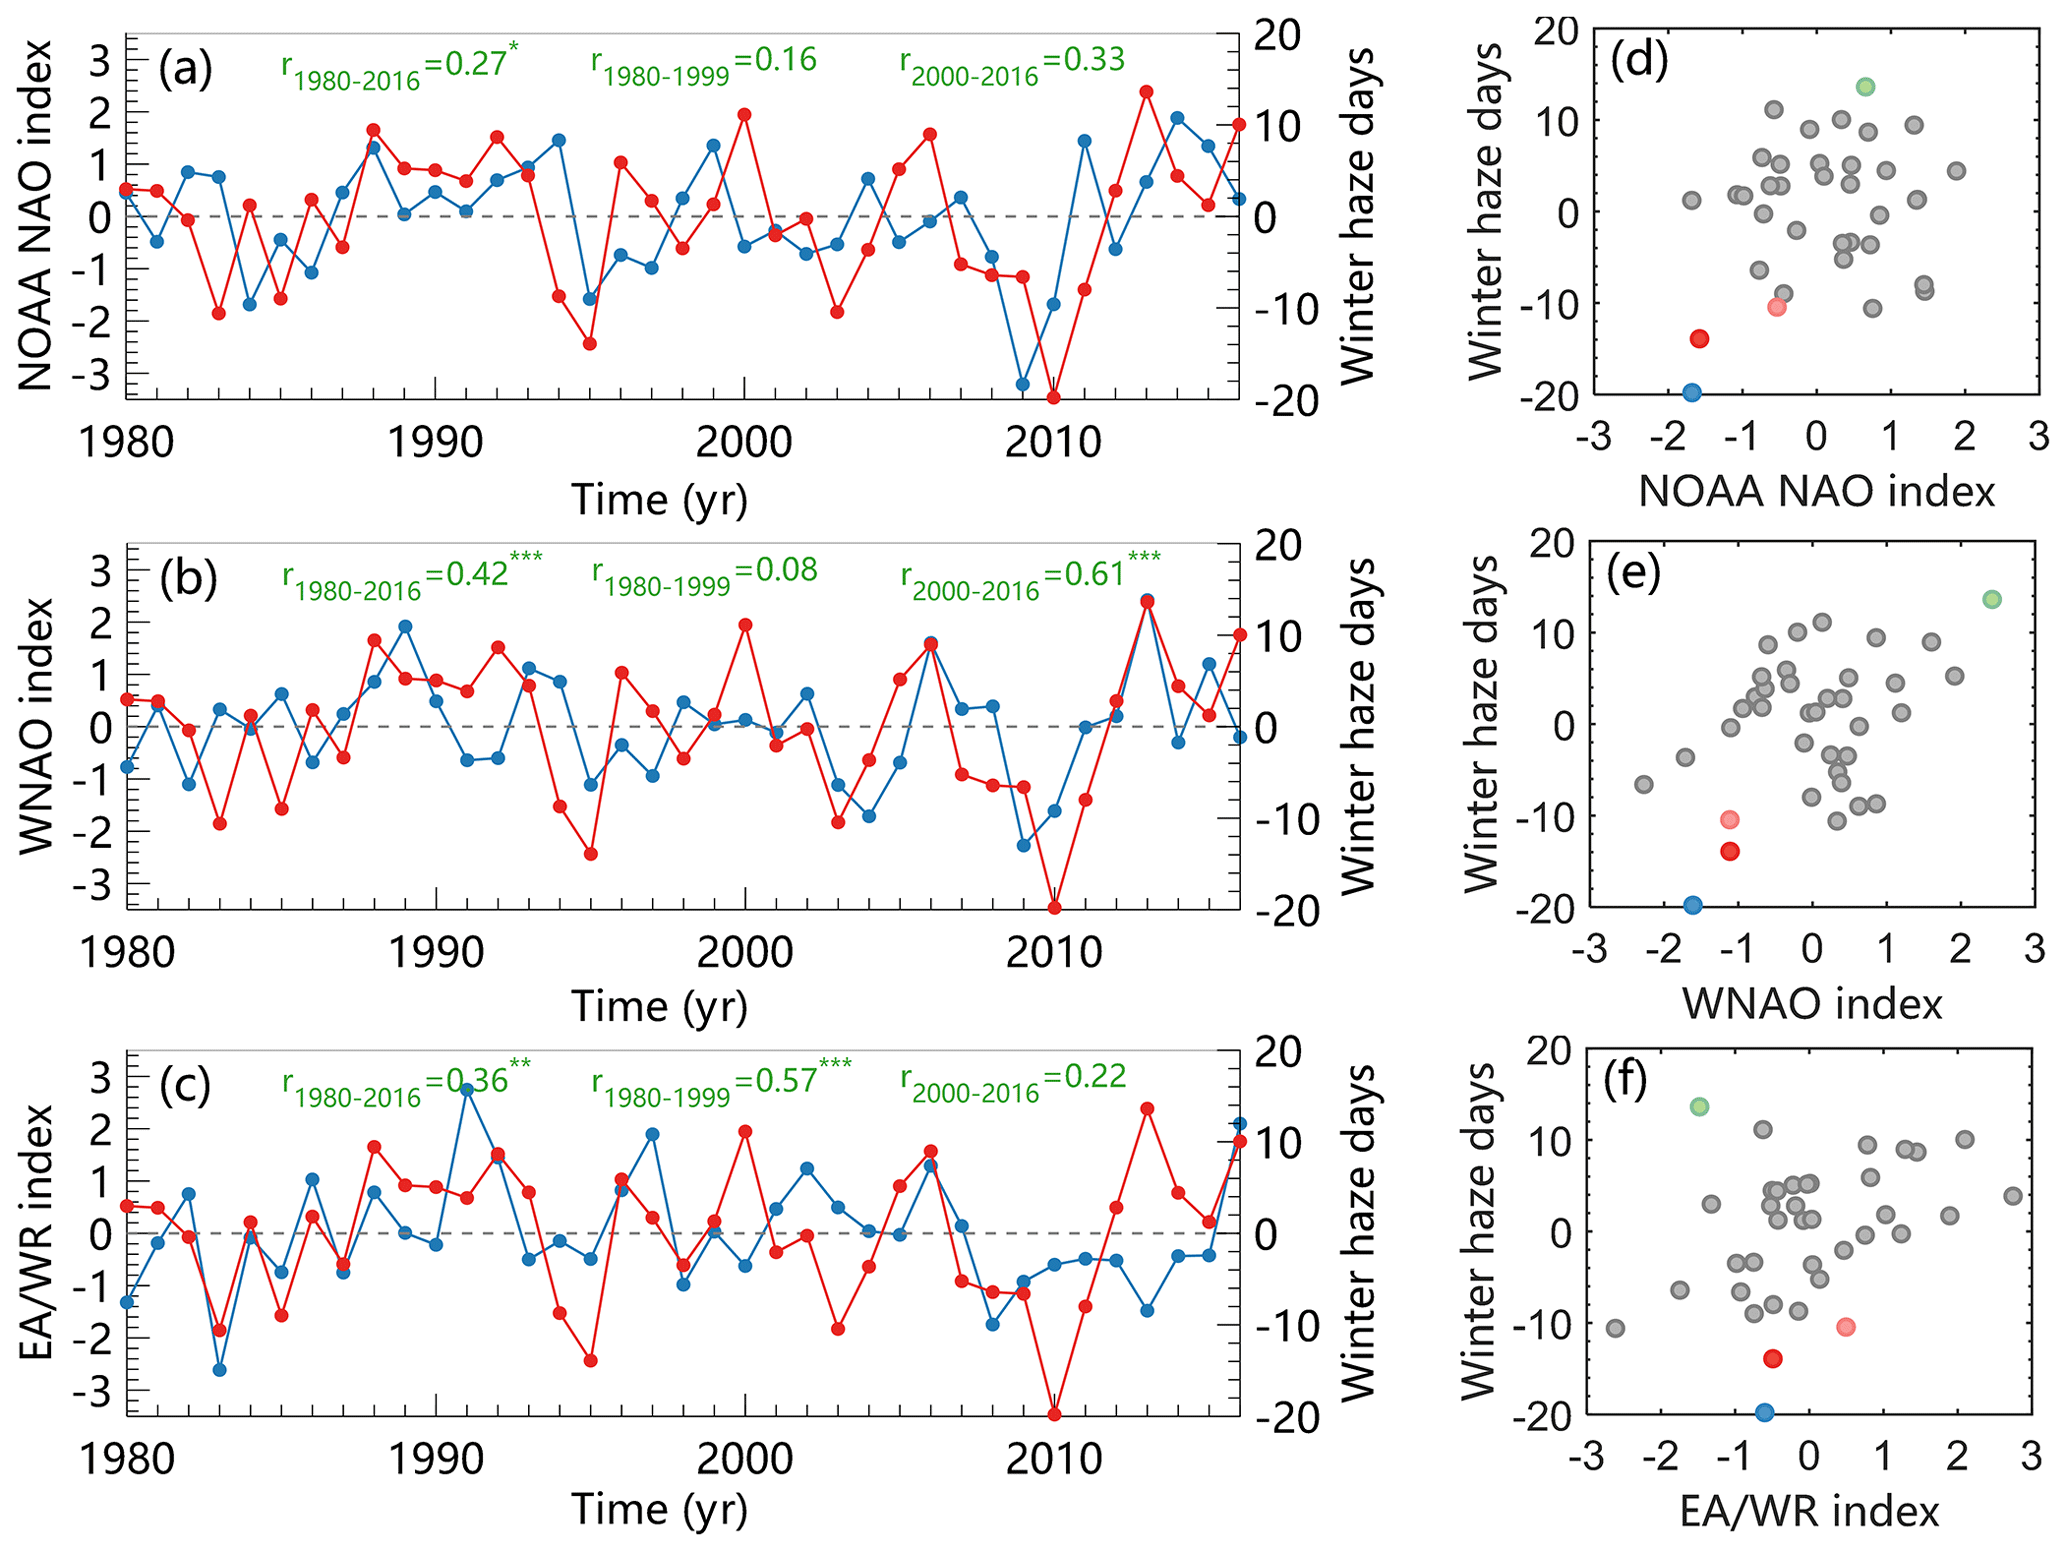
Figure 2Time series of detrended winter haze days (red) and (a) NOAA NAO index (blue), (b) WNAO index (blue) and (c) NOAA EA/WR index (blue). Correlation coefficients between winter haze days and the three indices during the periods 1980–2016, 1980–1999 and 2000–2016 are labeled at the top of each panel. The 90 %, 95 % and 99 % confidence levels for the Student's t test are denoted by one, two and three asterisks, respectively. Scatter diagrams of winter haze days against the (d) NOAA NAO index, (e) WNAO index and (f) EA/WR index are shown, in which the red, pink, blue and green dots represent the years 1995, 2003, 2010 and 2013, respectively.
To further understand the relationships between winter haze days in Beijing and the teleconnection patterns of the NAO and EA/WR, we present the annual variations in winter haze days, the NAO index and EA/WR index from NOAA/CPC, and the WNAO index in Fig. 2. Their correlation coefficients are calculated over the time periods 1980–2016, 1980–1999 and 2000–2016. The correlations between winter haze days and the NOAA/CPC NAO index are 0.27, 0.16 and 0.33, respectively, and only the correlation for the entire 1980–2016 period is significant at the 90 % confidence level (Fig. 2a). Correlation coefficients between winter haze days in Beijing and the WNAO index are considerably larger for the 1980–2016 and 2000–2016 periods, being 0.42 (P < 0.01) and 0.61 (P < 0.01), respectively, while the correlation coefficient (0.08) is much smaller (and not significant) for the period 1980–1999 (Fig. 2b). This indicates that the WNAO index more strongly reflects the relationship between the north–south dipole mode over the North Atlantic and winter haze days in Beijing. The correlation with the EA/WR index is slightly lower than that with the WNAO index for the entire period (0.36, P < 0.05) but considerably higher (0.57, P < 0.01) when only the first 20 years of the record are considered (Fig. 2c). Overall, we see that the EA/WR+ pattern has a closer relationship with hazy weather in Beijing before 2000, whereas the western NAO+ pattern is dominant after that date. It is also worth noting that the extreme numbers of winter haze days more closely correspond with the magnitude of the WNAO index (Fig. 2d–f). We can see that the extremely low numbers of hazy days in the winters of 1995, 2003 and 2010 occur simultaneously with low (normalized) WNAO values of −1.11, −1.11 and −1.61, respectively, whereas the winter of 2013 with an extremely high number of hazy days has a large WNAO value of 2.42 (Fig. 2e). However, such correspondences are weaker for the NOAA NAO index (Fig. 2d) and could not be found in the case of the EA/WR index (Fig. 2f).
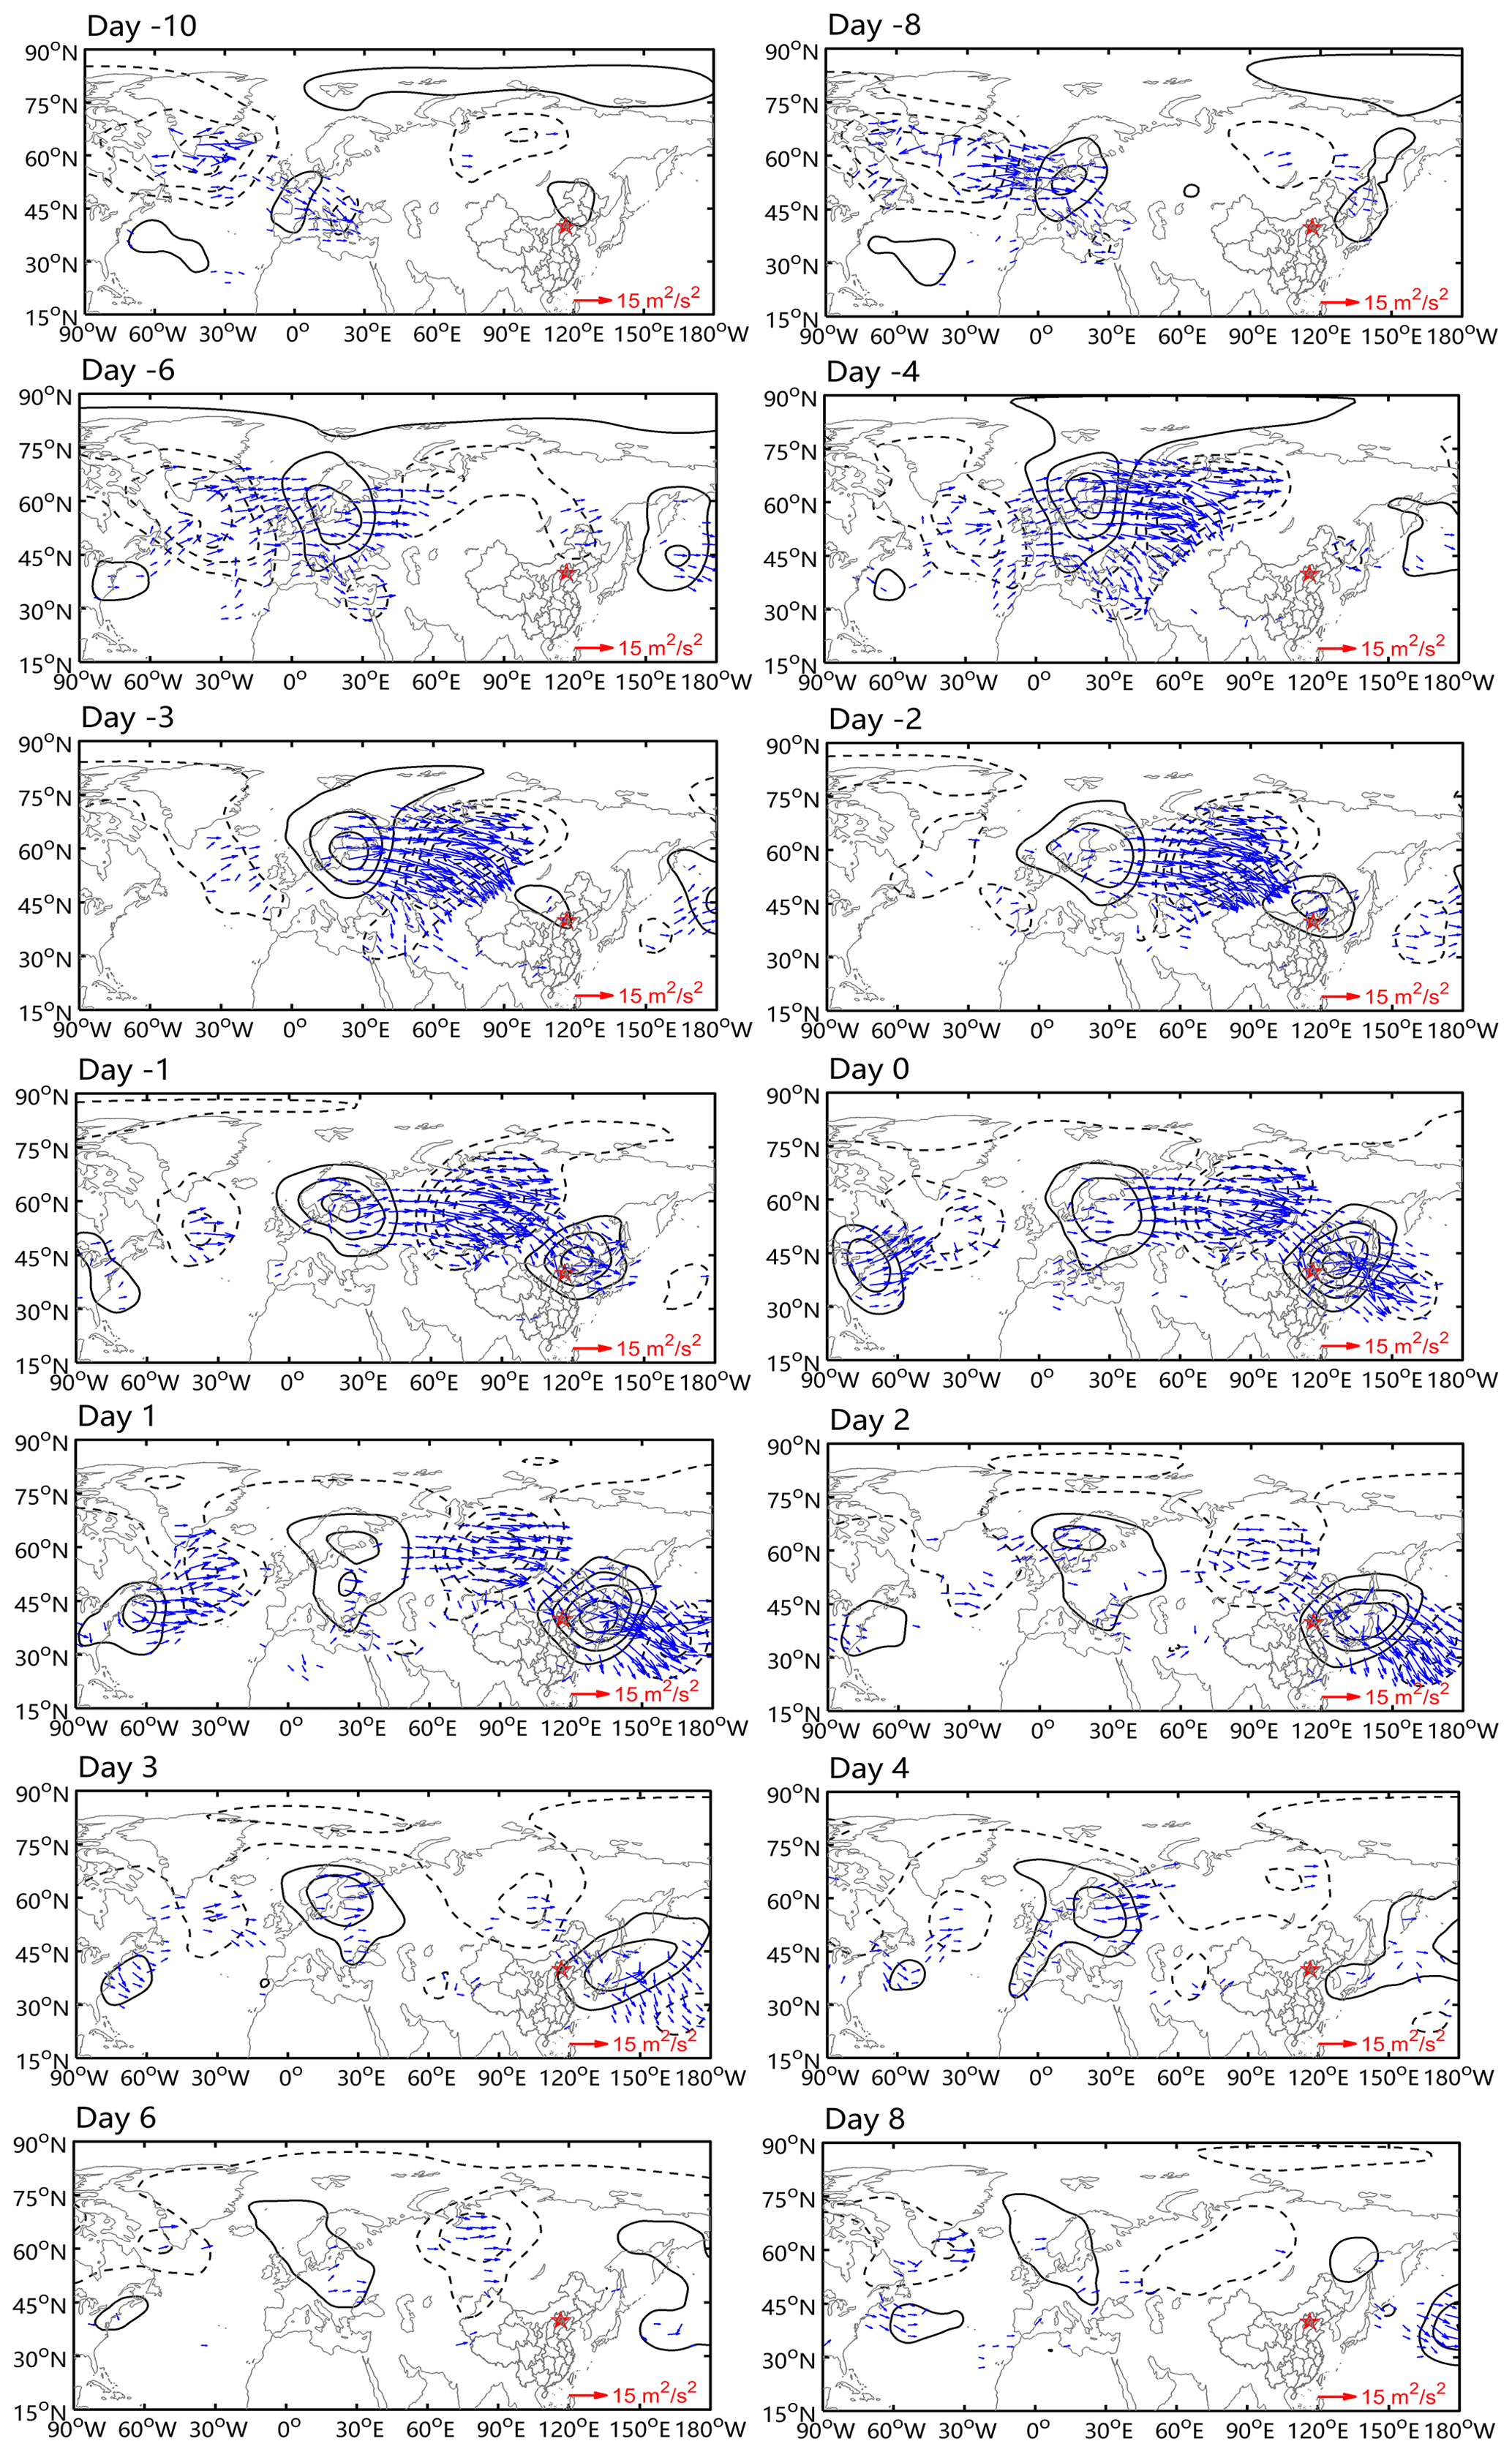
Figure 3Instantaneous fields of the composite daily Z500 anomalies (contours, interval = 20; units: gpm) and horizontal components of wave activity developed by Takaya and Nakamura (2001) (arrows; units: m2 s−2) from Day −10 to Day 8 for the 65 persistent haze events.
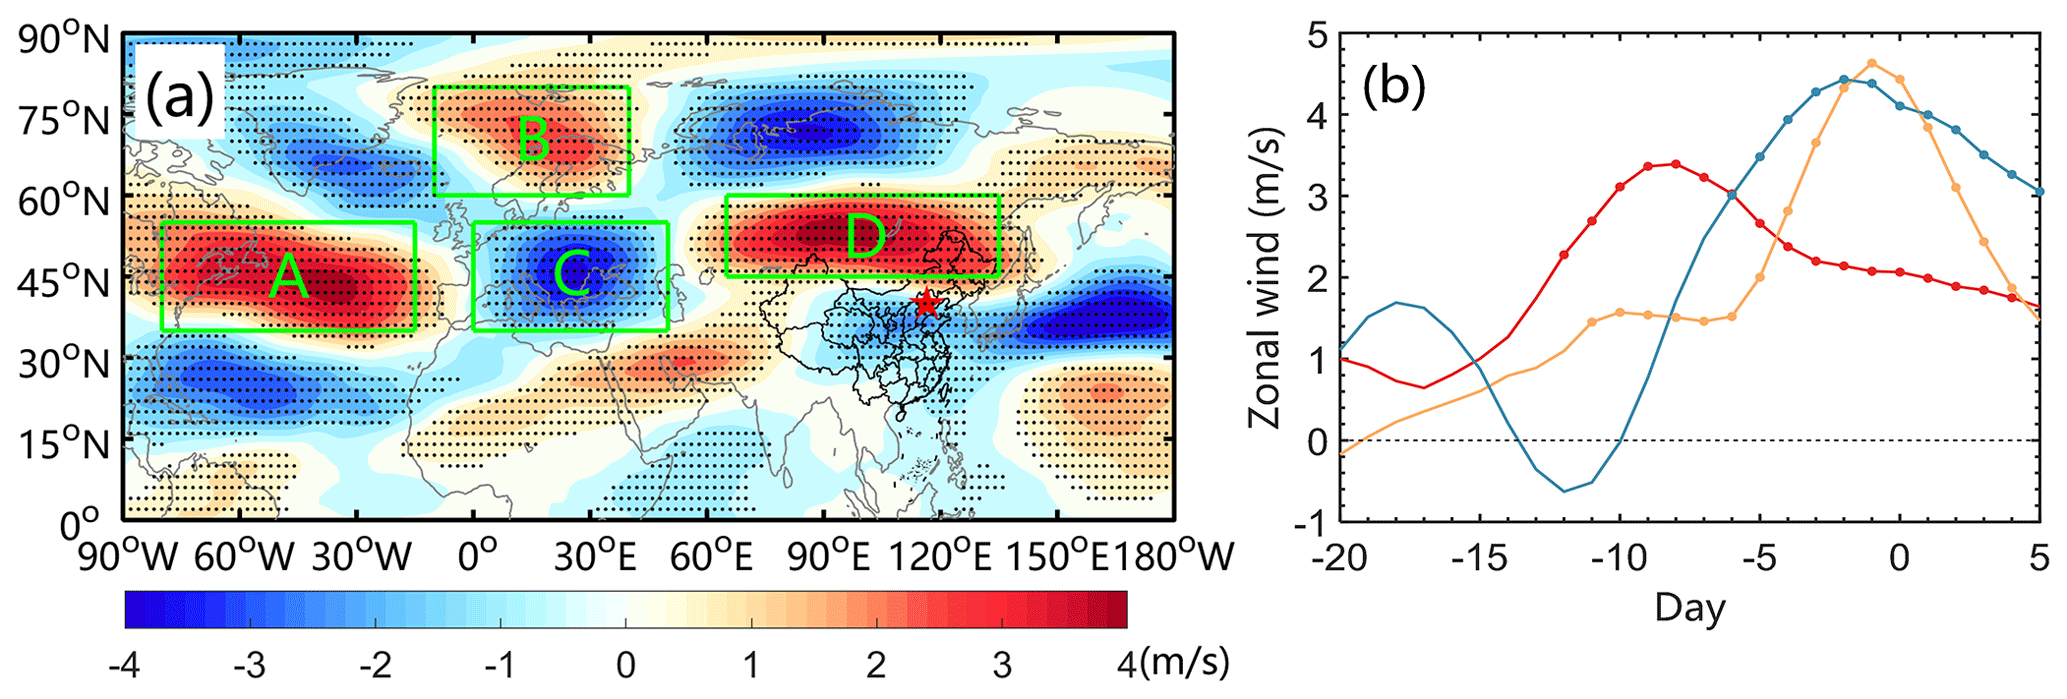
Figure 4(a) Composite 300 hPa zonal wind anomalies (shading; units: m s−1) between Day −10 and Day 5 for the 65 persistent haze events. The dotted areas show values that are above the 95 % confidence level based on a two-sided Student's t test. (b) Composite daily time series of region-averaged 300 hPa zonal wind anomalies in region A (80–15∘ W, 35–55∘ N) (red) and region D (65–135∘ E, 45–60∘ N) (orange) and the difference in region-averaged zonal wind anomalies between region B (10∘ W–40∘ E, 60–80∘ N) and region C (0–50∘ E, 35–55∘ N) (blue). The dots denote the days with values that are above the 95 % confidence level for the two-sided Student's t test.
3.2 Daily-to-weekly timescale
To cast further light on the above results, we have identified all the persistent haze events during 1980–2016 and explored the daily progression of the circulation structures that led up to (up to 10 d before) and followed (out to 8 d) the 65 identified persistent haze episodes. To accomplish this, we formed composites (across the 65 episodes) of daily Z500 anomalies and the horizontal components of wave activity flux (Takaya and Nakamura, 2001) (Fig. 3). From Day −10 to Day −8, a WNAO+ pattern can be identified over the North Atlantic, and the wave activity flux propagates downstream from the northern pole of the WNAO+ pattern to a weak anticyclone over Europe. Compared with the NAO pattern in the study by Li and Wang (2003), the north–south dipole mode of the WNAO pattern here is situated farther to the west and is accompanied by an anticyclone over Europe. These structures further emphasize the value of using our modified NAO index in this study. From Day −6 to Day −4, the weak anticyclone over Europe strengthens and a cyclone develops over western Russia following the propagation of wave activity. Simultaneously, the WNAO+ pattern weakens and shows a northeast–southwest inclination. From Day −3 to Day −2, an EA/WR+ pattern starts to appear in the mid to high latitudes. At this time, a zonal wave train that propagates from a cyclone over the North Atlantic, through an anticyclone over Europe and a cyclone over the west of Lake Baikal, to East Asia leads to the formation of an anticyclone over northeastern China. On Day −1, an anticyclone forms over the Gulf Stream region, which continues to provide wave activity to the development of downstream circulation. This anticyclone sustains the wave train propagating to northeastern China. As a result, the anticyclone over northeastern China persists for a total of 7 d from Day −3 to Day 3 and then moves eastward to the North Pacific. The wave train structure dissipates from Day 4, and the anomalous atmospheric circulation around Beijing becomes weaker.
From the daily evolution of atmospheric circulation, we find that certain teleconnection patterns (WNAO+ and EA/WR+) and wave trains lead to persistent haze events in Beijing. In the whole process, the WNAO+ pattern seems to be the origin of the transmission and the EA/WR+ pattern acts as a subsidiary mode that transfers the wave activities from the WNAO+ pattern to the downstream anticyclone over northeastern China. This sequence is consistent with the variations of zonal winds, as they act as waveguides for the propagation of wave trains (Ambrizzi et al., 1995; Fang et al., 2001; Athanasiadis et al., 2010; Wang and Zhang, 2015; Martinez-Asensio et al., 2016; Wirth et al., 2018; Rudeva and Simmonds, 2021). Zonal wind anomalies at 300 hPa are composited between Day −10 and Day 5 for the 65 persistent haze events to explain the evolution of large-scale circulations and to ascertain whether potential predictors exist (Fig. 4a). Corresponding to the propagation of the WNAO+ and EA/WR+ patterns, significantly intensified or weakened anomalous zonal wind centers can be clearly identified from the North Atlantic to East Asia. The negative–positive–negative zonal wind tripolar mode over the North Atlantic reflects the WNAO+ pattern, whereas the arched structure of the anomalous zonal wind from Greenland, passing through high latitudes to northern China, manifests in the EA/WR+ pattern. To track the daily variations in anomalous zonal winds, significantly increased zonal wind anomalies over the central North Atlantic, the Scandinavian Peninsula and the north of China are used as three indicators (Fig. 4b). The amplitude of the anomalous zonal wind over the central North Atlantic peaks at Day −8, which corresponds to the dominance of the WNAO+ pattern from Day −8 to Day −10 in Fig. 3. Although the zonal wind in this region weakens after Day −8, it retains significantly high values until Day 4. Simultaneously with the significantly increased zonal wind over the central North Atlantic, the difference in the zonal wind over the south of the Scandinavian Peninsula and the zonal wind over North China also show significant positive anomalies starting from Day −11 and Day −5, respectively. The difference in the zonal wind over the south of the Scandinavian Peninsula reaches its highest point on Day −2 when the EA/WR+ pattern can be clearly identified in Fig. 3, whereas the anomalous zonal wind over the north of China reaches a peak on Day −1. From the analyses above, we can see that the three indicators of anomalous zonal winds well reflect the sequential occurrence of teleconnection patterns related to persistent haze events.
The above analysis demonstrates that the formation of the persistent haze weather in Beijing is closely related to the WNAO+ and EA/WR+ patterns. Although both patterns are essential in the persistent haze formation, the WNAO+ pattern plays the role of the starting point in the atmospheric transmission and leads to the formation of the persistent haze over a longer time period. In the next section, we determine whether the WNAO+ pattern is a harbinger of more persistent haze on interannual timescales and explore the extent to which the WNAO+ pattern can improve the haze prediction on the daily-to-weekly timescale.
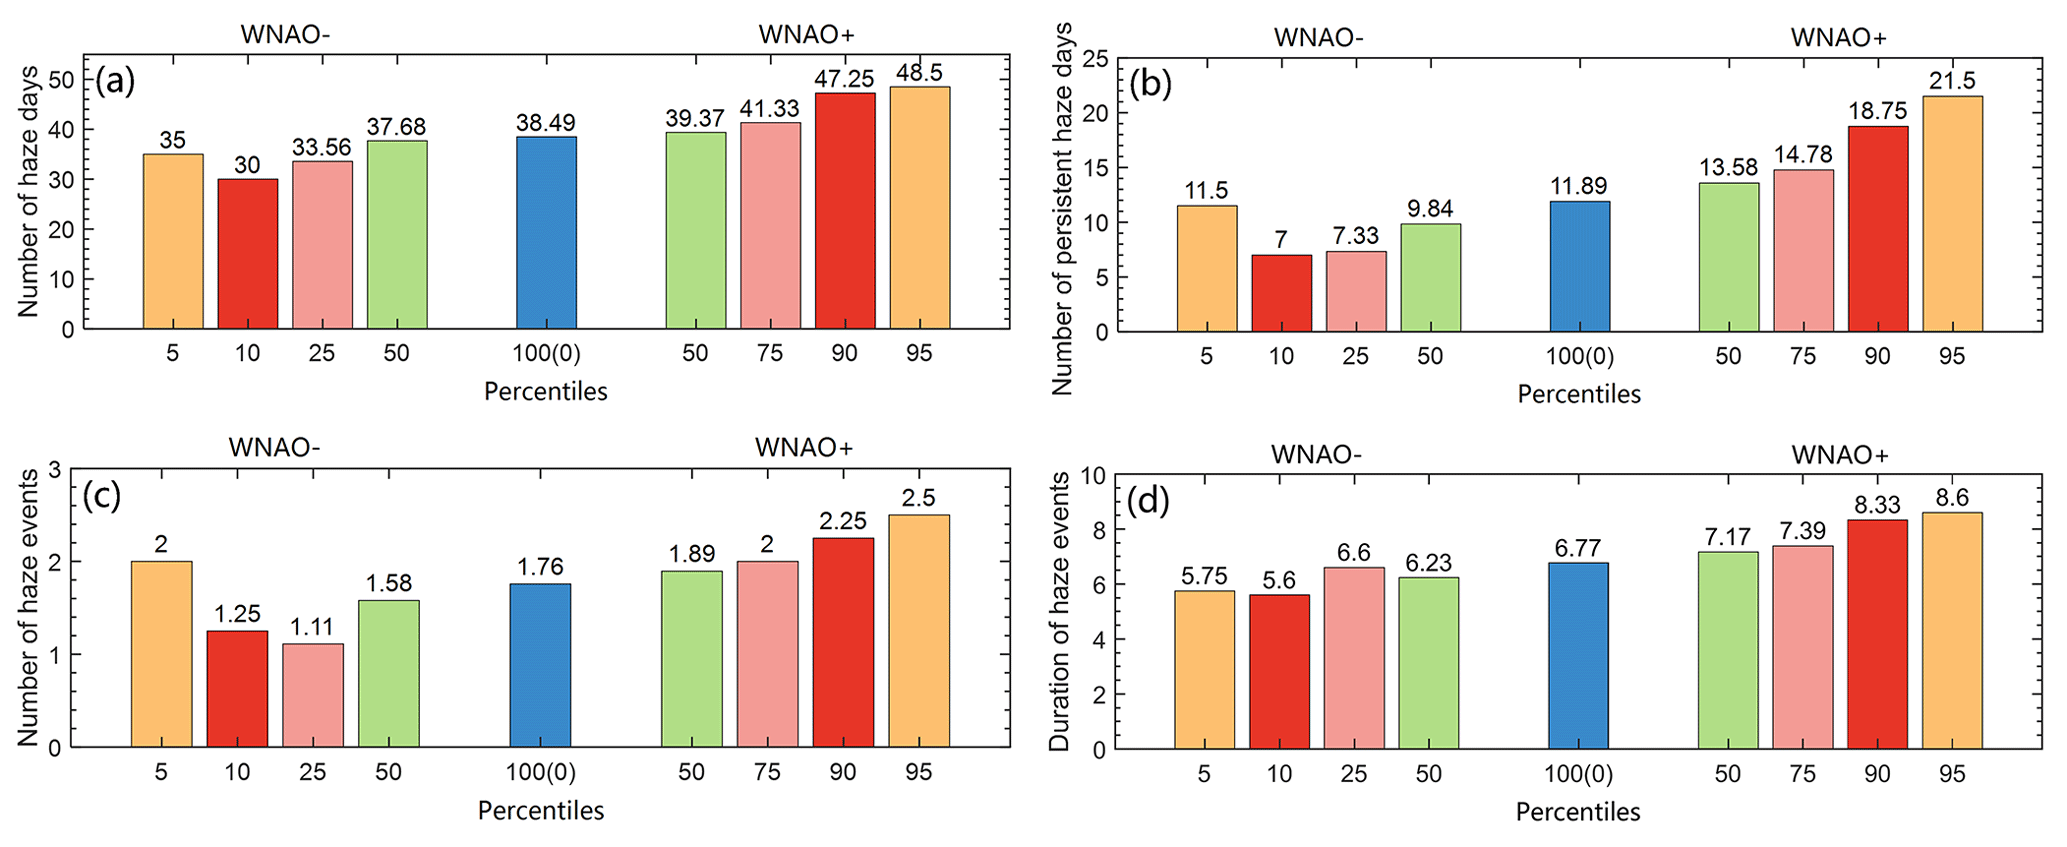
Figure 5Average number of (a) haze days, (b) persistent haze days, (c) haze events and (d) average duration of haze events (days) during WNAO− winters and WNAO+ winters. The orange, red, pink and green bars on the left and right denote winters with a WNAO index larger than the 5th, 10th, 25th and 50th percentiles (WNAO− winters) and winters with the WNAO index smaller than the 95th, 90th, 75th and 50th percentiles (WNAO+ winters), respectively. The blue bars in the middle denote the results of all the winters. The persistent haze days are defined as haze days belonging to haze events.
4.1 Interannual timescale
We first compare some characteristics of winter haze that occur in WNAO+ winters and WNAO− winters. The WNAO+ winters and WNAO− winters are classified with four sets of criteria with a view to making our results robust. We do this by stratifying the winters into above the 50th, 75th, 90th and 95th percentiles (WNAO+ winters) and below the 50th, 25th, 10th and 5th percentiles (WNAO− winters). Figure 5a shows that there are more haze days in WNAO+ winters than in WNAO− winters. For the 50th, 75th, 90th and 95th percentiles, the average number of haze days for WNAO+ winters are 4.5 %, 23.2 %, 57.5 % and 38.6 % more than their counterparts for WNAO− winters and 2.3 %, 7.4 %, 22.8 % and 26.0 % more than the average numbers of all winters (the baseline) (Fig. 5a). This suggests that the WNAO+ winters, especially winters with large-magnitude positive WNAO indices, are conducive to haze days. For the persistent haze days (that is, haze days within persistent haze events), their numbers for the WNAO+ winters are also greater than for WNAO− winters, and the same is true for the persistent haze events (Fig. 5b and c). The differences are especially large for the 90th/10th and 75th/25th percentiles. For these two sets of criteria, the numbers of persistent haze days in WNAO+ winters are 167.9 % and 101.5 % more than those in WNAO− winters (Fig. 5b), whereas the numbers of haze events in WNAO+ winters are 80.0 % and 80.0 % more than those in WNAO− winters (Fig. 5c). Compared with the average numbers of persistent haze days (events) for all the winters, the numbers for WNAO+ winters are increased by 14.2 %, 24.3 %, 57.7 % and 80.8 % (7.9 %, 13.9 %, 28.1 % and 42.3 %) at the 50th, 75th, 90th and 95th percentiles, respectively. The duration of haze events can be derived by dividing the number of persistent haze days by the number of haze events. As can be seen, the WNAO+ winters also correspond to longer persistent haze events, with the first two longest average durations, 8.3 and 8.6 d, in the winters with WNAO indices larger than the 90th and 95th percentiles, which are 2.9 and 2.7 d longer than that of winters with WNAO indices less than the 10th and 5th percentiles, respectively (Fig. 5d). These findings indicate that the WNAO+ pattern is conducive to the occurrence and the persistence of winter haze in Beijing, whereas the WNAO− pattern militates against these. These findings indicate that if we predict a strong WNAO+ winter (over the 95th percentile), we are able to prognose a 26.0 % increase in haze days, a 42.3 % increase in haze events and 1.8 d increase in haze duration compared with the condition that we do not know the prior state of the WNAO.
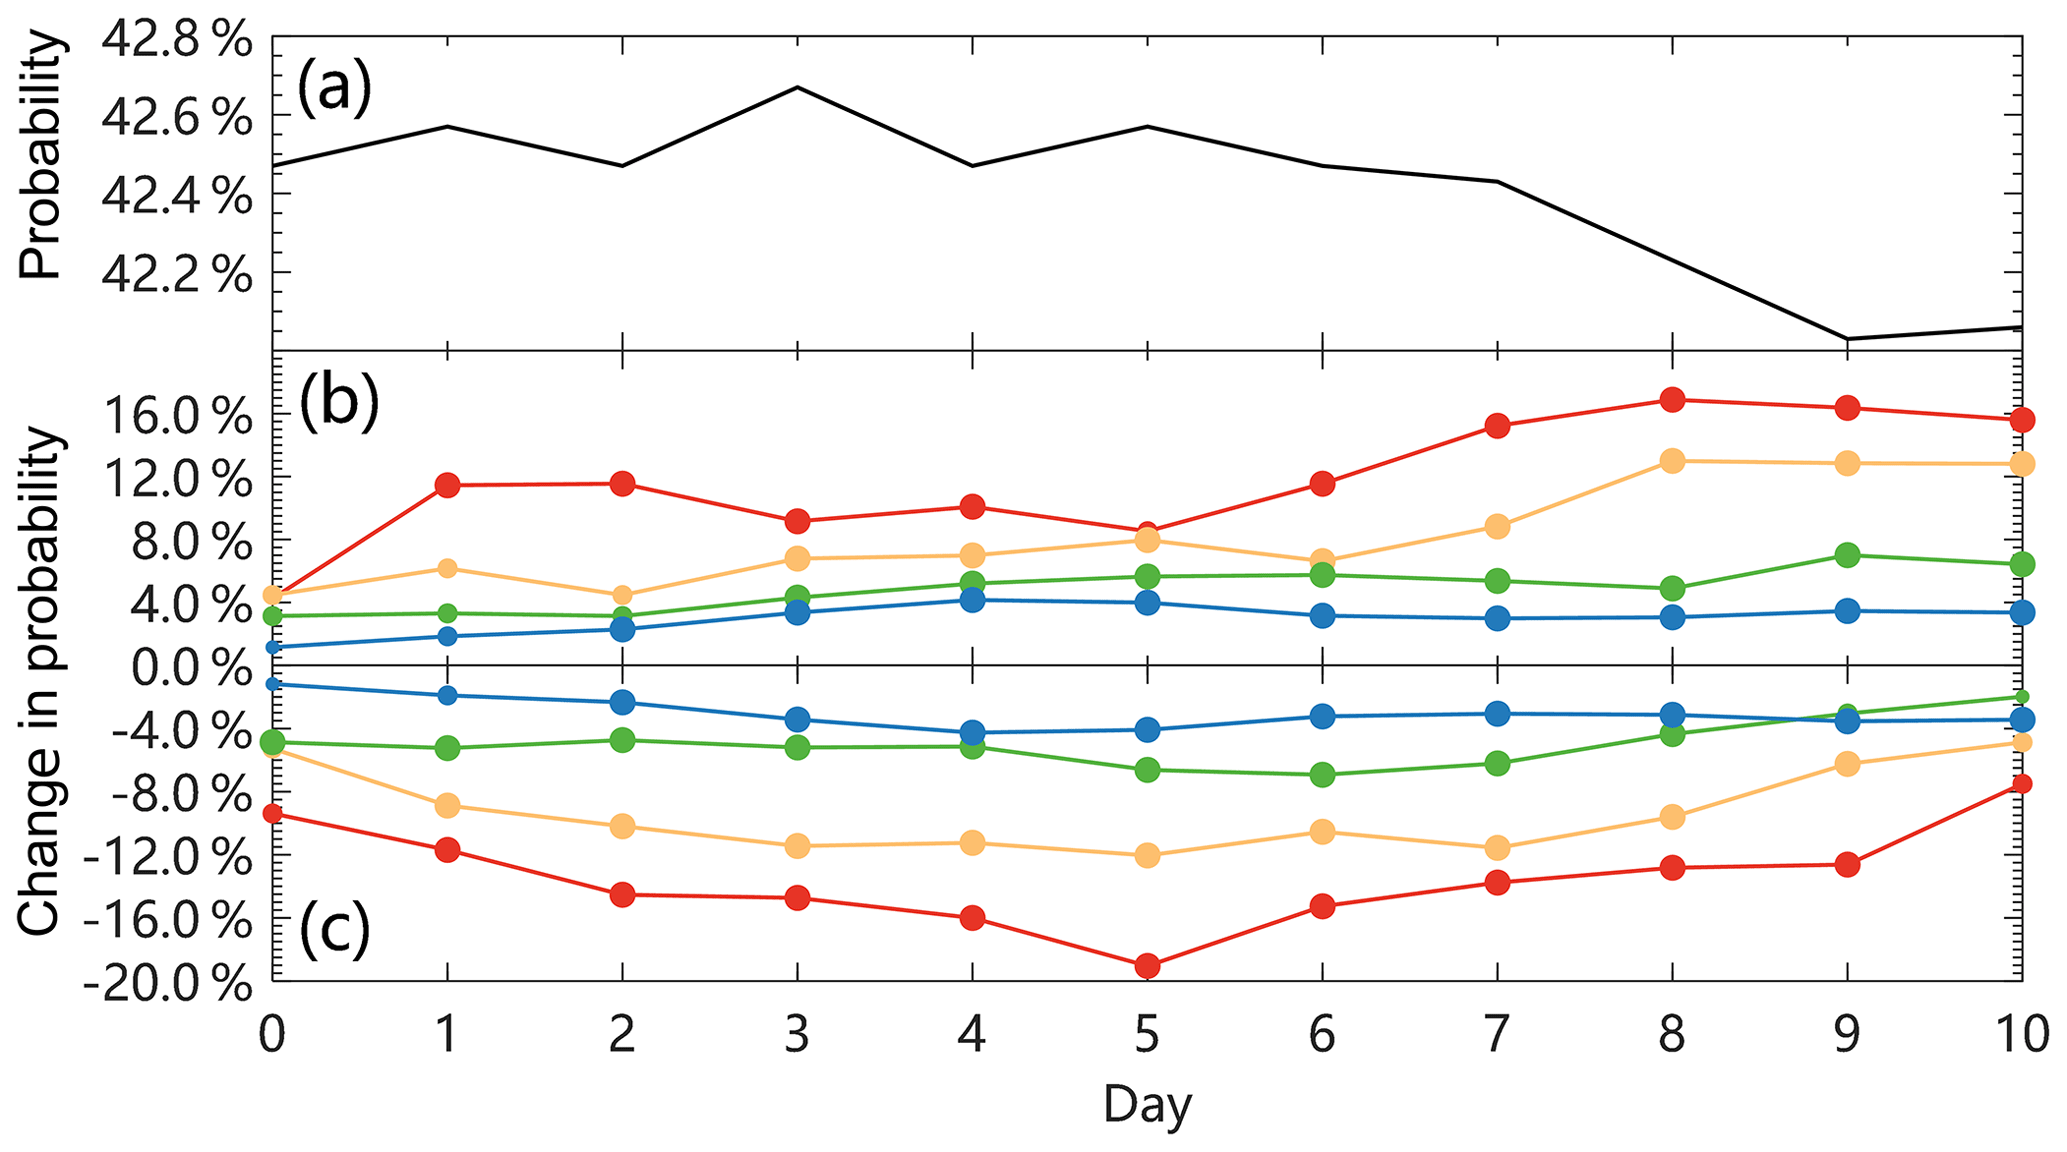
Figure 6The probability of haze day at Day i (i = 0…10) when (a) the state of the WNAO is unknown. The change in probability of haze day compared with (a) on the condition that (b) the 5 d moving average WNAO index is above the 95th (red), 90th (yellow), 75th (green) and 50th (blue) percentiles of the moving average series and (c) the 5 d moving average WNAO index is below the 50th (blue), 25th (green), 10th (yellow) and 5th (red) percentiles of the moving average series. The 5 d moving average is the 5 d sum of the WNAO index divided by five. Day 0 is defined as the last day of each consecutive 5 d. The small, medium and large dots represent the probability changes that are above the 90 %, 95 % and 99 % confidence levels, respectively, for a Monte Carlo test with 10 000 simulations.
4.2 Daily-to-weekly timescale
To test whether the predictability of haze days and haze events can be improved via the WNAO, we first compare the probability of haze days under three categories of conditions: the state of WNAO is unknown (the baseline), the WNAO is positive and the WNAO is negative. The WNAO we use here is a 5 d (a pentad) moving average calculated by dividing the consecutive 5 d sum of the WNAO index by five. To determine the probabilities of haze at different lead times, we take the last day of a pentad as Day 0, take the first day after the pentad as Day 1 and so on. We present the baseline probability of haze and the change in probability relative to the baseline when the WNAO is above (below) the 95th, 90th, 75th and 50th percentiles (the 50th, 25th, 10th and 5th percentiles) from Day 0 to Day 10 in Fig. 6. The baseline probability of a haze day for the 37 winters ranges between 42 % and 43 % (Fig. 6a). Moreover, the probabilities of haze for all percentiles are increased (decreased) given the positive (negative) WNAO condition, and most are significant at the 0.01 level (Fig. 6b and c). Compared with the 50th and 75th percentiles, larger increases in probability are found for the 95th and 90th percentiles, the peaks of which are at Day 8, being 16.9 % and 13.0 %, respectively. This suggests that the predictability of Beijing haze can be improved by 16.9 % (13.0 %) at Day 8 if the earlier 5 d average WNAO is known to be larger than the 95th (90th) percentile. Moreover, the day on which the maximum probability occurs corresponds well with the obvious WNAO pattern at Day −8 of the composite haze events (Fig. 3). Conversely, a small WNAO index implies fewer winter haze days, especially at Day 5 for the 5th and 10th percentiles, being 19.0 % and 12.0 %, respectively. Hence, the earlier WNAO condition is conducive to the improvement of the prediction of winter haze day in Beijing.

Figure 7The percentage of persistent haze days in haze days at Day i (i = 0…10) on the condition that (a) the state of the WNAO is unknown, (b) the 5 d moving average WNAO index is above the 95th (red), 90th (yellow), 75th (green) and 50th (blue) percentiles of the moving average series, and (c) when the 5 d moving average WNAO index is below the 50th (blue), 25th (green), 10th (yellow) and 5th (red) percentiles of the moving average series.
As an extension of Fig. 6, Fig. 7 shows the proportions of persistent haze days in the haze days under different WNAO states. If the WNAO state is unknown, the percentage of persistent haze days in the haze days varies between 29 % and 32 % (Fig. 7a). However, if the WNAO index is larger than the 95th, 90th, 75th and 50th percentiles, the percentage of persistent haze days increases to 50.6 %, 45.1 %, 45.8 % and 37.5 % on Day 7, Day 7, Day 8 and Day 6, respectively (Fig. 7b). This suggests that the positive WNAO pattern not only favors more haze days but also predicts a greater number of persistent haze days and haze events. However, if the WNAO is negative, persistent haze days and haze events are less likely to occur (Fig. 7c).

Figure 8Composite SST anomalies and SIC anomalies for (a, d) winters (1988, 1996, 1998, 2005, 2007, 2008, 2011–2015) with the greatest number of persistent haze days, (b, e) winters (1980, 1982–1984, 1986, 1987, 1994, 1995, 1999, 2003, 2010) with the lowest number of persistent haze days and (c, f) their differences. The dotted areas show values that are above the 95 % confidence level based on a Monte Carlo test with 10 000 simulations.
5.1 Interannual timescale
We now determine the SST pattern in the North Atlantic and the SIC pattern in the Greenland Sea and Barents Sea–Kara Sea, which might be related to persistent Beijing haze on the interannual timescale. Below we use the number of persistent haze days to categorize winters with more haze days and fewer haze days. This measure reflects the number of persistent haze events as well as their duration. The composite distributions of SST anomalies and SIC anomalies of 11 winters (1988, 1996, 1998, 2005, 2007, 2008 and 2011–2015) with more than 15 persistent haze days and 11 winters (1980, 1982–1984, 1986, 1987, 1994, 1995, 1999, 2003 and 2010) with no more than 5 persistent haze days, and their differences are shown in Fig. 8. The SST anomalies associated with the most persistent haze days show a north–south tripolar mode in the North Atlantic, with positive anomalies in the Gulf Stream region and negative anomalies at the southwest of the Canary Islands and regions around Greenland, which is consistent with the WNAO+ pattern (Fig. 8a). Simmonds and Govekar (2014) noted that warm SSTs in the Gulf Stream region give rise to a teleconnection pattern with a node in the Barents Sea and another over Eurasia. Significant SST anomalies can also be seen in the northwestern Pacific, with negative SST anomalies from Yellow Sea to the Sea of Japan and positive SST anomalies to the east of the Philippines. For SST anomalies of winters with fewer persistent haze days, a north–south tripolar mode in the North Atlantic opposite to that in Fig. 8a is found, although the anomalies are not significant (Fig. 8b). In addition, significant positive SST anomalies are located in the Greenland Sea and the Barents Sea (Fig. 8b). The structure of the SST anomalies in the northwest Pacific is similar to that in Fig. 8a but with much smaller magnitude. Figure 8c, which shows the difference between these two anomaly plots, further highlights the distribution of SST anomalies that are associated with more persistent haze days: a prominent north–south tripolar mode over the North Atlantic and negative SST anomalies over the Greenland Sea and Barents Sea.
SIC anomalies in the Greenland Sea and Barents Sea–Kara Sea also show significant differences between winters with the greatest number of persistent haze days and winters with the lowest number of persistent haze days (Fig. 8d–f). The Greenland Sea and the southern part of the Barents Sea are dominated by positive SIC anomalies and the Kara Sea shows negative SIC anomalies, although they are not significant (Fig. 8d). The only positive SIC anomalies that differ significantly from zero are found in the north of the Barents Sea–Kara Sea and the southeast of Greenland (Fig. 8d). By contrast, for the lowest number of hazy days, composite significant negative SIC anomalies are located in the Greenland Sea and the south part of the Barents Sea (Fig. 8e). The difference between Fig. 8d and e also suggests that the decrease in sea ice in the Greenland Sea and the southern Barents Sea is not conducive to a greater number of persistent haze days or haze events (Fig. 8f).
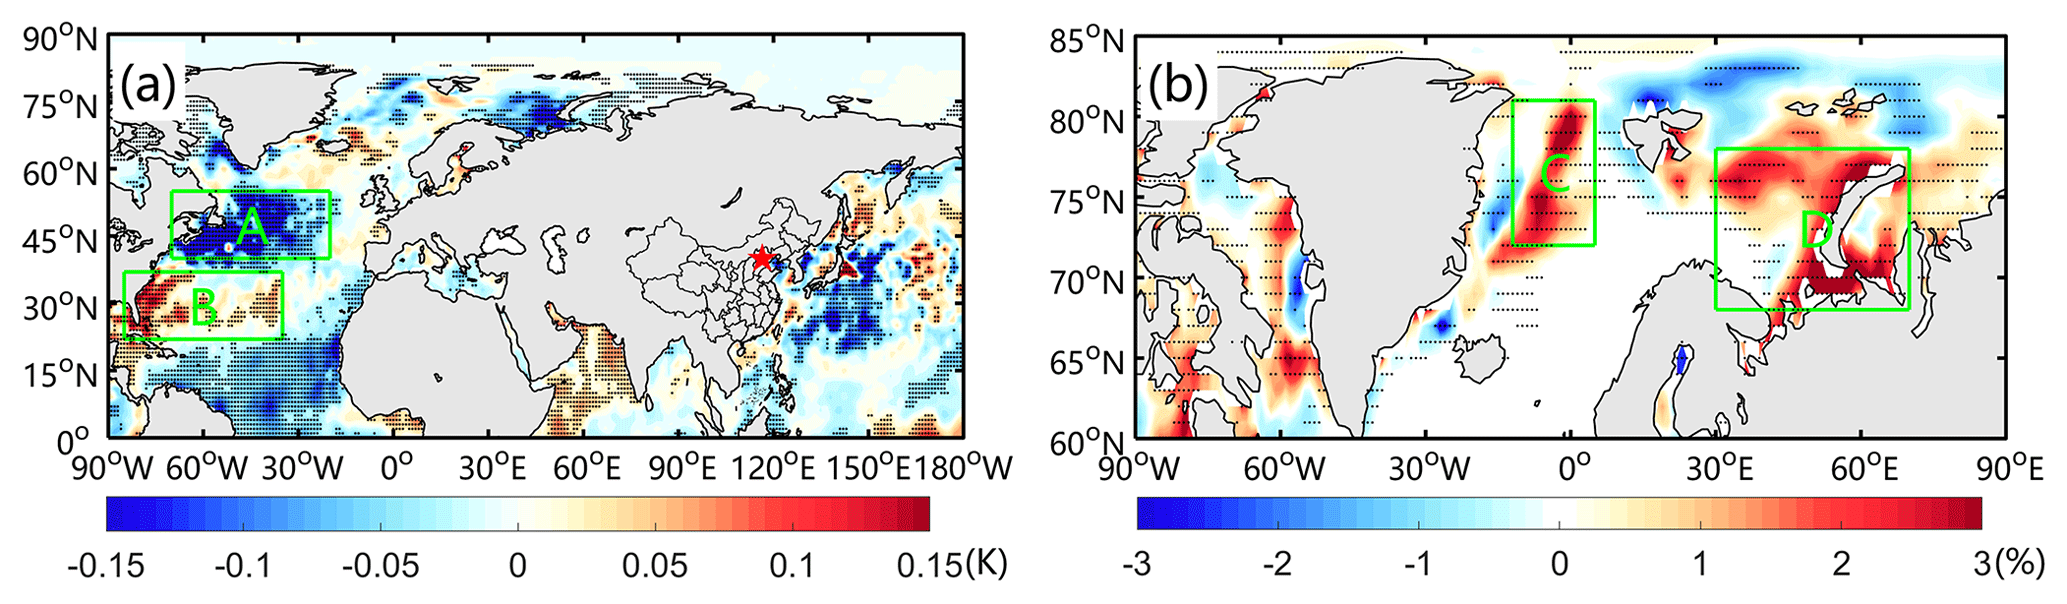
Figure 9(a) Composite SST anomalies and (b) SIC anomalies for the 10 d before the first day of the 65 persistent haze events. The dotted areas show values that are above the 95 % confidence level based on a two-sided Student's t test. The green rectangles A and B in (a) denote a north region (40–55∘ N, 70–20∘ W) and a south region (22–37∘ N, 85–35∘ W) over the North Atlantic, and the green rectangles C and D in (b) denote the Greenland Sea (12∘ W–5∘ E, 72–81∘ N) and the Barents Sea–Kara Sea (30–70∘ E, 68–78∘ N), respectively.
5.2 Daily-to-weekly timescale
From the analyses on the interannual timescale, we can see that SST anomalies in the North Atlantic and SIC anomalies in the Greenland Sea and Barents Sea–Kara Sea are associated with the occurrence of persistent haze days or haze events. To examine the potential causalities, here we analyzed the composite SST anomalies and SIC anomalies averaged over the period of 10 d prior to the first day of the 65 haze events. Prior to the persistent haze events, SST anomalies exhibit a north–south tripolar mode in the North Atlantic (Fig. 9a). This pattern differs from that shown in Fig. 8a; the tripolar mode is located farther south and has significant positive anomalies around the Florida peninsula and even into the Caribbean Sea and significant negative SST anomalies off the northeast coast of the United States (Fig. 9a). Figure 9a also shows significant negative SST anomalies in the Greenland Sea and the Barents Sea–Kara Sea. For the SIC composite anomalies for these 65 events, we observe significant increases in the Greenland Sea and the Barents Sea–Kara Sea (Fig. 9b). These prior distributions of SST and SIC anomalies are conducive to setting up the atmospheric circulations and zonal winds that are favorable for the formation of persistent Beijing haze events. The SST tripolar mode in the North Atlantic is favorable for the formation of a WNAO+ pattern, and the strongly increased zonal wind in association with the WNAO+ pattern encourages downstream wave train propagation. In concert with this, the decreased SST and increased SIC in the Barents Sea–Kara Sea region potentially enable a strengthening of the cyclone upstream of the anticyclone over northern China, which is an essential part of the downstream wave train. Furthermore, as in Fig. 8a, the significant negative SST anomalies in the northwestern Pacific are not compatible with the anticyclone directly controlling persistent haze events in Beijing.
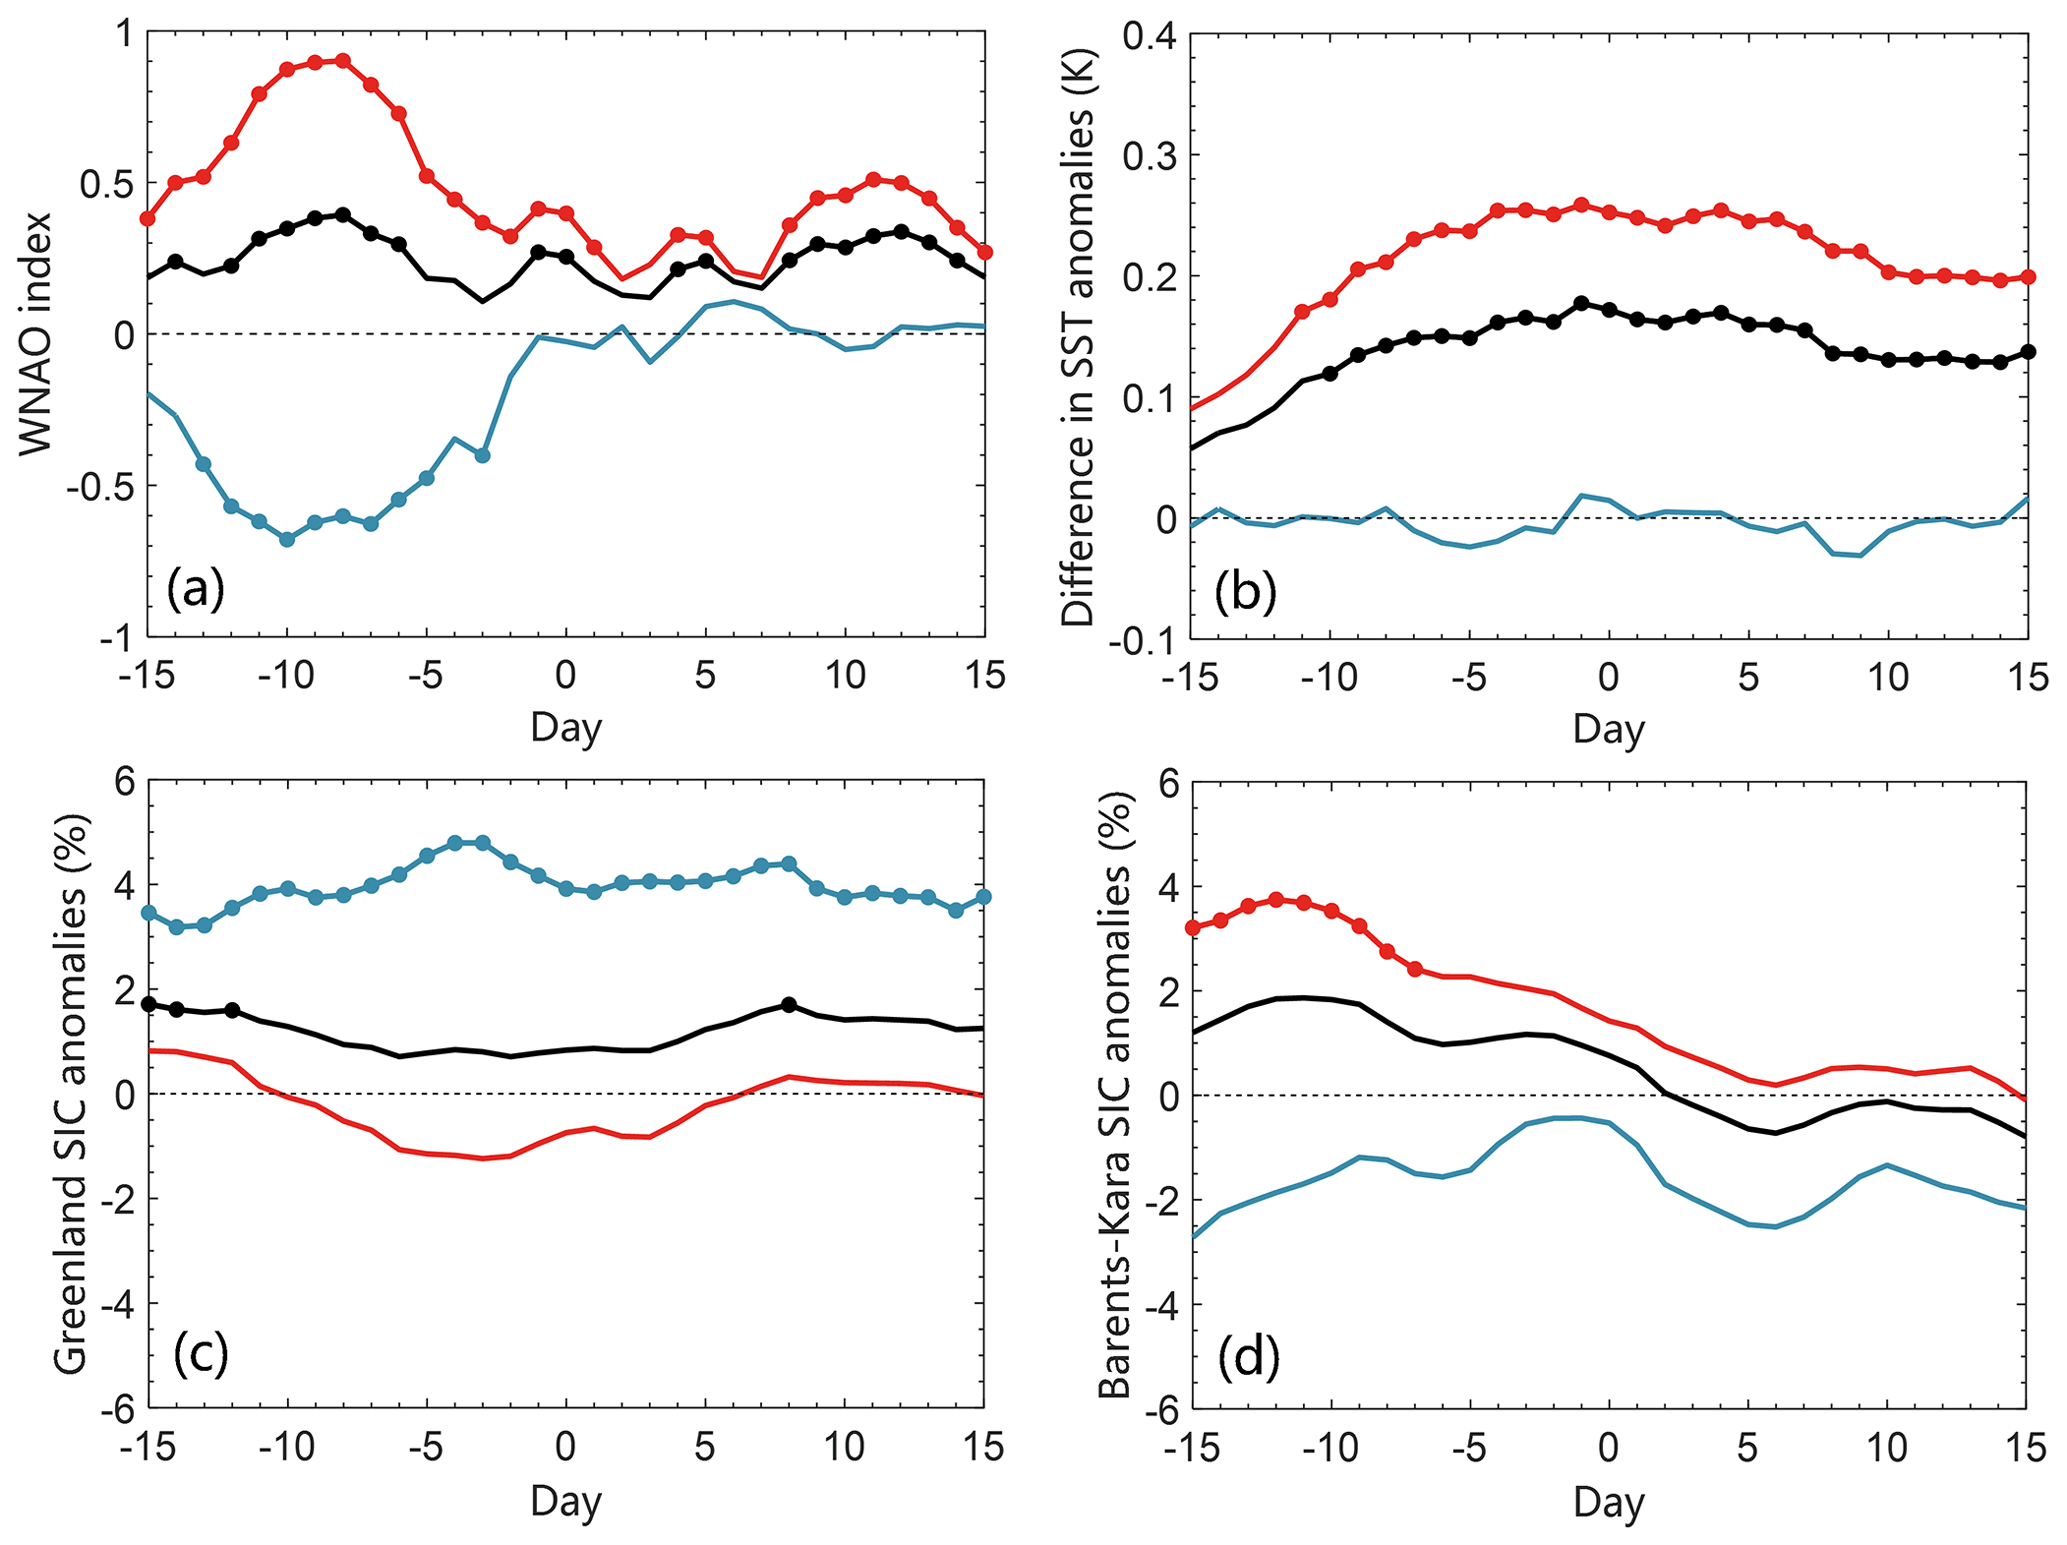
Figure 10Composite daily time series of the (a) WNAO index, (b) difference in the SST anomalies over the two regions, as presented in Fig. 9a, (c, d) region-averaged SIC anomalies in the (c) Greenland Sea (marked by C in Fig. 9b) and (d) Barents Sea–Kara Sea (marked by D in Fig. 9b) for the 65 persistent haze events (black), 43 WNAO+-related persistent haze events (red) and 22 WNAO−-related persistent haze events (blue) from Day −15 to Day 10. The difference in the SST anomalies is calculated by subtracting the region-averaged SST anomalies in the north (rectangle A) from the region-averaged SST anomalies in the south (rectangle B) (that is, B minus A). A persistent haze event that is related to the WNAO+ (WNAO−) is selected when its averaged WNAO index is positive (negative) from Day −10 to Day −6 of the persistent haze event.
In light of the above, it is noted that, even though regression and composite analyses (e.g., Fig. 1) might suggest a strong link between haze events and the WNAO+, it is important to remember that such analyses identify necessary but not sufficient conditions (Boschat et al., 2016). This leads us to the question of whether there are persistent haze events related to the WNAO− pattern and what the differences are between these haze events and those related to the WNAO+ pattern. First, the daily evolution of the NAO index for the 65 persistent haze events (black line), 43 WNAO+-related persistent haze events (red line) and 22 WNAO−-related persistent haze events (blue line) are shown in Fig. 10. The composite WNAO index for all haze events reaches its highest value on Day −8, so we select a WNAO+-related (WNAO−-related) persistent haze event if its averaged WNAO index during the period of Day −10 to Day −6 is above (below) zero. Figure 10a shows that the daily evolution of the composite WNAO index for WNAO+-related and WNAO−-related persistent haze events generally shows the opposite character. However, the peak value (0.90) of the WNAO index for WNAO+-related persistent haze events appears on Day −8, the absolute value of which is larger than that of the valley value (−0.68) of the WNAO index for WNAO−-related persistent haze events on Day −10. Corresponding SST and SIC anomalies of the WNAO+-related case and the WNAO−-related case are also compared in Fig. 10b–d. We use the difference in the SST anomalies between the two regions A (40–55∘ N, 70–20∘ W) and B (22–37∘ N, 85–35∘ W) marked in Fig. 9a to signify the SST tripolar pattern in the North Atlantic. Daily evolution of the SST anomaly difference show significant increases starting from Day −11 and Day −9 for the WNAO+-related case and all persistent haze events, respectively, whereas the difference in SST anomalies for the WNAO−-related case shows only a weak fluctuation (Fig. 10b). As for the SIC anomaly in the Barents Sea–Kara Sea, it has a significant maximum amplitude leading the Day 0 of WNAO+-related persistent haze events by 12 d (Fig. 10d), whereas the SIC anomaly in the Greenland Sea shows significant high values during the period from Day −15 to Day 15 of WNAO−-related persistent haze events and its peak appears on Day −3 (Fig. 10c). We can conclude that the SST difference in the North Atlantic and SIC anomalies in the Barents Sea–Kara Sea show preceding signals for WNAO+-related persistent haze events, and the WNAO−-related persistent haze events are associated mainly with increased SIC anomalies in the Greenland Sea.
In this study, we have focused on persistent winter haze in Beijing from the perspective of large-scale atmospheric circulation (e.g., teleconnections and wave trains). We first presented the atmospheric circulation correlated with winter haze in Beijing on the interannual timescale. It is found that the frequency of winter haze is related to a western-type NAO+ pattern and an EA/WR+ pattern on interannual timescales. Notably, the number of winter haze days is more relevant to the WNAO+ pattern after 1999, whereas it is more associated with the EA/WR+ pattern before 2000. Then, the daily evolution of the composite circulation patterns and wave activities for 65 persistent haze events is used to represent the relationship between winter haze weather in Beijing and atmospheric circulation on the daily-to-weekly timescale. A transmission of atmospheric circulation demonstrated a wave train propagating from the North Atlantic to northeast China. The WNAO+ pattern is the initiator of this transmission from Day −10 to Day −8, followed by an EA/WR+ pattern from Day −3 to Day −2. We also highlighted the daily variations in zonal winds linked to atmospheric circulation. It was revealed that the zonal wind over the central North Atlantic, which is coupled with the WNAO+ pattern, reached its largest value on Day −9, and the zonal wind downstream over the Scandinavian Peninsula and the north of China showed significantly increased values after Day −5, indicating the propagation of the wave train.
As the WNAO+ pattern acted as the original driver of this atmospheric transmission, we were interested in whether it can improve the predictability of winter haze on both interannual and daily-to-weekly timescales. From a comparison of the number of haze days and haze events, as well as the average duration of haze events for WNAO+ winters, WNAO− winters and all winters with four sets of criteria, we found that the haze days and haze events are more likely to occur in WNAO+ winters. The WNAO+ winters contribute to a 22.8 % (26.0 %) increase in winter haze days, a 28.1 % (42.3 %) increase in winter haze events, 1.6 d (1.8 d) increase in average haze duration relative to the baselines for the 90th (95th) percentile. Moreover, when compared to the WNAO− winters, these values are much higher. Thus, we propose that if the WNAO state can be predicted for a winter, then a general predication of the probability of haze days and haze events as well as the duration of haze events can be obtained.
On the daily-to-weekly timescale, our results also suggest that the WNAO+ pattern significantly improves the predictability of haze days and haze events. For a set of lead times (from Day 1 to Day 10) and four sets of criteria, the probabilities of haze days lagging the WNAO+ condition are all increased compared with the baseline or the WNAO− condition. The largest increase occurs for the 95th and 90th percentiles, and the largest increase, 16.9 % and 13.0 %, can be predicted at Day 8. However, if the WNAO index is lower than the 5th (10th) percentile, a 19.0 % (12.0 %) decrease of haze days can be predicted at Day 5. This provides more information for decision-makers for a given day; that is, if the 5 d average of WNAO index of the day is known, they can determine the probability of haze for a set of days after this day.
Further analyses revealed that the SST anomalies in the North Atlantic and SIC anomalies in the Greenland Sea and Barents Sea–Kara Sea are also related to winter haze weather in Beijing on both interannual and daily-to-weekly timescales. On the interannual timescale, winters with a greater number of persistent haze days correspond to a north–south tripolar mode over the North Atlantic. On the daily-to-weekly timescale, a more southerly SST tripolar mode is also prominent over the North Atlantic, and the Greenland Sea and Barents Sea–Kara Sea also show significant SST and SIC anomalies 10 d prior to the persistent haze events. For a more in-depth understanding, the relationship between the preceding WNAO pattern, SST and SIC anomalies and the persistent haze events was highlighted by comparing the WNAO+-related haze events and the WNAO−-related events. We found that the WNAO+-related case corresponded to prior SST signals in the North Atlantic and increased SIC anomalies in the Barents Sea–Kara Sea, whereas the WNAO−-related case had large SIC anomalies only in the Greenland Sea.
Previous studies have shown that the large-scale atmospheric circulations are closely associated with the winter haze in Beijing from decadal timescales down to intraseasonal timescales (Yin and Wang, 2017; Yin et al., 2017; Chen et al., 2019). These studies well captured certain modes of atmospheric circulations that are significant during the haze episodes, but they did not reveal their lead–lag relationships on a daily timescale as well as the role of atmospheric circulations in the prediction of winter haze. By analyzing the day-by-day evolution, our investigation has revealed that a WNAO+ pattern, part of an atmospheric transmission, shows potential prediction abilities for persistent haze events. One step further, we find that prior knowledge of the WNAO state can significantly improve the predictability of haze days and implies an increase in the predictability of persistent haze. As the external forces have longer memories and can affect the state of the NAO by air–sea interaction (Okumura et al., 2001; Frankignoul and Kestenare, 2005; Peng et al., 2002, 2003; Nie et al., 2019), it is possible to further improve the predictability of winter haze by predicting the WNAO state through external forces on both interannual and daily-to-weekly timescales. In addition, it is also worthwhile to determine the reasons why the WNAO index (EA/WR index) has a stronger correlation with winter haze weather in Beijing after 1999 (before 2000) from the perspective of climate change.
Daily atmospheric and land-surface data were downloaded from the ECMWF ERA-Interim data archive (http://www.ecmwf.int/en/research/climate-reanalysis/era-interim, last access: 5 December 2021, ERA-Interim, 2017). Monthly sea surface temperature data and sea-ice concentration data are available from the Met Office Hadley Centre datasets (https://www.metoffice.gov.uk/hadobs/hadisst/data/download.html, last access: 5 December 2021, Met Office, 2017). The ground observations were taken from the National Meteorological Information Center of China (http://data.cma.cn/, last access: 5 December 2021, CMA, 2017). The NAO and EA/WR indices are from the NOAA Climate Prediction Center (http://www.cpc.ncep.noaa.gov/data/teledoc/telecontents.shtml, last access: 5 December 2021, NOAA-CPC, 2017). The modified WNAO index can be obtained from the authors.
YY designed the study. ML created the figures. ML and YY wrote the article. IS, DL and LZ gave constructive comments. LP provided and analyzed the observational station data.
The contact author has declared that neither they nor their co-authors have any competing interests.
Publisher's note: Copernicus Publications remains neutral with regard to jurisdictional claims in published maps and institutional affiliations.
The authors are grateful to the editor and three anonymous referees for their constructive comments.
This research has been supported by the National Natural Science Foundation of China (grant nos. 41975068, 41790473 and 41975099), the Strategic Priority Research Program of Chinese Academy of Sciences (grant no. XDA19070403) and the Australian Research Council (grant no. DP16010997).
This paper was edited by Stefano Galmarini and reviewed by three anonymous referees.
Ambrizzi, T., Hoskins, B. J., and Hsu, H. H.: Rossby-wave propagation and teleconnection patterns in the austral winter, J. Atmos. Sci., 52, 3661–3672, https://doi.org/10.1175/1520-0469(1995)052<3661:rwpatp>2.0.co;2, 1995.
An, Z., Huang, R. J., Zhang, R., Tie, X., Li, G., Cao, J., Zhou, W., Shi, Z., Han, Y., Gu, Z., and Ji, Y.: Severe haze in northern China: A synergy of anthropogenic emissions and atmospheric processes, P. Natl. Acad. Sci. USA, 116, 8657–8666, https://doi.org/10.1073/pnas.1900125116, 2019.
Athanasiadis, P. J., Wallace, J. M., and Wettstein, J. J.: Patterns of wintertime jet stream variability and their relation to the storm tracks, J. Atmos. Sci., 67, 1361–1381, https://doi.org/10.1175/2009jas3270.1, 2010.
Barnston, A. G. and Livezey, R. E.: Classification, seasonality and persistence of low-frequency atmospheric circulation patterns, Mon. Weather Rev., 115, 1083–1126, https://doi.org/10.1175/1520-0493(1987)115<1083:csapol>2.0.co;2, 1987.
Boschat, G., Simmonds, I., Purich, A., Cowan, T., and Pezza, A. B.: On the use of composite analyses to form physical hypotheses: An example from heat wave – SST associations, Sci. Rep., 6, 9, https://doi.org/10.1038/srep29599, 2016.
Cai, W., Li, K., Liao, H., Wang, H., and Wu, L.: Weather conditions conducive to Beijing severe haze more frequent under climate change, Nat. Clim. Change, 7, 257–262, https://doi.org/10.1038/nclimate3249, 2017.
Callahan, C. and Mankin, J.: The influence of internal climate variability on projections of synoptically driven Beijing haze, Geophys. Res. Lett., 47, e2020GL088548, https://doi.org/10.1029/2020GL088548, 2020.
Chang, L., Wu, Z., and Xu, J.: A comparison of haze pollution variability in China using haze indices based on observations, Sci. Total Environ., 715, 136929, https://doi.org/10.1016/j.scitotenv.2020.136929, 2020.
Chen, H. and Wang, H.: Haze days in North China and the associated atmospheric circulations based on daily visibility data from 1960 to 2012, J. Geophys. Res.-Atmos., 120, 5895–5909, https://doi.org/10.1002/2015jd023225, 2015.
Chen, S., Guo, J., Song, L., Li, J., Liu, L., and Cohen, J. B.: Inter-annual variation of the spring haze pollution over the North China Plain: Roles of atmospheric circulation and sea surface temperature, Int. J. Climatol., 39, 783–798, https://doi.org/10.1002/joc.5842, 2019.
Chen, S., Guo, J., Song, L., Cohen, J. B., and Wang, Y.: Temporal disparity of the atmospheric systems contributing to interannual variation of wintertime haze pollution in the North China Plain, Int. J. Climatol., 40, 128–144, https://doi.org/10.1002/joc.6198, 2020a.
Chen, S., Guo, J., Song, L., Cohen, J. B. and Wang, Y.: Intra-seasonal differences in the atmospheric systems contributing to interannual variations of autumn haze pollution in the North China Plain, Theor. Appl. Climatol., 141, 389–403, https://doi.org/10.1007/s00704-020-03221-4, 2020b.
China Meteorological Administration: Specifications for surface meteorological observation, China Meteorological Press, Beijing, 129–130, 2004.
CMA (China Meteorological Data Service Centre): The ground observations, CMA, available at: http://data.cma.cn/en (last access: 5 December 2021), 2017.
Dang, R. and Liao, H.: Severe winter haze days in the Beijing–Tianjin–Hebei region from 1985 to 2017 and the roles of anthropogenic emissions and meteorology, Atmos. Chem. Phys., 19, 10801–10816, https://doi.org/10.5194/acp-19-10801-2019, 2019.
Dee, D. P., Uppala, S. M., Simmons, A. J., Berrisford, P., Poli, P., Kobayashi, S., Andrae, U., Balmaseda, M. A., Balsamo, G., Bauer, P., Bechtold, P., Beljaars, A. C. M., van de Berg, L., Bidlot, J., Bormann, N., Delsol, C., Dragani, R., Fuentes, M., Geer, A. J., Haimberger, L., Healy, S. B., Hersbach, H., Hólm, E. V., Isaksen, L., Kållberg, P., Köhler, M., Matricardi, M., McNally, A. P., Monge-Sanz, B. M., Morcrette, J.-J., Park, B.-K., Peubey, C., de Rosnay, P., Tavolato, C., Thépaut, J.-N., and Vitart, F.: The ERA-Interim reanalysis: configuration and performance of the data assimilation system, Q. J. Roy. Meteor. Soc., 137, 553–597, https://doi.org/10.1002/qj.828, 2011.
ERA-Interim: ERA-Interim data, ERA-Interim, available at: http://www.ecmwf.int/en/research/climate-reanalysis/era-interim (last access: 5 December 2021), 2017.
Fang, Z. F., Wallace, J. M., and Thompson, D. W. J.: The relationship between the meridional profile of zonal-mean geostrophic wind and station wave at 500 hPa, Adv. Atmos. Sci., 18, 692–700, https://doi.org/10.1007/BF03403494, 2001.
Frankignoul, C. and Kestenare, E.: Observed Atlantic SST anomaly impact on the NAO: An update, J. Climate, 18, 4089–4094, https://doi.org/10.1175/jcli3523.1, 2005.
He, J., Gong, S., Zhou, C., Lu, S., Wu, L., Chen, Y., Yu, Y., Zhao, S., Yu, L., and Yin, C.: Analyses of winter circulation types and their impacts on haze pollution in Beijing, Atmos. Environ., 192, 94–103, https://doi.org/10.1016/j.atmosenv.2018.08.060, 2018.
Li, J. and Han, Z.: A modeling study of severe winter haze events in Beijing and its neighboring regions, Atmos. Res., 170, 87–97, https://doi.org/10.1016/j.atmosres.2015.11.009, 2016.
Li, J., Du, H., Wang, Z., Sun, Y., Yang, W., Li, J., Tang, X., and Fu, P.: Rapid formation of a severe regional winter haze episode over a mega-city cluster on the North China Plain, Environ. Pollut., 223, 605–615, https://doi.org/10.1016/j.envpol.2017.01.063, 2017.
Li, J., Sun, J., Zhou, M., Cheng, Z., Li, Q., Cao, X., and Zhang, J.: Observational analyses of dramatic developments of a severe air pollution event in the Beijing area, Atmos. Chem. Phys., 18, 3919–3935, https://doi.org/10.5194/acp-18-3919-2018, 2018.
Li, J. P. and Wang, J. X. L.: A new North Atlantic Oscillation index and its variability, Adv. Atmos. Sci., 20, 661–676, https://doi.org/10.1007/BF02915394, 2003.
Li, K., Liao, H., Cai, W., and Yang, Y.: Attribution of anthropogenic influence on atmospheric patterns conducive to recent most severe haze over Eastern China, Geophys. Res. Lett., 45, 2072–2081, https://doi.org/10.1002/2017GL076570, 2018.
Li, X., Gao, Z., Li, Y., Gao, C. Y., Ren, J., and Zhang, X.: Meteorological conditions for severe foggy haze episodes over north China in 2016–2017 winter, Atmos. Environ., 199, 284–298, https://doi.org/10.1016/j.atmosenv.2018.11.042, 2019.
Li, Y. and Yin, Z.: Melting of Perennial Sea Ice in the Beaufort Sea Enhanced Its Impacts on Early-Winter Haze Pollution in North China after the Mid-1990s, J. Climate, 33, 5061–5080, https://doi.org/10.1175/jcli-d-19-0694.1, 2020.
Lu, S., He, J., Gong, S., and Zhang, L.: Influence of Arctic Oscillation abnormalities on spatio-temporal haze distributions in China, Atmos. Environ., 223, 117282, https://doi.org/10.1016/j.atmosenv.2020.117282, 2020.
Luo D., Yao, Y., and Feldstein, S.: Regime transition of the North Atlantic Oscillation and the extreme cold event over Europe in January–February 2012, Mon. Weather Rev., 142, 4735–4757, https://doi.org/10.1175/MWR-D-13-00234.1, 2014.
Martinez-Asensio, A., Tsimplis, M. N., Marcos, M., Feng, X., Gomis, D., Jorda, G., and Josey, S. A.: Response of the North Atlantic wave climate to atmospheric modes of variability, Int. J. Climatol., 36, 1210–1225, https://doi.org/10.1002/joc.4415, 2016.
Met Office: Monthly sea surface temperature data and sea-ice concentration data, Met Office [data set], available at: https://www.metoffice.gov.uk/hadobs/hadisst/data/download.html (last access: 5 December 2021), 2017.
Nie, Y., Ren, H.-L., and Zhang, Y.: The role of extratropical air–sea interaction in the Autumn subseasonal variability of the North Atlantic Oscillation, J. Climate, 32, 7697–7712, https://doi.org/10.1175/JCLI-D-19-0060.1, 2019.
NOAA-CPC: NAO and EA/WR indices, NOAA-CPC, available at: http://www.cpc.ncep.noaa.gov/data/teledoc/telecontents.shtml (last access: 5 December 2021), 2017.
Okumura, Y., Xie, S.-P., Numaguti, A., and Tanimoto, Y.: Tropical Atlantic air-sea interaction and its influence on the NAO, Geophys. Res. Lett., 28, 1507–1510, https://doi.org/10.1029/2000GL012565, 2001.
Pei, L. and Yan, Z.: Diminishing clear winter skies in Beijing towards a possible future, Environ. Res. Lett., 13, 124029, https://doi.org/10.1088/1748-9326/aaf032, 2018.
Pei, L., Yan, Z., Sun, Z., Miao, S., and Yao, Y.: Increasing persistent haze in Beijing: potential impacts of weakening East Asian winter monsoons associated with northwestern Pacific sea surface temperature trends, Atmos. Chem. Phys., 18, 3173–3183, https://doi.org/10.5194/acp-18-3173-2018, 2018.
Pei, L., Yan, Z., Chen, D., and Miao, S.: Climate variability or anthropogenic emissions: which caused Beijing Haze?, Environ. Res. Lett., 15, 034004, https://doi.org/10.1088/1748-9326/ab6f11, 2020.
Peng, S. L., Robinson, W. A., and Li, S. L.: North Atlantic SST forcing of the NAO and relationships with intrinsic hemispheric variability, Geophys. Res. Lett., 29, 1276, https://doi.org/10.1029/2001gl014043, 2002.
Peng, S. L., Robinson, W. A., and Li, S. L.: Mechanisms for the NAO responses to the North Atlantic SST tripole, J. Climate, 16, 1987–2004, https://doi.org/10.1175/1520-0442(2003)016<1987:mftnrt>2.0.co;2, 2003.
Rayner, N. A., Parker, D. E., Horton, E. B., Folland, C. K., Alexander, L. V., Rowell, D. P., Kent, E. C., and Kaplan, A.: Global analyses of sea surface temperature, sea ice, and night marine air temperature since the late nineteenth century, J. Geophys. Res.-Atmos., 108, 4407, https://doi.org/10.1029/2002jd002670, 2003.
Rudeva, I. and Simmonds, I.: Midlatitude winter extreme temperature events and connections with anomalies in the Arctic and tropics, J. Climate, 34, 3733–3749, https://doi.org/10.1175/JCLI-D-20-0371.1, 2021.
Shi, P., Zhang, G., Kong, F., Chen, D., Azorin-Molina, C., and Guijarro, J. A.: Variability of winter haze over the Beijing-Tianjin-Hebei region tied to wind speed in the lower troposphere and particulate sources, Atmos. Res., 215, 1–11, https://doi.org/10.1016/j.atmosres.2018.08.013, 2019.
Simmonds, I. and Govekar, P. D.: What are the physical links between Arctic sea ice loss and Eurasian winter climate?, Environ. Res. Lett., 9, 101003, https://doi.org/10.1088/1748-9326/9/10/101003, 2014.
Simmonds, I. and Li, M.: Trends and variability in polar sea ice, global atmospheric circulations and baroclinicity, Ann. NY Acad. Sci., 1504, 167–186, https://doi.org/10.1111/nyas.14673, 2021.
Su, B., Zhan, M., Zhai, J., Wang, Y., and Fischer, T.: Spatio-temporal variation of haze days and atmospheric circulation pattern in China (1961–2013), Quatern. Int., 380, 14–21, https://doi.org/10.1016/j.quaint.2014.11.044, 2015.
Takaya, K. and Nakamura, H.: A formulation of a phase-independent wave-activity flux for stationary and migratory quasigeostrophic eddies on a zonally varying basic flow, J. Atmos. Sci., 58, 608–627, https://doi.org/10.1175/1520-0469(2001)058<0608:afoapi>2.0.co;2, 2001.
Wang, H., Xu, J., Zhang, M., Yang, Y., Shen, X., Wang, Y., Chen, D., and Guo, J.: A study of the meteorological causes of a prolonged and severe haze episode in January 2013 over central-eastern China, Atmos. Environ., 98, 146–157, https://doi.org/10.1016/j.atmosenv.2014.08.053, 2014.
Wang, H., Li, J. H., Peng, Y., Zhang, M., Che, H. Z., and Zhang, X. Y.: The impacts of the meteorology features on PM2.5 levels during a severe haze episode in central-east China, Atmos. Environ., 197, 177–189, https://doi.org/10.1016/j.atmosenv.2018.10.001, 2019.
Wang, J., Zhu, Z., Qi, L., Zhao, Q., He, J., and Wang, J. X. L.: Two pathways of how remote SST anomalies drive the interannual variability of autumnal haze days in the Beijing–Tianjin–Hebei region, China, Atmos. Chem. Phys., 19, 1521–1535, https://doi.org/10.5194/acp-19-1521-2019, 2019.
Wang, J., Liu, Y., Ding, Y., Wu, P., Zhu, Z., Xu, Y., Li, Q., Zhang, Y., He, J., Wang, J. X. L., and Qi, L.: Impacts of climate anomalies on the interannual and interdecadal variability of autumn and winter haze in North China: A review, Int. J. Climatol., 10, 4309–4325, https://doi.org/10.1002/joc.6471, 2020, 2020.
Wang, N. and Zhang, Y. C.: Connections between the Eurasian teleconnection and concurrent variation of upper-level jets over East Asia, Adv. Atmos. Sci., 32, 336–348, https://doi.org/10.1007/s00376-014-4088-1, 2015.
Wang, Y. S., Yao, L., Liu, Z. R., J., D. S., Wang, L. L., and Zhang, J. K.: Formation mechanism and control strategies of haze in China, Bull. Chin. Acad. Sci., 28, 353–363, 2013 (in Chinese).
Wirth, V., Riemer, M., Chang, E. K. M., and Martius, O.: Rossby Wave Packets on the Midlatitude Waveguide–A Review, Mon. Weather Rev., 146, 1965–2001, https://doi.org/10.1175/mwr-d-16-0483.1, 2018.
Wu, D.: More Discussions on the differences between Haze and Fog in City, Quatern. Int., 32, 9–15, 2006.
Wu D.: Discussion on the distinction between haze and fog and analysis and processing of data, Environ. Chem., 27, 327–330, 2008.
Wu, P., Ding, Y., and Liu, Y.: Atmospheric circulation and dynamic mechanism for persistent haze events in the Beijing–Tianjin–Hebei region, Adv. Atmos. Sci., 34, 429–440, https://doi.org/10.1007/s00376-016-6158-z, 2017.
Wu, Y., Zhang, R., Tian, P., Tao, J., Hsu, S. C., Yan, P., Wang, Q., Cao, J., Zhang, X., and Xia, X.: Effect of ambient humidity on the light absorption amplification of black carbon in Beijing during January 2013, Atmos. Environ., 124, 217–223, https://doi.org/10.1016/j.atmosenv.2015.04.041, 2016.
Xiao, D., Li, Y., Fan, S., Zhang, R., Sun, J., and Wang, Y.: Plausible influence of Atlantic Ocean SST anomalies on winter haze in China, Theor. Appl. Climatol., 122, 249–257, https://doi.org/10.1007/s00704-014-1297-6, 2015.
Yang, Y., Liao, H., and Lou, S.: Increase in winter haze over eastern China in recent decades: Roles of variations in meteorological parameters and anthropogenic emissions, J. Geophys. Res.-Atmos., 121, 13050–13065, https://doi.org/10.1002/2016jd025136, 2016.
Yao Y. and Luo, D.: Relationship between zonal position of the North Atlantic Oscillation and Euro–Atlantic blocking events and its possible effect on the weather over Europe, Sci. China Earth. Sci., 57, 2628–2636, https://doi.org/10.1007/s11430-014-4949-6, 2014.
Yao, Y., Luo, D., Dai, A. and Feldstein, S.: The positive North Atlantic Oscillation with downstream blocking and Middle East snowstorms: Impacts of the North Atlantic jet, J. Climate, 29, 1853–1876, https://doi.org/10.1175/JCLI-D-15-0350.1, 2016.
Yin, Z. and Wang, H.: The relationship between the subtropical Western Pacific SST and haze over North-Central North China Plain, Int. J. Climatol., 36, 3479–3491, https://doi.org/10.1002/joc.4570, 2016.
Yin, Z. and Wang, H.: Role of atmospheric circulations in haze pollution in December 2016, Atmos. Chem. Phys., 17, 11673–11681, https://doi.org/10.5194/acp-17-11673-2017, 2017.
Yin, Z. and Wang, H.: The strengthening relationship between Eurasian snow cover and December haze days in central North China after the mid-1990s, Atmos. Chem. Phys., 18, 4753–4763, https://doi.org/10.5194/acp-18-4753-2018, 2018.
Yin, Z., Wang, H., and Chen, H.: Understanding severe winter haze events in the North China Plain in 2014: roles of climate anomalies, Atmos. Chem. Phys., 17, 1641–1651, https://doi.org/10.5194/acp-17-1641-2017, 2017.
Yin, Z., Li, Y., and Wang, H.: Response of early winter haze in the North China Plain to autumn Beaufort sea ice, Atmos. Chem. Phys., 19, 1439–1453, https://doi.org/10.5194/acp-19-1439-2019, 2019a.
Yin, Z., Wang, H., and Ma, X.: Possible Relationship between the Chukchi Sea Ice in the Early Winter and the February Haze Pollution in the North China Plain, J. Climate, 32, 5179–5190, https://doi.org/10.1175/jcli-d-18-0634.1, 2019b.
Zhang, R., Li, Q., and Zhang, R.: Meteorological conditions for the persistent severe fog and haze event over eastern China in January 2013, Sci. China Earth Sci., 57, 26–35, https://doi.org/10.1007/s11430-013-4774-3, 2014.
Zhang, Y., Fan, J., Chen, X., Ashkenazy, Y., and Havlin, S.: Significant Impact of Rossby Waves on Air Pollution Detected by Network Analysis, Geophys. Res. Lett., 46, 12476–12485, https://doi.org/10.1029/2019gl084649, 2019.
Zhang, Z., Zhang, X., Gong, D., Kim, S.-J., Mao, R., and Zhao, X.: Possible influence of atmospheric circulations on winter haze pollution in the Beijing–Tianjin–Hebei region, northern China, Atmos. Chem. Phys., 16, 561–571, https://doi.org/10.5194/acp-16-561-2016, 2016.
Zhong, W., Yin, Z., and Wang, H.: The relationship between anticyclonic anomalies in northeastern Asia and severe haze in the Beijing–Tianjin–Hebei region, Atmos. Chem. Phys., 19, 5941–5957, https://doi.org/10.5194/acp-19-5941-2019, 2019.
Zou, Y., Wang, Y., Zhang, Y., and Koo, J.-H.: Arctic sea ice, Eurasia snow, and extreme winter haze in China, Sci. Adv., 3, e1602751, https://doi.org/10.1126/sciadv.1602751, 2017.
- Abstract
- Introduction
- Data and methods
- Large-scale atmospheric circulations
- The WNAO pattern and persistent Beijing haze
- External influence of SST and SIC
- Conclusions and discussions
- Data availability
- Author contributions
- Competing interests
- Disclaimer
- Acknowledgements
- Financial support
- Review statement
- References