the Creative Commons Attribution 4.0 License.
the Creative Commons Attribution 4.0 License.
 | 21 Dec 2021
Anthropogenic aerosol effects on tropospheric circulation and sea surface temperature (1980–2020): separating the role of zonally asymmetric forcings
Chenrui Diao
Shang-Ping Xie
Anthropogenic aerosols (AAs) induce global and regional tropospheric circulation adjustments due to the radiative energy perturbations. The overall cooling effects of AA, which mask a portion of global warming, have been the subject of many studies but still have large uncertainty. The interhemispheric contrast in AA forcing has also been demonstrated to induce a major shift in atmospheric circulation. However, the zonal redistribution of AA emissions since start of the 20th century, with a notable decline in the Western Hemisphere (North America and Europe) and a continuous increase in the Eastern Hemisphere (South Asia and East Asia), has received less attention.
Here we utilize four sets of single-model initial-condition large-ensemble simulations with various combinations of external forcings to quantify the radiative and circulation responses due to the spatial redistribution of AA forcing during 1980–2020. In particular, we focus on the distinct climate responses due to fossil-fuel-related (FF) aerosols emitted from the Western Hemisphere (WH) versus the Eastern Hemisphere (EH).
The zonal (west to east) redistribution of FF aerosol emission since the 1980s leads to a weakening negative radiative forcing over the WH mid-to-high latitudes and an enhancing negative radiative forcing over the EH at lower latitudes. Overall, the FF aerosol leads to a northward shift of the Hadley cell and an equatorward shift of the Northern Hemisphere (NH) jet stream. Here, two sets of regional FF simulations (Fix_EastFF1920 and Fix_WestFF1920) are performed to separate the roles of zonally asymmetric aerosol forcings. We find that the WH aerosol forcing, located in the extratropics, dominates the northward shift of the Hadley cell by inducing an interhemispheric imbalance in radiative forcing. On the other hand, the EH aerosol forcing, located closer to the tropics, dominates the equatorward shift of the NH jet stream. The consistent relationship between the jet stream shift and the top-of-atmosphere net solar flux (FSNTOA) gradient suggests that the latter serves as a rule-of-thumb guidance for the expected shift of the NH jet stream.
The surface effect of EH aerosol forcing (mainly from low- to midlatitudes) is confined more locally and only induces weak warming over the northeastern Pacific and North Atlantic. In contrast, the WH aerosol reduction leads to a large-scale warming over NH mid-to-high latitudes that largely offsets the cooling over the northeastern Pacific due to EH aerosols.
The simulated competing roles of regional aerosol forcings in driving atmospheric circulation and surface temperature responses during the recent decades highlight the importance of considering zonally asymmetric forcings (west to east) and also their meridional locations within the NH (tropical vs. extratropical).
- Article
(9782 KB) - Full-text XML
- BibTeX
- EndNote


The external forcings due to anthropogenic activities and internal variabilities originating from the ocean–atmosphere system together determine climate change at decadal timescales (Kirtman et al., 2013; Meehl et al., 2013). Since the Industrial Revolution, the increasing greenhouse gas (GHG) emissions have been shown to be the leading cause of global warming of about 1.1 ∘C (as of the late 2010s; IPCC, 2018). On the other hand, the internal variation in the climate, which fluctuates at timescales ranging from years to decades, modulate the paces of global warming at a shorter decadal to a multidecadal timescale (Dai et al., 2015; Xie and Kosaka, 2017; Dong and McPahden, 2017), which also has regional implications such as sea ice retreat (Ding et al., 2019).
In addition to GHG forcing and internal variability, another major confounding factor affecting global climate change at decadal scales is anthropogenic aerosol forcing. Despite decades of research into this subject, quantitative understanding of the regional climate effects of anthropogenic aerosols (AAs) remains highly uncertain. There is still limited understanding of the physical mechanisms governing the strength of AA radiative forcing, for example, due to complex aerosol–cloud interaction (Fiedler et al., 2017; Bender, 2020), the brownness of organic aerosols (Bahadur et al., 2012; Jacobson, 2012; Kodros et al., 2015), and surface albedo changes due to black carbon aerosols (Xu et al., 2016; Liu et al., 2020).
Additionally, there are at least two more reasons why a robust attribution of past climate change to AAs is difficult, namely uneven spatial distributions and fast temporal evolution of emission/concentration/forcing. Unlike GHGs, the lifetimes of aerosols are as short as days, and thus, the spatial distribution of aerosol concentration and its forcing is highly heterogeneous, which may perturb regional climate differently compared to the well-mixed GHGs (Ming and Ramaswamy, 2011; Shindell et al., 2015). Lin et al. (2018) analyzed the relationship between aerosol and precipitation extremes and showed that precipitation extremes are more sensitive to aerosols than GHGs, consistent with Salzmann (2016), who examined the global mean precipitation. Also, the relatively shorter lifetime means that AA concentrations respond to local emission changes quickly. Indeed, global sulfate aerosol concentration has declined following strengthened emission control measures in the developed nations in the west (Klimont et al., 2013), which is in contrast to the monotonic increase in GHG concentration since the Industrial Revolution.
However, despite the differences between GHGs and aerosols, other studies found similar climate responses to GHGs and aerosols. Xie et al. (2013) found that the 20th century regional temperature and precipitation are similar in response to GHGs and the more spatially heterogeneous aerosol forcing. Song et al. (2021) showed that increasing GHGs and decreasing aerosols in the recent decades both delay rainfall by inducing a moister atmosphere. Both the differences and similarities between GHG- and aerosol-induced climate responses indicate the complexity and importance of the temporal and spatial distribution of AA forcings.
Because of the unique temporal and spatial features of AAs, some have argued that the aerosol forcing can induce an external-forced decadal variability, which can then be imposed onto the natural variabilities, further confounding a robust attribution of observed changes at a shorter timescale. For example, several recent studies suggested the reduction in aerosol emission over Europe contributes to the Atlantic Multidecadal Variability, which is, to a large extent, attributed to internal oceanic processes (Booth et al., 2012; Bellomo et al., 2018; Hua et al., 2019; Watanabe and Tatebe, 2019). The Atlantic Meridional Overturning Circulation (AMOC) is also argued, by recent studies, to be induced by AA forcing (Hassan et al., 2021; Menary et al., 2020), though with large uncertainties. Some studies focused on aerosol effects on the Pacific decadal to multidecadal variations, arguing that aerosol forcings can induce Pacific decadal variation (Allen et al., 2014; Dong et al., 2014; Hua et al., 2018), but the relative contribution of external forcing and internal variability remains unclear.
Given the rapid temporal evolution of global aerosol emission, and the regional redistribution of dominant aerosol emission regions from the west to east, the question of how AAs affect the regional climates needs further investigation. Many previous studies examined the aerosol geographical distribution effect on circulation, forcing, and temperature (Chemke et al., 2018; Shen and Ming, 2018). The recent aerosol unmasking in the west can have profound implications on the regional climate (Samset et al., 2018; Zhao et al., 2019; Y. Wang et al., 2020), Arctic sea ice (Krishnan et al., 2020), etc. Wang et al. (2015) demonstrated that the redistribution of aerosol from west to east induces a southward shift of the circulation systems and the weakening of tropical circulation. H. Wang et al. (2020) showed a large shift in the southern Hadley circulation due to AAs in the 20th century. Recently, Y. Wang et al. (2020) demonstrated that the reduced aerosol emission over Europe suppresses the Eurasian wintertime extremes.
Recently, a few studies attempted to separate the potential competing effects of regional aerosol forcings. Persad and Caldeira (2018) demonstrated diverse temperature responses due to regional aerosol forcings based on a set of idealized model simulations with identical emission placed at different continents. Kang et al. (2021) examined the climate responses to the zonal shift (west to east) of aerosol forcing but did not consider the meridional difference of western and eastern aerosol forcings. Understanding the climate response to the spatial (zonal and meridional) redistribution of aerosol forcing is the main motivation of the present study. We aim to separate and compare the potential competing roles of increasing aerosol forcing from the Eastern Hemisphere (EH) and decreasing aerosol forcing from the Western Hemisphere (WH) based on a suite of large-ensemble simulations with temporally evolving aerosol forcings.
An improved understanding can help shed light on other relevant problems on regional forcings, such as land use changes (e.g., deforestation over the Amazon vs. Africa), volcanic eruption (Verma et al., 2019), geoengineering solutions (such as stratospheric or tropospheric aerosol injection conducted over different locations), and the potential contrast of China and India's future emission trajectories in future decades (Samset et al., 2019; Wang et al., 2021). The fossil-fuel-related aerosols are projected to further decrease in future decades (Andreae et al., 2005; Zheng et al., 2020), even for Asian regions, with more strict air quality measures in developing nations. The future decline of fossil fuel (FF) aerosol will lead to further unmasking and warming in addition to GHG-induced global warming (Xu and Xie, 2015; Lelieveld et al., 2019; Allen et al., 2020; H. Wang et al., 2020) and have consequences for heat extremes (Xu et al., 2018; Zhao et al., 2019; Xu et al., 2020) and humidity and precipitation (Song et al., 2021).
This study leveraged a recently available large-ensemble simulation using the fully coupled global climate model and conducted additional regional single-forcing experiments to assess the aerosol impact on global climate change in the past few decades (1980–2020). The present study focuses on the zonal (WH to EH) asymmetry of aerosol forcing within the Northern Hemisphere. We aim to detail how the upward EH AA emission trend and the downward WH AA trend competes to affect tropical and midlatitude circulation and, simultaneously, affect the North Pacific surface climate, which may have played a role in determining the observed Pacific decadal variations.
The structure of this paper is the following. In Sect. 2, we provide the details of the climate model, the published simulation, and our new model experiment. In Sect. 3, we present simulated responses on the global and regional radiation budget (Sect. 3.1), air temperature (Sect. 3.2), and NH tropospheric circulation (Sect. 3.3), with a focus on separating the role of WH and EH FF forcing to have clear zonal asymmetry. The importance of the latitudinal distribution of AA forcing in driving North Pacific temperature change is highlighted in Sect. 3.4. In Sect. 4, we summarize our findings and suggest scientific questions for future research.
2.1 Climate model
The climate model used in this study is the Community Earth System Model 1 (CESM1). CESM1 is a fully coupled model developed by the National Center for Atmospheric Research (NCAR) and community scientists (Hurrell et al., 2013) and is one of the models participating in the Coupled Model Intercomparison Project Phase 5 (CMIP5) (Meehl et al., 2016). The CESM1 has been extensively applied in a variety of climate studies, including the ones focusing on external forcing and internal variability (e.g., Swart et al., 2015; Xu and Xie, 201; Kay et al., 2015; Ding et al., 2019). Studies utilizing the CMIP5 multimodel comparison (e.g., Samset et al., 2016; Smith et al., 2016; Lin et al., 2018) also demonstrated their capability for attribution studies on human-induced regional climate change.
Relevant to the aerosol effect focused on in this study, a scheme of the three-mode aerosol model (MAM3) – Aitken, accumulation, and coarse modes (Liu et al., 2012) – is used by default in CESM1 (CAM5). Aerosol concentration (including sulfates, black carbons, and organic carbons) in CESM1 (CAM5) is calculated online from the historical (up to 2005) and future (thereafter RCP8.5) emission scenarios. The cloud physics scheme allows ice supersaturation and features the activation of aerosols to form cloud droplets and ice crystals and, thus, enables simulations of aerosol indirect effects (Morrison and Gettlemen, 2008), which was missing in the model's predecessors.
The simulations used in this study are based on a model version of nominal 1∘ horizontal resolution (0.9∘ × 1.25∘) and 30 vertical levels. All simulation outputs analyzed in this study are based on monthly data.
2.2 Existing simulations
Our study relies on two published large-ensemble data sets using CESM1 (CAM5) as follows:
- a.
CESM1 Large Ensemble Project (CESM1-LENS; Kay et al., 2015).
- b.
CESM1 “Single Forcing” Large Ensemble Project (Deser et al., 2020).
The CESM1-LENS includes a 40-member ensemble of fully coupled simulations for the period of 1920–2100, with the same historical radiative forcing up to 2005 and the RCP8.5 scenario thereafter (Kay et al., 2015). Each ensemble member starts from the same simulation restart file in 1920 but with slightly different air temperatures perturbed at the level of rounded-off errors. In this paper, we use the term ALL (i.e., all forcing considered) to represent this large ensemble. One advantage of having a large-ensemble simulation is that we can separate climate responses to external forcings from internal variabilities by ensemble averaging. Thus, all results in this study are based on the ensemble average.
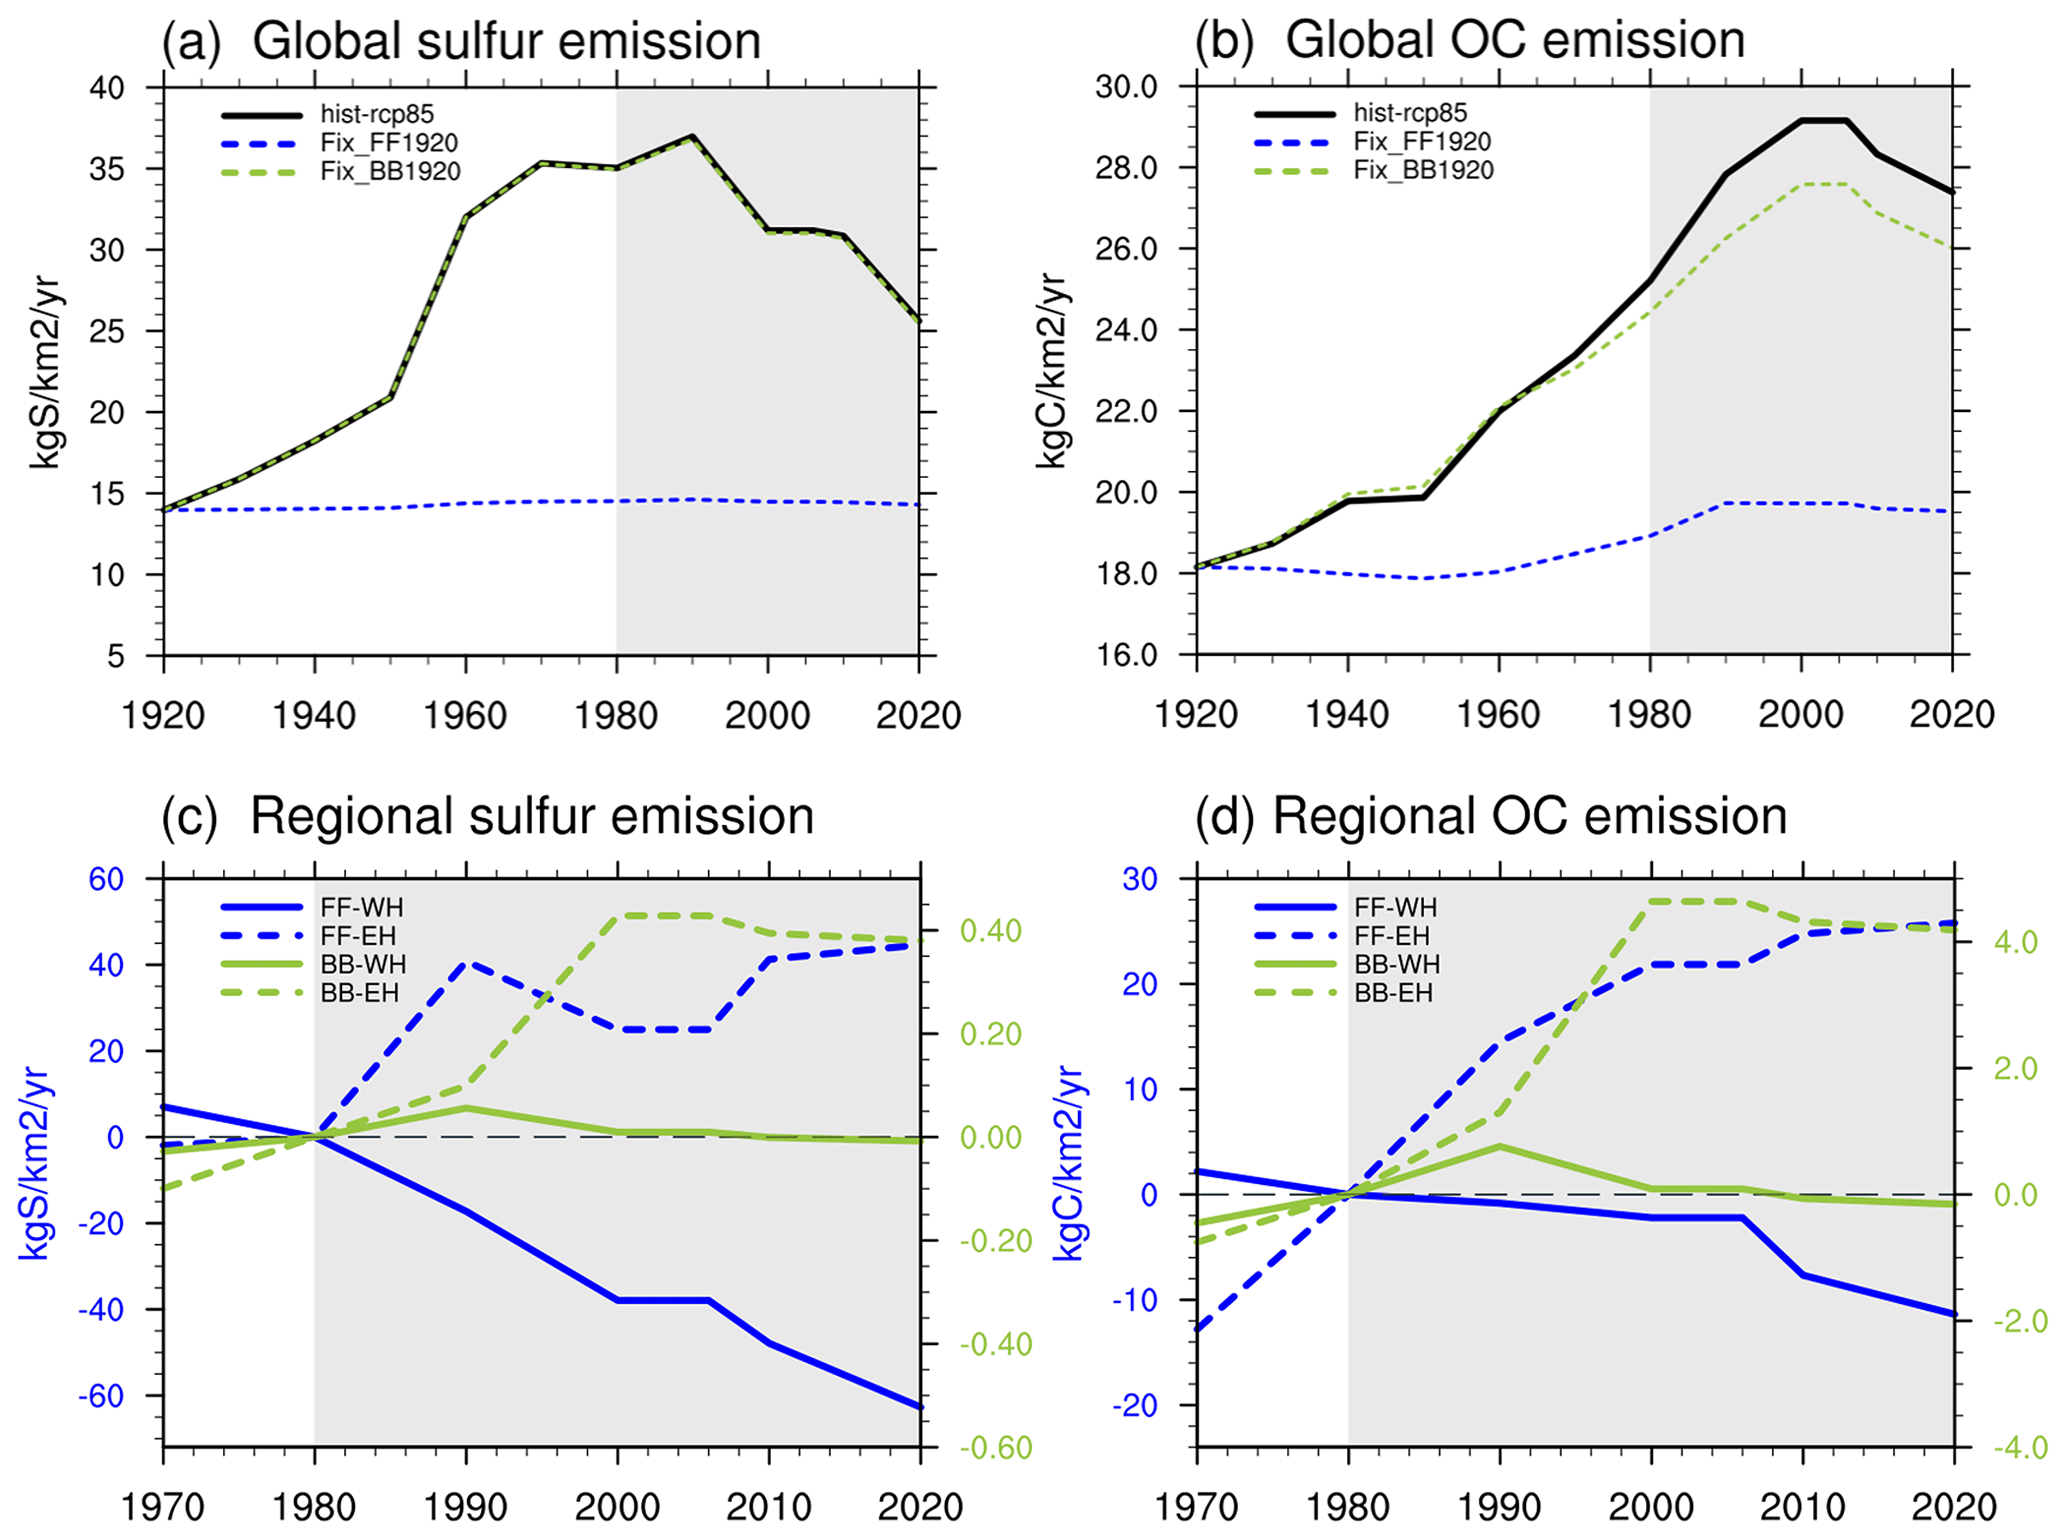
Figure 1Panels (a) and (b) show the global average anthropogenic emission of sulfur and OC from 1920 to 2020 in the three sets of simulations used in this study. FF represents the emission related to fossil fuel. BB represents biomass burning. The shaded areas of 1980–2020 are the period focused on in this study. Panels (c) and (d) are similar to (a) and (b) but with the difference between ALL and the corresponding fixed aerosol experiments indicated to show the regional FF or BB emissions. FF (blue lines) uses the left-hand side y axis and BB (green lines) uses the right-hand side y axis. Solid lines are for the western box (west box; 0–80∘ N, 120∘ W–40∘ E), and dashed lines are for the eastern box (east box; 0–80∘ N, 60–150∘ E). Boxes are shown in Fig. 2. All numbers in panels (c) and (d) are relative to the 1980 level to illustrate the change from 1980 to 2020.
The CESM1 “Single Forcing” Large Ensemble uses the same model setup of the CESM1-LENS, but with individual external forcing fixed at the 1920 level, while keeping all other external forcing evolving with time into the 21st century. The “Single Forcing” Large Ensemble includes four sets of ensembles with different single forcings fixed, i.e., (1) industrial aerosols (XAERindus; 20 members; 1920–2080), (2) biomass burning aerosols (XAERbmb; 15 members; 1920–2029), (3) greenhouse gases (XGHGs; 20 members; 1920–2080), and (4) land use/land cover (XLULC; five members; 1920–2029). Here in this study, we only used the first two ensembles. We changed the notation of the two ensembles to Fix_FF1920 (FF stands for fossil fuel) and Fix_BB1920 (BB stands for biomass burning) because, in the emission inventory data set, energy-/transportation-sector-related emission is also fixed, rather than the industrial activities only, as the original notation implies. We also emphasize the timing (the year 1920) of the leveling emission here because anthropogenic aerosol emissions in these simulations are not removed entirely but rather stay at a relatively low level (blue lines in Fig. 1a and b).
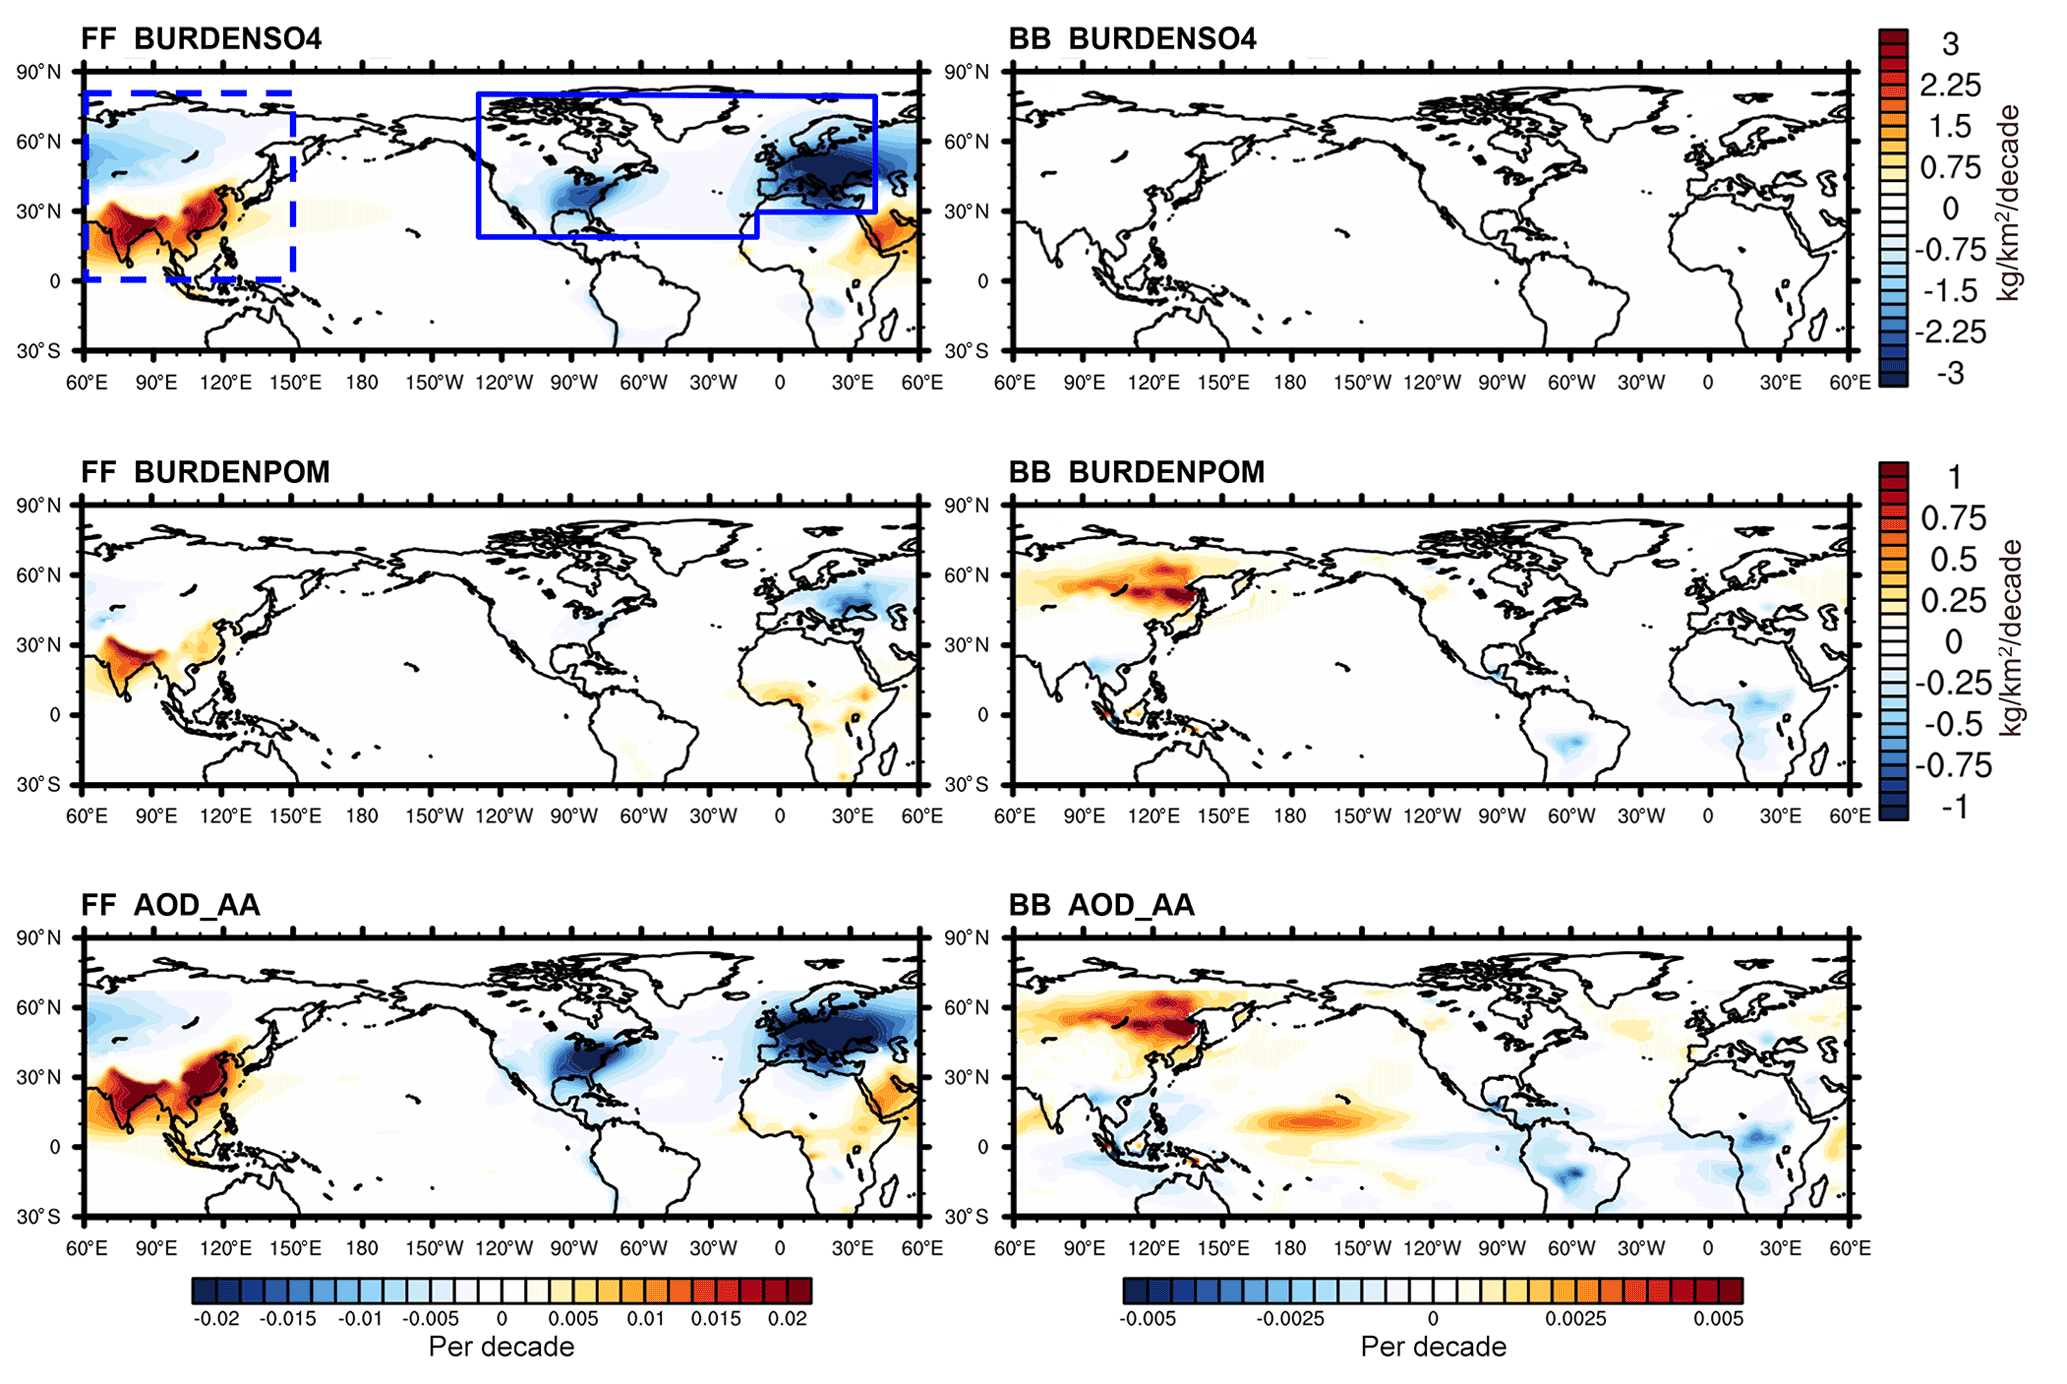
Figure 2The first and second rows show the 40-year trend of the sulfate and primary OC (POM) column burden (kilograms per square kilometer per decade; hereafter kg km−2 per decade) in response to FF (left) from 1980 to 2020 and BB (right) emission changes. Black carbon (BC) and secondary organic aerosol (SOA) are not shown, but the patterns are very similar to SO4. The third row shows the 40-year trend of AOD-AA (aerosol optical depth due to anthropogenic aerosols). Note that the color scale of FF is twice that of BB. The blue dashed box in the upper left panel indicates the Eastern Hemisphere box (EH box; 0–80∘ N, 60–150∘ E) used for the regional fixed-aerosol simulations. The solid box indicates the Western Hemisphere box (WH box; 20–80∘ N, 130–10∘ W, and 30–80∘ N, 10∘ W–40∘ E).
By subtracting the Fix_FF1920 or Fix_BB1920 ensemble average results from the ALL ensemble average, we can obtain climate responses to the fossil-fuel-related aerosol forcing (FF) or biomass burning aerosol forcing (BB). Note that other sets of single-forcing simulations (e.g., historicalMisc cases in CMIP5; see Taylor et al., 2012; hist-aer cases in CMIP6; see Gillett et al., 2016) simulate only historical aerosol evolution with all other forcings fixed at the pre-industrial state. The fixed-aerosol method adopted here (as in Deser et al., 2020, but also in earlier studies such as Xu and Xie, 2015) serves to estimate the aerosol effects with all other external forcings (such as GHGs) evolving in the background, which is arguably an advantage in the experimental design to assess the actual impact of single forcing.
One potential issue of using the fixed single-forcing approach is that we have assumed additivity when differentiating between the ALL and fixed single-forcing cases (i.e., Fix_FF1920 or Fix_BB1920). The additivity assumption is examined in several recent studies focusing on the nonlinear interaction between aerosols and GHGs (Deng et al., 2019) and for various climate variables, in particular for extreme precipitation (Lin et al., 2018).
2.3 New simulation
The existing two sets of single-forcing large-ensemble simulations (Fix_FF1920 and Fix_BB1920) enables a robust separation of aerosol-induced responses and a comparison of the role of FF and BB forcing. However, FF forcing features a strong zonal asymmetry starting from the 1980s (blue solid vs. dashed lines in Fig. 1c–d), which continuously increases over the EH (dashed lines) and decreases over the WH (solid lines). The sharp contrast and competition between WH and EH in the FF emission and forcing trend (driven by different air pollution policy) brings extra complexity to our attribution.
To gain further insights on the role of regional forcing (east vs. west), we conducted two additional sets of regional single-forcing large-ensemble simulations (10 realizations for each case) by branching from the existing run of Fix_FF1920. In the experiment of the fixed eastern fossil fuel simulation (Fix_EastFF1920), we use the same initialization protocol as Fix_FF1920 but only fix the aerosols over the EH box (0–80∘ N, 60–150∘ E; shown as the blue dashed box in Fig. 2), where FF aerosol emissions over other regions are allowed to evolve, including the decline over North America and Europe (shown as the blue solid box in Fig. 2). The experiment of the fixed western fossil fuel simulation (Fix_WestFF1920) is similar to the setup of Fix_EastFF1920 case, except that we fix the aerosols over WH box (20–80∘ N, 130–10∘ W and 30–80∘ N, 10∘ W–40∘ E; shown as the blue dashed box in Fig. 2). We run the two sets of simulations from 1920 through 1980 for one realization and then expand the ensemble size to be 10 for 1980–2020. A small random perturbation of surface temperature is applied to each realization to generate ensemble spreads.
In Fix_EastFF1920, except for the increasing negative forcing in the lower latitudes of eastern Asia, Siberia shows a slight weakening of the negative forcing (positive anomaly of radiative forcing) due to the extension of the WH aerosol reduction. However, the extended positive radiative forcing anomaly is considerably weak compared to the negative forcing and is largely constrained in the small emission domain. Therefore, the difference between ALL and Fix_EastFF1920 can be safely used to represent the climate in response to the dominant role of the negative radiative forcing from lower latitudes of Asia.
Similar to how we obtain the FF response, we subtract the ensemble average results of Fix_EastFF1920 and Fix_WestFF1920 from ALL, respectively, to obtain climate responses to regional fossil-fuel-related aerosol forcings (i.e., EastFF and WestFF). An additivity test is conducted to evaluate whether the summation of EastFF and WestFF can roughly reproduce FF. The SO4 column burden (BURDENSO4) and surface temperature in response to FF and EastFF and WestFF (hereafter SUM) are shown in Fig. 3. The FF-induced SO4 column burden resembles the sum of the SO4 burden from SUM. The surface temperature responses are also very similar between FF and SUM, except for the central Pacific and part of the Arctic region. The warm bias over the central Pacific in SUM is possibly associated with forcings outside the two focused regions (EH box and WH box in Fig. 2), or it is due to the residual effect of internal variability even after ensemble average due to limited ensemble sizes. Overall, the sum of the two sets of regional fixed single-forcing experiments well represents the major patterns of FF aerosol induced response, and thus, the two new sets of simulations here are capable of separating the east versus west aerosol forcings.
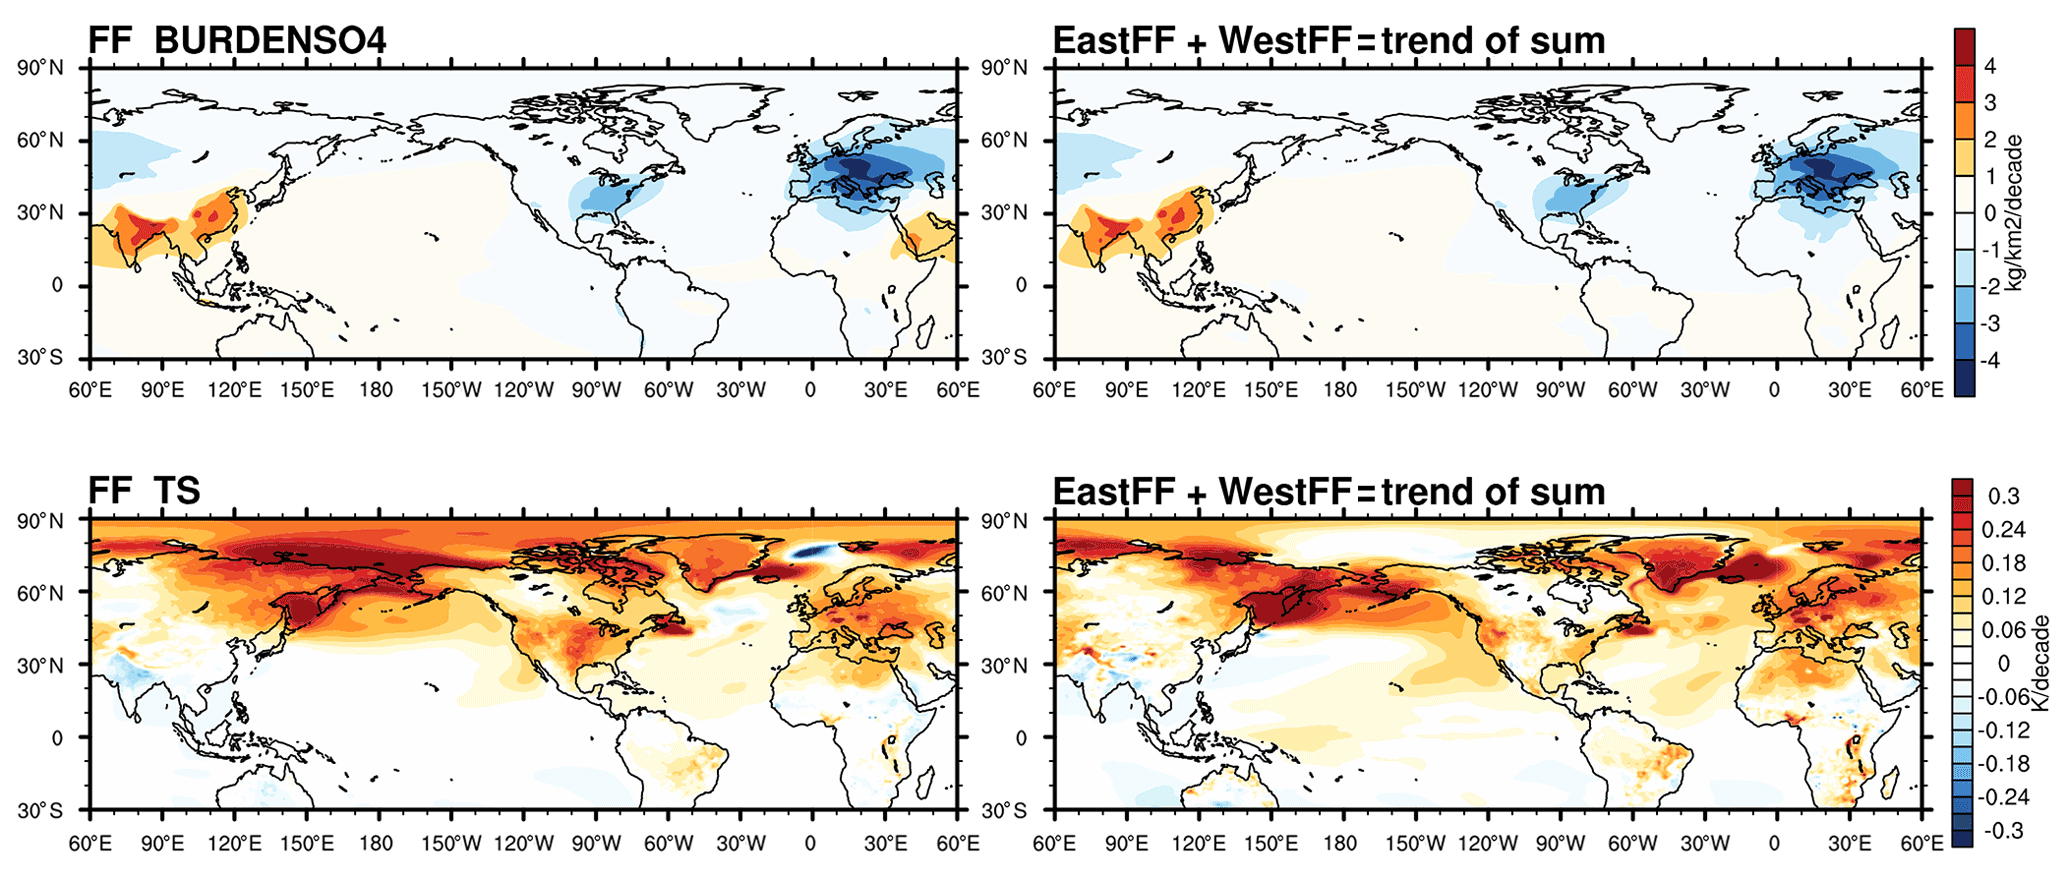
Figure 3The left column shows the 40-year trend of (top) sulfate column burden (kg km−2 per decade) and (bottom) surface air temperature in response to FF forcing from 1980 to 2020. The right column shows the same as the left column but for the summation of EastFF and WestFF, which is obtained by first adding EastFF and WestFF responses together and then calculating the 40-year trend.
Note that we did not conduct the analogous simulation for BB because, for NH, the significant BB emission and forcing trends during 1980–2020 are only over the EH (green dashed lines in Fig. 1c–d), specifically from northeastern Asia. Thus, the existing Fix_BB1920 simulation already captures the regional contribution from the EH.
3.1 Zonal asymmetry of anthropogenic aerosol forcing in the recent decades
Figure 1 shows the global and regional emissions of two major types of AAs (sulfur aerosols and organic carbon). Globally, it is clear that the AA emission has started to decline since the late 20th century (shaded area of 1980–2020 as the focused period of this study), but the decrease in aerosols mainly comes from developed countries in North America and Europe (solid lines as WH in Fig. 1c–d), while the developing countries in Asia (e.g., China and India) are still in the phase of increasing aerosol emission (dashed lines as EH in Fig. 1c–d).
The first row of Fig. 2 depicts the 40-year linear trend of the SO4 column burden between 1980 and 2020. The SO4 trend, as the dominant cooling aerosol produced by FF, shows a clear heterogeneous pattern in the NH, with a decrease over North America and Europe (shown as the blue solid box) and a strong increase over China and India (shown as the lower part of the blue dashed box). Note that the decrease in SO4 column burden also occurs over the mid-to-high latitudes of Asia, though with weaker trends compared to Europe and North America.
Unlike sulfate, another major cooling aerosol species, primary organic matter (POM), burden shows different distributions (second row of Fig. 2). FF-related POM is similar to that of the SO4 burden but with much weaker negative trends over North America and also a weaker positive trend over China compared to SO4. In contrast, BB-related POM features a much stronger increasing trend over northeastern Asia (40–70∘ N, 70–150∘ E), and a slight decrease over the rainforests of the Amazon and Congo. Combining FF and BB, the significant increasing trend of POM occurs over Asia at both low latitudes and high latitudes, while a relatively weaker decline trend can be found over Europe, Africa, and South America, again constituting a west–east zonal asymmetry. The secondary organic aerosol (SOA) burden resembles the SO4 burden in both the FF and BB cases but with weaker trends.
Aerosols with heating effects (such as black carbon; not shown) resemble the spatial pattern of the SO4 burden shown in Fig. 2. However, the overall aerosols effect is dominated by cooling aerosols such as SO4. Thus, in this study, we only focus on the total cooling effect of aerosols, without separating the warming and cooling competition as done in several earlier studies (Xu and Xie, 2015; Lin et al., 2016; Wang et al., 2017).
Looking at aerosol mass burden only is insufficient to establish connections between the radiative forcing response and aerosol emissions because different aerosol species could have different radiative forcing efficiency. Thus, we further show aerosol optical depth due to anthropogenic aerosol emission (AOD_AA) in the bottom panels of Fig. 2. To remove AOD induced by natural aerosols such as dust and sea salt, we derive AOD_AA following Eq. (1), in which the AODVIS is the total AOD at the 550 nm band, and the AODDUST 1–3 represents the dust AOD with different sizes. The background AOD (bkg_AOD) is the 100-year climatology of AODVIS − AODDUST (1–3) in the CESM1 pre-industrial control run, which is dominated by sea salt.
As expected, the AOD_AA trend (third row in Fig. 2) in response to FF resembles the SO4 burden (first row in Fig. 2), while AOD_AA in response to BB is in close agreement with the POM. Both the FF and BB AOD trends feature zonal asymmetry across the Pacific Ocean, with differences in terms of latitudinal distribution (increase at lower latitudes versus decrease at higher latitudes in FF). The implications of these spatial contrasts on climatic responses will be further discussed in the next section.
It is clear that BB shows a simple distribution without zonal competition, where a significant increase occurs over northeastern Asia. Therefore, our following discussion will only focus on the FF responses which show significant zonal differences. Based on the released simulation and the new regional FF simulations, we are able to separate the climate responses into aerosol increase over the EH and aerosol reduction over the WH.
In line with the zonal asymmetry of AOD_AA trends, the simulated solar radiation flux also has significant zonal contrast due to the direct and indirect climate effects of the aerosols. The first row of Fig. 3 shows the surface downward solar radiation (FSDS), which is broadly consistent with the patterns of the AOD_AA trend (third row of Fig. 2). Note the opposite colors, though, because a decline in AOD_AA leads to an increase in FSDS. The global surface radiative forcing shows an overall positive trend in response to the decrease in the global sulfate emission but with significant spatial heterogeneity due to the opposite regional emission trends. An increase in FSDS occurs over North America, Europe, and the northern part of Asia, consistent with reducing aerosol forcings over these regions. In contrast, the increasing aerosol emission over eastern Asia induces a substantial decrease in FSDS. The net solar radiation at the top of the atmosphere (FSNTOA; the second row of Fig. 3), as the main metric for aerosol forcing, is also consistent with FSDS patterns, but shows more obvious responses over the ocean. Both FSDS and FSNTOA show significant trends over not only the emission domain but also over extended regions into the ocean surface. In response to WestFF, the North Atlantic region shows strong increases in solar radiations, which is consistent with the significant decrease in cloud droplet number concentration (CDNC; third row of Fig. 3). However, the cloud fractions (fourth row of Fig. 3) show very weak changes over the North Atlantic, which indicates the critical role of the aerosol first indirect effect over the North Atlantic (Penner et al., 2001). The reduction in aerosol emission over North America also leads to smaller CDNC over the North Pacific in the WestFF case, further contributing to a positive radiative forcing anomaly. In contrast, in response to EastFF, CDNC shows a significant increase over the subtropical Pacific in the Northern Hemisphere, which is consistent with the weak increase in SO4 burden over this region. The larger CDNC increases cloud albedo and amplifies the negative radiative forcing. The negative radiative forcing over the subtropical Pacific is evident in the EastFF case but weaker in the (total) FF case due to the offset by the decreasing aerosols from North America.
The cloud fractions over this region also show an increasing trend in the FF and EastFF but fail to pass the significance test in the FF case. Surprisingly, the eastern subtropical Pacific in the Southern Hemisphere also shows significant changes in top-of-atmosphere (TOA) solar radiation and the cloud fraction, without much aerosol changes. This may possibly be explained by the slow response of sea surface temperature (SST) to the aerosol forcing, where the cloud fraction is affected by the climate adjustment due to SST or circulation changes (Xu and Xie, 2015; Wang et al., 2016; Dong et al., 2019; Kang et al., 2021). The slow responses of cloud fraction to aerosol forcing could also occur near the emission regions where SST changes more significantly; however, as discussed above, the simulated radiation changes over and near the emission regions are highly consistent with the changes in the CDNC, indicating a dominant role of indirect aerosol forcing through microphysics perturbation. Here we mainly focused on the overall circulation changes in response to regional aerosol forcings using a fully coupled climate model; therefore, a clear separation of the slow and fast responses of clouds and climate to aerosol forcing is beyond the scope of this study.
The North Pacific region, a focused region of this study, shows the complex competition of the two emission sources, where WestFF induces a significant decrease in cloud droplet concentration (along with increasing FSNTOA) northward of 30∘ N. In contrast, EastFF leads to an opposite trend at 30∘ N and south. One may expect that an increase in FF aerosol over Asia would lead to a negative forcing trend over the North Pacific, as is claimed in previous studies, but, actually, the simulated negative trends are confined to lower latitude regions (30∘ N and south). The two sets of regional forcing simulations reveal clearly that the decline of FF aerosol over the WH midlatitudes induces the positive radiative forcing anomaly at mid-to-high latitudes of the North Pacific, producing a weak positive FSNTOA trend. This demonstrated east–west competition is a focal point of our following analysis. In the subsequent sections, we will discuss the possible mechanisms in terms of temperature and circulation changes.
3.2 Simulated responses in the hemispheric average of surface air temperature
In Sect. 3.1, we demonstrate the distinct east–west pattern of the aerosol emission changes and its radiative effect. This section analyzes the simulated response in the hemispheric average of surface air temperature (SAT).
Figure 5a shows the Northern Hemisphere (NH) mean SAT from the two large-ensemble simulations. Without the FF aerosol emission in Fix_FF1920 simulation (blue line in Fig. 5a), NH mean SAT is significantly warmer than the air temperature in the ALL simulation (black line in Fig. 5a). Large volcanic eruptions (four major ones are shown as vertical dashed lines in Fig. 5a) also strongly affect the NH mean SAT by causing an abrupt cooling of about 0.1 to 0.3 K episodically, but the cooling effects quickly recover in a few years, which means it hardly affects the multidecadal climate trend. The global mean SAT evolutions resemble the NH result but with a weaker magnitude. The stronger response over NH is reasonable because most of the emission sources (and land regions) are located at the NH, and aerosol burden and radiative forcing (Figs. 2 and 3) are regionally concentrated.
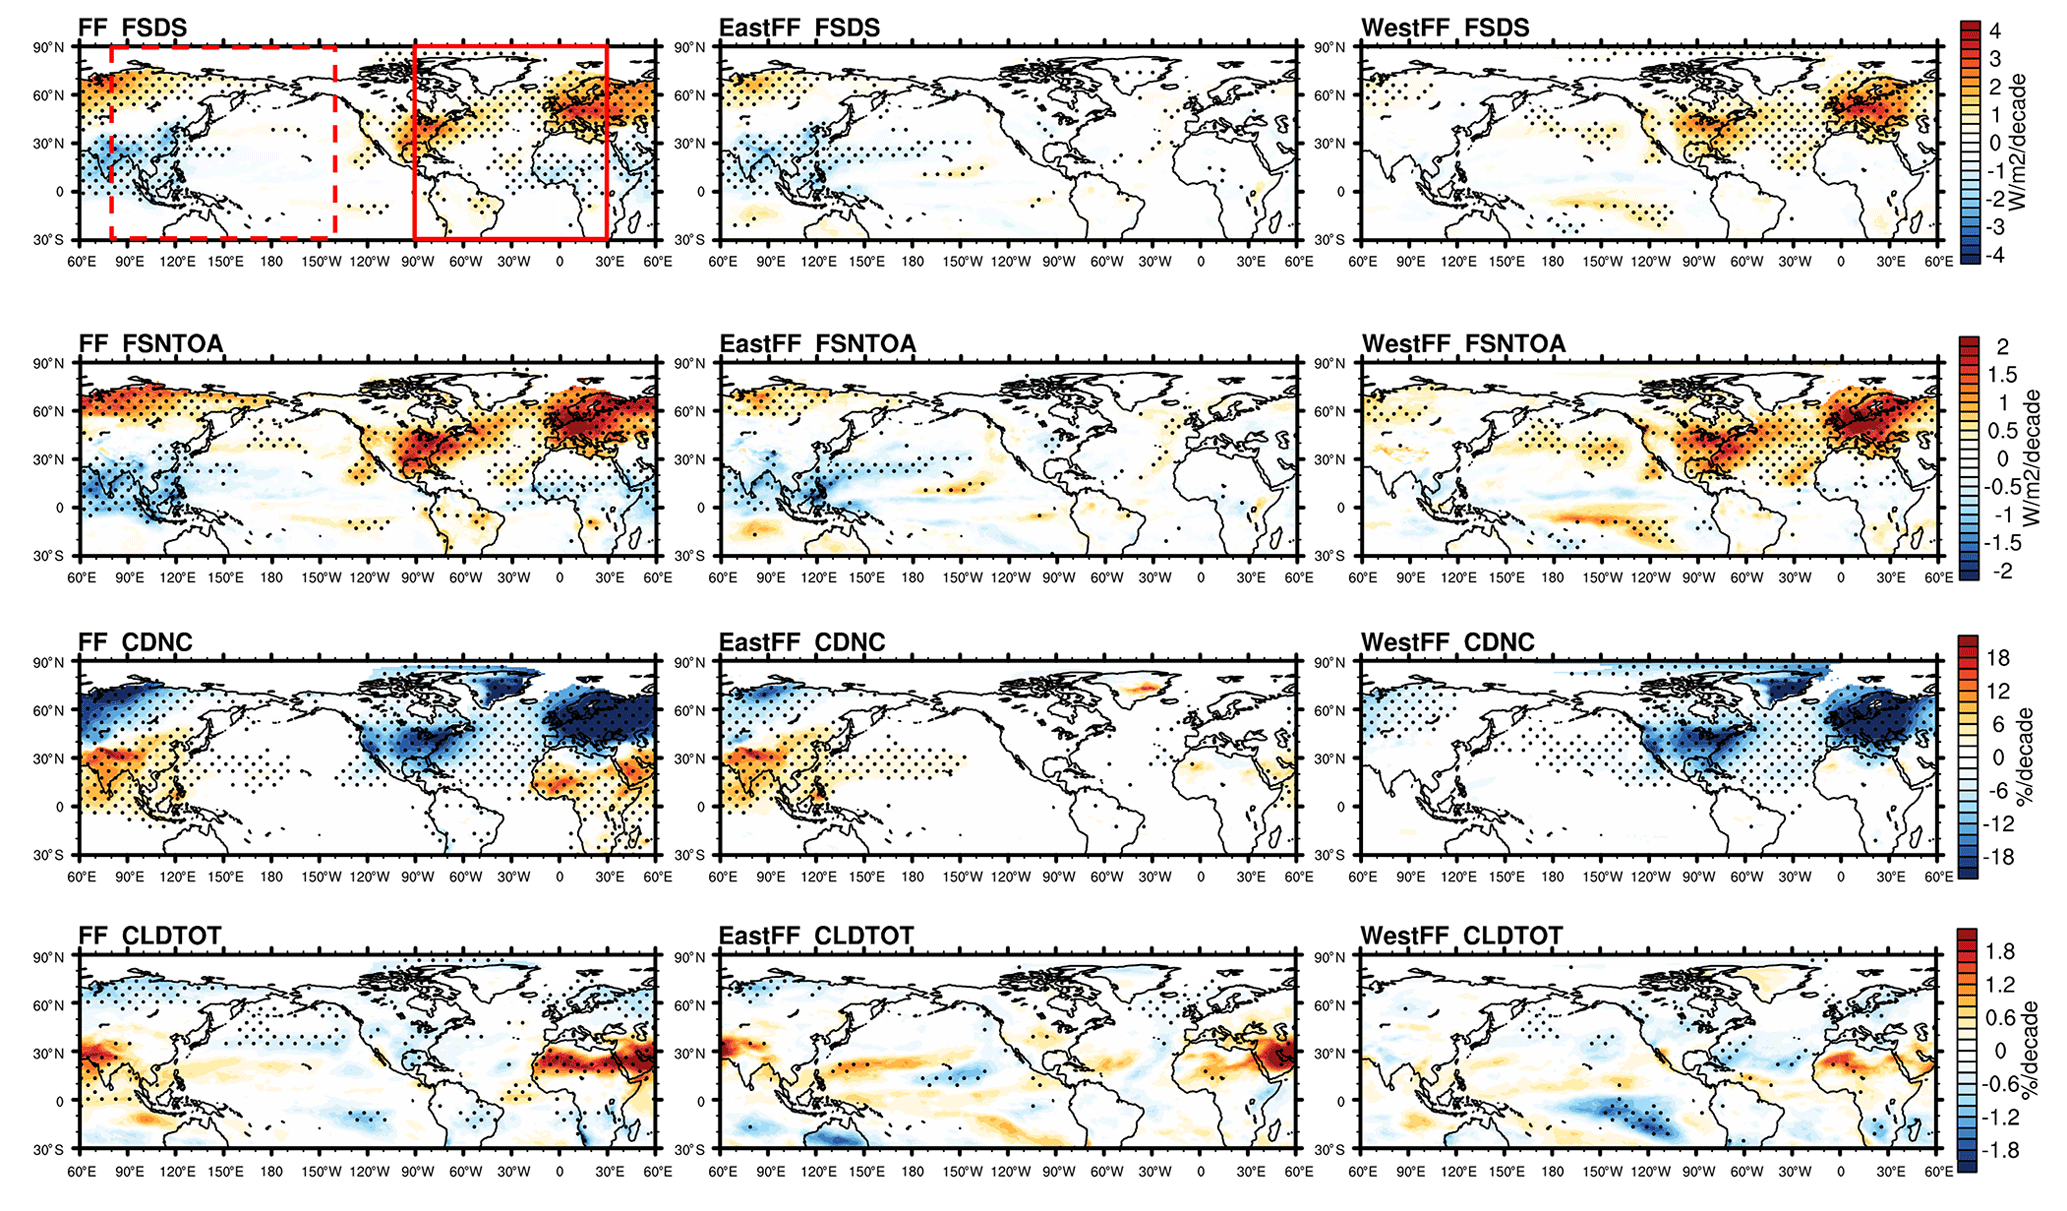
Figure 4The first row shows 40-year trend in surface downward solar flux (FSDS; Watts per square meter per decade; hereafter W m−2 per decade) in response to FF (left), EastFF (mid), and WestFF (right). The second row shows the top-of-atmosphere net solar flux (FSNTOA; W m−2 per decade), the third row shows the vertically integrated droplet number concentration (CDNC; percent per decade), and the fourth row shows the total cloud fraction (CLDTOT; percent per decade). The CDNC and CLDTOT patterns show the percentage trend relative to the 40-year climatology. Dotted areas indicate the region where the trend passes the 95 % significance test. The high-latitude ocean regions with significant sea ice change (e.g., the Arctic and the Sea of Okhotsk) are masked to remove the surface albedo change effects. The dashed box in the left panel of first row indicates the Eastern Hemisphere (EH box; 80∘ E–140∘ W) used in our subsequent analysis, and the solid box indicates the Western Hemisphere (WH box; 90∘ W–30∘ E).
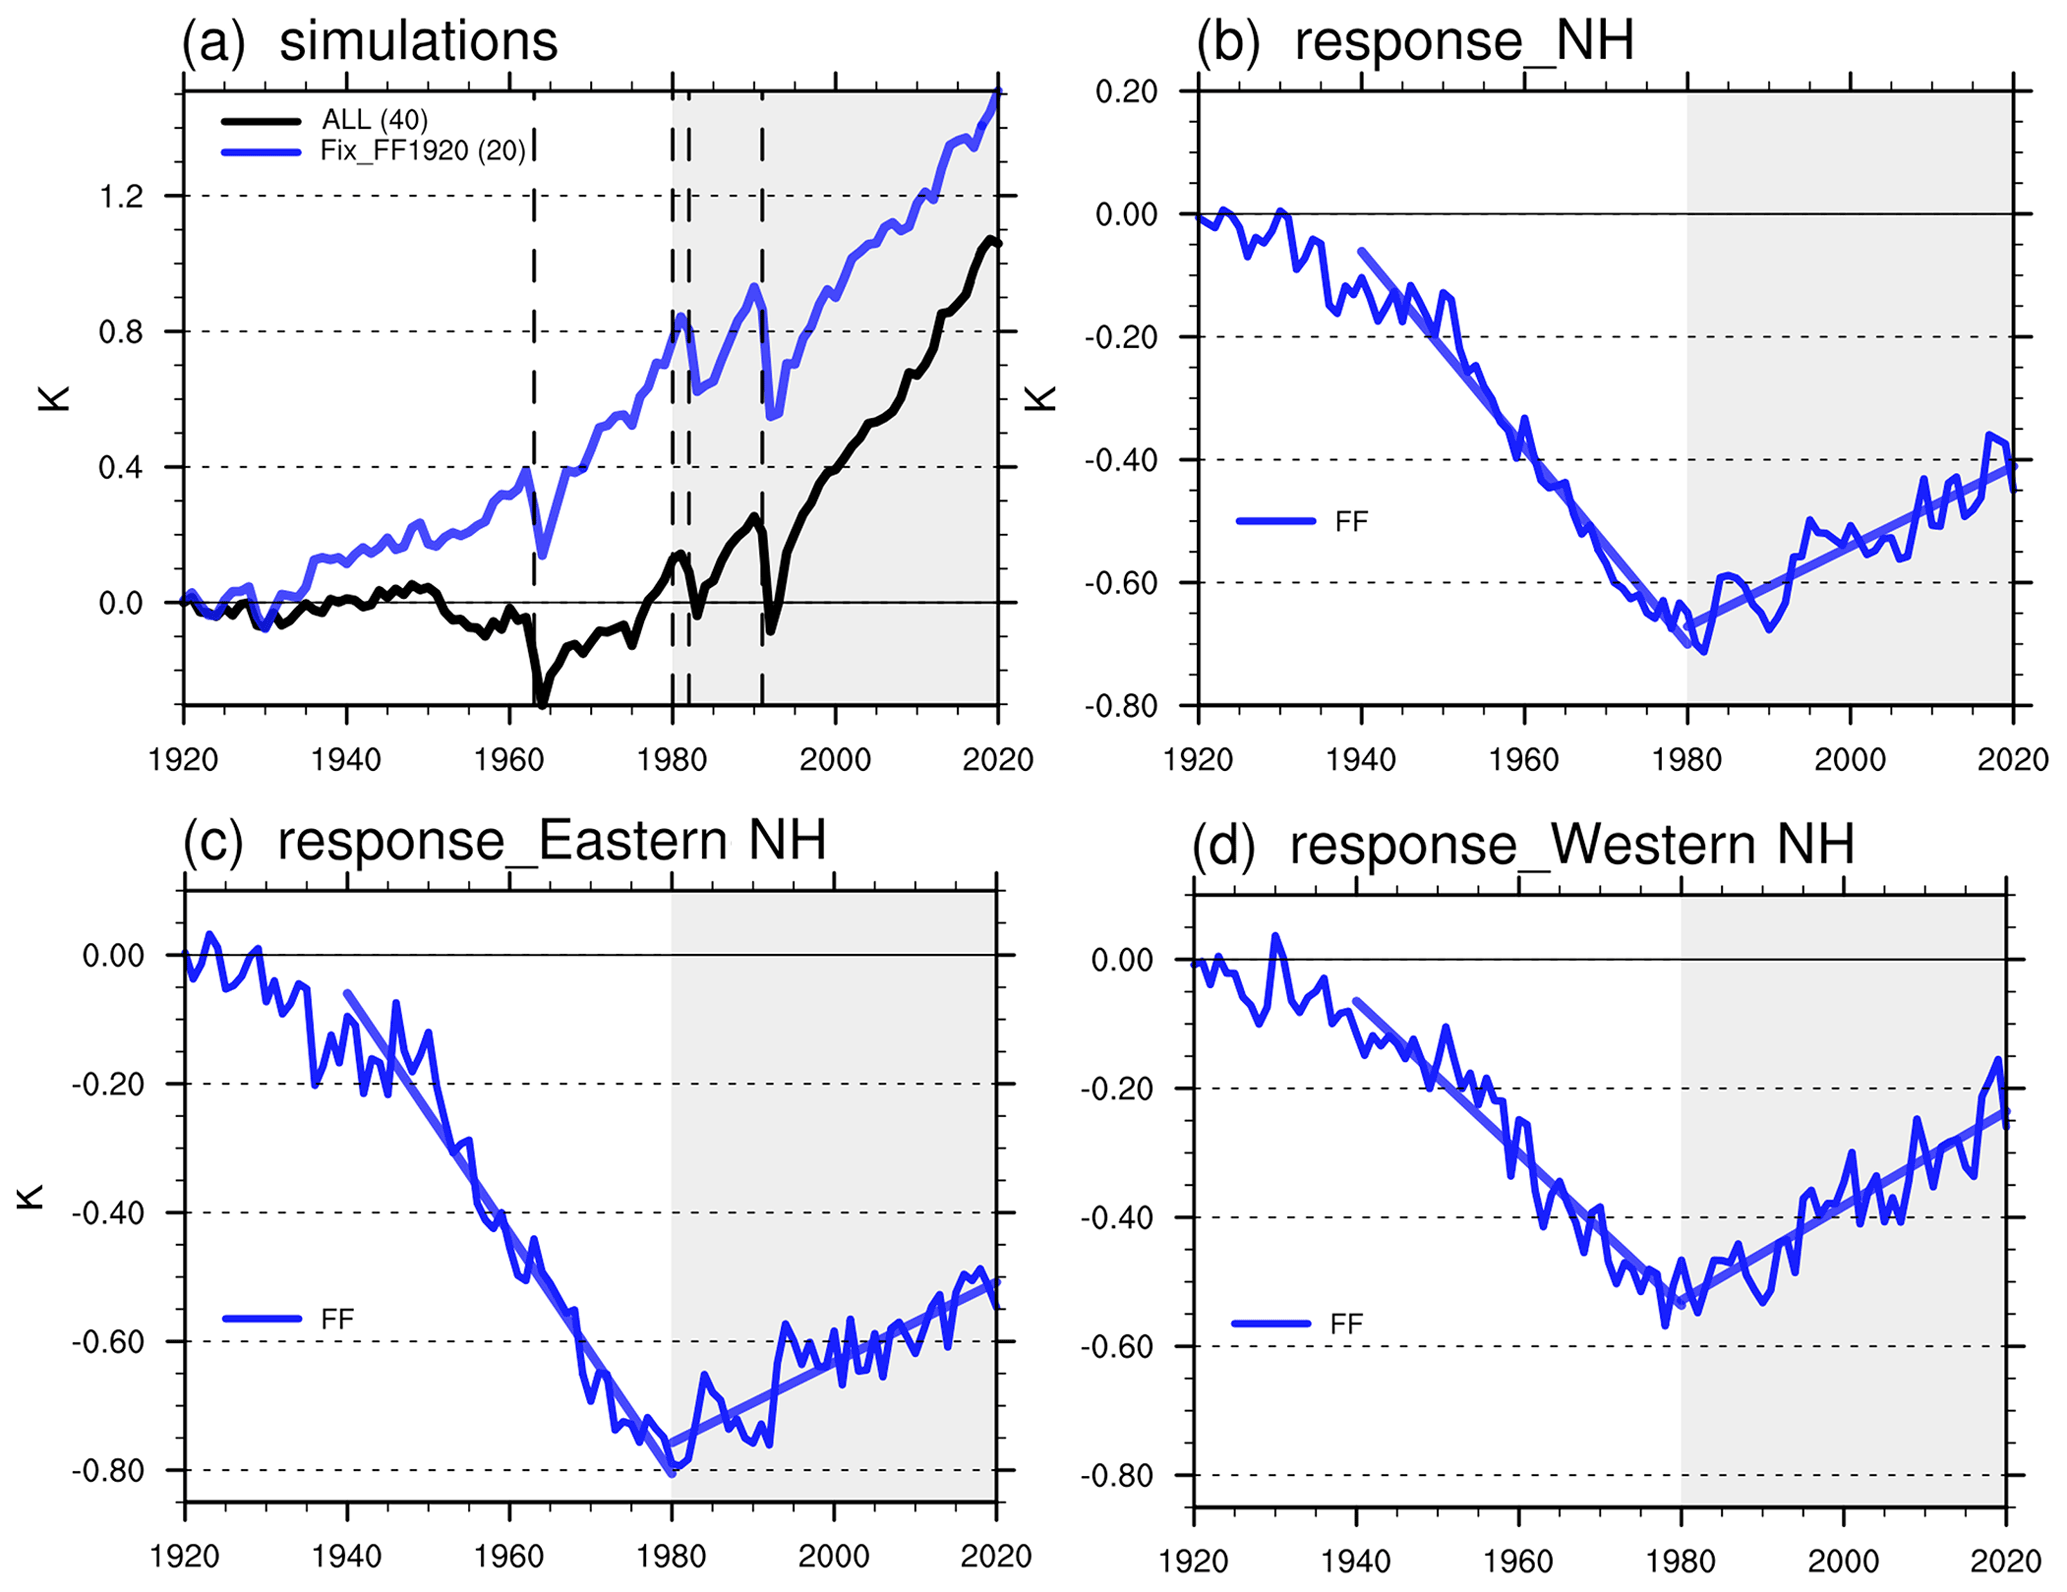
Figure 5(a) The Northern Hemisphere (NH) surface air temperature (SAT) anomalies (relative to 1920) in two sets of simulations, with ALL (all forcing – historical and RCP8.5; black line; 40 member) and Fix_FF1920 (blue line; 20 member). The four dashed lines indicate the four major volcanic eruption events (greater than category 5) during the 20th century. Shaded areas are the focused period of this study. (b) The SAT responses to FF (blue). The thicker straight lines indicate the 40-year linear fits for 1940–1980 and 1980–2020, respectively. Panels (c) and (d) are similar to panel (b) but for the EH and WH boxes (see boxes in Fig. 4).
Figure 5b shows the climate response to FF by calculating the difference between the ALL and Fix_FF1920 simulation. It indicates that the mid-20th-century aerosol cooling effect is dominated by FF aerosol (Meehl et al., 2004), with a cooling trend of 0.16 K per decade over NH. Since the 1980s, as the aerosol emission started to decline over WH, the NH mean SAT response to FF aerosol has shifted to a slightly warming trend by about 0.07 K per decade.
Because of the distinct east–west aerosol forcing asymmetry, we further examine how the aerosol emissions would influence regional SAT differently. Fig. 5c–d shows the temperature responses over the eastern (80∘ E–140∘ W) and the western (90∘ W–30∘ E) portion of NH separately. The domains are shown as the red boxes in Fig. 4, but here we only consider the NH portion to be consistent with Fig. 5a and b. The western NH temperature in response to FF (Fig. 5d) is largely following local emission evolution (Fig. 1), with a cooling along with the increasing emission before the 1980s and warming along with emission reduction afterward.
Notably, the eastern NH responses to FF are counterintuitive. There is a warming trend of 0.06 K per decade (same as western NH) after the 1980s (Fig. 5c), even with continuously increasing aerosol emission over this region, suggesting that eastern NH is sensitive to the remote influence of WH aerosols. Indeed, the eastern NH cooling response is even larger than the western NH response during the previous cooling period (1940–1980; −0.17 versus −0.11 K per decade). The apparent contradiction of the EH warming in response to FF (Fig. 5c) and the local negative FF forcing (third row of Fig. 2) bears important implications for tropospheric temperature and circulation changes (to be further explored in Sect. 3.4). Here we argue that the larger remote response of EH temperature to WestFF is due to the latitudinal difference in aerosol emission location, where WH emission changes mainly occur over mid-to-high latitudes (30–60∘ N; the first row of Fig. 2), while the EH emission changes are mainly located over low- to midlatitudes (southward of 40∘ N; the first row of Fig. 2). As a result, during 1980–2020, there is only a weak regional cooling over EH, due to local FF aerosols, and it is confined over low latitudes of EH. The WH decline in emission, however (positive radiative forcing anomaly), dominates the mid-to-high latitudes SAT change, including the North Pacific. Detailed analysis of this intriguing latitudinal contrast in forcing will be provided in Sect. 3.4 for regional SAT over the North Pacific.
3.3 Tropospheric responses
Because of the complex zonal and meridional differences in aerosol emission during 1980–2020 (Sect. 3.1), and the competition between EastFF and WestFF in changing NH air temperature (Sect. 3.2), tropospheric circulation responses could also be distinct over different regions. In this subsection, we discuss the global and regional tropospheric circulation responses due to the evolving anthropogenic aerosol emission, which have a major implication on midlatitude climate (Xu and Xie, 2015; Mann et al., 2017; Wang, Y. et al., 2020).
Previous studies have explored the tropospheric circulation responses to the interhemispheric (meridional) forcing gradient due to anthropogenic aerosols – more reflecting aerosols over the NH compared to the SH will lead to an equatorward shift of the NH Hadley cell and NH westerly wind (e.g., Hwang et al., 2013; Hilgenbrink et al., 2018). Meanwhile, recent studies also put effort into how the west–east contrast effects of aerosol induce the circulation changes (Wang et al., 2015; Kang et al., 2021). However, from 1980 to 2020, NH anthropogenic aerosol forcing (Sect. 3.1) has been highly heterogeneous, with both zonal and latitudinal contrasts (Fig. 4), further compounding the forcing–response relationship (Shindell and Faluvegi, 2009; Persad and Caldeira, 2018). Next, we will analyze the aerosol-induced tropospheric responses (in terms of zonal average), both globally and regionally, for the EH and WH portions (domains as red boxes in Fig. 4a).
Figure 6a–c shows the decadal trend of global zonal mean meridional overturning stream function (ZMMSF) in response to FF, EastFF, and WestFF during 1980–2020. The ZMMSF in response to FF features a counterclockwise Hadley cell anomaly (shown in blue) over the tropics, which indicates a northward shift of the Hadley cell into the NH. The northward shift of the Hadley cell also occurs in response to WestFF but not to EastFF, indicating that the shift of the Hadley cell is mainly due to the WestFF. The global mean ZMMSF shifts in our results are consistent with previous studies (Xu and Xie, 2015; Allen and Ajoku, 2016; Amaya et al., 2018; Shen and Ming, 2018) focusing on the interhemispheric forcing gradient. That is, the tropical circulation always tends to move towards a warmer hemisphere with stronger radiative forcing.

Figure 6Panels (a–c) show the 1980–2020 trend of zonal mean meridional stream function (ZMMSF; 109 kg s−1 per decade) in response to (a) FF, (b) EastFF, and (c) WestFF. The positive values (solid lines for climatology and red shading for the long-term trend) indicate clockwise circulation. The statistically insignificant trend is masked in white. The arrows indicate the latitudinal shift of the Hadley cell. Panels (d)–(f) are similar to panels (a)–(c) but for zonal mean zonal wind (U; meters per second per decade; hereafter m s−1 per decade). The positive values indicate westerly wind. The arrows indicate the latitudinal shift direction of the NH jet stream core. The latitudinal profiles below show the top-of-atmosphere net solar flux trend (FSNTOA as in Fig. 5c; W m−2 per decade) and the gradient of FSNTOA trend (black curves; Watts per square meter per decade per 10∘ latitude; hereafter W/m2 per decade per 10∘ lat). The trend and gradient lines are smoothed using the moving average method (with 30∘ of the latitudinal range sampling window). The dashed lines are the linear fit from 0 to 60∘ N.
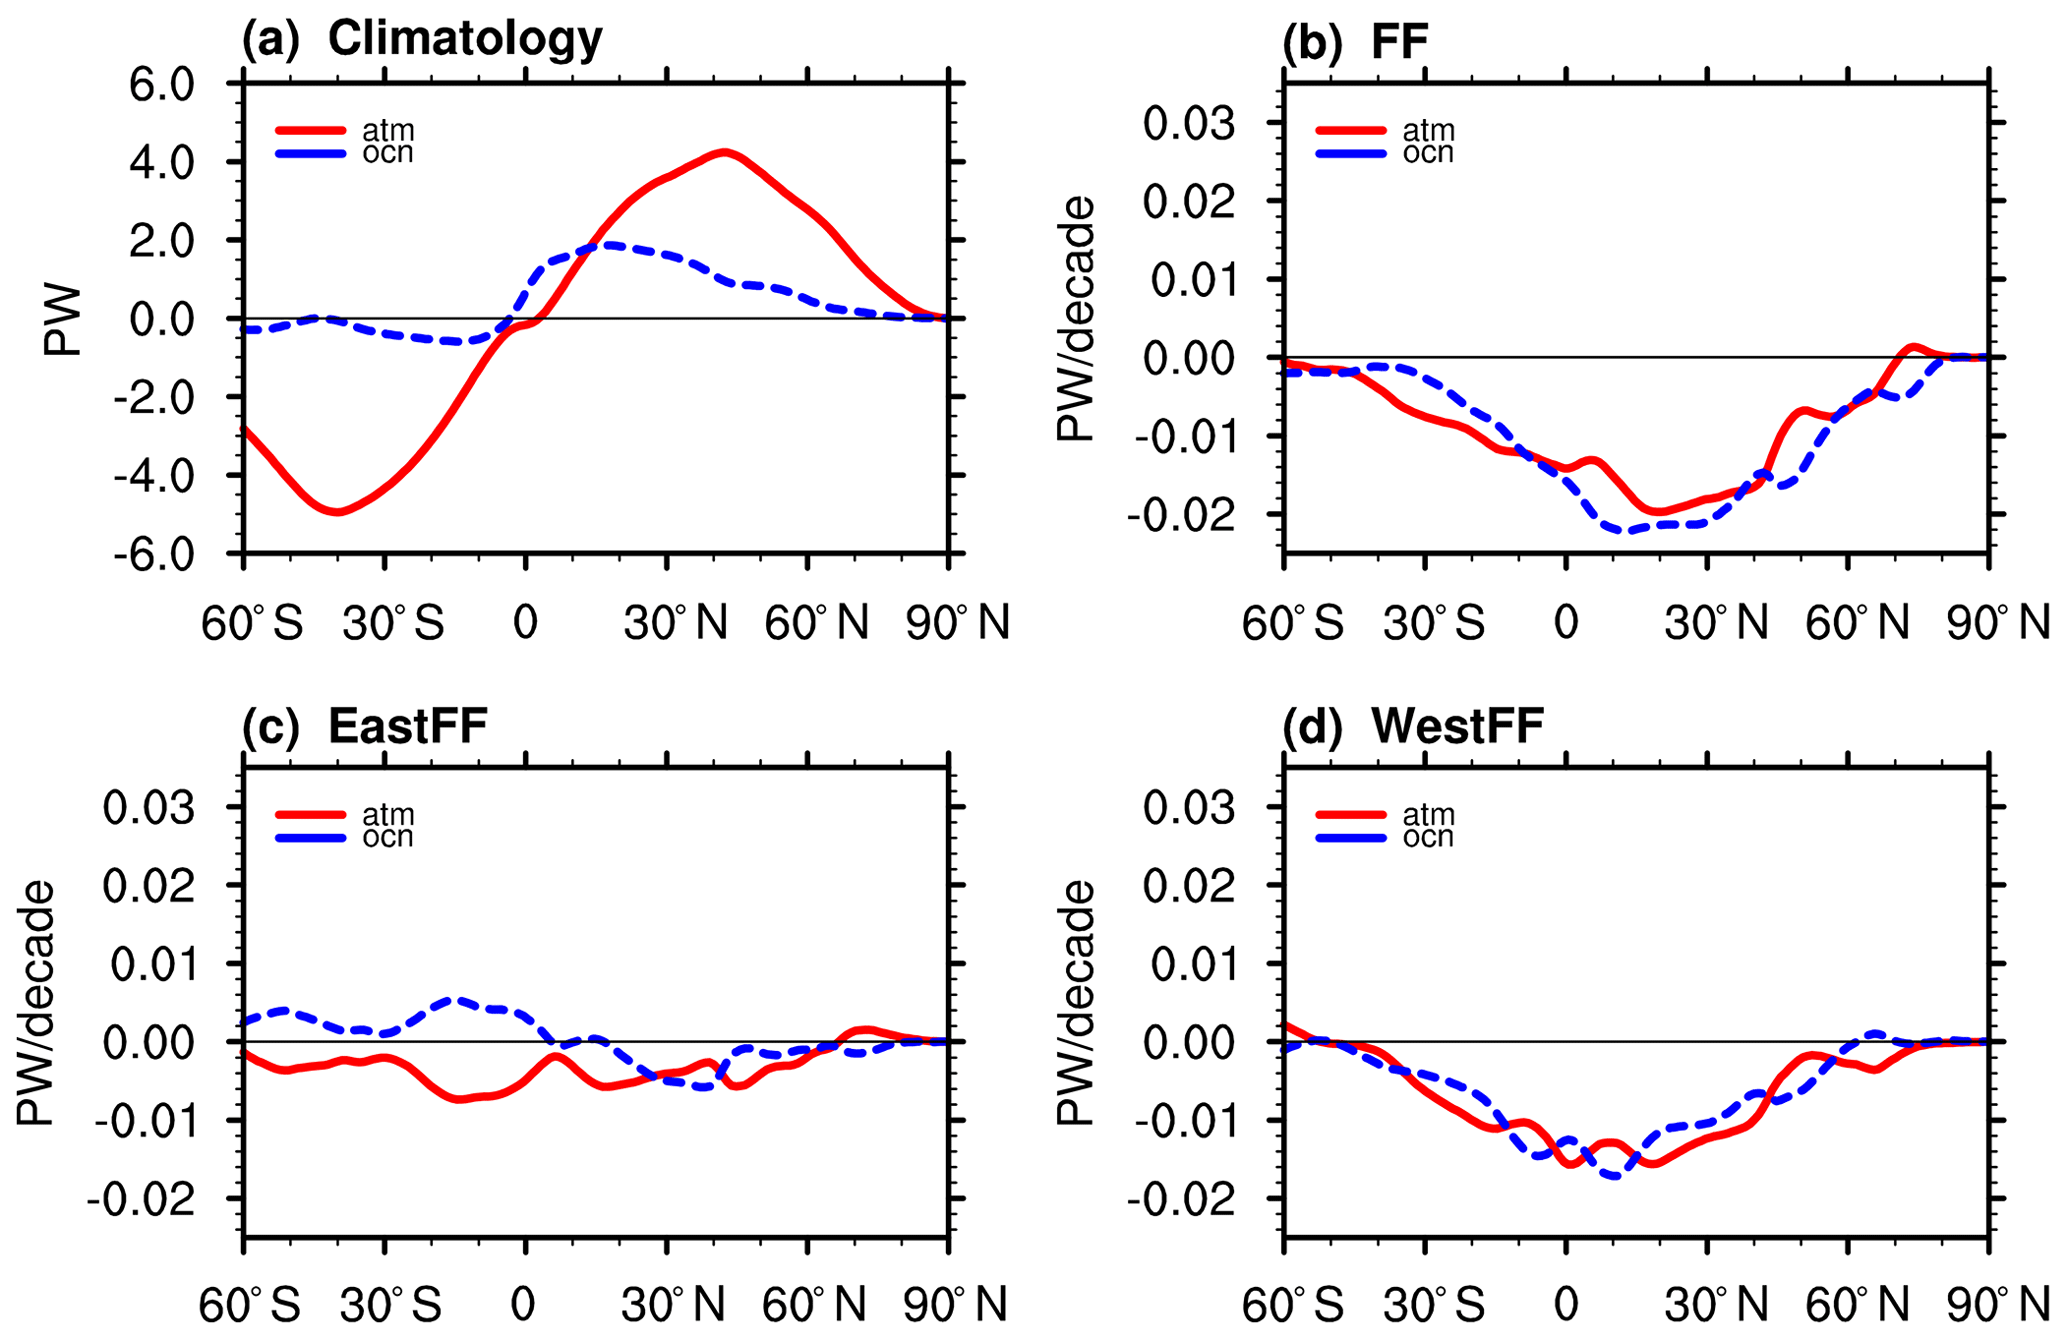
Figure 7(a) The 40-year climatology of northward energy transport (petawatts; hereafter Pwatt) is calculated based on the ensemble average of ALL experiments. (b–d) The decadal trend of northward energy transport in response to FF, EastFF, and WestFF (Pwatt per decade), which is obtained by subtracting the fixed single-forcing experiments from the ALL experiment. The dashed blue lines represent the oceanic energy transport; the solid red lines represent the atmospheric energy transport.
To further diagnose why EastFF and WestFF induce distinct changes in the Hadley cell, we analyze the changes of zonal, column-integrated meridional energy transport in response to aerosol forcings, which is shown in Fig. 7b–d. The atmospheric energy transport (AET) is calculated based on the following:
where φ is latitude, Fa is the meridional energy flux, RTOA is the net radiative flux at the top of the atmosphere (downward positive), and Q is the net downward energy flux at the surface. Q includes short wave radiation, longwave radiation, sensible heat flux, and latent heat flux. AET is then obtained by integrating the energy flux from south to north as follows:
where a is the Earth radius. Similarly, the oceanic energy transport (OET) is calculated based on the surface radiative flux as follows:
The positive radiative forcing anomaly in the NH extratropics from WestFF induces a negative AET at the Equator (Fig. 7d), which leads to the northward shifts of the Hadley cell and ITCZ (Intertropical Convergence Zone) to balance the interhemispheric difference in radiative forcing. Previous studies demonstrated that the cooling NH leads to southward shift of the ITCZ (Broccoli et al., 2006; Kang et al., 2021), which is consistent with the findings here. On the other hand, the EastFF introduces strong negative radiative forcing in the tropics and weak positive forcing anomaly in NH extratropics, but the AET shows small trends at all latitudes compared to that due to WestFF (Fig. 7c). Therefore, the Hadley cell does not shift significantly in response to EastFF. The AET changes in response to FF resembles those in response to WestFF, indicating the dominant role of WestFF in shifting the Hadley cell.
Figure 6d–f shows the global mean zonal wind (U) trends. The FF and EastFF forcing induce slowing U on the poleward flank of the NH jet core while strengthening U on the equatorward flank (especially in the EastFF case), indicating equatorward shifts of the NH jet stream. However, in the WestFF, U decreases on both flanks of the jet core (slighter greater on the equatorward flank), and the position of the jet core has no significant shift. This is not consistent with the shift of the Hadley cell. As a result, the shift of the Hadley cell and NH jet stream in the FF case are in opposite directions, which appears to disagree with previous studies (Xu and Xie, 2015). However, based on the regional FF simulations (Fig. 6b–c and e–f), we show that the jet stream and Hadley cell in FF are controlled by different regional forcings during this period (EastFF drives the jet stream shift, while WestFF drives the Hadley cell shift), which agrees with the argument provided by Xu and Xie (2015). The competition between EastFF and WestFF in shaping the Hadley cell and NH midlatitude jet stream further indicates the importance of the meridional location of the aerosol forcing, in addition to the zonal difference. Previous studies (Seo et al., 2014; Kang et al., 2021) also suggest the importance of the latitudinal position of the radiative forcing to the movement of tropical circulations, which is consistent with our findings here.
The latitudinal profiles under the contour plots in Fig. 6d–f indicate the corresponding zonal mean FSNTOA gradient trend (black curves; W/m2 per decade per 10∘lat), which seems to provide a good rule of thumb for the expected shift of the NH jet stream. The FSNTOA gradient, in response to FF and EastFF, shows an increase in the FSNTOA gradient trend over the midlatitudes (black dashed lines), which is consistent with the equatorward shift of the NH jet stream. On the contrary, the FSNTOA gradient in WestFF shows a slight negative gradient, while the NH jet stream shows no significant shift. Note that the FSNTOA gradient is only a quick rule of thumb for the NH jet shift, and one cannot only explain the jet stream shift based on it. More precise mechanisms of the jet stream shift driven by FF forcings will be discussed below.
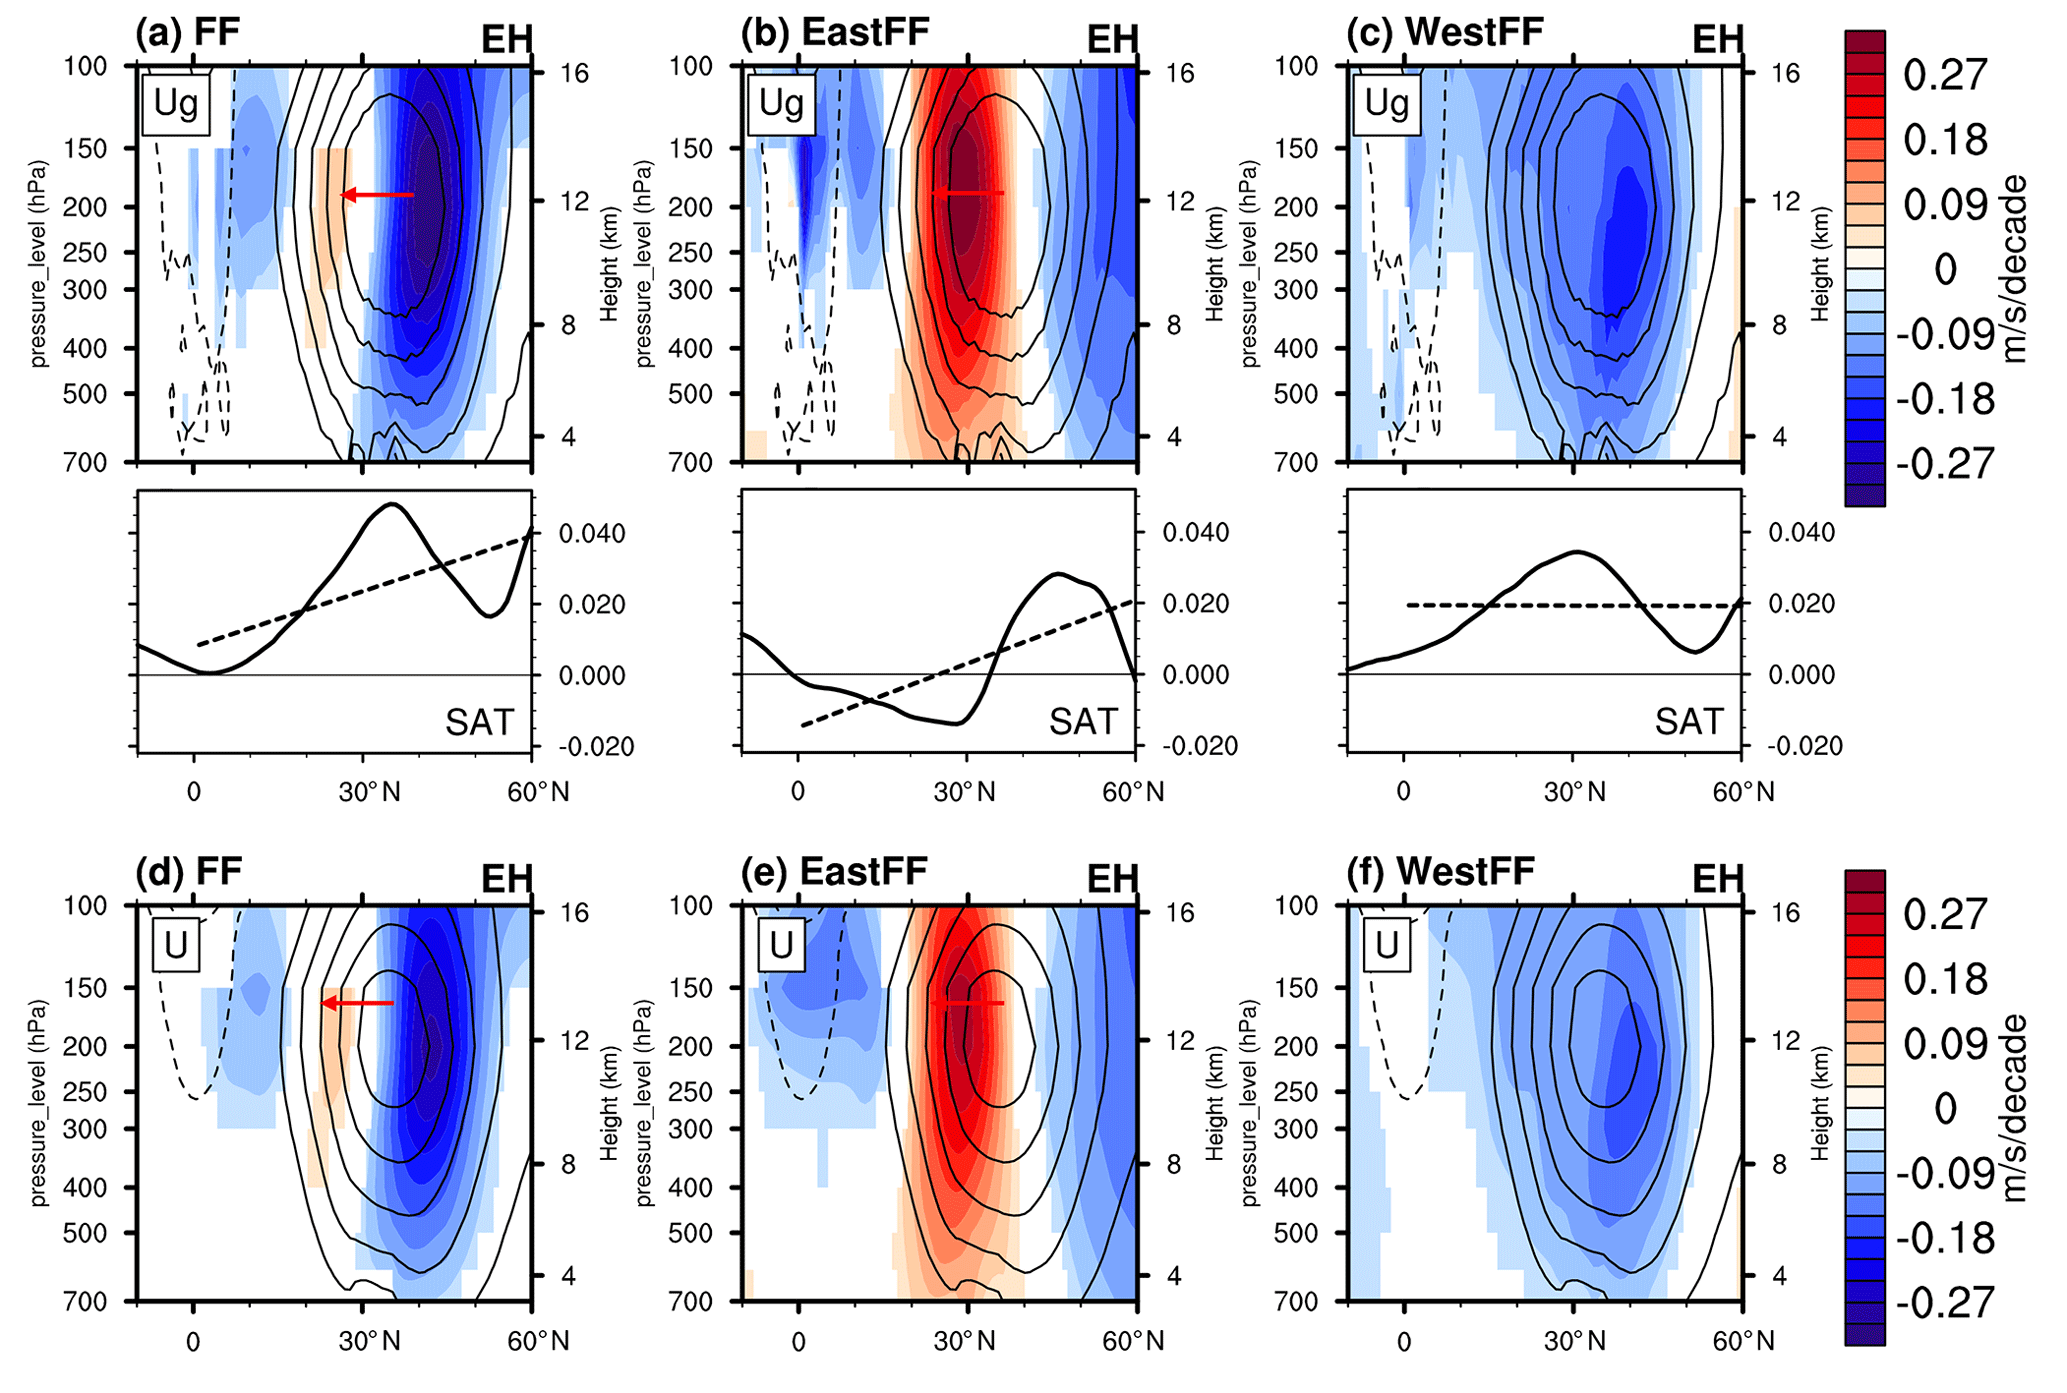
Figure 8Panels (a–c) are similar to Fig. 6d–f but for the geostrophic wind (Ug) trend (m s−1 per decade) derived from geopotential height (Z) during 1980–2020 in Eastern Hemisphere (EH). The climatology is shown in contour lines with an interval of 6. The positive values indicate a westerly wind. The statistically insignificant trend is masked in white. The arrows indicate the latitudinal shift in each case. The profiles below show the gradient of the surface air temperature trend (black curves; W/m2 per decade per 10∘lat). The gradient lines are smoothed using the moving average method (with 30∘ of the latitudinal range sampling window). The dashed lines are the linear fit from 0 to 60∘ N. Positive values indicate a larger SAT trend at higher latitude and vice versa. Panels (d–f) are similar to the bottom row of Fig. 6 but for the U trend in the Eastern Hemisphere (EH) in response to three types of forcings.
Figure 8a–c show the zonal mean geopotential wind in the zonal direction (Ug) in EH (red dashed box in Fig. 4), which is derived from geopotential height (Z) following the geostrophic wind equation. The derived ug patterns always resemble the simulated U pattern in EH (Fig. 8d–f), WH, and global (not shown), revealing the strong correlation between tropospheric circulation changes and the tropospheric temperature changes (and, thus, the geopotential height changes). Instead of the gradient of radiative variables as in Fig. 6, here we show the latitudinal profiles of the trend of the SAT gradient in response to each force. It has been previously demonstrated that the tropospheric responses to sulfate aerosol are anchored to the SST gradient (Xu and Xie, 2015).
The negative radiative forcing from EastFF is located at low latitudes, which leads to a negative SAT gradient southward of 35∘ N. The EastFF-induced SAT shows a negative gradient on the Equator flank of the NH jet core (southward of 35∘ N) and a positive gradient on the polar flank (max at about 45∘ N), indicating a great strengthening of zonal wind on the equatorward flank and weakening on the poleward flank. This is producing a net effect of an equatorward shift of NH jet. On the other hand, the WestFF-induced radiative forcing is located at mid-to-high latitudes, which leads to a largely balanced radiation flux on both flanks of the jet core. Therefore, the WestFF-induced SAT does not show a significant gradient, and thus, the jet stream shifts are much weaker compared to the FF and EastFF cases.
To summarize, Fig. 8 shows that the local trend of the SAT gradient explains the weakening or strengthening of the NH jet stream well, following the geostrophic wind equation, while the latitudinal slope of the SAT gradient (dashed line as the linear fit in Fig. 8) indicates the shift of jet stream. A consistent governing principle emerging from Fig. 8 is that the NH jet stream always tends to shift towards the more negative portion of SAT gradient. This is consistent with Fig. 6 because NH jet stream shifts towards the more negative portion of forcing gradient. Based on Fig. 7, the AET fails to explain the shift of NH jet stream, indicating that the jet stream may be more controlled by the slow response of the aerosol forcing, due to surface temperature change, rather than the fast response.
As shown in Fig. 5, the EH still experiences a warming tendency in response to FF, the same as WH, despite an increasing aerosol emission locally at low- to midlatitudes. So, to further reveal the contrast between EH and WH in response to FF, as well as regional FF forcings, we reassess the identified relationship between radiative forcing gradient, temperature gradient, and the tropical circulation changes in Figs. 6–7 by extracting the regional signals from the global mean states.
Figure 8 (first and second rows) shows the regional ZMMSF and U changes relative to the global mean state. The EH−globe (EH minus global mean) and WH−globe show opposite ZMMSF trends at low latitudes, with opposite slopes of FSNTOA gradients in both the FF case and the regional FF cases, indicating the importance of cross-equatorial AET in governing the tropospheric circulation adjustment. The increasing FSNTOA gradient from south to north in the NH leads to a clockwise ZMMSF trend and a poleward shift of the Hadley cell, which is consistent with the result shown in Xu and Xie (2015) and references within.
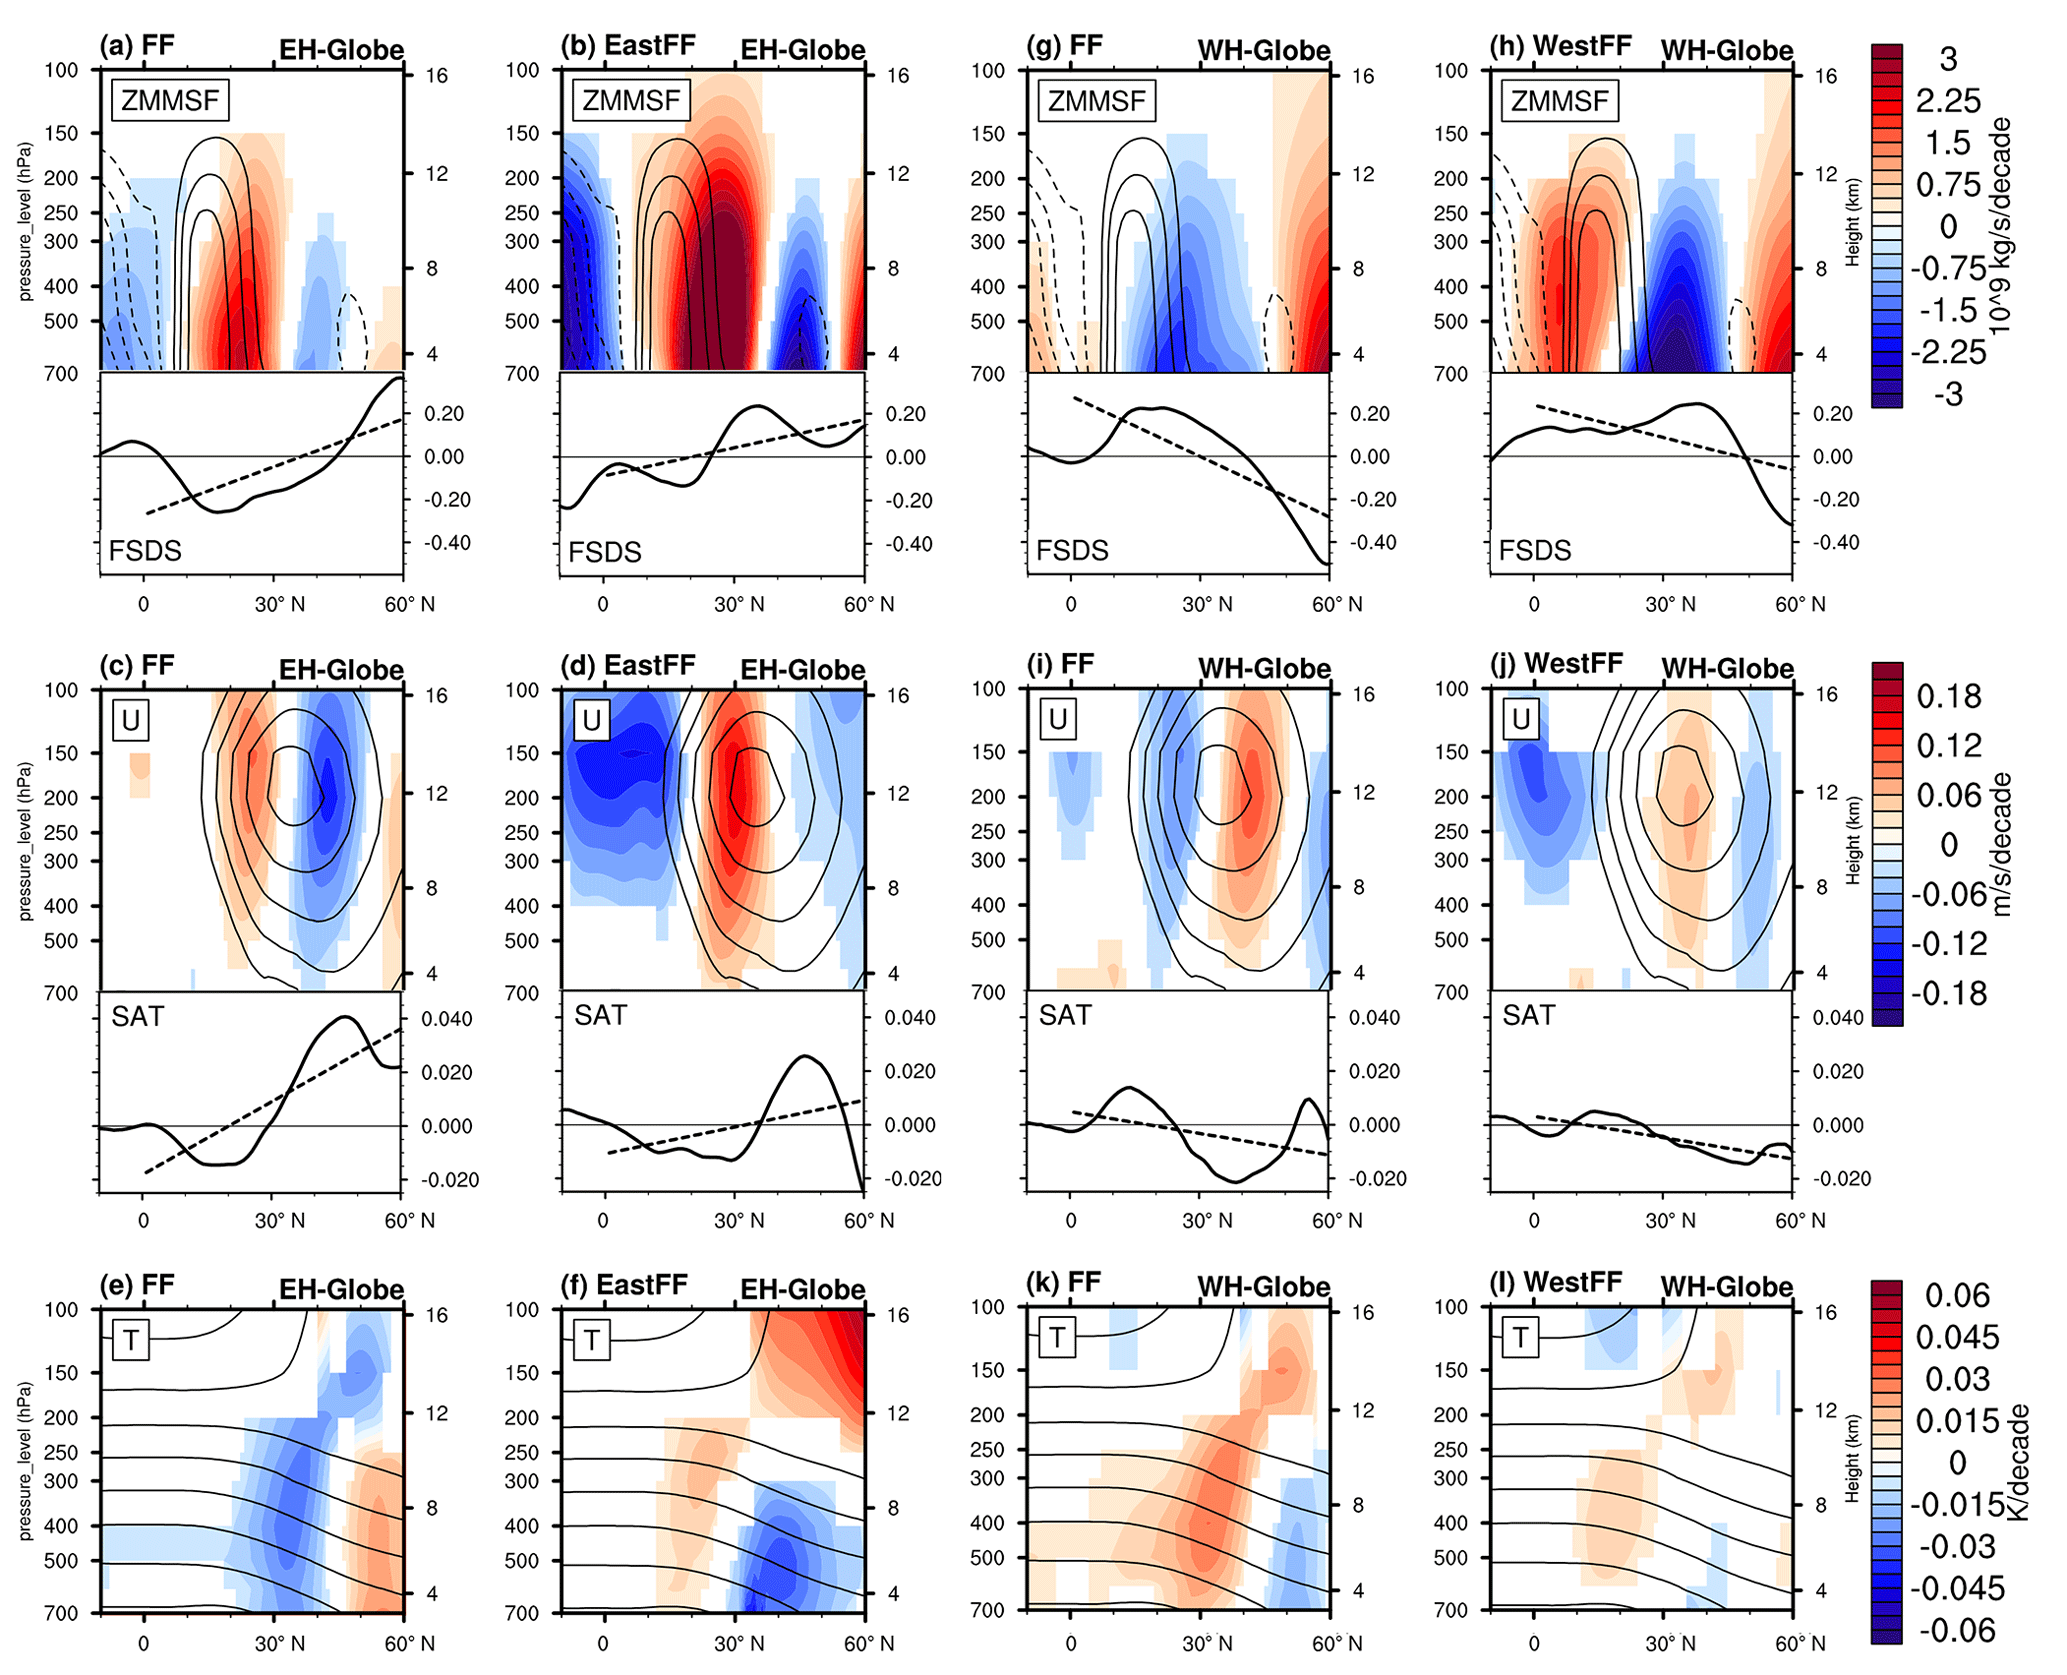
Figure 9The first row shows the ZMMSF trend, which is the same as for Fig. 6a–c, but shows the difference between the global mean and EH mean (a–b) and the difference between global mean and WH mean (g–h). The latitudinal profiles below show the latitudinal gradient of the FSDS trend, which is also calculated as the difference between EH/WH and the globe. The second row shows the U trend, which is the same as in Fig. 8d–f, but shows the difference between the global mean and EH (WH). The latitudinal profiles below show the latitudinal gradient of SAT trend, which is also calculated as the difference between EH (WH) and the globe. The third row is similar to the above two rows but shows tropospheric air temperature (T) trend.
The relationship between the gradient of the SAT trend and the shift of the NH jet stream is reassessed in the middle row of Fig. 9, in terms of regional anomalies over EH and WH relative to the global average. The results also support the simple relationship we identified, where the NH jet stream shifts to the flank with a more negative SAT gradient because the magnitude of U trend at certain latitudes is determined by the local gradient of air temperature trend, with a more negative gradient strengthening the westerly wind there. One counterexample here is the WH−globe U in response to WestFF, where the jet stream does not shift – even with a slight negative SAT gradient. The air temperature trend pattern (bottom row of Fig. 9) reveals that the negative gradient of air temperature is located at 30∘ N at all pressure levels, which is the latitude of the jet core. As a result, the jet core does not shift much as desired. In the low- to midlatitudes of EH (5 to 35∘ N), the gradient of the FSNTOA trend in response to FF is negative compared to the global mean, which is largely consistent with the increasing aerosol emission in EH (third row in Fig. 2).
3.4 Surface temperature responses over the NH with a focus on the North Pacific
Having demonstrated the tropical circulation changes and NH jet stream changes in Sect. 3.3, we now look at the SAT response to the regional aerosol forcings. Many previous studies have examined the relationship in and mechanisms of Atlantic changes (Booth et al., 2012; Bellomo et al., 2018; Hua et al., 2019; Watanabe and Tatebe, 2019). In contrast, the aerosol effects on the Pacific Ocean are comparatively less studied in the literature (Allen et al., 2014; Dong et al., 2014; Hua et al., 2018), and the potential effects of aerosol redistribution need further discussion. Since this study focuses on the comparison and competition of east and west aerosol forcings, we are specifically interested in how the increasing Asian aerosol forcing affects the North Pacific and how that might be compensated by declining aerosol forcing from North America.
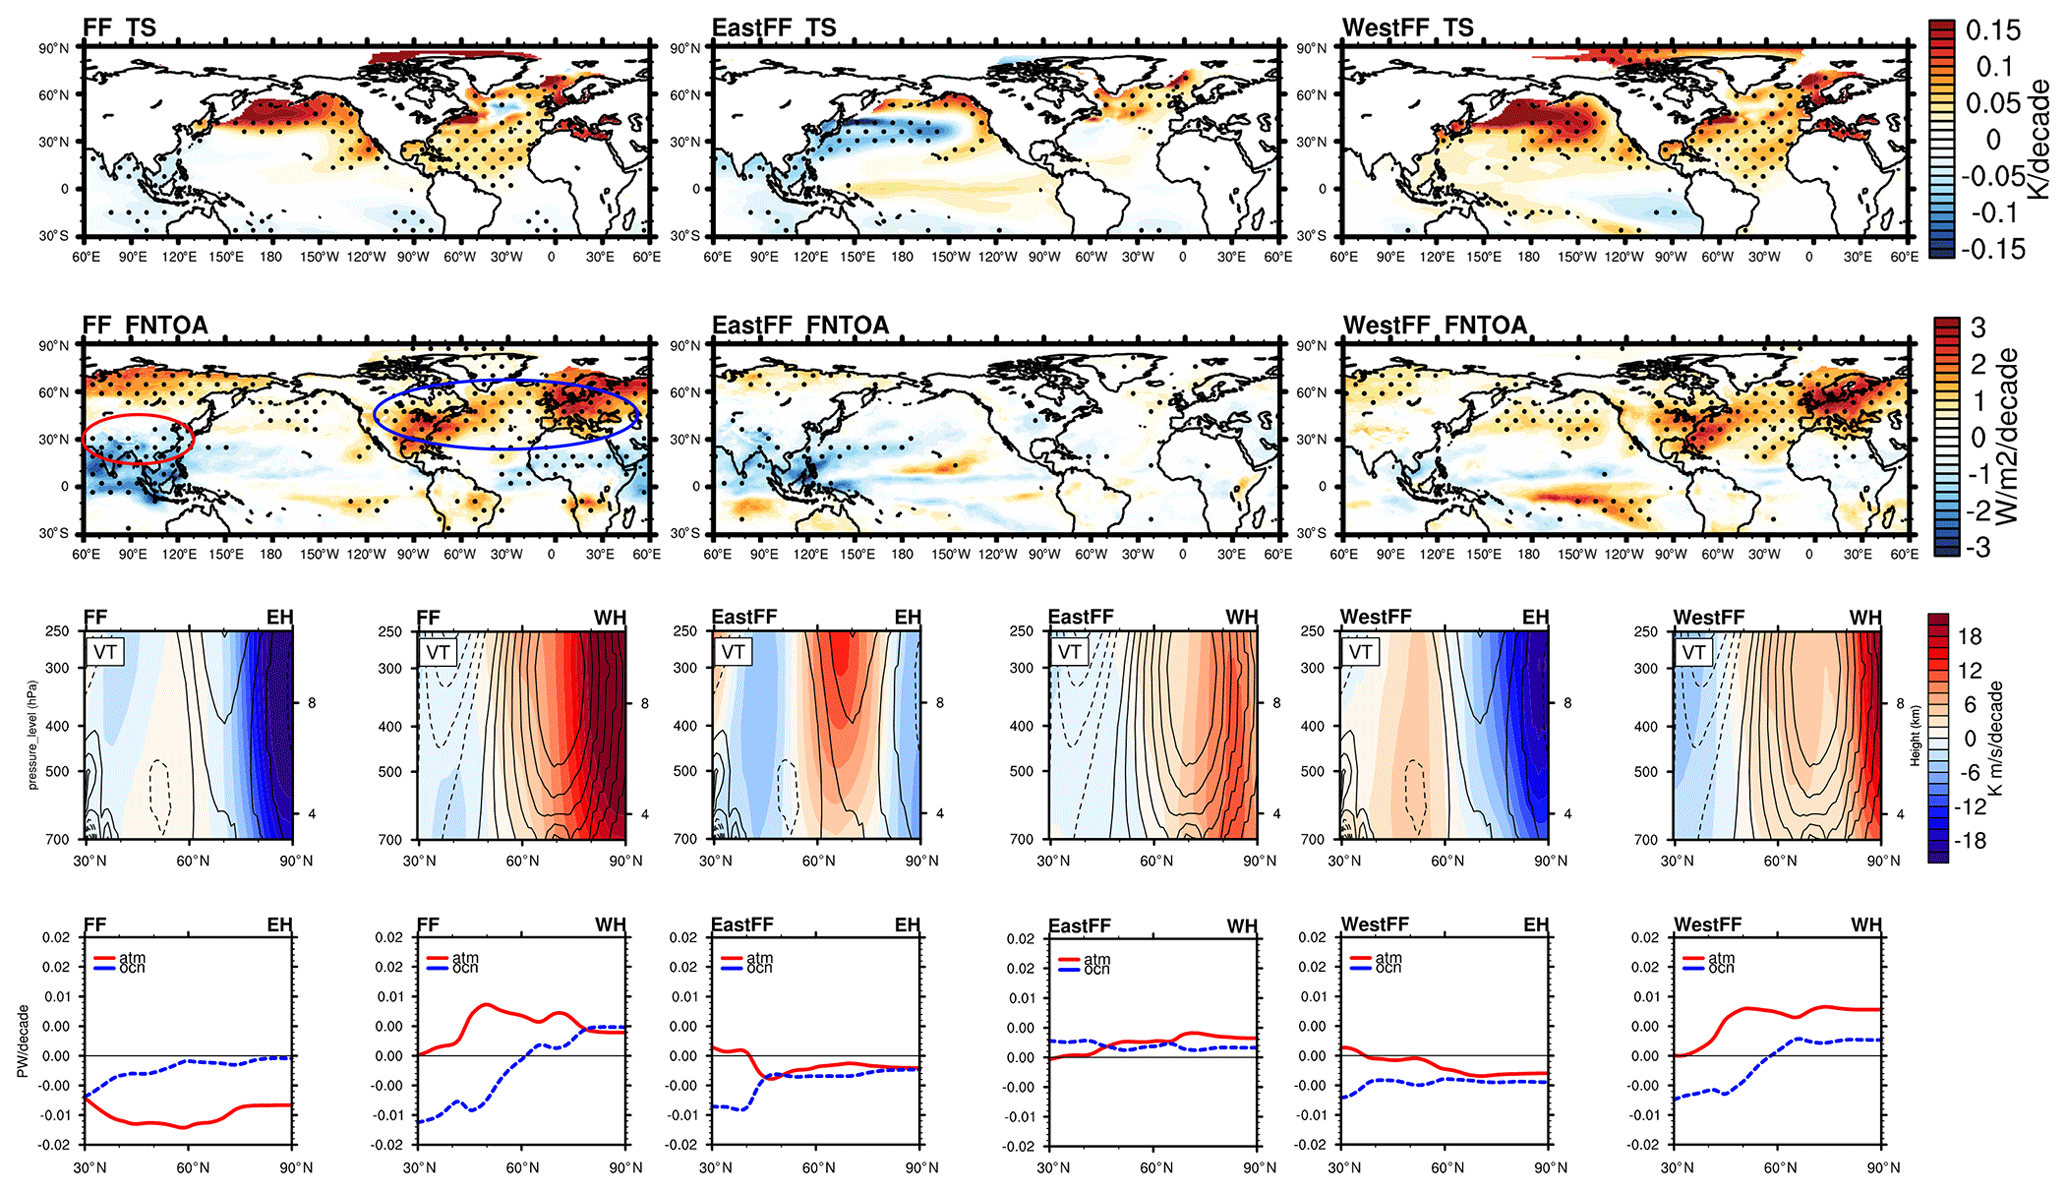
Figure 10The first and second rows show the 40-year sea surface air temperature trend (SAT) and net energy flux at TOA (Rtoa). Arctic regions with significant sea ice changes are masked. The blue (red) circles in the second row indicate the major regions with a decline (increase) in aerosol emission. The third row shows 40-year trends of zonal mean meridional heat transport (ZMMHT) in EH and WH. The positive values (solid lines for climatology and red shading for the long-term trend) indicate the poleward transfer. The arrows indicate the energy transfer responses relative to the climatology. The fourth row is similar to Fig. 7 but shows the regional northward energy transport (Pwatt per decade; northward positive) in EH and WH. The dashed blue lines indicate oceanic northward energy transport (OET), while the solid red lines indicate atmospheric northward energy transport (AET).
The first row of Fig. 10 shows the 40-year linear trends of surface air temperature (SAT) over the ocean in response to FF, EastFF, and WestFF during 1980–2020, which bears a close similarity to the SST (not shown). Overall, FF forcing induces significant warming over the North Pacific northward of 40∘ N, which is even stronger than the North Atlantic warming but with a weaker trend in TOA net radiative flux (RTOA; second row of Fig. 10). EastFF induces significant cooling over the western part of the North Pacific at low- to midlatitudes, which is consistent with previous studies (Dong et al., 2014; Takahashi and Watanabe, 2016; Smith et al., 2016). In contrast, WestFF, with a positive forcing anomaly at mid-to-high latitudes (30–60∘ N; blue oval in Fig. 10), induces large-scale warming locally in the North Atlantic and even stronger warming over the entire North Pacific. Thus, the WestFF-induced warming over the North Pacific largely offsets the EastFF-induced cooling in the FF case.
The North Atlantic warming, as many other studies (e.g., Acosta Navarro et al., 2017; Qin et al., 2020) have pointed out, can be attributed to the reduction in aerosol emission over North America and Europe since the 1980s, which is clearly seen in TOA net energy flux (blue circle in the second row of Fig. 10). A North Atlantic warming hole is also significant in the FF response (Dagan et al., 2020; Fiedler and Putrasahan, 2021). Notably, the simulated warming hole is less significant in response to WestFF forcing alone. In response to the EastFF forcing, the high latitudes of the North Atlantic show a warming trend despite insignificant local changes in the TOA net energy flux (second row in Fig. 10).
Over the tropical Pacific region, EastFF induces an El-Niño-like SAT pattern with symmetric warming trends (it does not pass the 95 % significance test, though). The EastFF-induced El-Niño-like pattern contradicts some previous studies arguing that Asian aerosols lead to a La-Niña-like pattern (Kaufmann et al., 2011; Smith et al., 2016; Kang et al., 2021). On the other hand, WestFF induces an asymmetric SAT pattern over the tropical Pacific, with warming in the north and cooling in the south. The distinct tropical Pacific SAT responses due to EastFF and WestFF may also contribute to the Pacific decadal-to-multidecadal variability (PDV) in amplitude and spatial pattern. The question about whether and how regional aerosol forcings affect PDV needs further investigation.
Let us compare the three sets of responses. The weak cooling over the Pacific warm pool region in response to FF can be explained by the offsetting effects between EastFF and WestFF, where the WestFF-induced warming weakens the strong cooling due to EastFF. Similarly, at the North Pacific region southward of 40∘ N, the extended aerosol cooling effect from eastern Asia is largely offset by the warming effect due to WestFF in the total FF response. A notable finding is that, at least based on the simulation here, the North Pacific warming northward of 40∘ N is dominated by the positive forcing anomaly from WH mid-to-high latitudes, overwhelming the cooling from EH low- to midlatitudes. The latitudinal difference between EH and WH forcing distribution plays an important role here. Indeed, Fig. 4 shows that the EastFF-induced CDNC changes are concentrated over low- to midlatitudes (close to the emission sources and western subtropical Pacific). In contrast, the WestFF-induced CDNC changes expand to a larger domain over North Pacific and North Atlantic. The simulation here indicates that mid-to-high latitude SAT is more sensitive to extratropical forcing than forcings originating from a lower latitude. This finding is consistent with previous findings that emissions at higher latitudes generate stronger temperature responses (Shindell and Faluvagi, 2009; Persad and Caldeira, 2018). We also examine the BB case (not shown), which has a strong negative forcing over northeastern Asia over 50∘ N, and we find that BB-induced cooling occurs over the entire North Pacific, similar to WestFF-induced response. Therefore, we highlight that the latitudinal distribution of aerosol forcing is essential to the North Pacific climate responses.
The competition of EastFF and WestFF over the North Pacific deserves some more discussion. There is an apparent paradox in the FF case. Compared to the North Atlantic, the high-latitude region of North Pacific shows stronger warming, though with a much weaker Rtoa trend. This suggests that the Rtoa cannot fully explain the North Pacific warming. So how does WH forcing lead to North Pacific warming (and also in the tropospheric circulations of EH mid-to-high latitudes in Fig. 9)? We now try to discuss the mechanisms of North Pacific SAT adjustment based on the meridional energy transport.
The trends of the zonal mean atmospheric meridional heat transport (ZMMHT) are shown in the third row of Fig. 10, where WH shows positive trends northward of 60∘ N in all three cases (note that the climatology of ZMMHT over both North Pacific and North Atlantic is still positive in the poleward direction, as shown in line contour). This suggests that the meridional energy transfer from the Atlantic Ocean to the Arctic is enhanced, slowing down the North Atlantic warming rate due to the local positive radiative forcing anomaly. Conversely, the North Pacific ZMMHT (poleward in climatology) is weakened and, thus, exports less heat from North Pacific midlatitudes to the polar region (blue color in the EH panels of Fig. 10).
In addition to the atmospheric ZMMHT, we also show the zonal, column-integrated AET response in EH versus WH (bottom row of Fig. 10). The AET results show a strong northward energy transport trend in the WH, while the equatorward energy transport trend in the EH, both of which resemble the ZMMHT trends. Moreover, the strong WestFF positive radiative forcing anomaly induces the strong poleward energy transport trend in the WH, and the AET in response to EastFF is much weaker.
Previous studies have also shown that the surface temperature response to aerosol forcing is also strongly modulated by the oceanic energy transport (OET; Cai et al., 2006; Delworth and Dixon, 2006; Dagan et al., 2020; Menary et al., 2020; Fiedler and Putrasahan 2021; Hassan et al., 2021). Here we show that OET (blue lines in Fig. 10; see the bottom row) can have different trends from AET or ZMMHT. In response to the WestFF (positive) forcing, OET increases in WH high latitude and decreases in EH, indicating that poleward heat transport via the ocean is strengthened over the North Atlantic but is weakened over the North Pacific. The stronger poleward OET in WH, in addition to poleward AET in a larger magnitude, explains why the North Pacific shows a stronger warming trend without local forcing. The EastFF also induces increasing OET in WH and decreasing OET in EH but with small magnitudes compared with WestFF-induced OET responses, which is similar to the AET responses. This further suggests that the WestFF forcing at mid-to-high latitudes is the dominant driver of atmospheric and oceanic poleward energy transport in NH.
To summarize, the simulated North Pacific warming northward of 50∘ N is dominated by the WestFF positive radiative forcing anomaly at mid-to-high latitudes. The EastFF forcing at low- to midlatitudes, which have been extensively discussed by previous studies, only induces cooling trend at mid-to-low latitudes (southward of 50∘ N) near the emission domain, which is similar to the positive El-Niño-like pattern response, but the signal is overwhelmed by the warming tendency induced by WestFF via both radiative forcing response and meridional heat transport from pole region. Another possible explanation for the stronger North Atlantic warming is that the midlatitude region of EH is controlled by the WH emission reduction effects at mid-to-high latitudes via the zonal energy transport between the Atlantic and Pacific (McGregor et al., 2014), but it has not yet been tested in this study.
The main findings of this paper are as follows:
-
The significant zonal and meridional contrasts in aerosol emission redistribution lead to opposite local radiative forcing that has competing effects on temperature and circulation changes.
-
In terms of hemispheric surface temperature response, the overall FF emission has decreased since the 1980s, mostly driven by the WH, which has induced a significant warming trend over NH. Interestingly, although the FF emission over EH continuously increases, the SAT in EH still shows a warming trend as large as WH because of the heavy influence from WH aerosol reduction.
-
In terms of tropospheric circulation responses, in response to FF, the NH shows an overall positive gradient of the temperature trend (cooling at low latitude; warming at high latitude), inducing a poleward shift of the Hadley cell and an equatorward shift of NH jet stream (Fig. 6). Previous studies show that the shift of the midlatitude jet stream is associated with the SST meridional gradient, and a cooling NH drives an equatorward shift of both the Hadley cell and NH jet stream (Xu and Xie, 2015; Xu et al., 2016), which appears to be inconsistent with our results. The main difference is that previous results are largely based on a sharp interhemispheric forcing gradient either with a timescale of the entire 20th century (Wang, H. et al., 2020) or focusing on the mid-century era when aerosol emission was on the rise globally. In this study, focusing on the 1980–2020 trend, the regional FF aerosol forcing competitions within the NH are more complex due to both zonal and meridional differences. The competing effects of EH and WH aerosol forcings are examined with two sets of large-ensemble simulations (Fix_EastFF1920 and Fix_WestFF1920) that we conducted.
In the tropics, the WestFF forcing at mid-to-high latitudes dominates the northward shift of the Hadley cell. WestFF induces a positive forcing anomaly in the NH extratropics and drives the northward shift of the Hadley cell to balance the interhemispheric difference in radiative forcing. Interestingly, in the extratropics, the EastFF forcing at low- to midlatitudes dominates the equatorward shift of the NH jet stream. The gradient of FSNTOA provides a rule of thumb for the expected shift of the NH jet stream (Fig. 9), where the NH jet stream tends to shift to the negative gradient portion of FSNTOA. The competition between EastFF and WestFF aerosol forcings in shaping the Hadley cell and midlatitude jet stream highlight the critical role of the meridional location of the aerosol forcings within the NH.
-
In terms of North Pacific temperature response, the FF forcing during 1980–2020, unlike the findings suggested by previous studies, induces North Pacific and pan-Pacific warming due to a competition between EastFF and WestFF, with the latter dominating the former (Fig. 10). The dominance is due to the latitudinal distribution of aerosol forcing within the NH. The negative forcing of EastFF, which occurs at the EH tropical and subtropical region (0–40∘ N), is largely confined to the emission domain. In contrast, negative FF forcing over the WH mid-to-high latitudes (northward of 30∘ N) not only introduces local warming but also imposes a heavy influence over North Pacific warming. Diagnostic data show that the remote contribution to North Pacific warming from WestFF is due to the combination of both the radiative forcing responses and meridional energy transfer anomaly from the North Atlantic to North Pacific via the Arctic pathway.
The importance of the interhemispheric asymmetry of external forcing has been extensively discussed in previous studies (e.g., Xu and Xie, 2015; Chung and Soden, 2017; Wang, H. et al., 2020) in which the NH is usually considered as a whole. Here we further emphasize that the latitudinal difference of external forcing within the NH is important for determining the tropospheric and surface responses. More specifically, the EastFF induces a Pacific Decadal Oscillation (PDO)-like pattern (negative phase) with a cooling over the northwestern Pacific and warming over the tropical Pacific. However, when combined with the aerosol reduction over the WH, the EastFF-driven northwestern Pacific cooling is completely offset and, instead, exhibits a warming trend.
We provide the following discussions related to our conclusion and suggest some future research directions.
-
With respect to the issue of nonlinearity, the CESM1 “Single Forcing” Large Ensemble simulations applied in this study treat the FF and BB forcing separately, which enables many of our discussions above. However, one problem is the additivity of the two anthropogenic aerosol sources. Deser et al. (2020) sum up the FF, BB, and GHGs responses to reconstruct the all forcing (ALL) responses and find some inconsistencies due to the nonlinear interactions between aerosol- and GHG-induced responses. So, it is also possible that adding FF and BB may cause some nonlinear problems. Similarly, adding EastFF and WestFF responses may also cause such problems. This study is not affected by such additivity problems because we treat each set of simulations separately, but future studies that aim to utilize the combined AA-induced changes should be cautious, and a rigorous test on the additivity would be necessary.
-
With respect to the issue of RCP8.5 scenarios applied in CESM1, as described in Sect. 2.1, the RCP8.5 scenarios are applied in all five sets of the large-ensemble simulations used in this study for 2006–2020. Studies have pointed out that the RCP data set is different from the new SSP (Shared Socioeconomic Pathway) scenarios which contain the historical emission data up to 2015. For example, the sulfate emissions over India and China over the 2006–2020 period in the RCP8.5 scenarios are lower than observations and SSP scenarios, which could lead to an underestimate of the sulfate cooling effects locally and globally (Lin et al., 2018). Future experiments utilizing the newer GCMs and SSP scenarios may find it helpful to repeat and test the current results.
-
With respect to the issue of the single-model large-ensemble method, the simulations applied in this study effectively separate the external-forcing-induced response from the model internal variability (Kay et al., 2015; Deser, et al., 2020). However, one limitation here is that only one GCM is utilized, so the potential systematic errors from a single model cannot be tested. Some new single-forcing large-ensemble simulations based on models, other than CESM1 (e.g., CanESM2 – CESM2; Oudar et al., 2018) have also coming out recently as part of the single-model initial-condition large-ensemble (SMILE) efforts, which brings the possibility of testing multi-model large ensembles in future works and improving our understanding of aerosol-induced climate change.
-
With respect to the issue of the implication of the North Pacific response to the PDO mode and global warming rate, the increasing FF emission over EH low latitudes (without WH) induces a PDO-like SAT response over the North Pacific and tropical Pacific, suggesting the potential impact of anthropogenic forcing onto the internal variability. More future research is needed on this topic, based on the current large-ensemble simulations and the upcoming CESM2 simulations.
-
With respect to the issue of the difference in EastFF and WestFF in the north–south direction, it is clear that the redistribution of anthropogenic aerosols since the 1980s has not been a pure zonal shift but has also shifted in the meridional direction. The aerosol loading shows a net decrease, especially in the midlatitude/subpolar region. Future studies may consider both zonal and meridional shifts in SO4 loading.
The CESM1 Large Ensemble data sets are publicly available from https://www.cesm.ucar.edu/projects/community-projects/LENS/data-sets.html (last access: 15 December 2021; Kay et al., 2015). The CESM1 “Single Forcing” Large Ensemble data sets are publicly available from https://www.cesm.ucar.edu/working_groups/CVC/simulations/cesm1-single_forcing_le.html (last access: 15 December 2021; Deser et al., 2020). The outputs for two sets of regional single-forcing large-ensemble (Fix_EastFF1920 and Fix_WestFF1920) are available on the National Center for Atmospheric Research (NCAR) Campaign Storage file system under /glade/campaign/univ/utam0012/CESM11-LEN-Reg/ and can also be accessed via the NCAR Data Sharing Service Endpoint on Globus upon request to the authors.
CD and YX developed the idea for this study and designed the model experiments. CD performed the model simulations and data analysis, with input and feedback from YX and SPX. CD and YX prepared the paper, with contributions from all authors.
The contact author has declared that neither they nor their co-authors have any competing interests.
Publisher’s note: Copernicus Publications remains neutral with regard to jurisdictional claims in published maps and institutional affiliations.
We acknowledge NCAR for the high-performance computing support from Cheyenne (https://doi.org/10.5065/D6RX99HX) and the data storage resources provided by Computational and Information Systems Laboratory (CISL). We thank the CESM-LE project for providing access to the model outputs.
This research has been supported by the National Science Foundation (grant no. AGS-1841308).
This paper was edited by Hailong Wang and reviewed by two anonymous referees.
Acosta Navarro, J. C., Ekman, A. M. L., Pausata, F. S. R., Lewinschal, A., Varma, V., Seland, Ø., Gauss, M., Iversen, T., Kirkevåg, A., Riipinen, I., and Hansson, H. C.: Future Response of Temperature and Precipitation to Reduced Aerosol Emissions as Compared with Increased Greenhouse Gas Concentrations, J. Climate, 30, 939–954, https://doi.org/10.1175/JCLI-D-16-0466.1, 2017.
Allen, R. J. and Ajoku, O.: Future aerosol reductions and widening of the northern tropical belt, J. Geophys. Res.-Atmos., 121, 6765–6786, https://doi.org/10.1002/2016JD024803, 2016.
Allen, R. J., Norris, J. R., and Kovilakam, M.: Influence of anthropogenic aerosols and the Pacific Decadal Oscillation on tropical belt width, Nat. Geosci., 7, 270–274, https://doi.org/10.1038/ngeo2091, 2014.
Allen, R. J., Turnock, S., Nabat, P., Neubauer, D., Lohmann, U., Olivié, D., Oshima, N., Michou, M., Wu, T., Zhang, J., Takemura, T., Schulz, M., Tsigaridis, K., Bauer, S. E., Emmons, L., Horowitz, L., Naik, V., van Noije, T., Bergman, T., Lamarque, J.-F., Zanis, P., Tegen, I., Westervelt, D. M., Le Sager, P., Good, P., Shim, S., O'Connor, F., Akritidis, D., Georgoulias, A. K., Deushi, M., Sentman, L. T., John, J. G., Fujimori, S., and Collins, W. J.: Climate and air quality impacts due to mitigation of non-methane near-term climate forcers, Atmos. Chem. Phys., 20, 9641–9663, https://doi.org/10.5194/acp-20-9641-2020, 2020.
Amaya, D. J., Siler, N., Xie, S.-P., and Miller, A. J.: The interplay of internal and forced modes of Hadley Cell expansion: lessons from the global warming hiatus, Clim. Dynam., 51, 305–319, https://doi.org/10.1007/s00382-017-3921-5, 2018.
Andreae, M. O., Jones, C. D., and Cox, P. M.: Strong present-day aerosol cooling implies a hot future, Nature, 435, 1187–1190, https://doi.org/10.1038/nature03671, 2005.
Bahadur, R., Praveen, P. S., Xu, Y., and Ramanathan, V.: Solar absorption by elemental and brown carbon determined from spectral observations, P. Natl. Acad. Sci. USA, 109, 17366–17371, https://doi.org/10.1073/pnas.1205910109, 2012.
Bellomo, K., Murphy, L. N., Cane, M. A., Clement, A. C., and Polvani, L. M.: Historical forcings as main drivers of the Atlantic multidecadal variability in the CESM large ensemble, Clim. Dynam., 50, 3687–3698, https://doi.org/10.1007/s00382-017-3834-3, 2018.
Bender, F. A.-M.: Aerosol Forcing: Still Uncertain, Still Relevant, AGU Adv., 1, e2019AV000128, https://doi.org/10.1029/2019AV000128, 2020.
Booth, B. B. B., Dunstone, N. J., Halloran, P. R., Andrews, T., and Bellouin, N.: Aerosols implicated as a prime driver of twentieth-century North Atlantic climate variability, Nature, 484, 228–232, https://doi.org/10.1038/nature10946, 2012.
Broccoli, A. J., Dahl, K. A., and Stouffer, R. J.: Response of the ITCZ to Northern Hemisphere cooling, Geophys. Res. Lett., 33, L01702, https://doi.org/10.1029/2005GL024546, 2006.
Cai, W., Bi, D., Church, J., Cowan, T., Dix, M., and Rotstayn, L.: Pan-oceanic response to increasing anthropogenic aerosols: Impacts on the Southern Hemisphere oceanic circulation, Geophys. Res. Lett., 33, L21707, https://doi.org/10.1029/2006GL027513, 2006.
Chemke, R. and Dagan, G.: The Effects of the Spatial Distribution of Direct Anthropogenic Aerosols Radiative Forcing on Atmospheric Circulation, J. Climate, 31, 7129–7145, https://doi.org/10.1175/JCLI-D-17-0694.1, 2018.
Chung, E.-S. and Soden, B. J.: Hemispheric climate shifts driven by anthropogenic aerosol – cloud interactions, Nat. Geosci., 10, 566–571, https://doi.org/10.1038/ngeo2988, 2017.
Dagan, G., Stier, P., and Watson-Parris, D.: Aerosol Forcing Masks and Delays the Formation of the North Atlantic Warming Hole by Three Decades, Geophys. Res. Lett., 47, e2020GL090778, https://doi.org/10.1029/2020GL090778, 2020.
Dai, A., Fyfe, J. C., Xie, S. P., and Dai, X.: Decadal modulation of global surface temperature by internal climate variability, Nat. Clim. Change, 5, 555, https://doi.org/10.1038/nclimate2605, 2015.
Delworth, T. L. and Dixon, K. W.: Have anthropogenic aerosols delayed a greenhouse gas-induced weakening of the North Atlantic thermohaline circulation?, Geophys. Res. Lett., 33, L02606, https://doi.org/10.1029/2005GL024980, 2006.
Deng, J., Dai, A., and Xu, H.: Nonlinear Climate Responses to Increasing CO2 and Anthropogenic Aerosols Simulated by CESM1, J. Clim., 33, 281–301, https://doi.org/10.1175/JCLI-D-19-0195.1, 2019.
Deser, C., Phillips, A. S., Simpson, I. R., Rosenbloom, N., Coleman, D., Lehner, F., Pendergrass, A. G., DiNezio, P., and Stevenson, S.: Isolating the Evolving Contributions of Anthropogenic Aerosols and Greenhouse Gases: A New CESM1 Large Ensemble Community Resource, J. Climate, 33, 7835–7858, https://doi.org/10.1175/JCLI-D-20-0123.1, 2020 (data available at: https://www.cesm.ucar.edu/working_groups/CVC/simulations/cesm1-single_forcing_le.html, last access: 15 December 2021).
Ding, Q., Schweiger, A., L'Heureux, M., Steig, E. J., Battisti, D. S., Johnson, N. C., Blanchard-Wrigglesworth, E., Po-Chedley, S., Zhang, Q., Harnos, K., Bushuk, M., Markle, B., and Baxter, I.: Fingerprints of internal drivers of Arctic sea ice loss in observations and model simulations, Nat. Geosci., 12, 28–33, https://doi.org/10.1038/s41561-018-0256-8, 2019.
Dong, B., Wilcox, L. J., Highwood, E. J., and Sutton, R. T.: Impacts of recent decadal changes in Asian aerosols on the East Asian summer monsoon: roles of aerosol–radiation and aerosol–cloud interactions, Clim. Dynam., 53, 3235–3256, https://doi.org/10.1007/s00382-019-04698-0, 2019.
Dong, L. and McPhaden, M. J.: The role of external forcing and internal variability in regulating global mean surface temperatures on decadal timescales, Environ. Res. Lett., 12, 034011, https://doi.org/10.1088/1748-9326/aa5dd8, 2017.
Dong, L., Zhou, T., and Chen, X.: Changes of Pacific decadal variability in the twentieth century driven by internal variability, greenhouse gases, and aerosols, Geophys. Res. Lett., 41, 8570–8577, https://doi.org/10.1002/2014GL062269, 2014.
Fiedler, S. and Putrasahan, D.: How Does the North Atlantic SST Pattern Respond to Anthropogenic Aerosols in the 1970s and 2000s?, Geophys. Res. Lett., 48, e2020GL092142, https://doi.org/10.1029/2020GL092142, 2021.
Fiedler, S., Stevens, B., and Mauritsen, T.: On the sensitivity of anthropogenic aerosol forcing to model-internal variability and parameterizing a Twomey effect, J. Adv. Model. Earth Syst., 9, 1325–1341, https://doi.org/10.1002/2017MS000932, 2017.
Gillett, N. P., Shiogama, H., Funke, B., Hegerl, G., Knutti, R., Matthes, K., Santer, B. D., Stone, D., and Tebaldi, C.: The Detection and Attribution Model Intercomparison Project (DAMIP v1.0) contribution to CMIP6, Geosci. Model Dev., 9, 3685–3697, https://doi.org/10.5194/gmd-9-3685-2016, 2016.
Hassan, T., Allen, R. J., Liu, W., and Randles, C. A.: Anthropogenic aerosol forcing of the Atlantic meridional overturning circulation and the associated mechanisms in CMIP6 models, 21, 5821–5846, https://doi.org/10.5194/acp-21-5821-2021, 2021.
Hilgenbrink, C. C. and Hartmann, D. L.: The Response of Hadley Circulation Extent to an Idealized Representation of Poleward Ocean Heat Transport in an Aquaplanet GCM, J. Clim., 31, 9753–9770, https://doi.org/10.1175/JCLI-D-18-0324.1, 2018.
Hua, W., Dai, A., and Qin, M.: Contributions of Internal Variability and External Forcing to the Recent Pacific Decadal Variations, Geophys. Res. Lett., 45, 7084–7092, https://doi.org/10.1029/2018GL079033, 2018.
Hua, W., Dai, A., Zhou, L., Qin, M., and Chen, H.: An Externally Forced Decadal Rainfall Seesaw Pattern Over the Sahel and Southeast Amazon, Geophys. Res. Lett., 46, 923–932, https://doi.org/10.1029/2018GL081406, 2019.
Hurrell, J. W., Holland, M. M., Gent, P. R., Ghan, S., Kay, J. E., Kushner, P. J., Lamarque, J.-F., Large, W. G., Lawrence, D., Lindsay, K., Lipscomb, W. H., Long, M. C., Mahowald, N., Marsh, D. R., Neale, R. B., Rasch, P., Vavrus, S., Vertenstein, M., Bader, D., Collins, W. D., Hack, J. J., Kiehl, J., and Marshall, S.: The Community Earth System Model: A Framework for Collaborative Research, B. Am. Meteorol. Soc., 94, 1339–1360, https://doi.org/10.1175/BAMS-D-12-00121.1, 2013.
Hwang, Y. T., Frierson, D. M. W., and Kang, S. M.: Anthropogenic sulfate aerosol and the southward shift of tropical precipitation in the late 20th century, Geophys. Res. Lett., 40, 2845–2850, https://doi.org/10.1002/grl.50502, 2013.
IPCC: Summary for Policymakers, in Global Warming of 1.5∘C. An IPCC Special Report on the impacts of global warming of 1.5∘C above pre-industrial levels and related global greenhouse gas emission pathways, in the context of strengthening the global response to the threat of climate change, sustainable development, and efforts to eradicate poverty, Tech. rep., edited by: Masson-Delmotte, V., Zhai, P., Pörtner, H.-O., Roberts, D., Skea, J., Shukla, P. R., Pirani, A., Moufouma-Okia, W., Péan, C., Pidcock, R., Connors, S., Matthews, J. B. R., Chen, Y., Zhou, X., Gomis, M. I., Lonnoy, E., Maycock, T., Tignor, M., and Waterfield, T., World Meteorological Organization, Geneva, Switzerland, 32 pp., 2018.
Jacobson, M. Z.: Investigating cloud absorption effects: Global absorption properties of black carbon, tar balls, and soil dust in clouds and aerosols, J. Geophys. Res.-Atmos., 117, D06205, https://doi.org/10.1029/2011JD017218, 2012.
Kang, S. M., Xie, S.-P., Deser, C., and Xiang, B.: Zonal mean and shift modes of historical climate response to evolving aerosol distribution, Sci. Bull., 66, 2405–2411, https://doi.org/10.1016/j.scib.2021.07.013, 2021.
Kaufmann, R. K., Kauppi, H., Mann, M. L., and Stock, J. H.: Reconciling anthropogenic climate change with observed temperature 1998–2008, P. Natl. Acad. Sci. USA, 108, 11790–11793, https://doi.org/10.1073/pnas.1102467108, 2011.
Kay, J. E., Deser, C., Phillips, A., Mai, A., Hannay, C., Strand, G., Arblaster, J. M., Bates, S. C., Danabasoglu, G., Edwards, J., Holland, M., Kushner, P., Lamarque, J.-F., Lawrence, D., Lindsay, K., Middleton, A., Munoz, E., Neale, R., Oleson, K., Polvani, L., and Vertenstein, M.: The Community Earth System Model (CESM) Large Ensemble Project: A Community Resource for Studying Climate Change in the Presence of Internal Climate Variability, B. Am. Meteorol. Soc., 96, 1333–1349, https://doi.org/10.1175/BAMS-D-13-00255.1, 2015 (data available at: https://www.cesm.ucar.edu/projects/community-projects/LENS/data-sets.html, last access: 15 December 2021).
Kirtman, B., Power, S. B., Adedoyin, A. J., Boer, G. J., Bojariu, R., Camilloni, I., Doblas-Reyes, F., Fiore, A. M., Kimoto, M., Meehl, G., Prather, M., Sarr, A., Schar, C., Sutton, R., van Oldenborgh, G. J., Vecchi, G., and Wang, H.-J.: Chapter 11 – Near-term climate change: Projections and predictability, in: Climate Change 2013: The Physical Science Basis, IPCC Working Group I Contribution to AR5, edited by: IPCC, Cambridge University Press, Cambridge, United Kingdom and New York, NY, USA, 2013.
Klimont, Z., Smith, S. J., and Cofala, J.: The last decade of global anthropogenic sulfur dioxide: 2000–2011 emissions, Environ. Res. Lett., 8, 14003, https://doi.org/10.1088/1748-9326/8/1/014003, 2013.
Kodros, J. K., Scott, C. E., Farina, S. C., Lee, Y. H., L'Orange, C., Volckens, J., and Pierce, J. R.: Uncertainties in global aerosols and climate effects due to biofuel emissions, Atmos. Chem. Phys., 15, 8577–8596, https://doi.org/10.5194/acp-15-8577-2015, 2015.
Krishnan, S., Ekman, A. M. L., Hansson, H.-C., Riipinen, I., Lewinschal, A., Wilcox, L. J., and Dallafior, T.: The Roles of the Atmosphere and Ocean in Driving Arctic Warming Due to European Aerosol Reductions, Geophys. Res. Lett., 47, e2019GL086681, https://doi.org/10.1029/2019GL086681, 2020.
Lelieveld, J., Klingmüller, K., Pozzer, A., Burnett, R. T., Haines, A., and Ramanathan, V.: Effects of fossil fuel and total anthropogenic emission removal on public health and climate, P. Natl. Acad. Sci. USA, 116, 7192–7197, https://doi.org/10.1073/pnas.1819989116, 2019.
Lin, L., Gettelman, A., Xu, Y., and Fu, Q.: Simulated responses of terrestrial aridity to black carbon and sulfate aerosols, J. Geophys. Res.-Atmos., 121, 785–794, https://doi.org/10.1002/2015JD024100, 2016.
Lin, L., Xu, Y., Wang, Z., Diao, C., Dong, W., and Xie, S.-P.: Changes in Extreme Rainfall Over India and China Attributed to Regional Aerosol-Cloud Interaction During the Late 20th Century Rapid Industrialization, Geophys. Res. Lett., 45, 7857–7865, https://doi.org/10.1029/2018GL078308, 2018.
Liu, D., He, C., Schwarz, J. P., and Wang, X.: Lifecycle of light-absorbing carbonaceous aerosols in the atmosphere, npj Clim. Atmos. Sci., 3, 40, https://doi.org/10.1038/s41612-020-00145-8, 2020.
Liu, X., Easter, R. C., Ghan, S. J., Zaveri, R., Rasch, P., Shi, X., Lamarque, J.-F., Gettelman, A., Morrison, H., Vitt, F., Conley, A., Park, S., Neale, R., Hannay, C., Ekman, A. M. L., Hess, P., Mahowald, N., Collins, W., Iacono, M. J., Bretherton, C. S., Flanner, M. G., and Mitchell, D.: Toward a minimal representation of aerosols in climate models: description and evaluation in the Community Atmosphere Model CAM5, Geosci. Model Dev., 5, 709–739, https://doi.org/10.5194/gmd-5-709-2012, 2012.
Mann, M. E., Rahmstorf, S., Kornhuber, K., Steinman, B. A., Miller, S. K., and Coumou, D.: Influence of Anthropogenic Climate Change on Planetary Wave Resonance and Extreme Weather Events, Sci. Rep., 7, 45242, https://doi.org/10.1038/srep45242, 2017.
McGregor, S., Timmermann, A., Stuecker, M. F., England, M. H., Merrifield, M., Jin, F.-F., and Chikamoto, Y.: Recent Walker circulation strengthening and Pacific cooling amplified by Atlantic warming, Nat. Clim. Change, 4, 888–892, https://doi.org/10.1038/nclimate2330, 2014.
Meehl, G. A., Washington, W. M., Ammann, C. M., Arblaster, J. M., Wigley, T. M. L., and Tebaldi, C.: Combinations of Natural and Anthropogenic Forcings in Twentieth-Century Climate, J. Climate, 17, 3721–3727, https://doi.org/10.1175/1520-0442(2004)017<3721:CONAAF>2.0.CO;2, 2004.
Meehl, G. A., Hu, A., Arblaster, J. M., Fasullo, J., and Trenberth, K. E.: Externally Forced and Internally Generated Decadal Climate Variability Associated with the Interdecadal Pacific Oscillation, J. Climate, 26, 7298–7310, https://doi.org/10.1175/JCLI-D-12-00548.1, 2013.
Meehl, G. A., Hu, A., and Teng, H.: Initialized decadal prediction for transition to positive phase of the Interdecadal Pacific Oscillation, Nat. Commun., 7, 11718, https://doi.org/10.1038/ncomms11718, 2016.
Menary, M. B., Robson, J., Allan, R. P., Booth, B. B. B., Cassou, C., Gastineau, G., Gregory, J., Hodson, D., Jones, C., Mignot, J., Ringer, M., Sutton, R., Wilcox, L., and Zhang, R.: Aerosol-Forced AMOC Changes in CMIP6 Historical Simulations, Geophys. Res. Lett., 47, e2020GL088166, https://doi.org/10.1029/2020GL088166, 2020.
Ming, Y. and Ramaswamy, V.: A Model Investigation of Aerosol-Induced Changes in Tropical Circulation, J. Climate, 24, 5125–5133, https://doi.org/10.1175/2011JCLI4108.1, 2011.
Morrison, H. and Gettelman, A.: A New Two-Moment Bulk Stratiform Cloud Microphysics Scheme in the Community Atmosphere Model, Version 3 (CAM3), Part I: Description and Numerical Tests, J. Climate, 21, 3642–3659, https://doi.org/10.1175/2008JCLI2105.1, 2008.
Oudar, T., Kushner, P. J., Fyfe, J. C., and Sigmond, M.: No Impact of Anthropogenic Aerosols on Early 21st Century Global Temperature Trends in a Large Initial-Condition Ensemble, Geophys. Res. Lett., 45, 9245–9252, https://doi.org/10.1029/2018GL078841, 2018.
Persad, G. G. and Caldeira, K.: Divergent global-scale temperature effects from identical aerosols emitted in different regions, Nat. Commun., 9, 3289, https://doi.org/10.1038/s41467-018-05838-6, 2018.
Penner, J. E., Andreae, M. O., Annegarn, H., Barrie, L., Feichter, J., Hegg, D., and Pitari, G.: Aerosols, their direct and indirect effects, In Climate Change 2001: The Scientific Basis. Contribution of Working Group I to the Third Assessment Report of the Intergovernmental Panel on Climate Change, Cambridge University Press, Cambridge, United Kingdom and New York, NY, USA, 289–348, 2001.
Qin, M., Dai, A., and Hua, W.: Aerosol-forced multidecadal variations across all ocean basins in models and observations since 1920, Sci. Adv., 6, eabb0425, https://doi.org/10.1126/sciadv.abb0425, 2020.
Salzmann, M.: Global warming without global mean precipitation increase?, Sci. Adv., 2, e1501572, https://doi.org/10.1126/sciadv.1501572, 2016.
Samset, B. H., Myhre, G., Forster, P. M., Hodnebrog, Ø., Andrews, T., Faluvegi, G., Fläschner, D., Kasoar, M., Kharin, V., Kirkevåg, A., Lamarque, J.-F., Olivié, D., Richardson, T., Shindell, D., Shine, K. P., Takemura, T., and Voulgarakis, A.: Fast and slow precipitation responses to individual climate forcers: A PDRMIP multimodel study, Geophys. Res. Lett., 43, 2782–2791, https://doi.org/10.1002/2016GL068064, 2016.
Samset, B. H., Stjern, C. W., Andrews, E., Kahn, R. A., Myhre, G., Schulz, M., and Schuster, G. L.: Aerosol Absorption: Progress Towards Global and Regional Constraints, Curr. Clim. Chang. Reports, 4, 65–83, https://doi.org/10.1007/s40641-018-0091-4, 2018.
Samset, B. H., Lund, M. T., Bollasina, M., Myhre, G., and Wilcox, L.: Emerging Asian aerosol patterns, Nat. Geosci., 12, 582–584, https://doi.org/10.1038/s41561-019-0424-5, 2019.
Seo, J., Kang, S. M., and Frierson, D. M. W.: Sensitivity of Intertropical Convergence Zone Movement to the Latitudinal Position of Thermal Forcing, J. Climate, 27, 3035–3042, https://doi.org/10.1175/JCLI-D-13-00691.1, 2014.
Shen, Z. and Ming, Y.: The Influence of Aerosol Absorption on the Extratropical Circulation, J. Clim., 31, 5961–5975, https://doi.org/10.1175/JCLI-D-17-0839.1, 2018.
Shindell, D. T. and Faluvegi, G.: Climate response to regional radiative forcing during the twentieth century, Nat. Geosci., 2, 294–300, https://doi.org/10.1038/ngeo473, 2009.
Shindell, D. T., Faluvegi, G., Rotstayn, L., and Milly, G.: Spatial patterns of radiative forcing and surface temperature response, J. Geophys. Res.-Atmos., 120, 5385–5403, https://doi.org/10.1002/2014JD022752, 2015.
Smith, D. M., Booth, B. B. B., Dunstone, N. J., Eade, R., Hermanson, L., Jones, G. S., Scaife, A. A., Sheen, K. L., and Thompson, V.: Role of volcanic and anthropogenic aerosols in the recent global surface warming slowdown, Nat. Clim. Change, 6, 936–940, https://doi.org/10.1038/nclimate3058, 2016.
Song, F., Leung, L. R., Lu, J., Dong, L., Zhou, W., Harrop, B., and Qian, Y.: Emergence of seasonal delay of tropical rainfall during 1979–2019, Nat. Clim. Change, 11, 605–612, https://doi.org/10.1038/s41558-021-01066-x, 2021.
Swart, N. C., Fyfe, J. C., Hawkins, E., Kay, J. E., and Jahn, A.: Influence of internal variability on Arctic sea-ice trends, Nat. Clim. Change, 5, 86–89, https://doi.org/10.1038/nclimate2483, 2015.
Takahashi, C. and Watanabe, M.: Pacific trade winds accelerated by aerosol forcing over the past two decades, Nat. Clim. Change, 6, 768–772, https://doi.org/10.1038/nclimate2996, 2016.
Taylor, K. E., Stouffer, R. J., and Meehl, G. A.: An Overview of CMIP5 and the Experiment Design, B. Am. Meteorol. Soc., 93, 485–498, https://doi.org/10.1175/BAMS-D-11-00094.1, 2012.
Verma, T., Saravanan, R., Chang, P., and Mahajan, S.: Tropical Pacific Ocean Dynamical Response to Short-Term Sulfate Aerosol Forcing, J. Clim., 32, 8205–8221, https://doi.org/10.1175/JCLI-D-19-0050.1, 2019.
Wang, H., Xie, S.-P., and Liu, Q.: Comparison of Climate Response to Anthropogenic Aerosol versus Greenhouse Gas Forcing: Distinct Patterns, J. Clim., 29, 5175–5188, https://doi.org/10.1175/JCLI-D-16-0106.1, 2016.
Wang, H., Xie, S.-P., Zheng, X.-T., Kosaka, Y., Xu, Y., and Geng, Y.-F.: Dynamics of Southern Hemisphere Atmospheric Circulation Response to Anthropogenic Aerosol Forcing, Geophys. Res. Lett., 47, e2020GL089919, https://doi.org/10.1029/2020GL089919, 2020.
Wang, Y., Jiang, J. H., and Su, H.: Atmospheric responses to the redistribution of anthropogenic aerosols, J. Geophys. Res.-Atmos., 120, 9625–9641, https://doi.org/10.1002/2015JD023665, 2015.
Wang, Y., Le, T., Chen, G., Yung, Y. L., Su, H., Seinfeld, J. H., and Jiang, J. H.: Reduced European aerosol emissions suppress winter extremes over northern Eurasia, Nat. Clim. Change, 10, 225–230, https://doi.org/10.1038/s41558-020-0693-4, 2020.
Wang, Z., Lin, L., Yang, M., Xu, Y., and Li, J.: Disentangling fast and slow responses of the East Asian summer monsoon to reflecting and absorbing aerosol forcings, Atmos. Chem. Phys., 17, 11075–11088, https://doi.org/10.5194/acp-17-11075-2017, 2017.
Wang, Z., Lin, L., Xu, Y., Che, H., Zhang, X., Zhang, H., Dong, W., Wang, C., Gui, K., and Xie, B.: Incorrect Asian aerosols affecting the attribution and projection of regional climate change in CMIP6 models, Npj Clim. Atmos. Sci., 4, 2, https://doi.org/10.1038/s41612-020-00159-2, 2021.
Watanabe, M. and Tatebe, H.: Reconciling roles of sulphate aerosol forcing and internal variability in Atlantic multidecadal climate changes, Clim. Dynam., 53, 4651–4665, https://doi.org/10.1007/s00382-019-04811-3, 2019.
Xie, S.-P. and Kosaka, Y.: What Caused the Global Surface Warming Hiatus of 1998–2013?, Curr. Clim. Chang. Reports, 3, 128–140, https://doi.org/10.1007/s40641-017-0063-0, 2017.
Xie, S.-P., Lu, B., and Xiang, B.: Similar spatial patterns of climate responses to aerosol and greenhouse gas changes, Nat. Geosci., 6, 828–832, https://doi.org/10.1038/ngeo1931, 2013.
Xu, Y. and Xie, S.-P.: Ocean mediation of tropospheric response to reflecting and absorbing aerosols, Atmos. Chem. Phys., 15, 5827–5833, https://doi.org/10.5194/acp-15-5827-2015, 2015.
Xu, Y., Wu, X., Kumar, R., Barth, M., Diao, C., Gao, M., Lin, L., Jones, B., and Meehl, G. A.: Substantial Increase in the Joint Occurrence and Human Exposure of Heatwave and High‐PM Hazards Over South Asia in the Mid‐21st Century, AGU Advances, 1, e2019AV000103, https://doi.org/10.1029/2019AV000103, 2020.
Xu, Y., Ramanathan, V., and Washington, W. M.: Observed high-altitude warming and snow cover retreat over Tibet and the Himalayas enhanced by black carbon aerosols, Atmos. Chem. Phys., 16, 1303–1315, https://doi.org/10.5194/acp-16-1303-2016, 2016.
Xu, Y., Lamarque, J. F., and Sanderson, B. M.: The importance of aerosol scenarios in projections of future heat extremes, Clim. Change, 146, 393–406, https://doi.org/10.1007/s10584-015-1565-1, 2018.
Zhao, A., Bollasina, M. A., and Stevenson, D. S.: Strong Influence of Aerosol Reductions on Future Heatwaves, Geophys. Res. Lett., 46, 4913–4923, https://doi.org/10.1029/2019GL082269, 2019.
Zheng, Y., Zhang, Q., Tong, D., Davis, S. J., and Caldeira, K.: Climate effects of China's efforts to improve its air quality, Environ. Res. Lett., 15, 104052, https://doi.org/10.1088/1748-9326/ab9e21, 2020.