the Creative Commons Attribution 4.0 License.
the Creative Commons Attribution 4.0 License.
 | 20 Dec 2021
The Michelson Interferometer for Passive Atmospheric Sounding global climatology of BrONO2 2002–2012: a test for stratospheric bromine chemistry
Oliver Kirner
Gerald Wetzel
Björn-Martin Sinnhuber
Florian Haenel
Sören Johansson
Johannes Orphal
Roland Ruhnke
Gabriele Stiller
Thomas von Clarmann
We present the first observational dataset of vertically resolved global stratospheric BrONO2 distributions from July 2002 until April 2012 and compare them to results of the atmospheric chemical climate model ECHAM/MESSy Atmospheric Chemistry (EMAC). The retrieved distributions are based on space-borne measurements of infrared limb-emission spectra recorded by the Michelson Interferometer for Passive Atmospheric Sounding (MIPAS) on Envisat. The derived vertical profiles of BrONO2 volume mixing ratios represent 10∘ latitude bins and 3 d means, separated into sunlit observations and observations in the dark. The estimated uncertainties are around 1–4 pptv, caused by spectral noise for single profiles as well as for further parameter and systematic errors which may not improve by averaging. Vertical resolutions range from 3 to 8 km between 15 and 35 km altitude.
All leading modes of spatial and temporal variability of stratospheric BrONO2 in the observations are well replicated by the model simulations: the large diurnal variability, the low values during polar winter as well as the maximum values at mid and high latitudes during summer. Three major differences between observations and model results are observed: (1) a model underestimation of enhanced BrONO2 in the polar winter stratosphere above about 30 km of up to 15 pptv, (2) up to 8 pptv higher modelled values than observed globally in the lower stratosphere up to 25 km, most obvious during night, and (3) up to 5 pptv lower modelled concentrations at tropical latitudes between 27 and 32 km during sunlit conditions. (1) is explained by the model missing enhanced NOx produced in the mesosphere and lower thermosphere subsiding at high latitudes in winter. This is the first time that observational evidence for enhancement of BrONO2 caused by mesospheric NOx production is reported. The other major inconsistencies (2, 3) between EMAC model results and observations are studied by sensitivity runs with a 1D model. These tentatively hint at a model underestimation of heterogeneous loss of BrONO2 in the lower stratosphere, a simulated production of BrONO2 that is too low during the day as well as strongly underestimated BrONO2 volume mixing ratios when loss via reaction with O(3P) is considered in addition to photolysis. However, considering the uncertainty ranges of model parameters and of measurements, an unambiguous identification of the causes of the differences remains difficult.
The observations have also been used to derive the total stratospheric bromine content relative to years of stratospheric entry between 1997 and 2007. With an average value of 21.2±1.4 pptv of Bry at mid latitudes where the modelled adjustment from BrONO2 to Bry is smallest, the MIPAS data agree with estimates of Bry derived from observations of BrO as well as from MIPAS-Balloon measurements of BrONO2.
- Article
(22655 KB) - Full-text XML
-
Supplement
(11776 KB) - BibTeX
- EndNote


Besides chlorine, bromine is the major halogen constituent, with anthropogenic and natural sources affecting stratospheric ozone (e.g. Sinnhuber et al., 2009; Engel et al., 2018). After Wofsy et al. (1975) had described the possible relevance of bromine for ozone, the important role of bromine nitrate (BrONO2) within stratospheric bromine chemistry was proposed by Spencer and Rowland (1978). They noticed the much faster photolysis of BrONO2 compared to ClONO2, which is an important prerequisite for the effectiveness of bromine ozone destruction cycles compared to those of chlorine (Lary, 1997; Klobas et al., 2020).
BrONO2 is produced via the termolecular reaction (Burkholder et al., 2019, and references therein)
Due to its relatively short lifetime, the BrONO2 concentration is strongly coupled to changes in NO2 (Lary, 1996). The 1σ uncertainty factor of the reaction rate (Reaction R1) as provided by Burkholder et al. (2015, 2019) is 1.2 (i.e. 20 % uncertainty) at 298 K, increasing to ∼1.9 at a stratospheric temperature of 220 K.
The main loss process of BrONO2 during the day is photolysis (Burkholder et al., 2019, and references therein):
in which the products are Br+NO3 and BrO+NO2. The recommended quantum yields at wavelengths above 300 nm, being most important in the lower stratosphere, are 0.85 and 0.15, respectively. While in Sander et al. (2011) a combined uncertainty in cross sections and quantum yields of 1.4 is provided, the most recent evaluations (Burkholder et al., 2015, 2019) assign one wavelength-independent uncertainty factor of 1.2 (2σ) to the cross sections.
Further loss of BrONO2 is due to atomic oxygen (Soller et al., 2001):
which occurs, like Reaction (R2), only during sunlit conditions due to the necessary presence of O(3P). The 1σ uncertainty factor for the reaction coefficient varies between 1.25 at room temperature and 1.3 at 220 K (Burkholder et al., 2019). However, independent confirmation of the reaction parameters of Reaction (R3) is pending (Burkholder et al., 2019).
Finally, heterogeneous reactions can affect BrONO2 concentrations, like hydrolysis in sulfuric acid aerosols (Burkholder et al., 2019, and references therein),
or in combination with halogens at surfaces, like
where typical uncertainty factors of the gas–surface reaction probabilities are in the range of 2–4 (Burkholder et al., 2019).
Given the relatively large uncertainties in most of these leading reactions involving BrONO2, comparison of observations to model calculations can be helpful for verification or even for suggesting improvements. For example, Kreycy et al. (2013) analysed stratospheric balloon observations and concluded that the ratio should be increased to fit their data. Such investigations can be useful, first, to improve model simulations of stratospheric ozone loss and, second, to aid the analysis of the total stratospheric bromine (Bry) content from observations of one species, such as BrO (e.g. Harder et al., 2000; Dorf et al., 2006a, 2008; Millán et al., 2012; Stachnik et al., 2013; Kreycy et al., 2013; Werner et al., 2017; Engel et al., 2018).
Anthropogenic and natural emissions both contribute roughly equally to the present-day stratospheric bromine loading: Engel et al. (2018) give a best estimate of the total stratospheric bromine loading for 2016 of 19.6 pptv, of which natural sources contribute slightly more than 10 pptv. Brominated very short-lived substances (VSLSs), such as bromoform (CHBr3) and dibromomethane (CH2Br2), contribute about 5 pptv to the stratospheric bromine loading, but their precise current contribution, any possible long-term changes, and the additional influx of inorganic product gases (product gas injection, PGI) are still uncertain (e.g. Sinnhuber et al., 2009; Aschmann and Sinnhuber, 2013; Falk et al., 2017). In this context, the observation of BrONO2 provides an additional independent approach to determine total Bry (Wetzel et al., 2017) and, in consequence, to estimate the relative contribution of brominated VSLSs.
Due to its spectral lines in the microwave and UV-vis, remote-sensing observations of BrO, the major inorganic bromine species in the lower stratosphere during sunlit hours, are common from the ground (e.g. Solomon et al., 1989; Carroll et al., 1989; Fish et al., 1995; Theys et al., 2007; Hendrick et al., 2008), from aircraft (e.g. Koenig et al., 2017; Werner et al., 2017; Rotermund et al., 2021), from balloons (e.g. Harder et al., 2000; Pundt, 2002; Dorf et al., 2006a, 2008; Stachnik et al., 2013; Kreycy et al., 2013), and from satellites (e.g. Sinnhuber et al., 2005; Livesey et al., 2006; Kovalenko et al., 2007; McLinden et al., 2010; Rozanov et al., 2011; Millán et al., 2012; Parrella et al., 2013). In contrast, BrONO2, the most important night-time reservoir of bromine, was detected in infrared limb-emission observations by the Michelson Interferometer for Passive Atmospheric Sounding (MIPAS) instrument on board the Envisat satellite only a decade ago (Höpfner et al., 2009). At that time the retrieval of altitude profiles was complicated by uncertainties in the infrared absorption cross sections of BrONO2. In the meantime, Wagner and Birk (2016) provided an improved infrared spectroscopic database covering stratospheric conditions. On the basis of these new data, Wetzel et al. (2017) analysed the diurnal variation of BrONO2 during three flights of the MIPAS-Balloon instrument.
In this paper we introduce the first day- and night-time climatology of stratospheric BrONO2 as derived for the ∼10-year lifetime of MIPAS/Envisat. We compare the results to global model simulations and discuss major differences by use of 1D photochemical modelling. Finally, the total stratospheric Bry content is estimated.
2.1 MIPAS instrument and data analysis
Flying on the polar-orbiting satellite Envisat, the limb sounder MIPAS recorded infrared spectra of the atmospheric thermal emission from 2002 until 2012 (Fischer et al., 2008). MIPAS was operated in two major modes: during period 1 (P1), between July 2002 and March 2004, the spectral resolution, defined here as 0.5× (maximum optical path difference)−1, was 0.025 cm−1, and during period 2 (P2) between January 2005 and April 2012, the resolution was set to 0.0625 cm−1. During P1 the spectra of the “nominal” viewing modes as used in this work were taken at 17 tangent points between 7 and 72 km with 3 km steps up to 42 km and somewhat larger steps above. During P2, 27 spectra were recorded per limb scan with latitude-dependent tangent altitudes ranging from 5–70 km at the poles to 12–77 km over the Equator, with steps increasing with height from 1.5 to 4.5 km. The along-track sampling distance between each limb scan was ∼550 km during P1 and ∼420 km during P2. The local solar Equator-crossing time at the position of the tangent points is around 10:10 for the descending node and 22:20 for the ascending node of the Sun-synchronous orbit.
Since the first stratospheric detection of BrONO2 (Höpfner et al., 2009), retrievals from averaged MIPAS spectra have been established for species with very weak signatures, such as SO2 and NH3 (Höpfner et al., 2013, 2016). The retrieval of vertical profiles of BrONO2 volume mixing ratios as applied for the current dataset follows closely the procedure described in Höpfner et al. (2009). Here we briefly describe the retrieval scheme as well as the applied improvements with respect to Höpfner et al. (2009).
For the selection of spectra to be averaged zonally as well as temporally, the cloud filter method by Spang et al. (2004) has been applied to sort out any measurements affected by tropospheric as well as polar stratospheric clouds. Further, only spectra above about 15 km tangent altitude have been used for averaging so as to concentrate mainly on the stratosphere. We have applied a constrained nonlinear multiparameter least-squares fitting procedure to each limb sequence of averaged spectra to derive profiles of trace gas volume mixing ratios at 1 km-spaced vertical levels. Here we have used the same spectral interval (801–820 cm−1) and atmospheric parameters simultaneously fitted with BrONO2 (O3, ClONO2, NO2, CFC−22, HNO4, COF2, HNO3, ClO, CCl4, CFC−113, PAN, T) as in Höpfner et al. (2009). We have applied a first-order smoothing constraint (Steck, 2002; Tikhonov, 1963) to dampen oscillations in the retrieved profiles. The regularization strength for each of the simultaneously derived species has been adjusted separately, and the related a priori profile for the target species BrONO2 was set to 0.1 pptv, while for the other species climatological profiles have been used.
Major improvements and updates compared to Höpfner et al. (2009) are the following.
-
The most recent version (V8.03) of level-1B calibrated limb radiances by the European Space Agency (ESA) has been used (https://earth.esa.int/web/sppa/mission-performance/esa-missions/envisat/mipas/products-availability/level-1/level1-8.03, last access: 14 December 2021).
-
To simulate the spectral feature of BrONO2, the new pressure- and temperature-dependent infrared spectroscopic database by Wagner and Birk (2016) has been used.
-
The spectroscopy of the interfering gases has been taken from the high-resolution transmission molecular absorption database (HITRAN) 2016 (Gordon et al., 2017) with the exception of HO2NO2. For this gas, the infrared cross sections in HITRAN for 220 K by May and Friedl (1993) have been extended by the ones of Friedl et al. (1994), which were measured at 298 K, to account for different atmospheric temperatures by two-point interpolation (Wetzel et al., 2017).
-
While in Höpfner et al. (2009) retrievals have been performed based on monthly mean spectra of September 2002 and 2003 within few coarse latitude bands, here we have subdivided the MIPAS measurements into 18 latitude bands of 10∘ spacing with a temporal binning of 3 d over the whole observational period 2002–2012.
We have estimated altitude-dependent errors of the BrONO2 retrieval by applying assumptions about single error sources to two randomly selected periods in March and June for the years 2003 and 2009, i.e. during P1 and P2, respectively. The results are shown in Fig. 1 together with the total error profile calculated by quadratic combination of single error components. Instrumental uncertainties are estimated at 3 % for the instrument line shape expressed as linear loss of modulation efficiency toward the maximum optical path difference of the interferometer (ILS), 1 % for radiometric gain calibration (RadGain), and 300 m for tangent height knowledge (Htang). The uncertainty of European Centre for Medium-Range Weather Forecasts (ECMWF) temperatures (Temp) has been set to values of 2 K below and 5 K above 35 km altitude. The uncertainty of the BrONO2 spectroscopy has been assumed to be 5 %, which is on the conservative side considering the 2 % (1σ) error estimation given in Wagner and Birk (2016). Further errors refer to the spectroscopic parameters of interfering gases. For those, we have assumed uncertainties of 5 % for species described by cross sections (SpecXitf), 5 % for intensities (SpecINTitf) and 10 % for the half-widths of the line parameters (SpecHWift). These assumptions are within the typical errors provided in the database (Gordon et al., 2017). A further error term describing the retrieval from averaged spectra (NonLin) has been estimated on the basis of dedicated retrieval simulations as detailed in Höpfner et al. (2009). For this estimate the values used for the tangent altitude scatter of single observations were set to 400 and 300 m (1σ) during P1 and P2, respectively.
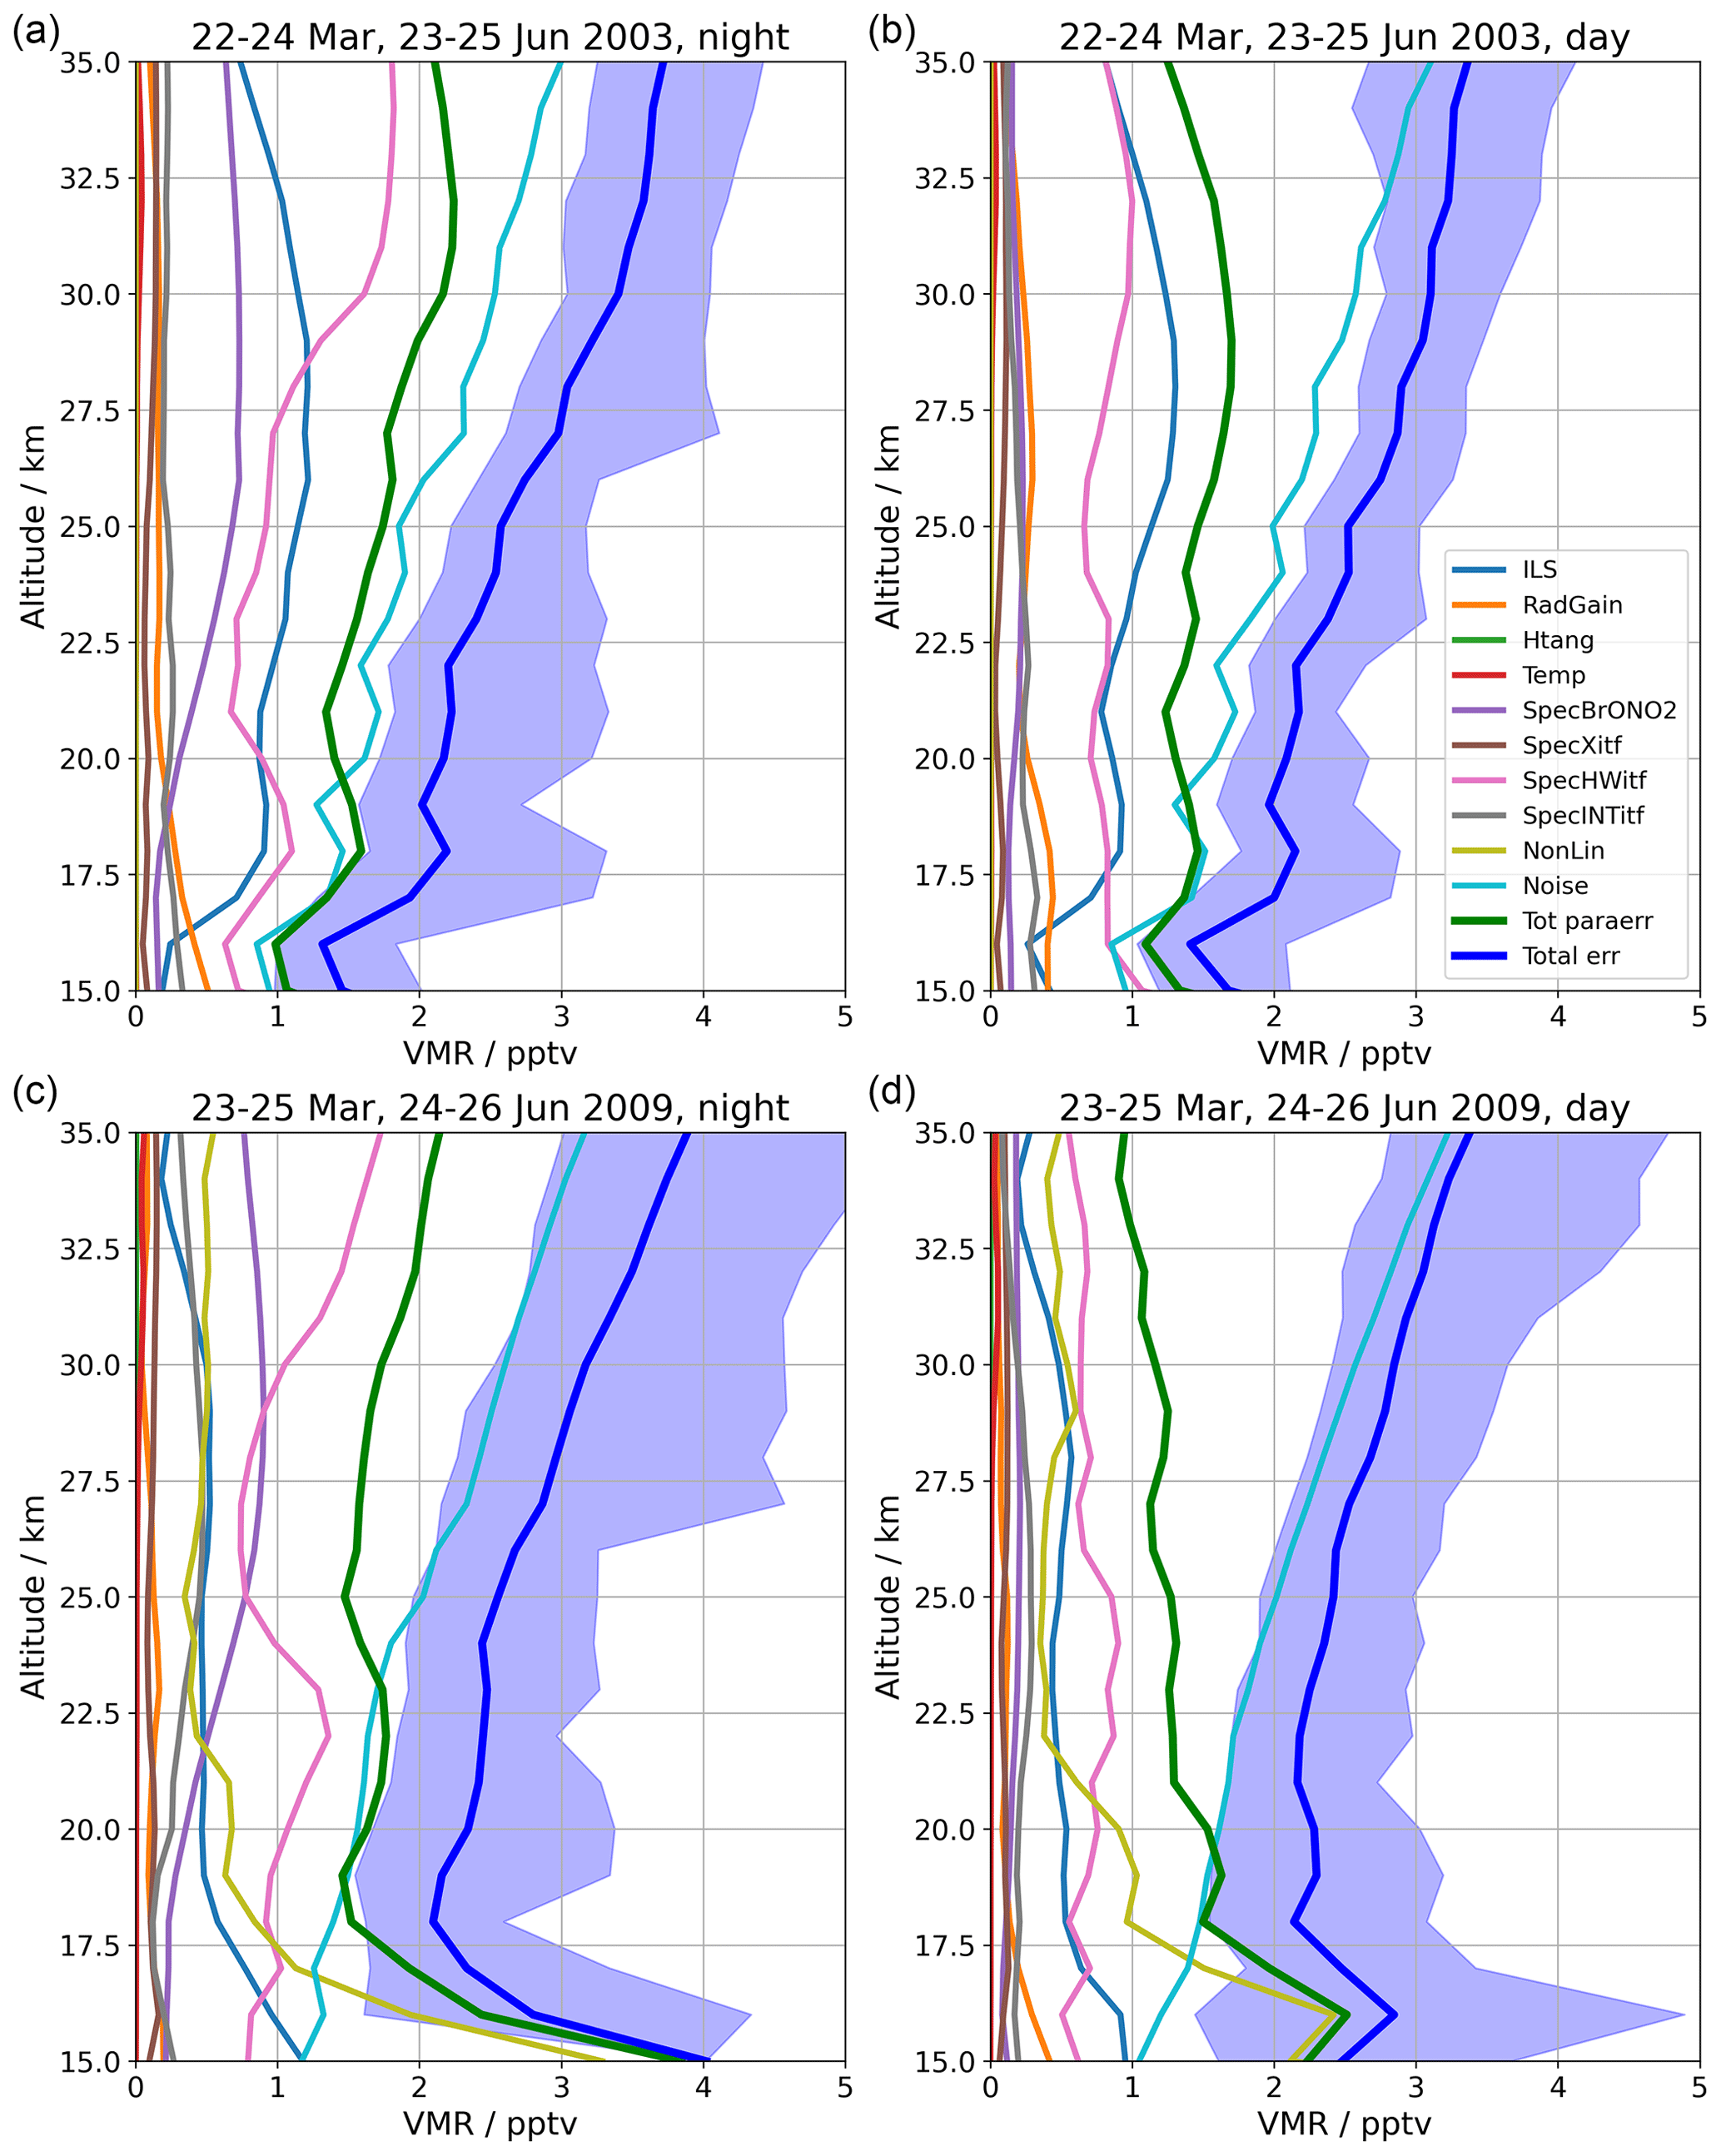
Figure 1 Retrieval error estimates from four 3 d periods, two during P1 (a, b) and two during P2 (c, d), for both dark (a, c) and sunlit (b, d) conditions. Considered error sources are the uncertainties of the instrumental line shape and radiometric gain calibration (ILS, RadGain), the pointing knowledge (Htang), assumed temperature profiles (Temp), spectroscopic errors of BrONO2 absorption cross sections (SpecBrONO2) and errors in cross sections (SpecXitf), line half-widths (SpecHWift) and line intensities (SpecINTitf) of interfering species, as well as the error due to the applied technique of retrievals from averaged spectra (NonLin) and the spectral noise of the instrument (Noise). The total error (Total err) has been determined by quadratic combination of all single error components, while the combined parameter and systematic error (Tot paraerr) considers all uncertainties except the spectral noise. The blue-filled space around the total error curves indicates the areas into which 90 % of the total error profile estimates fall.
The total error estimate as calculated by quadratic combination of the single components is given by the blue lines in Fig. 1. Around this total error estimate, the blue shading indicates the variability of the estimated errors for all latitude bands. In general, the estimated total errors vary between about 1 and 4 pptv, independent of day- or night-time observations. They appear to be slightly smaller during P1 compared to P2, which is probably due to the better spectral resolution during P1. Further, it is evident from Fig. 1 that, below 20–23 km, total parameter errors and spectral noise are the dominant contribution to the total error, while at larger altitudes it is mostly dominated by spectral noise.
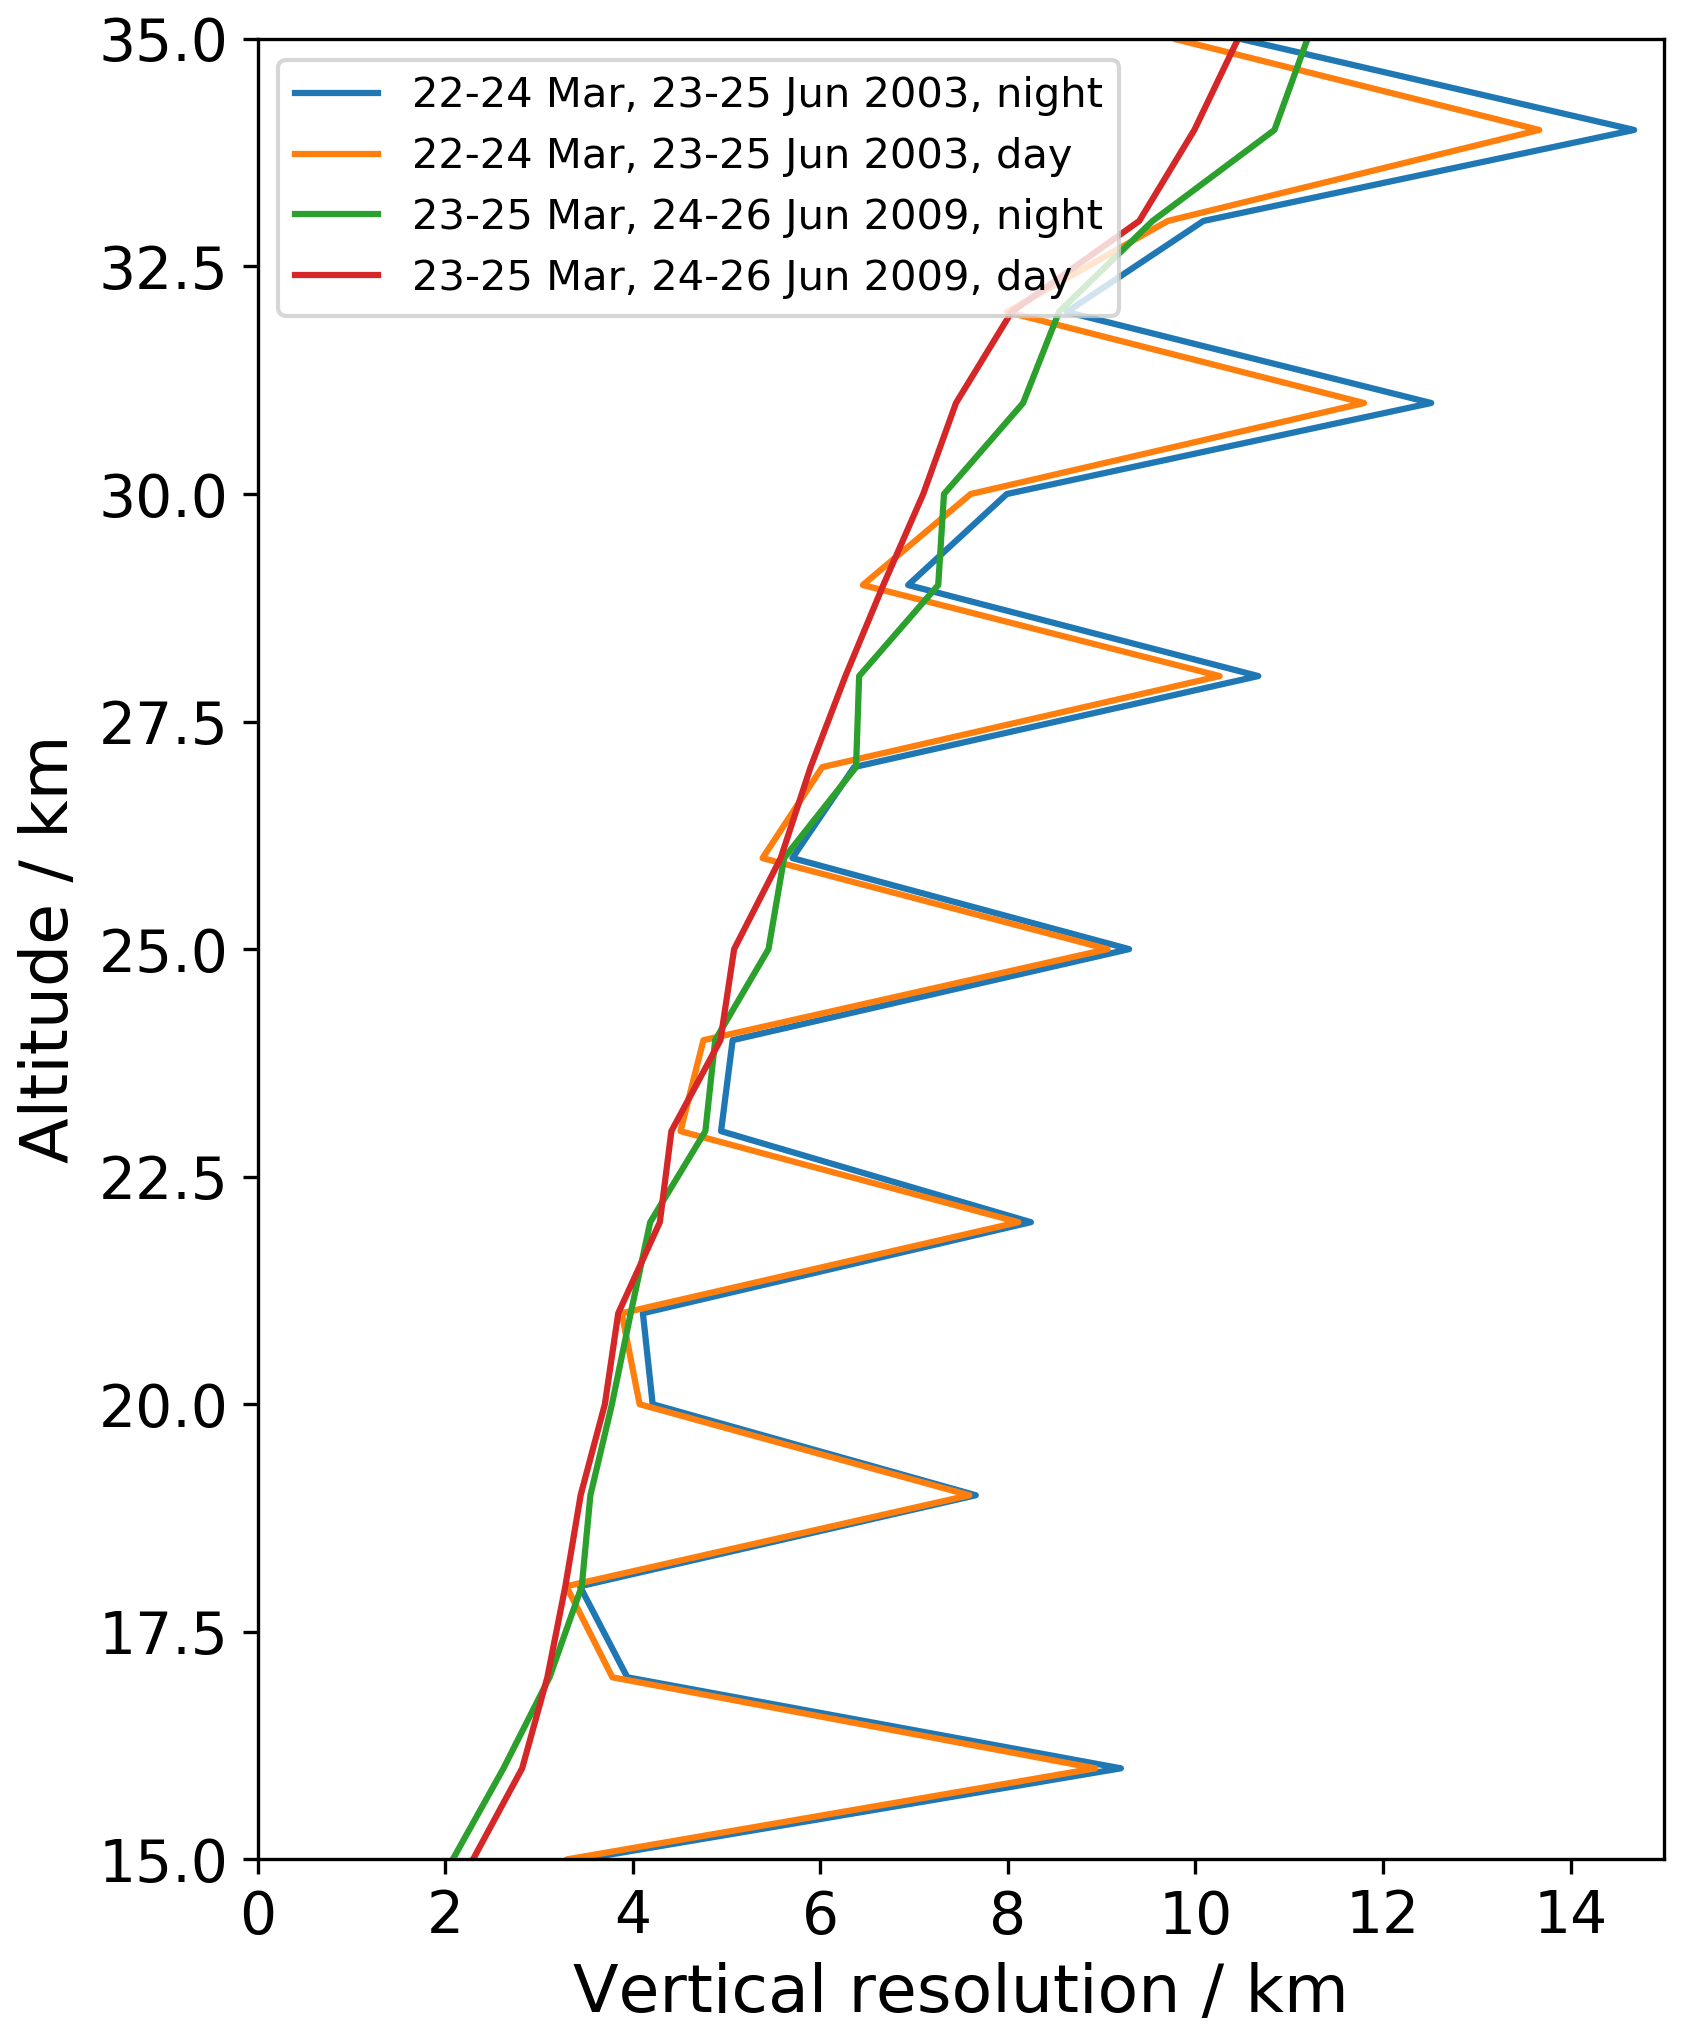
Figure 2 Examples of the vertical resolution of the MIPAS BrONO2 retrieval as derived from the diagonal elements of the averaging kernel matrices. Given curves are averages over all latitude bands for the given periods during P1 and P2. The zigzag during P1 is caused by the constant tangent altitude grid, while during P2, the variation of tangent altitudes with latitude smears out this effect. Note that the vertical resolution is generally finest at the tangent points and coarsest in between.
As a further diagnostic measure of the retrieval, Fig. 2 shows the vertical resolution as a function of altitude. It has been calculated by dividing the retrieval grid width of 1 km by the diagonal elements of the averaging kernel matrices (Rodgers, 2004). The vertical resolution is about 3 km at 15 km altitude and becomes coarser with altitude, reaching 8 km at 35 km altitude. The vertical resolution is generally finer at the tangent altitudes and coarser at retrieval levels between the tangent altitudes. Conversely, the retrieval noise is larger at the tangent altitudes and smaller at altitude levels in between. These effects are only visible when a retrieval set-up is chosen where the retrieval grid is finer than the tangent altitude spacing. Since in period P1 the tangent altitude grid is fixed, this effect survives the averaging, leading to a zigzag profile of the vertical resolution. In contrast, in P2 the tangent altitude grid varies with latitude, and the zigzag features of vertical resolution average out.
2.2 Atmospheric modelling
We have compared the MIPAS BrONO2 dataset with a multi-annual simulation from the chemical climate model ECHAM/MESSy Atmospheric Chemistry (EMAC) (Jöckel et al., 2010). Within EMAC, the interface Modular Earth Submodel System (MESSy) links the sub-models describing tropospheric and middle atmospheric processes to the dynamical core, the fifth-generation European Centre Hamburg general circulation model ECHAM5 (Roeckner et al., 2006). We have used EMAC (ECHAM5 version 5.3.02, MESSy version 2.52) at the T42L90MA resolution with 90 vertical hybrid pressure levels from the ground up to 0.01 hPa (∼80 km) and a horizontal resolution of ∼ 2.8 latitude × longitude. The sub-models MECCA (Sander et al., 2005) and MSBM (Kirner et al., 2011) simulate gas-phase chemistry and polar stratospheric clouds including heterogeneous reaction rates, respectively. To reproduce realistic conditions for comparison with the observations, the model run was nudged towards the ECMWF reanalysis ERA-Interim (Dee et al., 2011) by a Newtonian relaxation technique of surface pressure, temperature, vorticity, and divergence above the boundary layer and below 1 hPa (van Aalst, 2005). We have applied a comprehensive chemistry set-up from the troposphere to the lower mesosphere with more than 100 species involved in gas-phase, photolysis, and heterogeneous reactions on liquid sulfate aerosols, nitric acid trihydrate (NAT), and ice particles. Rate constants for gas-phase reactions have been taken mainly from Atkinson et al. (2007) and the Jet Propulsion Laboratory (JPL) compilation (Sander et al., 2011). Photochemical reactions of short-lived bromine-containing organic compounds CHBr3, CH2Br2, CH2ClBr, CHClBr2, and CHCl2Br are included in the model set-up (Jöckel et al., 2016). Boundary conditions for CH3Br and the bromine-containing halons were taken from Meinshausen et al. (2011) and extended with the RCP6.0 scenario as suggested by Eyring et al. (2013). We have used scenario 5 of Warwick et al. (2006) to describe the surface emissions of these organic bromine species. During the MIPAS measurement periods, from the model output first all data within 1 h around 10:00 and 22:00 LT were selected. Depending on their latitude, longitude and altitude, they were then assigned to sunlit and dark conditions and averaged over the observational bins of 10∘ latitude and 3 d periods. In the extreme cases of twilight conditions at high latitudes, this might induce differences between modelling and observations. However, in the discussion below we only refer to situations which are not affected by twilight conditions.
For specific sensitivity investigations at low latitudes, we have applied a 1D photochemical stacked box model. The chemical mechanism of the 1D model is based on the SLIMCAT model (Sinnhuber et al., 2005, and references therein). The 1D model runs have been initialized with equatorial mean profiles of the EMAC simulation of all inorganic Bry species and NO2. For the other species as well as pressure and temperature, equatorial profiles from the MIPAS reference database have been used (Remedios et al., 2007). A comparison of the parameters of several bromine reactions between EMAC, the 1D baseline model run and the JPL2019 compilation (Burkholder et al., 2019) is provided in Table D1.
3.1 Overview of the measurements
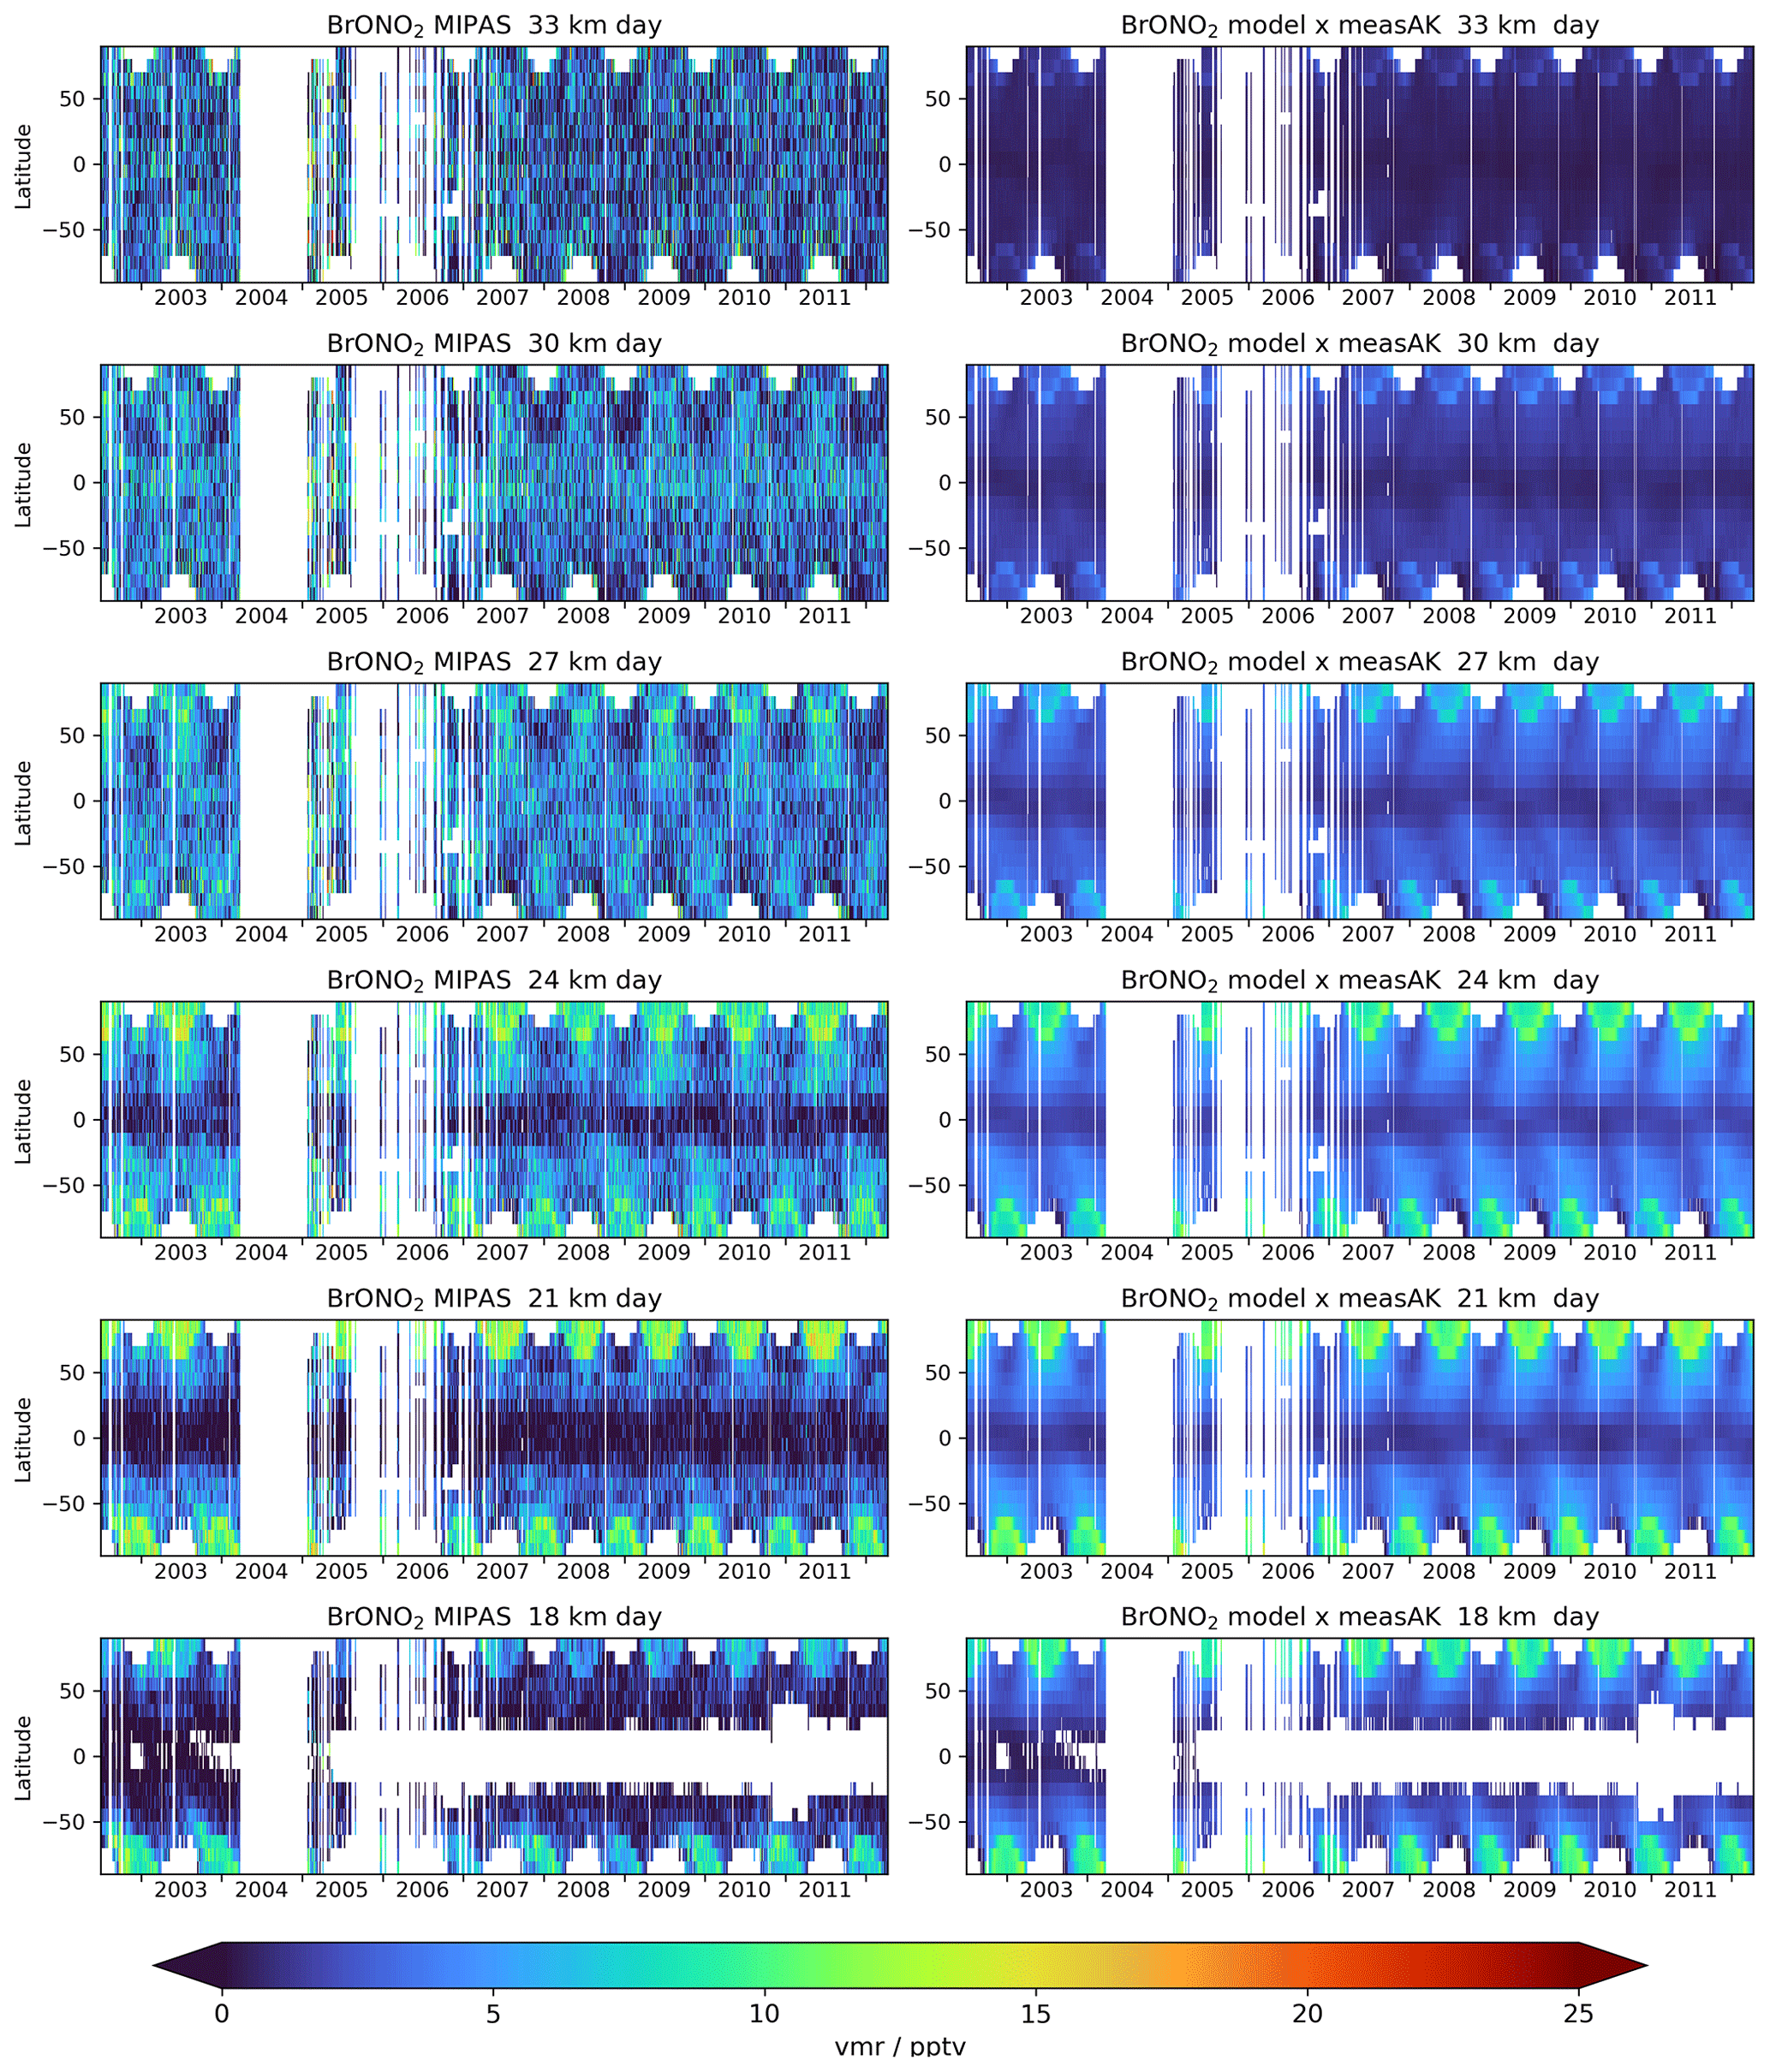
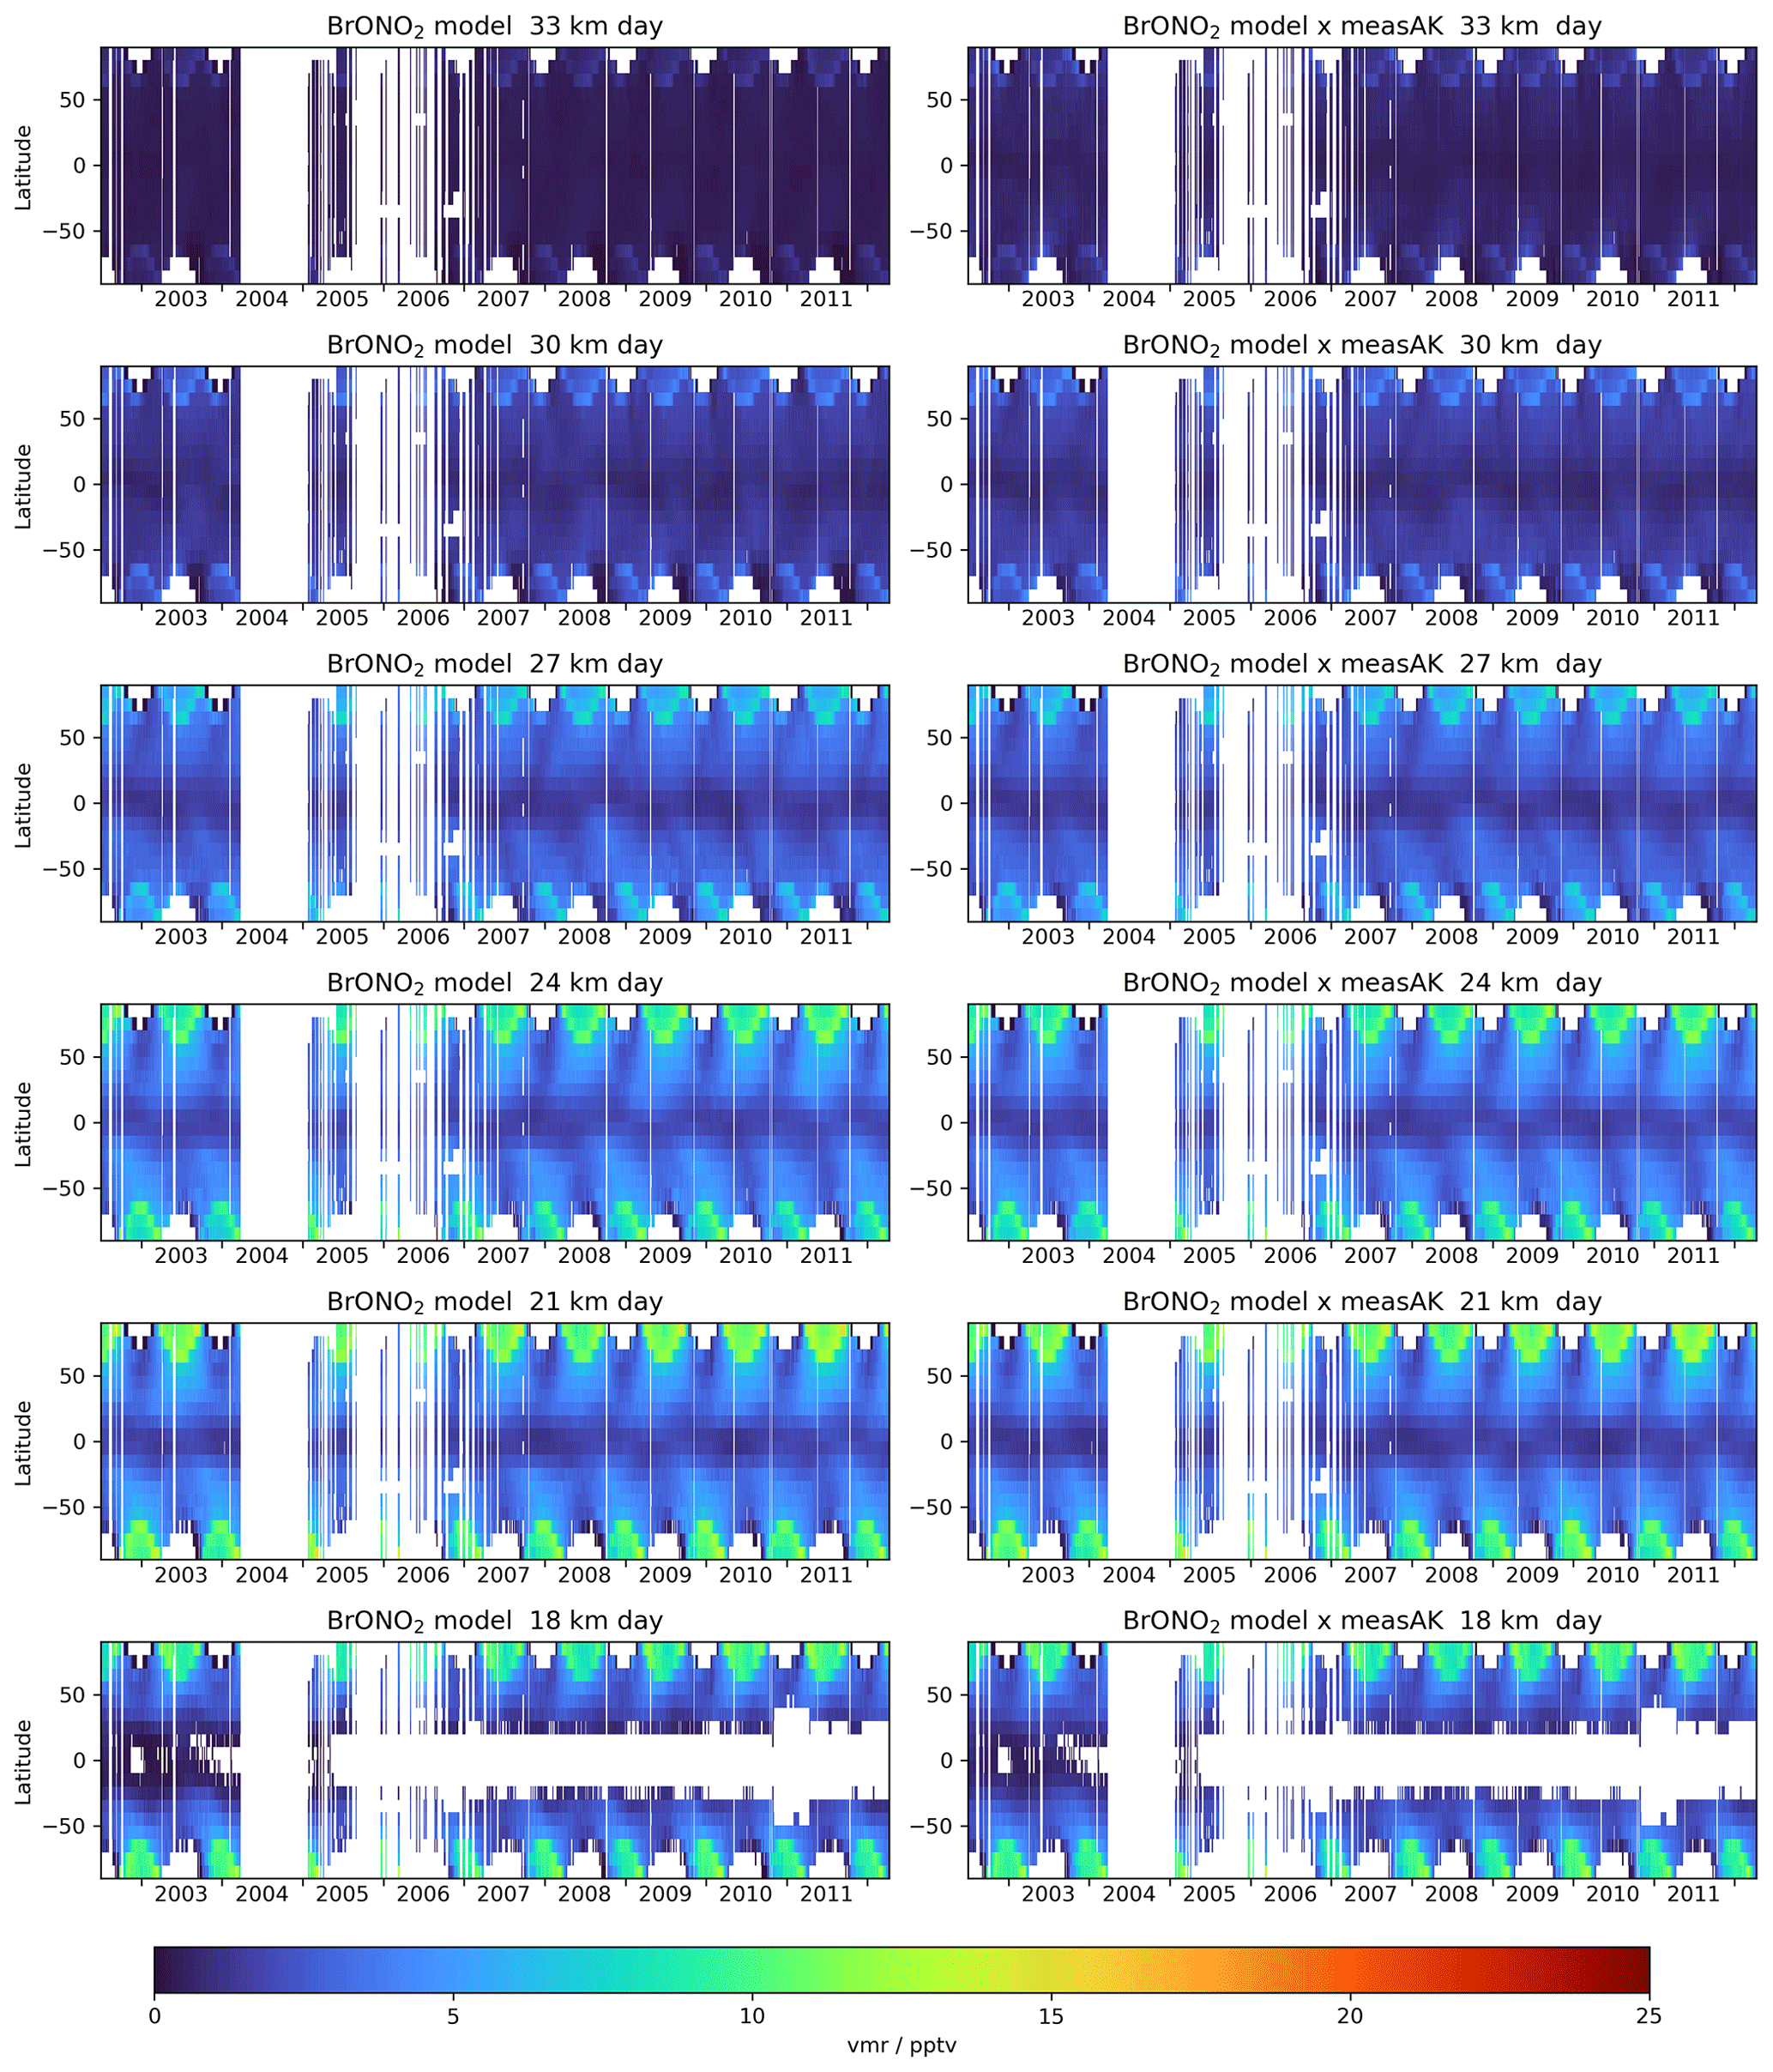
We provide overviews of the MIPAS BrONO2 volume mixing ratio datasets at full temporal resolution in the left-hand-side panels of Figs. 3 and 4 for observations during dark (night) and sunlit (day) conditions, respectively. White spaces indicate regions where no measurements are available, such as observations in the dark during high-latitude summer as well as sunlit measurements during winter. A measurement gap due to instrumental issues of MIPAS happened between April 2004 and January 2005, and in the subsequent years, observations were ramped up through to about 2007. From then on, quasi continuous coverage exists until April 2012. The coverage at lower altitudes is determined by the lower limit of 15 km, chosen to confine the retrievals primarily to the stratosphere, and by the presence of high-altitude clouds and the scan pattern of MIPAS (which is mainly a factor in the tropics). Some additional data gaps exist at high southern latitudes during winter, when thick polar stratospheric clouds (PSCs) obscured the observations.
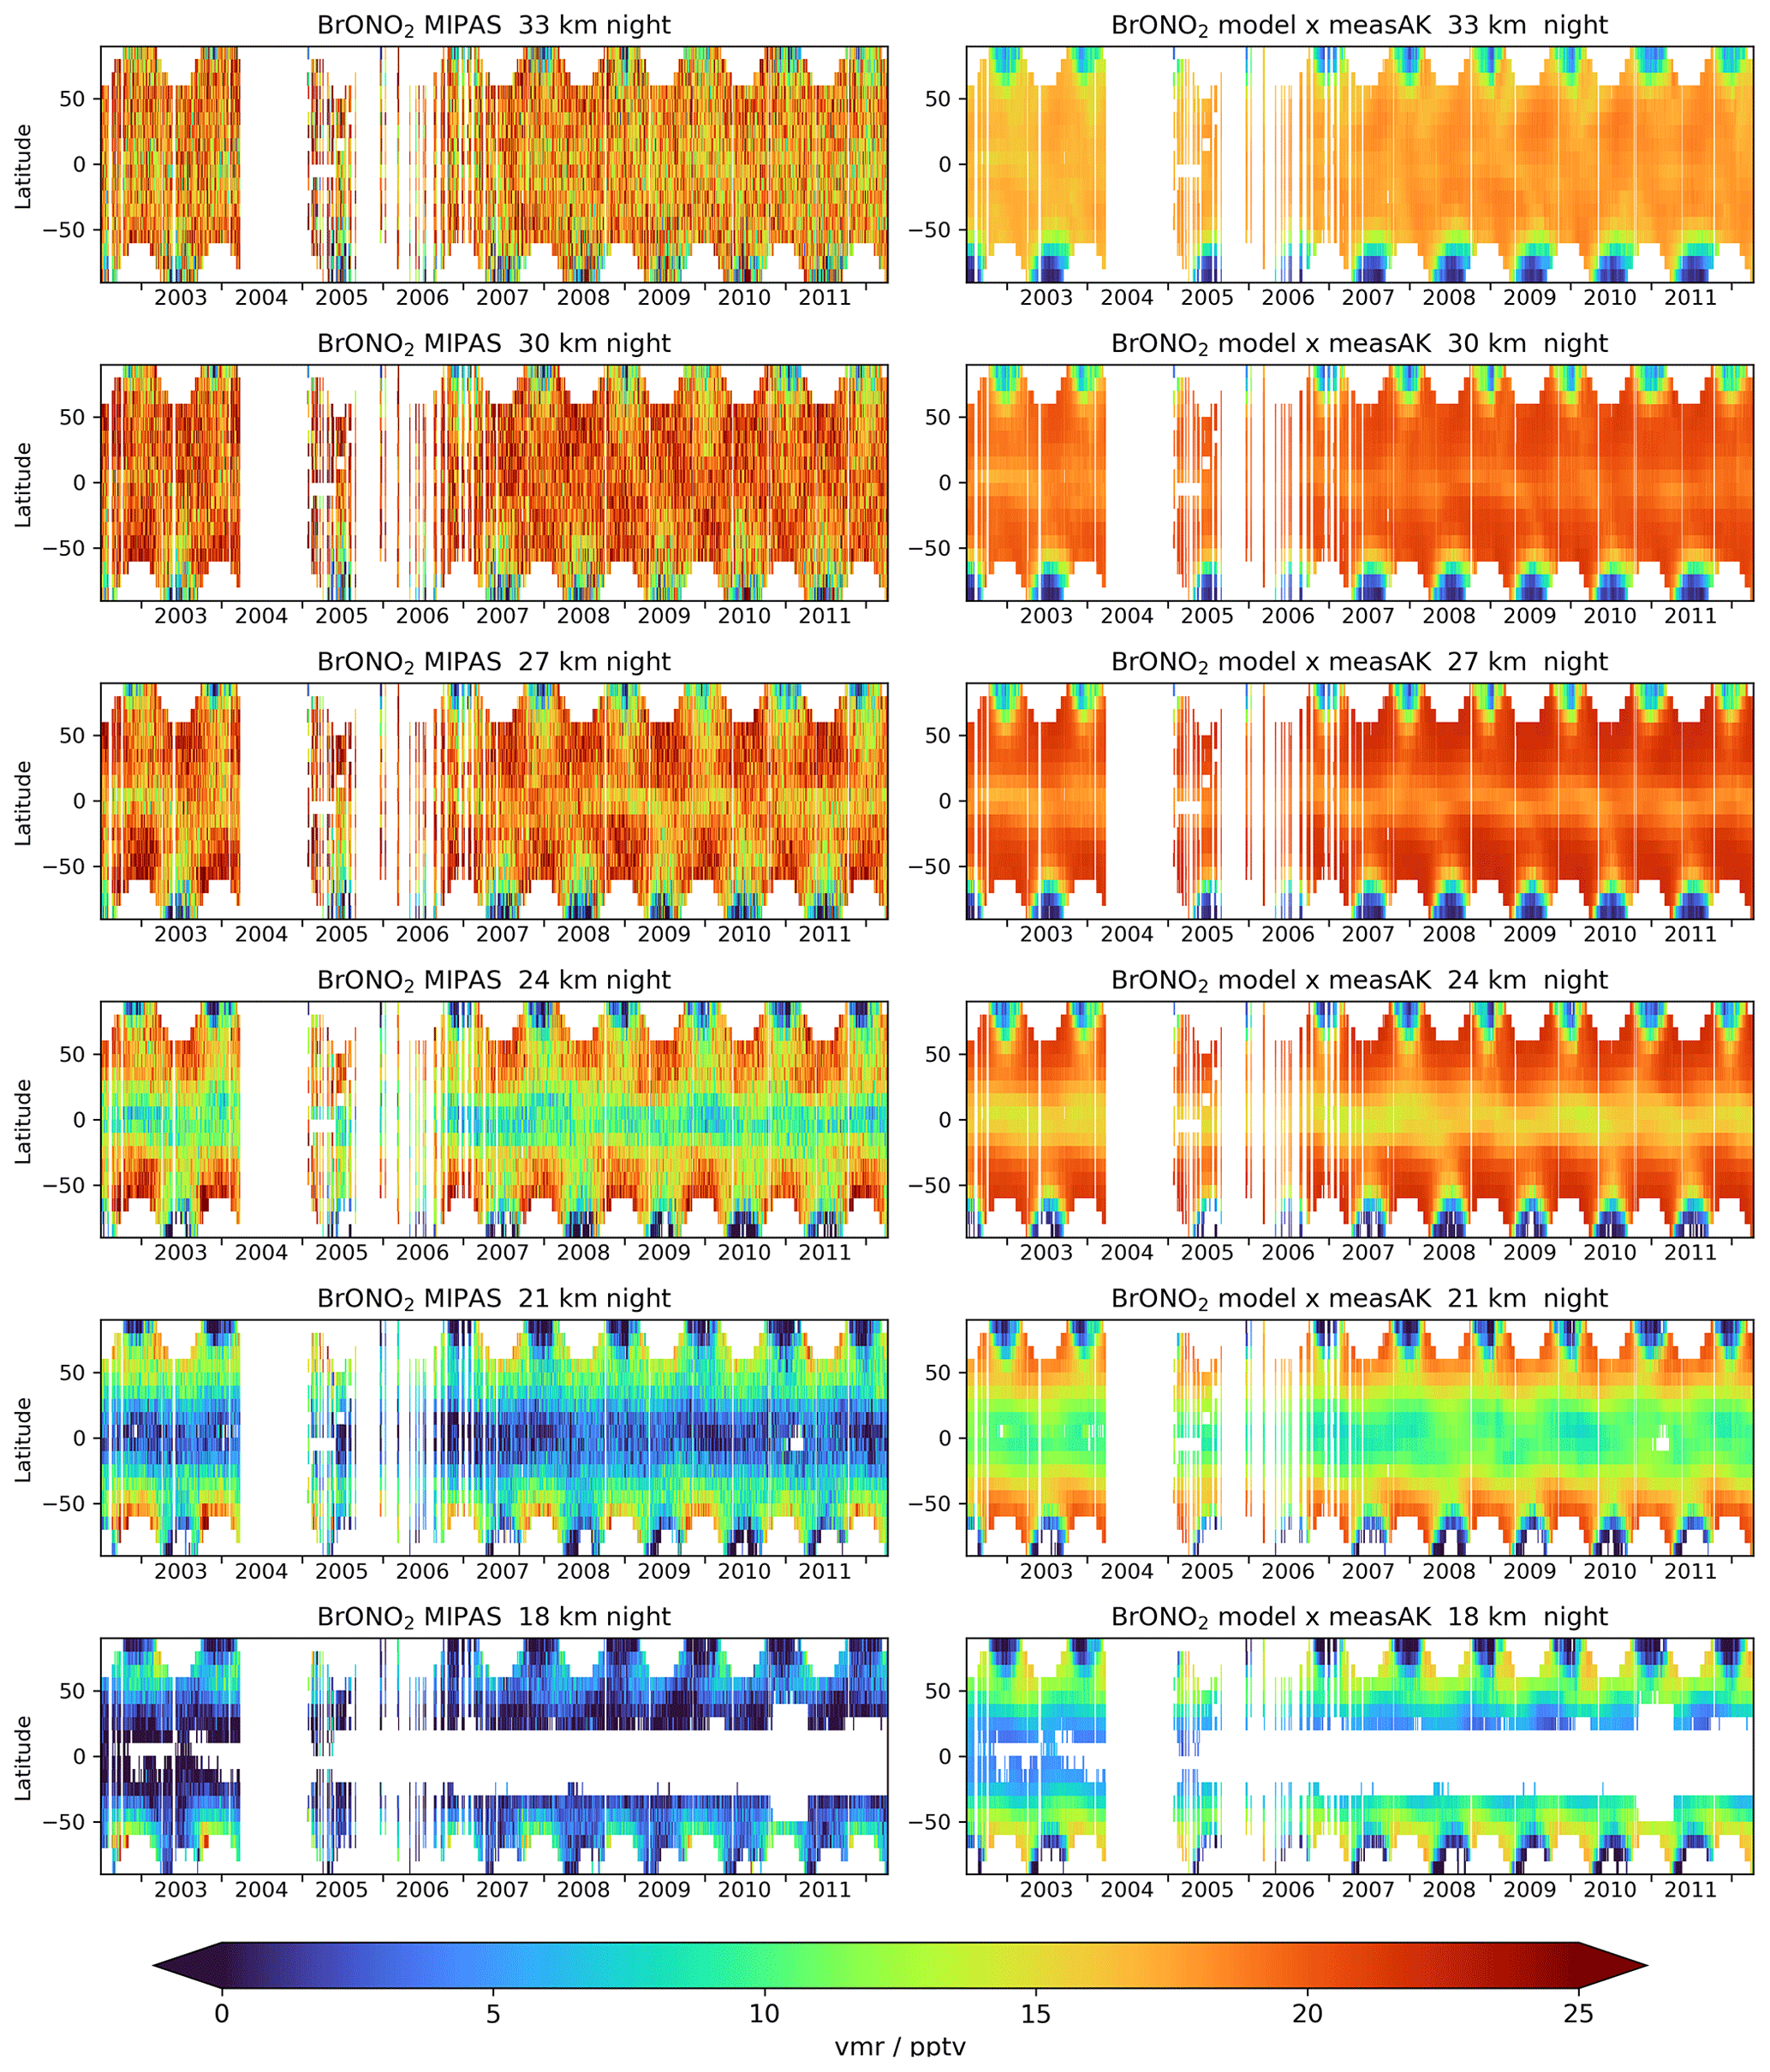
Figure 3 Horizontal cross sections (latitude versus time) of measured (left) and modelled (right) BrONO2 volume mixing ratios at selected altitudes over the whole time period of MIPAS observations during dark conditions. Retrieval averaging kernels have been applied to model data. White areas indicate the absence of measurements.
From Figs. 3 and 4, the major features of the stratospheric BrONO2 variability can be discerned in our measurements.
-
The diurnal variability (Fig. 3 versus Fig. 4) as a manifestation of the fast photolysis during the day (Reaction R2) versus the production (Reaction R1).
-
The annual recurrence of low values during night at high latitudes (Fig. 3) due to the lack of NOx as a supply for the production (Reaction R1) in combination with heterogeneous loss due to the presence of PSC particles (Reactions R4 and R5).
-
The annual maxima of BrONO2 volume mixing ratios at high and mid latitudes during day- and night-time observations in summer caused by the annual variability of NO2.
-
The lack of a similarly clear seasonal variability at tropical latitudes.
We have reduced the dataset to annual views by averaging over the whole MIPAS observational period in order to provide a clearer picture of intra-annual variabilities. The related horizontal and vertical cross sections are presented in Figs. 5–8. During dark conditions, maximum mean mixing ratios of around 22 pptv are reached mainly at mid latitudes at altitudes of 25–30 km during the summer months, while in winter only about 18 pptv is observed. During sunlit conditions, the largest BrONO2 mixing ratios of up to about 11 pptv appear at high latitudes at 20–25 km altitude during summer. Negative retrieved mean mixing ratios in the sub-tropics and tropics below about 18–22 km altitude are discussed more in detail below.
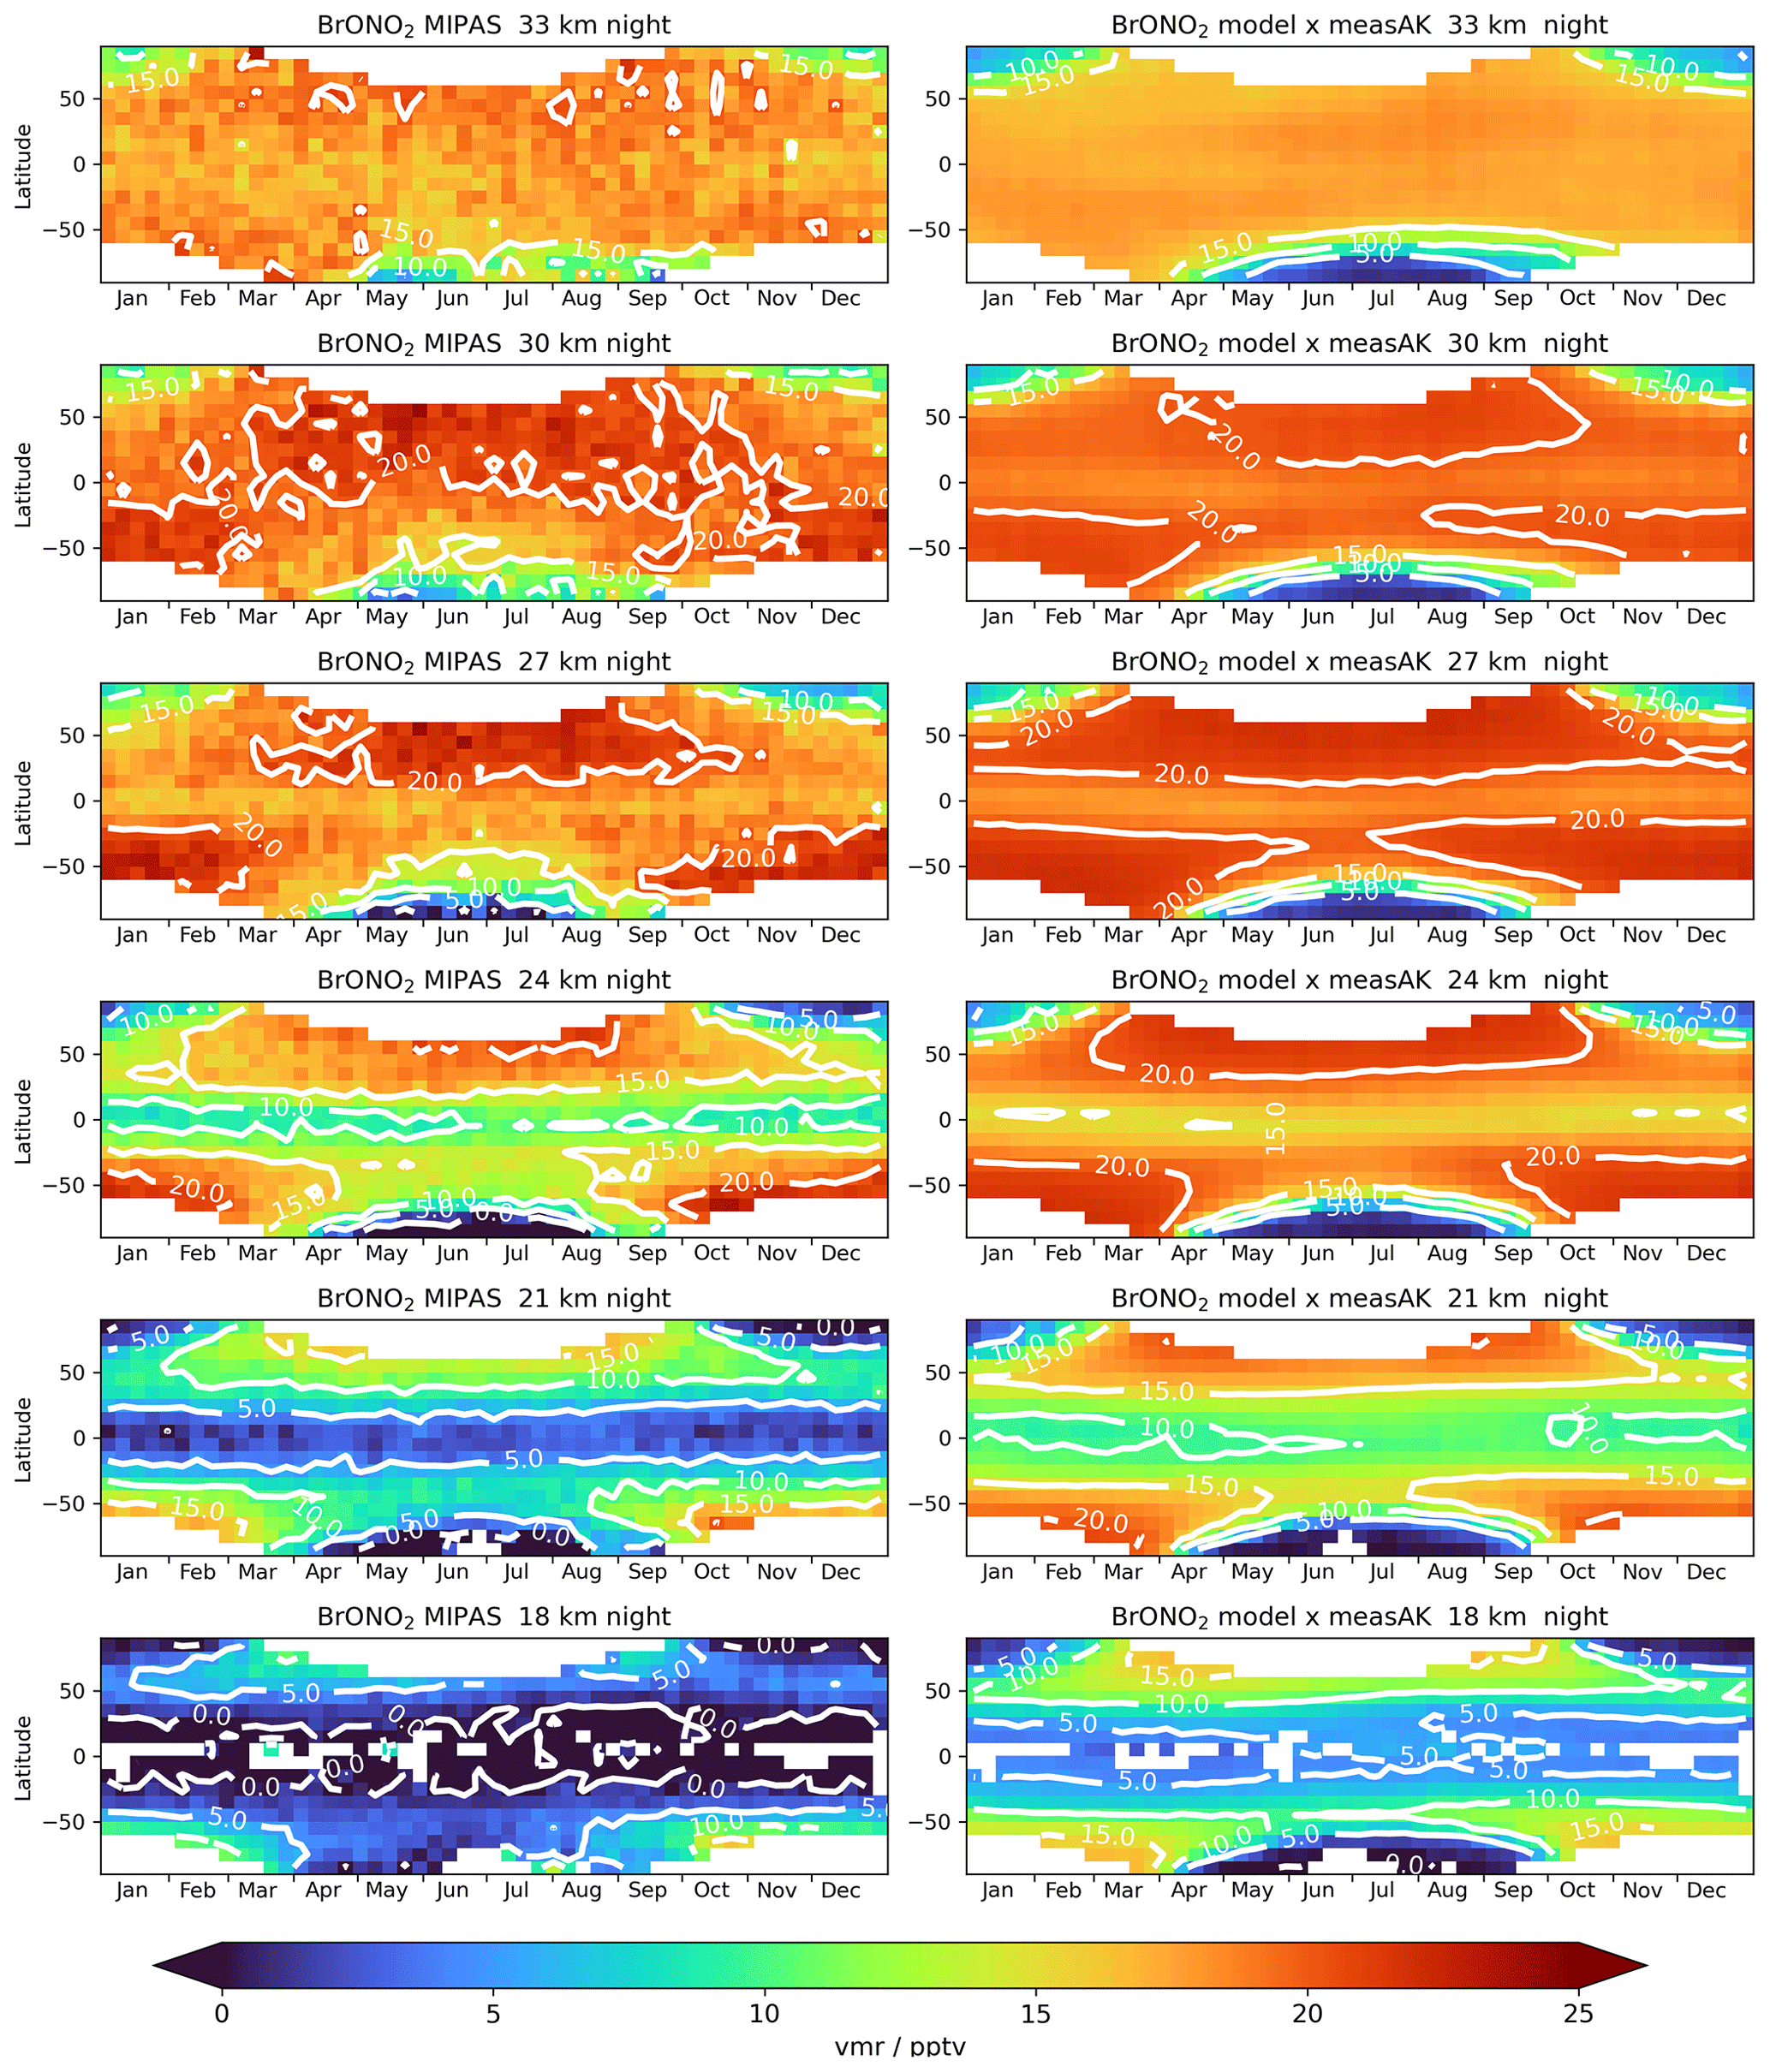
Figure 5 Horizontal cross sections (latitude versus time) of the annual development of measured (left) and modelled (right, with averaging kernels applied) BrONO2 volume mixing ratios during dark conditions at selected altitudes calculated as average values over the whole MIPAS dataset in weekly bins (see Fig. 3).
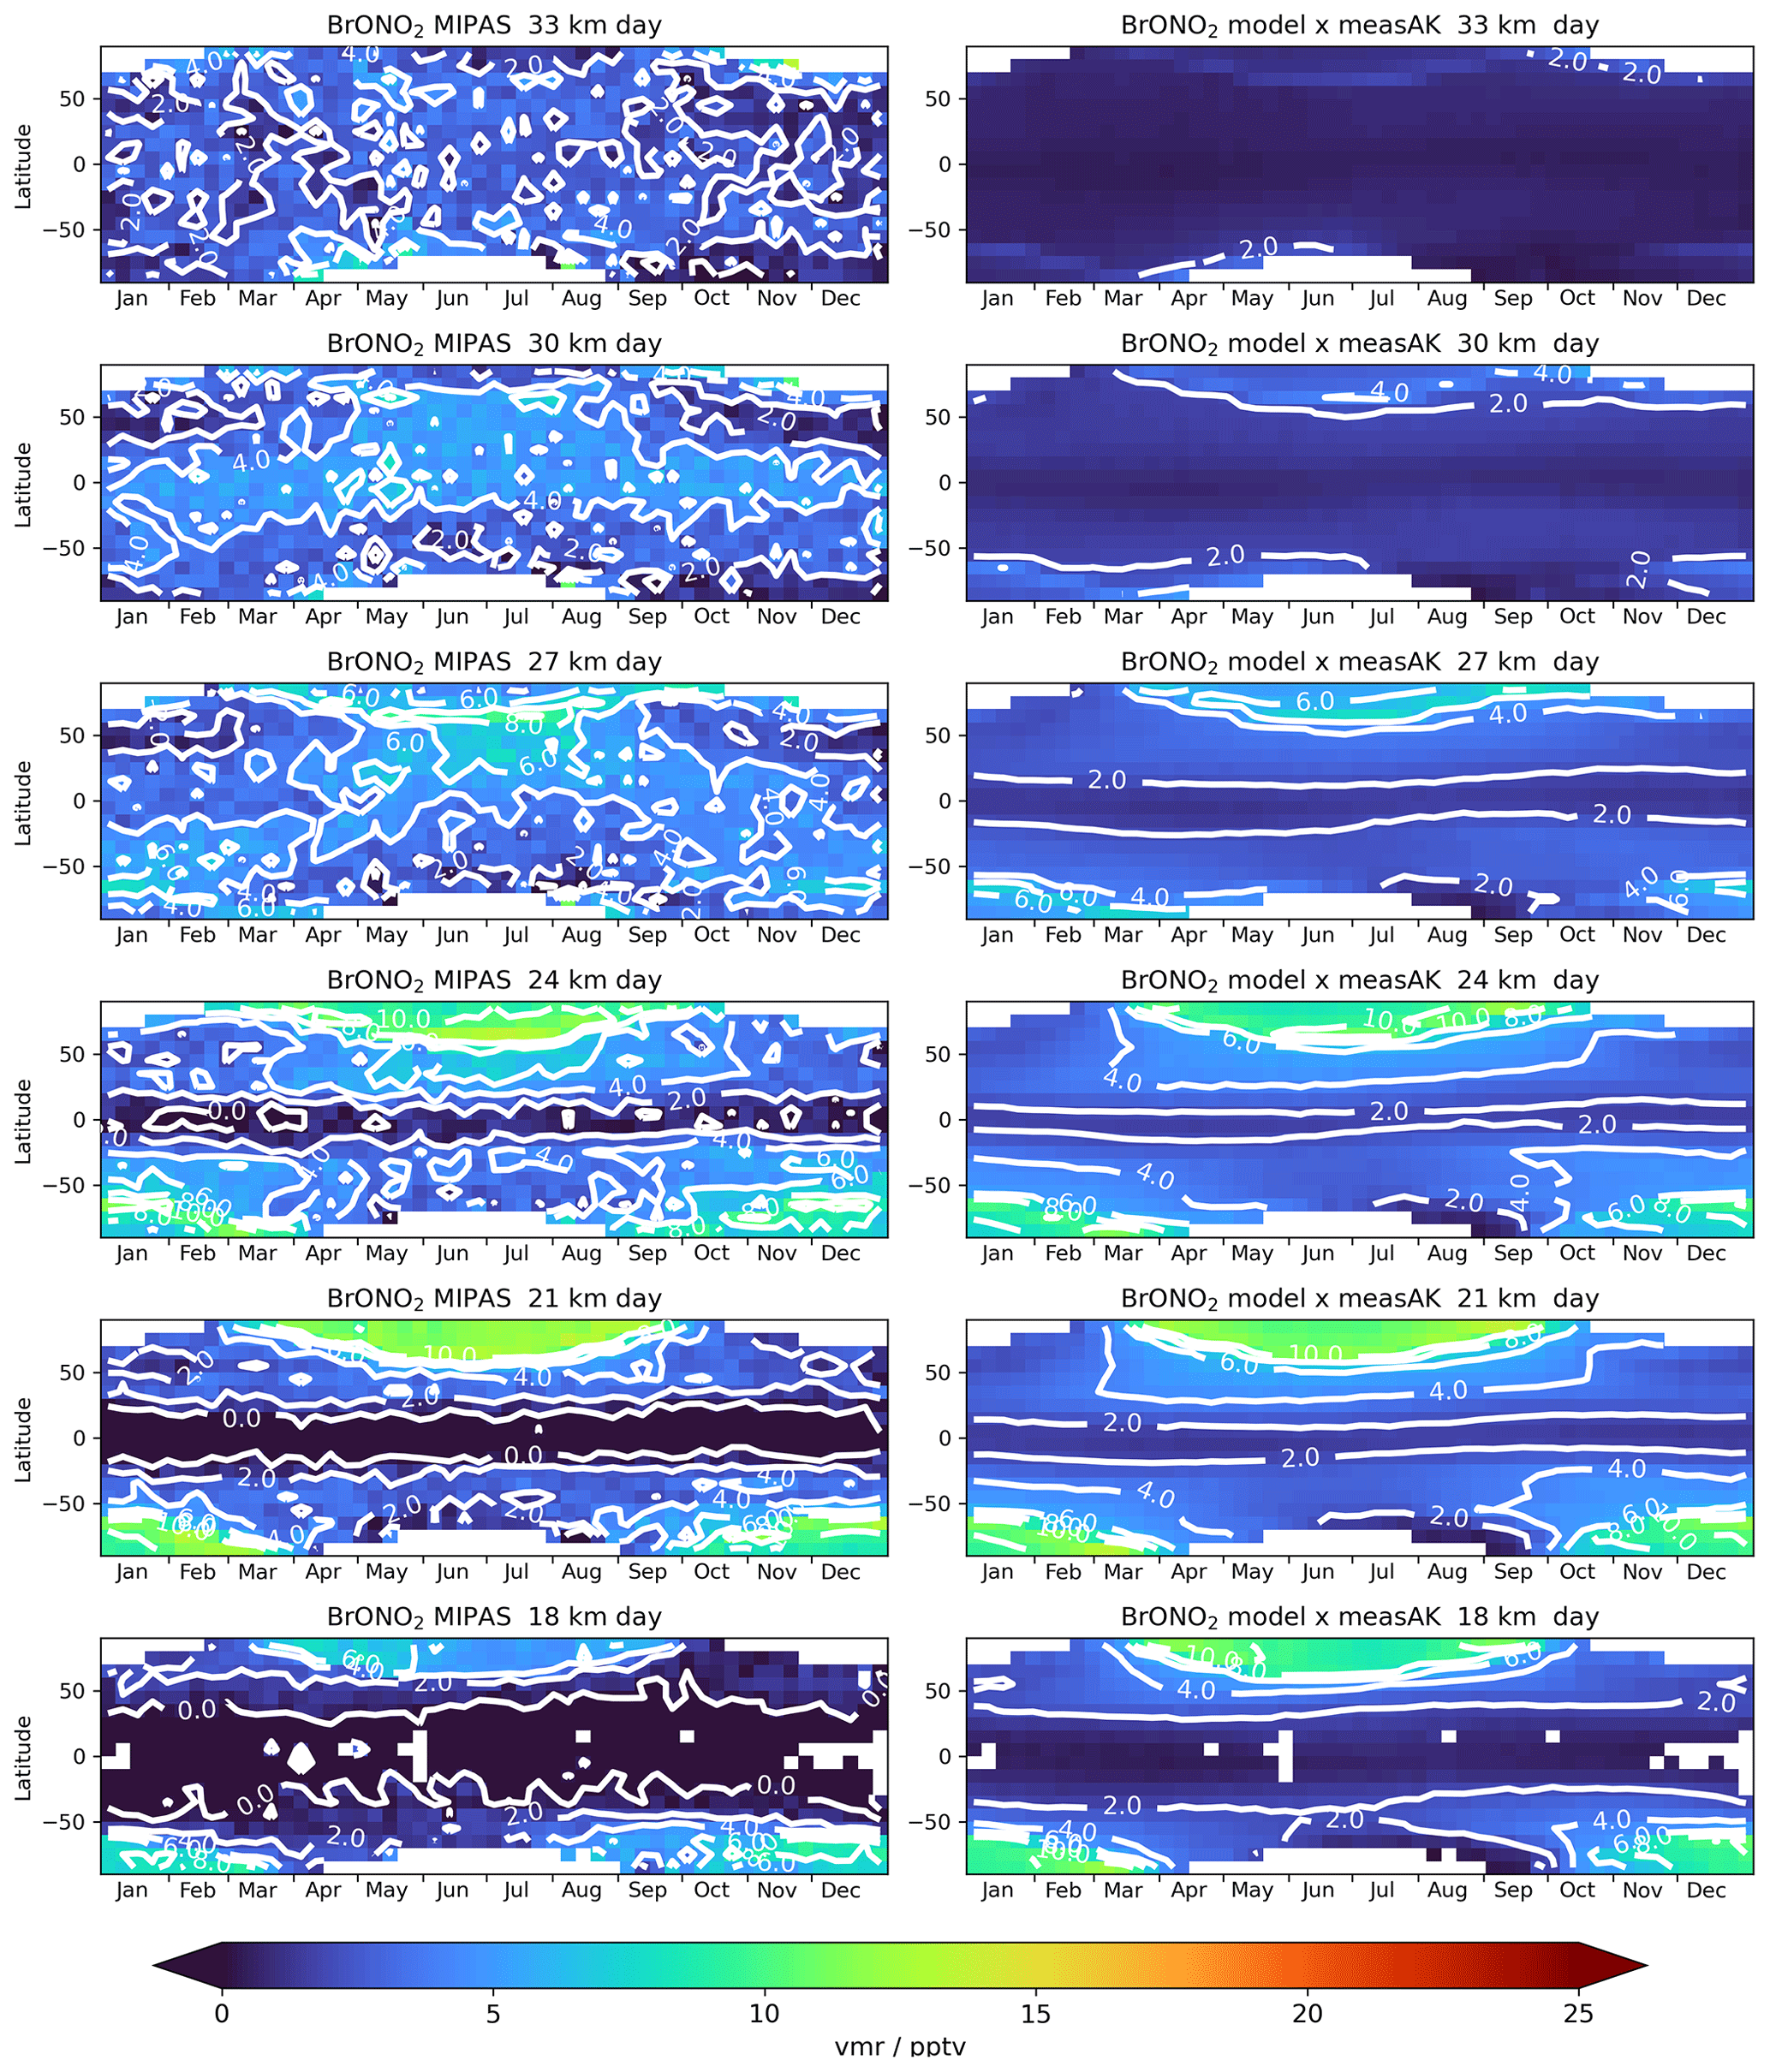
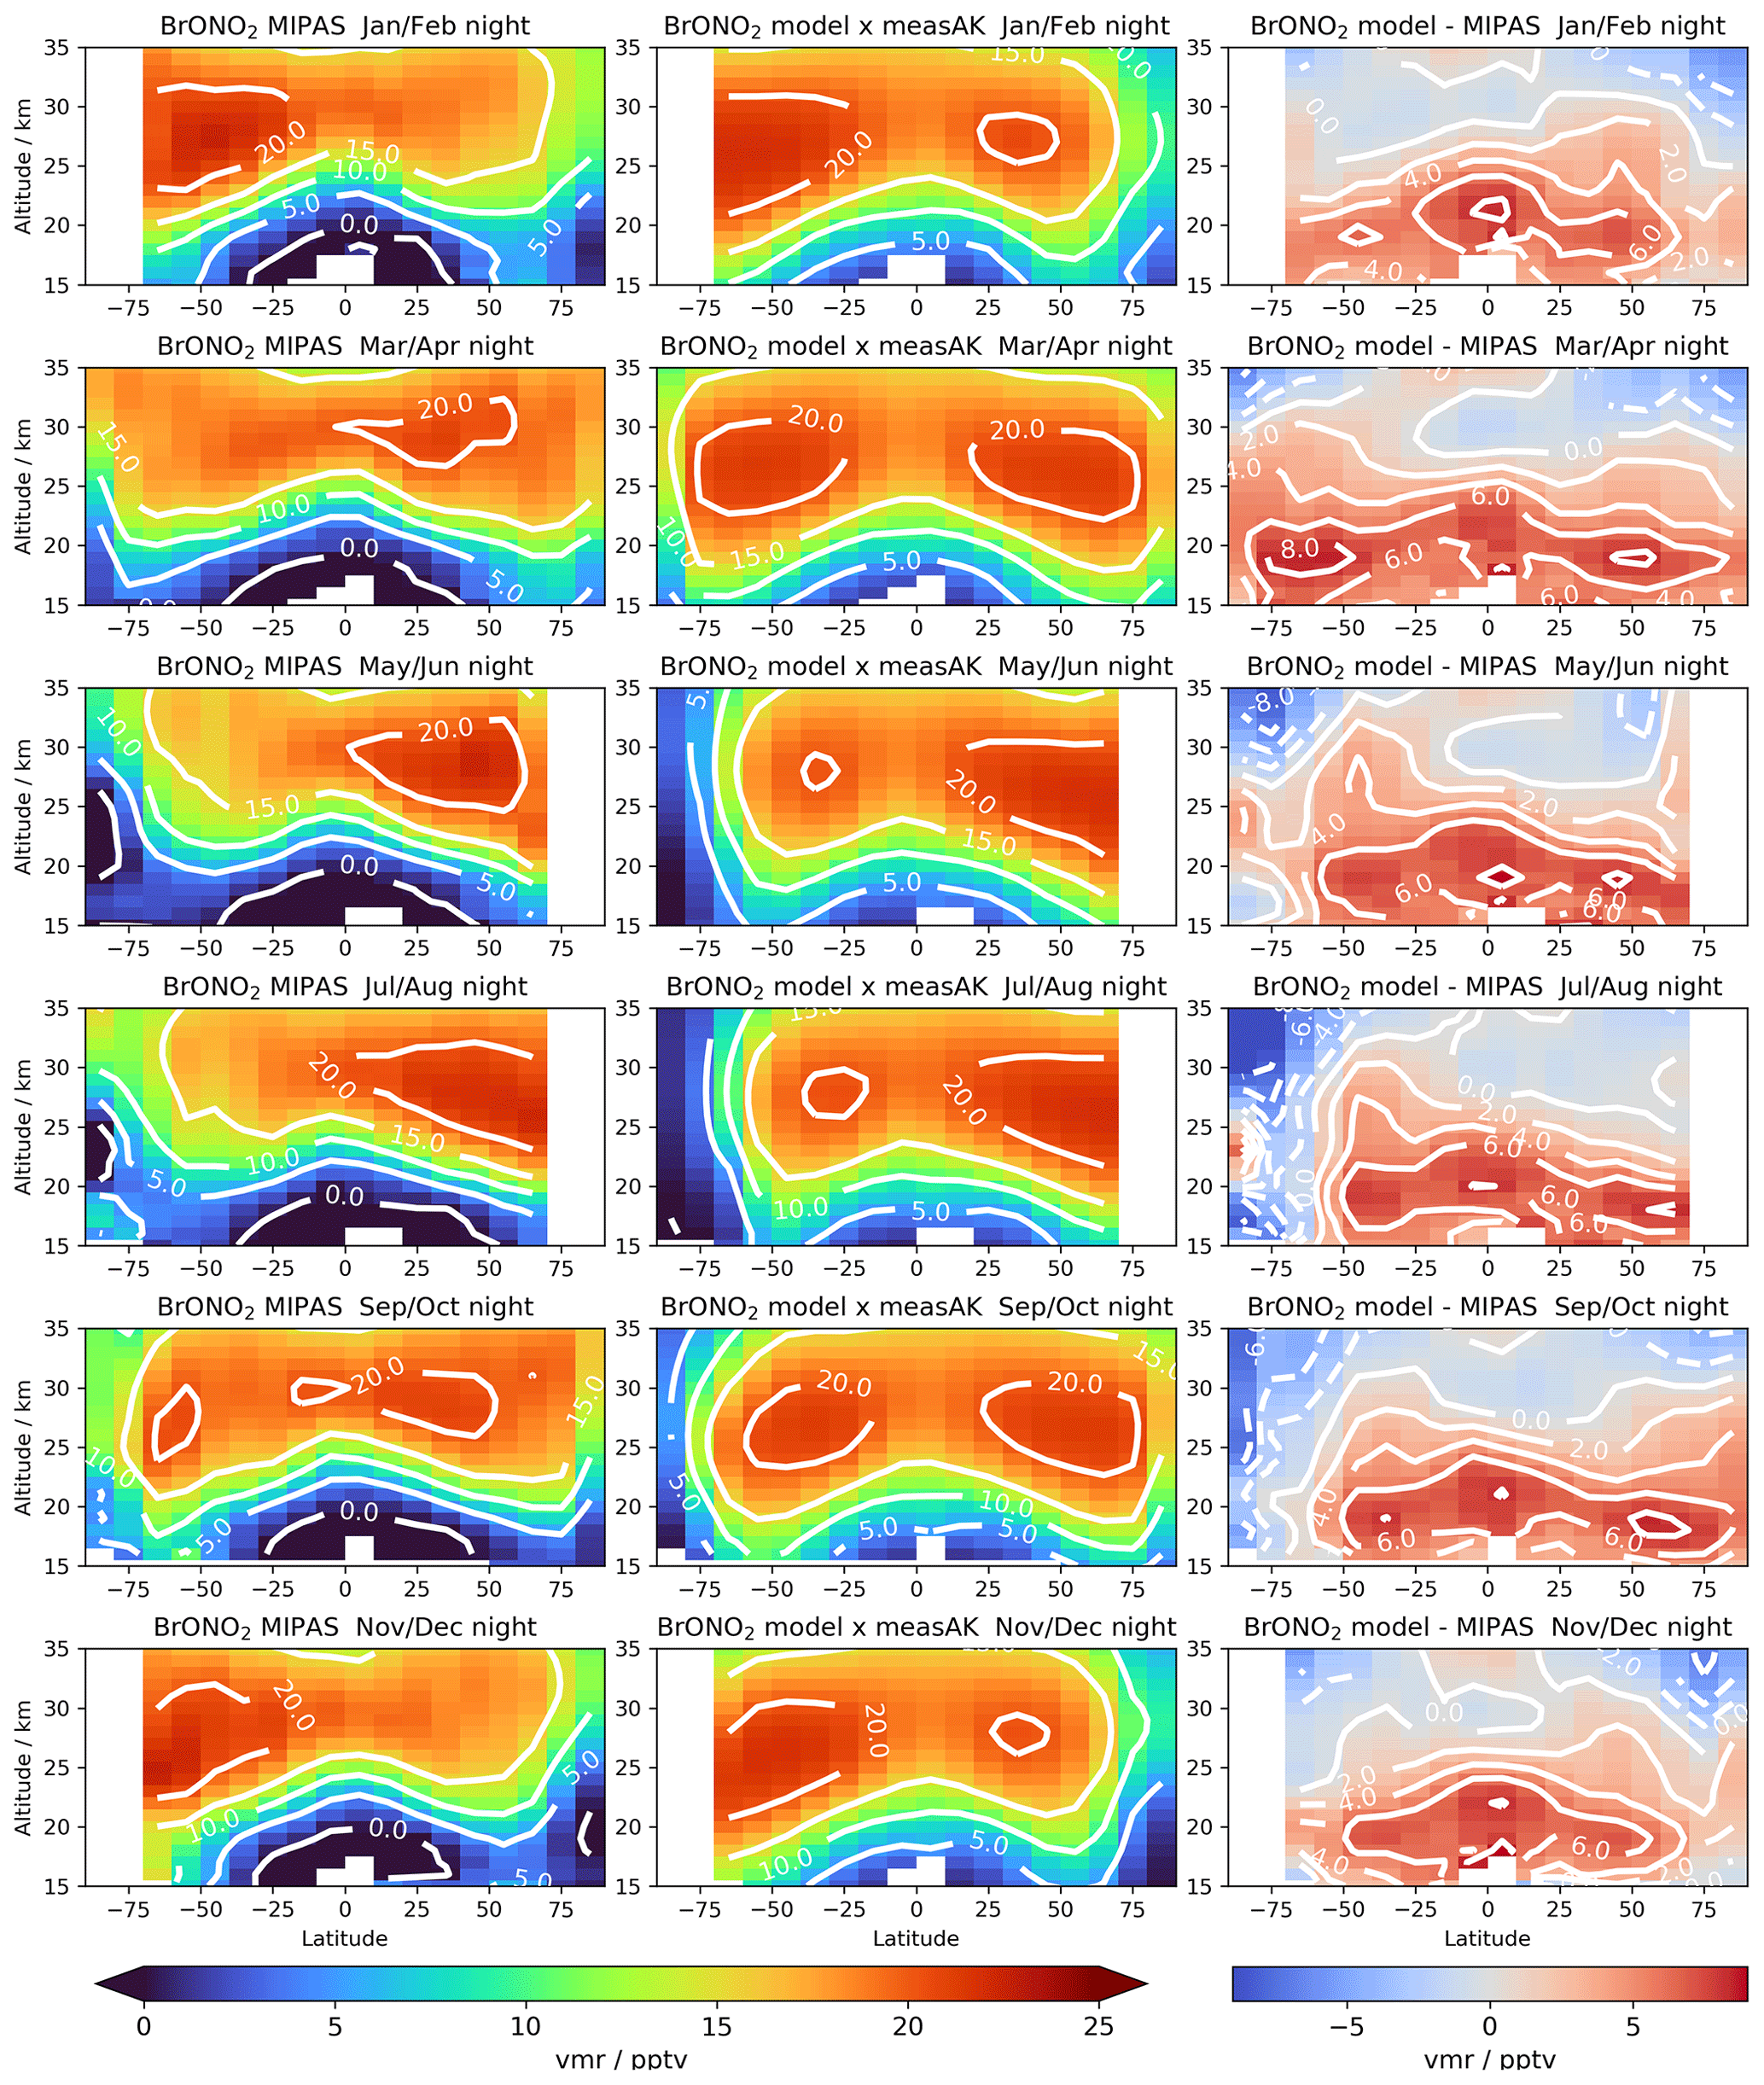
Figure 7 Bimonthly averaged cross sections (altitude versus latitude) of BrONO2 volume mixing ratios for dark conditions. Left: measurements, middle: model with retrieval averaging kernels applied, right: model minus MIPAS.
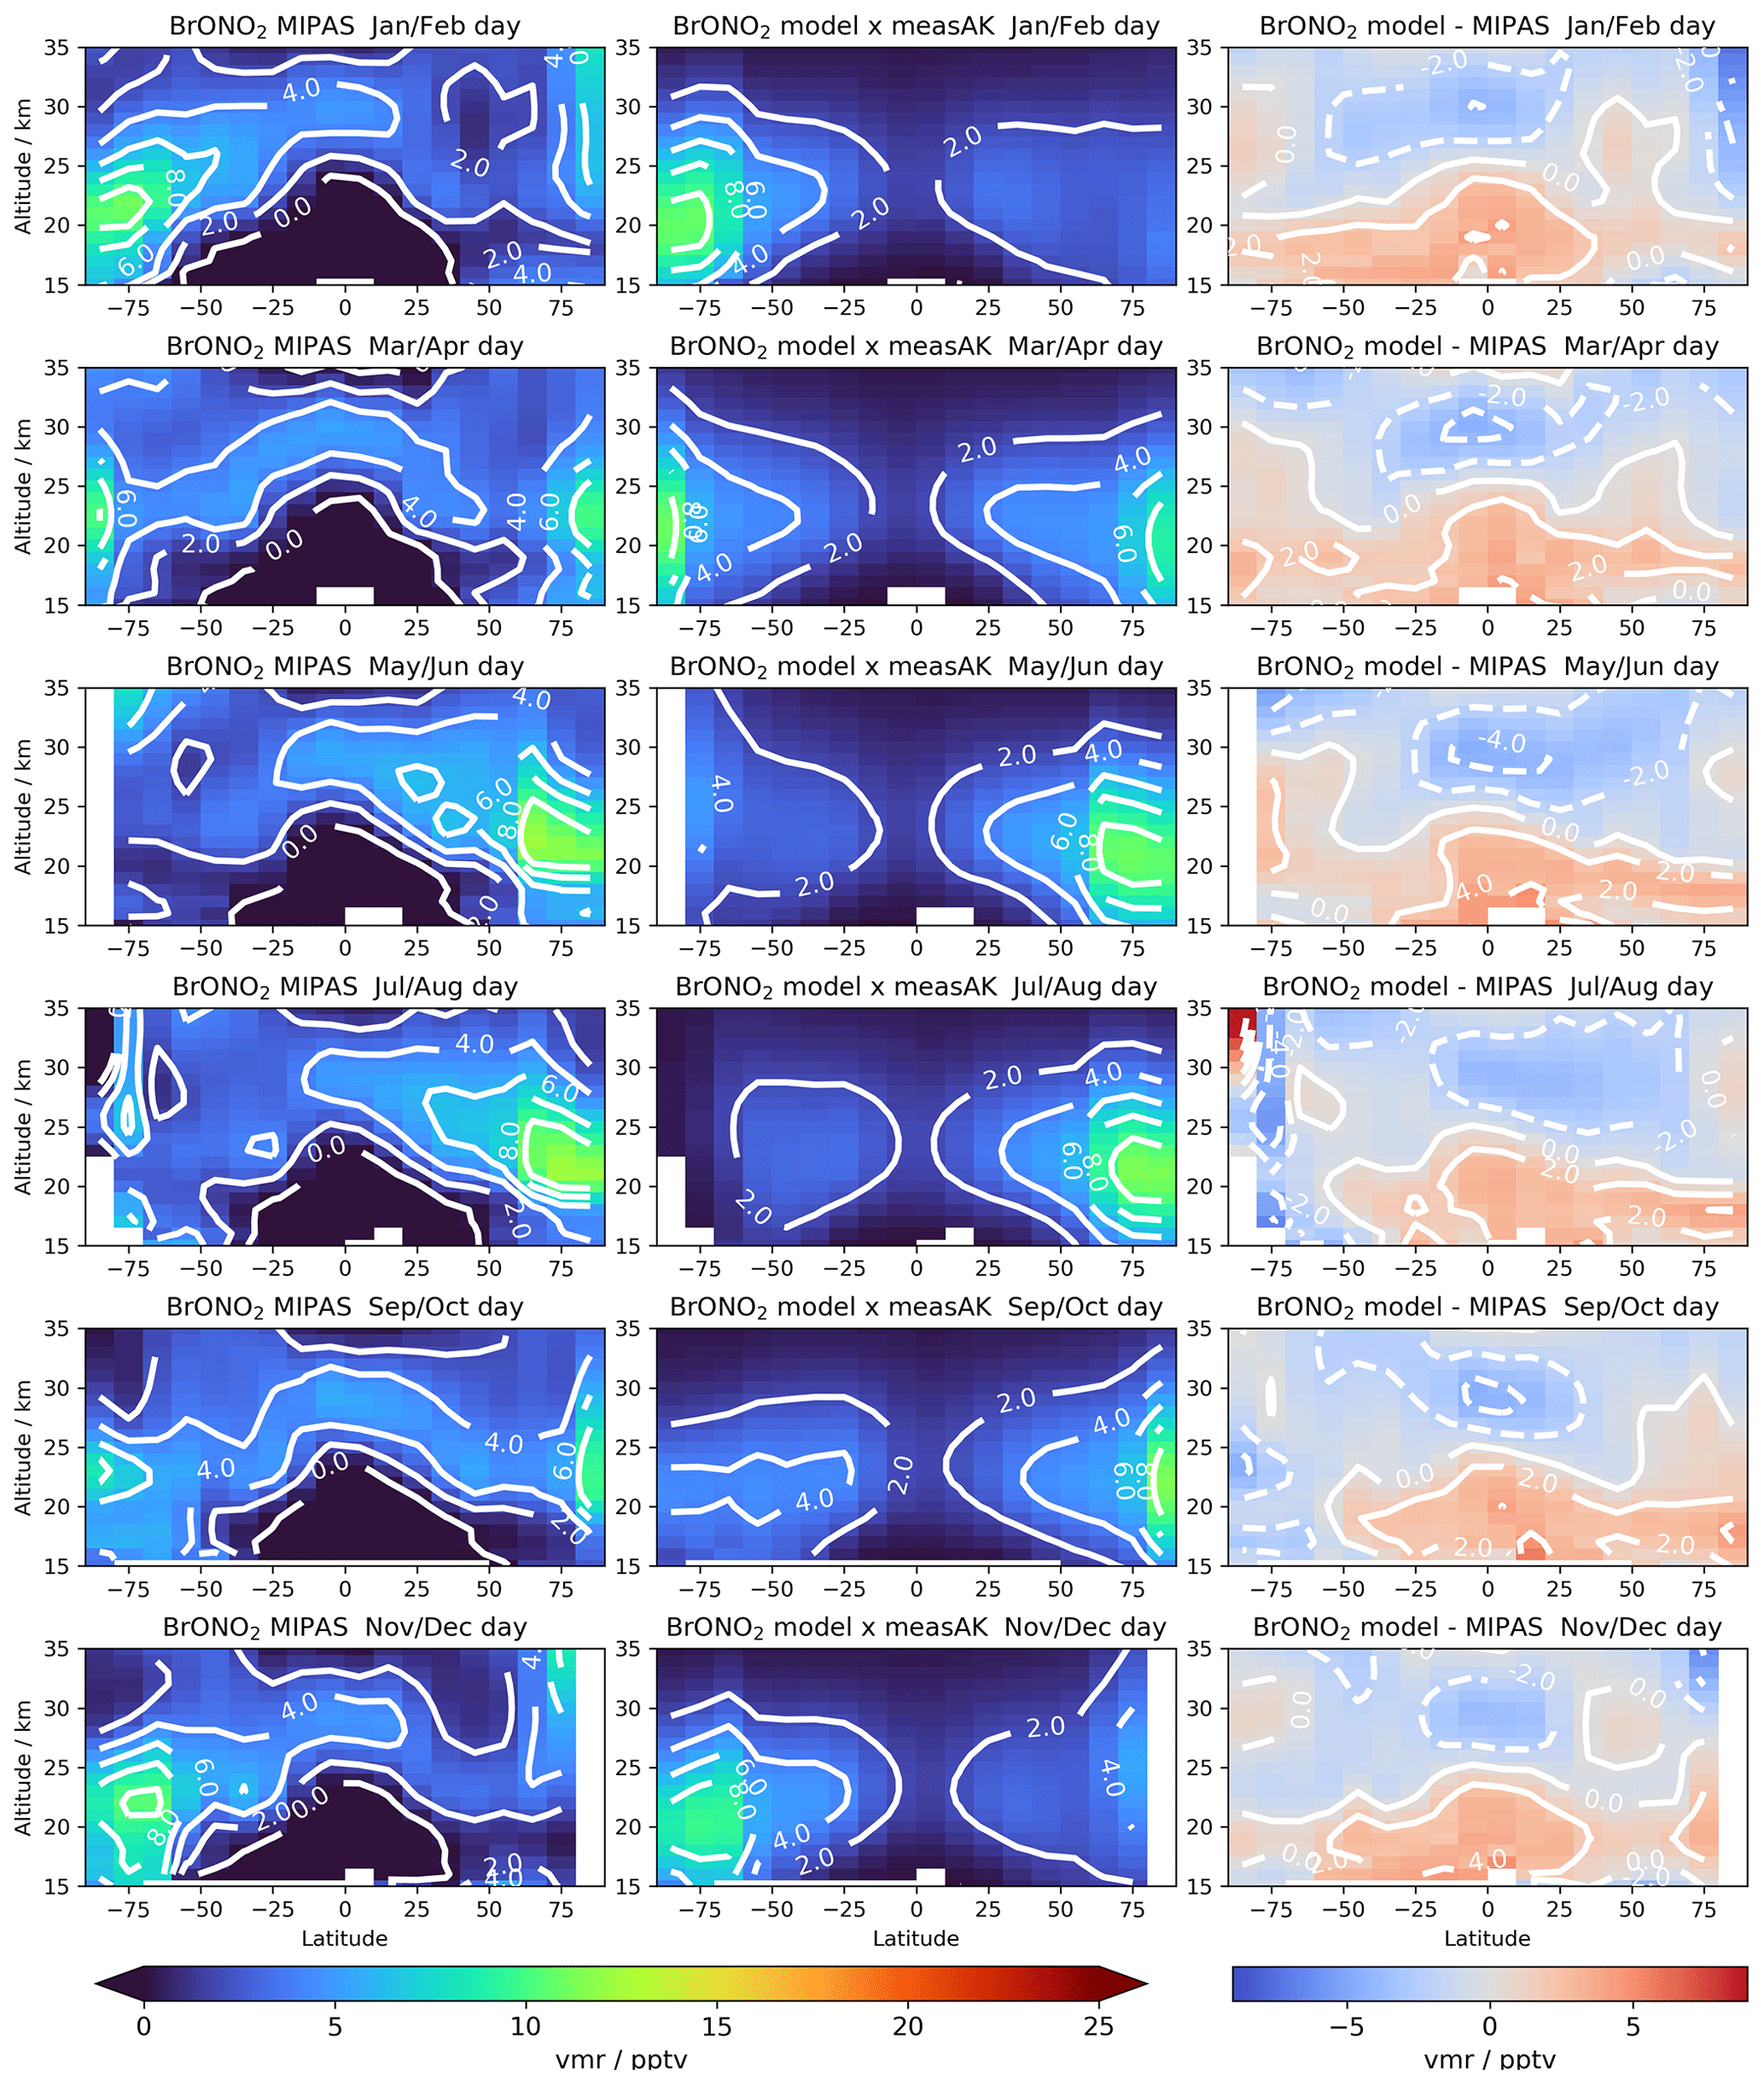
3.2 Measurement–model comparisons
The results of the EMAC model run are presented in the second column in each of Figs. 3–8. To take into account the limited vertical resolution of the measurements for these comparisons, we have applied the averaging kernel matrix of each retrieved profile of BrONO2 (see Sect. 2.1) to the related modelled profile. Differences between model results with and without averaging kernel application are generally below 1 pptv, with only sporadic exceptions at the highest altitudes near polar latitudes, where differences reach up to 3–4 pptv (Figs. A1 and A2).
From comparing measured and modelled distributions of BrONO2 volume mixing ratios in Figs. 3–8, it is evident that the model reproduces all major modes of variability which are present in the observations as described in the previous section. Despite this agreement, there are a few areas where systematic deviations are prominent.
The most obvious differences appear (1) at higher altitudes during polar winter, (2) in the lower stratosphere mainly at mid and low latitudes during the entire year as well as (3) at altitudes around 30 km in the tropics during sunlit conditions. We discuss these differences one by one below.
3.2.1 Low modelled polar winter BrONO2
One disagreement between modelled BrONO2 and MIPAS observations can best be observed in Figs. 5 and 7: at altitudes of around 30 km and above for latitudes south of 70∘ S, the model predicts values smaller than 5 pptv from May until September. The corresponding measurements, however, reach values of 10 to 15 pptv. While not as pronounced, this feature is also visible in the Arctic wintertime stratosphere, with model estimates of 5–10 pptv and measurements of 10–15 pptv. We explain these low model values of BrONO2 by an underestimation of NO2 as visible in Fig. B1. In this figure, the MIPAS NO2 distributions are compared to the EMAC model results of NO2. The missing NO2 in the simulations is due to an insufficient supply of NOx through downward propagation from the upper mesosphere and lower thermosphere. This stratospheric enhancement of NOx through production by energetic particle precipitation and downwelling during polar winter has been investigated e.g. on the basis of MIPAS observations by Funke et al. (2005, 2014).
3.2.2 High modelled night-time BrONO2 at lower altitudes
As visible e.g. in Figs. 5 and 7, the model overestimates BrONO2 volume mixing ratios with respect to the MIPAS results by up to 8 pptv in the lower stratosphere at altitudes up to about 25 km during the night. Such differences are also present during the day, albeit to a smaller absolute extent (up to about 4 pptv; see Fig. 8). Relative differences between measurements and model results during the day and night are more similar, reaching e.g. 50 % at around 20 km at mid latitudes and 22–25 km in the tropics. Below, the day-time relative differences become much larger due to the very small mixing ratios of BrONO2 and are difficult to compare.
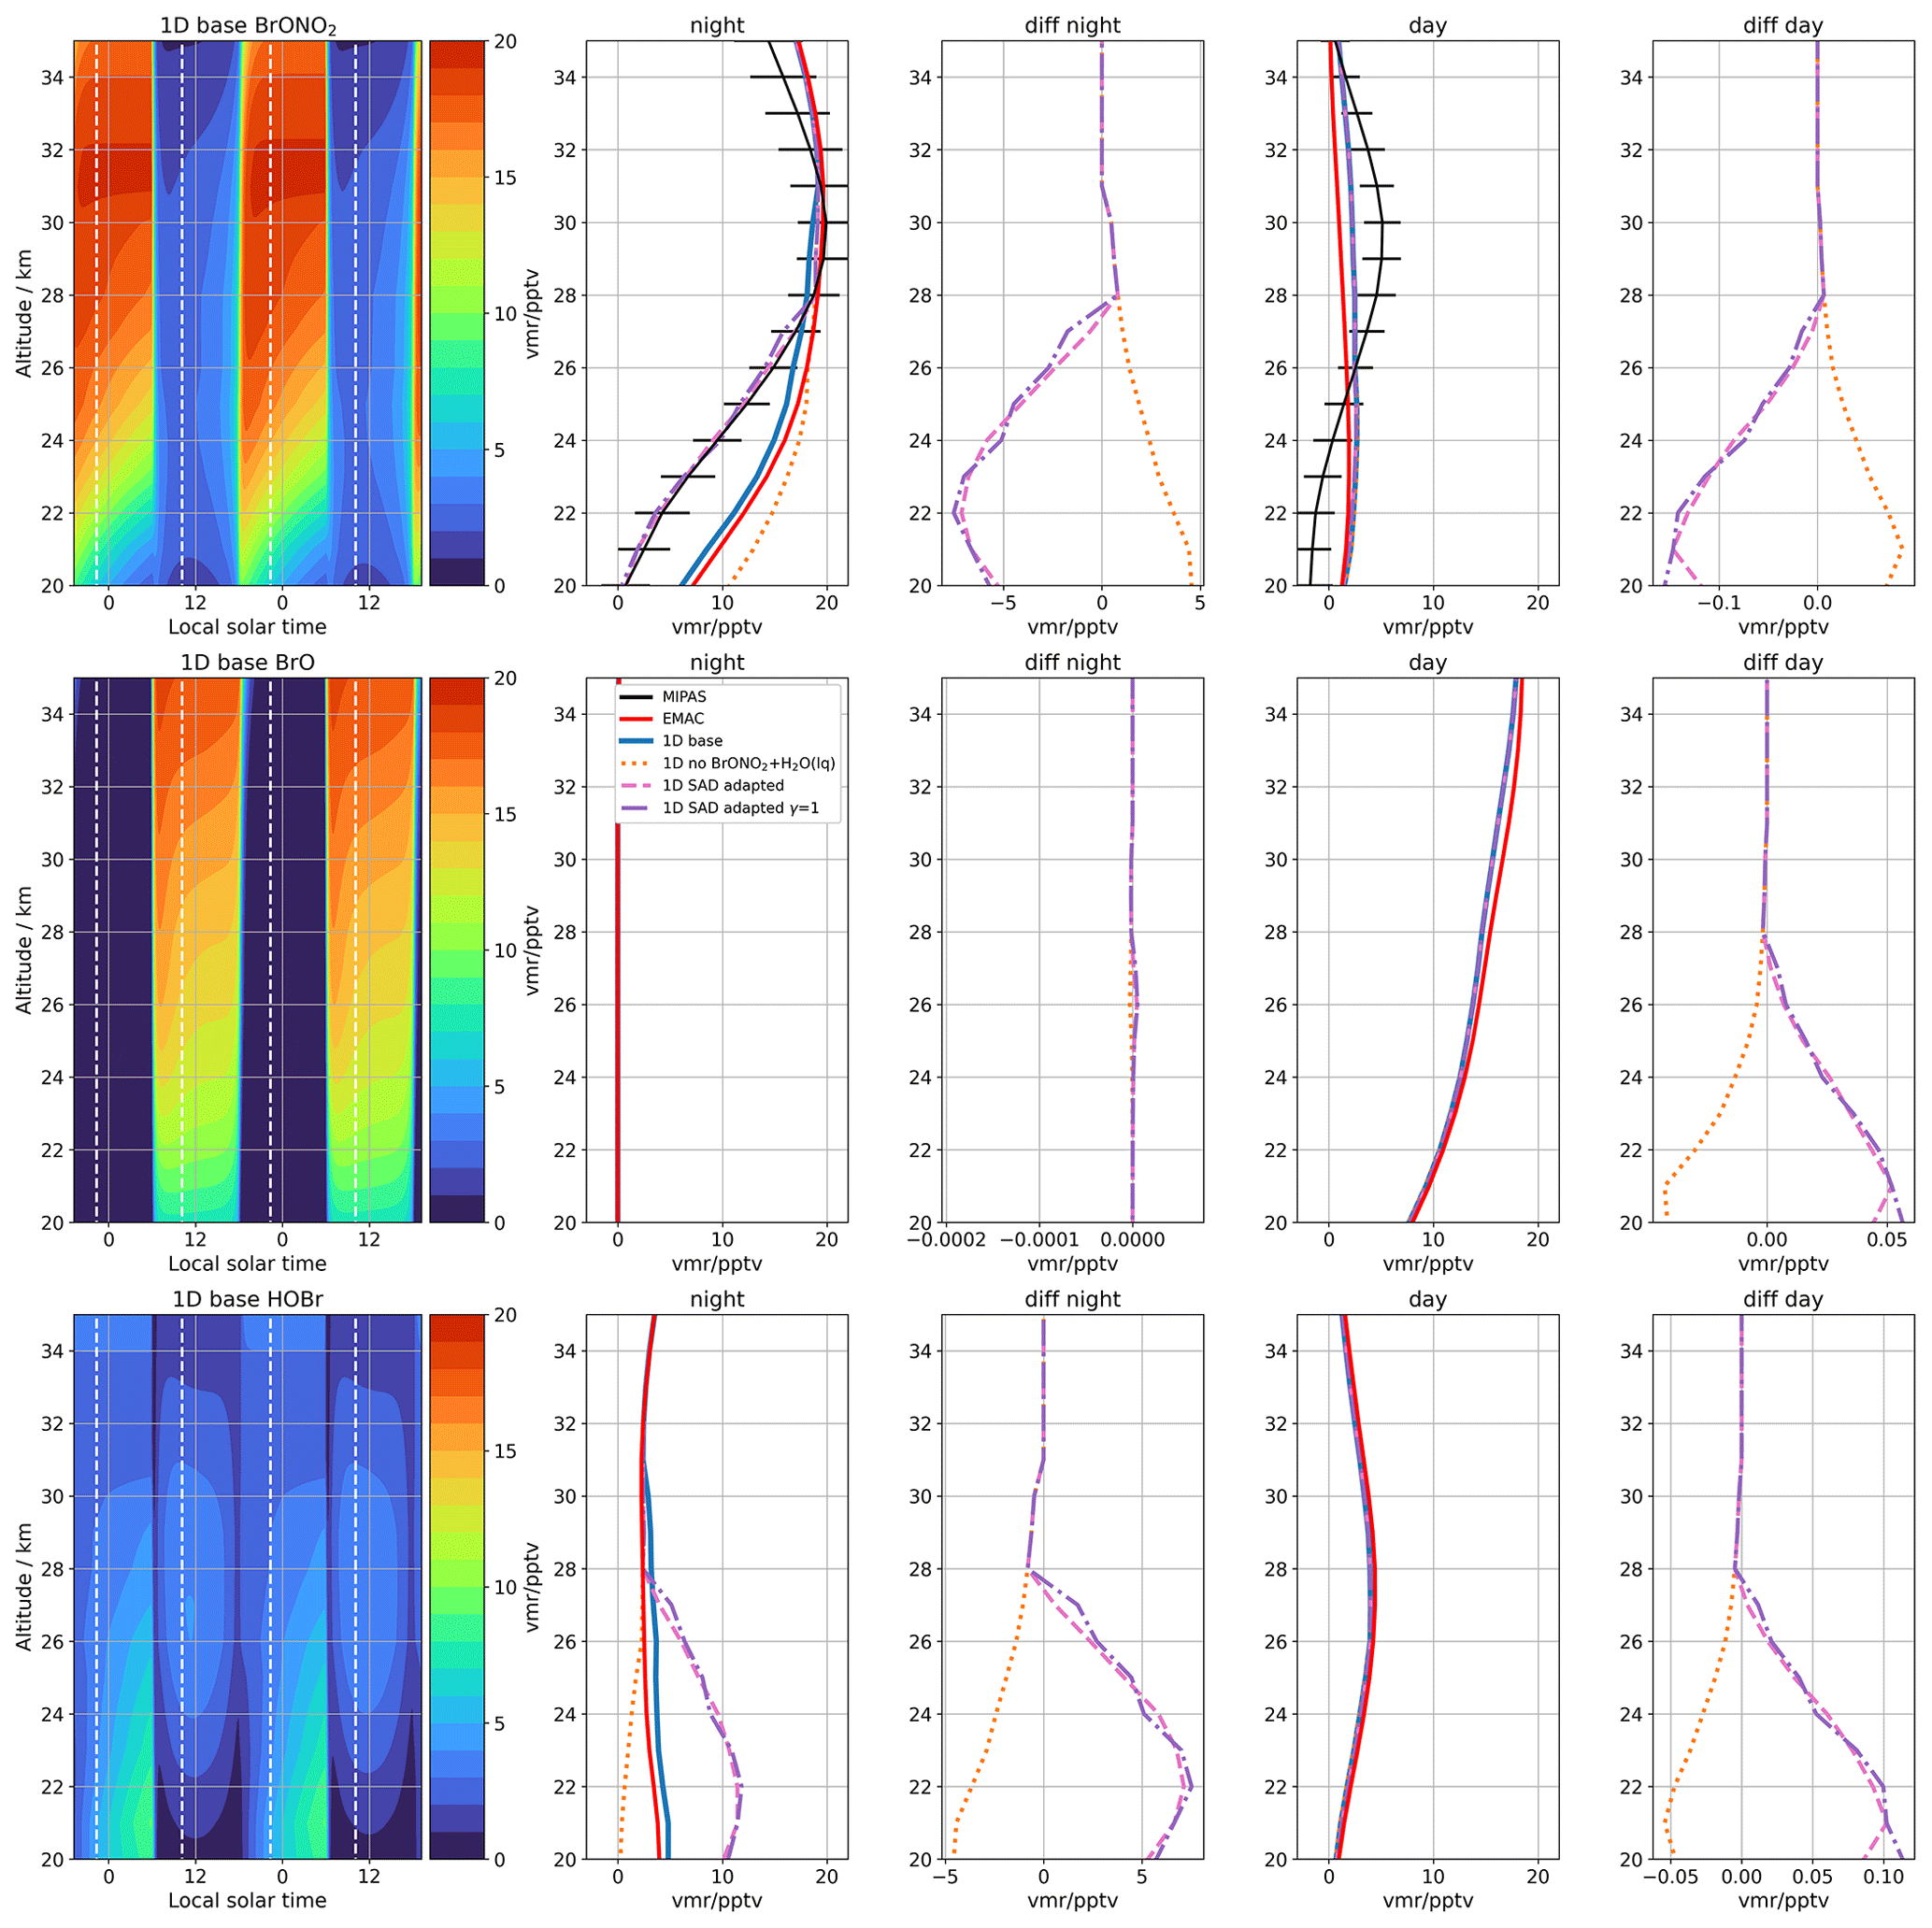
Figure 9 Sensitivity 1D model simulations for testing of the night-time EMAC model overestimation of BrONO2 below 27 km altitude for BrONO2 (top row), BrO (middle row), and HOBr (bottom row). Left: diurnal evolution of the “1D base” run for a period of 2 d. The white dashed lines indicate the local solar times of the MIPAS observations. The columns “night” and “day” contain the averaged night-time and day-time profiles of MIPAS at 5∘ S as black solid lines along with error bars indicating the 2σ estimated measurement uncertainty. The mean EMAC results are provided in red. The other curves illustrate the results of the 1D model simulations and the columns “diff night” and “diff day” show the differences between the 1D sensitivity runs and the “1D base” run.
The black line in panel “night” of the top row in Fig. 9 represents the measured mean night-time profile over the whole period at 5∘ S. The related EMAC model result is shown in red. Maximum differences between both are about 8 pptv at around 20–22 km altitude. As possible explanations for these differences we will discuss below (1) measurement errors, (2) wrong modelling of the release of Bry from its source gases, (3) wrong partitioning of Bry between its main constituents in the model simulations, and (4) wrong modelling of NO2 mixing ratios.
-
The degree of discrepancy between measurement and model of up to 8 pptv over an altitude range of around 5 km cannot reasonably be explained given the errors estimated for the MIPAS BrONO2 retrieval (Fig. 1). This would allow for discrepancies of around 2–3 pptv, especially considering that the “noise” error term is strongly reduced by the temporal averaging over all equatorial measurements. Still, one cannot rule out unequivocally any unidentified additional systematic error source in the measurements contributing to these differences.
-
Dorf et al. (2008) report on balloon observations of BrO in the framework of an ENVISAT validation campaign in Teresina, Brazil (5.1∘ S, 42.9∘ W), on 17 June 2005. In the altitude region of 20–22 km they observed volume mixing ratios of BrO of around 6–10 pptv, which agrees with our EMAC model results during day time (see Fig. 9, second row, red line in panel “day”) that indicate 8–11 pptv of BrO in the same altitude range. Similar mixing ratios of BrO at these altitudes in the tropics have also been reproduced by other model simulations (e.g. Theys et al., 2009) as well as by satellite observations (Sinnhuber et al., 2005; Sioris et al., 2006; Rozanov et al., 2011; Parrella et al., 2013). A possible contribution to a model overestimation of BrONO2 might be the emission scenario used for organic bromine species, taken from Warwick et al. (2006). As has e.g. been shown by Keber et al. (2020), this scenario probably leads to an overestimation of brominated VSLS by up to 2 pptv, which is, however, not enough to explain the observed differences. Thus, it is highly unlikely that the inorganic bromine content at 20–25 km is strongly overestimated in the EMAC model calculations.
-
The modelled partitioning of Bry at those altitudes during night is essentially determined by the heterogeneous conversion of BrONO2 into HOBr through sulfate aerosols (Reaction R4). For a more detailed investigation, we have performed sensitivity simulation with the 1D model, the results of which are shown in Fig. 9. The rate coefficient for heterogeneous reactions is proportional to the aerosol surface area density (SAD) and the reaction probability γ. For the baseline 1D calculation, we have applied a vertical profile of aerosol surface area densities which was derived from the mean tropical aerosol volume densities as available from MIPAS (Günther et al., 2018) assuming a lognormal size distribution with a number density of 10 cm−3 and a width of 1.8. Figure 10 provides a comparison of the resulting “MIPAS mean” surface area densities with SAGE II profiles in the tropics between July 2002 and August 2005 (Damadeo et al., 2013) as well as in situ measurements at mid latitudes over Laramie (41∘ S, 105∘ W) between 2002 and 2012 (Deshler et al., 2019). The reaction probabilities for the 1D baseline run (dashed pink curve in Fig. 10b) were determined according to Hanson (2003) as reported by Burkholder et al. (2019).
A test without consideration of heterogeneous conversion of BrONO2 into HOBr (dotted orange line in Fig. 9) results in a night-time increase in BrONO2 by up to 5 pptv as well as the corresponding decrease in HOBr. To replicate the observations of BrONO2, we performed two tests by adjusting the profile of aerosol surface area density: one (a) where we kept the altitude-dependent reaction probabilities (dashed pink curves in Figs. 9 and 10) and one (b) where the reaction probabilities were set to 1 over the entire altitude range (dashed-dotted purple curves in Figs. 9 and 10). As can be seen from Fig. 10, in test (a) one would require surface area densities enhanced by factors of more than 3 to deplete BrONO2 to such an extent that the observations in the altitude range 20–26 km are met. For the idealized case of γ=1, the aerosol surface area densities had to be adjusted up to 24 km only, however, still by a factor of more than 3 at 20 km altitude.
-
As the formation of BrONO2 is strongly linked to NO2, we have inspected its modelled mixing ratios in comparison to the observed ones. As can be seen in Figs. B1 and B3, the model calculations agree well with the measurements, especially at the lower altitudes where the observed discrepancies in BrONO2 occur. Thus, we exclude a wrong modelling of NO2 as an explanation for these differences.
In summary, we have to conclude that there is no compelling evidence for any of the explanations above causing the observed differences between measurements and model results. While (3) would imply an increase in aerosol surface area density contradicting related observations, (2) would oppose observations of BrO, (4) provides no hint of a discrepancy, and (1) seems out of reach within our estimated retrieval errors for BrONO2 from MIPAS.
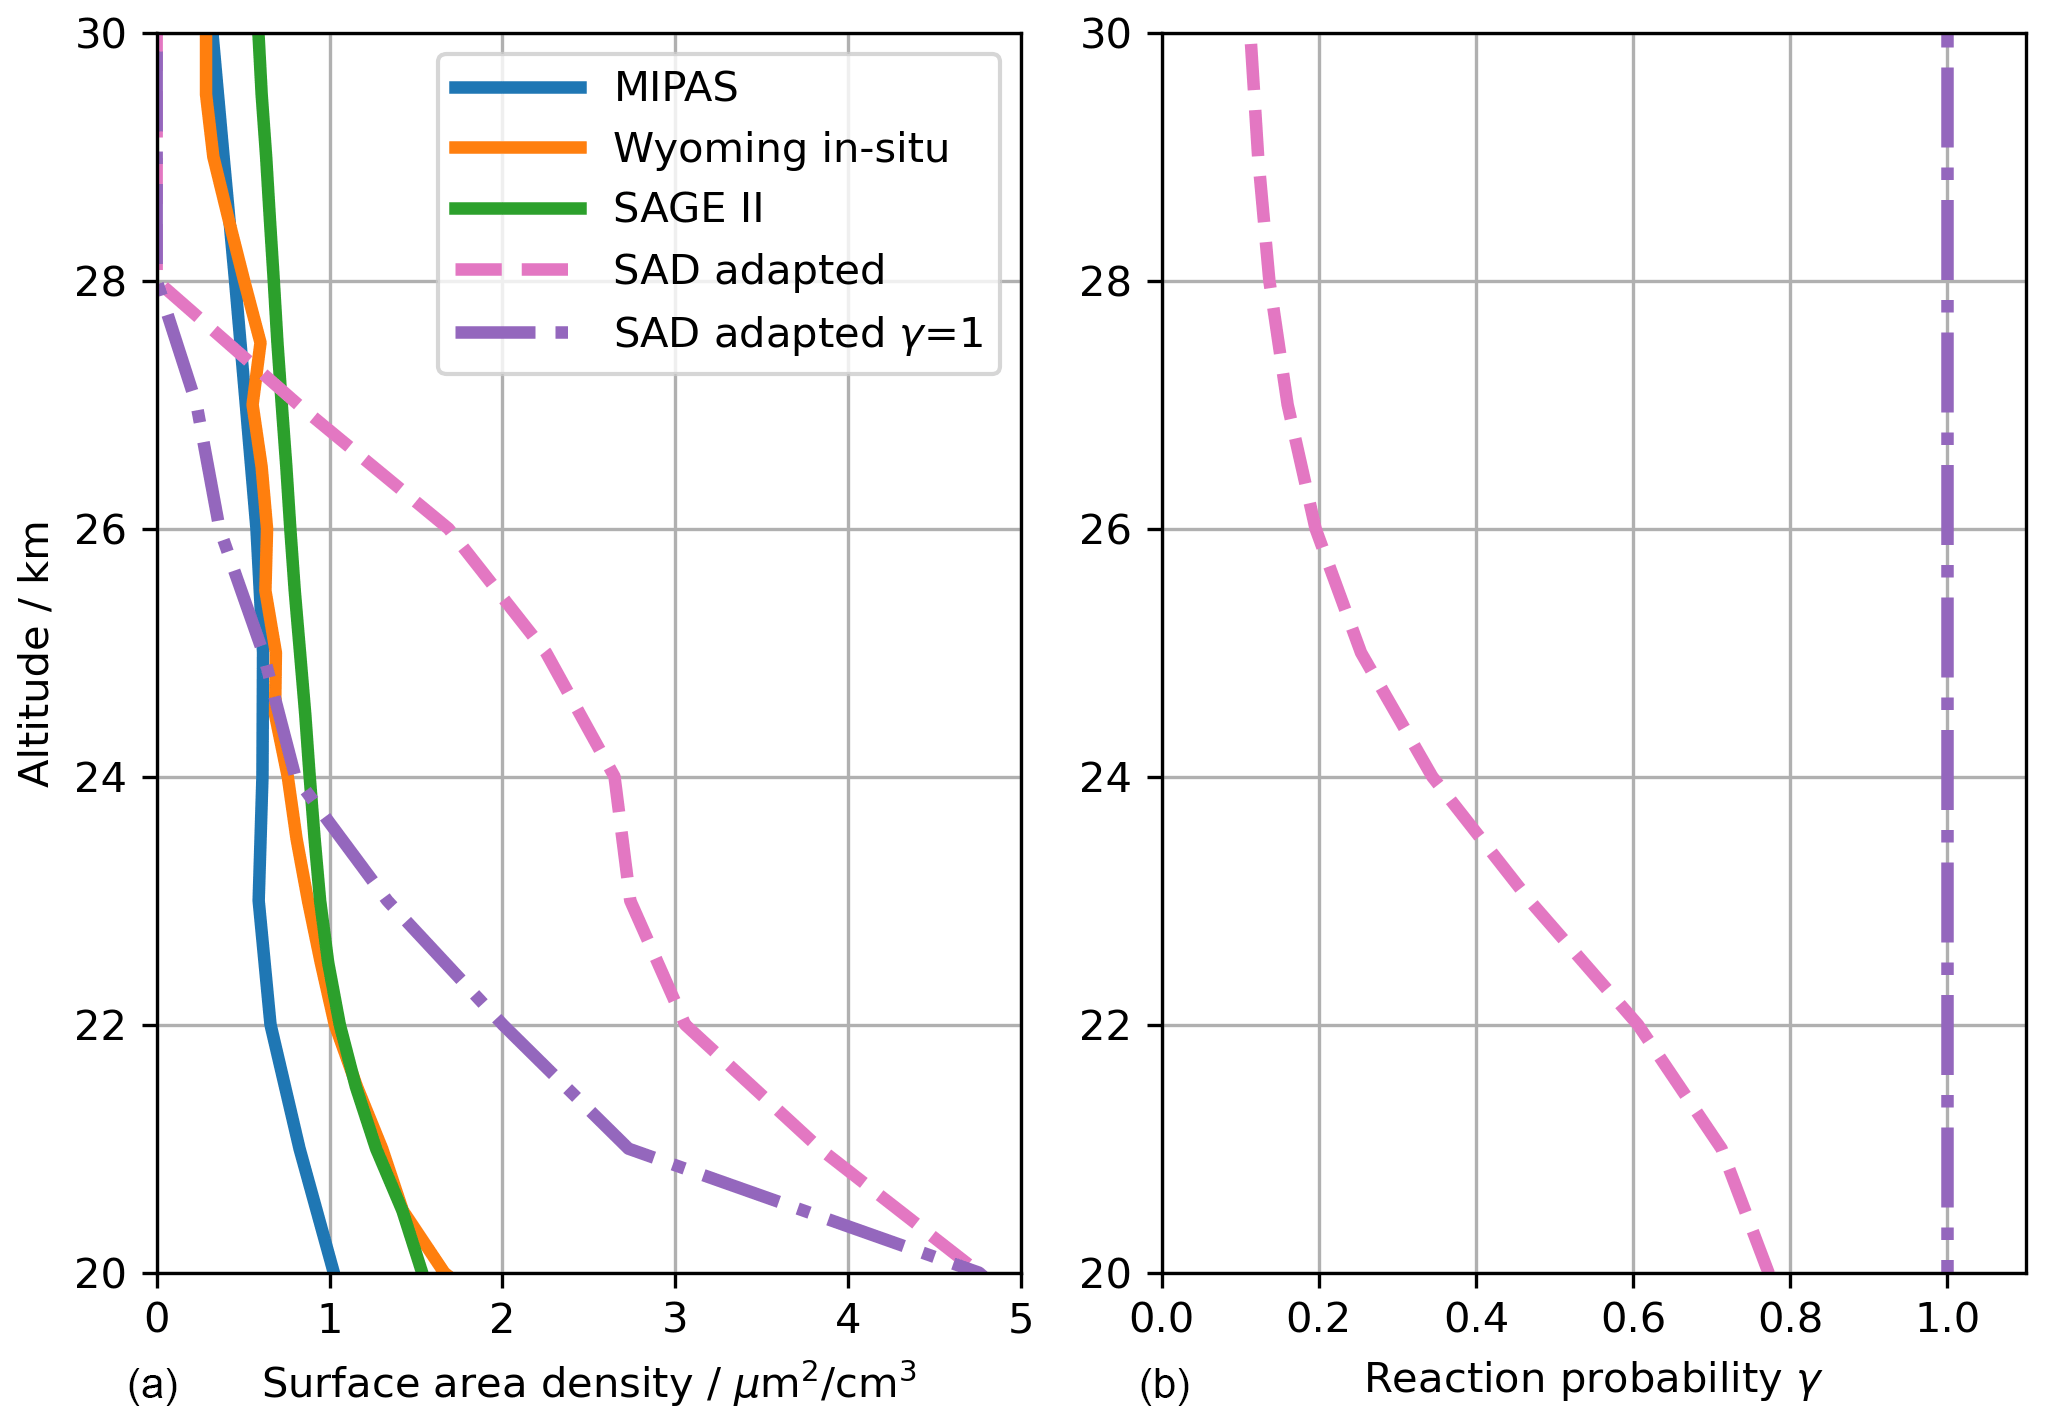
Figure 10 (a) Vertical profiles of surface area densities (SADs). Blue: mean MIPAS tropical profile (Günther et al., 2018) (see text for details), orange: mean profile from in situ observations over Laramie (41∘ S, 105∘ W) between 2002 and 2012, green: mean SAGE II profiles in the tropics between 2002 and 2005 (Damadeo et al., 2013). The dashed pink and dash-dotted purple lines show the adapted SAD profiles corresponding to the 1D model results indicated by the same line styles in Fig. 9. (b) Reaction probability profiles for hydrolysis of BrONO2 (Reaction R4). The dashed pink profile refers to the standard one determined in the 1D model (Hanson, 2003; Burkholder et al., 2019), and the dash-dotted purple curve has been used in the sensitivity analysis to adjust the SAD (a and Fig. 9).
3.2.3 Low modelled day-time BrONO2 at low latitudes
The EMAC model calculations fit the observed night-time BrONO2 maximum at 29–30 km altitude in the tropics quite well (see Fig. 7). However, during day time (Fig. 8), BrONO2 is almost entirely depleted in the EMAC simulations at these altitudes, while MIPAS still detects maximum values of up to 5 pptv. Possible reasons for this discrepancy discussed below might be (1) measurement errors or (2) the impact of uncertainties in the parameters of Reactions (R1) and (R2). Further, we will address the effect of Reaction (R3), which is not considered in the present implementation of EMAC. Finally, under (3), we will briefly address differences between measured and modelled NO2 mixing ratios.
-
In the top row of Fig. 11, the mean profile of BrONO2 measured at 5∘ S is again shown together with the EMAC model results in panel “day”. As in the case of the night-time discrepancy, the values of BrONO2 observed during sunlit conditions cannot be explained by the estimated retrieval errors, which are about 1–2 pptv at the 30 km region (Fig. 1). However, as can be seen in Fig. 11, the mean measured profile values below about 24 km are negative, indicating an unresolved issue in the retrieval at these altitudes. Still, the negative values are in the range of the estimated uncertainties. To investigate whether the positive values above where the discrepancy with the model becomes apparent might be due to an oscillatory feature caused by the negative values below, we have tested different retrieval options (increasing the regularization strength, performing retrievals of log(vmr) instead of vmr, skipping tangent altitudes below). In all the tests, the maximum values at around 30 km still appeared in the retrieved profiles, indicating them as a robust feature.
-
Sensitivity calculations using the 1D model are also shown in Fig. 11. As a baseline for these simulations, we have applied the setting “SAD adapted” so that the calculations during night-time also fit to the observations at altitudes below 27 km. The resulting profile from the 1D model run also shows values which are smaller than the observed BrONO2 mixing ratios by about 3 pptv at around 30 km altitude. Though about 1 pptv larger than the EMAC simulations at those altitudes, the 1D results are also not compatible with the measurements.
To test the sensitivity of modelled BrONO2 to its production via the three-body Reaction (R1), we have used the JPL2019 formulation (Burkholder et al., 2019) instead of that by Atkinson et al. (2007) that was applied in the EMAC and 1D baseline runs (Table D1). This led to an increase in BrONO2 vmr values by about 1 pptv; see the dash-dotted green curve in Fig. 11. Further increasing these rate coefficients by a factor of 2, which is well covered by the 2σ uncertainty factor of 3.7 for that reaction at 220 K (Burkholder et al., 2019), led to an additional increase by about 3 pptv (dash-dotted olive curves in Fig. 11). While these results coincide now with the observed day-time abundances of BrONO2 at around 30 km, the increase at lower altitudes does not correspond well to the observations there. Moreover, around 30 km during night, the calculations overestimate the measurements by up to 2 pptv.
To test the sensitivity with respect to the photolysis of BrONO2 (Reaction R2), we have divided the photolysis rate by 1.2, the 2σ uncertainty as provided by Burkholder et al. (2019). The result is illustrated by the blue dashed curves in Fig. 11. The resulting increase of only around 0.5 pptv is too small compared to the observations. Moreover, the increase appears over a larger altitude range (from 22 up to 34 km) compared to the more confined region between about 27 and 33 km where the increased day-time values are observed.
The grey dotted curve in Fig. 11 illustrates the effect on the simulated mixing ratios when the loss Reaction (R3) is included in the 1D model by using the reaction coefficients from the JPL2019 compilation; see Table D1 (Burkholder et al., 2019). With a reduction of up to 1.5 pptv, this obviously drives the concentrations further away from the observations.
-
In the tropics at around 30 km, the mixing ratios of NO2 from the measurements are around 10 %–20 % smaller than modelled by EMAC, with the results of the 1D model lying in between (see Figs. B2 and B4). These deviations cannot account for the model underestimation of BrONO2 since they would even imply stronger modelled production of BrONO2.
In conclusion, we have found no unequivocal explanation for the high measured day-time mixing ratios of BrONO2 at around 30 km over the tropics/subtropics: (a) the differences between models and observations are outside the estimated measurement errors, (b) the uncertainties of the cross sections for photolysis (Reaction R2) of BrONO2 are by far too small, (c) the error estimates for Reaction (R1) would allow a sufficient increase in BrONO2 mixing ratios but over an overly large vertical extent, and (d) any inclusion of Reaction (R3) opens the gap between simulated and observed BrONO2 concentrations even more.
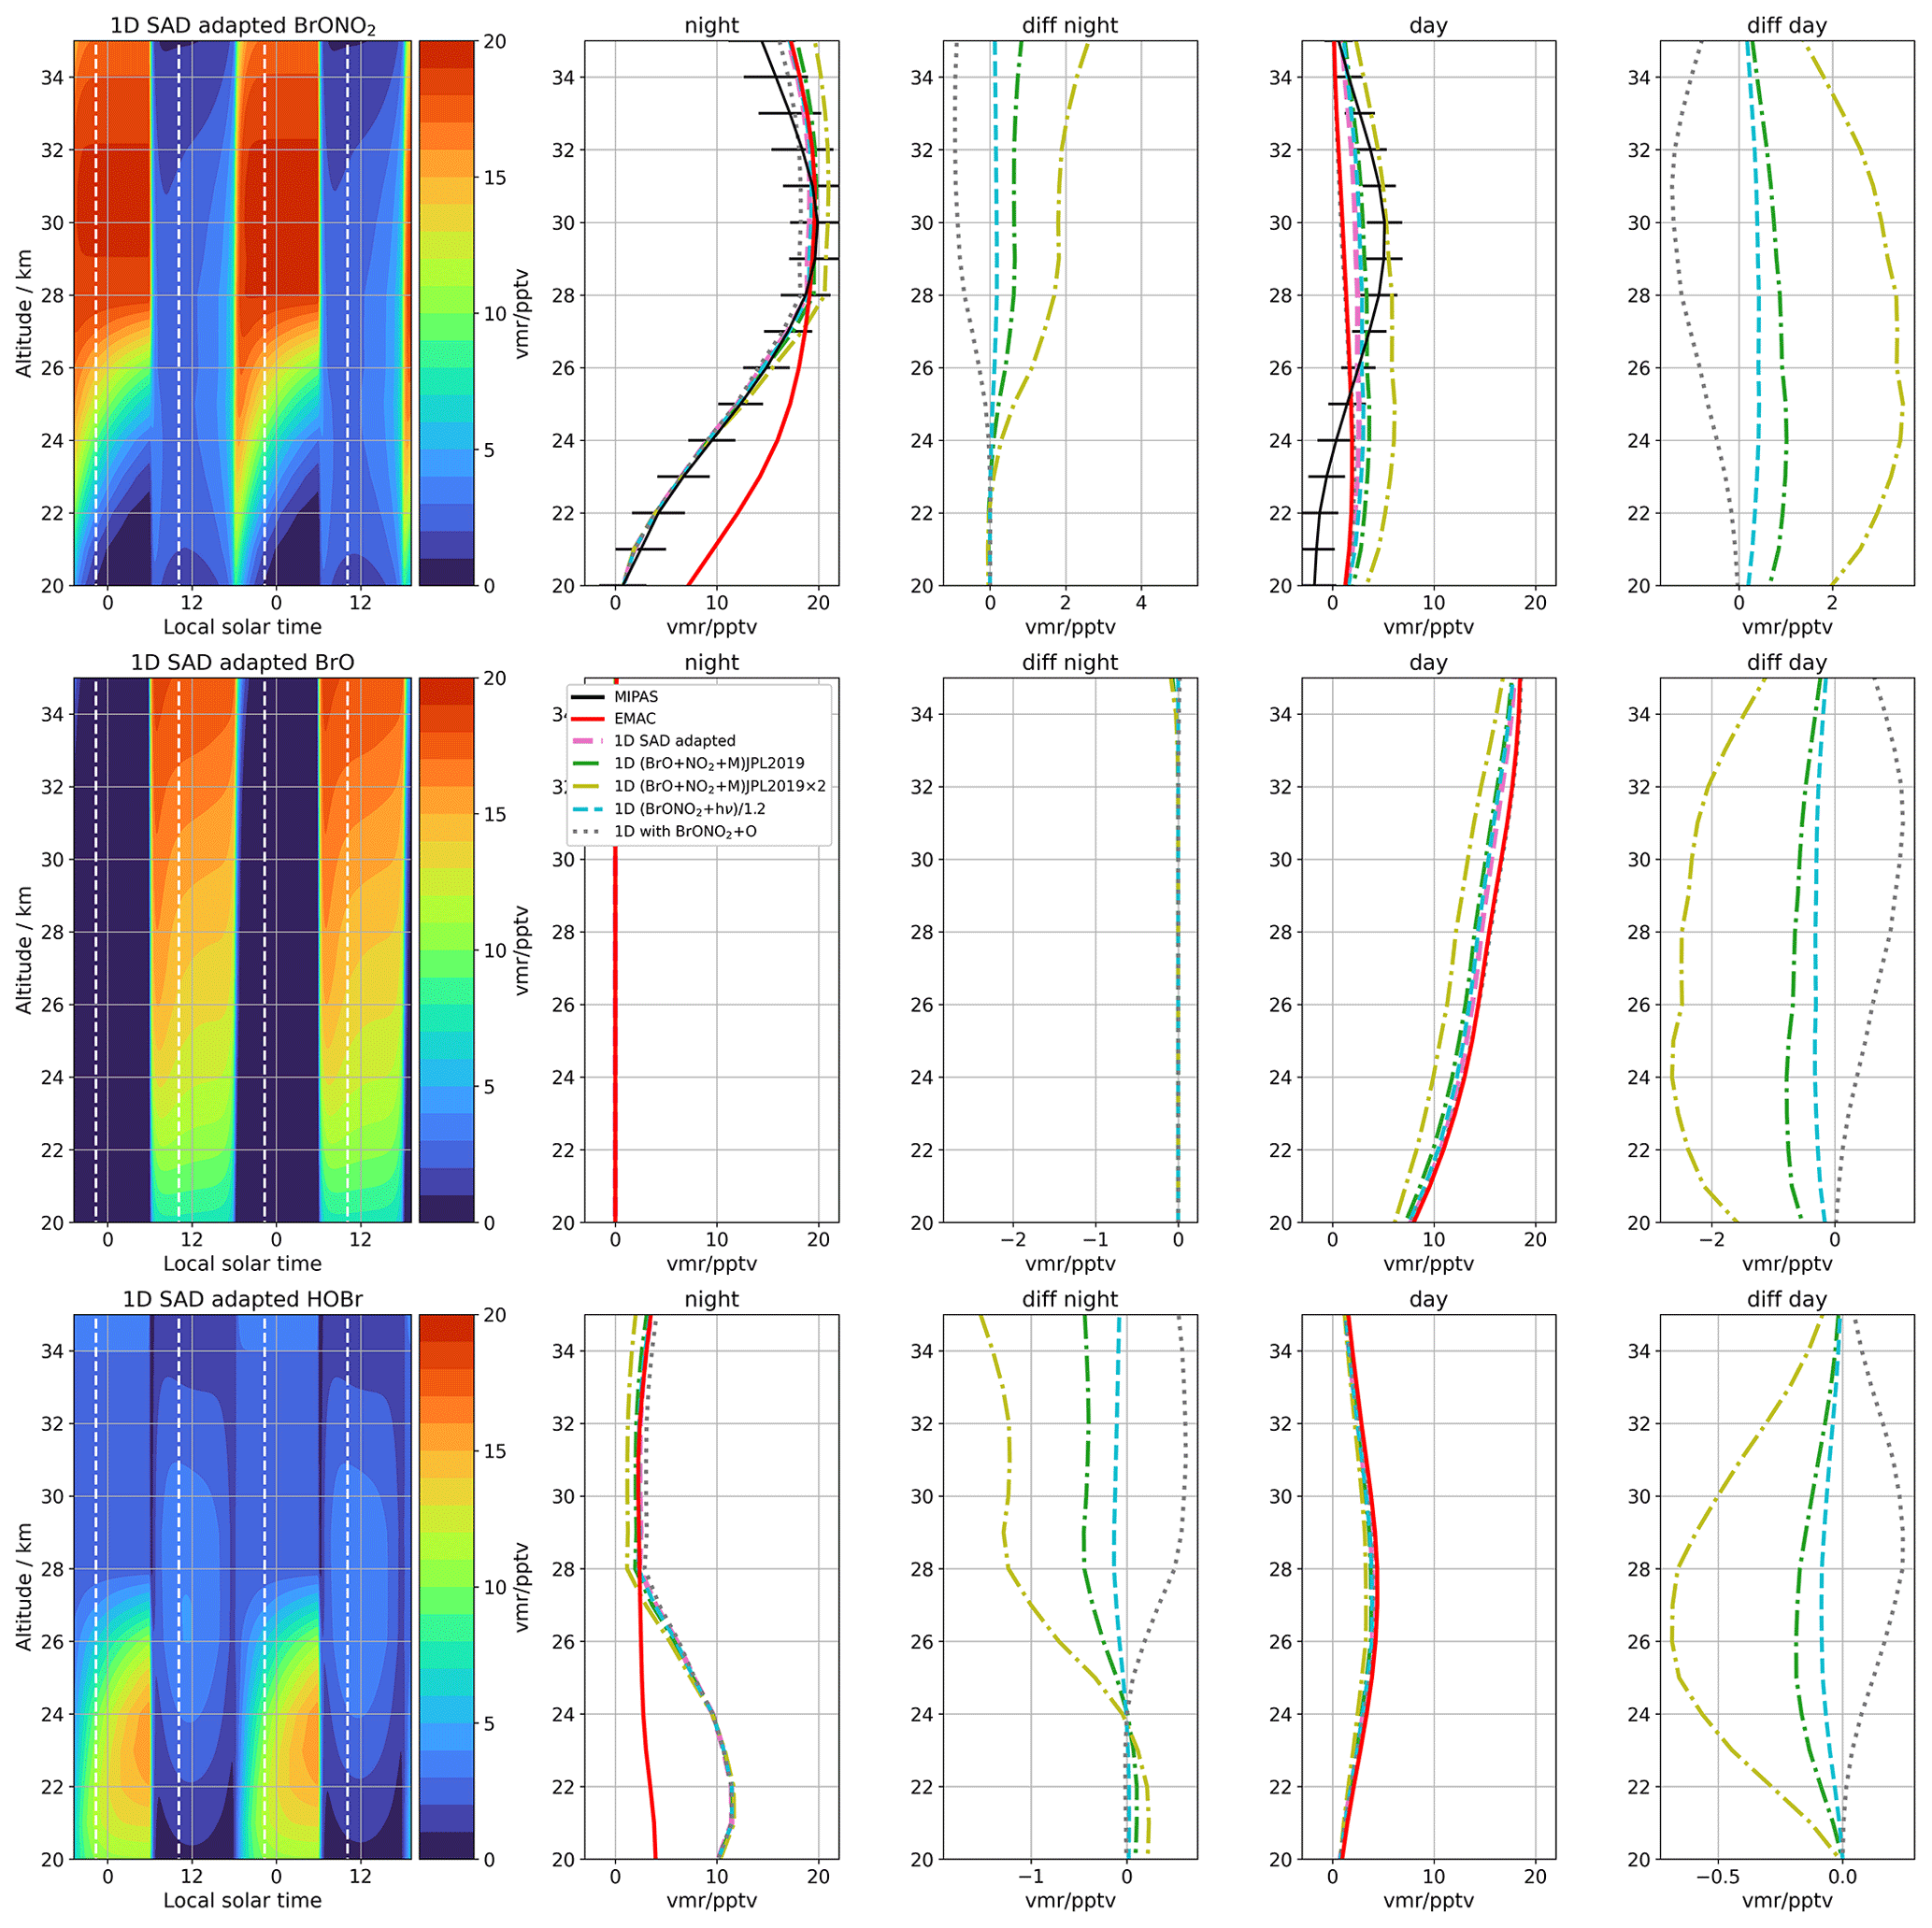
Figure 11 Sensitivity 1D model simulations to test the day-time EMAC model underestimation of BrONO2 around 29 km altitude for BrONO2 (top row), BrO (middle row), and HOBr (bottom row). Left: diurnal evolution of the “1D base” run for a period of 2 d. The white dashed lines indicate the local solar times of the MIPAS observations. The columns “night” and “day” contain the averaged night-time and day-time profiles of MIPAS at 5∘ S as black solid lines along with error bars indicating the 2σ estimated measurement uncertainty. The mean EMAC results are provided in red. The MIPAS and EMAC curves are the same as in Fig. 9. The other curves illustrate the results of the 1D model simulations and the columns “diff night” and “diff day” show the differences between the 1D sensitivity runs and the “1D base” run.
The MIPAS dataset of BrONO2 allows us to determine the total stratospheric content of bromine (Bry) by using the so-called inorganic method. It is a linear correction of the observed bromine species by multiplication by the ratio between total modelled bromine (Br) and the modelled bromine species observed. This procedure has often been applied in case of day-time observations of BrO (e.g. Dorf et al., 2006a, b). Wetzel et al. (2017) were the first to apply this method to night-time observation of BrONO2:
Using night-time observations of BrONO2 instead of BrO measured during the day to derive Bry should have the advantage that BrONO2 during the night makes up a larger fraction of Bry than BrO does during the day, due to the continuous production of BrONO2 (Reaction R1).
The modelled night-time ratio between and Br has been examined to decide which region (in terms of altitude and latitude) to use for determination of Bry from the MIPAS dataset (cf. Fig. C1). Values clearly exceeding 90 % are simulated at mid latitudes, mainly during spring/summer/autumn, and centred at altitudes around 26 km. Thus, for the analysis we have chosen data at 25–26 km altitude and 40–60∘ latitude from October to March in the Southern Hemisphere and from April to September in the Northern Hemisphere. Additionally, due to the low seasonal variability of BrONO2 and to capture relatively young air masses, we also considered tropical data at 29–30 km in the analysis. While not exceeding 90 %, the ratio Br is still larger than 85 % (see Fig. C1).
For stratospheric measurements, the values of derived total inorganic bromine are generally assigned to their year of entry into the stratosphere (e.g. Engel et al., 2018, Fig. 1-16). Here we have used an update of the age-of-air dataset determined from MIPAS retrievals of SF6 (Haenel et al., 2015; Stiller et al., 4–8). Typical values of age of air in the case of the mid-latitude observations range between 5 and 6.5 years and in the tropics between 3.5 and 5 years, with errors of about 1 year.
Depending on the date of stratospheric entry, total Bry (red) estimated from the MIPAS observations through Eq. (1) in comparison to the original MIPAS observation (, blue) is shown in Fig. 12. The solid lines represent weighted means of all data points, where for the weighting the a posteriori estimated random error (dotted black curves in Fig. 1) was applied. The resulting random error as indicated by the thickness of the line is very small (0.04–0.07 pptv) due to the large number of data points. The major part of the uncertainty in our estimation of total Bry, however, is due to the combined parameter and systematic error (the green line in Fig. 1), which is shown by the red shading in Fig. 12. It should be noted that this error term is a combination of a variety of estimated uncertainties, each of which might also partly be random in nature with different temporal correlation lengths (e.g. correlated over each of the two measurement phases). Thus, we have made a conservative assumption in considering all those to be systematic – but possibly also underestimate them by applying quadratic combination of the single error terms.

Figure 12 Series of averaged MIPAS BrONO2 measurements (dark blue dots) and derived total stratospheric Bry (red dots) for different altitude and latitude bands over the time of stratospheric entry. Dark blue and red lines indicate the related time-averaged mean values over the whole period and the red shading indicates the estimated 1σ uncertainty. The other data points and error bars are estimates of Bry from observations of BrO taken from Fig. 1-16 in Engel et al. (2018) as well as updates of the MIPAS-Balloon observations of BrONO2 (Wetzel et al., 2017). Coarse locations (south of 20∘ S: top; 20∘ S–20∘ N: middle; north of 20∘ N: bottom) of the non-MIPAS/Envisat observations are indicated by the larger symbol size. See also Table 1.
Our estimates of total Bry vary from 21.0±1.4 and 21.4±1.4 pptv for the northern and southern mid-latitude regions, respectively (years of stratospheric entry: 1997–2006), to a maximum of 22.4±1.7 pptv in the tropical stratosphere (years of stratospheric entry: 1998–2007) (Table 1). The values of Bry from the mid latitudes of both hemispheres coincide clearly within their uncertainty ranges. Since it is unlikely that the real values of total Bry vary strongly in the stratosphere, the differences of 1–1.4 pptv between tropical and mid-latitudinal estimates are more probably caused by uncertainties. These may either be caused by errors in the BrONO2 concentrations derived from MIPAS or may be due to the calculation of total Bry from BrONO2 through Eq. (1) (or a combination of both). The first explanation would require a retrieval error component varying with latitude, e.g. due to some temperature dependence, while the second one implies model uncertainty. Since the model adjustment of Bry from BrONO2 is much larger in the tropical stratosphere (about 2.5 pptv) than at mid latitudes (about 0.5 pptv), the second explanation would affect more strongly our estimation of Bry in the tropics.
Table 1 Mean values, standard deviation, the standard error of the mean, and the estimated accuracy of total stratospheric Bry as derived from MIPAS, from Fig. 1-16 of Engel et al. (2018) as well as single observations by the MIPAS-Balloon experiment (Wetzel et al., 2017) during the stratospheric entry years 1997–2007; see also Fig. 12.
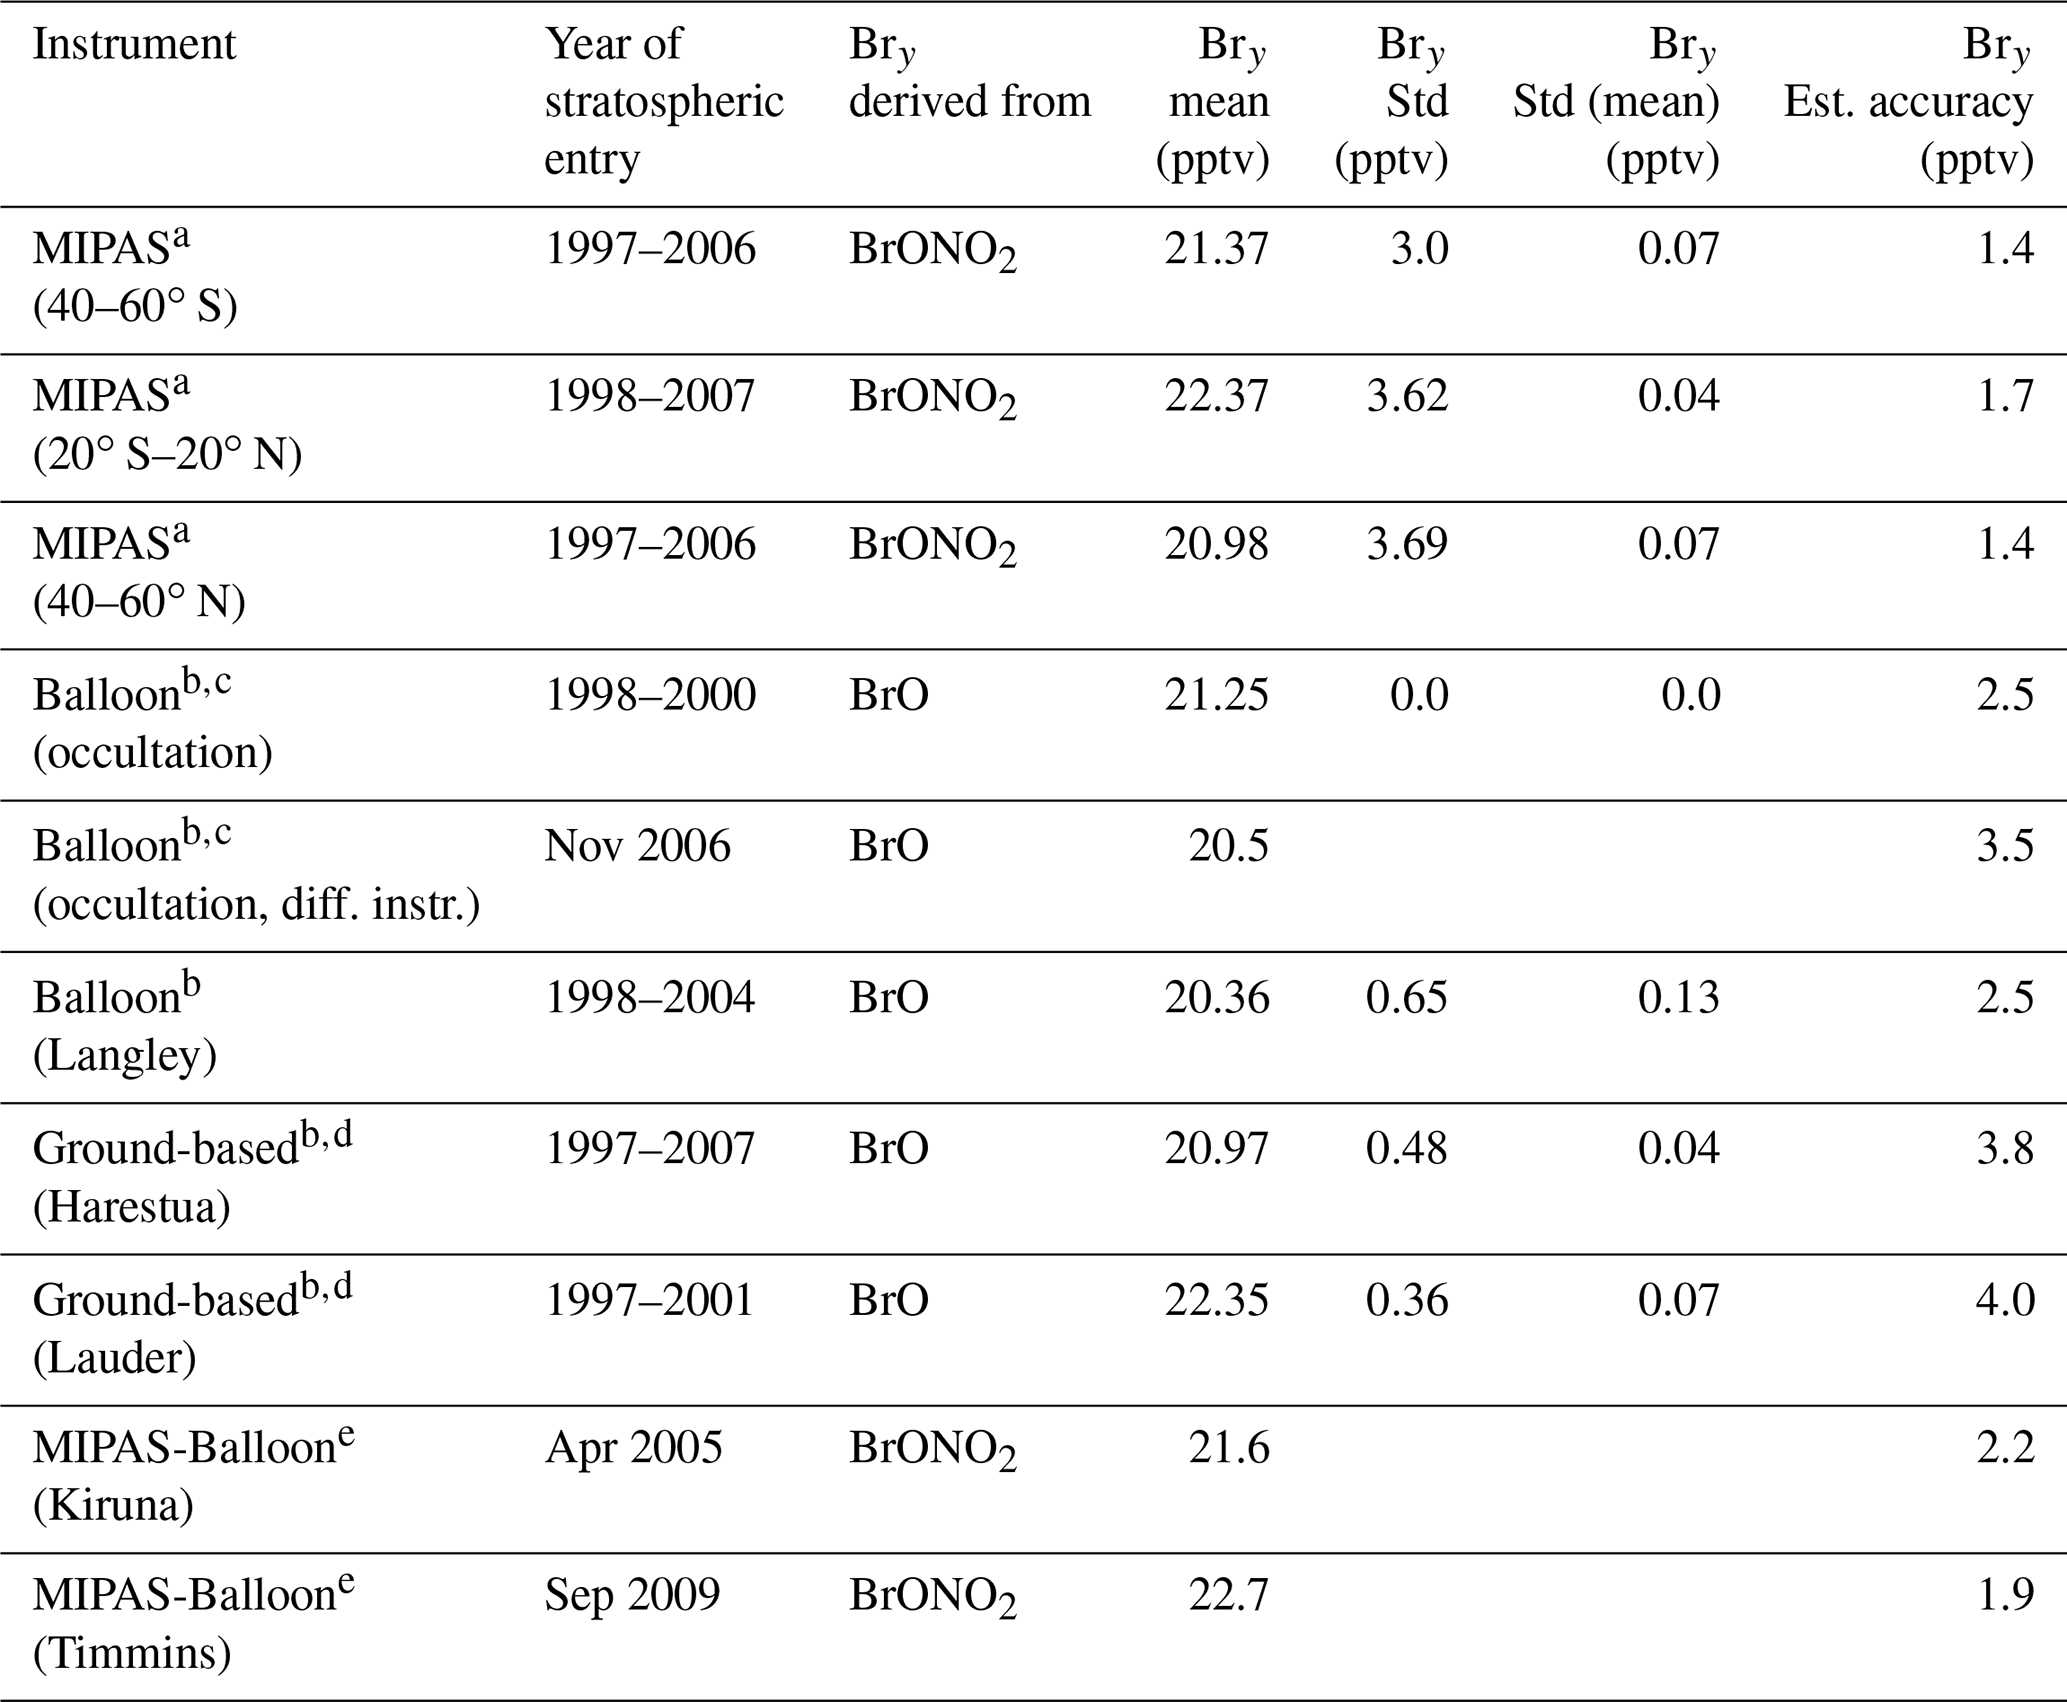
a This work, b WMO (2018), c Dorf et al. (2006b), d Hendrick et al. (2008), e update of Wetzel et al. (2017).
Bry obtained from MIPAS can be compared to data of Bry derived from observations of BrO, as summarized for example in Fig. 1-16 of Engel et al. (2018). To provide an easy way of comparison, we have replicated the single values of those datasets in each panel of our Fig. 12 and have collected their respective mean values in Table 1, limited to the period of stratospheric entry from the MIPAS dataset. Notably, all of these observations are compatible with the values derived from MIPAS and lie clearly within the uncertainty estimates of MIPAS data. The balloon-borne observations ranging from about 20.4 to 21.3 pptv are more in line with the mid-latitude values of MIPAS, as are the ground-based observations from Harestua with 21.0 pptv. The Bry value of 22.4 pptv from the ground-based observations in Lauder fits, however, more to the higher tropical MIPAS estimates. Further, the Bry estimates from BrONO2 measurements during two balloon flights of the MIPAS-B instrument (21.6 and 22.7 pptv, respectively) agree with both mid-latitude and tropical MIPAS/Envisat values.
We have presented the first global dataset of BrONO2 volume mixing ratio profiles for day and night derived from 10∘-zonally and 3-daily averaged MIPAS spectra covering the whole period of observations from 2002 to 2012. A comparison with EMAC model simulations confirms overall our current understanding of the chemical processes influencing the global zonal mean distribution as well as the diurnal and seasonal variations of BrONO2 in the stratosphere. Still, remaining differences indicate uncertainties in modelled processes as well as in boundary conditions.
One deviation, the underestimation of BrONO2 concentrations by the model at high latitudes during winter, could be explained. It is caused by the missing additional NOx source in the model located in the mesosphere and lower thermosphere. The energetic-particle-produced NOx is transported downwards by polar winter subsidence, thereby contributing to the production of BrONO2 – a process which we could observe here for the first time. In future, modelling efforts are envisaged to study this effect on the high-latitude bromine budget as well as its impact on stratospheric ozone.
Two further inconsistencies between model and measurement are more difficult to unravel, and final explanations remain open. First, a globally present disparity is the higher simulated values in the lower stratosphere, especially at night. Sensitivity calculations with our 1D model indicate as the only possible means to decrease BrONO2 concentrations a more efficient heterogeneous loss of BrONO2, e.g. via Reaction (R4). However, to reach values compatible with the observations, an increase in aerosol surface area densities and/or reaction probabilities would be required. Even for reaction probabilities of unity, aerosol SADs would have to be increased by factors of 2–3 to reproduce the observations of BrONO2. Such an increase in lower stratospheric aerosol SAD would, however, not agree with current satellite and in situ observations. Another possible cause, an overly efficient conversion of organic to inorganic bromine species in the model, would be in disagreement with previous balloon and satellite observation of BrO.
Further, the model showed an underestimation of BrONO2 abundances at low latitudes and altitudes of around 27–32 km during day time. Here, only an increase in the production of BrONO2 (Reaction R1) within its uncertainty range led to sufficient agreement with the observations at altitudes around 30 km, albeit aggravating it below about 27 km. Inclusion of Reaction (R3), the depletion of BrONO2 via reaction with O(3P), only increases the difference between model and simulation. It should be noted here that independent information on the reaction parameters for Reaction (R3) is missing (Burkholder et al., 2019), which might raise concern about its validity.
While we cannot rule out for sure that unaccounted systematic errors in the observations are responsible for these discrepancies, this seems rather unlikely given their overall fit to the model as well as the error assessment. This view is supported by the estimation of the total stratospheric bromine content from MIPAS BrONO2 measurements for years of stratospheric entry between 1997 and 2007, i.e. around the maximum of stratospheric total bromine content (Engel et al., 2018). At mid latitudes, where the model correction to estimate Bry from observed BrONO2 volume mixing ratios is smallest, we derived an average value of 21.2±1.4 pptv of total stratospheric Bry, which fits very well to independent estimates based on observations of BrO and to Bry estimates derived from BrONO2 observations of the MIPAS balloon experiment.
If it is the case that the inconsistencies between model and observations as discussed above are due to model uncertainties, these inconsistencies could also affect estimated ozone loss processes through bromine cycles. In future, our dataset of BrONO2 from MIPAS can be combined e.g. with the simultaneous day-time BrO observations from the SCIAMACHY instrument on Envisat to investigate the revealed issues about possible deficiencies in our understanding of stratospheric bromine chemistry as well as to gain more insight into possible uncertainties in the observations.
The EMAC model data without and with application of the respective averaging kernels from the BrONO2 retrieval are shown in Figs. A1 and A2.
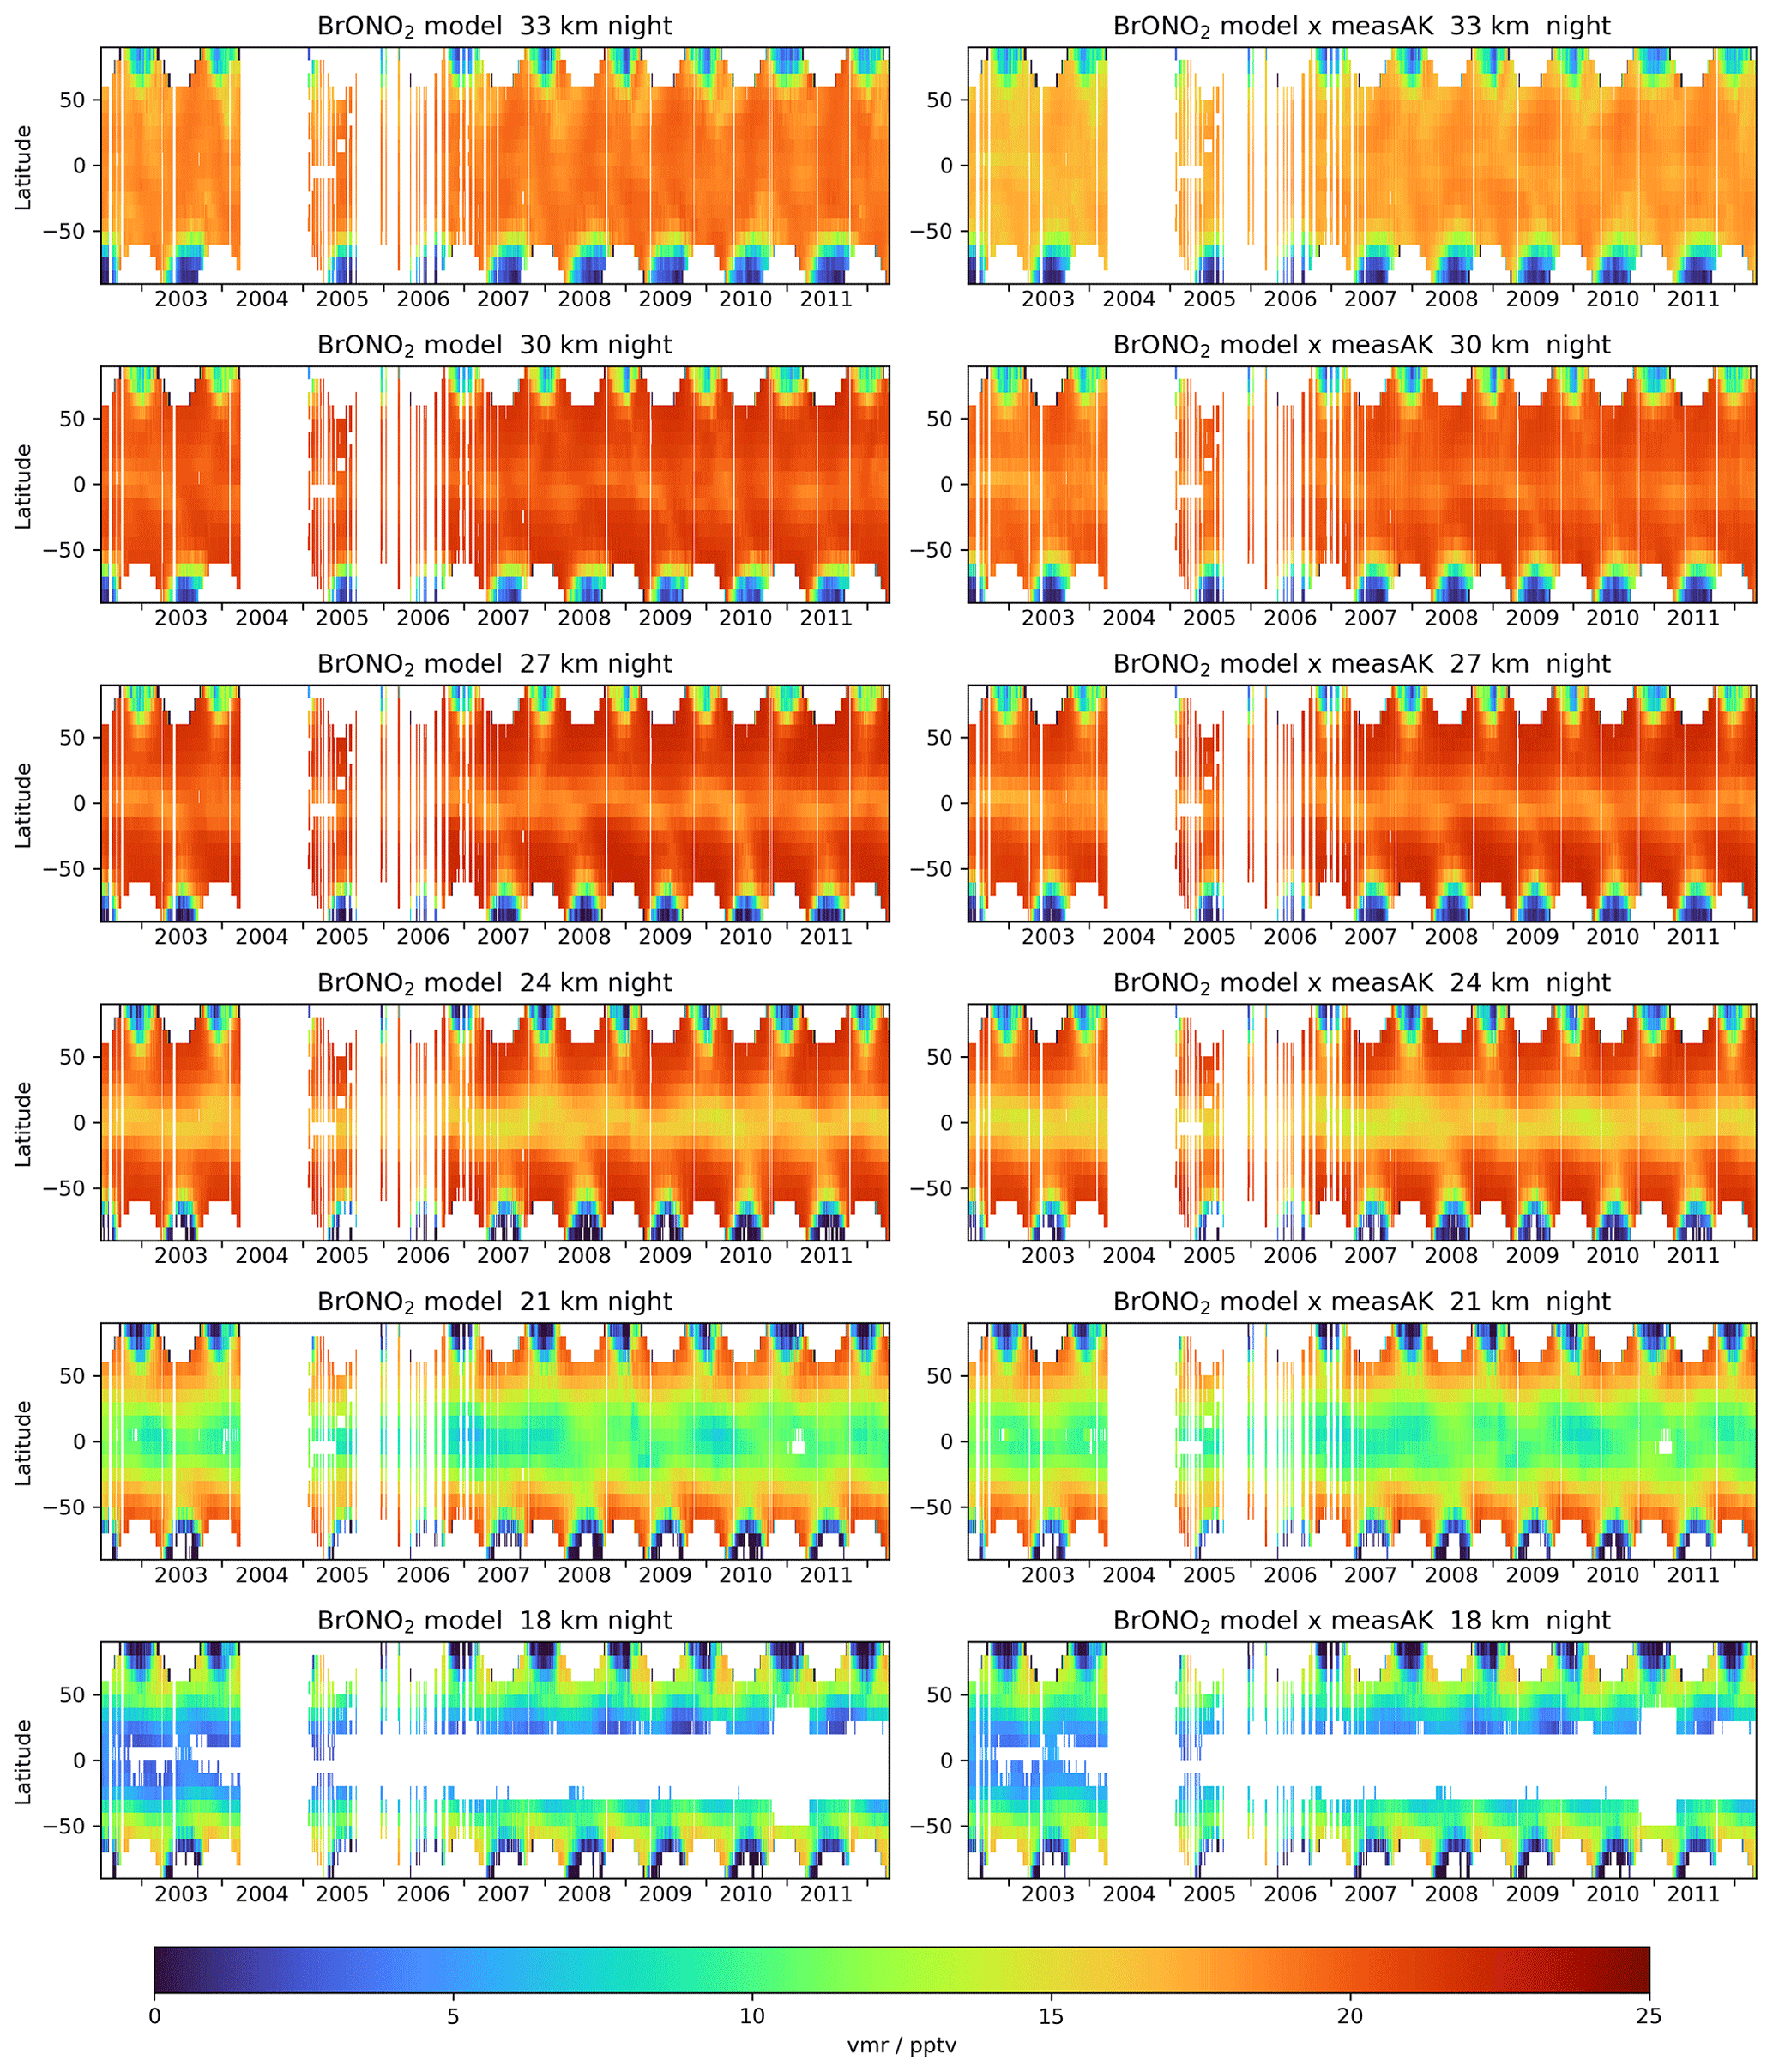
Figure A1 Same as in Fig. 3 but showing the pure model results of BrONO2 volume mixing ratios in dark conditions on the left-hand side in comparison to the model results with the retrieval averaging kernels applied on the right-hand side.
Figures B1 and B2 show the results of NO2 volume mixing ratio profiles simultaneously retrieved with BrONO2 in comparison with EMAC model data.
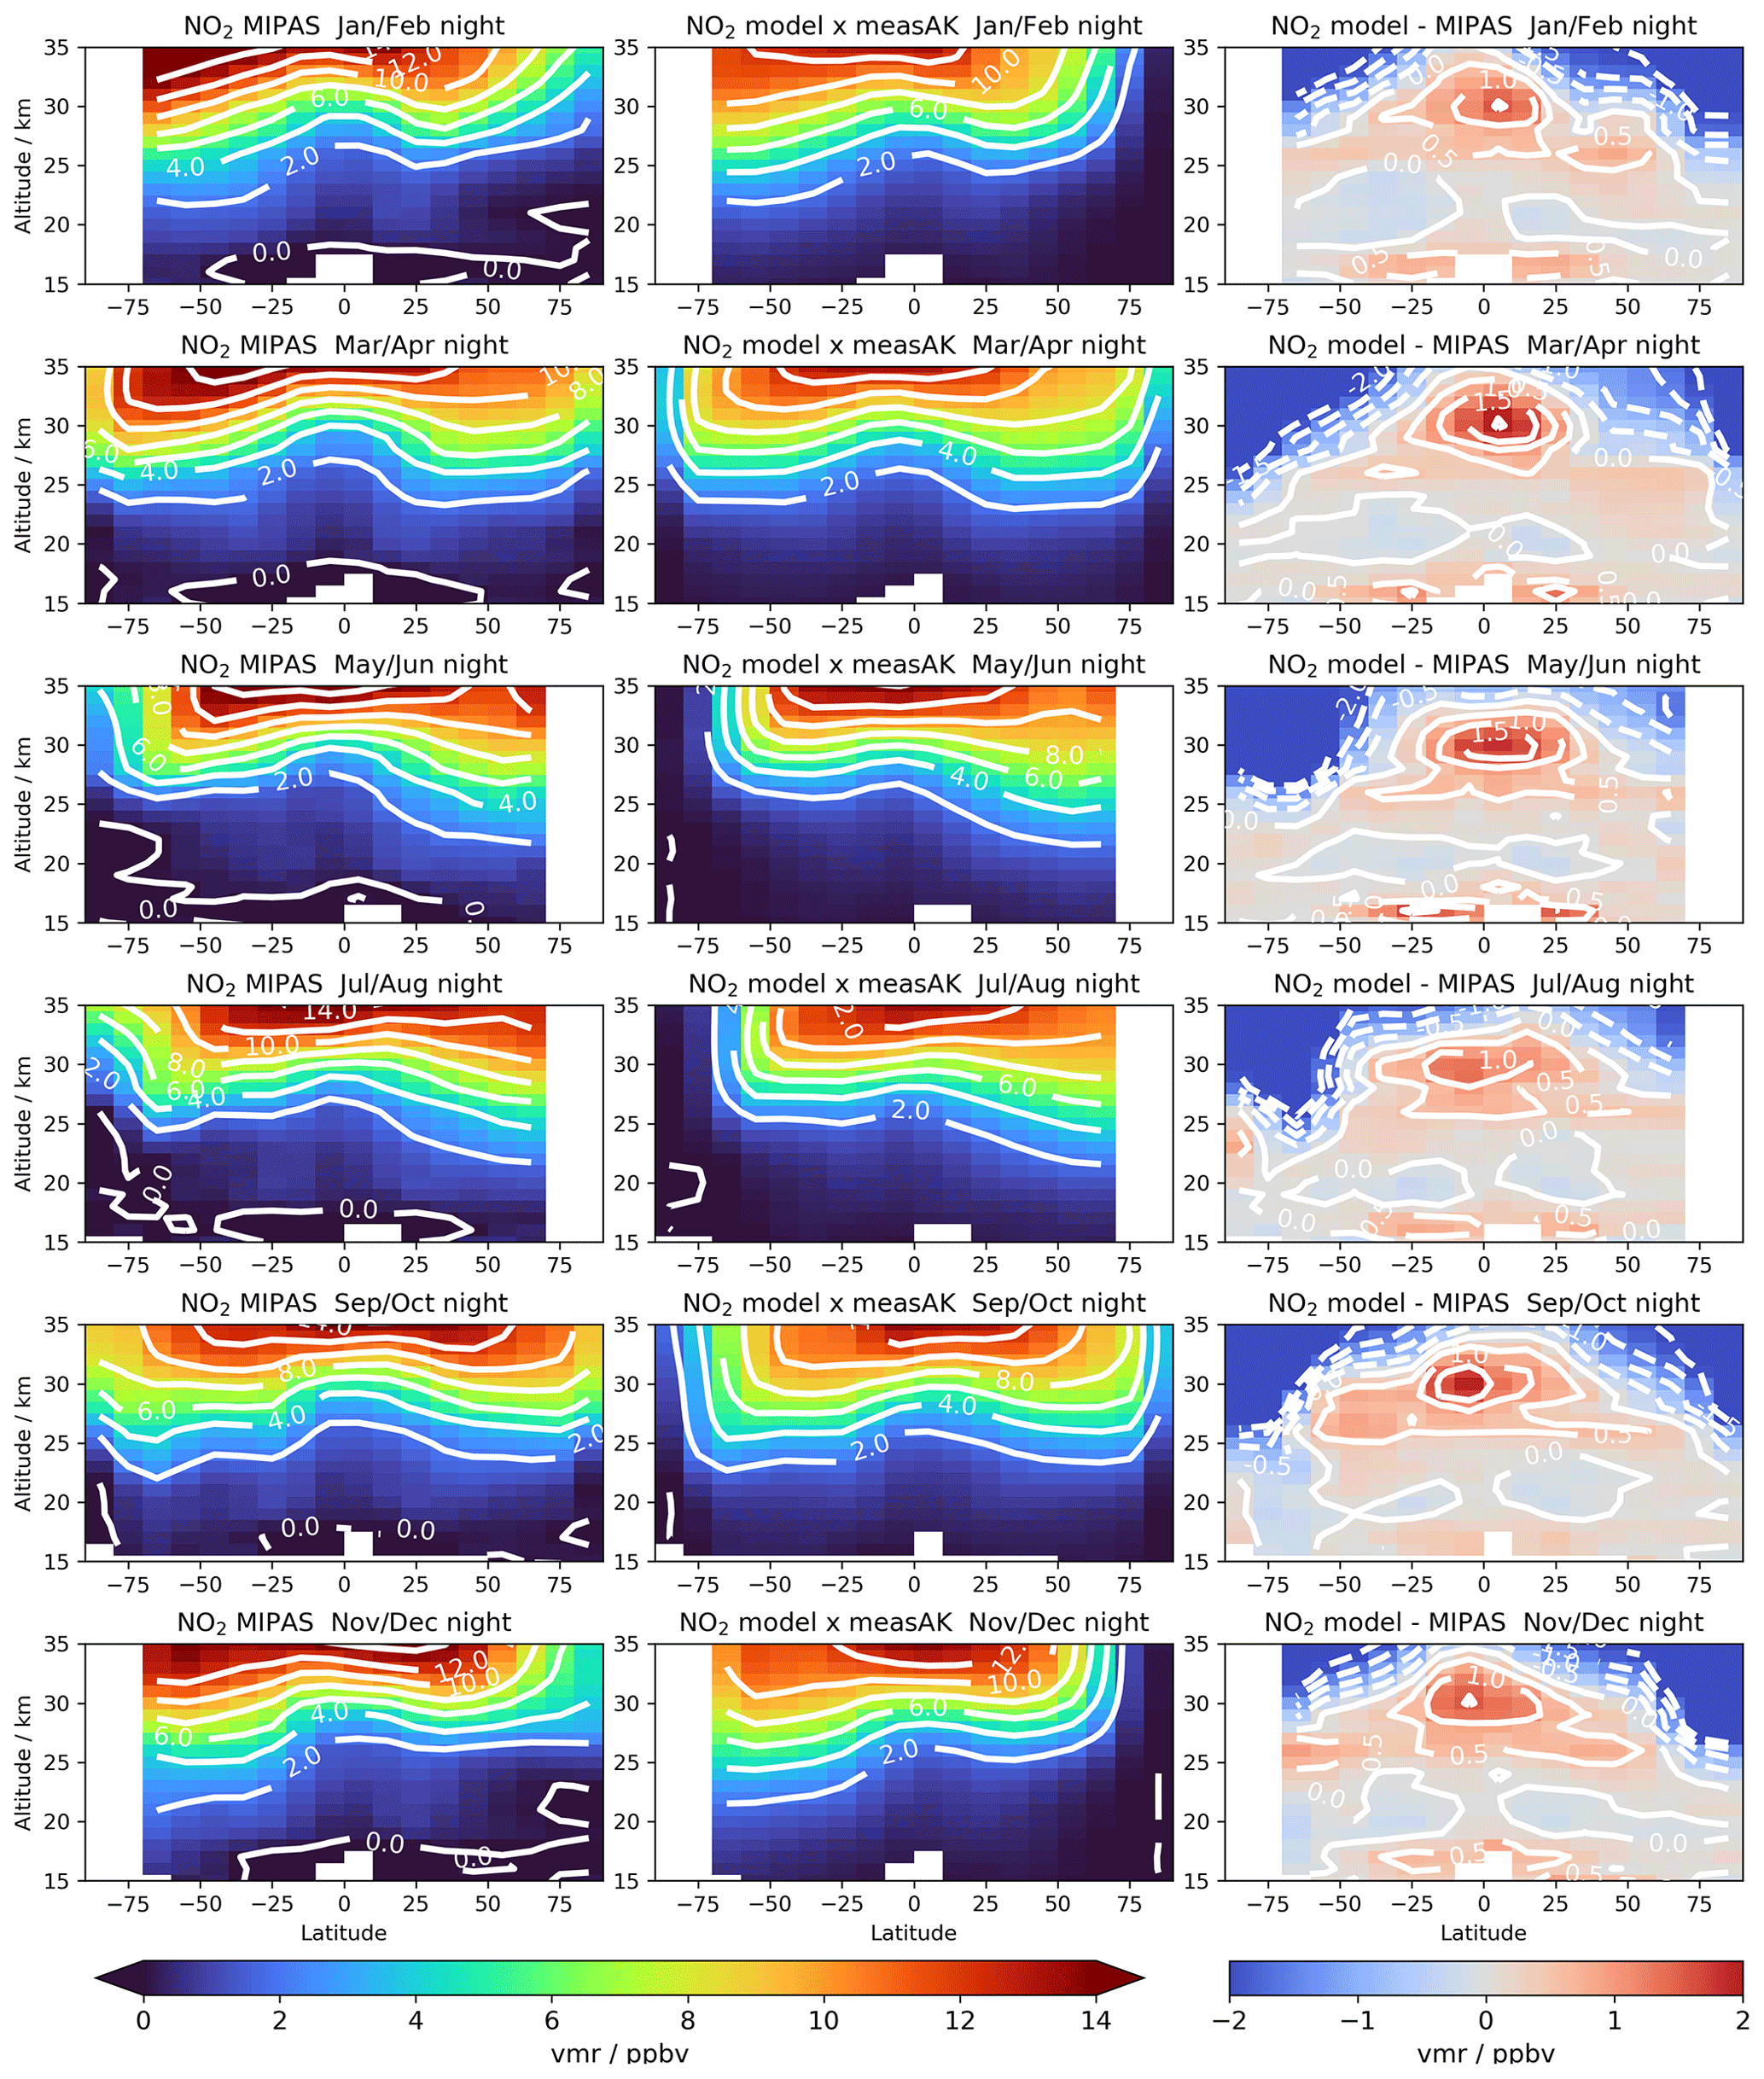
Figure B1 Bimonthly averaged cross sections (altitude versus latitude) of NO2 volume mixing ratios for dark conditions. Left: measurements, middle: model with retrieval averaging kernels applied, right: model minus MIPAS.
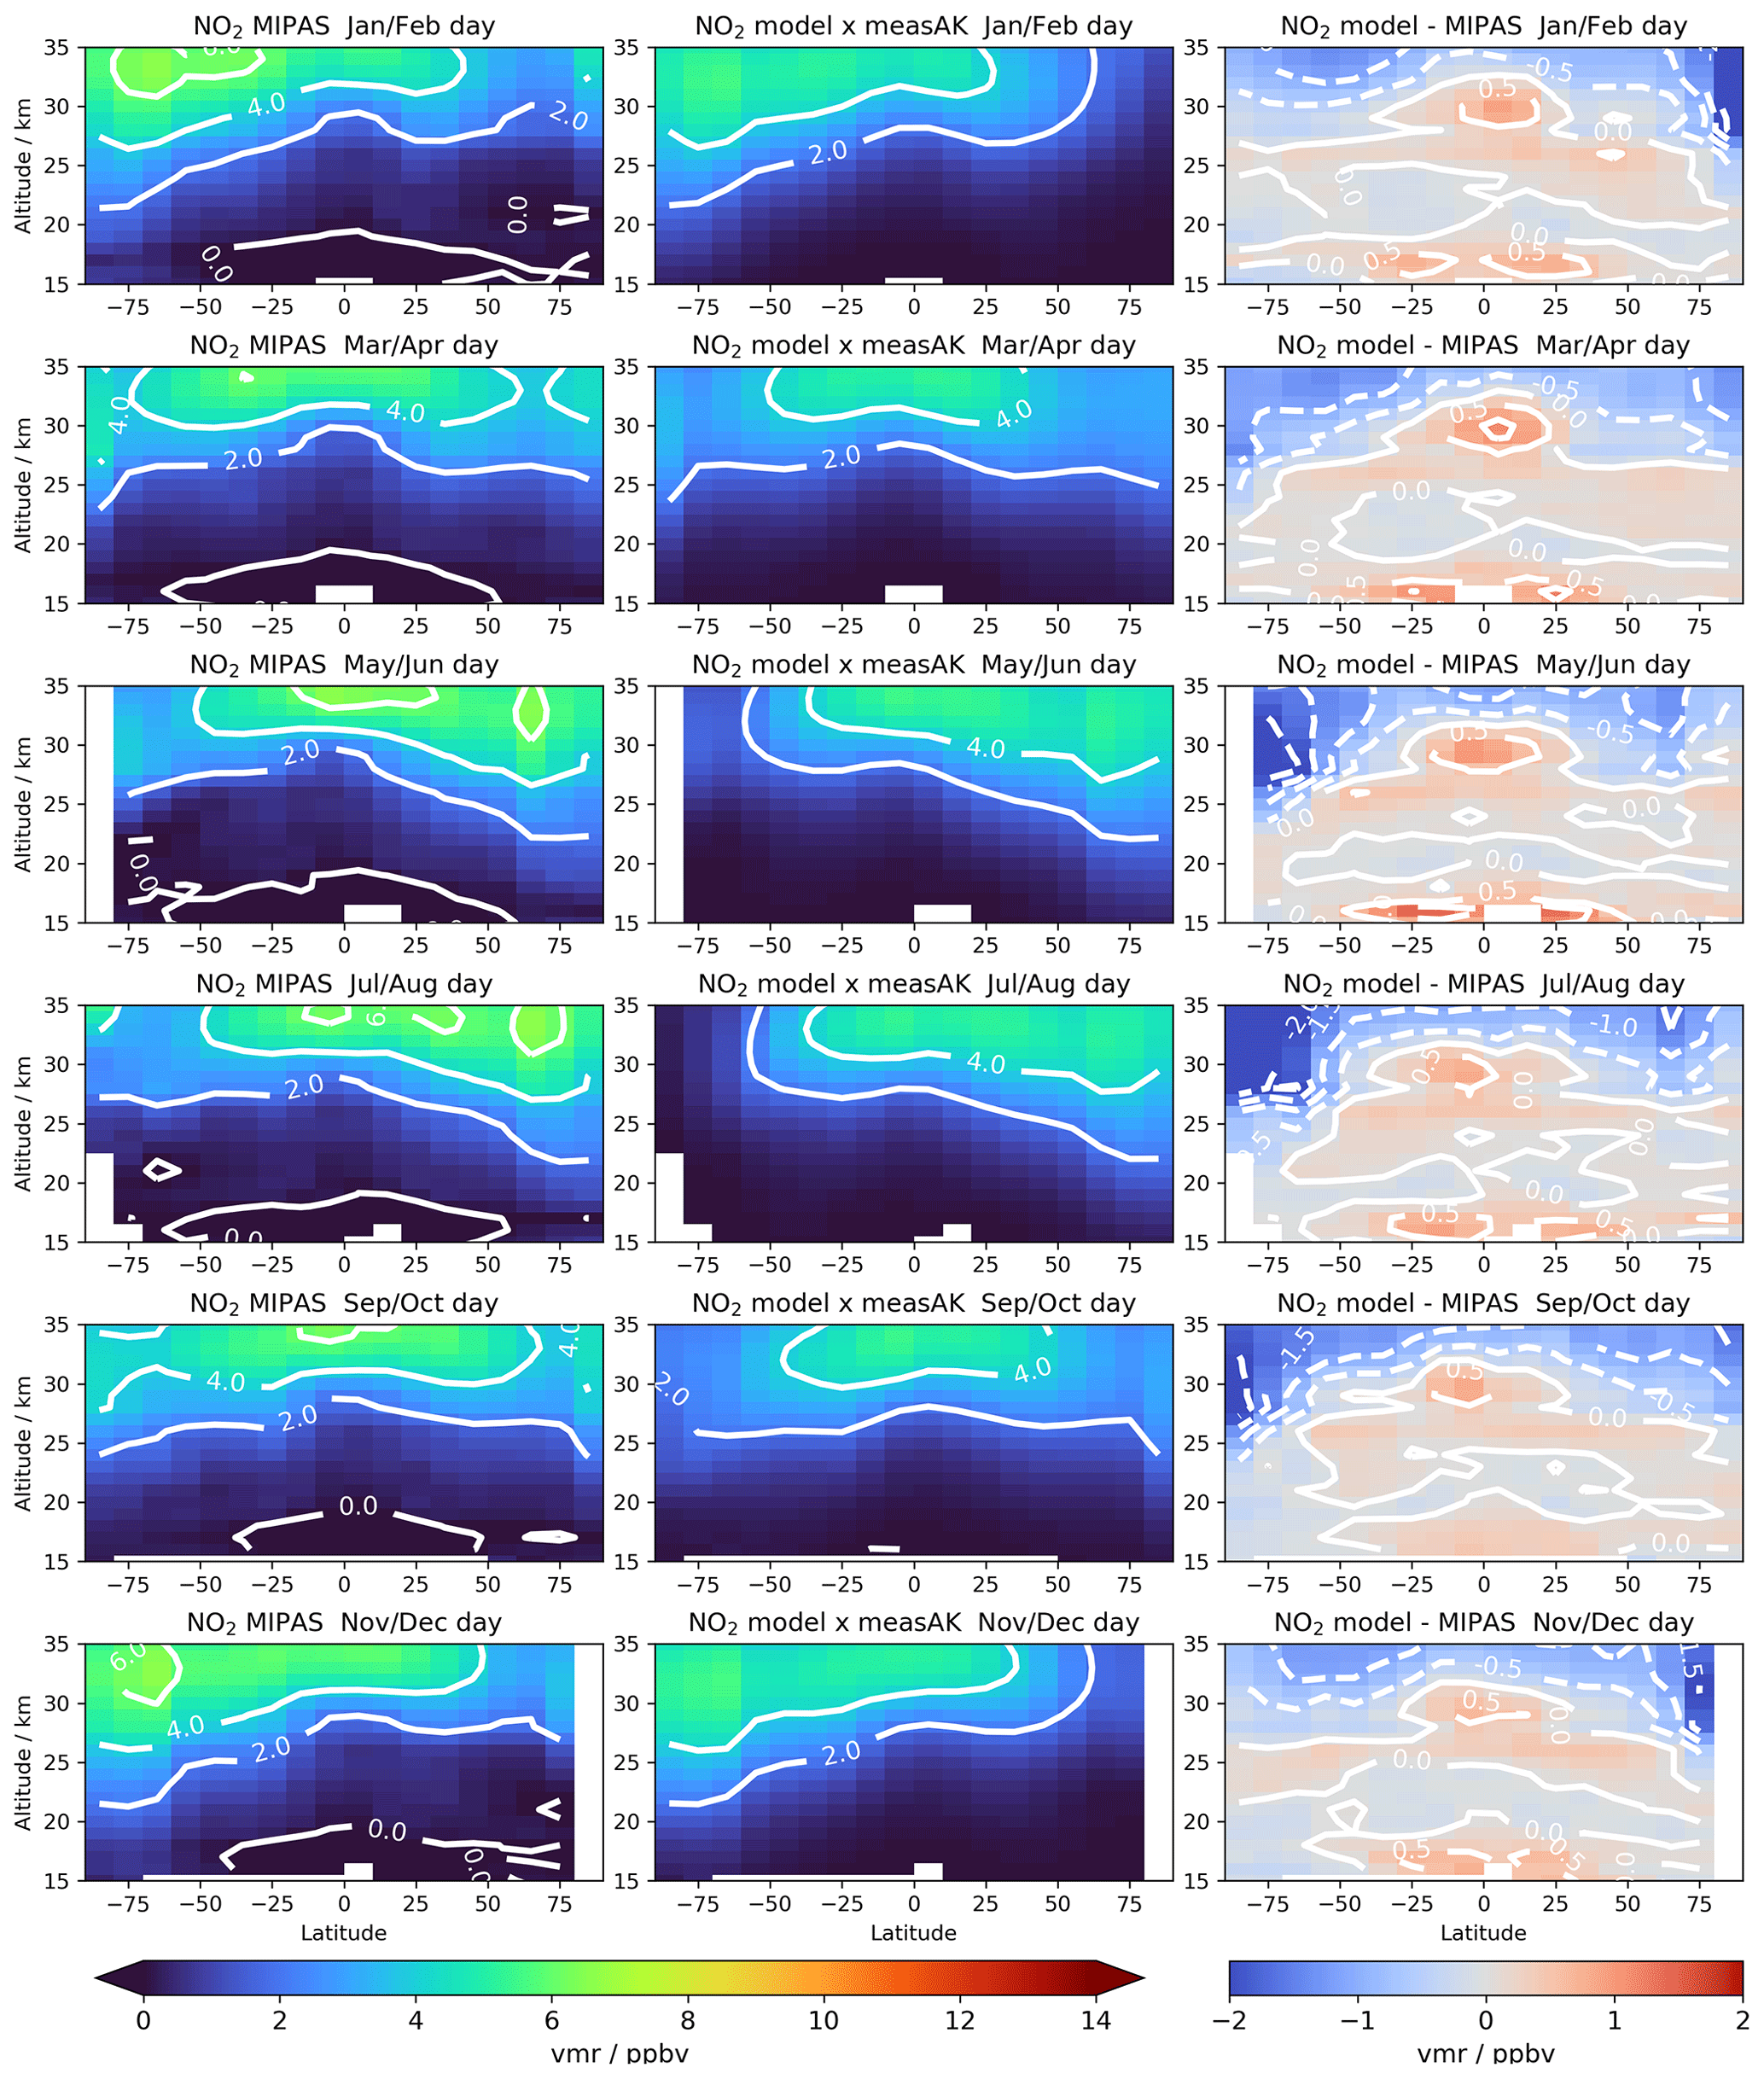

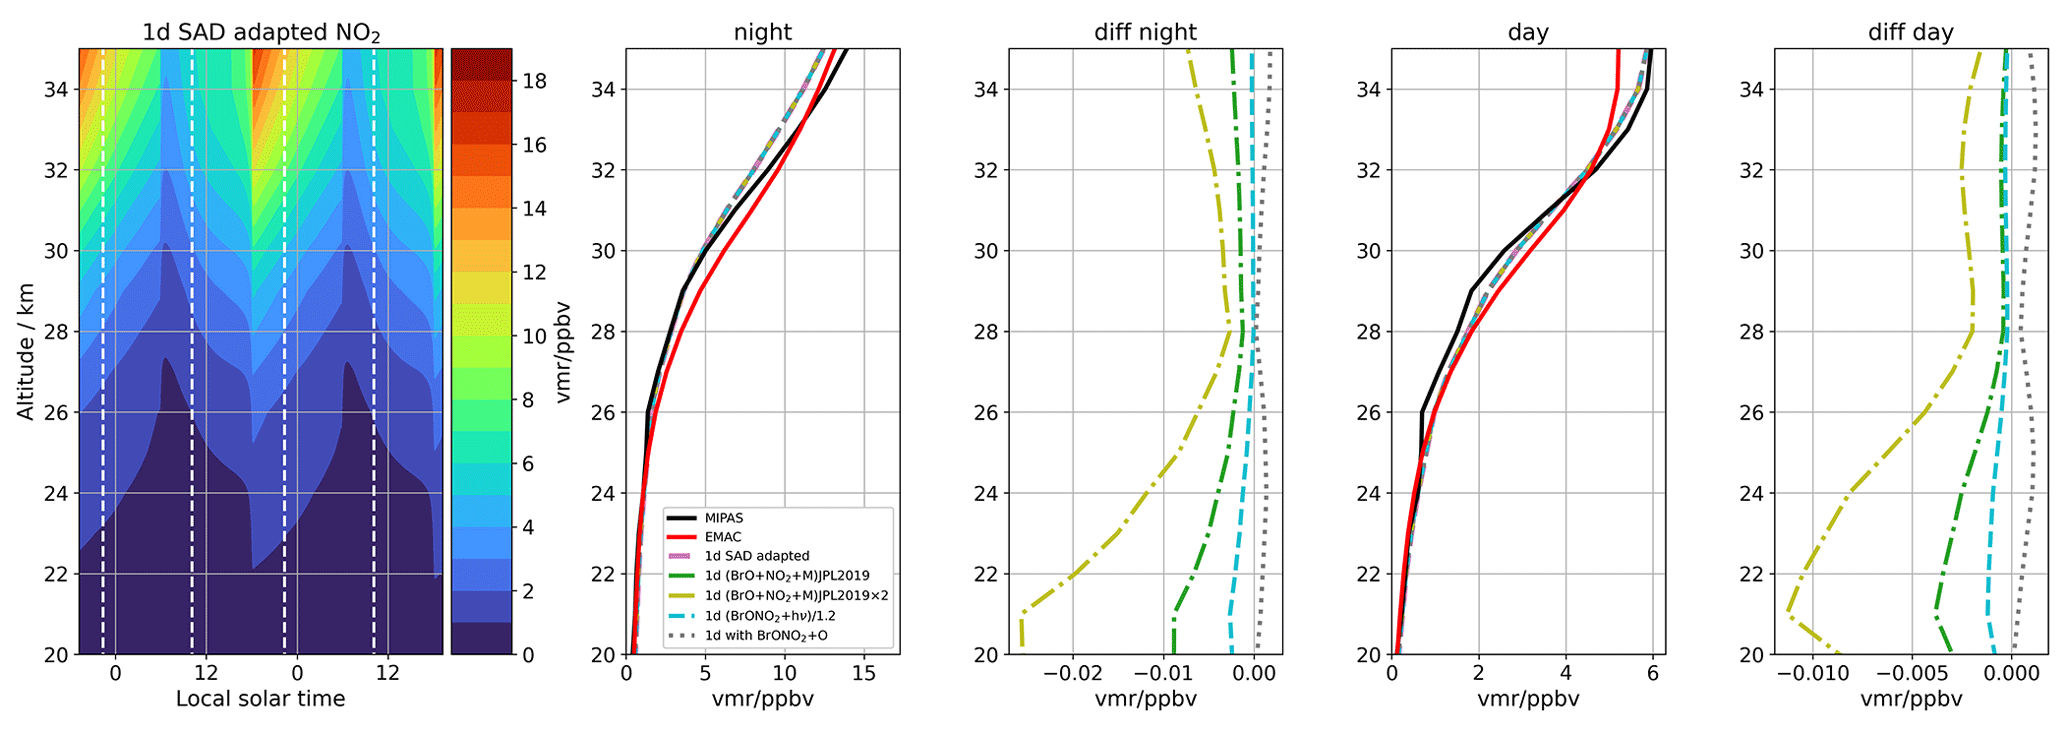
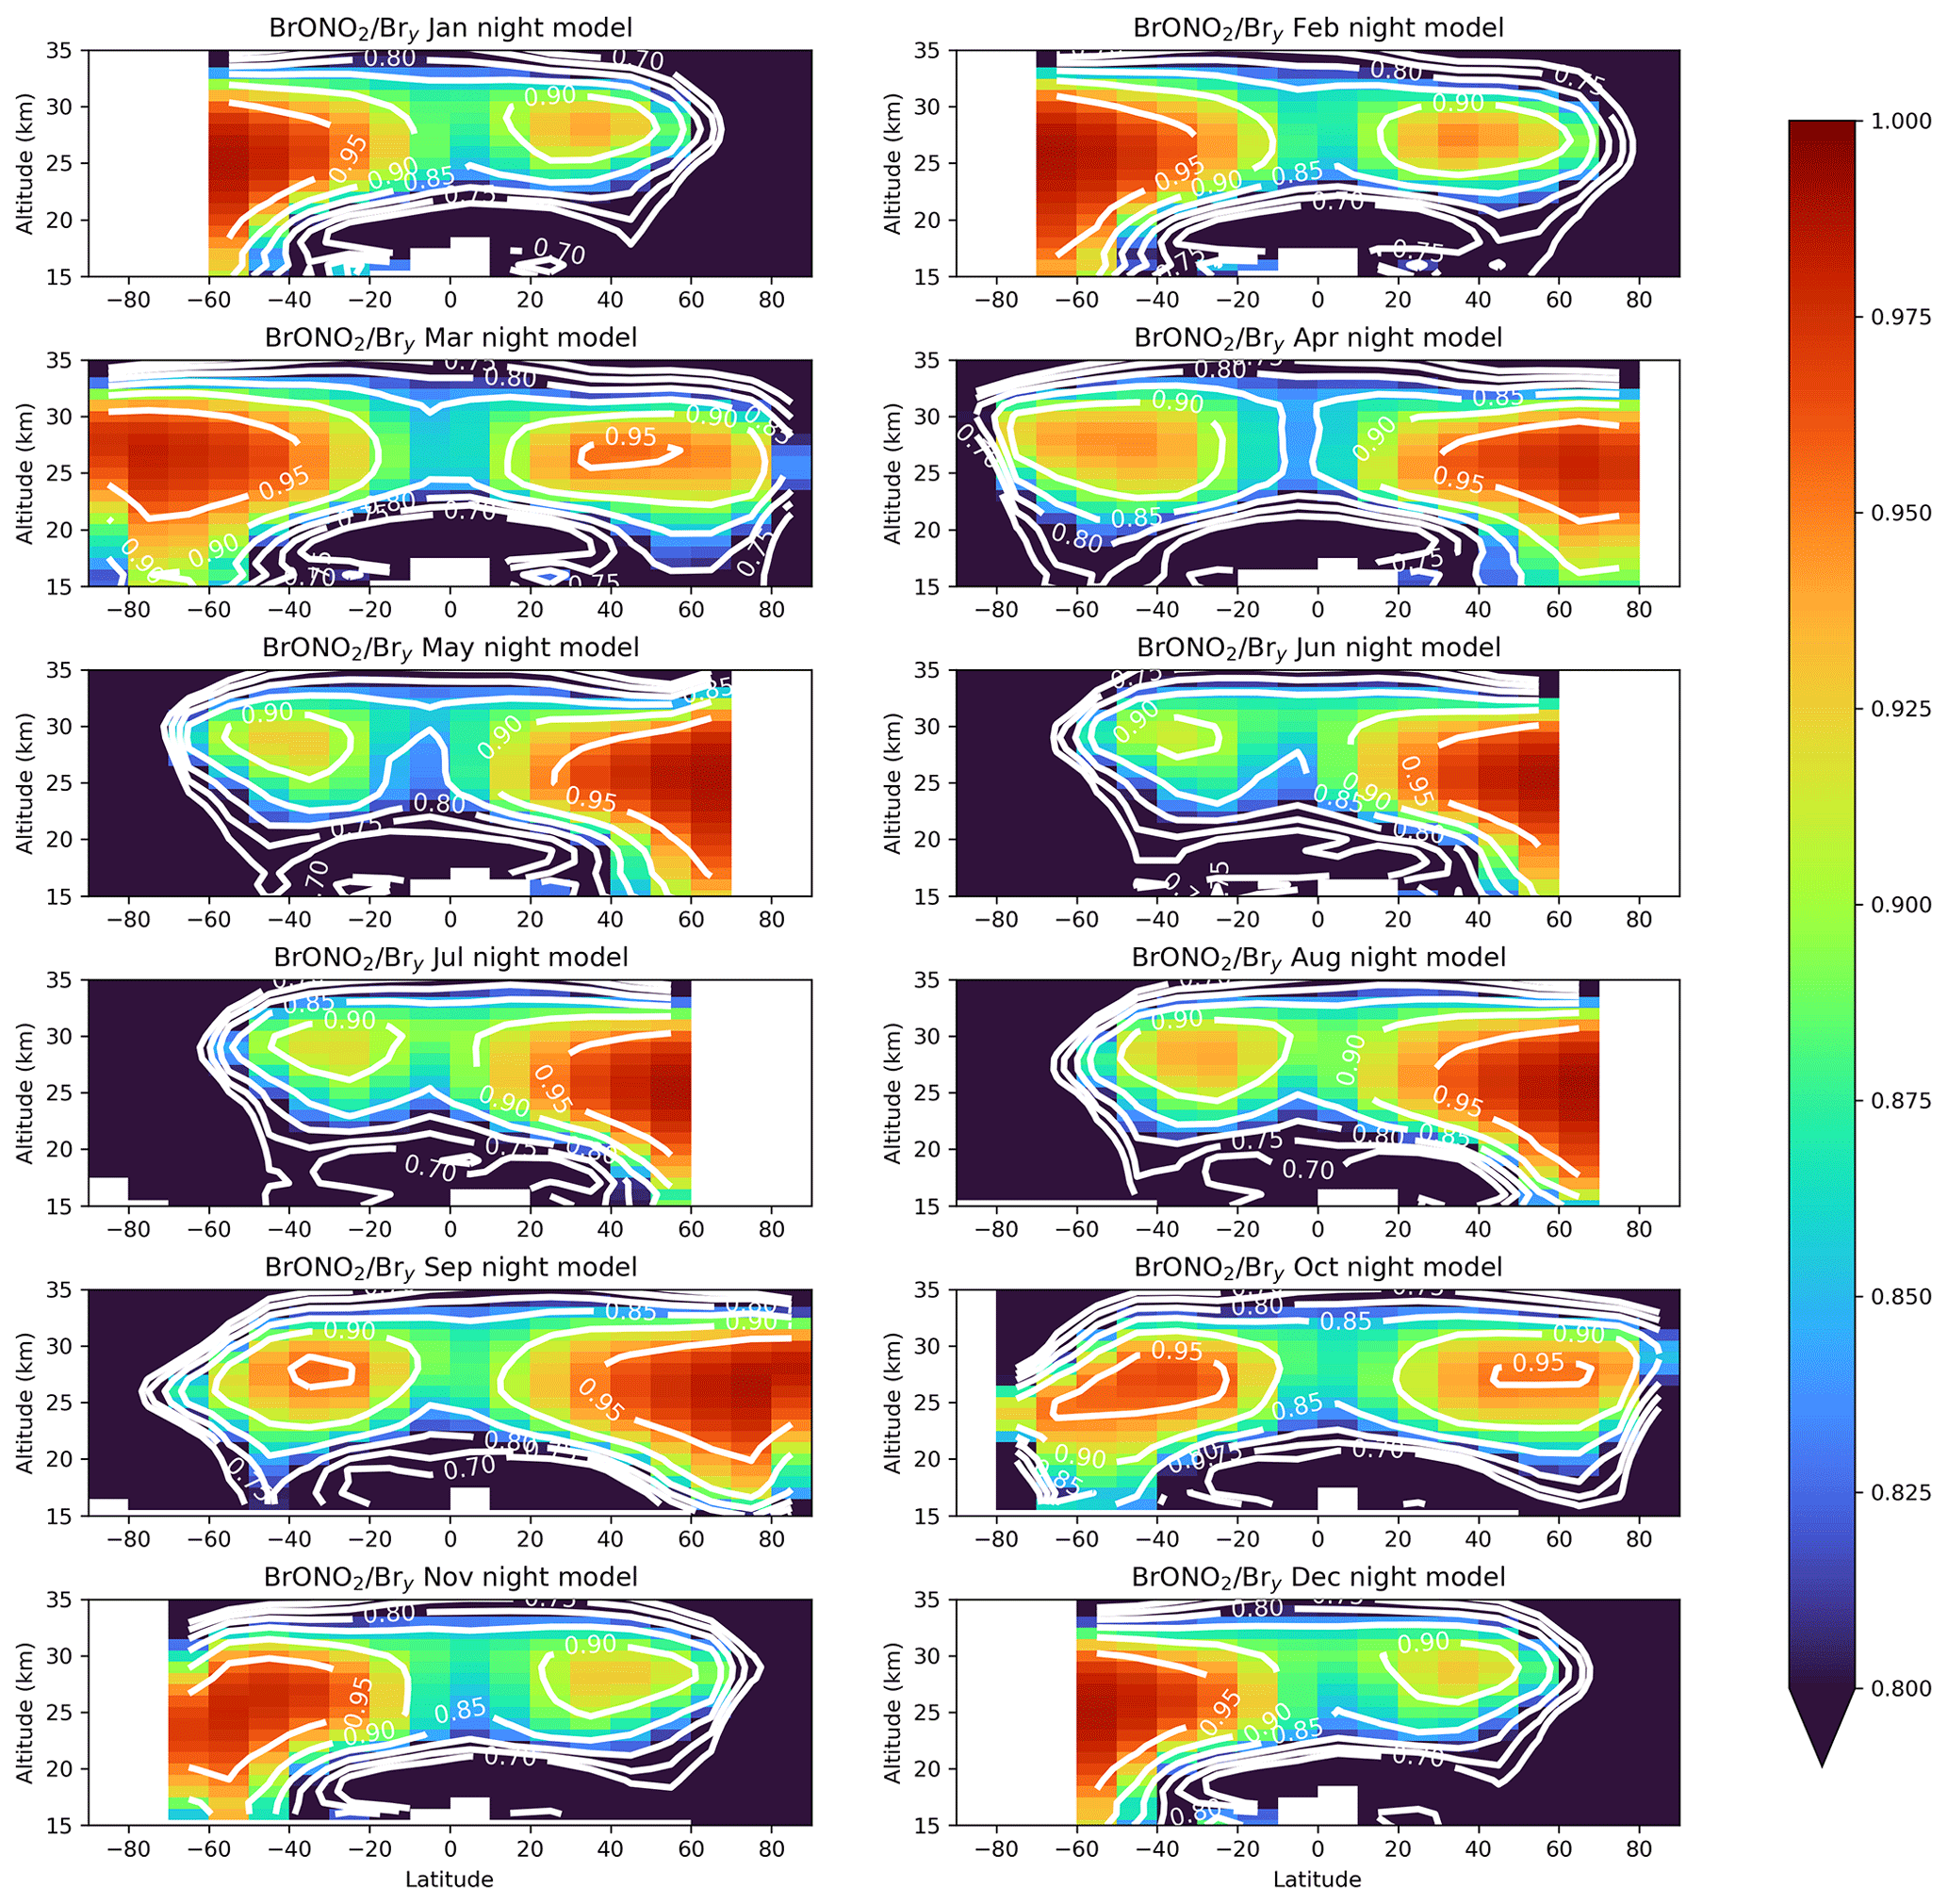
Table D1 Major bromine reaction parameters as used in the EMAC and the 1D baseline model runs compared to the JPL2019 compilation.
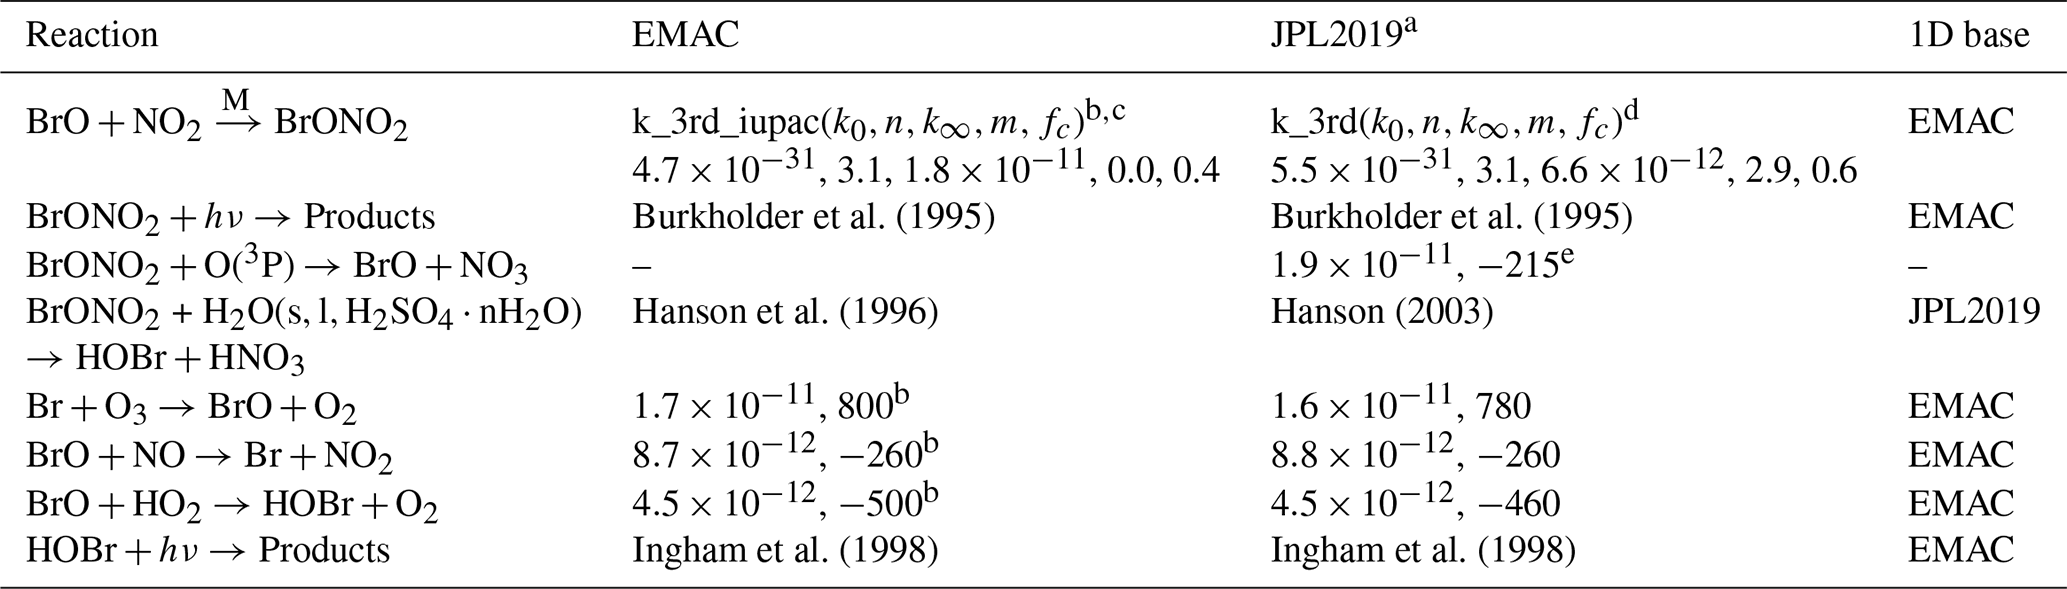
a Burkholder et al. (2019), b Atkinson et al. (2007), c , , , , , d , , , , e A, , .
MIPAS level-1b data are provided by ESA (https://earth.esa.int/web/sppa/mission-performance/esa-missions/envisat/mipas/products-availability/level-1/level1-8.03, last access: 14 December 2021; European Space Agency, 2021). SAGE II data were obtained from the NASA Langley Research Center Atmospheric Science Data Center https://asdc.larc.nasa.gov/project/SAGE%20II/SAGE2_AEROSOL_O3_NO2_H2O_BINARY_V7.0 (last access: 14 December 2021; NASA Langley Research Center, 2021). In situ aerosol data were retrieved from http://www-das.uwyo.edu/~deshler/Data/Aer_Meas_Wy_read_me.htm (last access: 14 December 2021; Deshler, 2021). The MIPAS BrONO2 dataset and model results are available upon request from the author and at the KITopen repository, https://doi.org/10.5445/IR/1000136324 (Höpfner et al., 2021). The MIPAS age-of-air dataset is available upon request from Gabriele Stiller (gabriele.stiller@kit.edu).
The supplement related to this article is available online at: https://doi.org/10.5194/acp-21-18433-2021-supplement.
MH performed the MIPAS data retrieval with input from GW, GS and TvC. JO advised on spectroscopy. OK, RR, BMS, GW, SJ and MH performed and supported simulations with EMAC and the 1D model. FH and GS provided age-of-air data from MIPAS. All the authors contributed to the scientific discussion. MH prepared the manuscript with support from all the co-authors.
At least one of the (co-)authors is a member of the editorial board of Atmospheric Chemistry and Physics. The peer-review process was guided by an independent editor, and the authors also have no other competing interests to declare.
Publisher's note: Copernicus Publications remains neutral with regard to jurisdictional claims in published maps and institutional affiliations.
This article is part of the special issue “IMK–IAA MIPAS version 8 data: retrieval, validation, and application (ACP/AMT inter-journal SI)”. It is not associated with a conference.
Provision of MIPAS level-1b calibrated spectra by ESA and meteorological analysis data by ECMWF is acknowledged. SAGE II satellite and in situ balloon data on aerosol surface area density were obtained from the NASA Langley Research Center Atmospheric Science Data Center and the University of Wyoming, Department of Atmospheric Science (Terry Deshler), respectively. We would like to thank Klaus Pfeilsticker (University of Heidelberg) and Francois Hendrick (Belgian Institute for Space Aeronomy) for providing data on Bry from Fig. 1-16 in Engel et al. (2018). The EMAC simulations were performed on the supercomputer ForHLR funded by the Ministry of Science, Research and the Arts Baden-Württemberg and by the German Federal Ministry of Education and Research. We were supported by the German Federal Ministry of Education and Research through the project “Surface Climate Impacts of Halogen Induced Stratospheric Ozone Changes (SCI-HI)”, grant 01LG1908A, as part of the programme ROMIC-II (“Role of the Middle Atmosphere in Climate”).
This research has been supported by the Bundesministerium für Bildung und Forschung (grant no. 01LG1908A).
The article processing charges for this open-access publication were covered by the Karlsruhe Institute of Technology (KIT).
This paper was edited by Michel Van Roozendael and reviewed by Rafael Pedro Fernandez and one anonymous referee.
Aschmann, J. and Sinnhuber, B.-M.: Contribution of very short-lived substances to stratospheric bromine loading: uncertainties and constraints, Atmos. Chem. Phys., 13, 1203–1219, https://doi.org/10.5194/acp-13-1203-2013, 2013. a
Atkinson, R., Baulch, D. L., Cox, R. A., Crowley, J. N., Hampson, R. F., Hynes, R. G., Jenkin, M. E., Rossi, M. J., and Troe, J.: Evaluated kinetic and photochemical data for atmospheric chemistry: Volume III – gas phase reactions of inorganic halogens, Atmos. Chem. Phys., 7, 981–1191, https://doi.org/10.5194/acp-7-981-2007, 2007. a, b, c
Burkholder, J. B., Ravishankara, A. R., and Solomon, S.: UV/visible and IR absorption cross sections of BrONO2, J. Geophys. Res.-Atmos., 100, 16793, https://doi.org/10.1029/95JD01223, 1995. a, b
Burkholder, J. B., Sander, S. P., Abbatt, J., Barker, J. R., Huie, R. E., Kolb, C. E., Kurylo, M. J., Orkin, V. L., Wilmouth, D. M., and Wine, P. H.: Chemical Kinetics and Photochemical Data for Use in Atmospheric Studies: Evaluation No. 18, vol. 15-10 of JPL Publications, Jet Propulsion Laboratory, Pasadena, available at: http://jpldataeval.jpl.nasa.gov (last access: 14 December 2021), 2015. a, b
Burkholder, J. B., Sander, S. P., Abbatt, J., Barker, J. R., Cappa, C., Crounse, J. D., Dibble, T. S., Huie, R. E., Kolb, C. E., Kurylo, M. J., Orkin, V. L., Percival, C. J., Wilmouth, D. M., and Wine, P. H.: Chemical Kinetics and Photochemical Data for Use in Atmospheric Studies: Evaluation No. 19, vol. 19-5 of JPL Publications, Jet Propulsion Laboratory, Pasadena, available at: http://jpldataeval.jpl.nasa.gov (last access: 14 December 2021), 2019. a, b, c, d, e, f, g, h, i, j, k, l, m, n, o, p
Carroll, M. A., Sanders, R. W., Solomon, S., and Schmeltekopf, A. L.: Visible and near-ultraviolet spectroscopy at McMurdo Station, Antarctica: 6. Observations of BrO, J. Geophys. Res., 94, 16633, https://doi.org/10.1029/JD094iD14p16633, 1989. a
Damadeo, R. P., Zawodny, J. M., Thomason, L. W., and Iyer, N.: SAGE version 7.0 algorithm: application to SAGE II, Atmos. Meas. Tech., 6, 3539–3561, https://doi.org/10.5194/amt-6-3539-2013, 2013. a, b
Dee, D. P., Uppala, S. M., Simmons, A. J., Berrisford, P., Poli, P., Kobayashi, S., Andrae, U., Balmaseda, M. A., Balsamo, G., Bauer, P., Bechtold, P., Beljaars, A. C. M., van de Berg, L., Bidlot, J., Bormann, N., Delsol, C., Dragani, R., Fuentes, M., Geer, A. J., Haimberger, L., Healy, S. B., Hersbach, H., Hólm, E. V., Isaksen, L., Kållberg, P., Köhler, M., Matricardi, M., McNally, A. P., Monge-Sanz, B. M., Morcrette, J.-J., Park, B.-K., Peubey, C., de Rosnay, P., Tavolato, C., Thépaut, J.-N., and Vitart, F.: The ERA-Interim reanalysis: configuration and performance of the data assimilation system, Q. J. Roy. Meteor. Soc., 137, 553–597, https://doi.org/10.1002/qj.828, 2011. a
Deshler, T.: University of Wyoming stratospheric aerosol size distributions, University of Wyoming [data set], available at: http://www-das.uwyo.edu/~deshler/Data/Aer_Meas_Wy_read_me.htm, last access: 14 December 2021. a
Deshler, T., Luo, B., Kovilakam, M., Peter, T., and Kalnajs, L. E.: Retrieval of aerosol size distributions from in situ particle counter measurements: Instrument counting efficiency and comparisons with satellite measurements, J. Geophys. Res.-Atmos., 124, 5058–5087, https://doi.org/10.1029/2018JD029558, 2019. a
Dorf, M., Bösch, H., Butz, A., Camy-Peyret, C., Chipperfield, M. P., Engel, A., Goutail, F., Grunow, K., Hendrick, F., Hrechanyy, S., Naujokat, B., Pommereau, J.-P., Van Roozendael, M., Sioris, C., Stroh, F., Weidner, F., and Pfeilsticker, K.: Balloon-borne stratospheric BrO measurements: comparison with Envisat/SCIAMACHY BrO limb profiles, Atmos. Chem. Phys., 6, 2483–2501, https://doi.org/10.5194/acp-6-2483-2006, 2006a. a, b, c
Dorf, M., Butler, J. H., Butz, A., Camy-Peyret, C., Chipperfield, M. P., Kritten, L., Montzka, S. A., Simmes, B., Weidner, F., and Pfeilsticker, K.: Long-term observations of stratospheric bromine reveal slow down in growth, Geophys. Res. Lett., 33, 4199, https://doi.org/10.1029/2006GL027714, 2006b. a, b
Dorf, M., Butz, A., Camy-Peyret, C., Chipperfield, M. P., Kritten, L., and Pfeilsticker, K.: Bromine in the tropical troposphere and stratosphere as derived from balloon-borne BrO observations, Atmos. Chem. Phys., 8, 7265–7271, https://doi.org/10.5194/acp-8-7265-2008, 2008. a, b, c
Engel, A., Rigby, M., Burkholder, J., Fernandez, R., Froidevaux, L., Hall, B. D., Hossaini, R., Saito, T., Vollmer, M. K., and Yao, B.: Update on Ozone-Depleting Substances (ODSs) and Other Gases of Interest to the Montreal Protocol, in: Scientific Assessment of Ozone Depletion: 2018, Global Ozone Research and Monitoring Project–Report No. 58, World Meteorological Organization, Geneva, Switzerland, 2018. a, b, c, d, e, f, g, h, i
European Space Agency: MIPAS Level 1b IPF version 8.03, European Space Agency [data set], available at: https://earth.esa.int/web/sppa/mission-performance/esa-missions/envisat/mipas/products-availability/level-1/level1-8.03, last access: 14 December 2021. a
Eyring, V., Lamarque, J.-F., Hess, P., Arfeuille, F., Bowman, K., Chipperfield, M. P., Duncan, B., Fiore, A., Gettelman, A., Giorgetta, M. A., Granier, C., Hegglin, M., Kinnison, D., Kunze, M., Langematz, U., Luo, B., Martin, R., Matthes, K., Newman, P. A., Peter, T., Robock, A., Ryerson, A., Saiz-Lopez, A., Salawitch, R., Schultz, M., Shepherd, T. G., Shindell, D., Stähelin, J., Tegtmeier, S., Thomason, L., Tilmes, S., Vernier, J.-P., Waugh, D. W., and Young, P.: Overview of IGAC/SPARC Chemistry-Climate Model Initiative (CCMI) Community Simulations in Support of Upcoming Ozone and Climate Assessments, SPARC Newsletter, 48–66, available at: http://www.sparc-climate.org/fileadmin/customer/6_Publications/Newsletter_PDF/40_SPARCnewsletter_Jan2013_web.pdf (last access: 14 December 2021), 2013. a
Falk, S., Sinnhuber, B.-M., Krysztofiak, G., Jöckel, P., Graf, P., and Lennartz, S. T.: Brominated VSLS and their influence on ozone under a changing climate, Atmos. Chem. Phys., 17, 11313–11329, https://doi.org/10.5194/acp-17-11313-2017, 2017. a
Fischer, H., Birk, M., Blom, C., Carli, B., Carlotti, M., von Clarmann, T., Delbouille, L., Dudhia, A., Ehhalt, D., Endemann, M., Flaud, J. M., Gessner, R., Kleinert, A., Koopman, R., Langen, J., López-Puertas, M., Mosner, P., Nett, H., Oelhaf, H., Perron, G., Remedios, J., Ridolfi, M., Stiller, G., and Zander, R.: MIPAS: an instrument for atmospheric and climate research, Atmos. Chem. Phys., 8, 2151–2188, https://doi.org/10.5194/acp-8-2151-2008, 2008. a
Fish, D. J., Jones, R. L., and Strong, E. K.: Midlatitude observations of the diurnal variation of stratospheric BrO, J. Geophys. Res.-Atmos., 100, 18863, https://doi.org/10.1029/95JD01944, 1995. a
Friedl, R. R., May, R. D., and Duxbury, G.: The ν6, ν7, ν8, and ν10 Bands of HO2NO2, J. Mol. Spectrosc., 165, 481–493, https://doi.org/10.1006/jmsp.1994.1151, 1994. a
Funke, B., López-Puertas, M., Gil-López, S., von Clarmann, T., Stiller, G. P., Fischer, H., and Kellmann, S.: Downward transport of upper atmospheric NOx into the polar stratosphere and lower mesosphere during the Antarctic 2003 and Arctic 2002/2003 winters, J. Geophys. Res.-Atmos., 110, D24308, https://doi.org/10.1029/2005JD006463, 2005. a
Funke, B., López-Puertas, M., Stiller, G. P., and von Clarmann, T.: Mesospheric and stratospheric NOy produced by energetic particle precipitation during 2002–2012, J. Geophys. Res.-Atmos., 119, 4429–4446, https://doi.org/10.1002/2013JD021404, 2014. a
Gordon, I. E., Rothman, L. S., Hill, C., Kochanov, R. V., Tan, Y., Bernath, P. F., Birk, M., Boudon, V., Campargue, A., Chance, K. V., Drouin, B. J., Flaud, J.-M., Gamache, R. R., Hodges, J. T., Jacquemart, D., Perevalov, V. I., Perrin, A., Shine, K. P., Smith, M.-A., Tennyson, J., Toon, G. C., Tran, H., Tyuterev, V. G., Barbe, A., Császár, A. G., Devi, V. M., Furtenbacher, T., Harrison, J. J., Hartmann, J.-M., Jolly, A., Johnson, T. J., Karman, T., Kleiner, I., Kyuberis, A. A., Loos, J., Lyulin, O. M., Massie, S. T., Mikhailenko, S. N., Moazzen-Ahmadi, N., Müller, H., Naumenko, O. V., Nikitin, A. V., Polyansky, O. L., Rey, M., Rotger, M., Sharpe, S. W., Sung, K., Starikova, E., Tashkun, S. A., Auwera, J. V., Wagner, G., Wilzewski, J., Wcisło, P., Yu, S., and Zak, E. J.: The HITRAN2016 molecular spectroscopic database, J. Quant. Spectrosc. Ra., 203, 3–69, https://doi.org/10.1016/j.jqsrt.2017.06.038, 2017. a, b
Günther, A., Höpfner, M., Sinnhuber, B.-M., Griessbach, S., Deshler, T., von Clarmann, T., and Stiller, G.: MIPAS observations of volcanic sulfate aerosol and sulfur dioxide in the stratosphere, Atmos. Chem. Phys., 18, 1217–1239, https://doi.org/10.5194/acp-18-1217-2018, 2018. a, b
Haenel, F. J., Stiller, G. P., von Clarmann, T., Funke, B., Eckert, E., Glatthor, N., Grabowski, U., Kellmann, S., Kiefer, M., Linden, A., and Reddmann, T.: Reassessment of MIPAS age of air trends and variability, Atmos. Chem. Phys., 15, 13161–13176, https://doi.org/10.5194/acp-15-13161-2015, 2015. a
Hanson, D. R.: Reactivity of BrONO2 and HOBr on sulfuric acid solutions at low temperatures, J. Geophys. Res., 108, 14009, https://doi.org/10.1029/2002JD002519, 2003. a, b, c
Hanson, D. R., Ravishankara, A. R., and Lovejoy, E. R.: Reaction of BrONO2 with H2O on submicron sulfuric acid aerosol and the implications for the lower stratosphere, J. Geophys. Res.-Atmos., 101, 9063–9069, https://doi.org/10.1029/96JD00347, 1996. a
Harder, H., Bösch, H., Camy-Peyret, C., Chipperfield, M. P., Fitzenberger, R., Payan, S., Perner, D., Platt, U., Sinnhuber, B.-M., and Pfeilsticker, K.: Comparison of measured and modeled stratospheric BrO: Implications for the total amount of stratospheric bromine, Geophys. Res. Lett., 27, 3695–3698, https://doi.org/10.1029/1999GL011215, 2000. a, b
Hendrick, F., Johnston, P. V., de Mazière, M., Fayt, C., Hermans, C., Kreher, K., Theys, N., Thomas, A., and van Roozendael, M.: One-decade trend analysis of stratospheric BrO over Harestua (60∘ N) and Lauder (45∘ S) reveals a decline, Geophys. Res. Lett., 35, 1909, https://doi.org/10.1029/2008GL034154, 2008. a, b
Höpfner, M., Orphal, J., von Clarmann, T., Stiller, G., and Fischer, H.: Stratospheric BrONO2 observed by MIPAS, Atmos. Chem. Phys., 9, 1735–1746, https://doi.org/10.5194/acp-9-1735-2009, 2009. a, b, c, d, e, f, g, h
Höpfner, M., Glatthor, N., Grabowski, U., Kellmann, S., Kiefer, M., Linden, A., Orphal, J., Stiller, G., von Clarmann, T., Funke, B., and Boone, C. D.: Sulfur dioxide (SO2) as observed by MIPAS/Envisat: temporal development and spatial distribution at 15–45 km altitude, Atmos. Chem. Phys., 13, 10405–10423, https://doi.org/10.5194/acp-13-10405-2013, 2013. a
Höpfner, M., Volkamer, R., Grabowski, U., Grutter, M., Orphal, J., Stiller, G., von Clarmann, T., and Wetzel, G.: First detection of ammonia (NH3) in the Asian summer monsoon upper troposphere, Atmos. Chem. Phys., 16, 14357–14369, https://doi.org/10.5194/acp-16-14357-2016, 2016. a
Höpfner, M., Kirner, O., Wetzel, G., Sinnhuber, B.-M., Haenel, F., Johansson, S., Orphal, J., Ruhnke, R., Stiller, G., and von Clarmann, T.: The MIPAS global climatology of BrONO2 2002–2012 in comparison to EMAC model data, KIT [data set], https://doi.org/10.5445/IR/1000136324, 2021. a
Ingham, T., Bauer, D., Landgraf, J., and Crowley, J. N.: Ultraviolet−Visible Absorption Cross Sections of Gaseous HOBr, J. Phys. Chem. A, 102, 3293–3298, https://doi.org/10.1021/jp980272c, 1998. a, b
Jöckel, P., Kerkweg, A., Pozzer, A., Sander, R., Tost, H., Riede, H., Baumgaertner, A., Gromov, S., and Kern, B.: Development cycle 2 of the Modular Earth Submodel System (MESSy2), Geosci. Model Dev., 3, 717–752, https://doi.org/10.5194/gmd-3-717-2010, 2010. a
Jöckel, P., Tost, H., Pozzer, A., Kunze, M., Kirner, O., Brenninkmeijer, C. A. M., Brinkop, S., Cai, D. S., Dyroff, C., Eckstein, J., Frank, F., Garny, H., Gottschaldt, K.-D., Graf, P., Grewe, V., Kerkweg, A., Kern, B., Matthes, S., Mertens, M., Meul, S., Neumaier, M., Nützel, M., Oberländer-Hayn, S., Ruhnke, R., Runde, T., Sander, R., Scharffe, D., and Zahn, A.: Earth System Chemistry integrated Modelling (ESCiMo) with the Modular Earth Submodel System (MESSy) version 2.51, Geosci. Model Dev., 9, 1153–1200, https://doi.org/10.5194/gmd-9-1153-2016, 2016. a
Keber, T., Bönisch, H., Hartick, C., Hauck, M., Lefrancois, F., Obersteiner, F., Ringsdorf, A., Schohl, N., Schuck, T., Hossaini, R., Graf, P., Jöckel, P., and Engel, A.: Bromine from short-lived source gases in the extratropical northern hemispheric upper troposphere and lower stratosphere (UTLS), Atmos. Chem. Phys., 20, 4105–4132, https://doi.org/10.5194/acp-20-4105-2020, 2020. a
Kirner, O., Ruhnke, R., Buchholz-Dietsch, J., Jöckel, P., Brühl, C., and Steil, B.: Simulation of polar stratospheric clouds in the chemistry-climate-model EMAC via the submodel PSC, Geosci. Model Dev., 4, 169–182, https://doi.org/10.5194/gmd-4-169-2011, 2011. a
Klobas, J. E., Weisenstein, D. K., Salawitch, R. J., and Wilmouth, D. M.: Reformulating the bromine alpha factor and equivalent effective stratospheric chlorine (EESC): evolution of ozone destruction rates of bromine and chlorine in future climate scenarios, Atmos. Chem. Phys., 20, 9459–9471, https://doi.org/10.5194/acp-20-9459-2020, 2020. a
Koenig, T. K., Volkamer, R., Baidar, S., Dix, B., Wang, S., Anderson, D. C., Salawitch, R. J., Wales, P. A., Cuevas, C. A., Fernandez, R. P., Saiz-Lopez, A., Evans, M. J., Sherwen, T., Jacob, D. J., Schmidt, J., Kinnison, D., Lamarque, J.-F., Apel, E. C., Bresch, J. C., Campos, T., Flocke, F. M., Hall, S. R., Honomichl, S. B., Hornbrook, R., Jensen, J. B., Lueb, R., Montzka, D. D., Pan, L. L., Reeves, J. M., Schauffler, S. M., Ullmann, K., Weinheimer, A. J., Atlas, E. L., Donets, V., Navarro, M. A., Riemer, D., Blake, N. J., Chen, D., Huey, L. G., Tanner, D. J., Hanisco, T. F., and Wolfe, G. M.: BrO and inferred Bry profiles over the western Pacific: relevance of inorganic bromine sources and a Bry minimum in the aged tropical tropopause layer, Atmos. Chem. Phys., 17, 15245–15270, https://doi.org/10.5194/acp-17-15245-2017, 2017. a
Kovalenko, L. J., Livesey, N. L., Salawitch, R. J., Camy-Peyret, C., Chipperfield, M. P., Cofield, R. E., Dorf, M., Drouin, B. J., Froidevaux, L., Fuller, R. A., Goutail, F., Jarnot, R. F., Jucks, K., Knosp, B. W., Lambert, A., MacKenzie, I. A., Pfeilsticker, K., Pommereau, J.-P., Read, W. G., Santee, M. L., Schwartz, M. J., Snyder, W. V., Stachnik, R., Stek, P. C., Wagner, P. A., and Waters, J. W.: Validation of Aura Microwave Limb Sounder BrO observations in the stratosphere, J. Geophys. Res., 112, 6154, https://doi.org/10.1029/2007JD008817, 2007. a
Kreycy, S., Camy-Peyret, C., Chipperfield, M. P., Dorf, M., Feng, W., Hossaini, R., Kritten, L., Werner, B., and Pfeilsticker, K.: Atmospheric test of the J(BrONO2) ratio: implications for total stratospheric Bry and bromine-mediated ozone loss, Atmos. Chem. Phys., 13, 6263–6274, https://doi.org/10.5194/acp-13-6263-2013, 2013. a, b, c
Lary, D. J.: Gas phase atmospheric bromine photochemistry, J. Geophys. Res.-Atmos., 101, 1505–1516, https://doi.org/10.1029/95JD02463, 1996. a
Lary, D. J.: Catalytic destruction of stratospheric ozone, J. Geophys. Res.-Atmos., 102, 21515–21526, https://doi.org/10.1029/97JD00912, 1997. a
Livesey, N. J., Kovalenko, L. J., Salawitch, R. J., MacKenzie, I. A., Chipperfield, M. P., Read, W. G., Jarnot, R. F., and Waters, J. W.: EOS Microwave Limb Sounder observations of upper stratospheric BrO: Implications for total bromine, Geophys. Res. Lett., 33, 1781, https://doi.org/10.1029/2006GL026930, 2006. a
May, R. D. and Friedl, R. R.: Integrated band intensities of HO2NO2 at 220 K, J. Quant. Spectrosc. Ra., 50, 257–266, https://doi.org/10.1016/0022-4073(93)90076-T, 1993. a
McLinden, C. A., Haley, C. S., Lloyd, N. D., Hendrick, F., Rozanov, A., Sinnhuber, B.-M., Goutail, F., Degenstein, D. A., Llewellyn, E. J., Sioris, C. E., van Roozendael, M., Pommereau, J. P., Lotz, W., and Burrows, J. P.: Odin/OSIRIS observations of stratospheric BrO: Retrieval methodology, climatology, and inferred Bry, J. Geophys. Res., 115, 4199, https://doi.org/10.1029/2009JD012488, 2010. a
Meinshausen, M., Smith, S. J., Calvin, K., Daniel, J. S., Kainuma, M. L. T., Lamarque, J.-F., Matsumoto, K., Montzka, S. A., Raper, S. C. B., Riahi, K., Thomson, A., Velders, G. J. M., and van Vuuren, D. P.: The RCP greenhouse gas concentrations and their extensions from 1765 to 2300, Climatic Change, 109, 213–241, https://doi.org/10.1007/s10584-011-0156-z, 2011. a
Millán, L., Livesey, N., Read, W., Froidevaux, L., Kinnison, D., Harwood, R., MacKenzie, I. A., and Chipperfield, M. P.: New Aura Microwave Limb Sounder observations of BrO and implications for Bry, Atmos. Meas. Tech., 5, 1741–1751, https://doi.org/10.5194/amt-5-1741-2012, 2012. a, b
NASA Langley Research Center: Stratospheric Aerosol and Gas Experiment (SAGE) II Version 7.0 Aerosol, O3, NO2 and H2O Profiles in binary format, NASA Langley Research Center [data set], available at: https://asdc.larc.nasa.gov/project/SAGE%20II/SAGE2_AEROSOL_O3_NO2_H2O_BINARY_V7.0, last access: 14 December 2021. a
Parrella, J. P., Chance, K., Salawitch, R. J., Canty, T., Dorf, M., and Pfeilsticker, K.: New retrieval of BrO from SCIAMACHY limb: an estimate of the stratospheric bromine loading during April 2008, Atmos. Meas. Tech., 6, 2549–2561, https://doi.org/10.5194/amt-6-2549-2013, 2013. a, b
Pundt, I.: Climatology of the stratospheric BrO vertical distribution by balloon-borne UV–visible spectrometry, J. Geophys. Res., 107, 1195, https://doi.org/10.1029/2002JD002230, 2002. a
Remedios, J. J., Leigh, R. J., Waterfall, A. M., Moore, D. P., Sembhi, H., Parkes, I., Greenhough, J., Chipperfield, M. P., and Hauglustaine, D.: MIPAS reference atmospheres and comparisons to V4.61/V4.62 MIPAS level 2 geophysical data sets, Atmos. Chem. Phys. Discuss., 7, 9973–10017, https://doi.org/10.5194/acpd-7-9973-2007, 2007. a
Rodgers, C. D.: Inverse methods for atmospheric sounding: Theory and practice, vol. 2 of Series on atmospheric oceanic and planetary physics, World Scientific, Singapore, reprinted. edn., 2004. a
Roeckner, E., Brokopf, R., Esch, M., Giorgetta, M., Hagemann, S., Kornblueh, L., Manzini, E., Schlese, U., and Schulzweida, U.: Sensitivity of Simulated Climate to Horizontal and Vertical Resolution in the ECHAM5 Atmosphere Model, J. Climate, 19, 3771–3791, https://doi.org/10.1175/JCLI3824.1, 2006. a
Rotermund, M. K., Bense, V., Chipperfield, M. P., Engel, A., Grooß, J.-U., Hoor, P., Hüneke, T., Keber, T., Kluge, F., Schreiner, B., Schuck, T., Vogel, B., Zahn, A., and Pfeilsticker, K.: Organic and inorganic bromine measurements around the extratropical tropopause and lowermost stratosphere: insights into the transport pathways and total bromine, Atmos. Chem. Phys., 21, 15375–15407, https://doi.org/10.5194/acp-21-15375-2021, 2021. a
Rozanov, A., Kühl, S., Doicu, A., McLinden, C., Puķīte, J., Bovensmann, H., Burrows, J. P., Deutschmann, T., Dorf, M., Goutail, F., Grunow, K., Hendrick, F., von Hobe, M., Hrechanyy, S., Lichtenberg, G., Pfeilsticker, K., Pommereau, J. P., Van Roozendael, M., Stroh, F., and Wagner, T.: BrO vertical distributions from SCIAMACHY limb measurements: comparison of algorithms and retrieval results, Atmos. Meas. Tech., 4, 1319–1359, https://doi.org/10.5194/amt-4-1319-2011, 2011. a, b
Sander, R., Kerkweg, A., Jöckel, P., and Lelieveld, J.: Technical note: The new comprehensive atmospheric chemistry module MECCA, Atmos. Chem. Phys., 5, 445–450, https://doi.org/10.5194/acp-5-445-2005, 2005. a
Sander, S. P., Abbatt, J., Barker, J. R., Burkholder, J. B., Friedl, R. R., Golden, D. M., Huie, R. E., Kolb, C. E., Kurylo, M. J., Moortgat, G. K., Orkin, V. L., and Wine, P. H.: Chemical Kinetics and Photochemical Data for Use in Atmospheric Studies: Evaluation No. 17, vol. 10-6 of JPL Publications, Jet Propulsion Laboratory, Pasadena, available at: http://jpldataeval.jpl.nasa.gov (last access: 14 December 2021), 2011. a, b
Sinnhuber, B.-M., Rozanov, A., Sheode, N., Afe, O. T., Richter, A., Sinnhuber, M., Wittrock, F., and Burrows, J. P.: Global observations of stratospheric bromine monoxide from SCIAMACHY, Geophys. Res. Lett., 32, 831, https://doi.org/10.1029/2005GL023839, 2005. a, b, c
Sinnhuber, B.-M., Sheode, N., Sinnhuber, M., Chipperfield, M. P., and Feng, W.: The contribution of anthropogenic bromine emissions to past stratospheric ozone trends: a modelling study, Atmos. Chem. Phys., 9, 2863–2871, https://doi.org/10.5194/acp-9-2863-2009, 2009. a, b
Sioris, C. E., Kovalenko, L. J., McLinden, C. A., Salawitch, R. J., van Roozendael, M., Goutail, F., Dorf, M., Pfeilsticker, K., Chance, K., von Savigny, C., Liu, X., Kurosu, T. P., Pommereau, J.-P., Bösch, H., and Frerick, J.: Latitudinal and vertical distribution of bromine monoxide in the lower stratosphere from Scanning Imaging Absorption Spectrometer for Atmospheric Chartography limb scattering measurements, J. Geophys. Res., 111, D14301, https://doi.org/10.1029/2005JD006479, 2006. a
Soller, R., Nicovich, J. M., and Wine, P. H.: Temperature-Dependent Rate Coefficients for the Reactions of Br(2P), Cl(2P), and O(3PJ) with BrONO2, J. Phys. Chem. A, 105, 1416–1422, https://doi.org/10.1021/jp001947q, 2001. a
Solomon, S., Sanders, R. W., Carroll, M. A., and Schmeltekopf, A. L.: Visible and near-ultraviolet spectroscopy at McMurdo Station, Antarctica: 5. Observations of the diurnal variations of BrO and OClO, J. Geophys. Res.-Atmos., 94, 11393, https://doi.org/10.1029/JD094iD09p11393, 1989. a
Spang, R., Remedios, J., and Barkley, M.: Colour indices for the detection and differentiation of cloud types in infra-red limb emission spectra, Adv. Space Res., 33, 1041–1047, https://doi.org/10.1016/S0273-1177(03)00585-4, 2004. a
Spencer, J. E. and Rowland, F. S.: Bromine nitrate and its stratospheric significance, J. Phys. Chem., 82, 7–10, https://doi.org/10.1021/j100490a002, 1978. a
Stachnik, R. A., Millán, L., Jarnot, R., Monroe, R., McLinden, C., Kühl, S., Puķīte, J., Shiotani, M., Suzuki, M., Kasai, Y., Goutail, F., Pommereau, J. P., Dorf, M., and Pfeilsticker, K.: Stratospheric BrO abundance measured by a balloon-borne submillimeterwave radiometer, Atmos. Chem. Phys., 13, 3307–3319, https://doi.org/10.5194/acp-13-3307-2013, 2013. a, b
Steck, T.: Methods for determining regularization for atmospheric retrieval problems, Appl. Optics, 41, 1788–1797, https://doi.org/10.1364/ao.41.001788, 2002. a
Stiller, G. P., Harrison, J. J., Haenel, F. J., Glatthor, N., Kellmann, S., and von Clarmann, T.: Improved global distributions of SF6 and mean age of stratospheric air by use of new spectroscopic data, EGU General Assembly 2020, Online, 4–8 May 2020, EGU2020-2660, https://doi.org/10.5194/egusphere-egu2020-2660, 2020. a
Theys, N., Van Roozendael, M., Hendrick, F., Fayt, C., Hermans, C., Baray, J.-L., Goutail, F., Pommereau, J.-P., and De Mazière, M.: Retrieval of stratospheric and tropospheric BrO columns from multi-axis DOAS measurements at Reunion Island (21∘ S, 56∘ E), Atmos. Chem. Phys., 7, 4733–4749, https://doi.org/10.5194/acp-7-4733-2007, 2007. a
Theys, N., Van Roozendael, M., Errera, Q., Hendrick, F., Daerden, F., Chabrillat, S., Dorf, M., Pfeilsticker, K., Rozanov, A., Lotz, W., Burrows, J. P., Lambert, J.-C., Goutail, F., Roscoe, H. K., and De Mazière, M.: A global stratospheric bromine monoxide climatology based on the BASCOE chemical transport model, Atmos. Chem. Phys., 9, 831–848, https://doi.org/10.5194/acp-9-831-2009, 2009. a
Tikhonov, A. N.: On the solution of ill-posed problems and the method of regularization, Dokl. Akad. Nauk SSSR, 151, 501–504, 1963. a
van Aalst, M. K.: Dynamics and transport in the stratosphere: Simulations with a general circulation model, Dissertation, Utrecht University, Utrecht, 2005. a
Wagner, G. and Birk, M.: New infrared spectroscopic database for bromine nitrate, J. Mol. Spectrosc., 326, 95–105, https://doi.org/10.1016/j.jms.2016.03.007, 2016. a, b, c
Warwick, N. J., Pyle, J. A., Carver, G. D., Yang, X., Savage, N. H., O'Connor, F. M., and Cox, R. A.: Global modeling of biogenic bromocarbons, J. Geophys. Res.-Atmos., 111, D24305, https://doi.org/10.1029/2006JD007264, 2006. a, b
Werner, B., Stutz, J., Spolaor, M., Scalone, L., Raecke, R., Festa, J., Colosimo, S. F., Cheung, R., Tsai, C., Hossaini, R., Chipperfield, M. P., Taverna, G. S., Feng, W., Elkins, J. W., Fahey, D. W., Gao, R.-S., Hintsa, E. J., Thornberry, T. D., Moore, F. L., Navarro, M. A., Atlas, E., Daube, B. C., Pittman, J., Wofsy, S., and Pfeilsticker, K.: Probing the subtropical lowermost stratosphere and the tropical upper troposphere and tropopause layer for inorganic bromine, Atmos. Chem. Phys., 17, 1161–1186, https://doi.org/10.5194/acp-17-1161-2017, 2017. a, b
Wetzel, G., Oelhaf, H., Höpfner, M., Friedl-Vallon, F., Ebersoldt, A., Gulde, T., Kazarski, S., Kirner, O., Kleinert, A., Maucher, G., Nordmeyer, H., Orphal, J., Ruhnke, R., and Sinnhuber, B.-M.: Diurnal variations of BrONO2 observed by MIPAS-B at midlatitudes and in the Arctic, Atmos. Chem. Phys., 17, 14631–14643, https://doi.org/10.5194/acp-17-14631-2017, 2017. a, b, c, d, e, f, g
WMO: Scientific assessment of ozone depletion: 2018, Global Ozone Research and Monitoring Project–Report No. 58, World Meteorological Organization, Geneva, Switzerland, 2018. a
Wofsy, S. C., McElroy, M. B., and Yung, Y. L.: The chemistry of atmospheric bromine, Geophys. Res. Lett., 2, 215–218, https://doi.org/10.1029/GL002i006p00215, 1975. a
- Abstract
- Introduction
- Methods
- The MIPAS dataset in comparison to EMAC model results
- Estimation of total stratospheric Bry
- Conclusions
- Appendix A: Application of averaging kernels to EMAC model results
- Appendix B: NO2
- Appendix C: BrONO2–Bry ratio
- Appendix D: Reaction parameters
- Data availability
- Author contributions
- Competing interests
- Disclaimer
- Special issue statement
- Acknowledgements
- Financial support
- Review statement
- References
- Supplement