the Creative Commons Attribution 4.0 License.
the Creative Commons Attribution 4.0 License.
 | 17 Dec 2021
Formaldehyde evolution in US wildfire plumes during the Fire Influence on Regional to Global Environments and Air Quality experiment (FIREX-AQ)
Jin Liao
Glenn M. Wolfe
Reem A. Hannun
Jason M. St. Clair
Thomas F. Hanisco
Jessica B. Gilman
Aaron Lamplugh
Vanessa Selimovic
Glenn S. Diskin
John B. Nowak
Hannah S. Halliday
Joshua P. DiGangi
Samuel R. Hall
Kirk Ullmann
Christopher D. Holmes
Charles H. Fite
Anxhelo Agastra
Thomas B. Ryerson
Jeff Peischl
Ilann Bourgeois
Carsten Warneke
Matthew M. Coggon
Georgios I. Gkatzelis
Kanako Sekimoto
Alan Fried
Dirk Richter
Petter Weibring
Eric C. Apel
Rebecca S. Hornbrook
Steven S. Brown
Caroline C. Womack
Michael A. Robinson
Rebecca A. Washenfelder
Patrick R. Veres
J. Andrew Neuman
Formaldehyde (HCHO) is one of the most abundant non-methane volatile organic compounds (VOCs) emitted by fires. HCHO also undergoes chemical production and loss as a fire plume ages, and it can be an important oxidant precursor. In this study, we disentangle the processes controlling HCHO by examining its evolution in wildfire plumes sampled by the NASA DC-8 during the Fire Influence on Regional to Global Environments and Air Quality experiment (FIREX-AQ) field campaign. In 9 of the 12 analyzed plumes, dilution-normalized HCHO increases with physical age (range 1–6 h). The balance of HCHO loss (mainly via photolysis) and production (via OH-initiated VOC oxidation) seems to control the sign and magnitude of this trend. Plume-average OH concentrations, calculated from VOC decays, range from −0.5 (± 0.5) × 106 to 5.3 (± 0.7) × 106 cm−3. The production and loss rates of dilution-normalized HCHO seem to decrease with plume age. Plume-to-plume variability in dilution-normalized secondary HCHO production correlates with OH abundance rather than normalized OH reactivity, suggesting that OH is the main driver of fire-to-fire variability in HCHO secondary production. Analysis suggests an effective HCHO yield of 0.33 (± 0.05) per VOC molecule oxidized for the 12 wildfire plumes. This finding can help connect space-based HCHO observations to the oxidizing capacity of the atmosphere and to VOC emissions.
- Article
(1541 KB) - Full-text XML
-
Supplement
(1535 KB) - BibTeX
- EndNote


Wildfire biomass burning is a large source of trace gases and aerosols that affect regional atmospheric chemistry, human health, air quality, radiative balance, and climate. Wildfire frequency and intensity are expected to increase with global warming under higher temperatures and drier conditions in the future (Westerling et al., 2006). Wildfire emissions of volatile organic compounds (VOCs) are a complex mixture spanning orders of magnitude in concentration, reactivity, and volatility (Gilman et al., 2015; Koss et al., 2018). These VOCs contribute to increased regional tropospheric ozone (Alvarado et al., 2010; Jaffe and Wigder, 2012; Mauzerall et al., 1998; Wotawa and Trainer, 2000) and can deposit onto or evaporate from organic aerosols in biomass burning air masses (Garofalo et al., 2019; Majdi et al., 2019; Palm et al., 2020).
Formaldehyde (HCHO) is one of the most abundant non-methane VOCs emitted by wildfires (Akagi et al., 2011; Gilman et al., 2015; Simpson et al., 2011). HCHO emissions vary with total carbon emissions, modified combustion efficiency (MCE), and fuel type. Emission factors of HCHO decrease as MCE increases (e.g., Liu et al., 2017; Yokelson et al., 1999), indicating that more HCHO is produced from smoldering fires than from flaming fires. HCHO emissions can vary by more than a factor of 2 among tropical forest, savanna, boreal forest, and temperate forest biomes (Akagi et al., 2011). In addition to direct emissions, HCHO is formed in fire plumes via VOC oxidation. Alvarado et al. (2020) used TROPOspheric Monitoring Instrument (TROPOMI) data to show that HCHO enhancements in wildfire plumes persist for days downwind. HCHO also serves as an important source of peroxy radicals (HO2), thereby influencing the formation of ozone and other secondary pollutants (Yokelson et al., 1999).
Few studies have investigated the photochemical evolution of HCHO in biomass burning plumes, and these studies have reported both net HCHO production and loss. Mauzerall et al. (1998) reported average HCHO enhancement () of 9.5 ppt ppb−1 for fresh plumes (less than 0.5 d), 1.8 ppt ppb−1 for recent plumes (less than 1 d), 2.3 ppt ppb−1 for aged plumes (< 5 d old), and 0.9 ppt ppb−1 for old plumes (> 5 d old). Trentmann et al. (2005) observed a potential increasing trend of from 20 ppt ppb−1 to over 30 ppt ppb−1 with limited data and simulated a flat trend of within 1 h age since emission from a Savanna fire plume in Africa. Müller et al. (2016) also observed an increasing trend of with an average of 22.7 ppt ppb−1 and simulated a flat or slightly decreasing trend of in a small fresh agricultural biomass burning plume in Georgia, US. While such case studies are valuable, we lack a general understanding of the drivers of plume trends and plume-to-plume variability in HCHO evolution.
HCHO is also one of the few VOCs that can be observed from space, and the global coverage of satellite observations has been leveraged to provide insights into a variety of atmospheric chemistry questions. HCHO is correlated with organic aerosols in biomass burning air masses, and this correlation might be exploited to estimate organic aerosol abundance from satellite HCHO measurements (Liao et al., 2019). In regions with constant or very high OH reactivity, HCHO variability is closely linked to OH variability (Valin et al., 2016; Wolfe et al., 2019) and may be used to infer OH. Satellite HCHO columns have also been widely used to constrain emissions of isoprene and other VOCs (Fu et al., 2007; Kaiser et al., 2018; Marais et al., 2014; Millet et al., 2008; Stavrakou et al., 2009). Understanding the emissions, chemistry, and trends of HCHO in wildfires will facilitate the application of satellite HCHO towards broadscale wildfire smoke processes and impacts.
The Fire Influence on Regional to Global Environments and Air Quality experiment (FIREX-AQ) deployed a comprehensive suite of instruments aboard the NASA DC-8 aircraft to study wildfires and agricultural fires in the US. It provided a great opportunity to systematically study the emissions and chemistry of HCHO in wildfire plumes. In the following, we describe the HCHO dependence on plume age in wildfire plumes from FIREX-AQ, assess the drivers of HCHO trends, and examine the factors controlling variability in secondary HCHO production.
2.1 FIREX-AQ field campaign and measurement description
During FIREX-AQ, a combination of four aircraft (the NASA DC-8, NASA ER-2, and two NOAA Twin Otters) with a comprehensive suite of in situ and remote-sensing instruments were deployed to characterize fire emissions and chemistry with operational bases in Boise, ID, and Salina, KS, from July to September 2019. This study focuses on wildfire plumes sampled by the NASA DC-8 aircraft during FIREX-AQ.
In situ HCHO observations were acquired by several instruments onboard the DC-8; here we primarily use measurements from the In Situ Airborne Formaldehyde (ISAF) instrument (Cazorla et al., 2015). ISAF uses laser-induced fluorescence to detect HCHO. A tunable UV laser excites HCHO molecules to an excited electronic state and the resulting fluorescence is detected with a photon-counting photomultiplier tube. The laser wavelength is modulated on and off a rotational absorption feature (353.163 nm), and the difference between the “online” and “offline” signals is proportional to the HCHO concentration.
ISAF was calibrated pre- and post-mission with a compressed-gas HCHO cylinder (584 ± 15 ppbv in nitrogen, Air Liquide). Sensitivity typically varies by less than 5 % between calibrations. Flow meters for the standard dilution system were calibrated against a DryCal calibrator (Mesa Labs) with an accuracy of > 99 %. The HCHO standard concentration was calibrated before and after the field deployment with an MKS Multigas 2031 Fourier transform infrared spectrometer. Gas standard mixing ratios are typically reproducible to within 2 % of the mean value measured over multiple years. IR-determined mixing ratios are adjusted by a factor of 0.96 based on a separate long-path UV absorption experiment (Cazorla et al., 2015). Thus, ISAF HCHO mixing ratios are ultimately tied to the UV cross sections of Meller and Moortgat (2000) as recommended by the JPL 2011 evaluation (Sander et al., 2011). The detection limit of ISAF was 30 pptv for 1 Hz data at signal noise = 1 and the accuracy of ISAF HCHO measurements was estimated as 10 % + 10 pptv. The response time of ISAF during FIREX-AQ was about 300 ms, limited mainly by flow through the sample cell.
During FIREX-AQ, ISAF HCHO measurements correlated with those from the Compact Atmospheric Multispecies Spectrometer (CAMS) (Richter et al., 2015), with a coefficient of determination r2 of 0.99, a slope of 1.27 (CAMS vs. ISAF), and a near-zero intercept for 1 Hz average wildfire data from equally weighted orthogonal distance regression (Fig. S1 in the Supplement). The systematic bias between the CAMS and ISAF measurements exceeds the combined stated uncertainty (10 % for ISAF, 6 % for CAMS). Post-mission comparisons suggest this discrepancy is due to the absolute calibration of compressed-gas HCHO standards, which are tied to literature-recommended UV (ISAF) or IR (CAMS) cross sections; the source of this discrepancy is still under investigation. Remotely sensed HCHO column retrievals rely on the same UV cross sections (De Smedt et al., 2018) that are used to calibrate the ISAF instrument. The HCHO enhancements in the plumes (Sect 3.1) and the estimated effective yield of HCHO from VOC oxidation by OH (Sect. 3.3) can have a potential low bias of 27 % due to the ISAF and CAMS HCHO measurement difference. This uncertainty proportionally affects quantitative analysis results but does not alter qualitative conclusions.
We also use several supporting measurements in our analysis. CO was measured via mid-IR wavelength modulation spectroscopy by the Differential Absorption Carbon Monoxide Measurement (DACOM) instrument (Sachse et al., 1991). Photolysis rates were derived from the Actinic flux measurements by the Charged-coupled device Actinic Flux Spectroradiometer (CAFS) (Hall et al., 2018). Alkenes were measured by the NOAA integrated Whole Air Sampler (iWAS) (Lerner et al., 2017). Ozone (O3) measurements were from the NOAA chemiluminescence instrument (Bourgeois et al., 2020). OH reactivity calculations used VOCs measurements from the NOAA proton-transfer reaction time-of-flight mass spectrometry (PTR-ToF-MS) (Yuan et al., 2016), NCAR Trace Organic Gas Analyzer (TOGA) (Apel et al., 2015) outfitted with a time-of-flight mass spectrometer, NOAA Airborne Cavity Enhanced spectrometer (ACES) (Min et al., 2016), and NOAA iodide ion time-of-flight (ToF) chemical ionization mass spectrometer (CIMS) (Veres et al., 2020), listed in Table S1 in the Supplement. Our analysis uses in situ measurements that are merged to the iWAS sampling period, which ranged from 1–9 s per canister, such that multiple samples were often acquired within a single plume crossing.
2.2 Normalized excess mixing ratio (NEMR) and physical age definitions
NEMR is defined as the difference between the concentration of species X in the plume and in the background air outside of the plume, normalized by the difference between CO concentrations in the plume and the background outside of the plume. Because photochemical production of CO is very small compared to the high CO concentrations in the biomass burning plumes (e.g., CO production from HCHO photolysis and oxidation for 1 h is about 2.5 ppbv, which is < 1 % of CO concentrations of 985 ppbv on average in the plumes), trace gases concentrations are normalized to CO in the biomass burning plumes to account for dilution, as in many previous biomass burning studies (e.g., Müller et al., 2016; Selimovic et al., 2019).
The background air outside of the plumes was manually selected and could be different or the same for different transects of the same plume, depending on the availability of the iWAS data. The HCHO NEMR is denoted by nHCHO below.
Physical age was estimated using a Lagrangian trajectory analysis and described briefly here. Fire source locations were pinpointed using the MODIS-ASTER (MASTER) Airborne Simulator instrument data onboard the DC-8. Upwind trajectories from aircraft locations were computed and the advection age was calculated from the time when a trajectory was closest to the fire. Plume rise time from the surface to the trajectory initialization altitude assumed a vertical wind speed of 7 m s−1. The smoke age is the sum of advection age plus rise age averaged over several meteorological models. The average uncertainty of the estimated physical age for the analyzed wildfire plumes was 37 % with an interquartile range of 20 % based on the range of ages derived from the High-Resolution Rapid Refresh (HRRR), North American Mesoscale Forecast System (NAM) CONUS Nest, and Global Forecast System (GFS 0.25∘) meteorological datasets.
2.3 Plume selection
Details about the specific selected wildfire plumes among all sampled wildfire plumes during FIREX-AQ are provided in Table S2 in the Supplement. Wildfire plumes that meet the conditions listed below are above the background HCHO concentrations, which typically vary from 100ppt–1ppb during FIREX-AQ, and are selected to study the evolution of HCHO in wildfires.
- a.
Lagrangian sampling pattern
Lagrangian sampling patterns are defined as flight tracks intercepting the plumes with flight leg directions approximately perpendicular to the horizontal wind directions and more than three transects downwind with different distances from the fire.
- b.
Appropriate VOC decay for the period analyzed with sufficient data samples
We selected the plume samples where chemical age correlated with physical age. This was defined by a coefficient of determination r2 ≥ 0.57 for a plot of ln(trans-2-butene propene) or ln(cis-2-butene propene) vs. physical age. We used 2-butenes propene as chemical age tracers in this analysis because these gases have comparable lifetimes to physical age for most of the analyzed plumes. We filtered out plume data if the correlation coefficient of ln(trans-2-butene propene) or ln(cis-2-butene propene) vs. physical age degraded at older physical ages. Figure S2 in the Supplement shows ln(trans-2-butene propene) and ln(cis-2-butene propene) vs. physical age for the plumes that satisfied conditions a) and had iWAS data available. The threshold of r2 = 0.57 is chosen by visual inspection of all VOC decay in Fig. S2. We also filtered out plumes with total number of data points < 8 in the iWAS sample periods for an entire selected circuit of multiple plume transects with good VOC decay. Due to the inhomogeneity of the plumes, too few data points can introduce large bias. In the analyzed plume periods, ln(trans-2-butene propene) or ln(cis-2-butene propene) also has good correlations with the maleic anhydride furan ratio (Fig. S3 in the Supplement), another tracer of chemical age in biomass burning plumes (Coggon et al., 2019; personal communication with Carsten Warneke and Matthew M. Coggon, 2021). The Mica and Lick Creek plume on 2 August 2019 is the plume with the least number of data points among the selected plumes (N=8).
The above filters, applied to a total of 26 fire plumes, yield 11 daytime plumes and 1 nighttime plume that are suitable for our analysis (Table S2). The nighttime plume on 12 August was after 20:00 local time with average O3 photolysis rate of essentially zero. One of the 12 plumes (Blackwater) occurred in the southeast US and the remaining 11 plumes were in the western US.
2.4 Estimating average OH concentrations in the plumes
Plume photochemical age is estimated based on the relative decay of primary emitted VOCs that have different reaction rate coefficients with OH (e.g., Warneke et al., 2007). We can estimate the average concentration of OH by combining the photochemical age with the trajectory-based air mass age. Cis-2-butenepropene ratios and trans-2-butenepropene ratios are used to estimate OH in this analysis because these gases have lifetimes comparable to physical age (2–6 h) for most of the analyzed plumes, and using two VOC ratios helps reduce the uncertainty. The lifetimes of propene, cis-2-butene, and trans-2-butene are approximately 4.5, 2.3, and 1.8 h, respectively, at OH concentrations of 2 × 10⁶ molecules cm−3 (Atkinson et al., 2006). Because both 2-butenes also differ from propene in O3 reaction rate coefficients, the reactions of these alkenes with O3 are also considered when we estimate the OH concentrations. We assume that the variability in the butenes–propene relationship is driven by OH and O3 and that there is negligible change in the relative emission ratios over the sampled plumes. Different slopes in cis-2-butene propene and trans-2-butene propene vs. plume age (Fig. S2) depend on the differences in reaction rate coefficients of OH and O3 with 2-butene (cis-2-butene and trans-2-butene) and propene, in addition to OH and O3 concentrations, as shown in Eq. (2). These reaction rate coefficients are those reported by Atkinson et al. (2006) with real-time temperature and pressure dependence. The plumes' average reaction rate coefficients are kpropene_OH = 3.1 × 10⁻¹¹ , kcis-2-butene_OH = 6.4 × 10⁻¹¹ , ktrans-2-butene_OH = 8.0 × 10⁻¹¹ , = 6.4 × 10⁻¹⁸ , = 9.9 × 10⁻¹⁷ , and = 1.5 × 10⁻¹⁶ .
OH concentrations are derived from the slope of vs. t (physical age), the measured ozone concentrations and the reaction rate coefficients.
Because the instantaneous O3 measurements do not reflect the oxidation history, the average ozone concentration of the entire circuit with multiple transects is used to represent the integrated O3 effect on alkene oxidation. The uncertainty due to O3 variation and the uncertainty in the slope of vs. t are propagated to estimate the total uncertainty in plume-average OH. Butene in Eqs. (2) and (3) represents trans-2-butene or cis-2-butene, both of which are used in average OH estimation. O3 variation, uncertainty in OH due to O3 variation, total OH uncertainty, and estimated OH are listed in Table S3 in the Supplement.
2.5 Calculating primary HCHO normalized mixing ratios and secondary HCHO production rates
To understand the relative importance of primary emission vs. secondary production of HCHO in fire plumes downwind, we calculate primary and secondary HCHO as the plume ages. The primary HCHO time profile is calculated by the following equation:
where nHCHO0 is equal to the fitted observed nHCHO (HCHONEMR) closest to the fire source, JHCHO is the measured HCHO photolysis frequency in iWAS sample periods averaged and interpreted in physical age space, kHCHO is the reaction rate coefficient between HCHO and OH, and t is the physical age. nHCHOsecondary is calculated by subtracting nHCHOprimary from the measured nHCHO. Here we assumed the fitted observed nHCHO closest to the fire source is equal to nHCHO at the emission source. This assumption will not impact the secondary nHCHO production rate calculated below.
To characterize secondary HCHO production in wildfire plumes, we calculate the secondary nHCHO production rate. The secondary nHCHO production rate is derived from the HCHO mass balance equation.
where P is chemical production, L is chemical loss, and D is dilution. The calculation of the secondary nHCHO production rate is shown in Eq. (6). The derivation of Eq. (6) from Eq. (5) can be found in Appendix A.
Here, is taken as the slope of measured nHCHO vs. physical age and other parameters are as defined above.
2.6 Impact of potential variation in HCHO emission ratios on nHCHO trend
In this analysis, we assume the variability in the emission ratio (that is, nHCHO at the source) is much smaller than the variability in nHCHO induced by chemistry for any single fire plume. Emission factors of both HCHO and CO (that is, grams of gas per kilogram of fuel burned) depend on MCE, fuel type, and other factors (e.g., Liu et al., 2017; Yokelson et al., 1999). Normalizing HCHO by CO removes the strong negative dependence of HCHO emission factors on MCE. A small positive trend of nHCHO vs. MCE is due to higher nHCHO and MCE for the eastern US wildfire plume than the western US wildfire plumes (Fig. S4 in the Supplement). No clear trend of MCE in nHCHO plume evolution was observed in FIREX-AQ data (Fig. S5 in the Supplement). Emissions of CO2 correlate with fire radiative power (FRP) detected by satellite during FIREX-AQ, and the variability of FRP could affect the variability of downwind concentrations (Wiggins et al., 2020). We found that HCHO correlates with CO2 (Fig. S6a in the Supplement) and thus likely also with FRP because the change in measured CO2 correlates with the change in FRP (Wiggins et al., 2020). To account for emission variation and dilution, which are the main factors affecting the absolution concentrations of trace gases and aerosols in the plumes, HCHO is normalized to CO to investigate the impact of photochemistry on HCHO evolution in the plumes. Photochemistry takes place while emission varies. When normalized to CO, nHCHO does not strongly depend on CO2 (Figs. S6b and S7 in the Supplement) or FRP. FRP and MCE do not control the trends of nHCHO.
2.7 OH reactivity calculation
We calculate the observed OH reactivity using the Framework for 0-D Atmospheric Modeling (F0AM v4) (Wolfe et al., 2016) with the Master Chemical Mechanism v3.3.1 (MCM; Jenkin et al., 2015) and additional chemical reactions from recent publications of newly observed biomass burning species and reactions (Coggon et al., 2019; Decker et al., 2019). The VOC chemical species included in the F0AM model are listed in Table S1. We calculate the OH-VOC reactivity (∑kiVOCi) by excluding OH reactions with NO2 and CO from the total OH reactivity and define the normalized OH-VOC reactivity or normalized total OH reactivity as OH-VOC reactivity normalized by CO or total OH reactivity normalized by CO.
3.1 OH concentration estimation
OH is the main oxidant that reacts with VOCs to produce HCHO in the daytime. As described in Sect. 2.4, we estimate plume-average OH concentrations using the relative decays of 2-butenes to propene via Eq. (3). The decay of the natural logarithm of the trans-2-butene-to-propene ratio and the cis-2-butene-to-propene ratio with physical age is plotted in Fig. S2. Figure S2 includes all the plumes that meet selection condition (a) in Sect. 2.3, 12 plumes of which with good correlations (r2 = 0.57–0.99) between 2-butenes propene and plume age and sufficient data (data points > 8) are selected for this analysis. The lowest correlation coefficient of the selected plumes occurs for the nighttime plume on 12 August 2019 and the daytime plume on 29 July 2019. This indicates that the photochemical age of these plumes is consistent with their physical age, and the oxidation chemistry can be reasonably represented by average OH and O3. The slopes in Fig. S2 infer the estimated OH concentrations, and their coefficients of determination (r2) imply how well the VOC decay can be used to estimate OH.
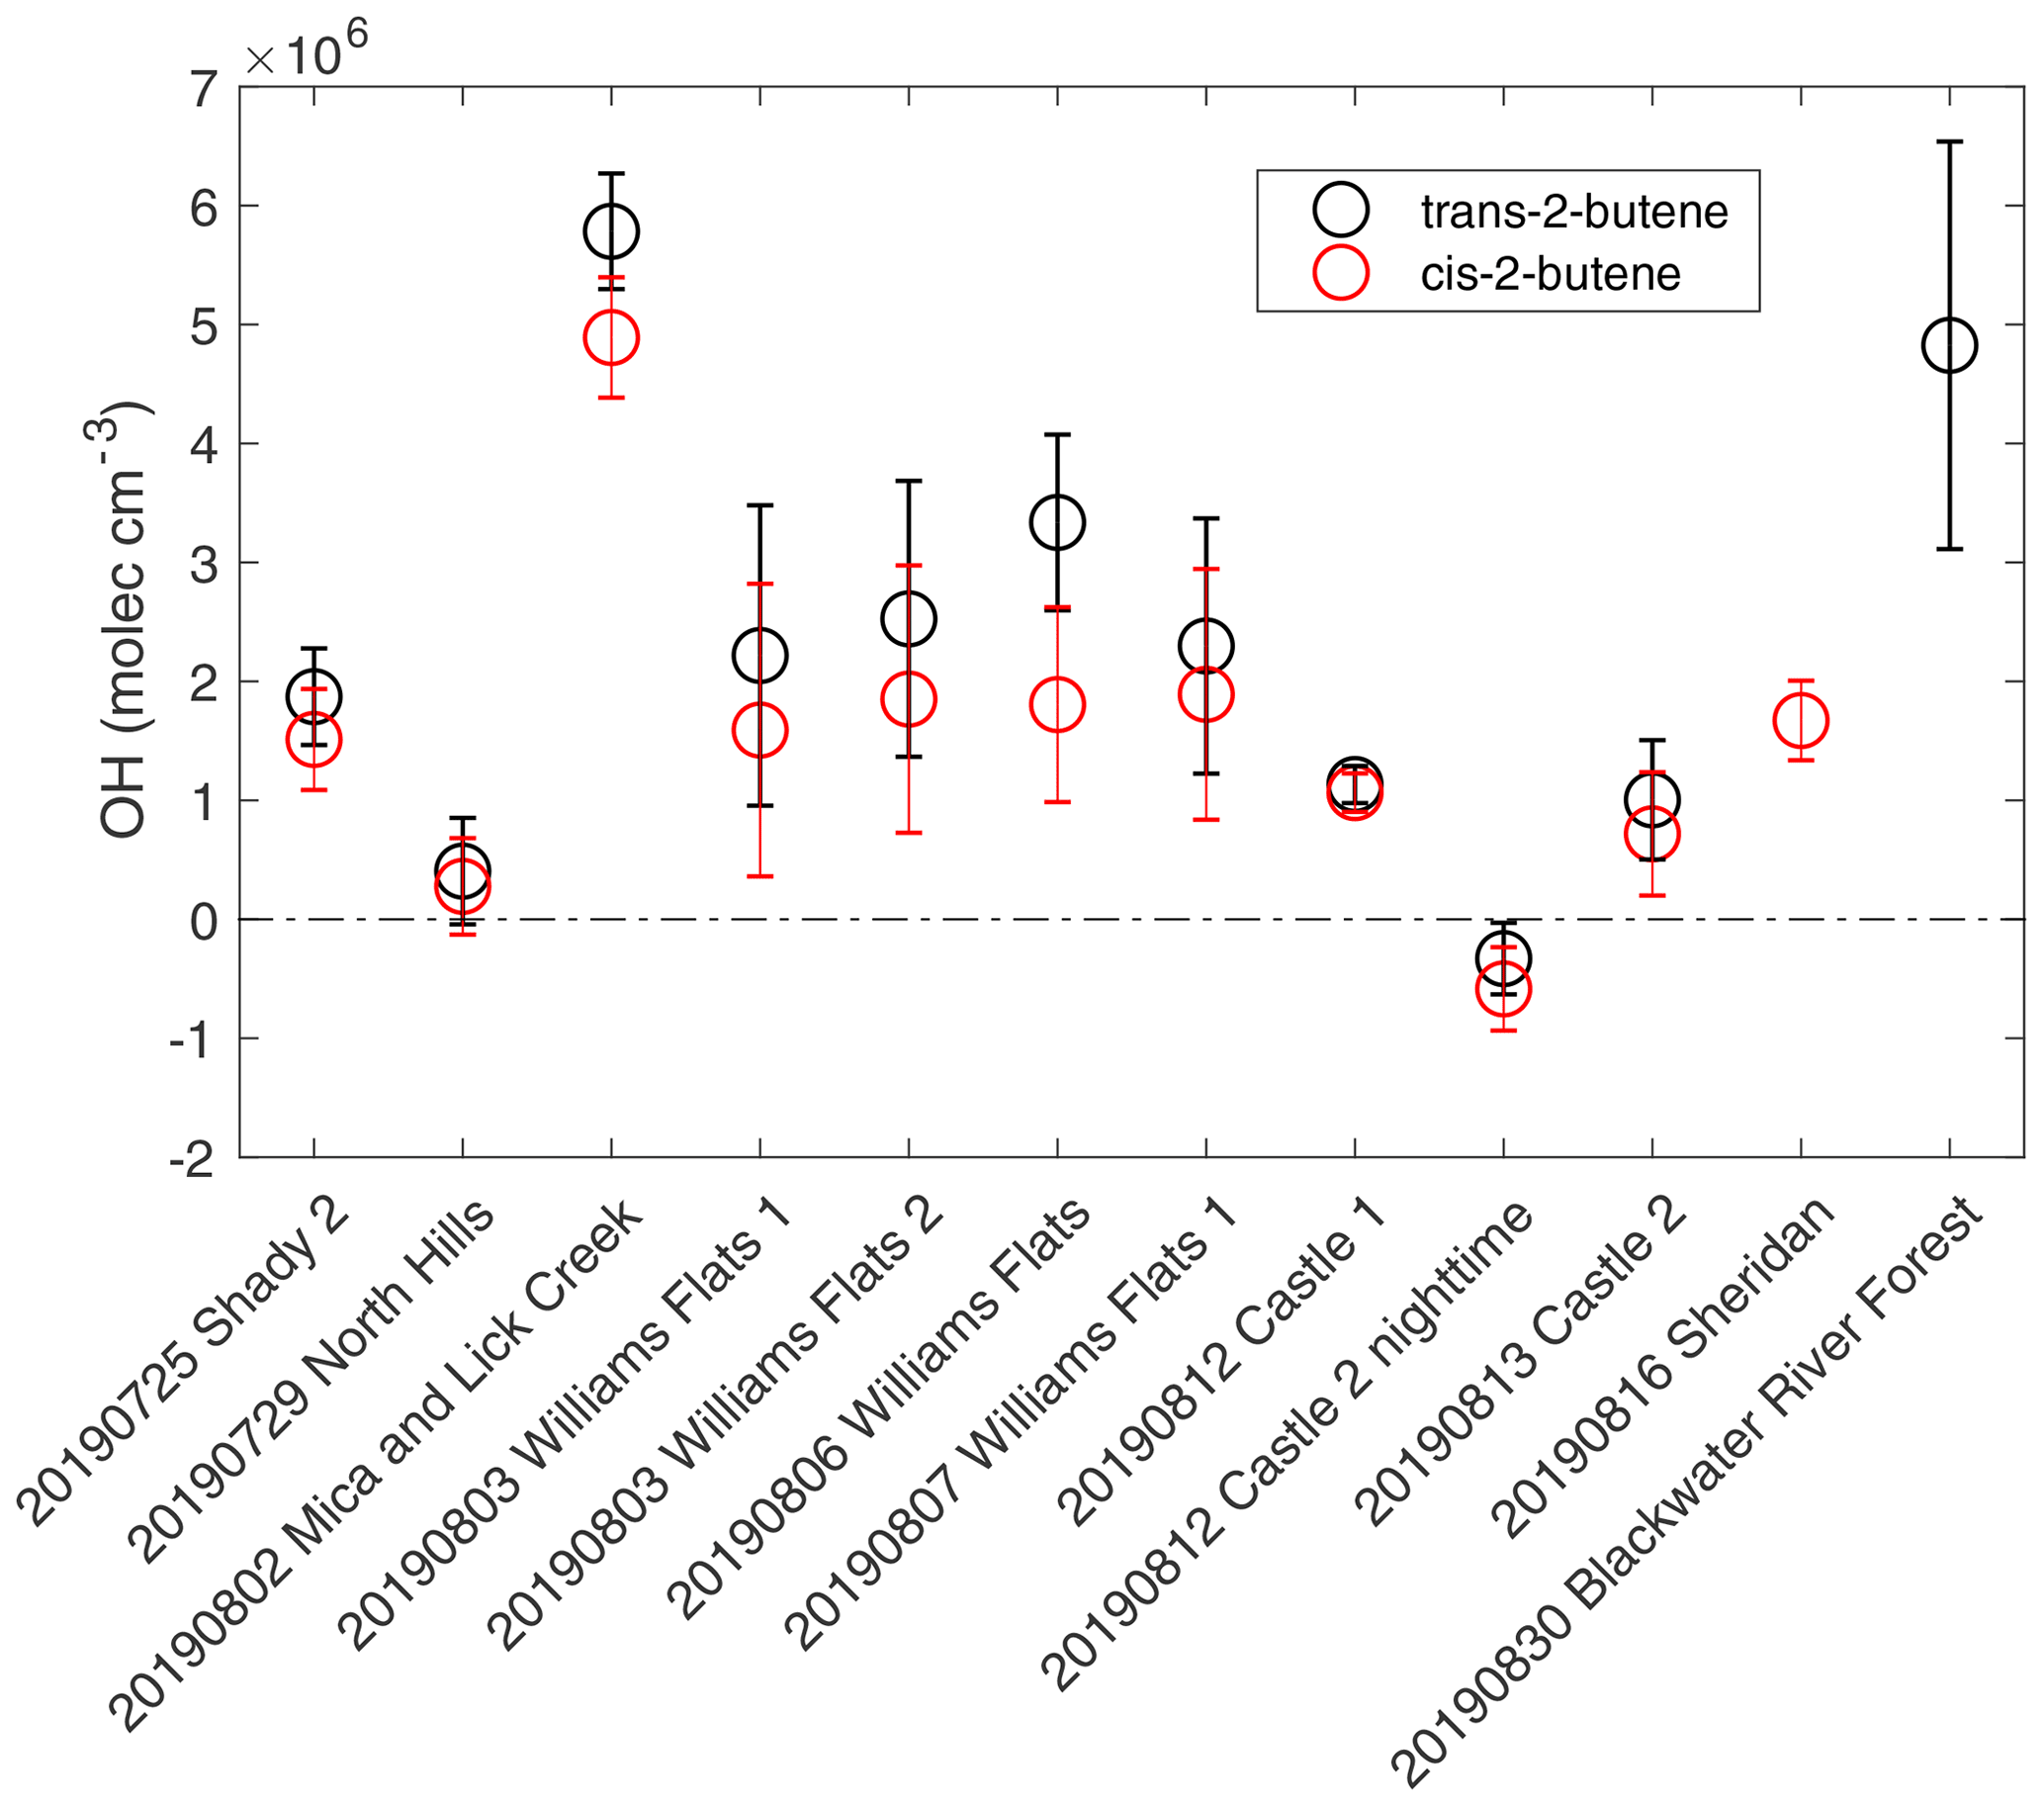
Figure 1Estimated average OH concentrations for the plumes analyzed from the decay of trans-2-butene propene (black) and the decay of cis-2-butene propene (red). The error bars represent the propagated uncertainties from the slopes of butenes propene decay and ozone variability within the plume.
The estimated average OH concentrations for the 12 plumes are shown in Fig. 1. The uncertainties in OH concentrations are based on the standard error in the slope of vs. physical age and the standard deviation of O3 concentrations. The average and standard deviation of O3 concentrations and the uncertainty in OH estimation due to the impact of O3 standard deviation are listed in Table S3. Plume-to-plume variability in average OH concentrations is generally consistent between the two ratio methods. OH concentrations from trans-2-butene are systematically higher than those from cis-2-butene by 27 % on average, which may reflect systematic bias in reaction rate coefficients or observations. For all plumes where both calculations were available, differences are within the combined uncertainties. The average OH concentrations from trans-2-butene to propene and cis-2-butene to propene were used to represent the average OH concentrations of the plumes. The average OH concentrations covered a large range, varying from −0.5(± 0.5) × 106 (for a nighttime plume) to 5.3(± 0.7) × 106 molecules cm−3.
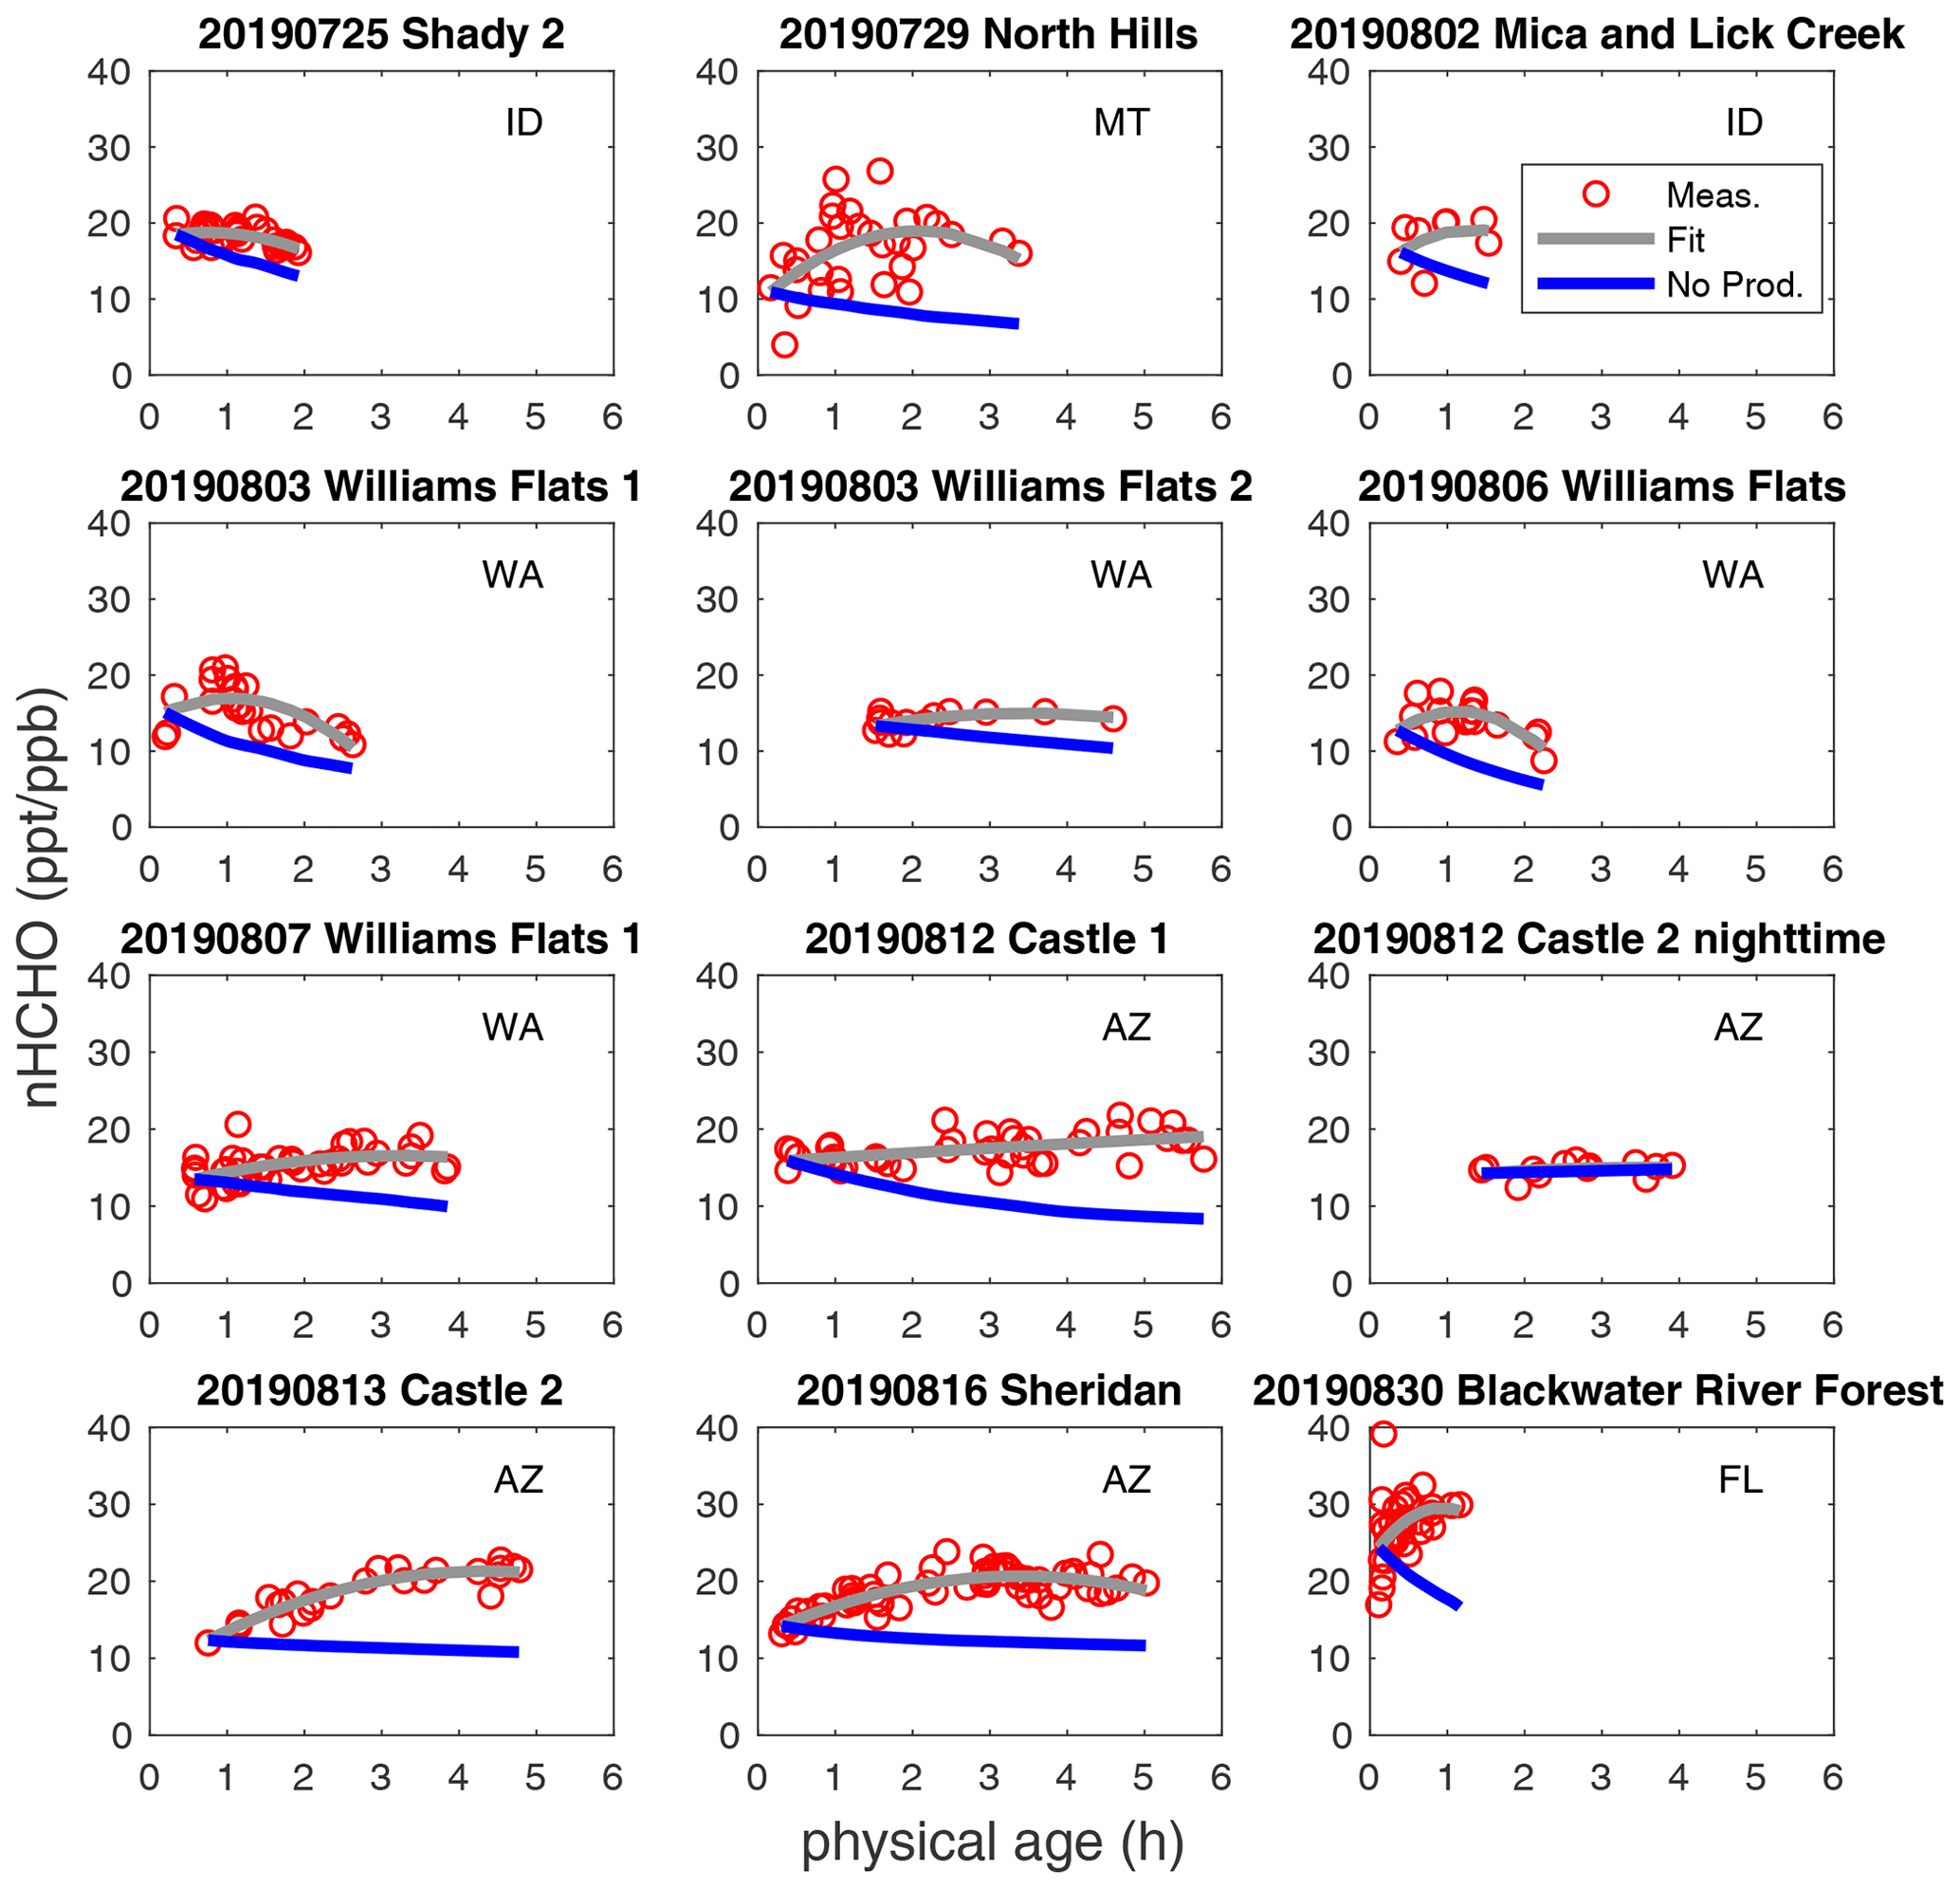
Figure 2Observed nHCHO (HCHO to CO NEMR) trends (red circle), quadratic polynomial fit (pink curve), and calculated decay of nHCHO trend without secondary production (blue curve) using measured photolysis rates along plume physical age for the 12 wildfire plumes. The state of fire location for each fire plume is listed.
3.2 Trends of HCHO in wildfire plumes
nHCHO in wildfire plumes can increase or decrease as plumes age. The trends of measured nHCHO vs. physical age and the corresponding quadratic polynomial regression for 12 selected plumes are plotted in Fig. 2. Quadratic polynomial regression is used because it has suitable degrees of freedom to capture the trends. Considering the CO measurement uncertainty of ≤ 7 % and HCHO measurement uncertainty of 10 %, the uncertainty of nHCHO is estimated to be ± 12 % with a potential systematic low bias of as much as 27 % (based on the difference between ISAF and CAMS). Random error due to HCHO and CO measurement precision is negligible when averaging over the iWAS integration time in high-concentration biomass burning plumes.
In the absence of secondary production, we expect nHCHO to decay with a time constant of a few hours in the daytime. The blue curves in Fig. 2 show the predicted decay of initial nHCHO using observed HCHO photolysis rates and measurement-derived OH concentrations. Because the variability in nHCHO in one transect is significant, we use the start point of the observed nHCHO fitted curve to represent the observed nHCHO closest to fire. HCHO photolysis frequencies are averaged generally over each transect and linearly interpolated to determine continuous age-dependent photolysis frequencies. The calculated nHCHO without production is higher than primary (emitted) nHCHO because some HCHO production and loss had already occurred before the closest transect.
The fraction of primary and secondary nHCHO varies from plume to plume and depends on secondary HCHO production rates and total HCHO loss rates. This can be inferred from nHCHO trends and the loss-only nHCHO decays in Fig. 2 and is also shown in Fig. S8 in the Supplement. We estimate the fraction of primary HCHO by assuming that nHCHO and the loss rate of nHCHO are constant between emission and the closest observation. The primary HCHO fraction could decay rapidly to be 60 % in about 1 h of aging, or it could decay slowly to still account for 60 % in about 5 h of aging. The primary and secondary fractions of HCHO indicate the impact of direct emission and photochemistry on the fire plume composition downwind. The slowing down of the increase in secondary nHCHO fraction with time probably indicates that the production of secondary nHCHO slows down with physical age. The average and standard deviation of nHCHO production and loss rates for each plume are provided in Table S4 in the Supplement.
HCHO production exceeds loss in 9 of the 12 selected plumes, indicated by overall positive trends of nHCHO vs. physical age in Fig. 2. Plumes exhibiting overall negative nHCHO trends (25 July 2019 Shady 2, 3 August 2019 Williams Flats 1, and 6 August 2019 Williams Flats) have higher overall nHCHO loss rates than production rates (Table S4). This shows that fire-to-fire variability in the overall nHCHO trend relates to the balance between loss (via photolysis) and production (via VOC oxidation). HCHO loss by photolysis can be either higher or lower than the loss by reaction with OH, but on average photolysis is faster. HCHO loss via photolysis accounts for 63 ± 27 % of the total HCHO loss in daytime plumes. The average HCHO lifetime by photolysis was 8.2 (± 8.8) h for the 11 daytime plumes, shorter than the average HCHO lifetime by OH oxidation of 23.5 (± 31.3) h. For some plume transects, there was significant variability in HCHO photolysis frequencies over iWAS averaging intervals due to the aerosol radiative effects. Applying filters to only analyze the data with relatively homogeneous in-plume HCHO photolysis rates does not alter our conclusions. Plume-average OH is not well correlated with the HCHO photolysis frequency (Fig. S9 in the Supplement), likely due to inter-fire variability of OH sources and sinks.
Besides the variability among different plumes, nHCHO production and loss also vary within a plume across physical age. In all analyzed plumes, nHCHO slope shifts from positive to neutral or negative within the first 2–6 h (Fig. 2). Figure S10 in the Supplement shows the age progression of nHCHO production, loss, and net change for the 12 plumes. In general, both production and loss decrease with age. Decreases in both are expected due to declining solar radiation, which results from the typical late-afternoon FIREX-AQ sampling strategy. Reduced production with increasing age may also reflect the decay of reactive VOC and oxidant precursors (e.g., HONO).
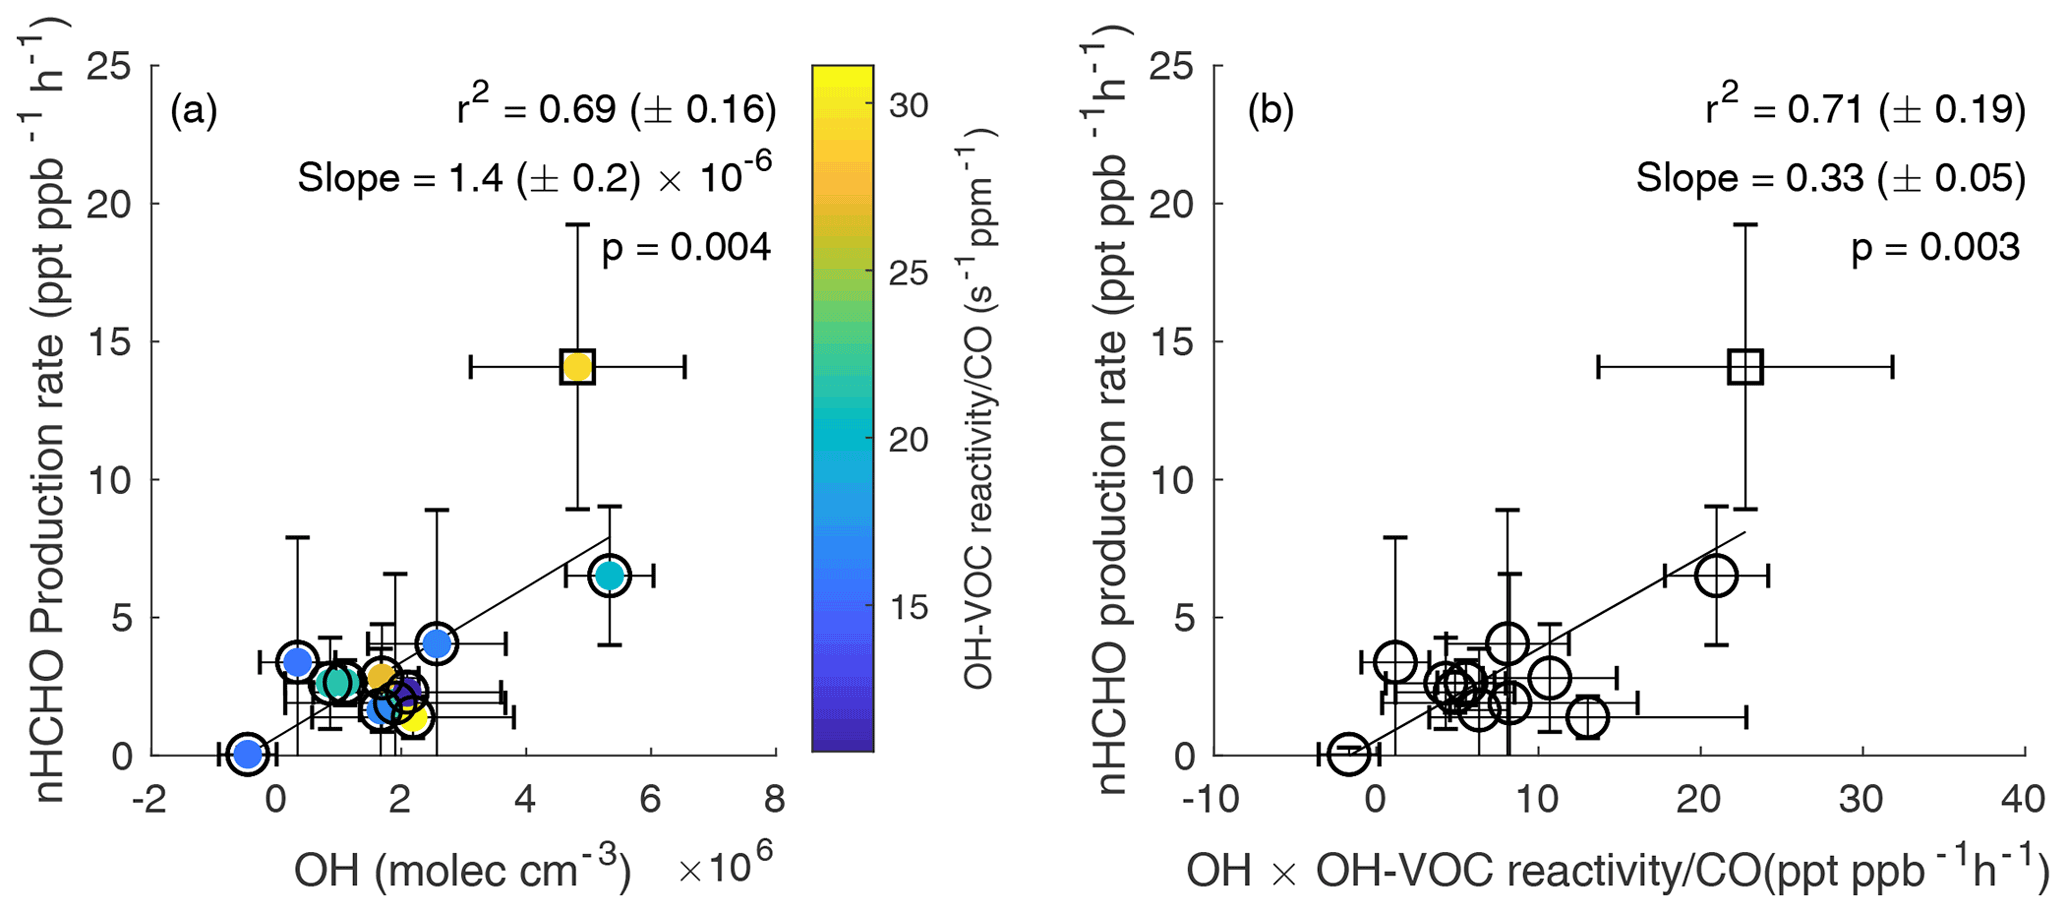
Figure 3(a) Average secondary nHCHO production rate vs. average OH concentration, color-coded by normalized OH-VOC reactivity, for the 12 plumes including 11 western US wildfire plumes (circles) and 1 eastern US wildfire plume (square). An uncertainty-weighted linear York regression (Derek, 1968) yields a slope = 1.4 (± 0.2) × 10−6 and r2 = 0.69 (± 0.16) for the 12 wildfire plumes. (b) Average secondary nHCHO production rate vs. the average product of OH and OH-VOC reactivity normalized to CO (OH× OH-VOC reactivity CO) for each plume. An uncertainty-weighted linear York regression yields a slope = 0.33 (± 0.05) and r2 = 0.71 (± 0.19). The slope represents the estimated effective yield αeff of HCHO per VOC molecule oxidized by OH for the US wildfires. The uncertainties in r2 are from bootstrap analysis. The p value in each panel is to evaluate whether linear correlation is statistically significant (p < 0.05).
3.3 Controls on secondary HCHO formation
The secondary HCHO production rate is determined by a mass balance approach with loss, production, and dilution terms, as discussed in Sect. 2.5. The average secondary nHCHO production rate correlates with the average OH concentration (r2 = 0.69, Fig. 3a). The secondary production rates of nHCHO were calculated from the trends of observed nHCHO (), photolysis loss rate, and OH (Eq. 6). Although OH concentrations are used to calculate secondary nHCHO production rates, the nHCHO loss term (k[OH]nHCHO) due to OH only accounts for 2 %–35 % of all the terms on the righthand side of Eq. (6), which is used to calculate secondary nHCHO production rate for the plumes. This indicates that the good correlation between secondary nHCHO production rate and OH is not due to the inclusion of OH in nHCHO production rate calculation. The uncertainty in nHCHO secondary production rates for each plume is estimated from the standard deviation of the calculated nHCHO secondary production rates along the physical age of the plume. The uncertainty in estimated OH is determined by the propagated uncertainties of OH from trans-2-butene-to-propene ratios and cis-2-butene-to-propene ratios. The nHCHO secondary production rates also correlate with the HCHO photolysis (r2 = 0.53 uncertainty-weighted linear regression), which is not unexpected as OH and JHCHO correlate positively as well. The correlation between nHCHO secondary production rates with oxidant ozone is poor (r2 = 0.1 from bivariate regression). The good correlations (r2 = 0.69) between the secondary production rate of nHCHO and average OH indicate that the variability in OH is a key driver of the secondary production rate of nHCHO. Although there is only one eastern US wildfire plume sampled during FIREX-AQ, it has high VOCs, nHCHO, nHCHO production rate, and OH, and the inclusion of the eastern US wildfire increases the coefficient of determination (r2 from 0.54 to 0.69) and the slope (m from 0.30 to 0.33) of nHCHO secondary production rates vs. OH. More wildfire sampling is needed to understand the difference between western and eastern US wildfires.
Figure 3a is color-coded with normalized OH-VOC reactivity calculated from measured VOCs (Sect. 2.7). Plume-average normalized OH-VOC reactivity ranges from 11 to 31 , which is about 20 % lower than normalized total OH reactivity across the analyzed plumes. nHCHO production rates vs. normalized OH-VOC reactivity (Fig. S11a in the Supplement) shows a lower coefficient of determination (r2) and a higher p value than Fig. 3a. Because uncertainty-weighted linear regression yields a low r2 = .08 for Fig. S11a, unweighted (or equally weighted) bivariate linear regression is used. P values in Fig. 3 show the correlation between nHCHO production rate vs. OH (p = 0.004) or vs. OH× normalized OH-VOC reactivity (p = 0.003) is statistically significant (p < 0.05). Because the yield of HCHO from VOC oxidation is calculated in the study, normalized OH-VOC reactivity instead of normalized total OH reactivity is mainly used. A plot of nHCHO production rate vs. normalized total OH reactivity color-coded with OH is shown in Fig. S11b in the Supplement. Similar to Fig. S11a, the correlation between nHCHO production rate with normalized total OH reactivity is also not significant. Because nHCHO trend, OH concentration, and normalized OH-VOC reactivity all depend on physical age, in addition to the different properties of the plumes, the difference in physical age among these plumes also has an impact on the average values.
Figure 3b shows nHCHO production vs. the product of OH and dilution-normalized observed OH-VOC reactivity (averaged for each plume). The latter is a lower limit for the total average OH loss production rate as observations do not include all OH sinks. The correlation is slightly higher than that in Fig. 3a because variability in normalized OH-VOC reactivity plays a smaller role than OH in affecting PnHCHO. The slope of this relationship, 0.33 ± 0.05, is a metric for the effective yield of HCHO from OH-initiated VOC oxidation. Assuming that reaction of OH with a VOC is the rate-limiting step and ignoring non-OH sources, integrated HCHO production can be written as in Eq. (7).
Where αi is the yield of HCHO from OH oxidation of any VOC reactant Xi and depends on both the structure of X and the fate of reactive intermediates like peroxy radicals, ki is the reaction rate coefficient for VOCi+OH, represents OH-VOC reactivity, and αeff is the effective yield weighted over OH-VOC reactions. If all OH reactivity (including reactions with CO and NO2) instead of OH-VOC reactivity is considered, αeff will be about 20 % smaller. As discussed by Valin et al. (2016), αeff from all OH reactivity is expected to range from 0.2 to 0.4 depending on the magnitude of NOx and the magnitude and speciation of VOC. The yield reported here (0.28 for all OH reactivity) is on the low end of this range, implying that HCHO production in the plumes is not very efficient due to the nature of the emitted VOC and/or the balance of RO2 reactions with NO, HO2, and other RO2. High αeff values reported by Valin et al. (2016) occur in high isoprene emission regions, implying the emitted VOCs in wildfires are not as efficient as isoprene in producing HCHO. Our αeff of 0.28, when considering all OH reactivity, is higher than the value of 0.20 (± 0.01) derived by Wolfe et al. (2019) for total-column HCHO in the remote troposphere, where methane oxidation is the primary HCHO source. The potential low bias in observed HCHO could lead to a proportional (27 %) low bias in αeff. Species that are highly reactive and present in large quantities such as CH3CHO are important for OH-VOC reactivity and αeff calculation. We use proton transfer reaction mass spectrometry (PTRMS) CH3CHO data in OH-VOC reactivity calculation because they are more easily integrated over the iWAS sampling time than TOGA CH3CHO. This indicates that besides the potential missing VOCs, the uncertainties in measured VOCs concentrations and different sampling time resolutions can also contribute to the uncertainties in OH reactivity and αeff. The αeff for the one eastern US wildfire plume is higher than that of the western US wildfire plumes, but more sampling of eastern wildfire plumes is needed to determine if there is a statistical difference in αeff. A higher ratio in the eastern than western US wildfire plumes may contribute to the higher αeff because more NOx generally means more radical turnover and a larger fraction of RO2 + NO, both of which favor HCHO production.
3.4 Implications for interpretation of satellite observations
The quantification of the evolution of HCHO in wildfire plumes can be leveraged to enhance interpretations of satellite remote-sensing observations. The good correlation of dilution-corrected secondary HCHO production and oxidant levels suggests the use of satellite HCHO data to estimate oxidant levels in biomass burning plumes. Similar to the studies of NO2 lifetime from satellite NO2 data (e.g., Laughner and Cohen, 2019; Liu et al., 2016), with parameterized production rates of HCHO as a function of OH from this study, the effective lifetime of HCHO and OH concentrations in the wildfire plumes could potentially be derived from remote-sensing HCHO and CO data if the photolysis rates can be properly parameterized. Satellite HCHO retrievals in biomass burning plumes remain challenging, and information about vertical distributions of trace gases and aerosols from airborne measurements are likely needed to improve satellite retrievals in biomass burning plumes. The effective yield of HCHO from this analysis indicates that the biomass burning VOCs could be less efficient than isoprene in producing HCHO, although other factors such as balance of RO2 reactions with NO, HO2, and other RO2 can play a role. This information may be useful for estimating VOC emissions from satellite HCHO data.
We studied the chemical evolution of HCHO in wildfire plumes during FIREX-AQ. Twelve well-developed plumes with consistent chemical and physical age 1–6 h downwind were selected among 26 wildfire plumes sampled. During plume transport and aging, dilution-corrected HCHO increased in smoke from nine wildfires and decreased in three, depending on the balance of HCHO production and loss processes. Secondary nHCHO production tracks average OH concentrations, indicating that the variability in OH rather than the variability in the reactive VOC pool drives the production of nHCHO in these wildfire plumes. The effective HCHO yield from OH-initiated VOC oxidation is estimated to be 0.33 (± 0.05), which is in about the middle of previous studies of isoprene-rich, urban VOC-dominated, and remote atmospheric background regions.
Change in HCHO concentration with time can be obtained from mass balance equation (Eq. A1):
where P is the HCHO chemical production term, L is the HCHO chemical loss term, and D is the dilution term. Considering the HCHO normalized excess mixing ratio (nHCHO = ) and assuming that the HCHO background change is relatively small (), can be written as
L, D, and P terms are as follows:
By assuming HCHO ≫ HCHObkg, can be written as
where can be derived from measured HCHO and CO vs. physical age; JHCHO is the HCHO photolysis coefficient, derived from in situ actinic flux measurements; OH is calculated from VOCs ratios (Sect. 2.4); kHCHO is the reaction rate coefficient of HCHO and OH.
Data are publicly available at https://doi.org/10.5067/SUBORBITAL/FIREXAQ2019/DATA001 (NASA, 2021). The Frame-work for 0-D Atmospheric Modeling (F0AM) is used in this study. Details about the F0AM model can be found at Wolfe et al. (2016) and Wolfe and Haskins (2021; https://doi.org/10.5281/zenodo.5752566). Model setup scripts for this study are available from the contact author upon request.
The supplement related to this article is available online at: https://doi.org/10.5194/acp-21-18319-2021-supplement.
GMW and TFH directed the research direction. JL analyzed the data and discussed the results with GMW. JL wrote the paper. TFH, GMW, JMSC, JL, and RAH made ISAF HCHO measurements. JBG, AL, and VS made iWAS measurements. GSD, JBN, HSH, and JPD made DACOM CO measurements. SRH and KU made CAFS photolysis frequencies measurements. CDH, CHF, and AA provided the trajectory-based plume physical age. HSH provided MCE calculation. TBR, JP, and IB made O3 measurements. CW, MMC, GIG, and KS made PTR-ToF-MS VOC measurements. AF, DR, and PW made CAMS HCHO measurements. ECA and RSH made TOGA VOC measurements. SSB, CCW, MAR, and RAW made ACES measurements. PRV and JAN made CIMS measurements. All authors reviewed and commented on the paper.
At least one of the (co-)authors is a member of the editorial board of Atmospheric Chemistry and Physics. The peer-review process was guided by an independent editor, and the authors also have no other competing interests to declare.
Publisher's note: Copernicus Publications remains neutral with regard to jurisdictional claims in published maps and institutional affiliations.
We gratefully acknowledge the crew, logistical personnel, science team, and science leadership who facilitated the FIREX-AQ mission. We also thank Gao Chen and Ali Aknan for the merged DC-8 dataset used in this study. Jin Liao, Glenn M. Wolfe, Reem A. Hannun, Jason M. St. Clair, and Thomas F. Hanisco acknowledge support from the NASA Tropospheric Composition Program and NOAA Climate Program Office's Atmospheric Chemistry, Carbon Cycle and Climate (AC4) program (NA17OAR4310004). Samuel R. Hall and Kirk Ullmann were funded by the NASA Tropospheric Composition Program (80NSSC18K0638). This material is based upon work supported by the National Center for Atmospheric Research, which is a major facility sponsored by the National Science Foundation under Cooperative Agreement No. 1852977. Kanako Sekimoto acknowledges the support from the fund Grant-in-Aid for Scientific Research (C) (18K05179) from the Ministry of Education, Culture, Sports, Science and Technology of Japan.
This research has been supported by the National Aeronautics and Space Administration (Tropospheric Composition Program), the National Oceanic and Atmospheric Administration (grant no. NA17OAR4310004), and the National Science Foundation (grant no. 1852977).
This paper was edited by Manvendra K. Dubey and reviewed by two anonymous referees.
Akagi, S. K., Yokelson, R. J., Wiedinmyer, C., Alvarado, M. J., Reid, J. S., Karl, T., Crounse, J. D., and Wennberg, P. O.: Emission factors for open and domestic biomass burning for use in atmospheric models, Atmos. Chem. Phys., 11, 4039–4072, https://doi.org/10.5194/acp-11-4039-2011, 2011.
Alvarado, L. M. A., Richter, A., Vrekoussis, M., Hilboll, A., Kalisz Hedegaard, A. B., Schneising, O., and Burrows, J. P.: Unexpected long-range transport of glyoxal and formaldehyde observed from the Copernicus Sentinel-5 Precursor satellite during the 2018 Canadian wildfires, Atmos. Chem. Phys., 20, 2057–2072, https://doi.org/10.5194/acp-20-2057-2020, 2020.
Alvarado, M. J., Logan, J. A., Mao, J., Apel, E., Riemer, D., Blake, D., Cohen, R. C., Min, K.-E., Perring, A. E., Browne, E. C., Wooldridge, P. J., Diskin, G. S., Sachse, G. W., Fuelberg, H., Sessions, W. R., Harrigan, D. L., Huey, G., Liao, J., Case-Hanks, A., Jimenez, J. L., Cubison, M. J., Vay, S. A., Weinheimer, A. J., Knapp, D. J., Montzka, D. D., Flocke, F. M., Pollack, I. B., Wennberg, P. O., Kurten, A., Crounse, J., Clair, J. M. St., Wisthaler, A., Mikoviny, T., Yantosca, R. M., Carouge, C. C., and Le Sager, P.: Nitrogen oxides and PAN in plumes from boreal fires during ARCTAS-B and their impact on ozone: an integrated analysis of aircraft and satellite observations, Atmos. Chem. Phys., 10, 9739–9760, https://doi.org/10.5194/acp-10-9739-2010, 2010.
Apel, E. C., Hornbrook, R. S., Hills, A. J., Blake, N. J., Barth, M. C., Weinheimer, A., Cantrell, C., Rutledge, S. A., Basarab, B., Crawford, J., Diskin, G., Homeyer, C. R., Campos, T., Flocke, F., Fried, A., Blake, D. R., Brune, W., Pollack, I., Peischl, J., Ryerson, T., Wennberg, P. O., Crounse, J. D., Wisthaler, A., Mikoviny, T., Huey, G., Heikes, B., Sullivan, D. O., and Riemer, D. D.: Upper tropsheric ozone production from lightning NOx-impacted convection: Smoke ingestion case study from the DC3 campaign, J. Geophys. Res.-Atmos., 120, 2505–2523, https://doi.org/10.1002/2014JD022121, 2015.
Atkinson, R., Baulch, D. L., Cox, R. A., Crowley, J. N., Hampson, R. F., Hynes, R. G., Jenkin, M. E., Rossi, M. J., Troe, J., and IUPAC Subcommittee: Evaluated kinetic and photochemical data for atmospheric chemistry: Volume II – gas phase reactions of organic species, Atmos. Chem. Phys., 6, 3625–4055, https://doi.org/10.5194/acp-6-3625-2006, 2006.
Bourgeois, I., Peischl, J., Thompson, C. R., Aikin, K. C., Campos, T., Clark, H., Commane, R., Daube, B., Diskin, G. W., Elkins, J. W., Gao, R.-S., Gaudel, A., Hintsa, E. J., Johnson, B. J., Kivi, R., McKain, K., Moore, F. L., Parrish, D. D., Querel, R., Ray, E., Sánchez, R., Sweeney, C., Tarasick, D. W., Thompson, A. M., Thouret, V., Witte, J. C., Wofsy, S. C., and Ryerson, T. B.: Global-scale distribution of ozone in the remote troposphere from the ATom and HIPPO airborne field missions, Atmos. Chem. Phys., 20, 10611–10635, https://doi.org/10.5194/acp-20-10611-2020, 2020.
Cazorla, M., Wolfe, G. M., Bailey, S. A., Swanson, A. K., Arkinson, H. L., and Hanisco, T. F.: A new airborne laser-induced fluorescence instrument for in situ detection of formaldehyde throughout the troposphere and lower stratosphere, Atmos. Meas. Tech., 8, 541–552, https://doi.org/10.5194/amt-8-541-2015, 2015.
Coggon, M. M., Lim, C. Y., Koss, A. R., Sekimoto, K., Yuan, B., Gilman, J. B., Hagan, D. H., Selimovic, V., Zarzana, K. J., Brown, S. S., Roberts, J. M., Müller, M., Yokelson, R., Wisthaler, A., Krechmer, J. E., Jimenez, J. L., Cappa, C., Kroll, J. H., de Gouw, J., and Warneke, C.: OH chemistry of non-methane organic gases (NMOGs) emitted from laboratory and ambient biomass burning smoke: evaluating the influence of furans and oxygenated aromatics on ozone and secondary NMOG formation, Atmos. Chem. Phys., 19, 14875–14899, https://doi.org/10.5194/acp-19-14875-2019, 2019.
Decker, Z. C. J., Zarzana, K. J., Coggon, M., Min, K. E., Pollack, I., Ryerson, T. B., Peischl, J., Edwards, P., Dubé, W. P., Markovic, M. Z., Roberts, J. M., Veres, P. R., Graus, M., Warneke, C., de Gouw, J., Hatch, L. E., Barsanti, K. C., and Brown, S. S.: Nighttime Chemical Transformation in Biomass Burning Plumes: A Box Model Analysis Initialized with Aircraft Observations, Environ. Sci. Technol., 53, 2529–2538, https://doi.org/10.1021/acs.est.8b05359, 2019.
Derek, Y.: Least-squares fitting of a straight line, Can. J. Phys., 46, 1845–1847, https://doi.org/10.1139/p68-523, 1968.
De Smedt, I., Theys, N., Yu, H., Danckaert, T., Lerot, C., Compernolle, S., Van Roozendael, M., Richter, A., Hilboll, A., Peters, E., Pedergnana, M., Loyola, D., Beirle, S., Wagner, T., Eskes, H., van Geffen, J., Boersma, K. F., and Veefkind, P.: Algorithm theoretical baseline for formaldehyde retrievals from S5P TROPOMI and from the QA4ECV project, Atmos. Meas. Tech., 11, 2395–2426, https://doi.org/10.5194/amt-11-2395-2018, 2018.
Fu, T. M., Jacob, D. J., Palmer, P. I., Chance, K., Wang, Y. X., Barletta, B., Blake, D. R., Stanton, J. C., and Pilling, M. J.: Space-based formaldehyde measurements as constrains on volatile organic compound emissions in east and south Asia and implications for ozone, J. Geophys. Res.-Atmos., 112, 1–15, https://doi.org/10.1029/2006JD007853, 2007.
Garofalo, L. A., Pothier, M. A., Levin, E. J. T., Campos, T., Kreidenweis, S. M., and Farmer, D. K.: Emission and Evolution of Submicron Organic Aerosol in Smoke from Wildfires in the Western United States, ACS Earth Space Chem., 3, 1237–1247, https://doi.org/10.1021/acsearthspacechem.9b00125, 2019.
Gilman, J. B., Lerner, B. M., Kuster, W. C., Goldan, P. D., Warneke, C., Veres, P. R., Roberts, J. M., de Gouw, J. A., Burling, I. R., and Yokelson, R. J.: Biomass burning emissions and potential air quality impacts of volatile organic compounds and other trace gases from fuels common in the US, Atmos. Chem. Phys., 15, 13915–13938, https://doi.org/10.5194/acp-15-13915-2015, 2015.
Hall, S. R., Ullmann, K., Prather, M. J., Flynn, C. M., Murray, L. T., Fiore, A. M., Correa, G., Strode, S. A., Steenrod, S. D., Lamarque, J.-F., Guth, J., Josse, B., Flemming, J., Huijnen, V., Abraham, N. L., and Archibald, A. T.: Cloud impacts on photochemistry: building a climatology of photolysis rates from the Atmospheric Tomography mission, Atmos. Chem. Phys., 18, 16809–16828, https://doi.org/10.5194/acp-18-16809-2018, 2018.
Jaffe, D. A. and Wigder, N. L.: Ozone production from wildfires: A critical review, Atmos. Environ., 51, 1–10, https://doi.org/10.1016/j.atmosenv.2011.11.063, 2012.
Jenkin, M. E., Young, J. C., and Rickard, A. R.: The MCM v3.3.1 degradation scheme for isoprene, Atmos. Chem. Phys., 15, 11433–11459, https://doi.org/10.5194/acp-15-11433-2015, 2015.
Kaiser, J., Jacob, D. J., Zhu, L., Travis, K. R., Fisher, J. A., González Abad, G., Zhang, L., Zhang, X., Fried, A., Crounse, J. D., St. Clair, J. M., and Wisthaler, A.: High-resolution inversion of OMI formaldehyde columns to quantify isoprene emission on ecosystem-relevant scales: application to the southeast US, Atmos. Chem. Phys., 18, 5483–5497, https://doi.org/10.5194/acp-18-5483-2018, 2018.
Koss, A. R., Sekimoto, K., Gilman, J. B., Selimovic, V., Coggon, M. M., Zarzana, K. J., Yuan, B., Lerner, B. M., Brown, S. S., Jimenez, J. L., Krechmer, J., Roberts, J. M., Warneke, C., Yokelson, R. J., and de Gouw, J.: Non-methane organic gas emissions from biomass burning: identification, quantification, and emission factors from PTR-ToF during the FIREX 2016 laboratory experiment, Atmos. Chem. Phys., 18, 3299–3319, https://doi.org/10.5194/acp-18-3299-2018, 2018.
Laughner, J. and Cohen, R. C.: Direct observation of changing NOx lifetime in North American cities, Science, 366, 723–727, 2019.
Lerner, B. M., Gilman, J. B., Aikin, K. C., Atlas, E. L., Goldan, P. D., Graus, M., Hendershot, R., Isaacman-VanWertz, G. A., Koss, A., Kuster, W. C., Lueb, R. A., McLaughlin, R. J., Peischl, J., Sueper, D., Ryerson, T. B., Tokarek, T. W., Warneke, C., Yuan, B., and de Gouw, J. A.: An improved, automated whole air sampler and gas chromatography mass spectrometry analysis system for volatile organic compounds in the atmosphere, Atmos. Meas. Tech., 10, 291–313, https://doi.org/10.5194/amt-10-291-2017, 2017.
Liao, J., Hanisco, T. F., Wolfe, G. M., St. Clair, J., Jimenez, J. L., Campuzano-Jost, P., Nault, B. A., Fried, A., Marais, E. A., Gonzalez Abad, G., Chance, K., Jethva, H. T., Ryerson, T. B., Warneke, C., and Wisthaler, A.: Towards a satellite formaldehyde – in situ hybrid estimate for organic aerosol abundance, Atmos. Chem. Phys., 19, 2765–2785, https://doi.org/10.5194/acp-19-2765-2019, 2019.
Liu, F., Beirle, S., Zhang, Q., Dörner, S., He, K., and Wagner, T.: NOx lifetimes and emissions of cities and power plants in polluted background estimated by satellite observations, Atmos. Chem. Phys., 16, 5283–5298, https://doi.org/10.5194/acp-16-5283-2016, 2016.
Liu, X., Huey, L. G., Yokelson, R. J., Selimovic, V., Simpson, I. J., Müller, M., Jimenez, J. L., Campuzano-Jost, P., Beyersdorf, A. J., Blake, D. R., Butterfield, Z., Choi, Y., Crounse, J. D., Day, D. A., Diskin, G. S., Dubey, M. K., Fortner, E., Hanisco, T. F., Hu, W., King, L. E., Kleinman, L., Meinardi, S., Mikoviny, T., Onasch, T. B., Palm, B. B., Peischl, J., Pollack, I. B., Ryerson, T. B., Sachse, G. W., Sedlacek, A. J., Shilling, J. E., Springston, S., St. Clair, J. M., Tanner, D. J., Teng, A. P., Wennberg, P. O., Wisthaler, A., and Wolfe, G. M.: Airborne measurements of western U. S. wildfire emissions: Comparison with prescribed burning and air quality implications, J. Geophys. Res.-Atmos., 122, 6108–6129, https://doi.org/10.1002/2016JD026315, 2017.
Majdi, M., Sartelet, K., Lanzafame, G. M., Couvidat, F., Kim, Y., Chrit, M., and Turquety, S.: Precursors and formation of secondary organic aerosols from wildfires in the Euro-Mediterranean region, Atmos. Chem. Phys., 19, 5543–5569, https://doi.org/10.5194/acp-19-5543-2019, 2019.
Marais, E. A., Jacob, D. J., Guenther, A., Chance, K., Kurosu, T. P., Murphy, J. G., Reeves, C. E., and Pye, H. O. T.: Improved model of isoprene emissions in Africa using Ozone Monitoring Instrument (OMI) satellite observations of formaldehyde: implications for oxidants and particulate matter, Atmos. Chem. Phys., 14, 7693–7703, https://doi.org/10.5194/acp-14-7693-2014, 2014.
Mauzerall, D. L., Logan, J. A., Jacob, D. J., Anderson, B. E., Blake, D. R., Bradshaw, J. D., Heikes, B., Sachse, G. W., Singh, H., and Talbot, B.: Photochemistry in biomass burning plumes and implications for tropospheric ozone over the tropical South Atlantic, J. Geophys. Res.-Atmos., 103, 8401–8423, https://doi.org/10.1029/97JD02612, 1998.
Meller, R. and Moortgat, G. K.: Temperature dependence of the absorption cross sections of formaldehyde between 223 and 323 K in the wavelength range 225–375 nm, J. Geophys. Res.-Atmos., 105, 7089–7101, https://doi.org/10.1029/1999JD901074, 2000.
Millet, D. B., Jacob, D. J., Boersma, K. F., Fu, T. M., Kurosu, T. P., Chance, K., Heald, C. L., and Guenther, A.: Spatial distribution of isoprene emissions from North America derived from formaldehyde column measurements by the OMI satellite sensor, J. Geophys. Res.-Atmos., 113, 1–18, https://doi.org/10.1029/2007JD008950, 2008.
Min, K.-E., Washenfelder, R. A., Dubé, W. P., Langford, A. O., Edwards, P. M., Zarzana, K. J., Stutz, J., Lu, K., Rohrer, F., Zhang, Y., and Brown, S. S.: A broadband cavity enhanced absorption spectrometer for aircraft measurements of glyoxal, methylglyoxal, nitrous acid, nitrogen dioxide, and water vapor, Atmos. Meas. Tech., 9, 423–440, https://doi.org/10.5194/amt-9-423-2016, 2016.
Müller, M., Anderson, B. E., Beyersdorf, A. J., Crawford, J. H., Diskin, G. S., Eichler, P., Fried, A., Keutsch, F. N., Mikoviny, T., Thornhill, K. L., Walega, J. G., Weinheimer, A. J., Yang, M., Yokelson, R. J., and Wisthaler, A.: In situ measurements and modeling of reactive trace gases in a small biomass burning plume, Atmos. Chem. Phys., 16, 3813–3824, https://doi.org/10.5194/acp-16-3813-2016, 2016.
NASA: Fire Influence on Regional to Global Environments and Air Quality, NASA [data set], https://doi.org/10.5067/SUBORBITAL/FIREXAQ2019/DATA001, last access: 3 December 2021.
Palm, B. B., Peng, Q., Fredrickson, C. D., Lee, B. H., Garofalo, L. A., Pothier, M. A, Kreidenweis, S. M., Farmer, D. K., Pokhrel, R. P., Shen, Y., Murphy, S. M., Permar, W. Hu, L., Campos, T. L., Hall, S. R., Ullmann, K. Zhang, X., Flocke, F., Fischer, E. V., and Thornton, J. A.: Quantification of organic aerosol and brown carbon evolution in fresh wildfire plumes, P. Natl. Acad. Sci. USA, 117, 29469–29477, https://doi.org/10.1073/pnas.2012218117, 2020.
Richter, D., Weibring, P., Walega, J. G., Fried, A., Spuler, S. M., and Taubman, M. S.: Compact highly sensitive multi-species airborne mid-IR spectrometer, Appl. Phys. B, 119, 119–131, https://doi.org/10.1007/s00340-015-6038-8, 2015.
Sachse, G. W., Collins, Jr., J. E., Hill, G. F., Wade, L. O., Burney, L. G., and Ritter, J. A.: Airborne tunable diode laser sensor for high-precision concentration and flux measurements of carbon monoxide and methane, Meas. Atmos. Gases, 1433, 157, https://doi.org/10.1117/12.46162, 1991.
Sander, S. P., Abbatt, J., Barker, J. R., Burkholder, J. B., Friedl, R. R., Golden, D. M., Huie, R. E., Kolb, C. E., Kurylo, M. J., Moortgat, G. K., Orkin, V. L., and Wine, P. H.: Chemical Kinetics and Photochemical Data for Use in Atmospheric Studies Evaluation Number 17, JPL Publ. 10-6, Jet Propul, available at: http://jpldataeval.jpl.nasa.gov/ (last access: 3 December 2021), 2011.
Selimovic, V., Yokelson, R. J., McMeeking, G. R., and Coefield, S.: In situ measurements of trace gases, PM, and aerosol optical properties during the 2017 NW US wildfire smoke event, Atmos. Chem. Phys., 19, 3905–3926, https://doi.org/10.5194/acp-19-3905-2019, 2019.
Simpson, I. J., Akagi, S. K., Barletta, B., Blake, N. J., Choi, Y., Diskin, G. S., Fried, A., Fuelberg, H. E., Meinardi, S., Rowland, F. S., Vay, S. A., Weinheimer, A. J., Wennberg, P. O., Wiebring, P., Wisthaler, A., Yang, M., Yokelson, R. J., and Blake, D. R.: Boreal forest fire emissions in fresh Canadian smoke plumes: C1−C10 volatile organic compounds (VOCs), CO2, CO, NO2, NO, HCN and CH3CN, Atmos. Chem. Phys., 11, 6445–6463, https://doi.org/10.5194/acp-11-6445-2011, 2011.
Stavrakou, T., Müller, J.-F., De Smedt, I., Van Roozendael, M., van der Werf, G. R., Giglio, L., and Guenther, A.: Global emissions of non-methane hydrocarbons deduced from SCIAMACHY formaldehyde columns through 2003–2006, Atmos. Chem. Phys., 9, 3663–3679, https://doi.org/10.5194/acp-9-3663-2009, 2009.
Trentmann, J., Yokelson, R. J., Hobbs, P. V., Winterrath, T., Christian, T. J., Andreae, M. O., and Mason, S. A.: An analysis of the chemical processes in the smoke plume from a savanna fire, J. Geophys. Res.-Atmos., 110, 1–20, https://doi.org/10.1029/2004JD005628, 2005.
Valin, L. C., Fiore, A. M., Chance, K., and Abad, G. G.: The role of OH production in interpreting the variability of CH2O columns in the southeast U.S., J. Geophys. Res.-Atmos., 121, 478–493, https://doi.org/10.1038/175238c0, 2016.
Veres, P. R., Andrew Neuman, J., Bertram, T. H., Assaf, E., Wolfe, G. M., Williamson, C. J., Weinzierl, B., Tilmes, S., Thompson, C. R., Thames, A. B., Schroder, J. C., Saiz-Lopez, A., Rollins, A. W., Roberts, J. M., Price, D., Peischl, J., Nault, B. A., Møller, K. H., Miller, D. O., Meinardi, S., Li, Q., Lamarque, J. F., Kupc, A., Kjaergaard, H. G., Kinnison, D., Jimenez, J. L., Jernigan, C. M., Hornbrook, R. S., Hills, A., Dollner, M., Day, D. A., Cuevas, C. A., Campuzano-Jost, P., Burkholder, J., Paul Bui, T., Brune, W. H., Brown, S. S., Brock, C. A., Bourgeois, I., Blake, D. R., Apel, E. C., and Ryerson, T. B.: Global airborne sampling reveals a previously unobserved dimethyl sulfide oxidation mechanism in the marine atmosphere, P. Natl. Acad. Sci. USA, 117, 4505–4510, https://doi.org/10.1073/pnas.1919344117, 2020.
Warneke, C., McKeen, S. A., de Gouw, J. A., Goldan, P. D., Kuster, W. C., Holloway, J. S., Williams, E. J., Lerner, B. M., Parrish, D. D., Trainer, M., Fehsenfeld, F. C., Kato, S., Atlas, E. L., Baker, A., and Blake, D. R.: Determination of urban volatile organic compound emission ratios and comparison with an emissions database, J. Geophys. Res.-Atmos., 112, D10S47, https://doi.org/10.1029/2006JD007930, 2007.
Westerling, A. L., Hidalgo, H. G., Cayan, D. R., and Swetnam, T. W.: Warming and earlier spring increase Western U. S. forest wildfire activity, Science, 313, 940–943, https://doi.org/10.1126/science.1128834, 2006.
Wiggins, E. B., Soja, A. J., Gargulinski, E., Halliday, H. S., Pierce, R. B., Schmidt, C. C., Nowak, J. B., DiGangi, J. P., Diskin, G. S., Katich, J. M., Perring, A. E., Schwarz, J. P., Anderson, B. E., Chen, G., Crosbie, E. C., Jordan, C., Robinson, C. E., Sanchez, K. J., Shingler, T. J., Shook, M., Thornhill, K. L., Winstead, E. L., Ziemba, L. D., and Moore, R. H.: High Temporal Resolution Satellite Observations of Fire Radiative Power Reveal Link Between Fire Behavior and Aerosol and Gas Emissions, Geophys. Res. Lett., 47, e2020GL090707, https://doi.org/10.1029/2020GL090707, 2020.
Wolfe, G. and Haskins, J.: AirChem/F0AM: v4.2.1, Zenodo [data set], https://doi.org/10.5281/zenodo.5752566, 2021.
Wolfe, G. M., Marvin, M. R., Roberts, S. J., Travis, K. R., and Liao, J.: The Framework for 0-D Atmospheric Modeling (F0AM) v3.1, Geosci. Model Dev., 9, 3309–3319, https://doi.org/10.5194/gmd-9-3309-2016, 2016.
Wolfe, G. M., Nicely, J. M., Clair, J. M. S., Hanisco, T. F., Liao, J., Oman, L. D., Brune, W. B., Miller, D., Thames, A., Abad, G. G., Ryerson, T. B., Thompson, C. R., Peischl, J., McKain, K., Sweeney, C., Wennberg, P. O., Kim, M., Crounse, J. D., Hall, S. R., Ullmann, K., Diskin, G., Bui, P., Chang, C., and Dean-Day, J.: Mapping hydroxyl variability throughout the global remote troposphere via synthesis of airborne and satellite formaldehyde observations, P. Natl. Acad. Sci. USA, 116, 11171–11180, https://doi.org/10.1073/pnas.1908931116, 2019.
Wotawa, G. and Trainer, M.: The influence of Canadian forest fires on pollutant concentrations in the United States, Science, 288, 324–328, https://doi.org/10.1126/science.288.5464.324, 2000.
Yokelson, R. J., Goode, J. G., Ward, D. E., Susott, R. A., Babbitt, R. E., Wade, D. D., Bertschi, I., Griffith, D. W. T., and Hao, W. M.: Emissions of formaldehyde, acetic acid, methanol, and other trace gases from biomass fires in North Carolina measured by airborne Fourier transform infrared spectroscopy, J. Geophys. Res.-Atmos., 104, 30109–30125, https://doi.org/10.1029/1999JD900817, 1999.
Yuan, B., Koss, A., Warneke, C., Gilman, J. B., Lerner, B. M., Stark, H., and de Gouw, J. A.: A high-resolution time-of-flight chemical ionization mass spectrometer utilizing hydronium ions (H3O+ ToF-CIMS) for measurements of volatile organic compounds in the atmosphere, Atmos. Meas. Tech., 9, 2735–2752, https://doi.org/10.5194/amt-9-2735-2016, 2016.
- Abstract
- Introduction
- Methods
- Results and discussion
- Conclusions
- Appendix A: Derivation of secondary nHCHO production rate from mass balance equation
- Code and data availability
- Author contributions
- Competing interests
- Disclaimer
- Acknowledgements
- Financial support
- Review statement
- References
- Supplement