the Creative Commons Attribution 4.0 License.
the Creative Commons Attribution 4.0 License.
 | 03 Dec 2021
Responses of surface ozone to future agricultural ammonia emissions and subsequent nitrogen deposition through terrestrial ecosystem changes
Xueying Liu
Ka Ming Fung
With the rising food demands from the future world population, more intense agricultural activities are expected to cause substantial perturbations to the global nitrogen cycle, aggravating surface air pollution and imposing stress on terrestrial ecosystems. Much less studied, however, is how the terrestrial ecosystem changes induced by agricultural nitrogen deposition may modify biosphere–atmosphere exchange and further exert secondary feedback effects on global air quality. Here we examined the responses of surface ozone air quality to terrestrial ecosystem changes caused by year 2000 to year 2050 changes in agricultural ammonia emissions and the subsequent nitrogen deposition by asynchronously coupling between the land and atmosphere components within the Community Earth System Model framework. We found that global gross primary production is enhanced by 2.1 Pg C yr−1, following a 20 % (20 Tg N yr−1) increase in global nitrogen deposition by the end of the year 2050 in response to rising agricultural ammonia emissions. Leaf area index was simulated to be higher by up to 0.3–0.4 m2 m−2 over most tropical grasslands and croplands and 0.1–0.2 m2 m−2 across boreal and temperate forests at midlatitudes. Around 0.1–0.4 m increases in canopy height were found in boreal and temperate forests, and there were ∼0.1 m increases in tropical grasslands and croplands. We found that these vegetation changes could lead to surface ozone changes by ∼0.5 ppbv (part per billion by volume) when prescribed meteorology was used (i.e., large-scale meteorological responses to terrestrial changes were not allowed), while surface ozone could typically be modified by 2–3 ppbv when meteorology was dynamically simulated in response to vegetation changes. Rising soil NOx emissions, from 7.9 to 8.7 Tg N yr−1, could enhance surface ozone by 2–3 ppbv with both prescribed and dynamic meteorology. We, thus, conclude that, following enhanced nitrogen deposition, the modification of the meteorological environment induced by vegetation changes and soil biogeochemical changes are the more important pathways that can modulate future ozone pollution, representing a novel linkage between agricultural activities and ozone air quality.
- Article
(15551 KB) - Full-text XML
-
Supplement
(3028 KB) - BibTeX
- EndNote


Increased food production for the ever-growing world population has been enabled by the widespread agricultural expansion and intensification with heavy fertilizer applications, which have correspondingly led to an enhancement in ammonia (NH3) emissions from the land by a factor of 2 to 5 since preindustrial times (Behera et al., 2013; Gu et al., 2015; Zhu et al., 2015). For instance, Asia (excluding Siberia), home to more than 60 % of the world population (FAOSTAT, 2021), has experienced a rapid expansion of agricultural activities (Liu and Tian, 2010; Tian et al., 2014), accounting for ∼50 % of the global total consumption of synthetic fertilizer and 30 %–40 % of global manure production (FAOSTAT, 2016). Agriculture-related activities are known to be the most significant sources of atmospheric NH3, of which the vast majority (∼60 %) originates from the excessive use of nitrogenous fertilizer and concentrated operations of livestock feeding on a global scale (Huang et al., 2012; Paulot et al., 2014; Zhang et al., 2018). For Asia, the percentage is even higher (80 %–90 %; Streets et al., 2003; Reis et al., 2009; Gu et al., 2012; Kang et al., 2016; Zhang, 2017; Zhang et al., 2018). Crops typically take up only about 40 %–60 % of the nitrogen fertilizer applied to croplands (Tilman et al., 2002; Zhang et al., 2015; Liu et al., 2016; Mueller et al., 2017), and only 25 %–35 % of the nitrogen fed to dairy cows is converted into milk (Bittman and Mikkelsen, 2009), while most of the remainder is chemically transformed into a variety of simple and complex forms and leaked to the environment. The release of gaseous NH3 into the atmosphere is one of the major nitrogen leakages from agricultural soils. Under a business-as-usual scenario, where future nitrogen use efficiency (NUE; i.e., the fraction of nitrogen input finally harvested as output) in agricultural systems is not expected to be substantially improved, increasing food production will undoubtedly continue to intensify agricultural NH3 emissions into the overlying air (Erisman et al., 2008; Lamarque et al., 2011; Zhang, 2017).
Reactive nitrogen, from the emissions of nitrogen oxides (NOx; NO + NO2) and NH3, is deposited over the land and ocean through a variety of processes collectively known as wet and dry deposition. As the combustion-driven NOx emission is projected to slow down due to regulatory efforts (van Vuuren et al., 2011), while agricultural NH3 emission will continue to increase (Lamarque et al., 2011), future nitrogen deposition is expected to increase overall in the global budget (Galloway et al., 2003; Paulot et al., 2013; Lamarque et al., 2013; Kanakidou et al., 2016) and shift from a nitrate-dominated to ammonium-dominated condition (Ellis et al., 2013; Paulot et al., 2013; Li et al., 2016). Atmospheric nitrogen deposition onto the land surface is an important source of soil mineral nitrogen and, thus, enhances plant growth; this is known as the nitrogen fertilization effect (Reay et al., 2008; Templer et al., 2012). The fertilization effect depends on the soil nitrogen limitation defined as the nitrogen constraint on the productivity of many terrestrial ecosystems (Vitousek et al., 2002; Gruber and Galloway, 2008; LeBauer et and Treseder, 2008; Heimann and Reichstein, 2008; Reay et al., 2008; Zaehle et al., 2010). Nitrogen limitation is often found in natural soils where severe nitrogen competition among plants and microbes exists, and the unmet plant nitrogen demand can be translated to a reduction in the potential gross primary production (GPP) of the terrestrial ecosystems, representing a direct downregulation of photosynthetic carbon gain.
Nitrogen deposition affects the terrestrial carbon and nitrogen cycle, but much less is known about how nitrogen deposition affects atmospheric chemistry via terrestrial changes and feedbacks. As nitrogen limitation is relaxed, enhanced carbon assimilation can be translated to changes in the carbon mass allocated to different plant parts, ultimately manifested as an enhancement in vegetation structural variables such as leaf area index (LAI) and canopy height. Meanwhile, nitrogen deposition can also alter soil inorganic nitrogen composition and a variety of abiotic and biotic processes, including uptake by plants, nitrification, denitrification, immobilization by microbes, and fixation in clay minerals. Soil NOx is produced as a byproduct of nitrification and denitrification, which are two microbial processes that first convert NH3 aerobically to nitrate (NO) and then NO to nitrous oxide (N2O) or nitrogen gas (N2) under anoxic conditions. As LAI, canopy height and soil NOx are known to affect surface air quality, nitrogen deposition can potentially affect atmospheric chemistry through affecting vegetation structure and ecophysiology, as well as soil biogeochemistry.
Nitrogen-mediated changes in vegetation and soil can affect surface ozone air quality via various pathways (Fig. 1). Among them, biogeochemical effects are processes mediated via direct exchange (i.e., emissions or deposition) of relevant chemical species between the terrestrial biosphere (vegetation and soil microbes) and the atmosphere, while biogeophysical or meteorological effects are mediated through a modification of the overlying meteorological environment (i.e., temperature, humidity, turbulence structure, etc.), as defined in Sadiq et al. (2017), Zhou et al. (2018), and Wang et al. (2020). One possible biogeochemical pathway is that LAI enhancement could elevate surface ozone by increasing biogenic volatile organic compound (VOC) emissions in high-NOx environments but could also reduce ozone by increasing the dry depositional uptake via leaf stomata (Zhao et al., 2017; Fu and Tai, 2015). Another possible biogeochemical effect is via the increase in canopy height, which further enhances surface roughness length, turbulent mixing, and, thus, higher aerodynamic conductance for land–atmosphere exchange including, ozone dry deposition (Bonan, 2016; Oleson et al., 2013). Another possible biogeochemical effect is that increased inorganic nitrogen availability facilitates soil NOx emission through nitrification and denitrification processes, which further causes rapid NO and NO2 cycling for ozone formation. Biogeophysical effects or meteorological effects are through vegetation-induced changes in the surface energy balance (e.g., absorbed solar radiation and sensible and latent heat fluxes) and subsequent changes in surface temperature, precipitation, humidity, circulation patterns, and moisture convergence (Wang et al., 2020). Higher temperature enhances ozone mainly through increased biogenic emissions and higher abundance of NOx, while lower humidity reduces the chemical loss rate of ozone (Jacob and Winner, 2009). Surface ozone changes via each individual process are heterogeneous over the globe, and the overall ozone response through various biogeochemical and biogeophysical pathways is highly complex (Zhao et al., 2017).
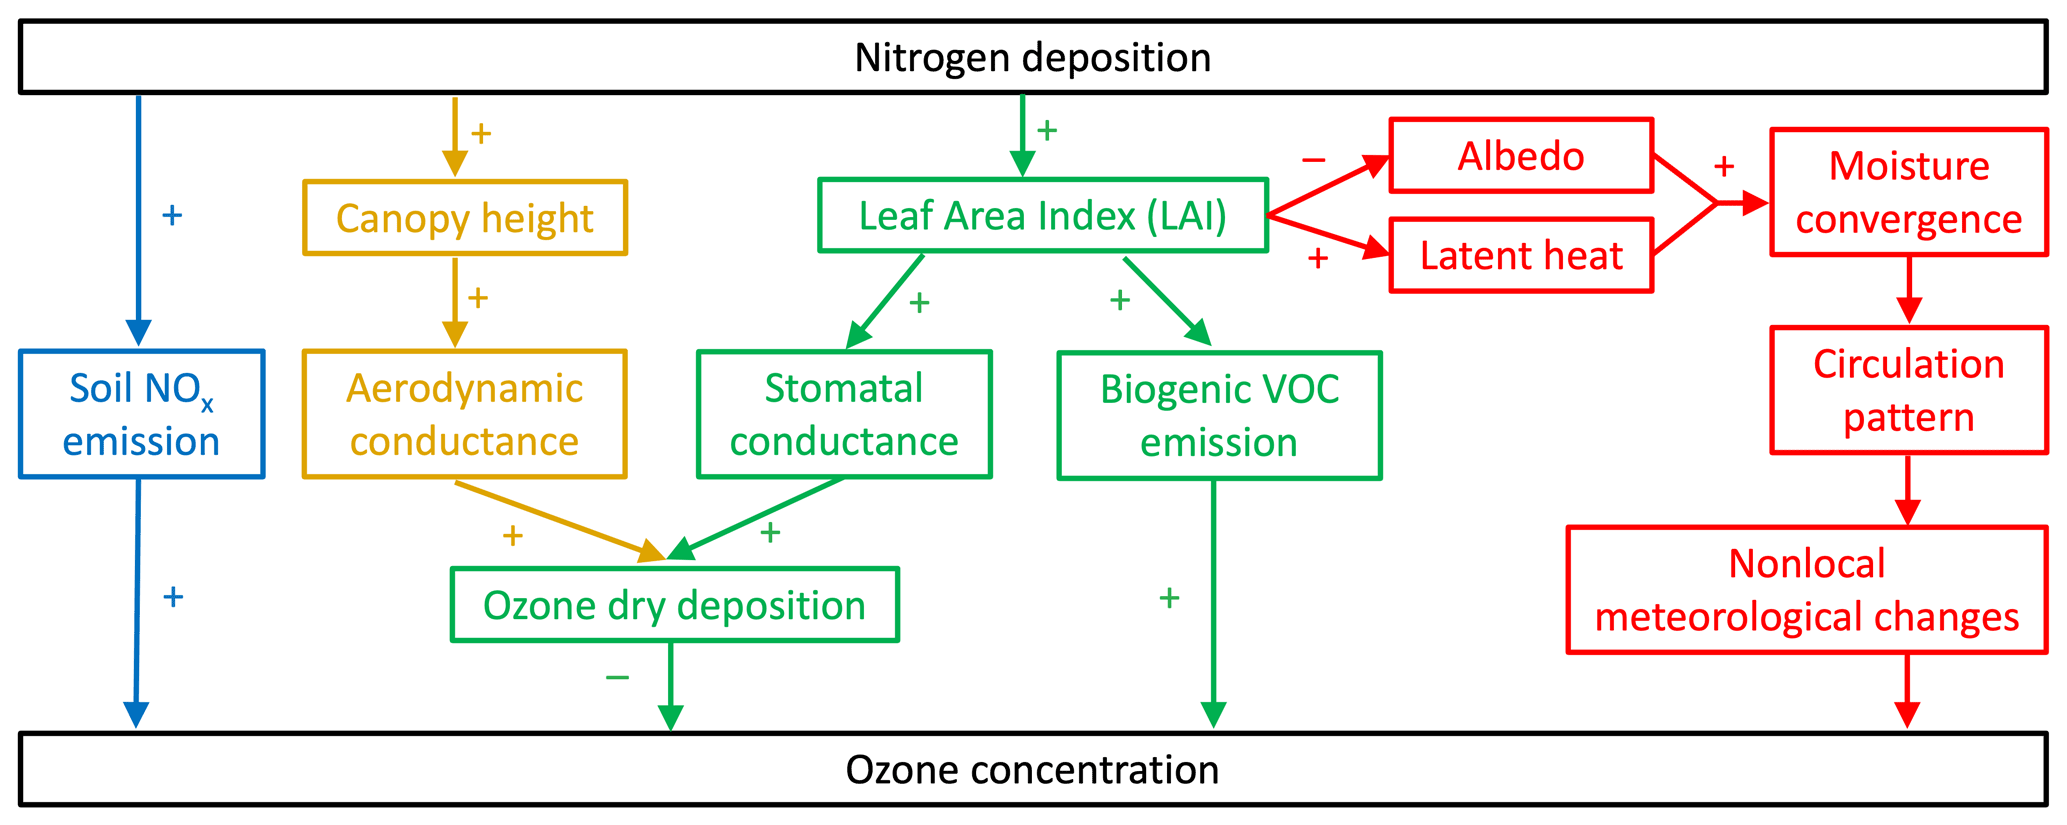
Figure 1Biogeochemical and biogeophysical pathways of nitrogen deposition affecting surface ozone concentration. Biogeochemical pathways via canopy height (yellow), leaf area index (LAI; green), and soil NOx (blue), as well as some of the biogeophysical pathways relevant for this study (red) are shown. The sign associated with each arrow indicates the correlation between the two variables; the sign of the overall effect (positive or negative) of a given pathway is the product of all the signs along the pathway. Biogeochemical pathways affect gas exchange (i.e., biogenic VOC emission and ozone deposition) though plant stomata or microbe-mediated soil processes. Biogeophysical or meteorological pathways are mediated through a modification of the local and nonlocal overlying meteorological environment above the surface layer.
Here we present a study that investigates how agriculture-induced increases in NH3 emissions and subsequent nitrogen deposition could affect surface ozone air quality via terrestrial ecosystem changes in terms of LAI, canopy height and soil NOx emissions. We used an asynchronously coupled modeling framework based on the atmosphere (Community Atmosphere Model with Chemistry – CAM-Chem) and land (Community Land Model – CLM) components of the Community Earth System Model (CESM) to quantify the corresponding responses of surface ozone air quality to terrestrial changes. We first examined the responses of vegetation and soil variables to the present-day vs. future scenarios of nitrogen deposition and then used those terrestrial changes to drive factorial simulations for surface ozone. To evaluate the relative importance of LAI, canopy height, and soil NOx emissions, we evaluated ozone responses to the three individual effects and the overall combined effects using prescribed meteorology (i.e., large-scale meteorological responses to terrestrial changes are not allowed). Furthermore, we evaluated the effects of changing meteorology to surface ozone by conducting simulations using dynamic meteorology (i.e., where the overlying boundary layer meteorology and large-scale circulation also respond to terrestrial changes). Model configuration with dynamic meteorology represents the overall effects from regional terrestrial changes and associated meteorological changes (an integration over both biogeochemical and biogeophysical effects to surface ozone), whereas the setting with prescribed meteorology provides limited above-surface-layer meteorological changes directly caused by terrestrial changes and represents the biogeochemical effects only. Our study emphasizes the complexity of biosphere–atmosphere interactions and their indirect modulating effects on air quality and atmospheric chemistry, which are important for evaluating the impacts from future food production trends on air quality and health beyond the direct effects of agricultural emissions alone.
2.1 Model description
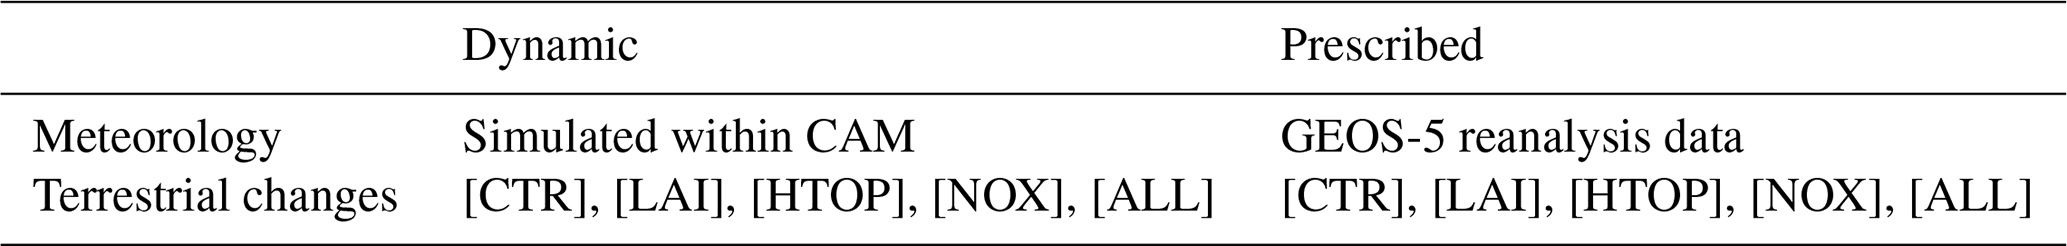
We used the Community Earth System Model (CESM), which includes atmospheric, land, ocean, and sea ice model components. We employed CESM version 1.2.2, with fully interactive atmosphere and land components, but we left the ocean and sea ice prescribed. For the atmosphere component, we used the Community Atmosphere Model version 4 (CAM4; Neale et al., 2013), which is fully coupled with an atmospheric chemistry scheme (i.e., CAM-Chem) that contains full tropospheric O3–NOx–CO–VOC–aerosol chemistry based on the MOZART-4 mechanism (Emmons et al., 2010; Lamarque et al., 2012). Emissions are from the combined emission inventories of the Emissions Database for Global Atmospheric Research (EDGAR), Regional Emission inventory in ASia (REAS), Global Fire Emissions Database (GFED2), and others. CAM-Chem provides the flexibility of performing climate simulations online (i.e., dynamic meteorology) and simulations with specified meteorological fields (i.e., prescribed meteorology). For simulations with dynamic meteorology, it was driven by the Climatic Research Unit National Centers for Environmental Prediction (CRUNCEP) climate forcing data set. For simulations with prescribed meteorology, horizontal wind components, air temperature, surface temperature, surface pressure, sensible and latent heat flux, and wind stress of the Goddard Earth Observing System Model version 5 (GEOS-5) forcing data at 6 h interval were used for years 2000 and 2001 (see Table 1). This version of CAM-Chem simulates the concentrations of 56 atmospheric chemical species at a horizontal latitude-by-longitude resolution of 1.9∘ × 2.5∘ and a vertical resolution of 26 layers for dynamic meteorology and 52 layers for prescribed meteorology.
Table 1Meteorological inputs for simulations with dynamic and prescribed meteorology.
For the land component, we used the Community Land Model version 4.5 (CLM4.5; Oleson et al., 2013) with the satellite phenology (CLM45SP) mode, in which vegetation structures are prescribed (e.g., using satellite-derived LAI data), or with active carbon–nitrogen biogeochemistry (CLM45BGC) that contains prognostic treatments of terrestrial carbon and nitrogen cycles (Lawrence et al., 2011), depending on the cases of concern. In CLM4.5, the Model of Emissions of Gases and Aerosols from Nature (MEGAN) version 2.1 was used to compute biogenic emissions online as functions of LAI, vegetation temperature, solar radiation, soil moisture, and other environmental conditions (Guenther et al., 2012). For dry deposition of gases and aerosols, we used the resistance-in-series scheme in CLM4.5, as described in Lamarque et al. (2012), with updated, optimized coupling of stomatal resistance to LAI (Val Martin et al., 2014). Soil NOx emission was implemented by Fung et al. (2021) as a function of N2O emission, soil-air-filled pore space, and volumetric soil water content during nitrification and denitrification (See the Supplement for details). We also applied a temperature factor to correct the soil NOx overestimation at high latitudes, as in previous studies (Zhao et al., 2017). The evapotranspiration rate was calculated based on the Monin–Obukhov similarity theory for turbulent exchange and the diffusive flux-resistance model with dependence on vegetation, ground and surface temperature, specific humidity, and an ensemble of resistances that are functions of meteorological and land surface conditions (Oleson et al., 2013; Lawrence et al., 2011; Bonan et al., 2011).
2.2 Asynchronously coupled atmosphere chemistry–biosphere modeling framework
An asynchronously coupled system with CAM-Chem and CLM was adopted to investigate the vegetation structural changes induced by nitrogen deposition and their potential to modulate surface ozone under both dynamic and prescribed meteorology. Asynchronous instead of synchronous coupling was used because, currently, CESM does not have the capacity to allow an online bidirectional exchange of reactive nitrogen fluxes between the atmosphere and land components; it also conveniently facilitates sensitivity experiments to be conducted to isolate individual drivers of changes and processes. First, present-day and future scenarios of nitrogen deposition are obtained by CAM-Chem simulations with the corresponding NH3 emission of the years 2000 and 2050. Year 2000 NH3 emission was from the prescribed emission inventory inherent in CAM-Chem (see Sect. 2.1), which includes anthropogenic, ocean, soil, and biomass burning sources. We split the year 2000 anthropogenic NH3 emission into agricultural and non-agricultural parts by using the corresponding ratios based on the Magnitude And Seasonality of Agricultural Emissions model for NH3 (MASAGE_NH3; Paulot et al., 2014). We kept natural and non-agricultural emissions the same in both the year 2000 and year 2050 scenarios and only scaled the year 2000 agricultural NH3 by a growth factor g (Fig. 2c), as follows:
based on crop production estimates from Alexandratos and Bruinsma (2012) and accounting for technology-driven yield improvements and cropland area changes, as in Tai et al. (2014), Tai and Val Martin (2017). We generated the growth factors for major crops (Fig. S1) and obtained an average growth factor from these crop-specific production growths. Such a linear scaling assumes the nitrogen use efficiency (NUE) of fertilization applications remains the same in the future. In practice, NUE is expected to rise with technological advancements, the extent of which is, however, highly uncertain and region specific; we, therefore, regarded our linear scaling as being a representation of the worst-case scenario, where fertilizer nitrogen use remains as inefficient as it is today. For each scenario of the sensitivity experiments, CAM-Chem simulations were conducted for 20 simulation years. Throughout, the CAM-Chem component was still coupled online with CLM45SP with prescribed vegetation structures, which computed land–atmosphere fluxes for CAM-Chem to simulate atmospheric dynamics and chemistry. Both simulations were performed with the prescribed sea surface temperature and sea ice cover following the HadISST (Hadley Centre Global Sea Ice and Sea Surface Temperature) data set (Rayner et al., 2003) at the year 2000 level. Long-lived greenhouse gases and their radiative forcing were kept at the year 2000 level to exclude the effects of increasing temperature on NH3 emissions. The first 5 years of outputs were treated as spinup and, thus, discarded in the analysis, and we calculated the annual averages of the last 15 years to obtain the corresponding nitrogen deposition fluxes for the year 2000 and year 2050 scenarios.
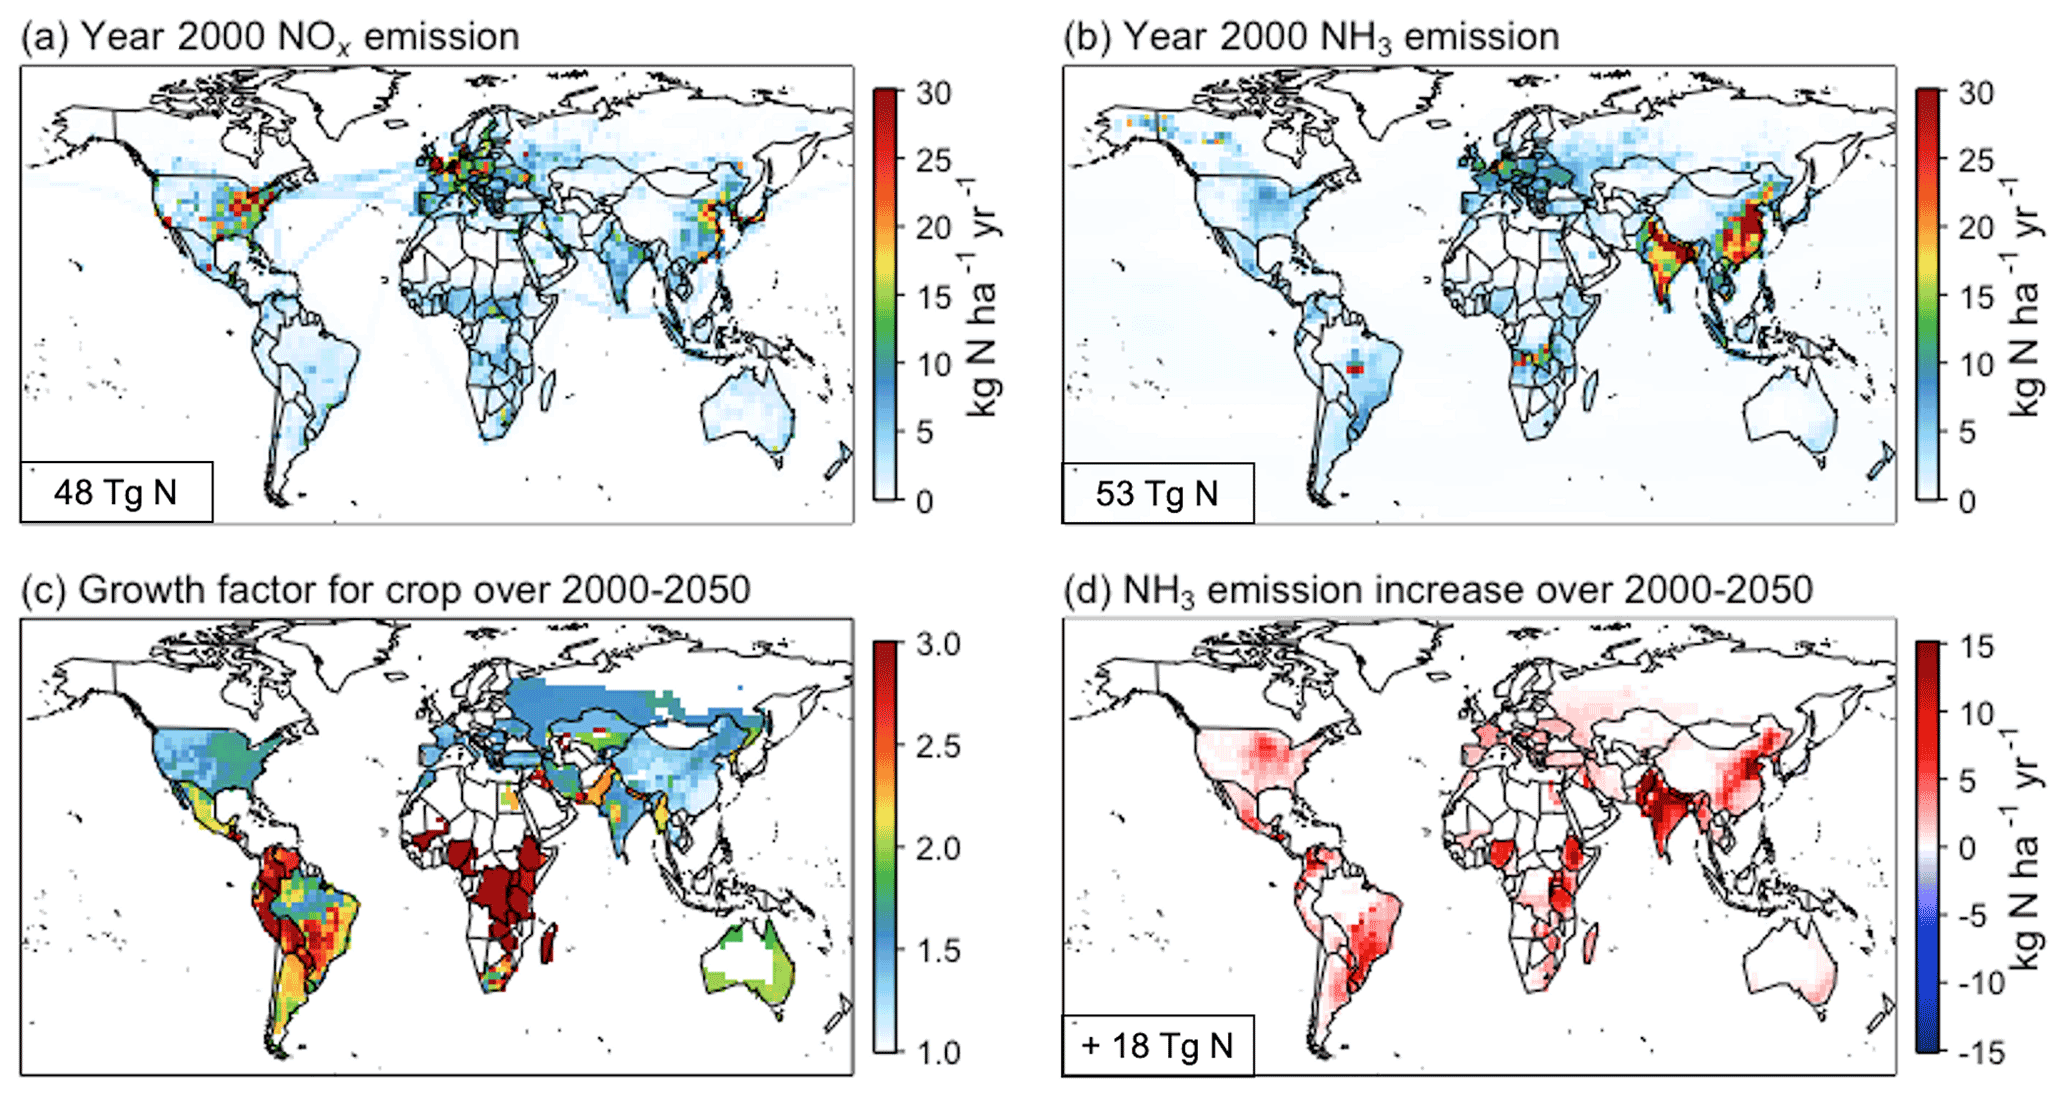
Figure 2Global year 2000 emissions of (a) NOx and (b) NH3, (c) the growth factor g of crop production increase over 2000–2050 from the Food and Agriculture Organization of the United Nations (FAO), (d) and the projected increases in NH3 emissions over 2000–2050.
The CLM45BGC mode was used to investigate vegetation and soil changes in response to perturbations in the nitrogen input to the land. We first obtained steady-state vegetation and soil variables including LAI, canopy height, and soil NOx emissions following present-day nitrogen deposition (obtained from CAM-Chem) for 200 years in the CLM. The first 150 years of outputs were treated as spinup, while the last 50-year average was used to represent the vegetation and soil conditions in a steady state. We used the year 2000 steady state as initial conditions for the following perturbation experiments. We then perturbed the present-day steady state with future nitrogen deposition fluxes following the year 2050 agricultural emission scenario, allowing the vegetation and soil variables to come into a new steady state, which took 10–20 simulation years. After that, the simulation was conducted for another 50 years, which were considered to be year 2050 steady state and then averaged to determine the differences in LAI, canopy height, and soil NOx emissions from the 50-year present-day averages.
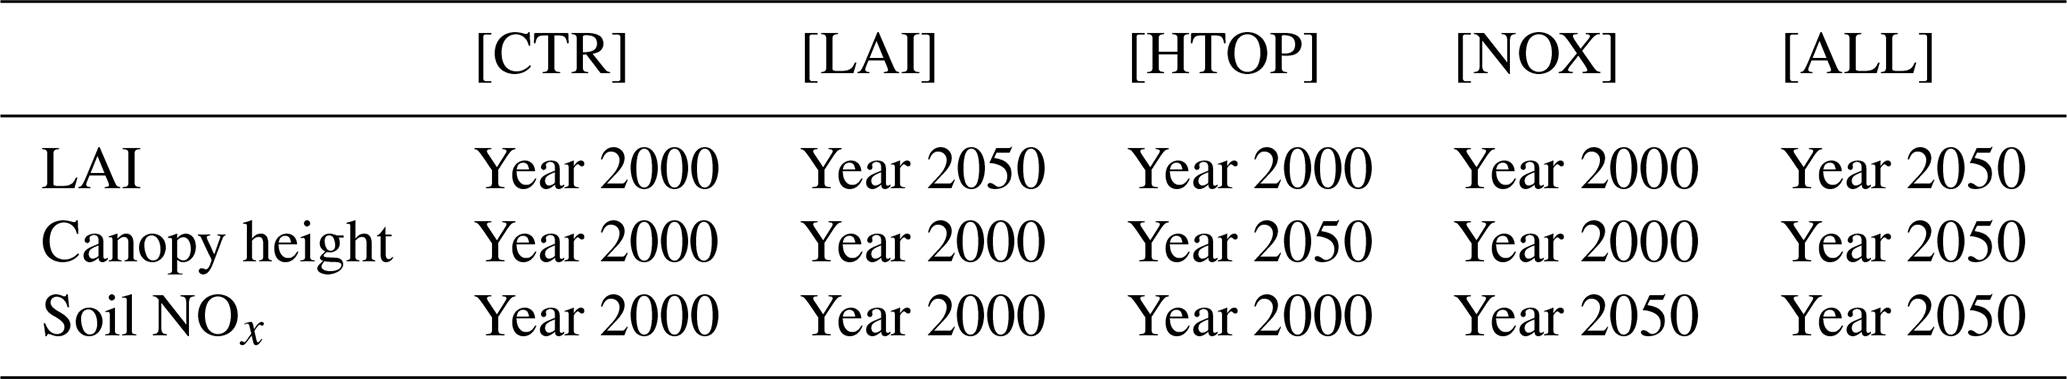
Last, we investigated the individual and combined impacts of the above changes in the three terrestrial pathways (i.e., via LAI, canopy height, and soil NOx emissions) on surface ozone air quality, with both prescribed meteorology (i.e., large-scale meteorological responses to terrestrial changes are not allowed) and dynamic meteorology (i.e., overlying boundary layer meteorology and large-scale circulation also respond to terrestrial changes). Terrestrial changes with prescribed meteorology included only biogeochemical pathways, while terrestrial changes with dynamic meteorology included the combined effects of biogeochemical and biogeophysical processes, as well as larger meteorological and circulation pattern changes. Therefore, we were able to examine the effects from land–atmosphere feedbacks with dynamic meteorology, while prescribed meteorology provided limited atmospheric changes directly caused by terrestrial changes without many land–atmosphere feedbacks. To evaluate the relative importance of individual pathways to the overall effects, we conducted the following five sets of fully coupled land–atmosphere simulations: (1) a control case without any nitrogen-mediated changes in LAI, canopy height, and soil NOx emissions ([CTR]), (2) a simulation with LAI change only ([LAI]), (3) a simulation with canopy height change only ([HTOP]), (4) a simulation with soil NOx emission change only ([NOX]), and (5) a simulation with all changes in LAI, canopy height, and soil NOx emissions ([ALL]). The simulations of [LAI], [HTOP], and [NOX] in relation to [CTR] allowed us to quantify the relative contribution from LAI, canopy height, and soil NOx emissions, respectively, while the simulation of [ALL] reflected the overall ozone changes due to three combined effects. The experiments were summarized in Table 1. We conducted the same set of simulations with both dynamic and prescribed meteorology to examine how meteorological responses to these terrestrial changes would modify the importance of these pathways (Table 2). We focused on average changes in the last 15 years of Northern Hemisphere summer (June, July, and August – JJA) for most of the variables in the rest of this paper, since summer was both the high-ozone season and the growing season of the majority of global vegetation, when ozone–vegetation coupling appeared to be the strongest and most significant.
Table 2Experimental design to quantify surface ozone responses to terrestrial changes including leaf area index (LAI), canopy height, and soil NOx emissions.
We first show the year 2000 emissions of reactive nitrogen as NOx (48 Tg N yr−1; Fig. 2a) and NH3 (53 Tg N yr−1; Fig. 2b), with a global budget of 101 Tg N yr−1, which is in good agreement with Ciais et al. (2013). NOx is densely emitted from industrial and populated regions, while hotspots for NH3 emission are India and eastern China, with intensive agricultural activities and inefficient fertilizer use. The global year 2050 NH3 emission is projected to reach 67, 57, 65, and 71 Tg N yr−1 in the Representative Concentration Pathways (RCPs) of RCP2.6, RCP4.5, RCP6.0, and RCP8.5, respectively, mainly due to rising agricultural production (RCP database version 2.0.5). Yet, RCP projections did not include a sufficient representation of the spatial patterns of agricultural NH3 emissions worldwide – especially in Asia, which has the world's most productive croplands (RCP database version 2.0.5). To capture the year 2000 to year 2050 agricultural intensification, we, therefore, estimated future NH3 emissions based on the FAO year 2000 to year 2050 crop production changes.
The FAO projects global year 2050 crop production to be higher than the year 2000 level due to changes in yield, crop intensity (i.e., multiple cropping and shortening of fallow periods), and arable land (Alexandratos and Bruinsma, 2012). The major increases occur in South America and central Africa due to yield increases and arable land expansion. Production growth factor g in Fig. 2c can go up to 2–3 for South America and 3–5 for central Africa, while it is 1.5–2 for some of the world's most productive croplands at northern midlatitudes, suggesting that the Southern Hemisphere will be playing an increasingly important role in producing food for the future global population. By scaling up year 2000 NH3 emissions by the growth factor in FAO crop production, we estimated that the year 2050 NH3 budget will be 71 Tg N yr−1, a 34 % increase (18 Tg N yr−1) compared to the year 2000 emission, with major increases over East China, India, the midwestern United States, Brazil, Argentina, and East Africa (Fig. 2d). This estimate is comparable to the RCP8.5 estimate of 71 Tg N yr−1, as both studies assumed a business-as-usual scenario, where future NUE in agroecosystems is not expected to be improved much. We fed both year 2000 and year 2050 NH3 emissions into the CESM model to simulate the corresponding nitrogen deposition. The global budget of both reduced (NHx) and oxidized (NOy) nitrogen deposition is 101 Tg N yr−1 in year 2000 (Fig. 3a), which almost balances out the emission totals of both NH3 and NOx. Nitrogen deposition in year 2050 is 121 Tg N yr−1, a 20 % (20 Tg N yr−1) increase from the year 2000 total (Fig. 3b). Increases in year 2000 to year 2050 nitrogen deposition mostly result from increased NHx deposition, since we fixed the NOx emission at the year 2000 level to isolate the deposition changes due to agricultural intensification alone. This increased nitrogen deposition serves as an important input of mineral nitrogen from the atmosphere to the biosphere.
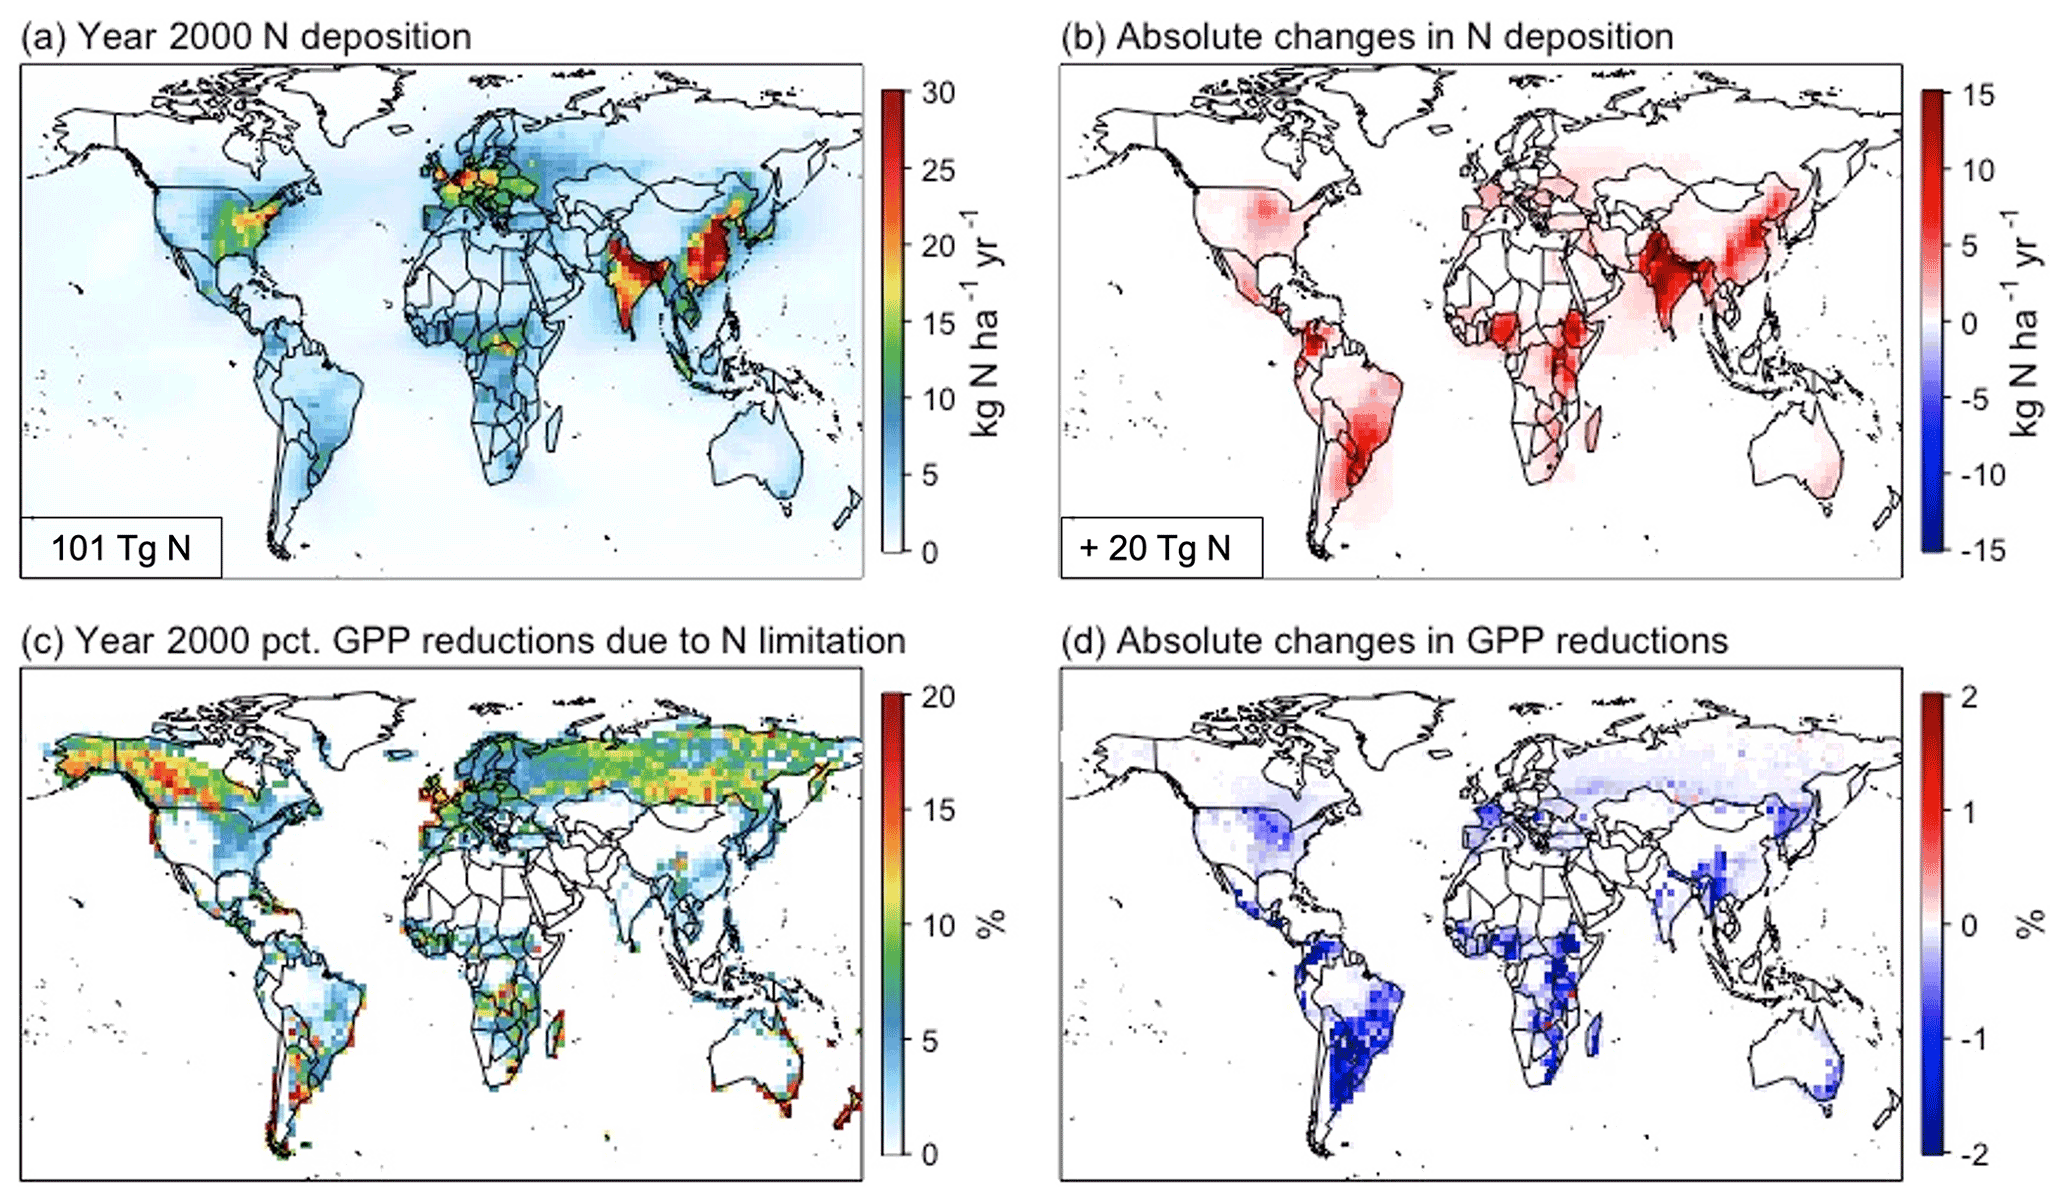
Figure 3(a) Year 2000 atmospheric nitrogen deposition and (b) absolute changes in nitrogen deposition over year 2000 to year 2050. (c) Year 2000 gross primary production (GPP) percentage reduction, due to nitrogen limitation, as presented in the CLM model. In nitrogen-limited soils (i.e., colored areas), plant growth is limited by insufficient soil nitrogen supply due to plant–microbe competition. (d) There are absolute changes in nitrogen-limitation-induced GPP reductions because of enhanced nitrogen availability from atmospheric nitrogen deposition over 2000–2050. Relative changes over 2000–2050 can be found in Fig. S2.
We present, in this section, the fertilization effect of year 2050 nitrogen deposition and associated enhancements in vegetation structure (i.e., LAI and canopy height) and soil NOx emissions compared with those of the year 2000 nitrogen deposition. Nitrogen uptake from the soil is an important determinant of plant growth, as nitrogen is a major component of chlorophyll (i.e., pigments absorbing light energy for photosynthesis) and RuBisCo (i.e., the enzyme necessary for carbon fixation). Meanwhile, mineral nitrogen availability is also vital for nitrification and denitrification microbial processes where NOx is produced as a byproduct. In CLM, the plant nitrogen demand for new growth is calculated by the carbon available for allocation to new growth allocation, given the C:N stoichiometry of a given plant type and plant part. From the soil side, soil mineral nitrogen supply is calculated by adding various nitrogen sources (e.g., atmospheric nitrogen deposition, fertilizer, and biological nitrogen fixation) and subtracting nitrogen sinks (e.g., leaching and assimilation by heterotrophs). When the plant nitrogen demand is greater than the soil nitrogen supply, the plants are not able to take up enough nitrogen to support the carbon allocation for new growth, which would then be reduced (downregulated) by a percentage in the model, which we refer to as the soil nitrogen limitation on plant growth here. When the soil is nitrogen limited, the plants are not able to take up enough nitrogen for maximum photosynthesis, and unmet plant nitrogen demand is translated back to a carbon supply surplus, which is eliminated through the reduction of the GPP in the CLM model. Figure 3c shows the year 2000 GPP percentage reductions due to nitrogen limitation. Most of the nitrogen-limited soils are found over the boreal forests because of slow soil decomposition and turnover, with litter of a high C:N content and a cold climate. Savannas and grasslands in the tropics are also mildly nitrogen limited because of low foliar nitrogen concentrations and plant density. Figure 3d shows the differences in GPP reductions, i.e., year 2050 GPP reductions minus year 2000 GPP reductions. We found smaller GPP reductions induced by nitrogen limitation in the year 2050 than in the year 2000, reflecting higher plant productivity and growth over year 2000 to year 2050. However, this nitrogen fertilization effect is found only over nitrogen-limited regions but not over nitrogen-abundant regions, such as India and northern China, where the critical nitrogen loads are almost always exceeded (Zhao et al., 2017) despite substantial increases in nitrogen deposition over year 2000 to year 2050.
Due to nitrogen fertilization, GPP, LAI, canopy height, and soil NOx emissions over nitrogen-limited regions are generally higher with the year 2050 nitrogen deposition (Fig. 4). Specifically, we found that the year 2050 nitrogen deposition to the land enhances global GPP by 2.1 Pg C yr−1 (Fig. 4e), and the enhanced carbon assimilation can be translated into changes in the carbon mass allocated to different plant parts such as leaves, stems, and roots. The two vegetation structural proxies in the CLM model, LAI, and canopy height, which characterize the carbon allocation to plant tissues, leaf, and stem, respectively. LAI was simulated to be higher by up to 0.3–0.4 m2 m−2 over tropical grasslands and croplands in Brazil, savannas in sub-Saharan Africa, and 0.1–0.2 m2 m−2 across boreal and temperate forests at midlatitudes (Fig. 4f). Canopy heights from broadleaf deciduous trees and needleleaf evergreen trees were simulated to be higher by up to 0.1–0.3 m over the eastern USA, southern Europe, southern Russia, and southeastern China. Increases of 0.3–0.4 m were found over broadleaf deciduous trees in South America, and ∼0.1 m increases were found for grasses and crops over sub-Saharan Africa (Fig. 4g). Meanwhile, the global soil NOx emission budget rises from 7.9 to 8.7 Tg N yr−1 (Fig. 4h) due to faster and greater nitrification and denitrification processes under the year 2050 atmospheric nitrogen deposition.
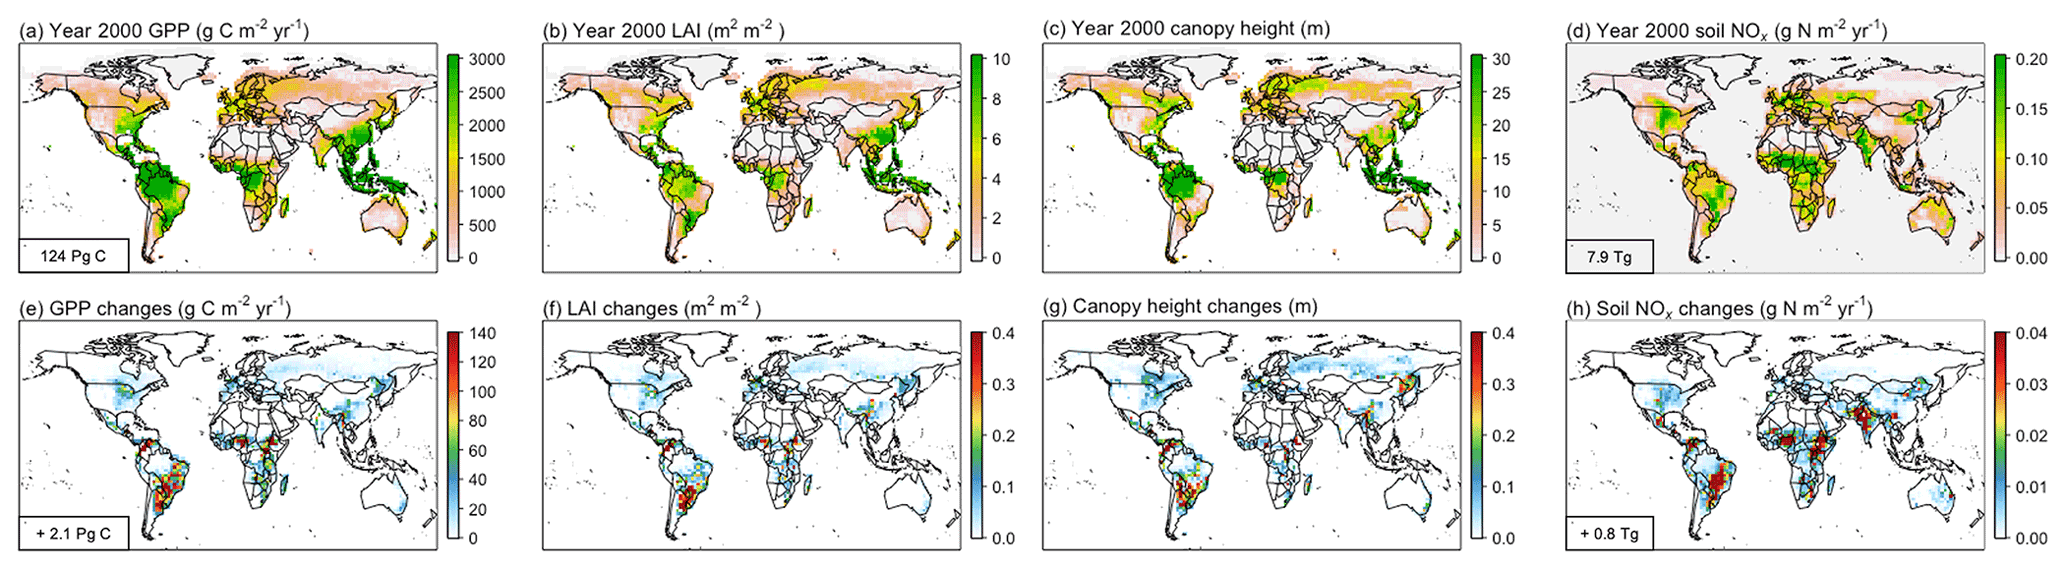
Figure 4Annual mean of year 2000 (a) gross primary production (GPP), (b) leaf area index (LAI), (c) canopy height, and (d) soil NOx emission and the corresponding increases (e–h) due to increased nitrogen deposition over year 2000 to year 2050.
5.1 Surface ozone changes with prescribed meteorology
We first examined the responses of surface ozone air quality to changes in LAI, canopy height, and soil NOx separately, as well as the combined effects of all three with the prescribed meteorology (i.e., large-scale meteorological responses to these terrestrial changes are not accounted for in the ozone changes). With the prescribed meteorology, the responses of ozone are seen mostly where the changes in vegetation cover or soil emission take place. Figure 5d shows that LAI modulates surface ozone biogeochemically (i.e., without perturbing the overlying meteorology) by ±0.5 ppbv (parts per billion by volume), depending on the counteracting effects from enhanced biogenic VOC emission (Fig. 5e) and surface conductance for ozone deposition (Fig. 5d). We estimated a 3.0 Tg yr−1 increase in global biogenic isoprene emission (Fig. 5e), a key source of reduced atmospheric hydrocarbons that are the chief precursors of tropospheric ozone. Yet, rises in dry deposition velocity (Fig. 5f) reduce ozone concentration. The sensitivity of isoprene emissions to LAI is higher than that of dry deposition, rendering the effects of isoprene emissions dominant in northern midlatitude regions that have low LAI to begin with (Wong et al., 2018). As shown in Fig. 5g, increased canopy height decreases ozone by 0.2 ppbv through stronger aerodynamic conductance and, thus, stronger turbulent exchange and dry deposition within the surface layer (without the corresponding changes in the overlying boundary layer meteorology, however, due to the prescribed meteorology). Ozone dry deposition velocity increases by 0.002–0.004 cm s−1, with increased canopy height in central Africa and the northern USA. Figure 5j shows that surface ozone is elevated biogeochemically by 1–3 ppbv in certain low NOx equatorial regions due to increased soil NOx emissions. Overall ozone changes with prescribed meteorology (Fig. 5m) are mostly local and can be explained predominately (80 %–90 %) by biogeochemical effects from soil NOx emissions.
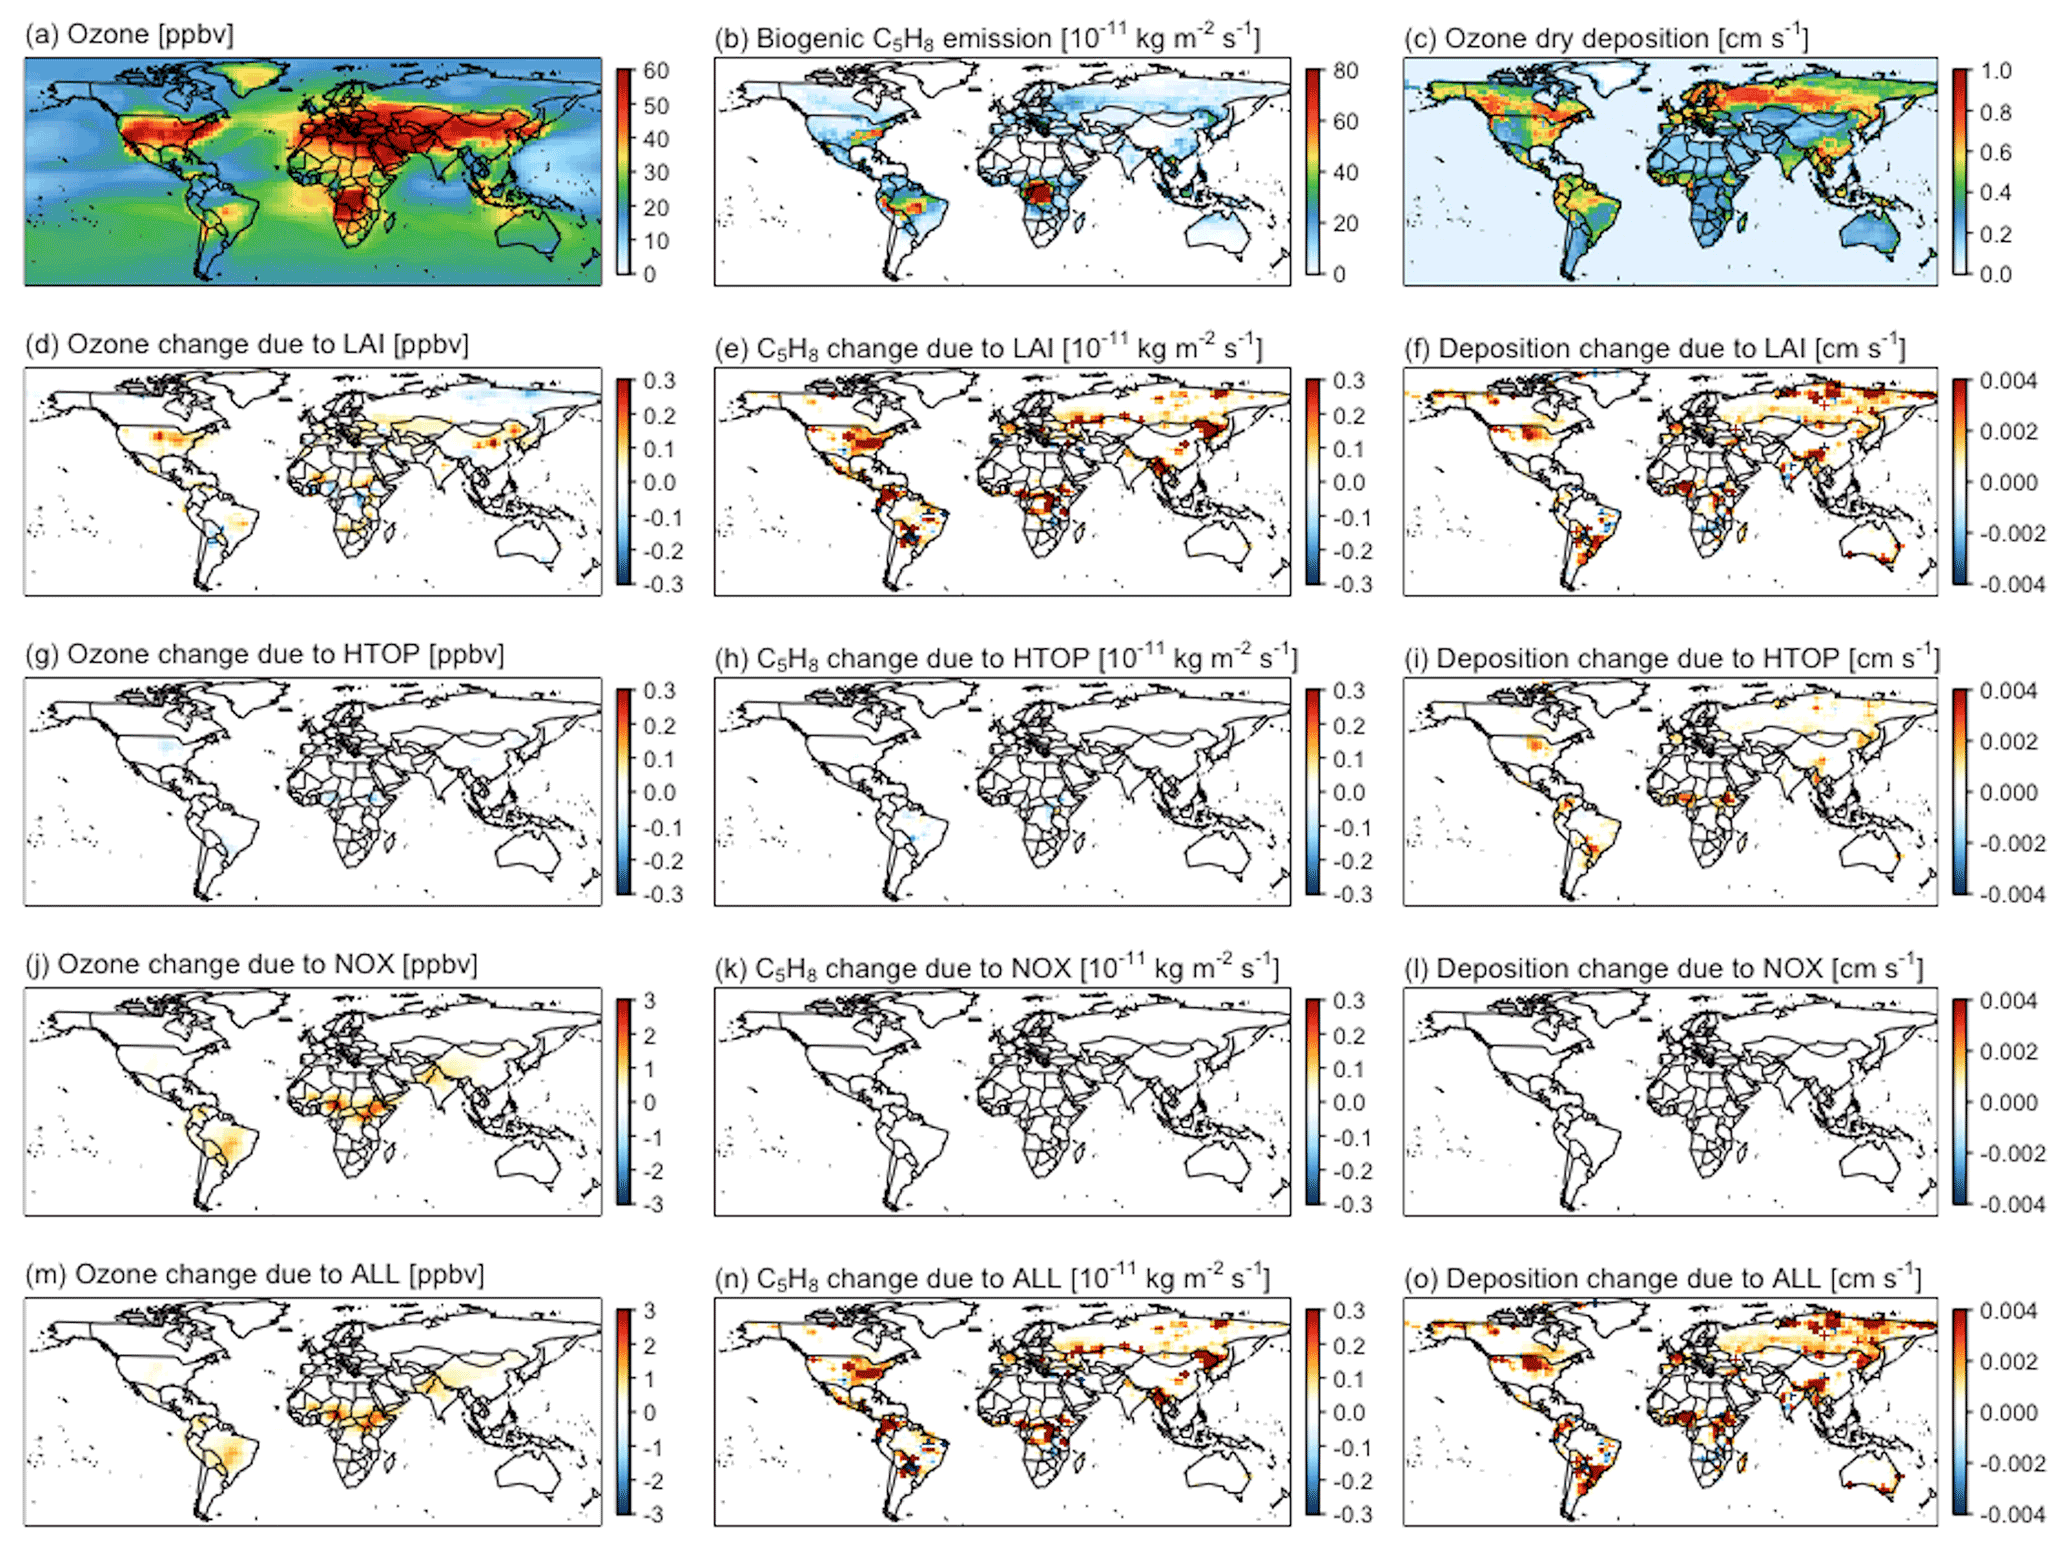
Figure 5Year 2000 summertime (June–July–August; JJA) level of (a) surface ozone concentration, (b) biogenic isoprene emission, (c) ozone dry deposition, and their corresponding changes due to nitrogen-mediated increases in LAI only (d, e, f), canopy height only (g, h, i), soil NOx emission only (j, k, l), and the combination of increases of all elements (m, n, o) with the prescribed meteorology.
5.2 Surface ozone changes with dynamic meteorology
To evaluate the relative importance of regional terrestrial changes vs. terrestrial changes with meteorological changes in regulating surface ozone concentration, we also conducted simulations with dynamic meteorology (i.e., overlying boundary layer meteorology and large-scale circulation could respond to terrestrial changes). The ozone changes with dynamic meteorology are the combined results from regional terrestrial changes and associated meteorological changes, an integration over both biogeochemical and biogeophysical effects. Figure 6 shows that the changes in summertime surface ozone are within ±2–3 ppbv with dynamic meteorology. Overall ozone change with dynamic meteorology (Fig. 6m) are the combined results from the integrated effects of vegetation changes (Fig. 6d, g) and the biogeochemical effects of soil NOx changes (Fig. 6j).
Ozone changes in response to vegetation changes with dynamic meteorology (Fig. 6d, g) are much higher than those with prescribed meteorology (Fig. 5d, g) as vegetation changes could modify boundary layer meteorology, shift circulation patterns, and moisture flows and, thus, shape ozone concentrations. In contrast to the clear, localized signals in ozone changes through the biogeochemical pathways, both local and remote surface ozone changes are found when biogeophysical pathways are involved (Wang et al., 2020). For example, changes in biogenic VOC emissions with dynamic meteorology correlate with air temperature changes (Figs. S3, S4), which is separate from local vegetation changes. Changes in dry deposition also correlate to meteorological changes; stomatal resistance can respond to atmospheric dryness and soil water stress (Figs. S3, S4). Ozone changes in response to soil NOx changes with dynamic meteorology (Fig. 6j) are within the same magnitude as those with prescribed meteorology (Fig. 5j), as soil NOx emissions only change the photochemical production of surface ozone but do not affect biogenic VOC emission and ozone dry deposition directly (Fig. 5k, l) or indirectly via meteorological changes (Fig. 6k, l).
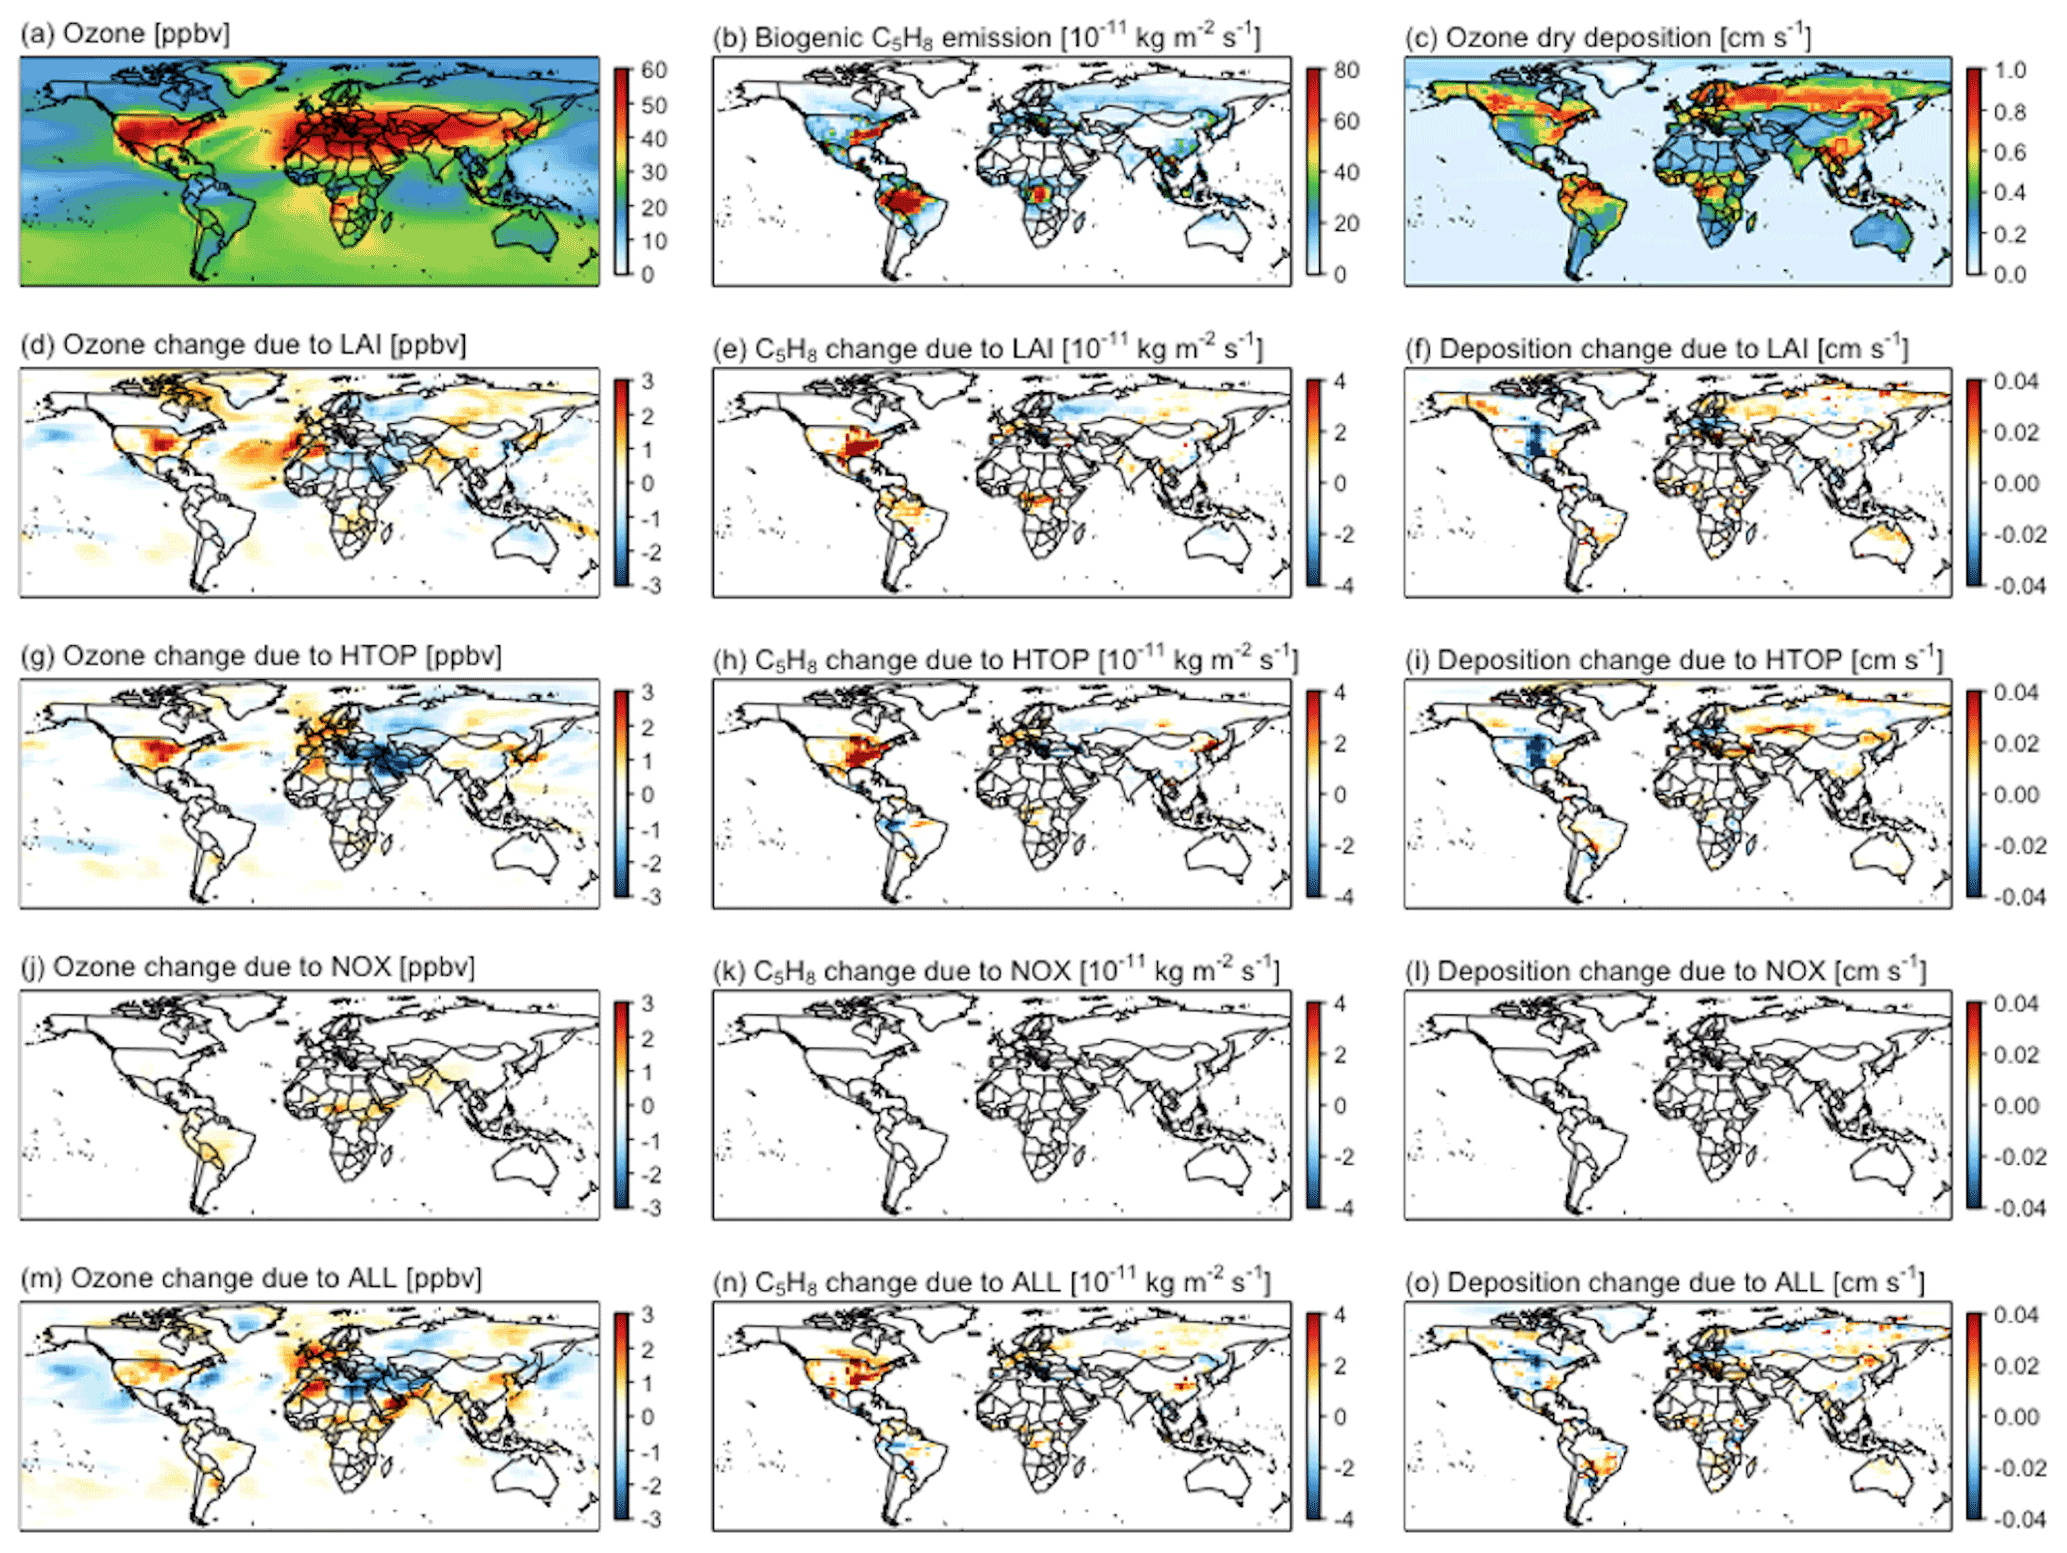
Figure 6Same as Fig. 5 but with dynamic meteorology.
The greatest vegetation enhancements in response to future nitrogen deposition in this study are found over tropical savannas and grasslands, which are less capable of affecting local and pan-regional climate than forests, and our forest structural changes are only mild. Therefore, here we choose the USA, which shows obvious ozone enhancement following vegetation changes, as an example to illustrate the biogeophysical effects further. Figure 7 shows that in the forest regions in the eastern USA where LAI and canopy height changes are relatively large following higher nitrogen deposition, albedo decreases, absorbed radiation increases, and latent heat flux increases and such changes appear to have shifted the surface energy balance and circulation patterns in a way that enhances moisture convergence, precipitation, and soil moisture in the originally wetter places (i.e., the forested eastern USA) but reduces the moisture convergence in the originally drier places (i.e., the grassland regions in the central USA). This constitutes a feedback loop in these grassland regions that reduces transpiration, increases temperature, increases aridity, and, thus, the plant stomata close more, all leading to the relatively large enhancements in surface ozone there. Our mild vegetation changes only have modest local impacts in places with dense vegetation to begin with (e.g., the eastern USA). We found that the vegetation changes shift the circulation patterns and moisture convergence such that it is the adjacent places that are the most affected, which was also reported by Wang et al. (2020), who found obvious temperature increases in the central USA after reforestation in the eastern USA under RCP4.5 land use and land cover change. High temperature and reduced stomatal conductance in the central USA further cause reduced ozone deposition (Fig. 6f), while increased temperature and LAI in the eastern USA enhances biogenic emissions, both of which increase surface ozone in the central–eastern USA (Fig. 6d).
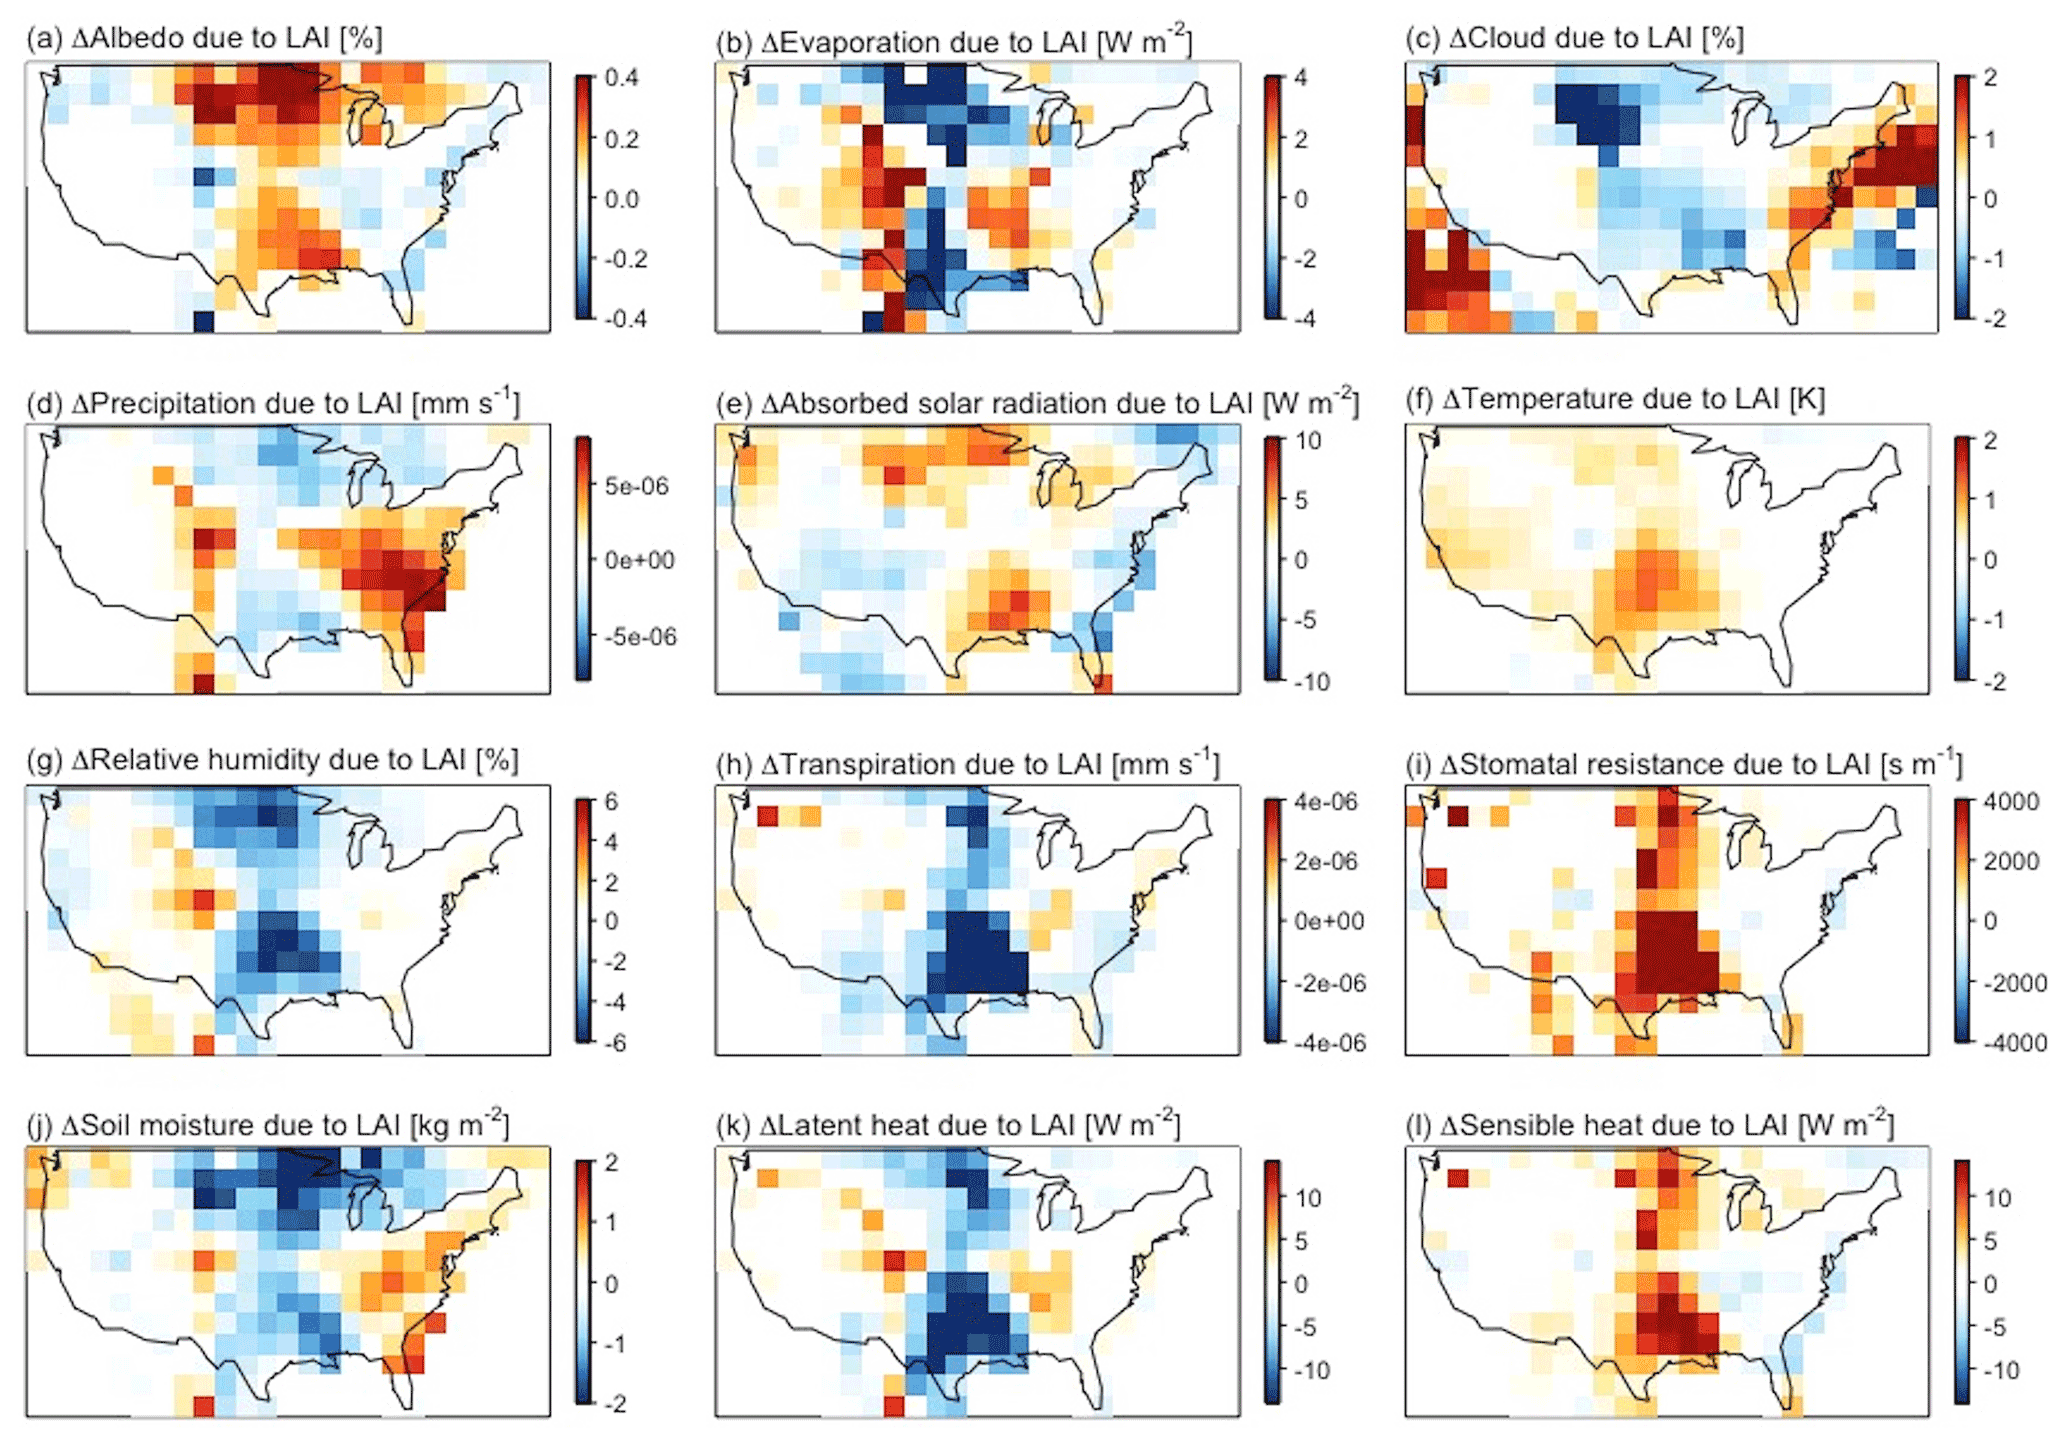
Figure 7Summertime changes in (a) albedo, (b) ground evaporation, (c) cloud cover, (d) precipitation, (e) absorbed solar radiation, (f) surface temperature, (g) relative humidity, (h) vegetation transpiration, (i) stomatal resistance, (j) soil moisture, (k) latent heat flux, and (l) sensible heat flux driven by LAI increase with dynamic meteorology.
Changes in canopy height show similar trends in modulating meteorological conditions (Fig. 8). The effects of meteorological variations induced by vegetation changes can be as important as, or even more important than, the direct biogeochemical effects of vegetation structural changes per se in terms of modulating surface ozone and are of similar magnitude to the biogeochemical effects of soil NOx changes. We note, specifically, that temperature changes resulting from vegetation–meteorology coupling are more important than LAI changes per se in regulating biogenic isoprene emission, especially in regions where obvious warming or cooling occurs. It is noteworthy that, unlike with prescribed meteorology, individual effects may not add up linearly with dynamic meteorology for a given location due to the complex and far-reaching changes in atmospheric circulation and the associated cascade of local and nonlocal changes in climate that are dynamically simulated following terrestrial changes.
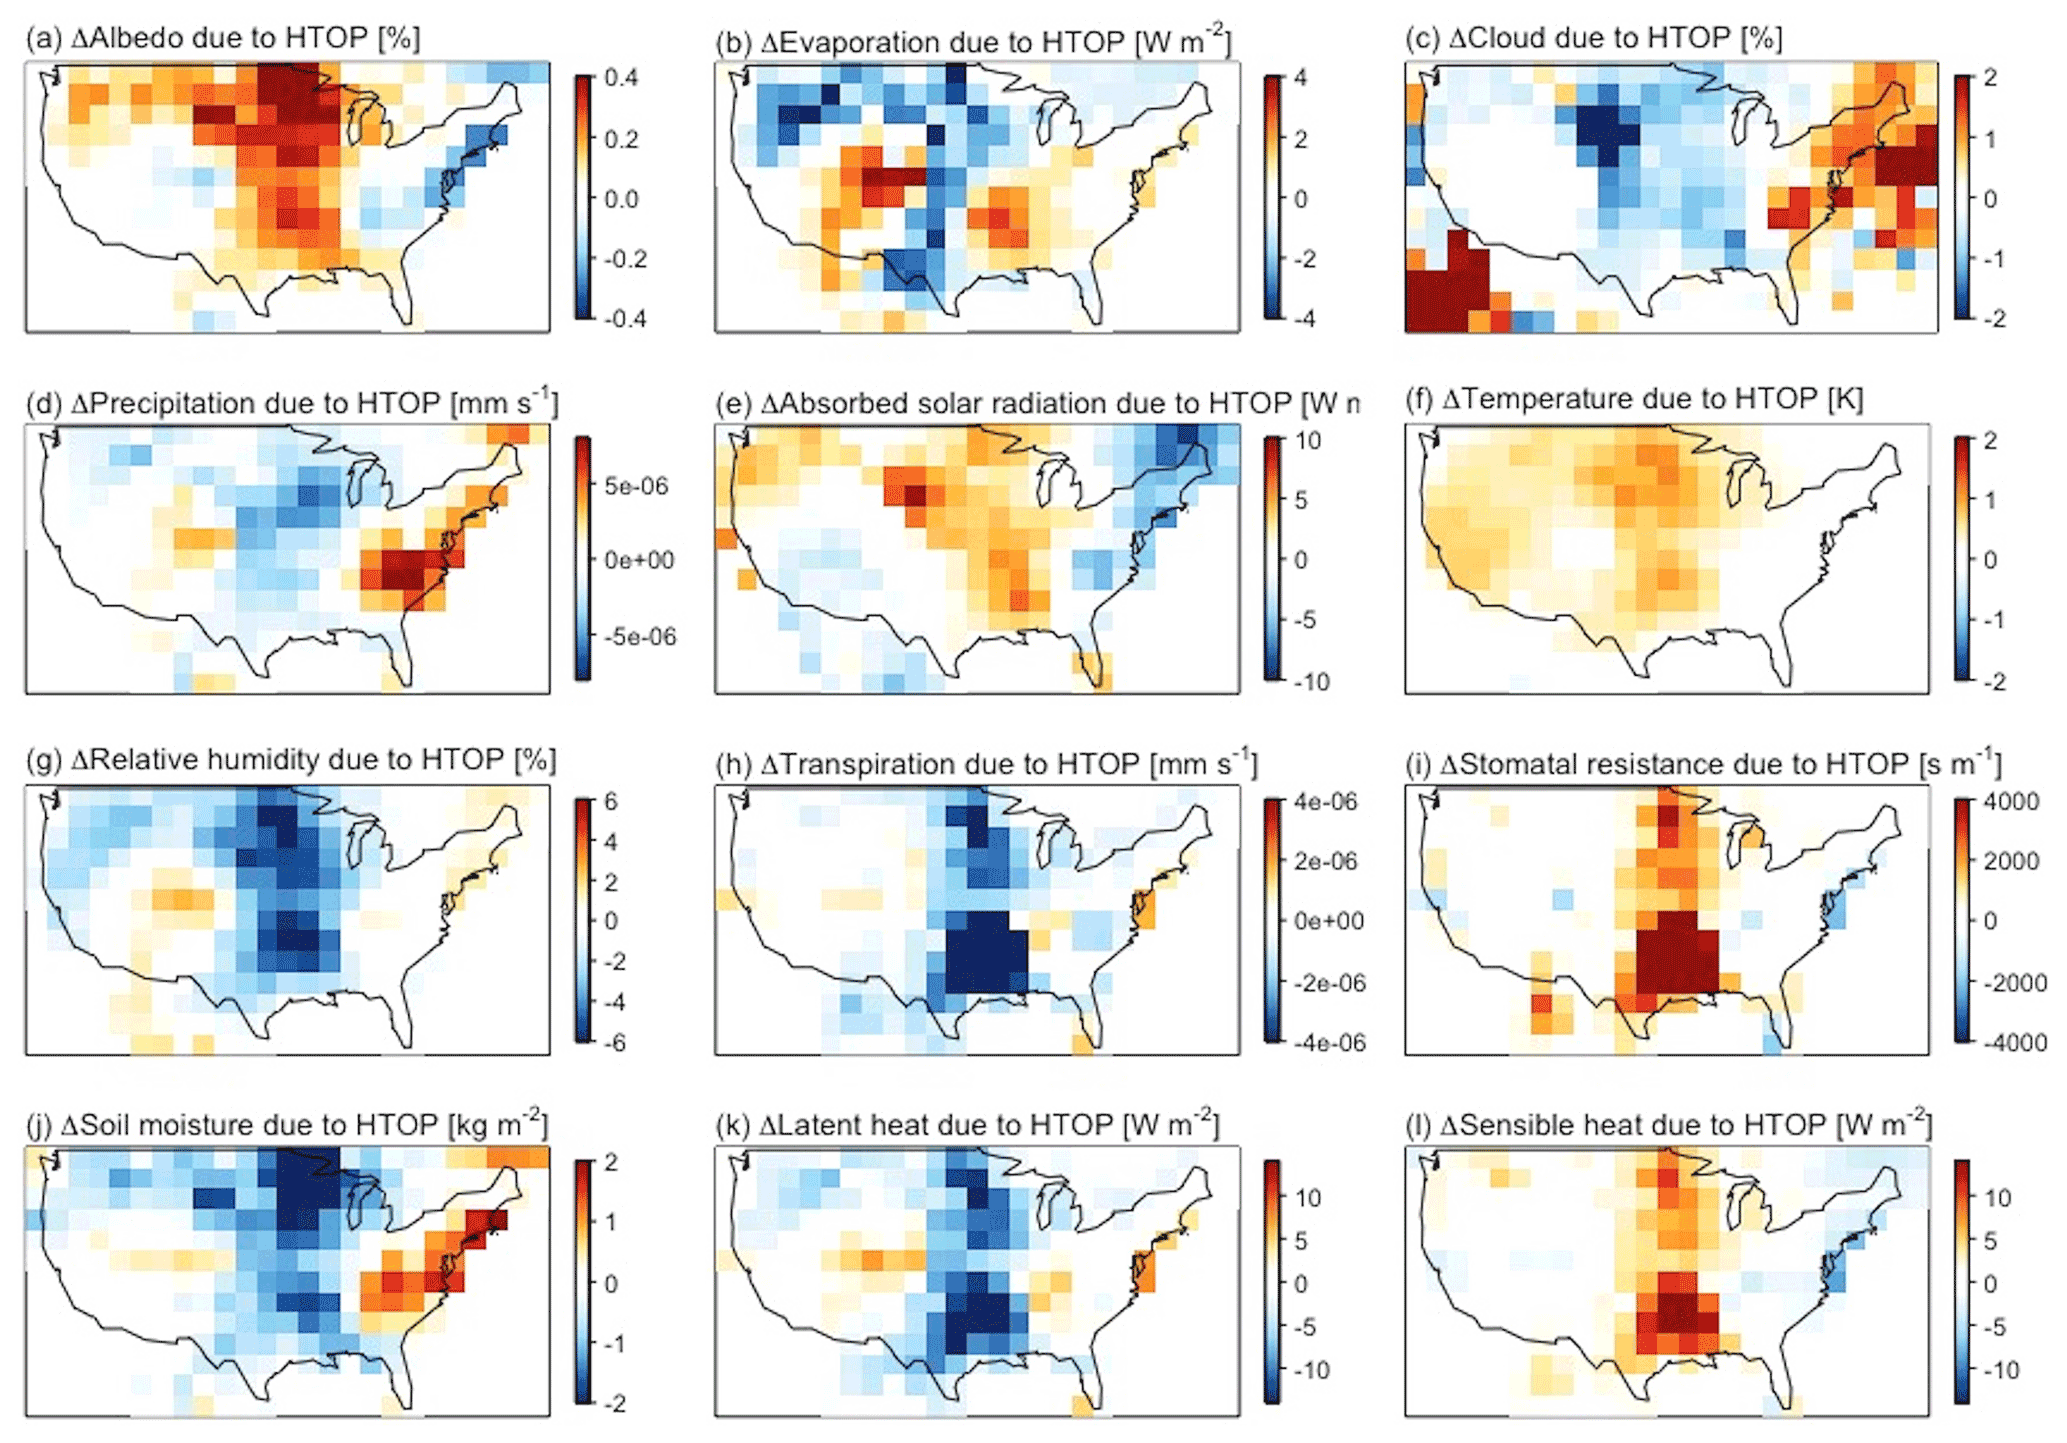
Figure 8Same as Fig. 7 but driven by canopy height increase.
With the rising food need for the future world population, more intense agricultural activities are expected to cause substantial perturbations to the global nitrogen cycle, aggravating surface air pollution and imposing stress on terrestrial ecosystems. Much less studied, however, is how the ecosystem changes induced by agricultural nitrogen deposition may modify biosphere–atmosphere exchange and further exert secondary effects on global air quality. In this paper, we present a study to quantify the response of surface ozone air quality to vegetation structural (LAI and canopy height) and soil NOx emission changes under year 2000 vs. year 2050 agricultural ammonia emissions over centurial timescales by using an asynchronously coupled framework.
Agricultural ammonia emission in the coming decades is destined to increase. We estimated the year 2050 NH3 emissions to be 71 Tg N yr−1, a 34 % increase compared to the year 2000 emissions. Our estimate is comparable to 71 Tg N yr−1 made by RCP8.5, as both studies assumed a business-as-usual scenario where future NUE in agroecosystems is not expected to be improved by much. However, it should be acknowledged that increases in food production may also be obtained with a less-than-proportionate increase in fertilizer use as countries are developing a greater awareness of agriculture-related environmental impacts and adopting more efficient nutrient use practices in the coming decades. Gu et al. (2015) reported that reasonable changes in diet, NUE, and N recycling could reduce year 2050 N losses and anthropogenic reactive nitrogen creation to 52 % and 64 % of 2010 levels, respectively, in China. Fung et al. (2019) showed that the maize–soybean intercropping improves NUE by easing fertilizer application and NH3 volatilization in agricultural soils in China. Therefore, we acknowledge that the future paths of agricultural NH3 emissions and nitrogen deposition may differ from what we projected as a worst-case scenario in this study, but we do not expect the nature of the mechanisms and conclusions in this study to be altered significantly.
Atmospheric nitrogen deposition increases carbon uptake by terrestrial biosphere in nitrogen-limited areas and also stimulates release of NOx, nitrous oxide (N2O), and NH3 from soils (Reis et al., 2009; Zaehle et al., 2011). We found that nitrogen deposition increases by 20 % from year 2000 to year 2050, due to rising agricultural NH3 emissions, and this enhances global GPP by 2.1 Pg C yr−1. LAI was simulated to be higher by up to 0.3–0.4 m2 m−2 in the tropical grasslands and croplands and 0.1–0.2 m2 m−2 in the midlatitude boreal and temperate forests. Canopy height increases were found in boreal and temperate forests (by 0.1–0.4 m), as well as in tropical grasslands and croplands (by ∼0.1 m). The soil NOx emission budget rises to 8.7 Tg N yr−1 with the year 2050 nitrogen deposition because of intensive nitrification and denitrification processes. Due to decreasing trends of anthropogenic NOx emissions throughout this century (Myhre et al., 2013), soil NOx is expected to play an increasingly important role in the global NOx budget. Therefore, the inclusion of effects of soil NOx emissions to surface ozone is essential. These estimates are based on carbon and nitrogen interactions in CLM4.5 biogeochemistry (CLM4.5-BGC), which are widely used in estimating the long-term trajectory of terrestrial variations (Lombardozzi et al., 2012; Val Martin et al., 2014; Sadiq et al., 2017; Zhou et al., 2018). However, the internal soil nitrogen cycle, its coupling with the atmosphere, and reactive nitrogen gas emissions, other than N2O, are not fully represented in default CLM4.5-BGC. The soil NOx emission module that we added, which allows soil NOx to respond to nitrogen deposition from the atmosphere, partly improved the representation (Fung et al., 2021), but the NH3 emission we used was still based on inventories and scaling with future crop production and, thus, did not respond to nitrogen deposition. We expect, however, that the secondary effect of nitrogen deposition on NH3 should be much smaller than any perturbations due to agricultural changes (Fung et al., 2021). Moreover, fully coupled bidirectional nitrogen fluxes were not enabled in our model setting. Future work is needed to examine the overall downstream biogeochemical and biogeophysical effects in an Earth system model with a closed nitrogen cycle, where soil NOx and NH3 emissions to the atmosphere and nitrogen deposition from the atmosphere are fully coupled dynamically.
With only the biogeochemical effects of nitrogen-induced terrestrial changes (with prescribed meteorology where meteorological changes are not included), surface ozone is elevated by 1–3 ppbv in certain low NOx equatorial regions due to increased soil NOx emissions, while LAI and canopy height only modulate surface ozone by ±0.5 and 0.2 ppbv, respectively. With both the biogeochemical and biogeophysical effects under dynamic meteorology, changes in summertime surface ozone are within ±2–3 ppbv. Ozone responses due to vegetation changes are much higher with dynamic meteorology than prescribed meteorology, as vegetation changes shift surface energy balance, circulation patterns, and moisture flow and, thus, shape ozone concentrations. Local meteorological variations induced by vegetation structural changes are generally more important than the vegetation changes per se in terms of modulating surface ozone concentration and appear to be as important as the biogeochemical soil NOx effect. Furthermore, biogeophysical pathways related to canopy height changes have not been accounted for by most previous studies of ozone–vegetation interactions, which usually only considered LAI and other ecophysiological changes (Wang et al., 2020; Wong et al., 2018; Zhao et al., 2017; Fu and Tai, 2015). Global vegetation growth is altered by land use and land cover change, warming, CO2 fertilization, nitrogen deposition, ozone damage, etc., but the associated canopy height changes have usually been ignored, rendering an incomplete representation of terrestrial effects on surface air quality predictions. Here, we found that the effects of canopy height changes on surface ozone through the biogeophysical pathways are noticeable and can be as much as the effects associated with LAI changes alone.
One limitation of this study is that we did not consider ozone damage on stomatal conductance and photosynthesis, as in the study by Sadiq et al. (2017). If ozone damage on stomatal conductance is considered, higher ozone concentrations could have positive feedbacks on ozone itself via reduced dry deposition and enhanced isoprene emission. Meanwhile, ozone damage on plant productivity may also diminish the fertilization effect of nitrogen and foliar nitrogen content, which is itself vital for photosynthetic capacity (Franz and Zaehle, 2021). Therefore, if ozone damage is considered, lower LAI and canopy height are expected, thus compensating for some of the enhanced LAI and canopy height induced by higher nitrogen deposition found in this study. These changes in LAI and canopy height could further affect ozone via various biogeochemical and biogeophysical pathways, but such a secondary feedback effect is expected to be relatively minor (Zhou et al., 2018). More work is warranted to investigate the individual and combined effects of nitrogen deposition and ozone damage on plant growth and terrestrial carbon uptake, especially in light of the possible nonlinear interactions between ozone and nitrogen in plants (e.g., Shang et al., 2021).
Overall, our study demonstrates a novel link between agricultural activities and ozone air quality via the modulation of vegetation and soil biogeochemistry by nitrogen deposition and highlights the particular importance of considering meteorological changes following vegetation structural changes, including those in canopy height and soil NOx changes, in studying the effects of ozone–nitrogen–vegetation interactions in the future.
Model output data used for analysis and plotting can be made available in RData format by contacting the corresponding author (Amos P. K. Tai at amostai@cuhk.edu.hk).
The supplement related to this article is available online at: https://doi.org/10.5194/acp-21-17743-2021-supplement.
APKT devised the overall methodology and supervised the writing of the paper. XL conducted model simulation, analyzed results, and wrote the draft. KMF implemented soil NOx and NH3 emissions in the model.
The contact author has declared that neither they nor their co-authors have any competing interests.
Publisher’s note: Copernicus Publications remains neutral with regard to jurisdictional claims in published maps and institutional affiliations.
This research has been supported by the General Research Fund (grant no. 14323116) and the National Natural Science Foundation of China (NSFC)/Research Grants Council (RGC) (grant no. N_CUHK440/20) awarded by the Research Grants Council (RGC) of the University Grants Committee of Hong Kong to Amos P. K. Tai.
This paper was edited by Tim Butler and reviewed by three anonymous referees.
Alexandratos, N. and Bruinsma, J.: World agriculture towards 2030/2050: the 2012 revision, ESA working paper No. 12-03, Food and Agriculture Organization, Rome, 2012.
Behera, S. N., Sharma, M., Aneja, V. P., and Balasubramanian, R.: Ammonia in the atmosphere: a review on emission sources, atmospheric chemistry and deposition on terrestrial bodies, Environ. Sci. Pollut. Res. Int., 20, 8092–8131, https://doi.org/10.1007/s11356-013-2051-9, 2013.
Bittman, S. and Mikkelsen, R.: Ammonia emissions from agricultural operations: livestock, Better Crops, 93, 28–31, 2009.
Bonan, G.: Ecological Climatology, 3rd edn., Cambridge University Press, Cambridge, United Kingdom, 2016.
Bonan, G. B., Lawrence, P. J., Oleson, K. W., Levis, S., Jung, M., Reichstein, M., Lawrence, D. M., and Swenson, S. C.: Improving canopy processes in the Community Land Model version 4 (CLM4) using global flux fields empirically inferred from FLUXNET data, J. Geophys. Res.-Biogeo., 116, G02014, https://doi.org/10.1029/2010jg001593, 2011.
Ciais, P., Sabine, C., Bala, G., Bopp, L., Brovkin, V., Canadell, J., Chhabra, A., DeFries, R., Galloway, J., Heimann, M., Jones, C., Quéré, C. L., Myneni, R. B., Piao, S., and Thornton, P.: Chapter 6: Carbon and Other Biogeochemical Cycles, in: IPCC, Climate Change 2013: The Physical Science Basis. Contribution of Working Group I to the Fifth Assessment Report of the Intergovernmental Panel on Climate Change, edited by: Stocker, T. F., Qin, D., Plattner, G.-K., Tignor, M., Allen, S. K., Boschung, J., Nauels, A., Xia, Y., Bex, V., and Midgley, P. M., Cambridge University Press, Cambridge, United Kingdom and New York, NY, USA, 465–570, 2013.
Ellis, R. A., Jacob, D. J., Sulprizio, M. P., Zhang, L., Holmes, C. D., Schichtel, B. A., Blett, T., Porter, E., Pardo, L. H., and Lynch, J. A.: Present and future nitrogen deposition to national parks in the United States: critical load exceedances, Atmos. Chem. Phys., 13, 9083–9095, https://doi.org/10.5194/acp-13-9083-2013, 2013.
Emmons, L. K., Walters, S., Hess, P. G., Lamarque, J.-F., Pfister, G. G., Fillmore, D., Granier, C., Guenther, A., Kinnison, D., Laepple, T., Orlando, J., Tie, X., Tyndall, G., Wiedinmyer, C., Baughcum, S. L., and Kloster, S.: Description and evaluation of the Model for Ozone and Related chemical Tracers, version 4 (MOZART-4), Geosci. Model Dev., 3, 43–67, https://doi.org/10.5194/gmd-3-43-2010, 2010.
Erisman, J. W., Sutton, M. A., Galloway, J., Klimont, Z., and Winiwarter, W.: How a century of ammonia synthesis changed the world, Nat. Geosci., 1, 636–639, https://doi.org/10.1038/ngeo325, 2008.
FAOSTAT: FAO Statistical Databases, available at: https://www.fao.org/faostat/en/, last access: 20 November 2021.
Franz, M. and Zaehle, S.: Competing effects of nitrogen deposition and ozone exposure on northern hemispheric terrestrial carbon uptake and storage, 1850–2099, Biogeosciences, 18, 3219–3241, https://doi.org/10.5194/bg-18-3219-2021, 2021.
Fu, Y. and Tai, A. P. K.: Impact of climate and land cover changes on tropospheric ozone air quality and public health in East Asia between 1980 and 2010, Atmos. Chem. Phys., 15, 10093–10106, https://doi.org/10.5194/acp-15-10093-2015, 2015.
Fung, K. M., Tai, A. P., Yong, T., Liu, X., and Lam, H. M.: Co-benefits of intercropping as a sustainable farming method for safeguarding both food security and air quality, Environ. Res. Lett., 14, 044011, https://doi.org/10.1088/1748-9326/aafc8b, 2019.
Fung, K. M., Val Martin, M., and Tai, A. P. K.: Modeling the interinfluence of fertilizer-induced NH3 emission, nitrogen deposition, and aerosol radiative effects using modified CESM2, Biogeosciences Discuss. [preprint], https://doi.org/10.5194/bg-2021-63, in review, 2021.
Galloway, J. N., Aber, J. D., Erisman, J. W., Seitzinger, S. P., Howarth, R. W., Cowling, E. B., and Cosby, J.: The nitrogen cascade, BioScience, 53, 341–356, https://doi.org/10.1641/0006-3568(2003)053[0341:TNC]2.0.CO;2, 2003.
Gruber, N. and Galloway, J. N.: An Earth-system perspective of the global nitrogen cycle, Nature, 451, 293–296, https://doi.org/10.1038/nature06592, 2008.
Gu, B., Ju. X., Chang. J., Ge, Y., and Vitousek P. M.: Integrated reactive nitrogen budgets and future trends in China, P. Natl. Acad. Sci. USA, 112, 8792–8797, https://doi.org/10.1073/pnas.1510211112, 2015.
Gu, B. J., Ge, Y., Ren, Y., Xu, B., Luo, W. D., Jiang, H., Gu, B. H., and Chang, J.: Atmospheric reactive nitrogen in China: Sources, recent trends, and damage costs, Environ. Sci. Technol., 46, 9240–9247, https://doi.org/10.1021/es301446g, 2012.
Gu, B. J., Sutton, M. A., Chang, S. X., Ge, Y., and Jie, C.: Agricultural ammonia emissions contribute to China's urban air pollution, Front. Ecol. Environ., 12, 265–266, https://doi.org/10.1890/14.WB.007, 2015.
Guenther, A. B., Jiang, X., Heald, C. L., Sakulyanontvittaya, T., Duhl, T., Emmons, L. K., and Wang, X.: The Model of Emissions of Gases and Aerosols from Nature version 2.1 (MEGAN2.1): an extended and updated framework for modeling biogenic emissions, Geosci. Model Dev., 5, 1471–1492, https://doi.org/10.5194/gmd-5-1471-2012, 2012.
Heimann, M. and Reichstein, M.: Terrestrial ecosystem carbon dynamics and climate feedbacks, Nature, 451, 289–292, https://doi.org/10.1038/nature06591, 2008.
Huang, X., Song, Y., Li, M., Li, J., Huo, Q., Cai, X., Zhu, T., Hu, M., and Zhang, H.: A high-resolution ammonia emission inventory in China, Global Biogeochem. Cy., 26, GB1030, https://doi.org/10.1029/2011GB004161, 2012.
Jacob, D. J. and Winner, D. A.: Effect of climate change on air quality, Atmos. Environ., 43, 51–63, https://doi.org/10.1016/j.atmosenv.2008.09.051, 2009.
Kanakidou, M., Myriokefalitakis, S., Daskalakis, N., Fanourgakis, G., Nenes, A., Baker, A. R., Tsigaridis, K., and Mihalopoulos, N.: Past, present and future atmospheric nitrogen deposition, J. Atmos. Sci., 73, 2039–2047, https://doi.org/10.1175/JAS-D-15-0278.1, 2016.
Kang, Y., Liu, M., Song, Y., Huang, X., Yao, H., Cai, X., Zhang, H., Kang, L., Liu, X., Yan, X., He, H., Zhang, Q., Shao, M., and Zhu, T.: High-resolution ammonia emissions inventories in China from 1980 to 2012, Atmos. Chem. Phys., 16, 2043–2058, https://doi.org/10.5194/acp-16-2043-2016, 2016.
Lamarque, J.-F., Kyle, G. P., Meinshausen, M., Riahi, K., Smith, S. J., Vuuren, D. P., Conley, A. J., and Vitt, F.: Global and regional evolution of short-lived radiatively-active gases and aerosols in the Representative Concentration Pathways, Climatic Change, 109, 191–212, https://doi.org/10.1007/s10584-011-0155-0, 2011.
Lamarque, J.-F., Emmons, L. K., Hess, P. G., Kinnison, D. E., Tilmes, S., Vitt, F., Heald, C. L., Holland, E. A., Lauritzen, P. H., Neu, J., Orlando, J. J., Rasch, P. J., and Tyndall, G. K.: CAM-chem: description and evaluation of interactive atmospheric chemistry in the Community Earth System Model, Geosci. Model Dev., 5, 369–411, https://doi.org/10.5194/gmd-5-369-2012, 2012.
Lamarque, J.-F., Shindell, D. T., Josse, B., Young, P. J., Cionni, I., Eyring, V., Bergmann, D., Cameron-Smith, P., Collins, W. J., Doherty, R., Dalsoren, S., Faluvegi, G., Folberth, G., Ghan, S. J., Horowitz, L. W., Lee, Y. H., MacKenzie, I. A., Nagashima, T., Naik, V., Plummer, D., Righi, M., Rumbold, S. T., Schulz, M., Skeie, R. B., Stevenson, D. S., Strode, S., Sudo, K., Szopa, S., Voulgarakis, A., and Zeng, G.: The Atmospheric Chemistry and Climate Model Intercomparison Project (ACCMIP): overview and description of models, simulations and climate diagnostics, Geosci. Model Dev., 6, 179–206, https://doi.org/10.5194/gmd-6-179-2013, 2013.
Lawrence, D. M., Oleson, K. W., Flanner, M. G., Thornton, P. E., Swenson, S. C., Lawrence, P. J., Zeng, X. B., Yang, Z. L., Levis, S., Sakaguchi, K., Bonan, G. B., and Slater, A. G.: Parameterization Improvements and Functional and Structural Advances in Version 4 of the Community Land Model, J. Adv. Model Earth Sy., 3, M03001, https://doi.org/10.1029/2011MS00045, 2011.
LeBauer, D. S. and Treseder, K. K.: Nitrogen limitation of net primary productivity in terrestrial ecosystems is globally distributed, Ecology, 89, 371–379, https://doi.org/10.1890/06-2057.1, 2008.
Li, Y., Schichtel, B. A., Walker, J. T., Schwede, D. B., Chen, X., Lehmann, C. M., Puchalski, M. A., Gay, D. A., and Collett, J. L.: Increasing importance of deposition of reduced nitrogen in the United States, P. Natl. Acad. Sci. USA, 113, 5874–5879, https://doi.org/10.1073/pnas.1525736113, 2016.
Liu, J., Ma, K., Ciais, P., and Polasky, S.: Reducing human nitrogen use for food production, Sci. Rep., 6, 30104, https://doi.org/10.1038/srep30104, 2016.
Liu, M. L. and Tian, H. Q.: China's land cover and land use change from 1700 to 2005: Estimations from high-resolution satellite data and historical archives, Global Biogeochem. Cy., 24, GB3003, https://doi.org/10.1029/2009gb003687, 2010.
Lombardozzi, D., Levis, S., Bonan, G., and Sparks, J. P.: Predicting photosynthesis and transpiration responses to ozone: decoupling modeled photosynthesis and stomatal conductance, Biogeosciences, 9, 3113–3130, https://doi.org/10.5194/bg-9-3113-2012, 2012.
Mueller, N. D., Lassaletta, L., Runck, B. C., Billen, G., Garnier, J., and Gerber, J. S.: Declining spatial efficiency of global cropland nitrogen allocation, Global Biogeochem. Cy., 31, 245–257, https://doi.org/10.1002/2016GB005515, 2017.
Myhre, G., Shindell, D., Bréon, F.-M., Collins, W., Fuglestvedt, J., Huang, J., Koch, D., Lamarque, J.-F., Lee, D., Mendoza, B., Nakajima, T., Robock, A., Stephens, G., Takemura, T., and Zhang, H.: Anthropogenic and Natural Radiative Forcing, in: Climate Change 2013: The Physical Science Basis. Contribution of Working Group I to the Fifth Assessment Report of the Intergovernmental Panel on Climate Change, edited by: Stocker, T. F., Qin, D., Plattner, G.-K., Tignor, M., Allen, S. K., Boschung, J., Nauels, A., Xia, Y., Bex, V., and Midgley, P. M., Cambridge University Press, Cambridge, United Kingdom and New York, NY, USA, https://doi.org/10.1017/CBO9781107415324.018, 2013.
Neale, R. B., Richter, J., Park, S., Lauritzen, P. H., Vavrus, S. J., Rasch, P. J., and Zhang, M. H.: The Mean Climate of the Community Atmosphere Model (CAM4) in Forced SST and Fully Coupled Experiments, J. Climate, 26, 5150–5168, https://doi.org/10.1175/JCLI-D-12-00236.1, 2013.
Oleson, K. W., Lawrence, D. M., Bonan, G. B., Drewniak, B., Huang, M., Koven, C. D., Levis, S., Li, F., Riley, W. J., Subin, Z. M., Swenson, S. C., Thornton, P. E., Bozbiyik, A., Fisher, R., Heald, C. L., Kluzek, E., Lamarque, J.-F., Lawrence, P. J., Leung, L. R., Lipscomb, W., Muszala, S., Ricciuto, D. M., Sacks, W., Sun, Y., Tang, J., and Yang, Z.-L.: Technical Description of version 4.5 of the Community Land Model (CLM), Ncar Technical Note NCAR/TN-503+STR, National Center for Atmospheric Research, 422, https://doi.org/10.5065/D6RR1W7M, 2013.
Paulot, F., Jacob, D. J., and Henze, D. K.: Sources and processes contributing to nitrogen deposition in biodiversity hotspots worldwide, Environ. Sci. Technol., 47, 3226–3233, https://doi.org/10.1021/es3027727, 2013.
Paulot, F., Jacob, D. J., Pinder, R. W., Bash, J. O., Travis, K., and Henze, D. K.: Ammonia emissions in the United States, European Union, and China derived by high-resolution inversion of ammonium wet deposition data: interpretation with a new agricultural emissions inventory (MASAGE_NH3), J. Geophys. Res.-Atmos., 119, 4343–4364, https://doi.org/10.1002/2013JD021130, 2014.
Rayner, N. A., Parker, D. E., Horton, E. B., Folland, C. K., Alexander, L. V., Rowell, D. P., Kent, E. C., and Kaplan, A.: Global analyses of sea surface temperature, sea ice, and night marine air temperature since the late nineteenth century, J. Geophys. Res.-Atmos., 108, D002670, https://doi.org/10.1029/2002JD002670, 2003.
Reay, D. S., Dentener, F., Smit, P., Grace, J., and Feely, R. A.: Global nitrogen deposition and carbon sinks, Nat. Geosci., 1, 430–437, https://doi.org/10.1038/ngeo230, 2008.
Reis, S., Pinder, R. W., Zhang, M., Lijie, G., and Sutton, M. A.: Reactive nitrogen in atmospheric emission inventories, Atmos. Chem. Phys., 9, 7657–7677, https://doi.org/10.5194/acp-9-7657-2009, 2009.
Sadiq, M., Tai, A. P. K., Lombardozzi, D., and Val Martin, M.: Effects of ozone–vegetation coupling on surface ozone air quality via biogeochemical and meteorological feedbacks, Atmos. Chem. Phys., 17, 3055–3066, https://doi.org/10.5194/acp-17-3055-2017, 2017.
Shang, B., Xu, Y., Peng, J., Agathokleous, E., and Feng, Z.: High nitrogen addition decreases the ozone flux by reducing the maximum stomatal conductance in poplar saplings, Environ. Pollut., 272, 115979, https://doi.org/10.1016/j.envpol.2020.115979, 2021.
Streets, D. G., Bond, T. C., Carmichael, G. R., Fernandes, S. D., Fu, Q., He, D., Klimont, Z., Nelson, S. M., Tsai, N. Y., Wang, M. Q., Woo, J.-H., and Yarber, K. F.: An inventory of gaseous and primary aerosol emissions in Asia in the year 2000, J. Geophys. Res., 108, 8809, https://doi.org/10.1029/2002JD003093, 2003.
Tai, A. P. K. and Val Martin, M.: Impacts of ozone air pollution and temperature extremes on crop yields: Spatial variability, adaptation and implications for future food security, Atmos. Environ., 169, 11–21, https://doi.org/10.1016/j.atmosenv.2017.09.002, 2017.
Tai, A. P. K., Val Martin, M., and Heald, C. L.,: Threat to future global food security from climate change and ozone air pollution, Nat. Clim. Change, 4, 817–821, https://doi.org/10.1038/nclimate2317, 2014.
Templer, P. H., Pinder, R. W., and Goodale, C. L.: Effects of nitrogen deposition on greenhouse-gas fluxes for forests and grasslands of North America, Front Ecol. Environ., 10, 547–553, https://doi.org/10.1890/120055, 2012.
Tian, H., Banger, K., Bo, T., and Dadhwal, V. K.: History of land use in India during 1880–2010: Large-scale land transformations reconstructed from satellite data and historical archives, Global Planet. Change, 121, 78–88, https://doi.org/10.1016/j.gloplacha.2014.07.005, 2014.
Tilman, D., Cassman, K. G., Matson, P. A., Naylor, R., and Polasky, S.: Agricultural sustainability and intensive production practices, Nature, 418, 671–677, https://doi.org/10.1038/nature01014, 2002.
Val Martin, M., Heald, C. L., and Arnold, S. R.: Coupling dry deposition to vegetation phenology in the Community Earth System Model: Implications for the simulation of surface O3, Geophys. Res. Lett., 41, 2988–2996, https://doi.org/10.1002/2014GL059651, 2014.
van Vuuren, D. P., Edmonds, J., Kainuma, M., Riahi, K., Thomson, A., Hibbard, K., Hurtt, G. C., Kram, T., Krey, V., Lamarque, J. F., Masui, T., Meinshausen, M., Nakicenovic, N., Smith, S. J., and Rose, S. K.: The representative concentration pathways: an overview, Climatic Change, 109, 5–31, https://doi.org/10.1007/s10584-011-0148-z, 2011.
Vitousek, P. M., Hättenschwiler, S., Olander, L., and Allison, S.: Nitrogen and Nature, A Journal of the Human Environment, 31, 97–101, https://doi.org/10.1579/0044-7447-31.2.97, 2002.
Wang, L., Tai, A. P. K., Tam, C.-Y., Sadiq, M., Wang, P., and Cheung, K. K. W.: Impacts of future land use and land cover change on mid-21st-century surface ozone air quality: distinguishing between the biogeophysical and biogeochemical effects, Atmos. Chem. Phys., 20, 11349–11369, https://doi.org/10.5194/acp-20-11349-2020, 2020.
Wong, A. Y. H., Tai, A. P. K., and Ip, Y. Y.: Attribution and statistical parameterization of the sensitivity of surface ozone to changes in leaf area index based on a chemical transport model, J. Geophys. Res.-Atmos., 123, 1883–1898, https://doi.org/10.1002/2017JD027311, 2018.
Zaehle, S., Friedlingstein, P., and Friend, A. D.: Terrestrial nitrogen feedbacks may accelerate future climate change, Geophys. Res. Lett., 37, L01401, https://doi.org/10.1029/2009GL041345, 2010.
Zaehle, S., Ciais, P., Friend, A. D., and Prieur, V.: Carbon benefits of anthropogenic reactive nitrogen offset by nitrous oxide emissions, Nat. Geosci., 4, 601–605, https://doi.org/10.1038/ngeo1207, 2011.
Zhang, L., Chen, Y., Zhao, Y., Henze, D. K., Zhu, L., Song, Y., Paulot, F., Liu, X., Pan, Y., Lin, Y., and Huang, B.: Agricultural ammonia emissions in China: reconciling bottom-up and top-down estimates, Atmos. Chem. Phys., 18, 339–355, https://doi.org/10.5194/acp-18-339-2018, 2018.
Zhang, X.: Biogeochemistry: A plan for efficient use of nitrogen fertilizers, Nature, 543, 322–323, https://doi.org/10.1038/543322a, 2017.
Zhang, X., Davidson, E. A., Mauzerall, D. L., Searchinger, T. D., Dumas, P., and Shen, Y.: Managing nitrogen for sustainable development, Nature, 528, 51–59, https://doi.org/10.1038/nature15743, 2015.
Zhao, Y., Zhang, L., Tai, A. P. K., Chen, Y., and Pan, Y.: Responses of surface ozone air quality to anthropogenic nitrogen deposition in the Northern Hemisphere, Atmos. Chem. Phys., 17, 9781–9796, https://doi.org/10.5194/acp-17-9781-2017, 2017.
Zhou, S. S., Tai, A. P. K., Sun, S., Sadiq, M., Heald, C. L., and Geddes, J. A.: Coupling between surface ozone and leaf area index in a chemical transport model: strength of feedback and implications for ozone air quality and vegetation health, Atmos. Chem. Phys., 18, 14133–14148, https://doi.org/10.5194/acp-18-14133-2018, 2018.
Zhu, L., Henze, D., Bash, J., Jeong, G.-R., Cady-Pereira, K., Shephard, M., Luo, M., Paulot, F., and Capps, S.: Global evaluation of ammonia bidirectional exchange and livestock diurnal variation schemes, Atmos. Chem. Phys., 15, 12823–12843, https://doi.org/10.5194/acp-15-12823-2015, 2015.
- Abstract
- Introduction
- Model and method
- Year 2000 vs. year 2050 NH3 emissions and nitrogen deposition
- Responses of terrestrial ecosystems to nitrogen deposition
- Impacts of terrestrial changes on surface ozone air quality
- Conclusions
- Data availability
- Author contributions
- Competing interests
- Disclaimer
- Financial support
- Review statement
- References
- Supplement