the Creative Commons Attribution 4.0 License.
the Creative Commons Attribution 4.0 License.
 | 03 Dec 2021
Mixing state of refractory black carbon in fog and haze at rural sites in winter on the North China Plain
Yuting Zhang
Shandong Lei
Wanyun Xu
Yu Tian
Weijie Yao
Xiaoyong Liu
Qi Liao
Jie Li
Chun Chen
Pingqing Fu
Jinyuan Xin
Junji Cao
Zifa Wang
The variability of the mixing state of refractory black carbon aerosol (rBC) and the corresponding complicated light absorption capacity imposes great uncertainty for its climate forcing assessment. In this study, field observations using a single-particle soot photometer (SP2) were conducted to investigate the mixing state of rBC under different meteorological conditions at a rural site on the North China Plain. The results showed that the hourly mass concentration of rBC during the observation periods was 2.6±1.5 µg m−3 on average, with a moderate increase (3.1±0.9) during fog episodes. The mass-equivalent size distribution of rBC exhibited an approximately lognormal distribution with a mass median diameter (MMD) of 213 nm. We found that the count median diameter (CMD) of rBC particles during snowfall episodes was larger than that before snowfall, and the number of rBC particles with Dc<121 nm were reduced by 28.4 % after snow. This may indicate that rBC-containing particles with small core sizes (Dc) were much more effectively removed by snow with light snow intensity (0.23 mm h−1). Based on the Mie scattering theory simulation, the relative and absolute coating thicknesses of rBC-containing particles were estimated to be ∼1.6 and ∼52 nm for the rBC core with a mass-equivalent diameter (Dc) of 170 to 190 nm, respectively, which indicates that most of the rBC-containing particles were thinly coated. Furthermore, a moderate light absorption enhancement (Eabs=1.3) and relatively low absorption cross section (MAC = 5.5 m2 g−1) at 880 nm were observed at the Gucheng (GC) site in winter compared with other typical rural sites.
The relationship between the microphysical properties of rBC and meteorological conditions was also studied. Relatively warm and high-RH environments (RH>50 %, ) were more favorable to rBC aging than dry and cold environments (RH<60 %, ). And the increase in ambient RH at the same temperature favors rBC aging. An increasing mass fraction of secondary inorganic aerosols (SIAs; especially sulfate and nitrate) and a decreasing mass fraction of organic aerosols in the environment support the formation of thick coatings by rBC. The RH dependence of absorption enhancement (Eabs) was likely caused by the relative coating thickness (RCT) as supported by the gradual increase in the mass concentration and mass fraction of secondary components as a function of RH in the ambient air. The mass fractions of aqueous-phase formation of secondary components had a limited effect on Eabs under a high-RH environment. The measured rBC concentrations and the mixing state of rBC in different meteorological environments will be useful for evaluating the radiative forcing of rBC in regional climate models.
- Article
(7773 KB) - Full-text XML
-
Supplement
(503 KB) - BibTeX
- EndNote


As an absorbing aerosol produced by incomplete combustion, black carbon plays a leading role in the absorption of shortwave solar radiation and changes atmospheric thermodynamics through the heating effect. Black carbon is an important factor leading to highly uncertain climate warming (Bond et al., 2013; Moffet and Prather, 2009). Black carbon aerosols enhance haze pollution by absorbing solar radiation to change the meteorological characteristics of the planetary boundary layer (PBL) (Ding et al., 2016). Freshly discharged black carbon is hydrophobic and becomes hydrophilic when mixed with hydrophilic material during aging, acting as cloud condensation nuclei (CCN) (Sarangi et al., 2019; Twomey, 1974) and increasing the cloud drop number concentration (Cherian et al., 2017). Wet removal is a key factor in determining the lifetime of black carbon aerosols in the atmosphere, which determines their vertical and horizontal distribution, local and regional diffusion, and direct, semidirect, and indirect radiative forcing effects (Liu et al., 2013).
The burning of fossil fuels such as coal and oil and the burning of biomass in agricultural production caused by human activities are the main factors leading to the increasing black carbon emissions. Using a transmission electron microscope fitted with an environmental cell (ETEM), we observed that fresh black carbon presents a loose and porous chain structure, and then in the atmosphere through condensation, coagulation, heterogeneous oxidation condensation, or heterogeneous chemical reaction, refractory black carbon aerosol (rBC) is coated by soluble material, and the coating gradually becomes thicker with increasing RH (He et al., 2015; Freney et al., 2010). The mixing state determines the morphology and optical properties of black carbon, affects its wet removal efficiency, and thus affects the atmospheric lifetime (Yu et al., 2020). The extent of rBC coating has been considered to be an important factor in evaluating aerosol radiative capacity (Oshima et al., 2009). It has been shown that the mixing of BC and other non-BC materials can enhance radiation absorption, which is interpreted as exhibiting a “lensing effect,” with the magnitude strongly dependent on the rBC coating amount (Cappa et al., 2012; Liu et al., 2015; Moffet and Prather, 2009). Generally, rBC-containing particles with thicker coatings have higher hygroscopic properties and can act as CCN under severe pollution conditions (Ding et al., 2019; Schwarz et al., 2008). Under high-pollution and RH conditions, the absorption efficiency of black carbon was significantly increased. Reducing the emission of BC and related secondary coating precursors is an effective way to alleviate the direct radiation effect of BC in urban environments. However, the change in the mixing state of black carbon aerosols and their driving factors are not clear under high-pollution and RH conditions.
The North China Plain is one of the BC hotspots with intensive anthropogenic emissions (Cao et al., 2006; Yang et al., 2016). Recently, the spatiotemporal distribution and optical properties of rBC and its influence on climate and the environment have been reported (D. Zhao et al., 2020; Ding et al., 2019; Liu et al., 2020b). However, observations of the mixing state of black carbon under different meteorological conditions are still insufficient. The single-particle soot photometer (SP2) with high resolution and high precision has significant advantages in estimating the mixing state of black carbon. During recent years, an increasing number of observations have used SP2 instruments to observe the mixing state of black carbon in China (Wang et al., 2014; Gong et al., 2016; Liu et al., 2020b; Pan et al., 2017). Most studies have focused on the mixing state of BC on severe haze days because of the presence of large amounts of particulate matter and gaseous precursors in the atmosphere. Studies have focused on the chemical mechanisms such as condensation, coagulation, and heterogeneous oxidation for coating formation (He et al., 2015; Bond et al., 2013), while the connection between meteorological factors and coatings is relatively rare. Previous studies have shown that wind speed and variation in the planetary boundary layer (PBL) can influence the concentration of BC (Talukdar et al., 2019) and that relative humidity (RH) affects the morphology and hygroscopic growth of rBC-containing particles (Laborde et al., 2013; Freney et al., 2010). Meteorological fields may have an impact on the mixing state of rBC.
In this study, SP2 was deployed at a moderately polluted rural site on the North China Plain in winter to characterize the size distribution and mixing state of rBC. This work is unique due to the largely different meteorological conditions during the campaign. The differences in rBC particle size under different meteorological conditions are illustrated, and the main factors influencing the rBC mixing state are discussed. The results of this paper were exhibited in the following sequence: (1) the size distribution of rBC in different campaigns, (2) the relative and absolute coating thickness and optical properties of rBC-containing particles and their influencing factors, and (3) the relationship of the aging process of rBC with meteorological conditions such as RH, temperature, and pollution conditions.
2.1 Site description and measurements
The observation of refractory BC (rBC) particles was performed from 7 December 2019 to 1 January 2020, in an air-conditioned container located in farmland of the Gucheng (GC; latitude: 39∘7.8′ N; longitude: 115∘48′ E) site in Dingxing County, Hebei Province, China, which is part of the China Atmosphere Watch Network (CAWNET), operated by the Chinese Meteorological Administration. As shown in Fig. S1a in the Supplement, the observation station is located ∼120 km southwest of Beijing, adjacent to National Highway 107 (G107) and the Beijing–Hong Kong–Macau Expressway (G4). This result indicates that the sampling site was affected by traffic emissions sources, which is a feature compared to other typical rural sites mainly affected by biomass burning sources at home and abroad. A single-particle soot photometer (SP2, Droplet Measurement Technologies Inc. USA) was used to measure rBC. A high-resolution time-of-flight aerosol mass spectrometer (HR-AMS, Aerodyne Research Inc., USA) was used to measure the non-refractory submicron (NR-PM1) aerosol species (organics, sulfate, nitrate, ammonium, and chloride). More details on this instrument can be found in previous studies (Jimenez, 2003; Kumar et al., 2016). Ambient relative humidity varied from 9 % to 100 % during the observation period, with an average relative humidity of 66 %.
2.2 SP2 data analysis
2.2.1 Instrument and calibration
The measurement of the size distribution and mixing state of individual rBC-containing particles in GC was characterized using an SP2. The aerosol sampling inlet was placed on a lift tower 3.5 m above the ground, and ambient air entered the container through a in. soft tube. The SP2 was operated at a sampling flow rate of 100 cm3 min−1. There was a continuous-wave intracavity Nd : YAG laser beam (1064 nm, TEM00 mode) in the SP2 measurement chamber. The SP2 used particle identification by laser-induced incandescence technology to observe and identify rBC (Stephens et al., 2003; Schwarz et al., 2006b). All particles scatter light, but only when they contain highly absorbent and refractory components, such as rBC, do they absorb the laser radiation and are heated to their boiling point temperature before emitting blackbody radiation (Liu et al., 2010; Moteki and Kondo, 2007). When particles cross the laser, particles' composition and size can be determined by detecting the incandescence signal when particles evaporated and the elastic scattering signal of particles. The ratio of the signals observed at the detectors for the narrowband, and broadband is used for estimating the color temperature of thermal radiation from rBC-containing particles and, thereby, constrains particle composition (Schwarz et al., 2006a). If only the scattering signal was detected, it was proven that the particles do not contain rBC and are purely scattering particles (non-rBC). If both the scattering signal and the incandescence signal were recorded, it was an rBC-containing particle. In general, rBC-containing particles need more time to evaporate the non-refractory matter before reaching their boiling point temperature. Therefore, there was a lag time (Δt) for the peak of the incandescence signal and the scattering signal, which can be used to qualitatively study the mixing state of rBC-containing particles. For SP2, the detectable size range of the scattering signal was 200–400 nm diameter. Assuming a black carbon density of 1.8 g cm−3 and an ideally spherical structure, the mass equivalent diameter of black carbon detected by the incandescence signal is 70–500 nm.
Prior to the observation field campaign, the scattering and incandescence signals of SP2 were calibrated in the laboratory. Aquadag aerosols (lot no. 9627, Acheson Inc., USA) were used to calibrate the incandescence signal. We used an atomizer (model 3072, TSI Inc, USA) and a diffusion dryer to prepare monodispersed Aquadag aerosols, which were selected according to mobility diameter using a differential mobility analyzer (DMA; Model 3081, TSI Inc., 150 USA). The calibration coefficient values for broadband high gain (BBHG) and broadband low gain (BBLG) of incandescence signals are shown in Fig. S2. We corrected the incandescence signal for ambient rBC with a scaling factor of 0.75 because the SP2 is more sensitive to Aquadag than diesel emission rBC in the same mass range (Laborde et al., 2012; Baumgardner et al., 2012). The scattering signal was calibrated using polystyrene latex spheres (PSL; Nanosphere Size Standards, Duke Scientific Corp., USA). In addition to the above instruments, a condensation particle counter (CPC, model 3775, TSI Inc., USA) was adopted to measure the number concentration of particles to compare with the SP2.
2.2.2 Shell–core calculation
A single-particle rBC mass was obtained by the incandescence signal. We usually refer to the mass equivalent diameter converted by the rBC mass (ρ=1.8 g cm−3 for ambient BC) as the rBC core diameter (Dc), which is the diameter of a void-free, spherical structure, as expressed in Eq. (1):
Information about the scattering signal of rBC-containing particles detected by the SP2 is distorted because when individual rBC particles passed through the laser beam, they absorb the laser energy and are heated up to ∼4000 K, resulting in mass loss of a single rBC particle directly. Thus, the methodology of leading-edge-only (LEO) fitting is adopted to characterize the original scattering properties and coating thickness of rBC-containing particles. The scattering signal of purely scattering particles is Gaussian, as detected by the SP2. In this method, the Gaussian fitting of the original scattering signal is reconstructed from the leading edge of the scattering signal (before the volatilization of particles) of rBC-containing particles (Gao et al., 2007). In this study, rBC-containing particles are assumed to be shell–core structures. The optical diameter of rBC-containing particles or coated diameter (Dp) is calculated by Mie table calculations. Using a core refractive index and a coating refractive index , we input the LEO fitted scattering signal and rBC core size into Mie calculations (Taylor et al., 2015). Further, the relative coating thickness (RCT) and absolute coating thickness (ACT) of an rBC-containing particle, calculated as and , respectively.
2.2.3 Calculation of rBC optical properties
The ensemble effect of light absorption by rBC-containing particles is calculated at 880 nm because the optical properties of rBC-containing particles at this wavelength are hardly affected by brown carbon (BrC). Based on the size information of rBC-containing particles (i.e., Dc and Dp) obtained by SP2 observation, optical parameters such as the mass absorption cross section (MAC), absorption enhancement (Eabs), and absorption coefficient (σabs) of rBC-containing particles can be obtained based on Mie scattering theory. The refractive index of the rBC core was 2.26+1.26i, and the refractive index of 1.48+0i was used for coatings in the Mie calculation assuming rBC-containing particles constitute a core–shell model. In addition to the absorption of light by the rBC core, coating materials on the surface of rBC can attract more light to the rBC core, which is called the lensing effect, enhancing the light absorption of rBC. The Eabs can be used to quantify the theoretical light absorption capability of BC-containing particles.Eabs is determined by the ratio of the absorption cross section of the whole rBC-containing particle (Cabs,s) to the absorption cross section of the bare rBC core (Cabs,c), as shown in Eq. (2):
MAC reflects the optical absorption characteristics of rBC-containing particles in unit mass concentration. The larger the value is, the stronger the radiation absorption capacity of rBC-containing particles is. The mass absorption cross section (MACi) of a single rBC-containing particle is defined as the absorption cross section of the whole rBC-containing particle (Cabs,s) per unit rBC mass (mrBC, i), as expressed in the following equation:
The MAC in bulk for a given period is calculated as
The σabs of rBC-containing particles is calculated based on the MAC and the mass concentration (CrBC) measured by the SP2, as shown in Eq. (4):
Previous studies have shown that the light absorption of rBC-containing particles is related to their morphology (Liu et al., 2017, 2020b). Simple assumptions of a core–shell structure and the ideal spherical shape of rBC particles, used in Mie theory to calculate optical properties, cause uncertainty due to the lack of observation of optical size information and morphology.
2.3 Dispersion and trajectory analysis
The HYSPLIT (Hybrid Single-Particle Lagrangian Integrated Trajectory) model developed by NCEP (National Center for Environmental Prediction) and NCAR (National Center for Atmospheric Research) was widely used to simulate the air footprint area for dispersion and trajectory analysis, which was based on the Lagrangian transport model (https://ready.arl.noaa.gov/HYSPLIT_traj.php, last access: 28 February 2020) (Cohen et al., 2015; Fan et al., 2021b, a). The potential uncertainty of the HYSPLIT model is related to the meteorological assimilation datasets that drive the model simulation (Su et al., 2015). In this study, the HYSPLIT model was used to investigate the source of air mass on the North China Plain. The dataset provided for HYSPLIT is the global reanalysis data in GDAS format (ftp://arlftp.arlhq.noaa.gov/pub/archives/gdas1, last access: 26 February 2020). It produces meteorological data four times a day, namely, at 00:00, 06:00, 12:00, and 18:00 UTC, and the horizontal resolution is . The vertical direction has 17 levels, ranging from the ground surface to 10 hPa. Meteorological parameters including wind, temperature, humidity, potential height, and ground precipitation are also provided. During the simulation, the trajectory ensemble option starts multiple trajectories from the first selected starting location. Each member of the trajectory ensemble is calculated by offsetting the meteorological data by a fixed grid factor (one meteorological grid point in the horizontal direction and 0.01σ units in the vertical direction). Air samples were released at 150 from the GC site, and the simulation time of the backward trajectory was 5 d.
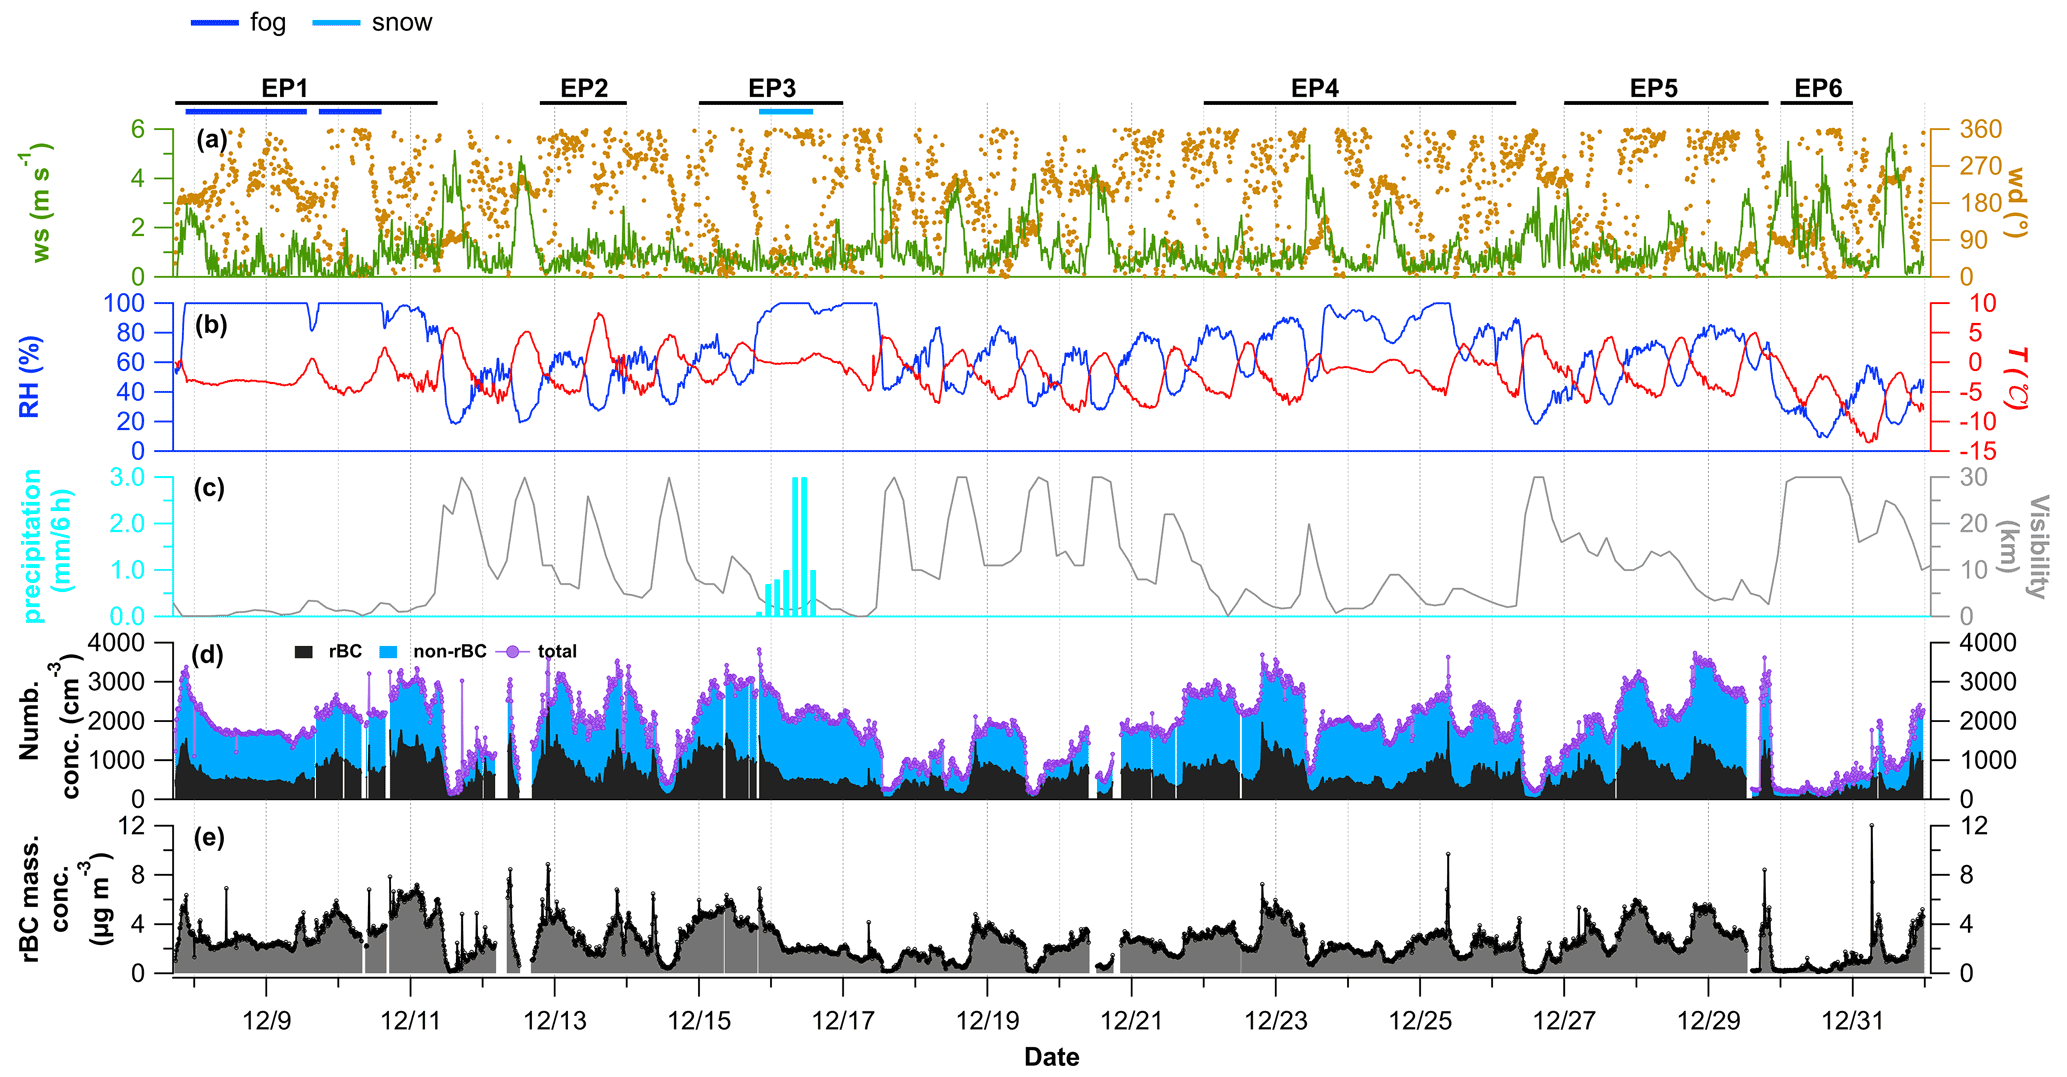
Figure 1Time series of (a) wind speed (WS) and wind direction (WD), (b) relative humidity (RH) and ambient temperature (T), (c) precipitation and visibility, (d) number concentration of rBC-containing particles, purely scattering particles and total particles measured by the SP2 in GC, and (e) rBC mass loading.
3.1 Overview of the field observation
3.1.1 Meteorology
The field campaign was performed from 8 to 31 December 2019. During the observation period, the site was affected by the winter monsoon with a prevailing northwesterly wind (Fig. S1b). The meteorological conditions and the concentration of aerosol particles during the sampling period are shown in Fig. 1. The average (±1σ) wind speed was 1.2 (±1) m s−1, with the highest value up to 5.9 m s−1. According to the wind rose diagram, the northwest wind and the southwest wind prevailed during the observation, and the wind speed reached a maximum in the southwest direction during the whole sampling period according to the wind rose diagram (Fig. S1c). The relative humidity (RH) during the entire period was relatively high, with an average (±1σ) of 66 (±25) %. There were fog events and snowfall during the observation period. The period when the RH reached 100 % between 7 and 11 December was defined as the fog event, and the visibility was almost 0 km during this period. Snowfall occurred at 20:00 on 15 December and lasted until 14:00 on 16 December, with snow intensity of 1.37 mm 6 h−1. It was of great significance to study the mixing state and removal of rBC-containing particles during fog and snow events to improve the model's simulation.
3.1.2 Mass concentration of rBC
As shown in Fig. 1, the number concentrations of rBC and purely scattering particles showed similar variation trends. The average (±1σ) number concentrations of rBC and purely scattering particles were 650±368 and , respectively. The mass concentration of rBC in the ambient environment was 2.6 (±1.5) µg m−3, which was much lower than the observations in the winter of 2016 and 2018 at the urban site in Beijing. Liu et al. (2019) reported that the mass concentration of rBC in winter 2016 in Beijing was 6.4 µg m−3. Due to the strict air pollution control on coal combustion and biomass burning (Ji et al., 2017), Xie et al. (2020) found a decrease in mass concentration (3.2 µg m−3) in winter 2018. A similar urban–high and rural–low pattern was also found in Shenzhen, and the average mass loading of rBC in rural areas (2.6 µg m−3) in fall was much lower than that in urban areas (6 µg m−3) (Huang et al., 2012). One possible explanation was that rural sites have lower traffic emissions than urban sites, open biomass burning has been strictly controlled in recent years, and the goal of changing fuel from coal to natural gas has been well implemented, at least in the North China Plain (Huang et al., 2006; Ji et al., 2017).
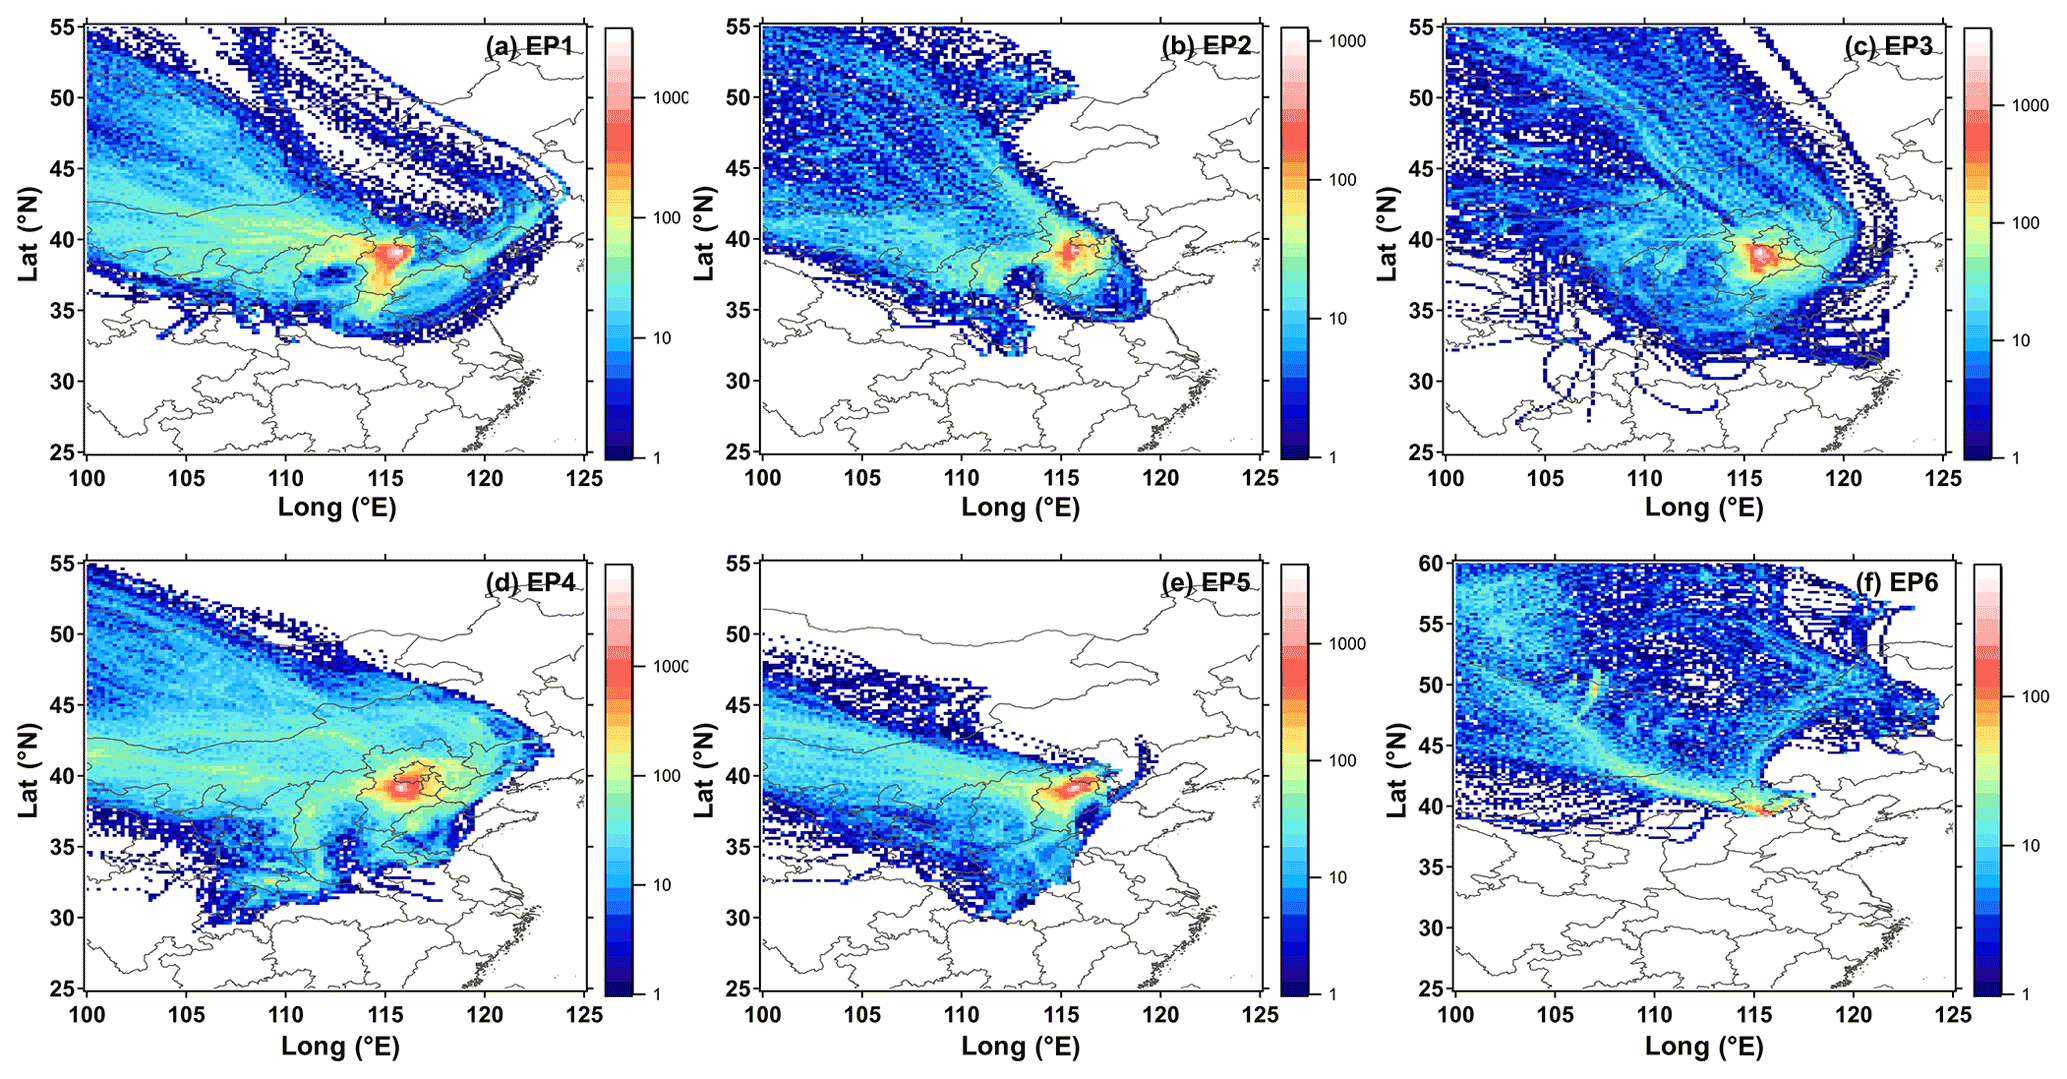
Figure 2The backward trajectories from which the air mass over GC originated in varying periods.
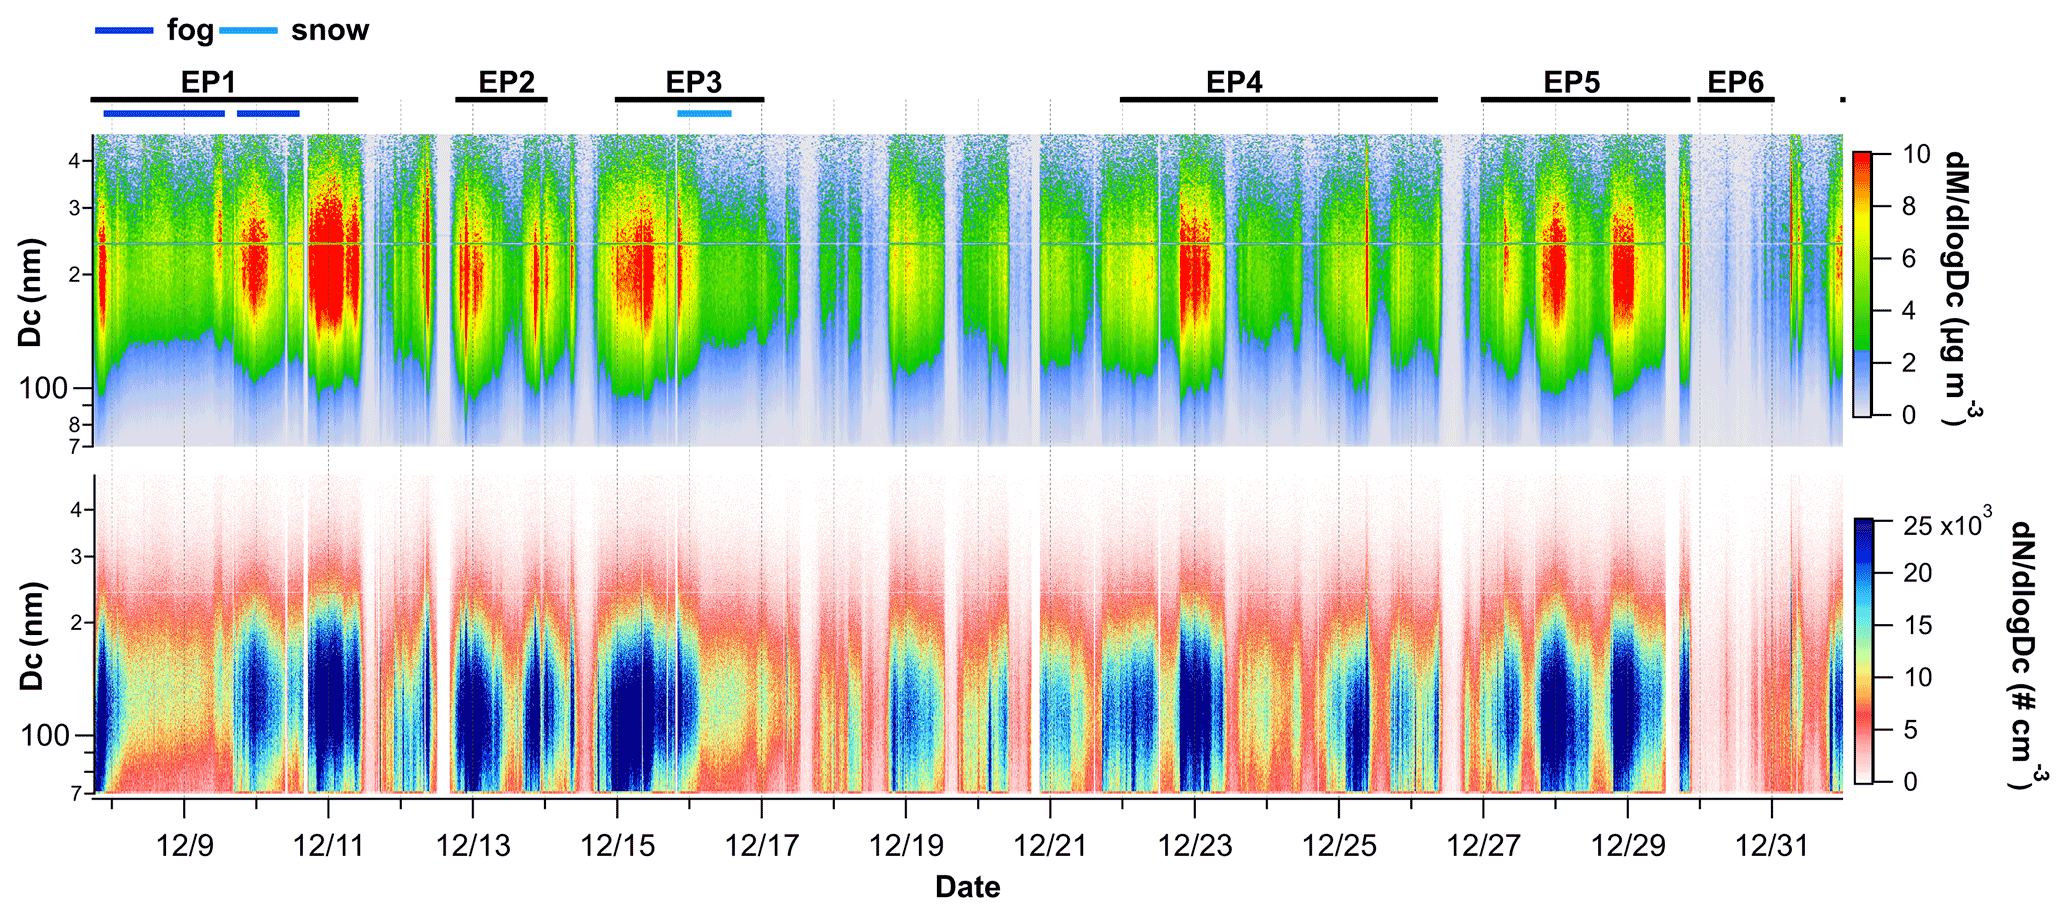
Figure 3Time series of the mass size distribution and number size distribution of rBC, as measured by the SP2.
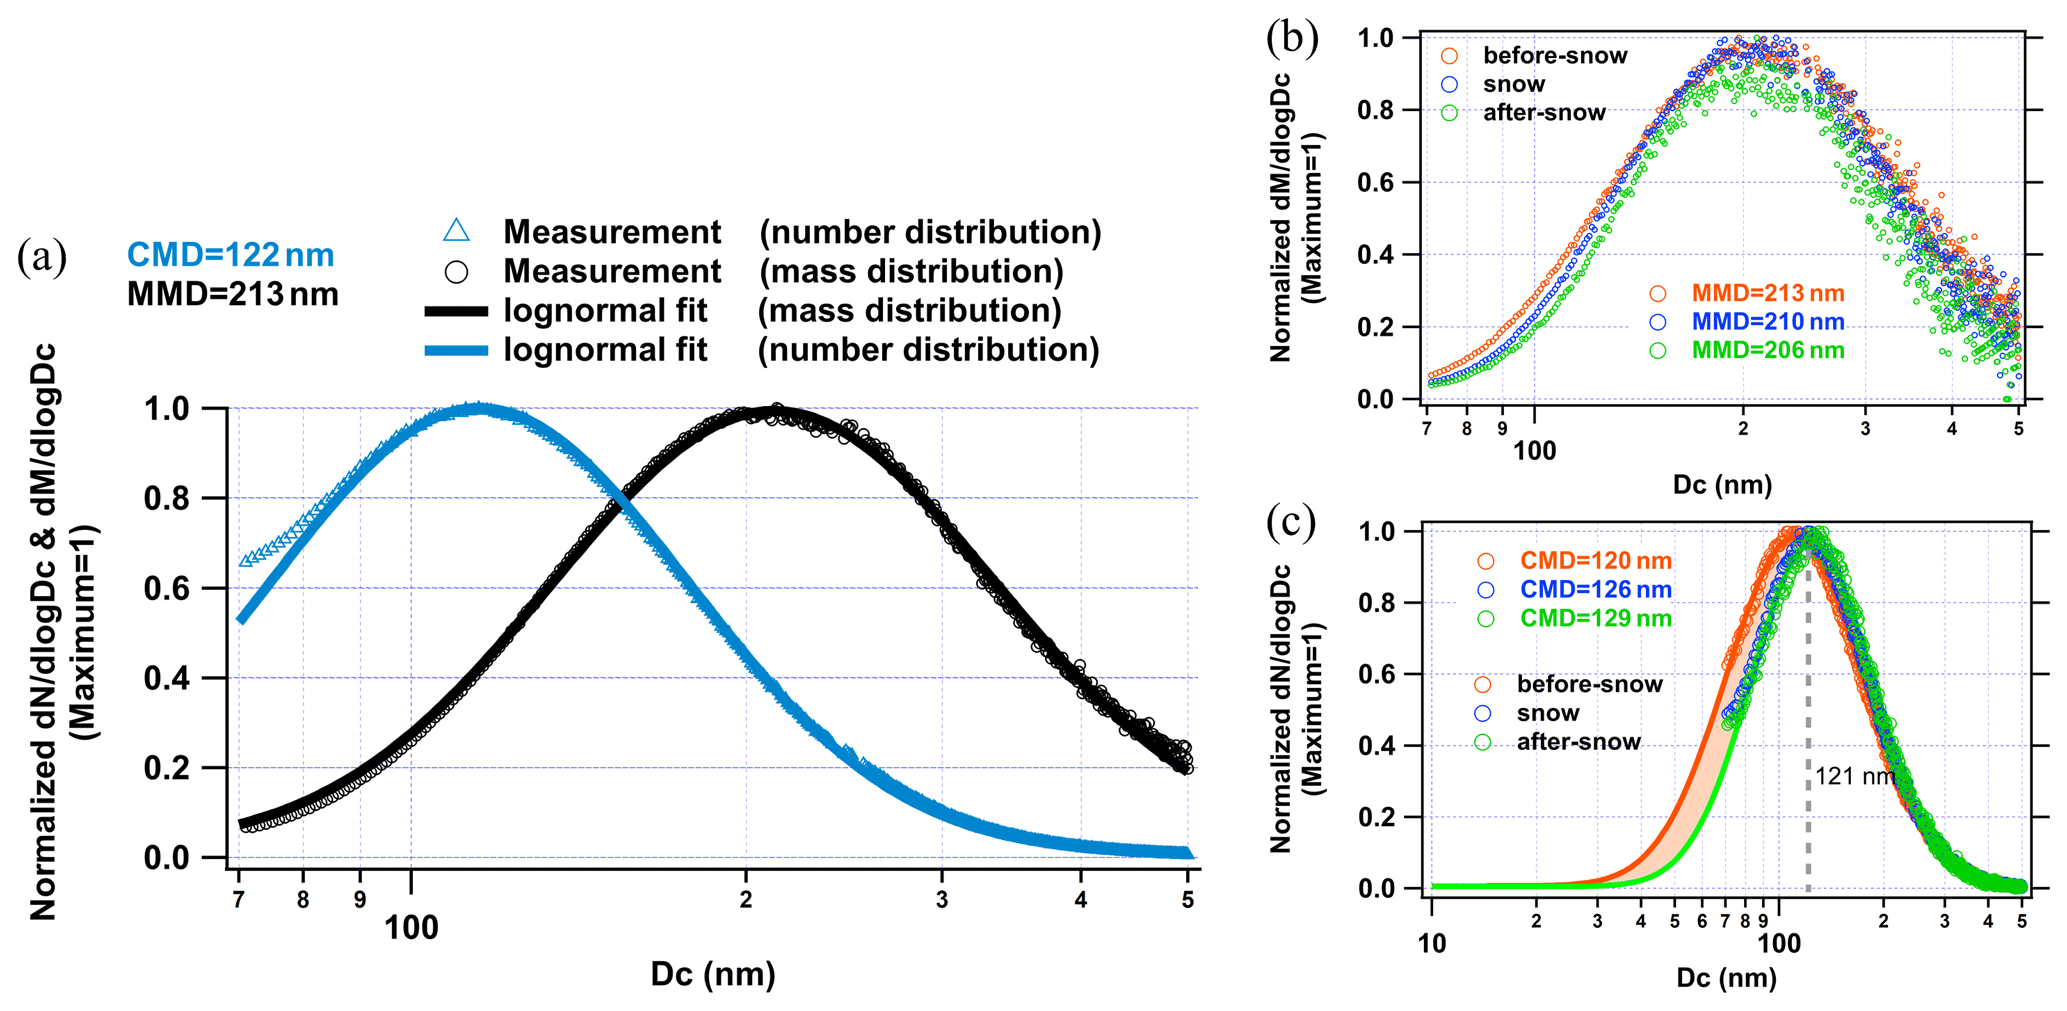
Figure 4(a) Number and mass size distribution ( and ) of rBC core during the whole campaign. (b) Mass size distribution () during snowfall and (c) number size distribution () during snowfall. Note that the orange and green lines in (c) are the log-normal fit of number size distribution during the before-snow and after-snow periods, respectively. And the orange shaded areas denote the difference in area between the two log-normal fit curves at Dc less than 121 nm.
Based on the meteorological conditions and concentrations of the total particles, six observation periods were chosen, as denoted in Fig. 1a: EP1 (17:40 on 7 December–09:00 on 11 December), EP2 (19:00 on 12 December–00:00 on 14 December), EP3 (00:00 on 15 December–00:00 on 17 December), EP4 (00:00 on 21 December–00:00 on 26 December), EP5 (00:00 on 27 December–20:00 on 29 December) and EP6 (00:00 on 30 December–00:00 on 31 December). The periods with RH = 100 % during EP1 were defined as the fog period. The average RH was 96 %, and the average rBC mass concentration was 3.6 (±1.4) µg m−3 during EP1. During EP3, there was snow from 20:00 on 15 December to 14:00 on 16 December. Therefore, during EP3, the discussion is divided into before-snow, snow, and after-snow periods. In the other four periods, EP6 was the clean period with an average rBC mass concentration of 0.5 (±0.3) µg m−3, while EP2, EP4, and EP5 represented polluted periods with average rBC mass concentrations of 3.4 (±1.4), 1.2 (±1.2), and 3.4 (±1.3) µg m−3, respectively. The variables related to rBC and the meteorological conditions in the selected different periods are shown in Table S2. The HYSPLIT model was used to analyze the origin of the air masses during the different periods. As shown in Fig. 2a–f, the air masses over GC mainly came from the northwest and northeast directions during the clean period, and the wind speed was relatively high. During the pollution period, the air masses mainly came from the southwest and south directions and local areas. During the period of EP1 and EP3 with high RH, part of the air mass originated from the eastern Bohai Sea direction.
3.2 Size distribution of rBC
The time series of the mass size distribution and number size distribution of rBC during the whole experimental period was stable, with a modal size peaking at approximately 200 and 120 nm, respectively (Fig. 3). The rBC values measured by the SP2 at the GC site mainly were distributed in the range of 70–500 nm, and the rBC mass and number values were concentrated at 100–400 and <300 nm, respectively. and showed an apparent diurnal trend. The peak period of diurnal variation was between 20:00 and 09:00 LST, while low diurnal variation occurred in the afternoon. This pattern was determined by the dual effects of diurnal variation in the boundary layer and local rBC emissions. To better study and , the mass median diameter (MMD) and count median diameter (CMD) were used to represent the characteristics of and for detailed discussion.
Field measurements of the size of rBC around the world are summarized in Table 1. The size distribution as a function of rBC core mass equivalent diameter (Dc) measured by the SP2 is shown in Fig. 4. During the whole experiment, the mass size distribution followed the lognormal distribution and peaked at 213 nm (MMD) (Fig. 4a). As shown in Table 1, the MMD of rBC at the GC site in winter was slightly smaller than the value (222 nm) observed in rural areas in Shenzhen in November (Huang et al., 2012) and was consistent with the biomass burning emission observed in Texas (MMD = 210 nm) (Schwarz et al., 2008). However, the rBC emitted by biomass burning in the laboratory was smaller (189 nm) (Pan et al., 2017). In addition, this mode was identical to the rBC mode observed in the aged continental air mass during a Paris study (Laborde et al., 2013). In comparison with most studies in urban areas, we found that the MMD of rBC in urban areas was smaller than that in our study (Huang et al., 2012; Gong et al., 2016; Liu et al., 2019, 2020b; Lan et al., 2013; Schwarz et al., 2008). Laborde et al. (2013) found that MMD was significantly related to the source of rBC-containing particle emissions. Pan et al. (2017) showed that the MMD of rBC was also determined by combustion conditions and burning materials in a laboratory study. Many studies have indicated that the MMD of rBC from traffic emissions was smaller than that from biomass burning, coal combustion, and aged air masses (Laborde et al., 2013; Schwarz et al., 2008). According to previous studies, MMD presented a trend of a small size in summer and a large size in winter, a small size in urban areas, and a large size in rural areas (Liu et al., 2019, 2020b; Huang et al., 2012; Kondo et al., 2016; Wu et al., 2021). The dense traffic arteries in urban areas and a large amount of traffic emissions may be the reason that MMD in urban areas is smaller than that in rural areas (Huang et al., 2006; Laborde et al., 2013; Schwarz et al., 2008). The different trends of MMD in seasons and spaces may be because rBC-containing particles came from different emission sources. In addition, the MMD was higher in pollution events (i.e., EP1, EP2, EP3, and EP5). This was similar to the results of previous studies in which under the condition of a higher rBC mass concentration, the rBC core size usually increased (Liu et al., 2019). It could be that coagulation of rBC particles or regional transport causes changes in rBC-containing particle sources at higher concentrations.
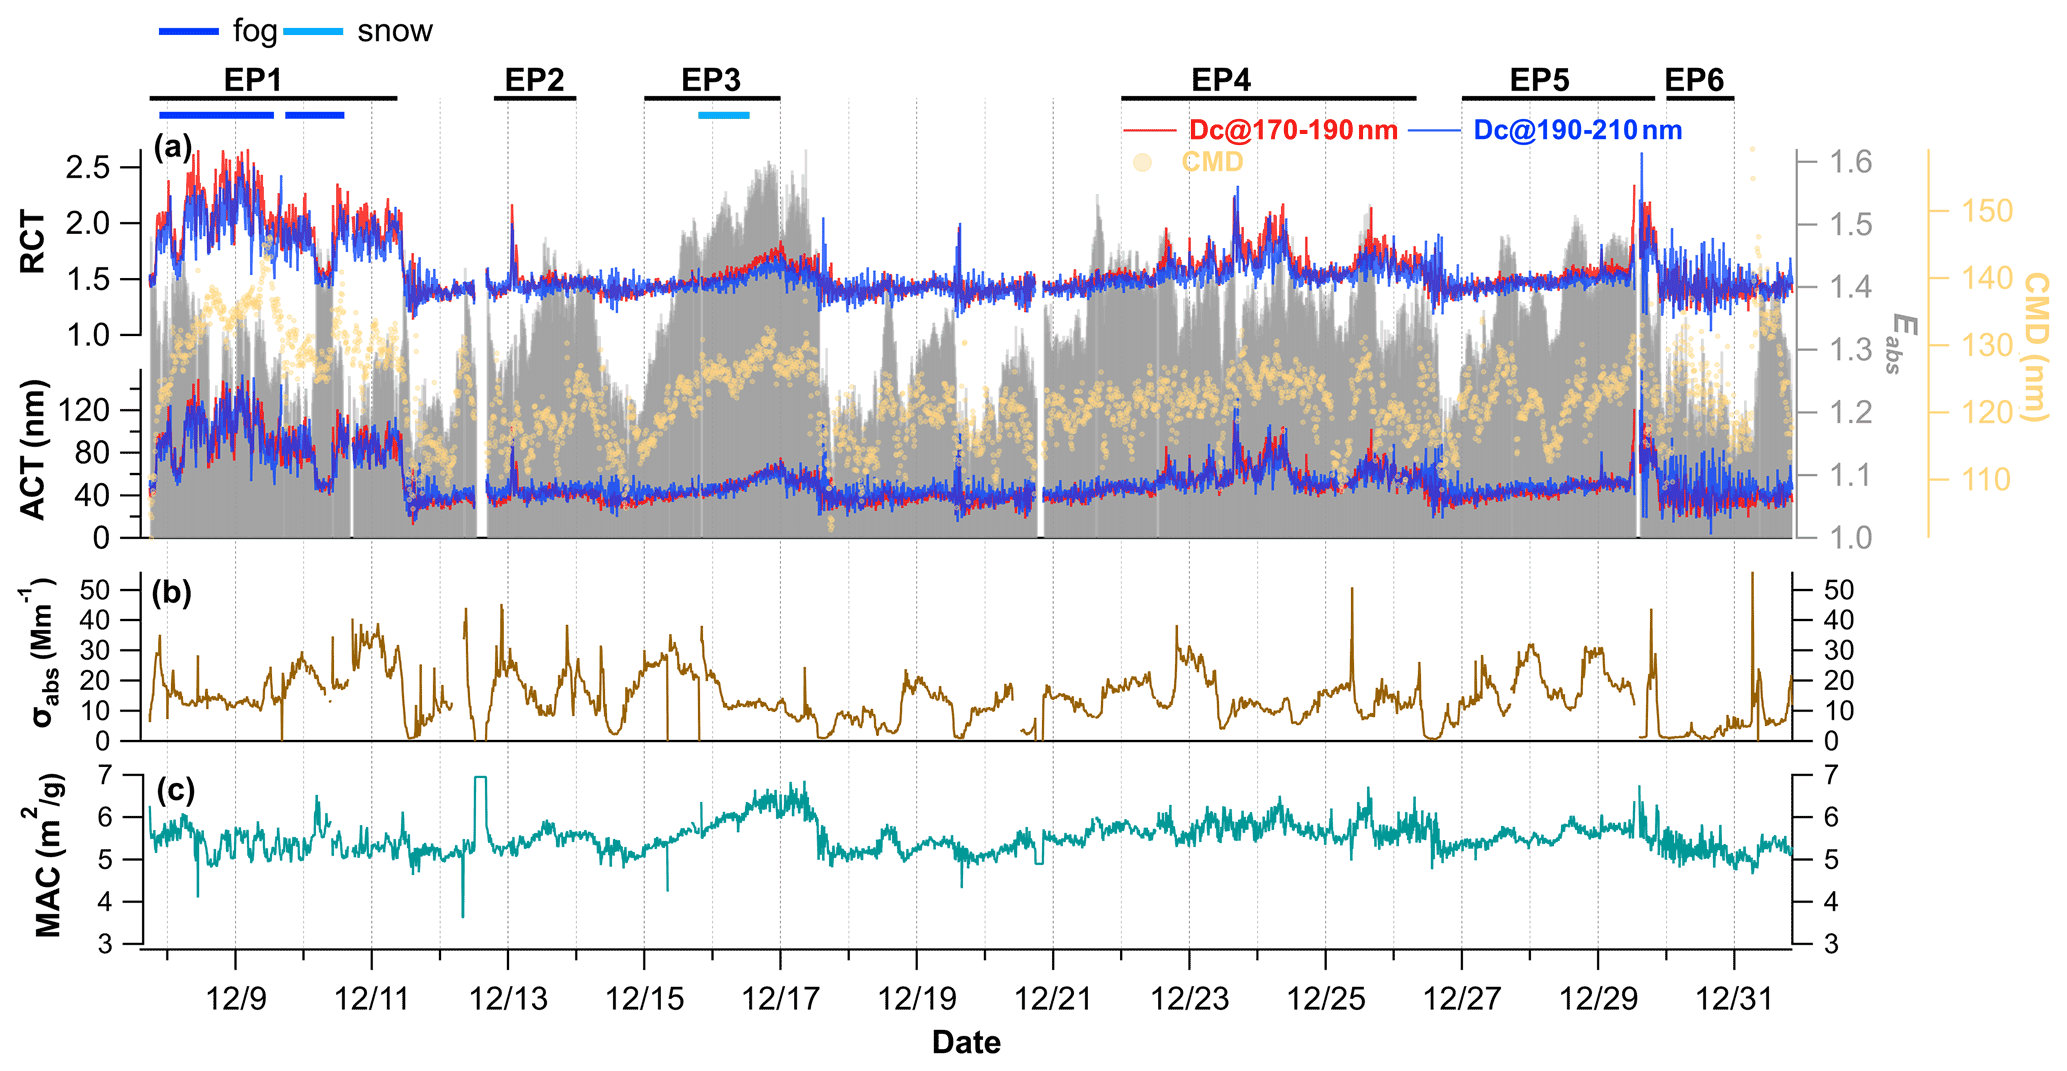
Figure 5(a) Time series of the relative and absolute coating thicknesses of rBC-containing particles within the Dc range of 170–190 and 190–210 nm. The gray bars denote the absorption enhancement (Eabs) of rBC. The light yellow circles denote the size of the rBC core. Time series of the (b) absorption coefficient (σabs) and (c) mass absorption cross section (MAC).
Table 1Brief summary of some of the experiments on the size and mixing state of rBC-containing particles.
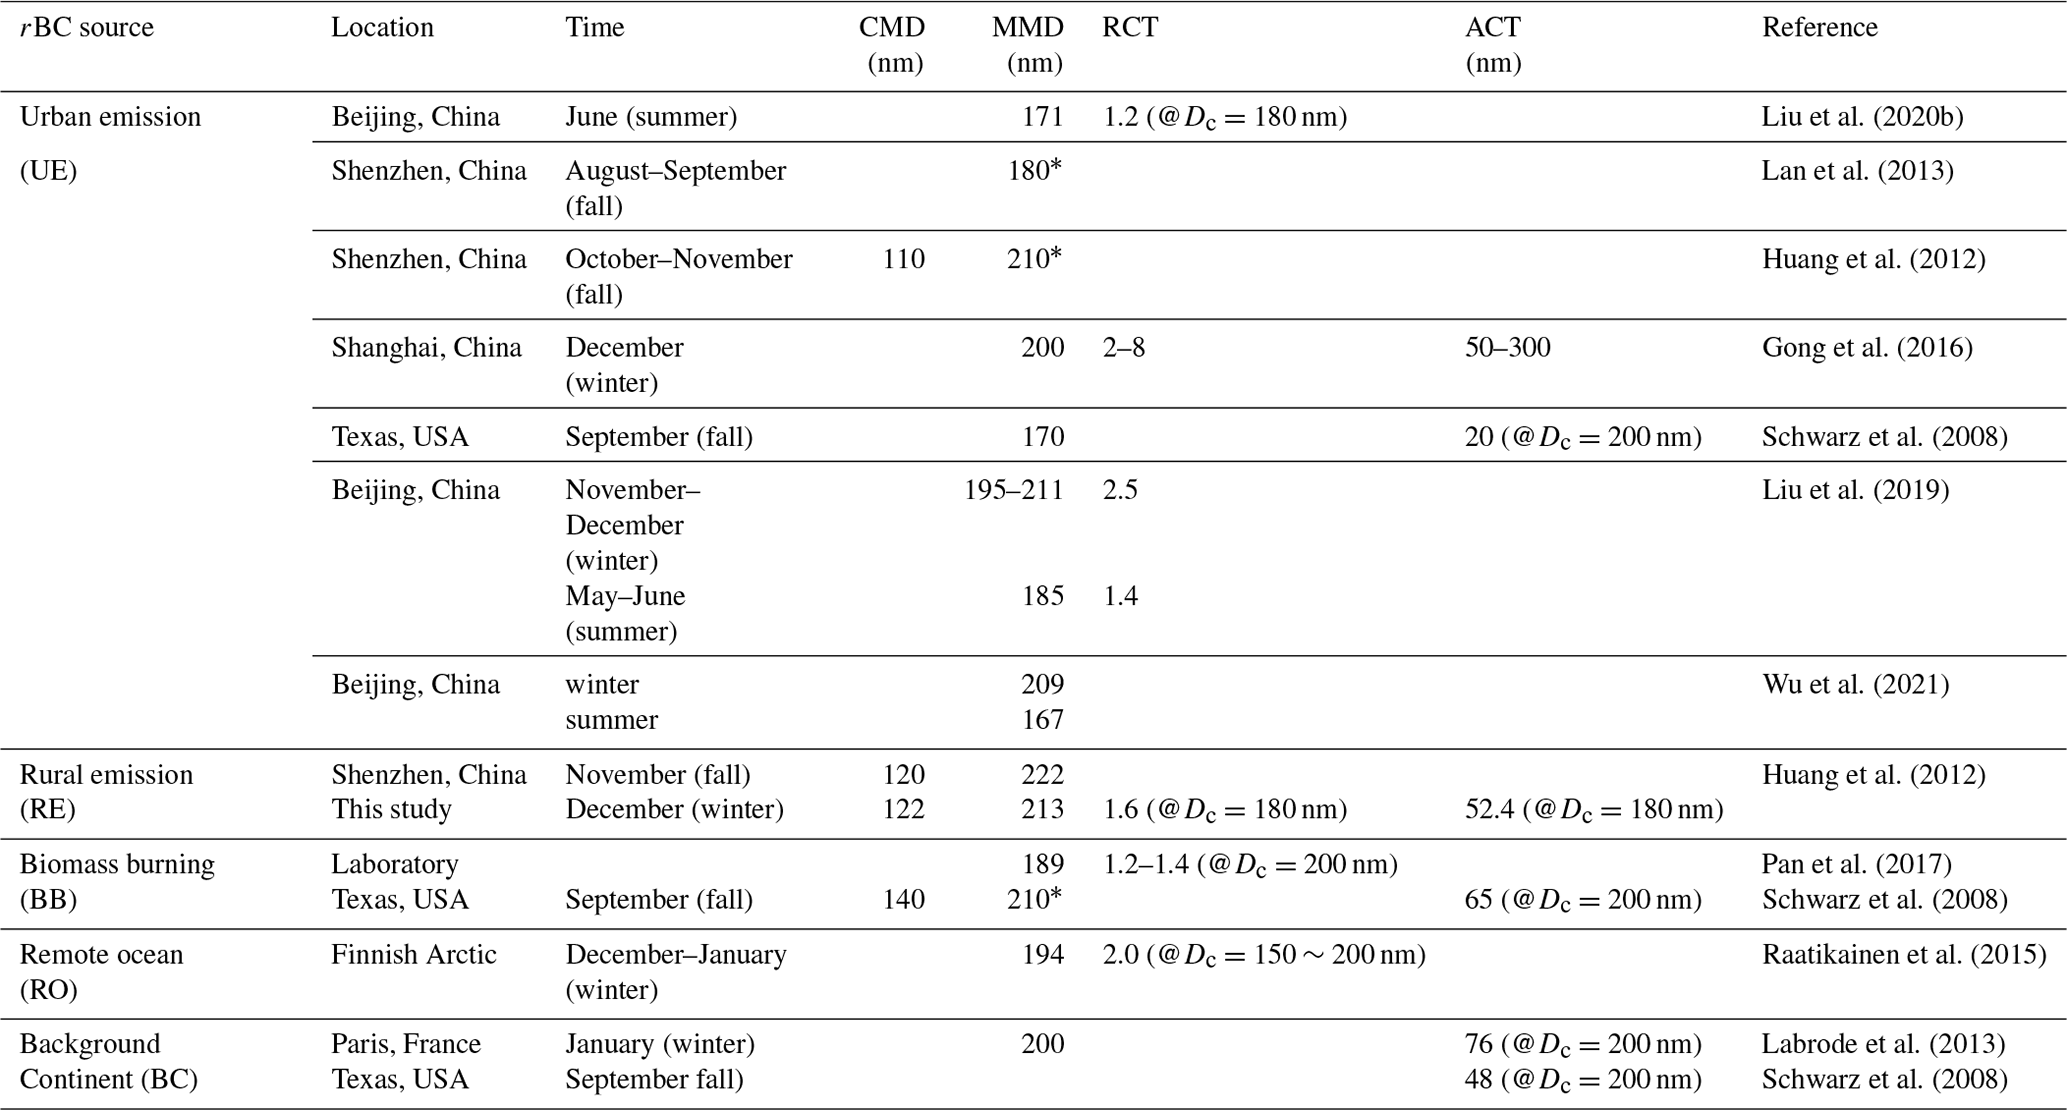
* The density of rBC is 2 g cm−3
The number size distribution followed the lognormal distribution and peaked at 122 nm (CMD) (Fig. 4a). Because most rBC particles (by number) emitted from urban areas were below the SP2 detection limit of 70 nm, the comparison of the number size distribution between urban and rural areas was meaningless (Schwarz et al., 2008). There was snowfall with the intensity of 0.23 mm h−1 during the observation period, and the mass and number size distributions of the rBC core mass equivalent diameter (Dc) during the snow event are illustrated in Fig. 4b and c. During before-snow, snow, and after-snow periods, the MMD was 213, 210, and 206 nm, a decrease by 3.3 %, and the CMD was 120, 126, and 129 nm, an increase of 7.5 %, respectively. We found that the number size distribution during the pre-snow and after-snow periods was consistent with a log-normal distribution. CMD of fresh BC usually ranges from 50 to 80 nm (Bond et al., 2013), so we extrapolated the fitting curves to 10 nm (Fig. 4c). The difference in areas between the two log-normal fit curves at Dc less than 121 nm was 0.23; that is, the amount of rBC with Dc less than 121 nm decreased by 28.4 % after snow. According to Fig. 3, the number concentration of rBC with Dc below 100 nm decreased significantly, while the number concentration of rBC with Dc about 200 nm decreased slightly during the snow case. This result is similar to the observation in Beijing that the snow with a precipitation intensity of 0.37 mm reduced the volume concentration of the small particle size (<100 nm) fraction in the accumulation mode (Su et al., 2016). Previous studies found that wet deposition is the main mechanism for removing rBC-containing particles (Taylor et al., 2014). Wet removal plays an important role in determining the size distribution of rBC during vertical transport in the free troposphere (Moteki et al., 2012), and rainfall, as a means of wet removal, preferentially removes large rBC-containing particles, resulting in a decrease in MMD after rain events (Liu et al., 2020b; Wang et al., 2018). However, the snow with relatively weak intensity may preferentially remove the small core size of rBC. Although the CMD increased moderately, the effect of removing rBC particles with a small core size (Dc) by snow was insignificant on the MMD (Liu et al., 2020a). The mechanism of wet scavenging and its effect of the distribution of aerosol particle size are complex (X. Zhao et al., 2020c; Sun et al., 2019), and we will investigate in more depth how wet scavenging affects rBC particle size in a future study.
3.3 Mixing state of rBC-containing particles under different conditions
3.3.1 Coating thickness of rBC-containing particles
Figure 5 provides the temporal variation of ACT, RCT, and CMD of rBC-containing particles during the entire period. The relative coating thickness (RCT) and absolute coating thickness of rBC-containing particles were calculated by the LEO fitting method; see Sect. 2.2.2 for details. Herein, rBC cores with nm and nm were selected because the low scattering signal of small rBC is easily influenced by signal noise (Schwarz et al., 2008; G. Zhao et al., 2020; Liu et al., 2020b). The average RCT (±1σ) (Dc@170–190 nm) was 1.6 (±0.2), RCT (±1σ) (Dc@190–210 nm) was 1.5 (±0.2), ACT (±1σ) (Dc@170–190 nm) was 52.4 (±21.8) nm, and ACT (±1σ) (Dc@190–210 nm) was 54.2 (±20.4) nm. As shown in Table 1, the RCT (Dc@190–210 nm) of the GC site was consistent with the RCT (1.2–1.4) with Dc=200 nm of rBC-containing particles emitted from biomass burning through laboratory research (Pan et al., 2017) but was larger than the value (RCT () during the summer in Beijing, which was mainly influenced by traffic emissions (Liu et al., 2020b). The ACT at the GC site (Dc@190–210 nm) was smaller than the ACT (@Dc=200 nm) affected by biomass burning (65 nm) in Texas and larger than the ACT (@Dc=200 nm) affected by urban emissions in Texas (Schwarz et al., 2008). The different sources and aging processes of rBC-containing particles affect the coatings. Laborde et al. (2013) reported that rBC-containing particles emitted by traffic were essentially uncoated, with a median coating thickness of 2±10 nm at a core size of 180–220 nm, the median ACT of rBC-containing particles emitted by biomass burning was approximately 20–40 nm, and the median ACT of rBC-containing particles in continental aged air masses reached ∼80 nm.
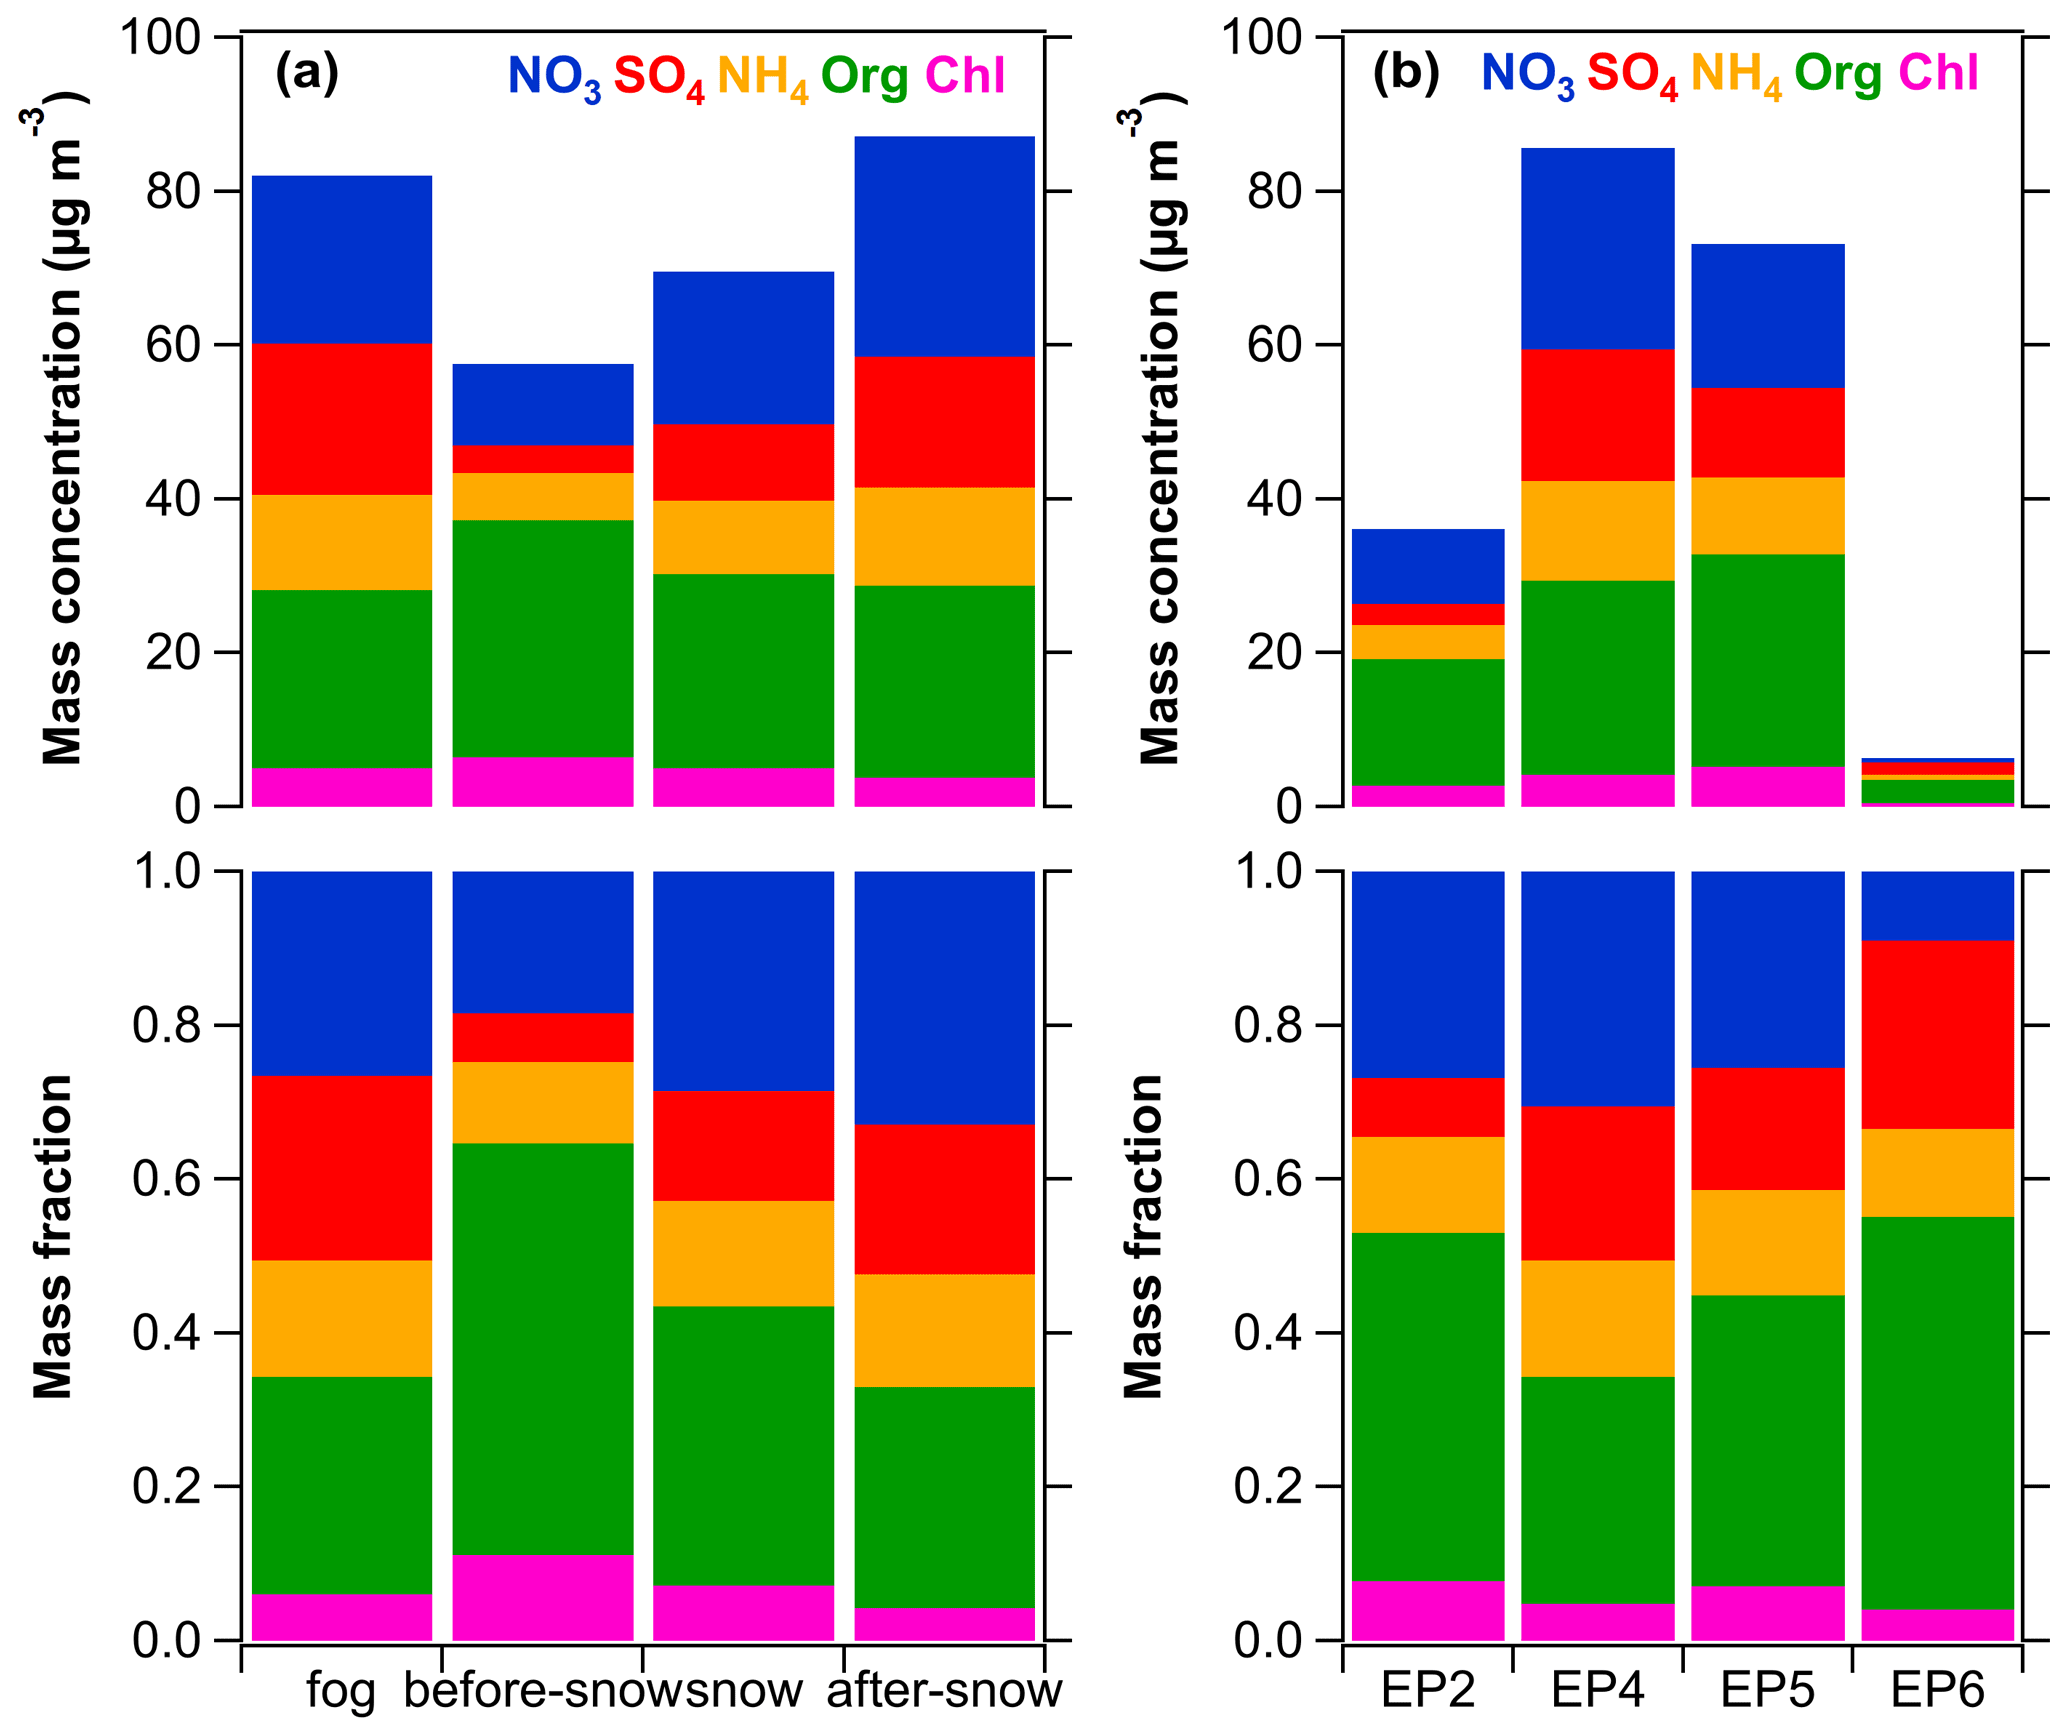
Figure 6Changes in mass concentration and mass fractions of aerosol species during different periods.
In addition, we compared the average coating thickness of rBC-containing particles during different periods. As shown in Table S2, the average RCT and ACT (±1σ) (Dc@170–190 nm) were 2.0 (±0.3) and 92.7 (±23.8) nm, respectively, during the fog event, which were the highest values during the whole observation period. During the before-snow, snow, and after-snow periods, the average RCTs (ACTs) (±1σ) (Dc@170–190 nm) were 1.4 (±0.1) (39.9 (±43.6) nm), 1.5 (±0.1) (46.9 (±4.5) nm), and 1.7 (±0.1) (61.3 (±4.7) nm), respectively. During the polluted periods (EP2, EP4, and EP5), the average RCTs (ACTs) (±1σ) (Dc@170–190 nm) were 1.5 (±0.1) (42.3(±9.4) nm), 1.7 (±0.1) (58.6(±12.7) nm), and 1.6 (±0.2) (37.0 (±9.5) nm), respectively. The average RCT and ACT (±1σ) (Dc@170–190 nm) were 1.4 (±0.1) and 37.0 (±9.5) nm during the clean period (EP6). We used the ambient mass concentrations of NR-PM1 and meteorological conditions to discuss the differences in coating thickness during different periods. According to Fig. 6, the ambient mass concentrations of total NR-PM1 were almost the same during the fog, after-snow, and EP4 periods. However, the coating thickness was different. The RH during these three periods was different, where the RH during the fog event was highest (RH = 100 %), the RH during EP4 was lowest (RH ∼ 81 %), and the RH during the after-snow period was about 96 %. In addition, the concentrations and mass fractions of ambient sulfate and organics during fog events were the highest and lowest, respectively, in the three cases. This indicates that a high RH significantly affected the formation of coatings under the same concentration of pollutants in the atmosphere. Moreover, it was also likely that the high RH provides favorable conditions for the sulfate formed by the aqueous-phase reaction. This also means that the high fraction of sulfate and low fraction of organics in the environment provide favorable conditions for the formation of coatings. This is similar to the conclusion obtained from previous studies; the increase of growth factor of BC (gfBC) was positively associated with the elevation of secondary inorganic material, while it was suppressed by the increase of organic coating content (Liu et al., 2013). The changes of the coatings and variations of the NR-PM1 fractions in the environment were also consistent with this pattern. The secondary transformation of inorganic aerosols was intensified due to the increasing ambient RH during snowfall. The increase in the fraction of secondary inorganic aerosols in the atmosphere and the decrease in the fraction of organic materials and chlorides to a certain extent favor the formation of rBC coatings. Similarly, the coating thickness of rBC-containing particles showed a positive variation with RH and the fractions of secondary inorganic aerosols during the selected pollution periods (EP2, EP4, and EP5). Despite the higher concentration of rBC during EP2, the lower RH and the fraction of secondary inorganic aerosols during this period result in thinner coatings of rBC-containing particles, indicating that pollution processes based on primary emissions were not conducive to the formation of rBC coatings. During dry, clean days, both primary emissions and secondary transformation were weak, and the coating thickness of rBC-containing particles was relatively thinner compared with periods of pollution days under high-RH conditions. This part of rBC-containing particles constitutes mainly aged rBC that has not been scavenged.
3.3.2 Absorption enhancement of rBC-containing particles
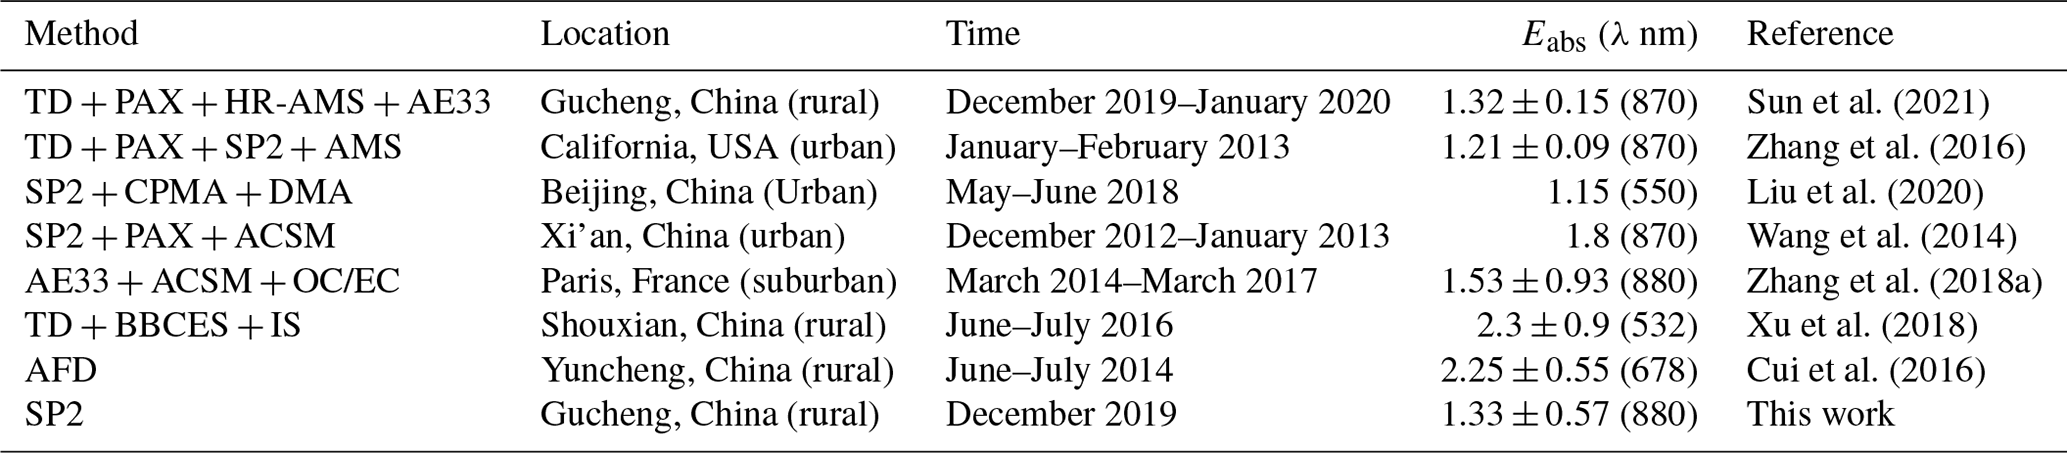
The Eabs, σabs, and MAC of rBC-containing particles during the whole campaign are shown in Fig. 5. The average Eabs and MAC at 880 nm were 1.3 and 5.5 m2 g−1, respectively, as calculated by Mie theory. Comparisons of Eabs in various field studies are shown in Table 2. The Eabs values at the GC site we simulated were consistent with the value measured by Sun et al. (2021) with TD-PAX (Droplet Measurement Technologies) at 870 nm (1.32±0.15). The Eabs calculated by Mie theory is only related to the core size of rBC, the refractive index of rBC-containing particles, and the coating thickness. It has been suggested that the correlation between σabs calculated by Mie theory and σabs measured by AE33 is as high as 0.98, indicating that the optical properties of rBC-containing particles calculated by Mie theory can represent the actual rBC-containing particles in a specific area (Zhang et al., 2018a). Therefore, we compared the differences in Eabs between the GC site and other regions. A moderate Eabs (1.21±0.09) at 870 nm was found in California during winter in 2013 which was close to the present study (Zhang et al., 2016). The Eabs were slightly larger than the value simulated using core–shell in Beijing during summer in 2008 at 550 nm (1.15) (Liu et al., 2020b). Slightly high Eabs values were observed in Xi'an (1.8 at 870 nm) (Wang et al., 2014) and Paris (1.53±0.93 at 880 nm) (Zhang et al., 2018b), which represent the more polluted urban areas. Previous studies have found that the Eabs values are generally higher in rural areas than in urban areas, such as Shouxian (2.3±0.9 at 532 nm) (Xu et al., 2018) and Yuncheng (2.25±0.55 at 678 nm) (Cui et al., 2016). In addition, we studied the absorption enhancement of rBC-containing particles during six different periods, and specific information is detailed in Table S1 in the Supplement. From the before-snow to after-snow period, the coating thickness and Eabs of rBC-containing particles increased gradually. During the clean period, rBC with a larger core size was mostly emitted from primary sources, and the Eabs was close to 1. In the fog event, the coating thickness was the highest among the six periods, while the Eabs was lower. This may be because the core size (Dc) of rBC during fog events was larger, rBC with a large core size (Dc) had a lower MAC, and the addition of coatings to rBC with a large Dc did not significantly affect the final total MAC compared to rBC with a small Dc (Liu et al., 2019). Compared with other rural sites, the Eabs and MAC of rBC-containing particles at the GC site were low. Sun et al. (2021) found that the absorption due to the lensing effect at the GC site correlated best with chloride and less well with secondary inorganic aerosol (SIA) and secondary organic aerosol (SOA). Chloride is mainly from coal combustion and biomass burning emissions, which means that the Eabs values at the GC site of rBC-containing particles were dominantly affected by primary species and that the coatings formed by secondary reaction products had little effect on Eabs. This result was consistent with the findings observed at Fresno with similar emission sources as the GC site, where the average mixing-induced absorption enhancement of BC due to the coatings can be very small (Cappa et al., 2019).
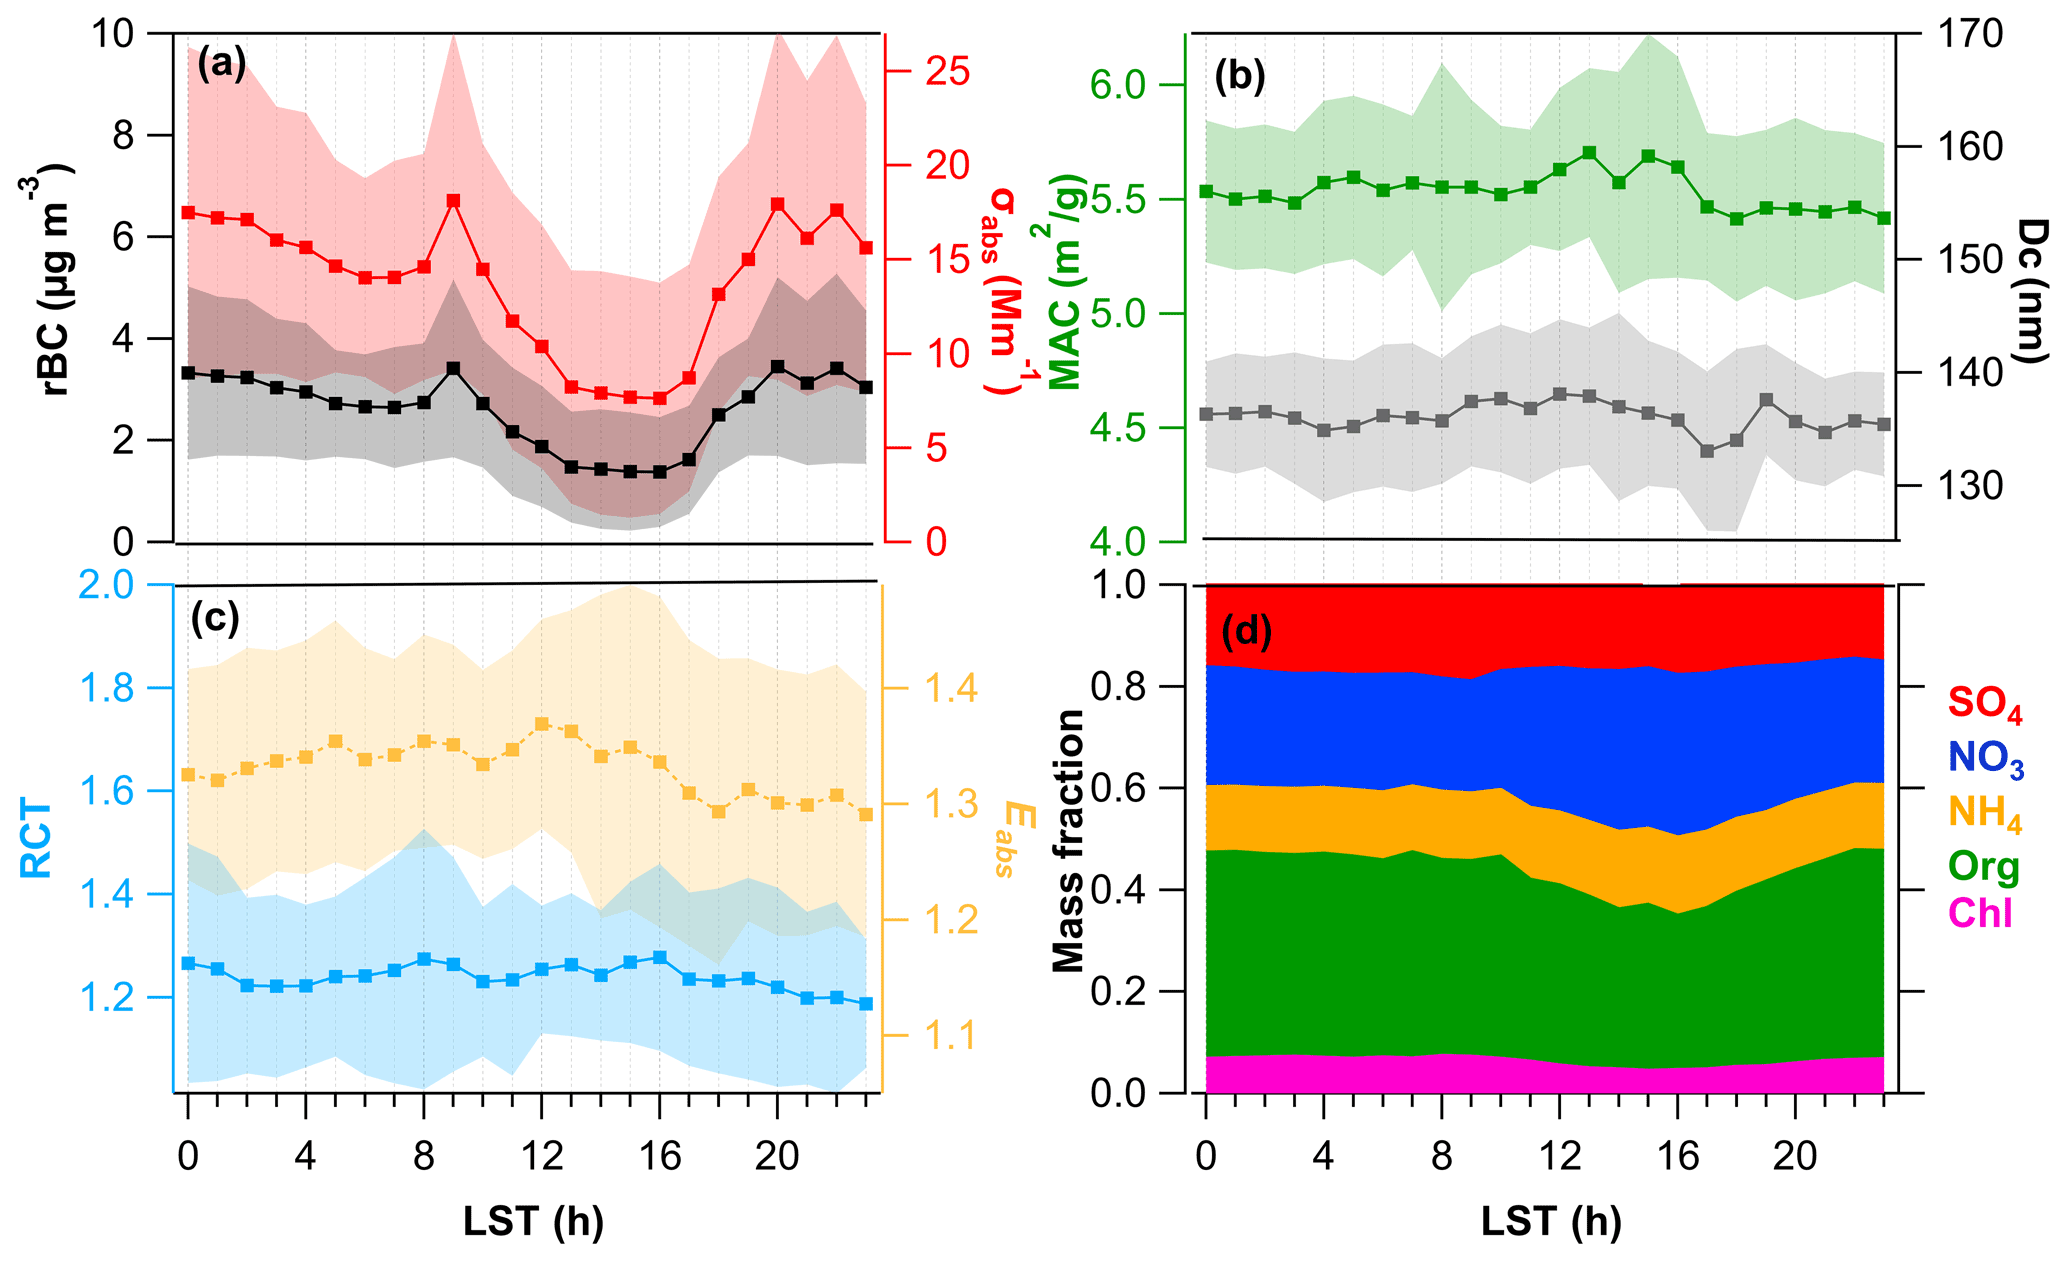
Figure 7Diurnal variation in (a) rBC mass loading and absorption coefficients (σabs) of rBC-containing particles, (b) the mass absorption cross section (MAC) of rBC-containing particles and the MMD, and (c) relative coating thickness (RCT@Dc=180 nm) and absorption enhancement (Eabs) of rBC. The shaded areas denote the standard deviation. (d) Mass fraction of aerosol species.
3.4 Diurnal variation of the mixing state of rBC
Figure 7 exhibits the diurnal trend of the mixing state of rBC-containing particles. The temporal variation in rBC exhibited a clear U-shaped pattern, while the diurnal variation in wind speed was the opposite (Fig. S3). The mean rBC mass loading increased during the evening, with a peak (3.5 µg m−3) at 20:00 LST and a minimum (1.4 µg m−3) at 16:00 LST at the GC site, which was later than that in Beijing (Xie et al., 2020). From the diurnal variation of wind speed (Fig. S3), it can be seen that the wind speed started to increase at approximately 09:00 LST and reached a maximum (2.2 m s−1) at 13:00 LST. These two time points corresponded to the start of rBC decline and the lowest value of rBC respectively. This diurnal variation in rBC and wind speed can be explained by the diurnal variation in the boundary layer (Simpson and McGee, 2012; Talukdar et al., 2019). In the early morning, calm inversion conditions predominate in the boundary layer. The temperature rose, the wind speed increased to an average of over 2 m s−1 at midday, and the rBC declined rapidly with decreased atmospheric stability and increased turbulence. After sunset, the temperature dropped sharply, due to inversion and increased emissions from heating activities, and the surface pollution of rBC was enhanced. The diurnal cycle of σabs was similar to that of rBC mass concentration, which may be because σabs values of rBC depend on its concentration (Zhang et al., 2018b). MAC and Dc did not show significant diurnal variations. The coating thickness of freshly emitted rBC-containing particles was thin but thicker through a complex aging process, indicating that the RCT was controlled by the competing effects of the aging process and emissions. The temporal variation in RCT did not present a clear inverted U-shaped pattern like Beijing during summer (Liu et al., 2020b). Three peaks of the mean RCT appeared at 00:00, 08:00, and 18:00, indicating that rBC emissions increased after 00:00, 08:00, and 18:00 at the GC site, and fresh rBC decreased the coating thickness. In addition, there was a significant increase in RCT from the late afternoon. The light absorption enhancement of rBC also did not present a strong diurnal variation trend like Beijing during June (Xie et al., 2019). This trend was consistent with the diurnal variation trend of MAC but different from that of RCT. As shown in Fig. S4, a good correlation was found between MAC (880 nm) and Eabs, with an R2 of 0.75, and a weak anticorrelation was found between RCT and Eabs, with an R2 of 0.14. This is consistent with the results discussed in Sect. 3.3.2, where the Eabs values at the GC site were more influenced by the MAC of the rBC than the coating thickness. The diurnal variation in the mass fraction of aerosol species is shown in Fig. 7d. The daily cycle of mass fractions in chloride, organics, and ammonium began to decrease in the late afternoon, while nitrate increased. The two higher diurnal peak values of the mass fraction of sulfate occurred at 09:00 and 16:00 LST, and the daily variation peak of the mass fraction of nitrate occurred at 16:00 LST. This may explain the increase in RCT in the late afternoon, and an increase in the mass fraction of sulfate and nitrate in the environment may favor an increase in the coating thickness of rBC-containing particles. However, the diurnal cycle of light absorption enhancement of rBC presented limited dependence on the aerosol species in the environment.
3.5 The dependence of the aging degree of rBC-containing particles on meteorological and pollution conditions
The factors that affect the aging degree of rBC-containing particles include photochemical reactions, chemical coatings, and the meteorology of the environment (Laborde et al., 2013; Saathoff et al., 2003; Schnaiter, 2005). Here, we select rBC-containing particles with a Dc size of 170–190 nm. Figure 8 shows RCT as a function of temperature and RH. Temperature and RH ranged from −14 to 8 ∘C and from 9 % to 100 %, respectively. In general, the changes of RH were mainly controlled by diurnal variations in temperature (Fig. S3). The higher the RH, the greater the RCT at the same temperature. At temperatures lower than −8 ∘C, the RH was lower than 60 %, and the RCT was smaller than 1.5. However, in the intermediate temperature regime (−7–4 ∘C), the RH required when the RCT exceeds 1.6 decreases with the increase of temperature. Larger RCT (RCT >2) occurred in the temperature range of −4–4 ∘C when the RH was higher than 50 %, indicating that lower RH (∼60 %) is required for rBC to form thick coatings under the subcooled condition (), while higher RH (∼80 %) is required for rBC to form thick coatings under the supercooled condition ().

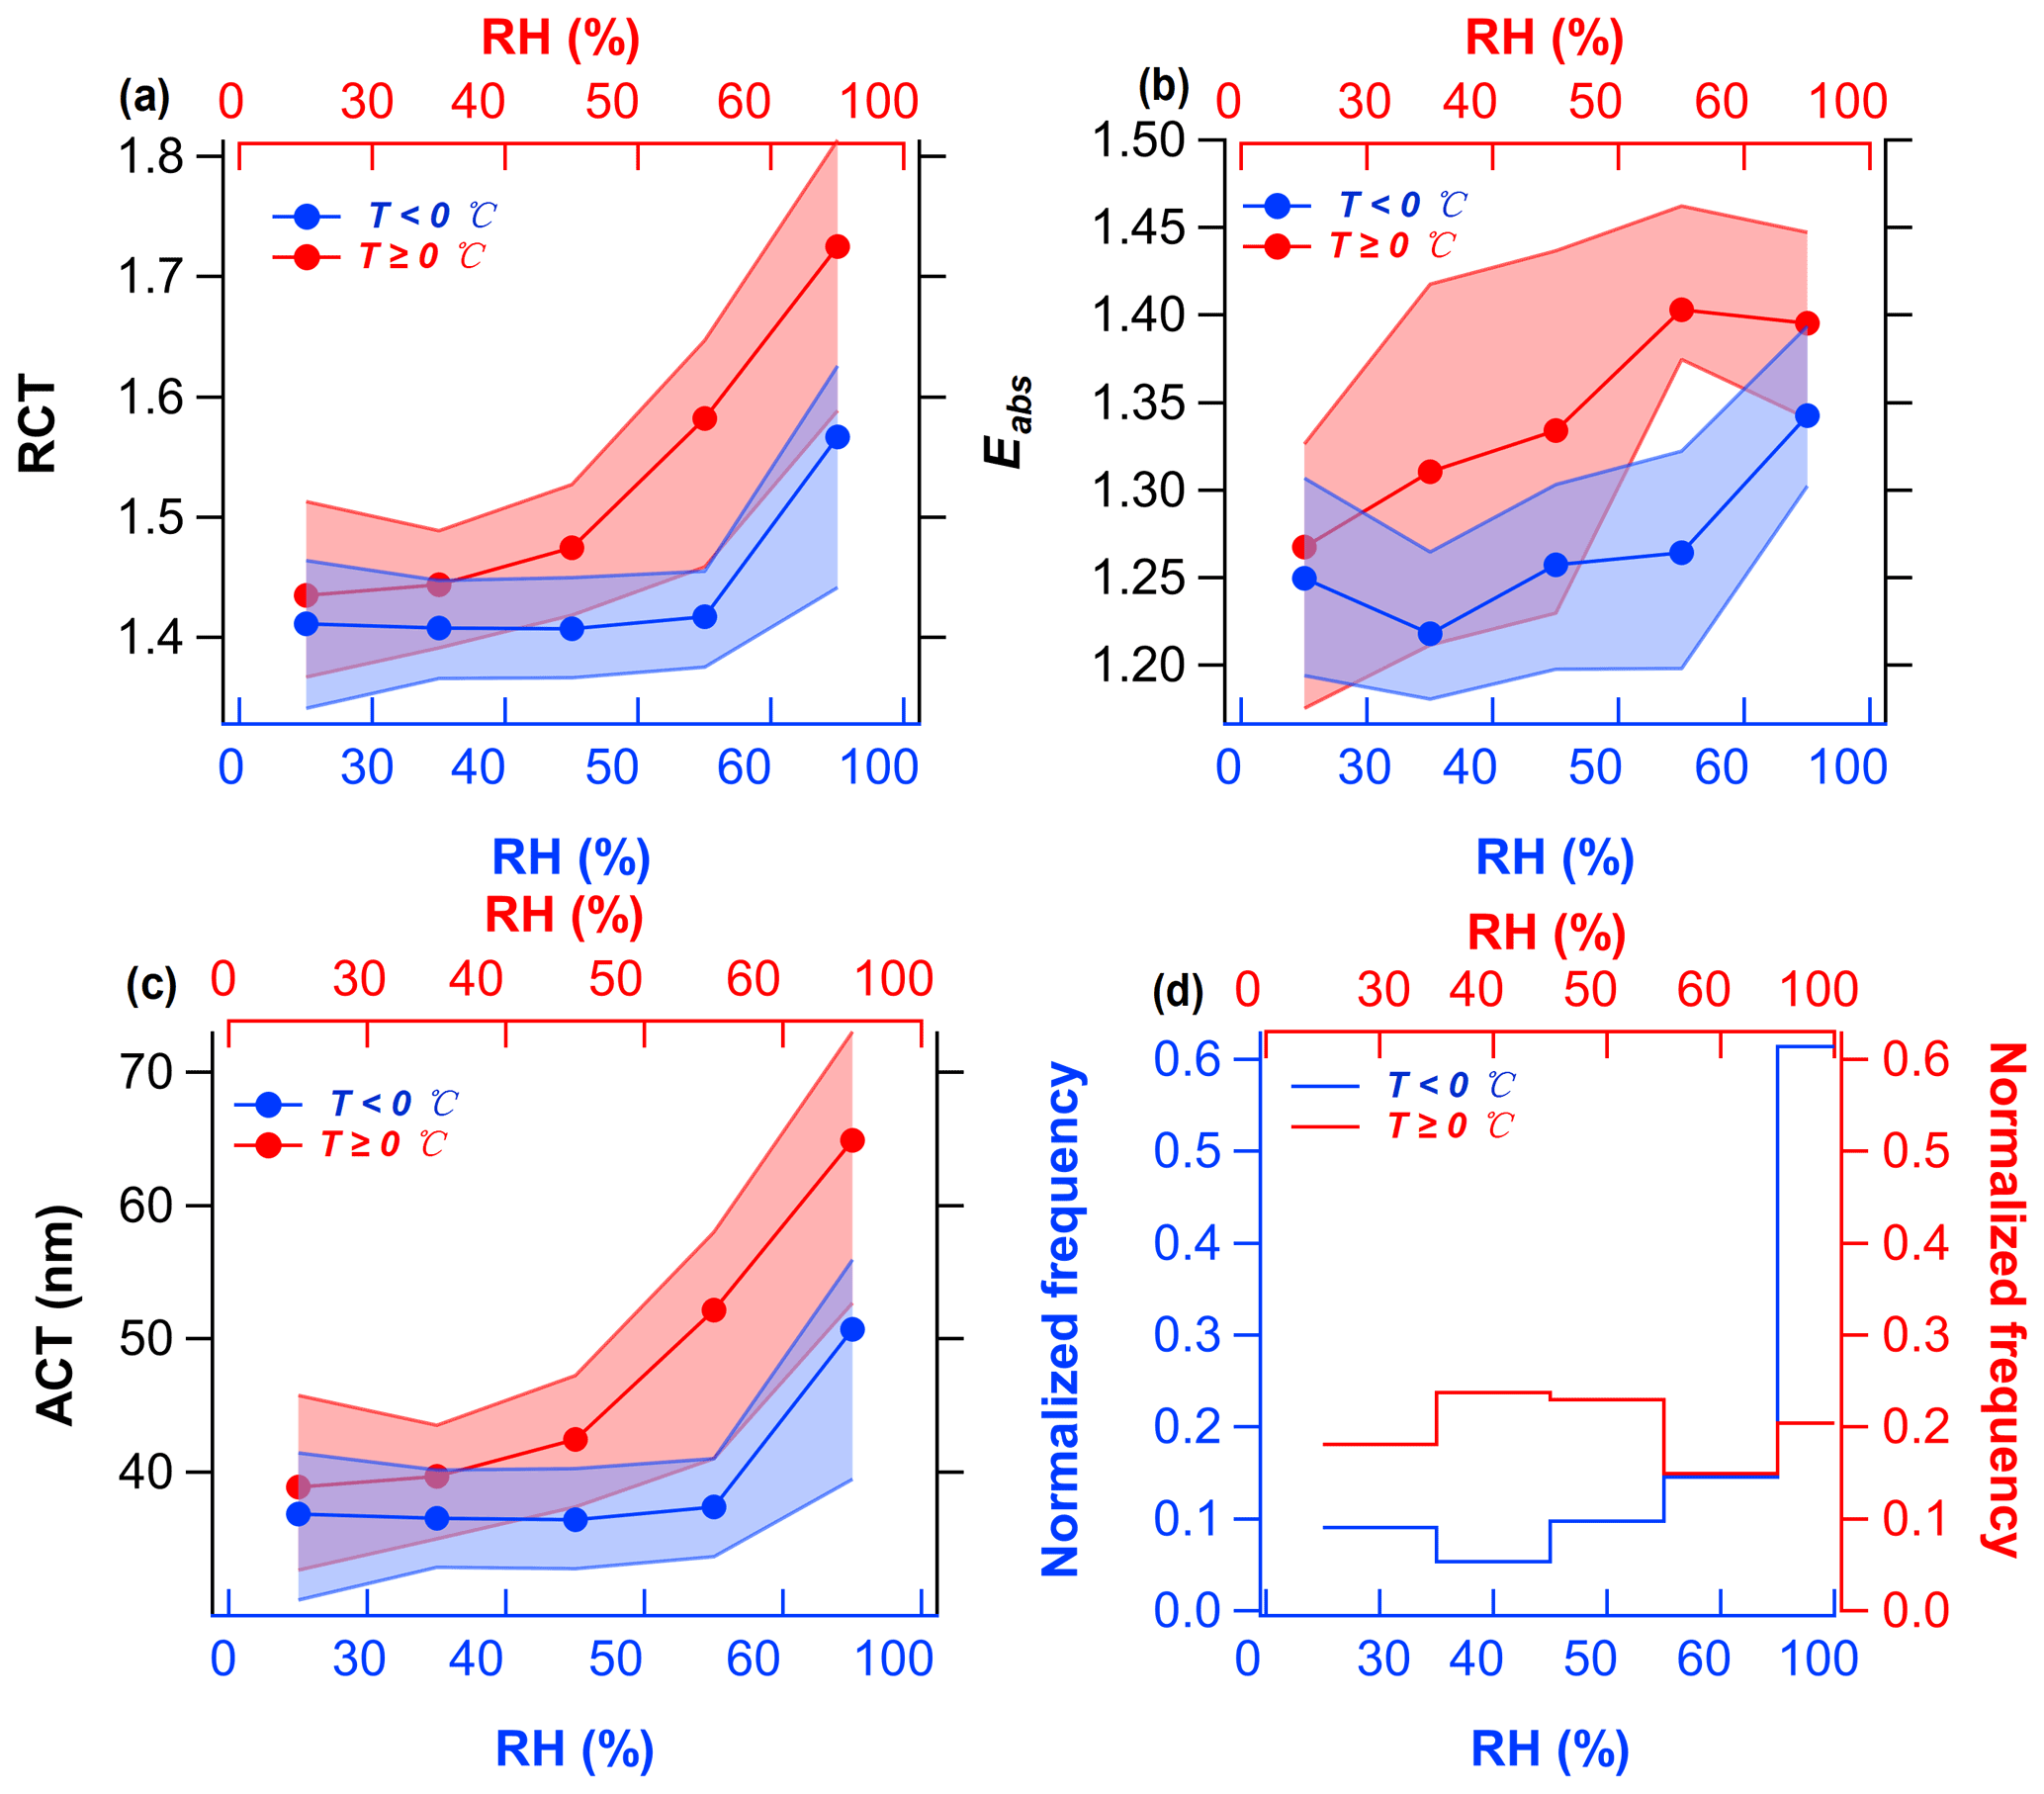
Figure 9(a–c) RCT (Dc@180 nm), Eabs, and ACT (Dc@180 nm) dependence on RH under the temperature regimes of and . Circles represent the average values. The upper and lower boundaries of the shaded areas represent the 75th and 25th percentiles of data points in each bin. (d) The normalized frequency of data points in each bin under different temperature ranges.
In order to exclude the influence of special cases on the general results, data from fog days and snow periods were excluded to further investigate the aging of rBC. Based on the normalized frequency of data points under different RH and temperature ranges (Fig. 9d), five RH levels of 0 %–30 %, 30 %–40 %, 40 %–50 %, 50 %–60 %, and 60 %–100 % were selected in two different temperature ranges (supercooled condition () and subcooled condition ()) to investigate the dependence of the mixing state of rBC on temperature and RH. The mean RCT, Eabs, ACT, and aerosol species as a function of RH for two different temperature regimes were shown in Figs. 9 and 10. The average RCT increased from ∼1.4 to 1.6 and from ∼1.4 to 1.7, and the average ACT increased from ∼37 to 51 nm and from ∼39 to 65 nm at the GC site as RH increased from 0 to 100 % under the supercooled condition and subcooled condition, respectively. The coating thickness of rBC particles was thicker under subcooled conditions than under supercooled conditions. This indicates that a suitable high temperature is conducive to the aging of rBC particles. This variation was also supported by the gradual increases in mass concentration and mass fractions of secondary components as a function of RH in the environment. Under subcooled conditions, the coating thickness of rBC started to increase significantly at RH > 40 %, whereas this phenomenon did not occur until RH > 60 % under supercooled conditions. This show that the RH required to form a thicker coating of rBC particles was lower under subcooled conditions. The high mass fraction of secondary components formed by liquid phase and heterogeneous reactions in the environment under high-RH and subcooled conditions were favorable to form coatings of rBC particles (Collier et al., 2018; Wu et al., 2016).
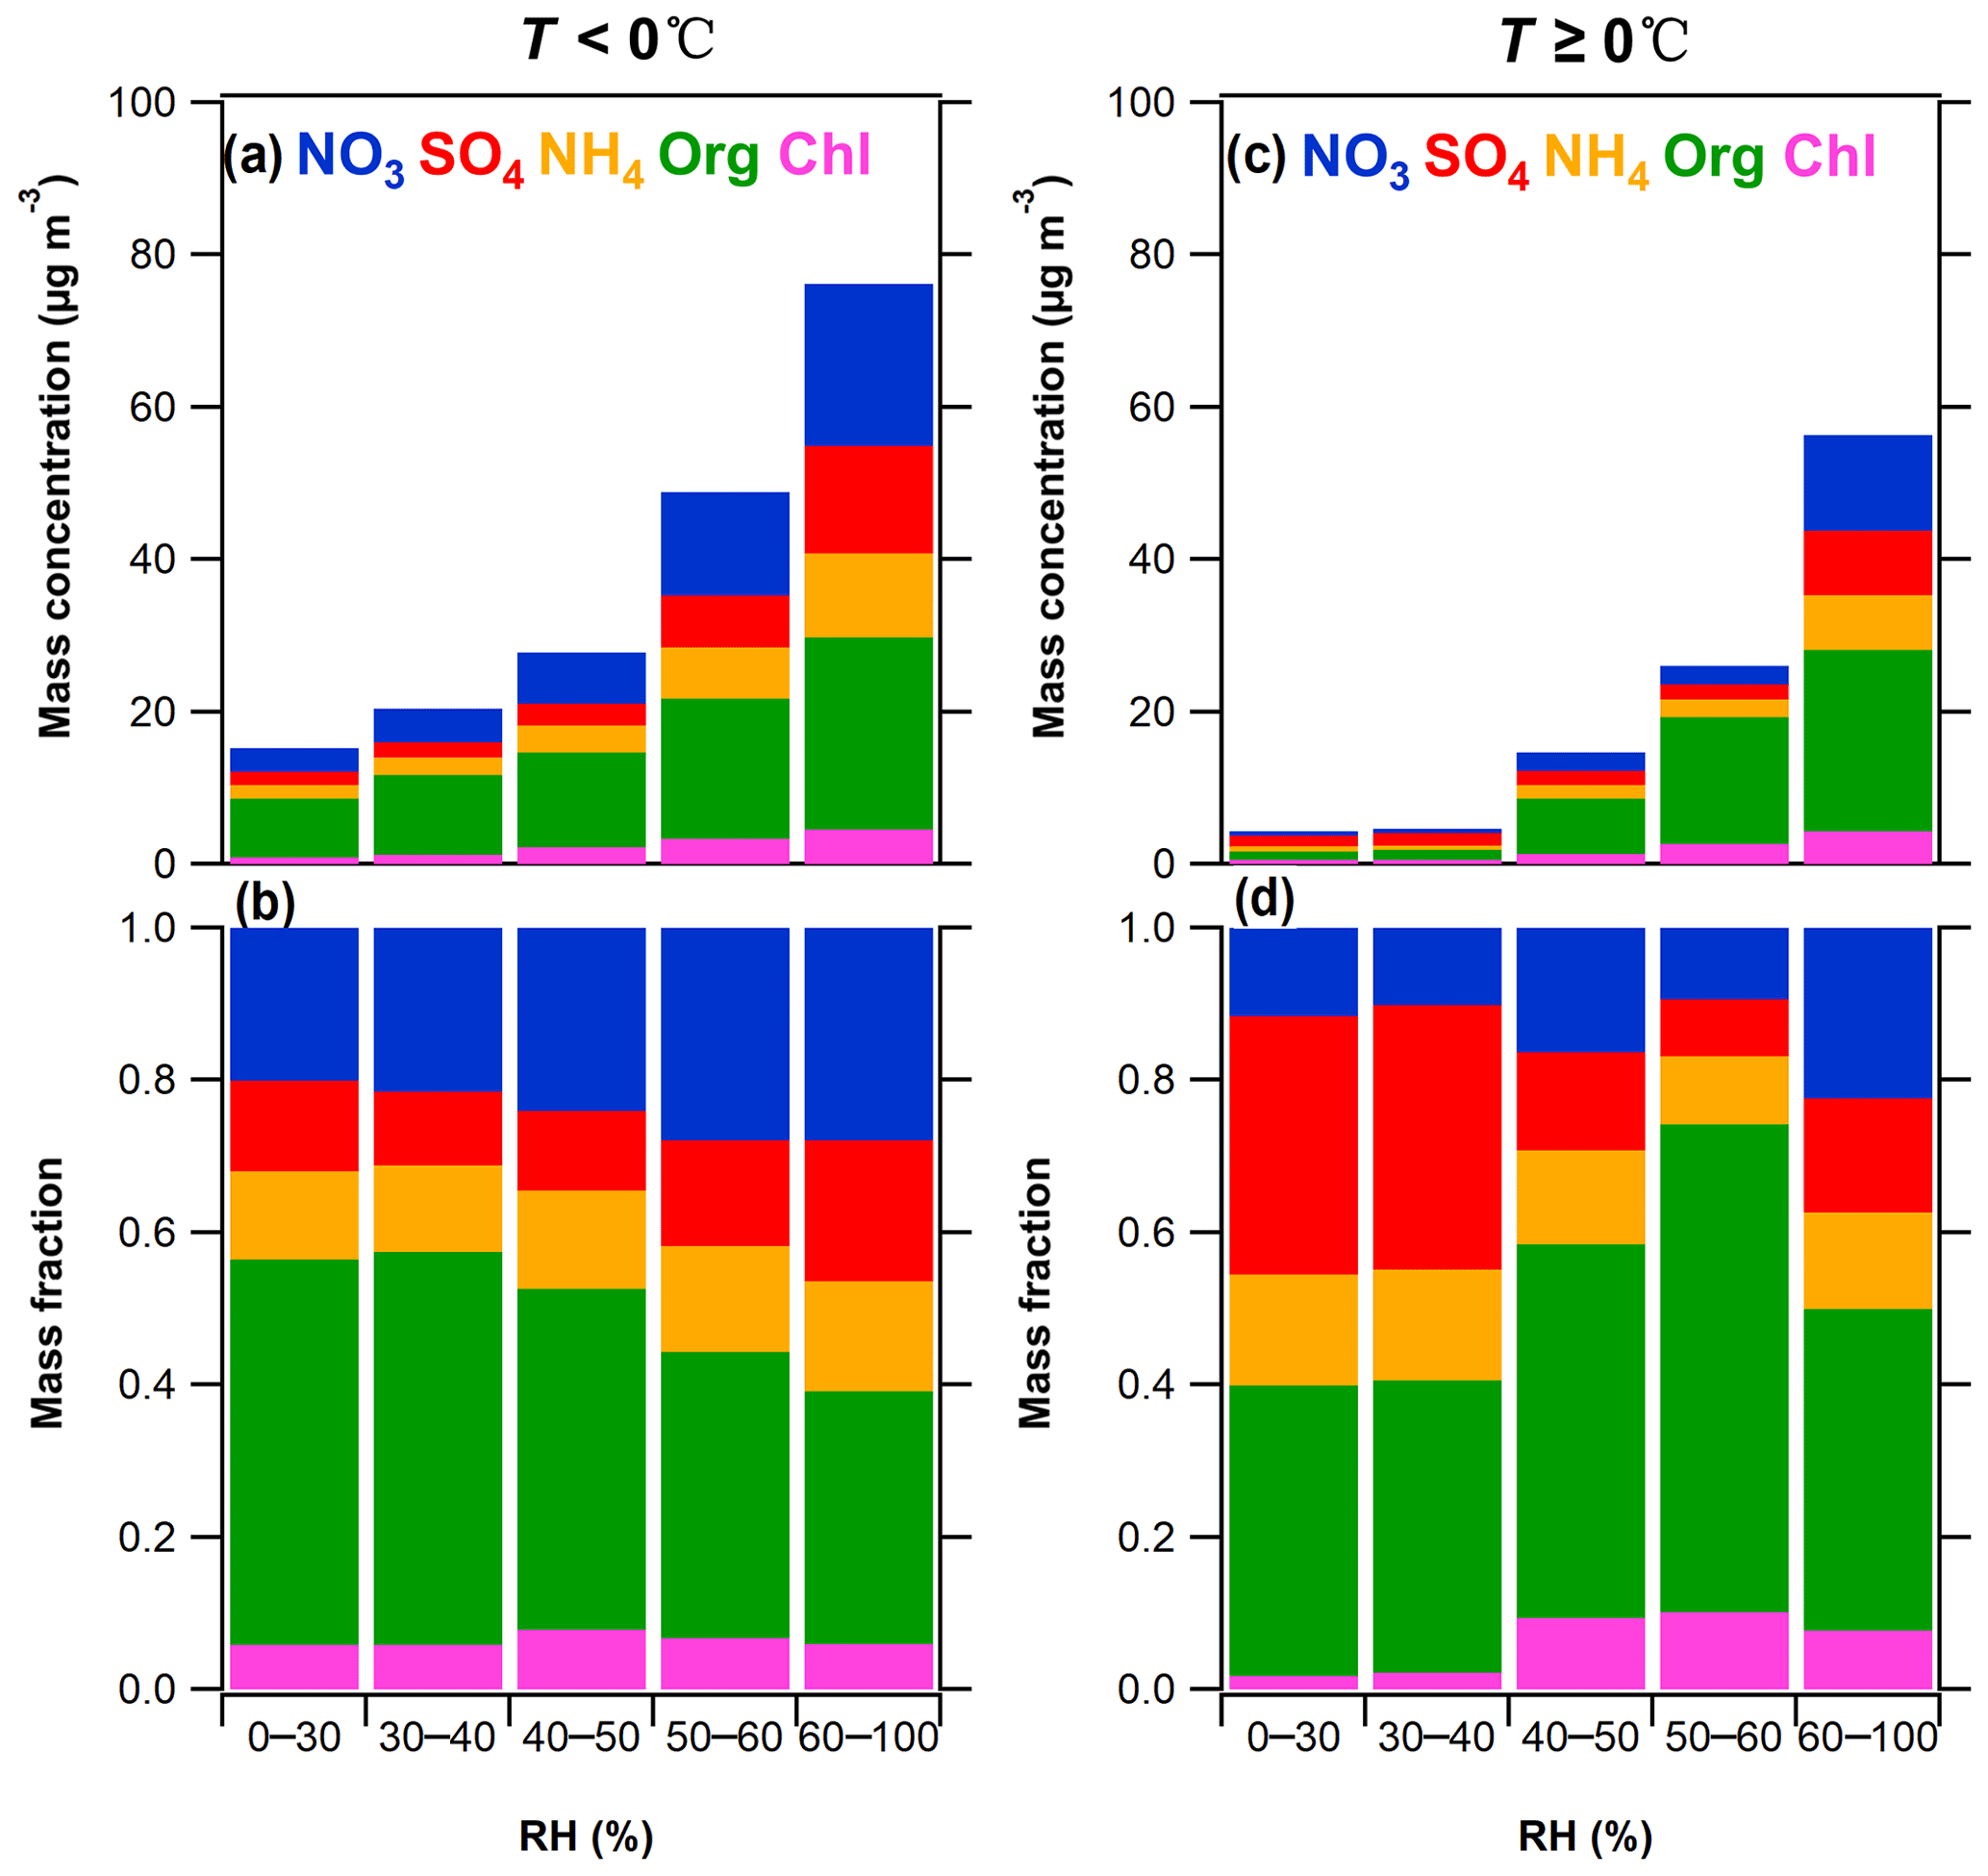
Figure 10Mass concentration and mass fractions of aerosol species dependence on RH at different temperature ranges. Panel (a) and (b) denote the situation for . Panels (c) and (d) denote the situation for .
The RH dependence of average Eabs is shown in Fig. 9b. The RH dependence of Eabs was likely caused by the RCT as supported by the gradual increase in the mass concentration and mass fraction of secondary components as a function of RH in the ambient (Fig. 10a and b). The averageEabs increased from ∼1.2 to 1.3 and from 1.3 to 1.4 as RH increased from 0 to 100 % under the supercooled condition and subcooled condition, respectively. The Eabs under subcooled conditions was greater than that under supercooled conditions. The average Eabs remained almost constant after RH exceeded 60 % under subcooled conditions. We suspected that the contribution of the aqueous-phase formation of secondary components to Eabs might be limited under high RH (Sun et al., 2021).
The size distribution, coating thickness, and optical properties of individual rBC-containing particles were measured by a single-particle soot photometer (SP2) during the period 7 to 31 December 2019 to characterize the mixing state of rBC-containing particles in rural areas on the North China Plain. There were fog, snow, and heavy pollution events during the observation period, so we analyzed the mixing state and optical properties of rBC-containing particles in different episodes and discussed the factors affecting the aging degree of rBC. The mean mass concentration of rBC at the GC site was 2.6 (±1.5) µg m−3, which was much lower than the observations in the winter of 2016 and 2018 at the urban site in Beijing. The MMD and CMD of rBC at the GC site were 213 and 122 nm, respectively. The MMD was smaller than that in other rural areas. In addition to the impact of emission sources, meteorological conditions can significantly affect the size distribution of rBC. The CMD of rBC increased after snow, suggesting that snow events with the light intensity (0.23 mm h−1) preferred to remove rBC-containing particles with smaller core sizes. The average RCT (ACT) was 1.6 (52 nm) when the Dc was in the range of 170∼190 nm, indicating a moderate coating thickness of rBC during the winter. The coating thickness of rBC-containing particles in the fog event was thicker than that in other periods due to the high RH and high concentrations of secondary aerosols. When the concentrations of NR-PM1 in the environment were the same in the different cases, the higher the RH, the thicker the coating thickness. Higher mass fractions of secondary inorganic aerosols (SIAs) and lower mass fractions of organics in the environment may favor the formation of coatings of rBC. The ensemble-average mixing-induced Eabs (1.3) and MAC (5.5 m2 g−1) at the GC site were smaller than those in other rural areas. The RCT and Eabs did not show clear diurnal cycles, with little variation in the range of ∼1.9–2 and 1.3–1.4, respectively. A good correlation was found between MAC (880 nm) and Eabs, with an R2 of 0.75, and a weak anticorrelation was found between RCT and Eabs, with an R2 of 0.14 under diurnal cycle. This may be because the optical properties of rBC at the GC site were mainly influenced by primary emissions (such as coal combustion, biomass burning, and traffic emission), and the absorption due to the lensing effect contributes less to it.
Our results showed that the mixing state of rBC-containing particles depends on the synergistic effects of ambient RH, temperature, and aerosol species. Higher RH made it easier for rBC to form thicker coatings when the ambient temperature was the same. At temperatures lower than −8 ∘C, the RH was lower than 60 %, and the RCT was smaller than 1.5. Larger RCT (RCT > 2) occurred in the temperature range of −4–4 ∘C when the RH was higher than 50 %. The RH required to form the same coating thickness of rBC was higher under supercooled conditions than that under subcooled conditions. The RH dependence of Eabs was likely caused by the RCT as supported by the gradual increase in the mass concentration and mass fraction of secondary components as a function of RH in the ambient. The mass fractions of aqueous-phase formation of secondary components had a limited effect on Eabs under a high-RH environment. The increasing mass fraction of secondary components in the environment favored the aging of rBC under high-RH, subcooled conditions. Our results highlight that the aging degree of rBC in different meteorological environments needs to be considered in regional climate models to better evaluate the radiative forcing of rBC.
To request the data given in this study, please contact Xiaole Pan at the Institute of Atmospheric Physics, Chinese Academy of Sciences, via email (panxiaole@mail.iap.ac.cn).
The supplement related to this article is available online at: https://doi.org/10.5194/acp-21-17631-2021-supplement.
YZ, SL, HL, and XP designed the research. YZ, SL, HL, XP, WX, YT, WY, XL, QL, JL, CC, YS, PF, JX, JC, and ZW performed the experiments. YZ, SL, HL, and XP performed the data analysis. YZ, HL, XP, and SL wrote the paper.
The contact author has declared that neither they nor their co-authors have any competing interests.
Publisher's note: Copernicus Publications remains neutral with regard to jurisdictional claims in published maps and institutional affiliations.
This research has been supported by the National Natural Science Foundation of China (grant no. 41877314).
This paper was edited by Ottmar Möhler and reviewed by three anonymous referees.
Baumgardner, D., Popovicheva, O., Allan, J., Bernardoni, V., Cao, J., Cavalli, F., Cozic, J., Diapouli, E., Eleftheriadis, K., Genberg, P. J., Gonzalez, C., Gysel, M., John, A., Kirchstetter, T. W., Kuhlbusch, T. A. J., Laborde, M., Lack, D., Müller, T., Niessner, R., Petzold, A., Piazzalunga, A., Putaud, J. P., Schwarz, J., Sheridan, P., Subramanian, R., Swietlicki, E., Valli, G., Vecchi, R., and Viana, M.: Soot reference materials for instrument calibration and intercomparisons: a workshop summary with recommendations, Atmos. Meas. Tech., 5, 1869–1887, https://doi.org/10.5194/amt-5-1869-2012, 2012.
Bond, T. C., Doherty, S. J., Fahey, D. W., Forster, P. M., Berntsen, T., DeAngelo, B. J., Flanner, M. G., Ghan, S., Kärcher, B., Koch, D., Kinne, S., Kondo, Y., Quinn, P. K., Sarofim, M. C., Schultz, M. G., Schulz, M., Venkataraman, C., Zhang, H., Zhang, S., Bellouin, N., Guttikunda, S. K., Hopke, P. K., Jacobson, M. Z., Kaiser, J. W., Klimont, Z., Lohmann, U., Schwarz, J. P., Shindell, D., Storelvmo, T., Warren, S. G., and Zender, C. S.: Bounding the role of black carbon in the climate system: A scientific assessment, J. Geophys. Res.-Atmos., 118, 5380–5552, https://doi.org/10.1002/jgrd.50171, 2013.
Cao, G., Zhang, X., and Zheng, F.: Inventory of black carbon and organic carbon emissions from China, Atmos. Environ., 40, 6516–6527, https://doi.org/10.1016/j.atmosenv.2006.05.070, 2006.
Cappa, C. D., Onasch, T. B., Massoli, P., Worsnop, D. R., Bates, T. S., Cross, E. S., Davidovits, P., Hakala, J., Hayden, K. L., Jobson, B. T., Kolesar, K. R., Lack, D. A., Lerner, B. M., Li, S.-M., Mellon, D., Nuaaman, I., Olfert, J. S., Petaja, T., Quinn, P. K., Song, C., Subramanian, R., Williams, E. J., and Zaveri, R. A.: Radiative Absorption Enhancements Due to the Mixing State of Atmospheric Black Carbon, Science, 337, 1078–1081, https://doi.org/10.1126/science.1223447, 2012.
Cappa, C. D., Zhang, X., Russell, L. M., Collier, S., Lee, A. K. Y., Chen, C.-L., Betha, R., Chen, S., Liu, J., Price, D. J., Sanchez, K. J., McMeeking, G. R., Williams, L. R., Onasch, T. B., Worsnop, D. R., Abbatt, J., and Zhang, Q.: Light Absorption by Ambient Black and Brown Carbon and its Dependence on Black Carbon Coating State for Two California, USA, Cities in Winter and Summer, J. Geophys. Res.-Atmos., 124, 1550–1577, https://doi.org/10.1029/2018jd029501, 2019.
Cherian, R., Quaas, J., Salzmann, M., and Tomassini, L.: Black carbon indirect radiative effects in a climate model, Tellus B, 69, 1369342, https://doi.org/10.1080/16000889.2017.1369342, 2017.
Cohen, M. D., Stunder, B. J. B., Rolph, G. D., Draxler, R. R., Stein, A. F., and Ngan, F.: NOAA's HYSPLIT Atmospheric Transport and Dispersion Modeling System, B. Am. Meteorol. Soc., 96, 2059–2077, https://doi.org/10.1175/bams-d-14-00110.1, 2015.
Collier, S., Williams, L. R., Onasch, T. B., Cappa, C. D., Zhang, X., Russell, L. M., Chen, C.-L., Sanchez, K. J., Worsnop, D. R., and Zhang, Q.: Influence of Emissions and Aqueous Processing on Particles Containing Black Carbon in a Polluted Urban Environment: Insights From a Soot Particle-Aerosol Mass Spectrometer, J. Geophys. Res.-Atmos., 123, 6648–6666, https://doi.org/10.1002/2017jd027851, 2018.
Cui, X., Wang, X., Yang, L., Chen, B., Chen, J., Andersson, A., and Gustafsson, O.: Radiative absorption enhancement from coatings on black carbon aerosols, Sci. Total Environ., 551–552, 51–56, https://doi.org/10.1016/j.scitotenv.2016.02.026, 2016.
Ding, A. J., Huang, X., Nie, W., Sun, J. N., Kerminen, V. M., Petaja, T., Su, H., Cheng, Y. F., Yang, X. Q., Wang, M. H., Chi, X. G., Wang, J. P., Virkkula, A., Guo, W. D., Yuan, J., Wang, S. Y., Zhang, R. J., Wu, Y. F., Song, Y., Zhu, T., Zilitinkevich, S., Kulmala, M., and Fu, C. B.: Enhanced haze pollution by black carbon in megacities in China, Geophys. Res. Lett., 43, 2873–2879, https://doi.org/10.1002/2016gl067745, 2016.
Ding, S., Liu, D., Zhao, D., Hu, K., Tian, P., Zhou, W., Huang, M., Yang, Y., Wang, F., Sheng, J., Liu, Q., Kong, S., Cui, P., Huang, Y., He, H., Coe, H., and Ding, D.: Size-Related Physical Properties of Black Carbon in the Lower Atmosphere over Beijing and Europe, Environ. Sci. Technol., 53, 11112–11121, https://doi.org/10.1021/acs.est.9b03722, 2019.
Fan, H., Zhao, C., Yang, Y., Yang, X., and Wang, C.: Impact of emissions from a single urban source on air quality estimated from mobile observation and WRF-STILT model simulations, Air Qual. Atmos. Hlth., 14, 1313–1323, https://doi.org/10.1007/s11869-021-01023-9, 2021a.
Fan, H., Wang, Y., Zhao, C., Yang, Y., Yang, X., Sun, Y., and Jiang, S.: The Role of Primary Emission and Transboundary Transport in the Air Quality Changes During and After the COVID-19 Lockdown in China, Geophys. Res. Lett., 48, e2020GL091065, https://doi.org/10.1029/2020GL091065, 2021b.
Freney, E. J., Adachi, K., and Buseck, P. R.: Internally mixed atmospheric aerosol particles: Hygroscopic growth and light scattering, J. Geophys. Res., 115, D19210, https://doi.org/10.1029/2009jd013558, 2010.
Gao, R. S., Schwarz, J. P., Kelly, K. K., Fahey, D. W., Watts, L. A., Thompson, T. L., Spackman, J. R., Slowik, J. G., Cross, E. S., Han, J. H., Davidovits, P., Onasch, T. B., and Worsnop, D. R.: A Novel Method for Estimating Light-Scattering Properties of Soot Aerosols Using a Modified Single-Particle Soot Photometer, Aerosol Sci. Tech., 41, 125–135, https://doi.org/10.1080/02786820601118398, 2007.
Gong, X., Zhang, C., Chen, H., Nizkorodov, S. A., Chen, J., and Yang, X.: Size distribution and mixing state of black carbon particles during a heavy air pollution episode in Shanghai, Atmos. Chem. Phys., 16, 5399–5411, https://doi.org/10.5194/acp-16-5399-2016, 2016.
He, C., Liou, K.-N., Takano, Y., Zhang, R., Levy Zamora, M., Yang, P., Li, Q., and Leung, L. R.: Variation of the radiative properties during black carbon aging: theoretical and experimental intercomparison, Atmos. Chem. Phys., 15, 11967–11980, https://doi.org/10.5194/acp-15-11967-2015, 2015.
Huang, X. F., Yu, J. Z., He, L. Y., and Hu, M.: Size distribution characteristics of elemental carbon emitted from Chinese vehicles: Results of a tunnel study and atmospheric implications, Environ. Sci. Technol., 40, 5355–5360, https://doi.org/10.1021/es0607281, 2006.
Huang, X.-F., Sun, T.-L., Zeng, L.-W., Yu, G.-H., and Luan, S.-J.: Black carbon aerosol characterization in a coastal city in South China using a single particle soot photometer, Atmos. Environ., 51, 21–28, https://doi.org/10.1016/j.atmosenv.2012.01.056, 2012.
Ji, D., Li, L., Pang, B., Xue, P., Wang, L., Wu, Y., Zhang, H., and Wang, Y.: Characterization of black carbon in an urban-rural fringe area of Beijing, Environ. Pollut., 223, 524–534, https://doi.org/10.1016/j.envpol.2017.01.055, 2017.
Jimenez, J. L.: Ambient aerosol sampling using the Aerodyne Aerosol Mass Spectrometer, J. Geophys. Res., 108, 8452, https://doi.org/10.1029/2001jd001213, 2003.
Kondo, Y., Moteki, N., Oshima, N., Ohata, S., Koike, M., Shibano, Y., Takegawa, N., and Kita, K.: Effects of wet deposition on the abundance and size distribution of black carbon in East Asia, J. Geophys. Res.-Atmos., 121, 4691–4712, https://doi.org/10.1002/2015jd024479, 2016.
Kumar, B., Chakraborty, A., Tripathi, S. N., and Bhattu, D.: Highly time resolved chemical characterization of submicron organic aerosols at a polluted urban location, Environ. Sci.-Proc. Imp., 18, 1285–1296, https://doi.org/10.1039/c6em00392c, 2016.
Laborde, M., Mertes, P., Zieger, P., Dommen, J., Baltensperger, U., and Gysel, M.: Sensitivity of the Single Particle Soot Photometer to different black carbon types, Atmos. Meas. Tech., 5, 1031–1043, https://doi.org/10.5194/amt-5-1031-2012, 2012.
Laborde, M., Crippa, M., Tritscher, T., Jurányi, Z., Decarlo, P. F., Temime-Roussel, B., Marchand, N., Eckhardt, S., Stohl, A., Baltensperger, U., Prévôt, A. S. H., Weingartner, E., and Gysel, M.: Black carbon physical properties and mixing state in the European megacity Paris, Atmos. Chem. Phys., 13, 5831–5856, https://doi.org/10.5194/acp-13-5831-2013, 2013.
Lan, Z.-J., Huang, X.-F., Yu, K.-Y., Sun, T.-L., Zeng, L.-W., and Hu, M.: Light absorption of black carbon aerosol and its enhancement by mixing state in an urban atmosphere in South China, Atmos. Environ., 69, 118–123, https://doi.org/10.1016/j.atmosenv.2012.12.009, 2013.
Liu, D., Flynn, M., Gysel, M., Targino, A., Crawford, I., Bower, K., Choularton, T., Jurányi, Z., Steinbacher, M., Hüglin, C., Curtius, J., Kampus, M., Petzold, A., Weingartner, E., Baltensperger, U., and Coe, H.: Single particle characterization of black carbon aerosols at a tropospheric alpine site in Switzerland, Atmos. Chem. Phys., 10, 7389–7407, https://doi.org/10.5194/acp-10-7389-2010, 2010.
Liu, D., Allan, J., Whitehead, J., Young, D., Flynn, M., Coe, H., McFiggans, G., Fleming, Z. L., and Bandy, B.: Ambient black carbon particle hygroscopic properties controlled by mixing state and composition, Atmos. Chem. Phys., 13, 2015–2029, https://doi.org/10.5194/acp-13-2015-2013, 2013.
Liu, D., Joshi, R., Wang, J., Yu, C., Allan, J. D., Coe, H., Flynn, M. J., Xie, C., Lee, J., Squires, F., Kotthaus, S., Grimmond, S., Ge, X., Sun, Y., and Fu, P.: Contrasting physical properties of black carbon in urban Beijing between winter and summer, Atmos. Chem. Phys., 19, 6749–6769, https://doi.org/10.5194/acp-19-6749-2019, 2019.
Liu, D. T., Whitehead, J., Alfarra, M. R., Reyes-Villegas, E., Spracklen, D. V., Reddington, C. L., Kong, S. F., Williams, P. I., Ting, Y. C., Haslett, S., Taylor, J. W., Flynn, M. J., Morgan, W. T., McFiggans, G., Coe, H., and Allan, J. D.: Black-carbon absorption enhancement in the atmosphere determined by particle mixing state, Nat. Geosci., 10, 184–188, https://doi.org/10.1038/ngeo2901, 2017.
Liu, H., Pan, X., Wu, Y., Ji, D., Tian, Y., Chen, X., and Wang, Z.: Size-resolved mixing state and optical properties of black carbon at an urban site in Beijing, Sci. Total Environ., 749, 141523, https://doi.org/10.1016/j.scitotenv.2020.141523, 2020a.
Liu, H., Pan, X., Liu, D., Liu, X., Chen, X., Tian, Y., Sun, Y., Fu, P., and Wang, Z.: Mixing characteristics of refractory black carbon aerosols at an urban site in Beijing, Atmos. Chem. Phys., 20, 5771–5785, https://doi.org/10.5194/acp-20-5771-2020, 2020b.
Liu, S., Aiken, A. C., Gorkowski, K., Dubey, M. K., Cappa, C. D., Williams, L. R., Herndon, S. C., Massoli, P., Fortner, E. C., Chhabra, P. S., Brooks, W. A., Onasch, T. B., Jayne, J. T., Worsnop, D. R., China, S., Sharma, N., Mazzoleni, C., Xu, L., Ng, N. L., Liu, D., Allan, J. D., Lee, J. D., Fleming, Z. L., Mohr, C., Zotter, P., Szidat, S., and Prevot, A. S. H.: Enhanced light absorption by mixed source black and brown carbon particles in UK winter, Nat. Commun., 6, 8435, https://doi.org/10.1038/ncomms9435, 2015.
Moffet, R. C. and Prather, K. A.: In-situ measurements of the mixing state and optical properties of soot with implications for radiative forcing estimates, P. Natl. Acad. Sci. USA, 106, 11872–11877, https://doi.org/10.1073/pnas.0900040106, 2009.
Moteki, N. and Kondo, Y.: Effects of Mixing State on Black Carbon Measurements by Laser-Induced Incandescence, Aerosol Sci. Tech., 41, 398–417, https://doi.org/10.1080/02786820701199728, 2007.
Moteki, N., Kondo, Y., Oshima, N., Takegawa, N., Koike, M., Kita, K., Matsui, H., and Kajino, M.: Size dependence of wet removal of black carbon aerosols during transport from the boundary layer to the free troposphere, Geophys. Res. Lett., 39, L13802, https://doi.org/10.1029/2012gl052034, 2012.
Oshima, N., Koike, M., Zhang, Y., Kondo, Y., Moteki, N., Takegawa, N., and Miyazaki, Y.: Aging of black carbon in outflow from anthropogenic sources using a mixing state resolved model: Model development and evaluation, J. Geophys. Res., 114, D06210, https://doi.org/10.1029/2008jd010680, 2009.
Pan, X., Kanaya, Y., Taketani, F., Miyakawa, T., Inomata, S., Komazaki, Y., Tanimoto, H., Wang, Z., Uno, I., and Wang, Z.: Emission characteristics of refractory black carbon aerosols from fresh biomass burning: a perspective from laboratory experiments, Atmos. Chem. Phys., 17, 13001–13016, https://doi.org/10.5194/acp-17-13001-2017, 2017.
Saathoff, H., Naumann, K. H., Schnaiter, M., Schöck, W., Möhler, O., Schurath, U., Weingartner, E., Gysel, M., and Baltensperger, U.: Coating of soot and (NH4)2SO4 particles by ozonolysis products of α-pinene, J. Aerosol Sci., 34, 1297–1321, https://doi.org/10.1016/s0021-8502(03)00364-1, 2003.
Sarangi, B., Ramachandran, S., Rajesh, T. A., and Dhaker, V. K.: Black carbon linked aerosol hygroscopic growth: Size and mixing state are crucial, Atmos. Environ., 200, 110–118, https://doi.org/10.1016/j.atmosenv.2018.12.001, 2019.
Schnaiter, M.: Absorption amplification of black carbon internally mixed with secondary organic aerosol, J. Geophys. Res., 110, D19204, https://doi.org/10.1029/2005jd006046, 2005.
Schwarz, J. P., Gao, R. S., Fahey, D. W., Thomson, D. S., Watts, L. A., Wilson, J. C., Reeves, J. M., Darbeheshti, M., Baumgardner, D. G., Kok, G. L., Chung, S. H., Schulz, M., Hendricks, J., Lauer, A., Karcher, B., Slowik, J. G., Rosenlof, K. H., Thompson, T. L., Langford, A. O., Loewenstein, M., and Aikin, K. C.: Single-particle measurements of midlatitude black carbon and light-scattering aerosols from the boundary layer to the lower stratosphere, J. Geophys. Res.-Atmos., 111, D16207, https://doi.org/10.1029/2006jd007076, 2006a.
Schwarz, J. P., Gao, R. S., Fahey, D. W., Thomson, D. S., Watts, L. A., Wilson, J. C., Reeves, J. M., Darbeheshti, M., Baumgardner, D. G., Kok, G. L., Chung, S. H., Schulz, M., Hendricks, J., Lauer, A., Karcher, B., Slowik, J. G., Rosenlof, K. H., Thompson, T. L., Langford, A. O., Loewenstein, M., and Aikin, K. C.: Single-particle measurements of midlatitude black carbon and light-scattering aerosols from the boundary layer to the lower stratosphere, J. Geophys. Res.-Atmos., 111, 15, https://doi.org/10.1029/2006jd007076, 2006b.
Schwarz, J. P., Gao, R. S., Spackman, J. R., Watts, L. A., Thomson, D. S., Fahey, D. W., Ryerson, T. B., Peischl, J., Holloway, J. S., Trainer, M., Frost, G. J., Baynard, T., Lack, D. A., de Gouw, J. A., Warneke, C., and Del Negro, L. A.: Measurement of the mixing state, mass, and optical size of individual black carbon particles in urban and biomass burning emissions, Geophys. Res. Lett., 35, L13810, https://doi.org/10.1029/2008gl033968, 2008.
Simpson, A. J. and McGee, O. S.: Analysis of the Fumigation Effect on Pollutants over Pietermaritzburg, S. Afr. Geogr. J., 78, 41–46, https://doi.org/10.1080/03736245.1996.9713605, 2012.
Stephens, M., Turner, N., and Sandberg, J.: Particle identification by laser-induced incandescence in a solid-state laser cavity, Appl. Optics, 42, 3726–3736, https://doi.org/10.1364/ao.42.003726, 2003.
Su, J., Zhao, P., and Chen, Y.: Characteristics of Number Concentration Size Distributions of Aerosols Under Different Weather Processes in Beijing, Environm. Sci., 37, 1208–1218, 2016.
Su, L., Yuan, Z., Fung, J. C., and Lau, A. K.: A comparison of HYSPLIT backward trajectories generated from two GDAS datasets, Sci. Total Environ., 506–507, 527–537, https://doi.org/10.1016/j.scitotenv.2014.11.072, 2015.
Sun, J., Xie, C., Xu, W., Chen, C., Ma, N., Xu, W., Lei, L., Li, Z., He, Y., Qiu, Y., Wang, Q., Pan, X., Su, H., Cheng, Y., Wu, C., Fu, P., Wang, Z., and Sun, Y.: Light absorption of black carbon and brown carbon in winter in North China Plain: comparisons between urban and rural sites, Sci. Total Environ., 770, 144821, https://doi.org/10.1016/j.scitotenv.2020.144821, 2021.
Sun, Y., Zhao, C., Su, Y., Ma, Z., Li, J., Letu, H., Yang, Y., and Fan, H.: Distinct Impacts of Light and Heavy Precipitation on PM2.5 Mass Concentration in Beijing, Earth Space Science, 6, 1915–1925, https://doi.org/10.1029/2019ea000717, 2019.
Talukdar, S., Venkat Ratnam, M., Ravikiran, V., and Chakraborty, R.: Influence of Black Carbon Aerosol on the Atmospheric Instability, J. Geophys. Res.-Atmos., 124, 5539–5554, https://doi.org/10.1029/2018jd029611, 2019.
Taylor, J. W., Allan, J. D., Allen, G., Coe, H., Williams, P. I., Flynn, M. J., Le Breton, M., Muller, J. B. A., Percival, C. J., Oram, D., Forster, G., Lee, J. D., Rickard, A. R., Parrington, M., and Palmer, P. I.: Size-dependent wet removal of black carbon in Canadian biomass burning plumes, Atmos. Chem. Phys., 14, 13755–13771, https://doi.org/10.5194/acp-14-13755-2014, 2014.
Taylor, J. W., Allan, J. D., Liu, D., Flynn, M., Weber, R., Zhang, X., Lefer, B. L., Grossberg, N., Flynn, J., and Coe, H.: Assessment of the sensitivity of core / shell parameters derived using the single-particle soot photometer to density and refractive index, Atmos. Meas. Tech., 8, 1701–1718, https://doi.org/10.5194/amt-8-1701-2015, 2015.
Twomey, S.: Pollution and planetary albedo, Atmos. Environ., 8, 1251–1256, https://doi.org/10.1016/0004-6981(74)90004-3, 1974.
Wang, Q., Huang, R. J., Cao, J., Han, Y., Wang, G., Li, G., Wang, Y., Dai, W., Zhang, R., and Zhou, Y.: Mixing State of Black Carbon Aerosol in a Heavily Polluted Urban Area of China: Implications for Light Absorption Enhancement, Aerosol Sci. Tech., 48, 689–697, https://doi.org/10.1080/02786826.2014.917758, 2014.
Wang, Q., Cao, J., Han, Y., Tian, J., Zhu, C., Zhang, Y., Zhang, N., Shen, Z., Ni, H., Zhao, S., and Wu, J.: Sources and physicochemical characteristics of black carbon aerosol from the southeastern Tibetan Plateau: internal mixing enhances light absorption, Atmos. Chem. Phys., 18, 4639–4656, https://doi.org/10.5194/acp-18-4639-2018, 2018.
Wu, Y., Zhang, R., Tian, P., Tao, J., Hsu, S. C., Yan, P., Wang, Q., Cao, J., Zhang, X., and Xia, X.: Effect of ambient humidity on the light absorption amplification of black carbon in Beijing during January 2013, Atmos. Environ., 124, 217–223, https://doi.org/10.1016/j.atmosenv.2015.04.041, 2016.
Wu, Y., Xia, Y., Zhou, C., Tian, P., Tao, J., Huang, R. J., Liu, D., Wang, X., Xia, X., Han, Z., and Zhang, R.: Effect of source variation on the size and mixing state of black carbon aerosol in urban Beijing from 2013 to 2019: Implication on light absorption, Environ. Pollut., 270, 116089, https://doi.org/10.1016/j.envpol.2020.116089, 2021.
Xie, C., He, Y., Lei, L., Zhou, W., Liu, J., Wang, Q., Xu, W., Qiu, Y., Zhao, J., Sun, J., Li, L., Li, M., Zhou, Z., Fu, P., Wang, Z., and Sun, Y.: Contrasting mixing state of black carbon-containing particles in summer and winter in Beijing, Environ. Pollut., 263, 114455, https://doi.org/10.1016/j.envpol.2020.114455, 2020.
Xie, C. H., Xu, W. Q., Wan, J. F., Liu, D. T., Ge, X. L., Zhang, Q., Wang, Q., Du, W., Zhao, J., Zhou, W., Li, J., Fu, P. Q., Wang, Z. F., Worsnop, D. L., and Sun, Y. L.: Light absorption enhancement of black carbon in urban Beijing in summer, Atmos. Environ., 213, 499–504, https://doi.org/10.1016/j.atmosenv.2019.06.041, 2019.
Xu, X., Zhao, W., Qian, X., Wang, S., Fang, B., Zhang, Q., Zhang, W., Venables, D. S., Chen, W., Huang, Y., Deng, X., Wu, B., Lin, X., Zhao, S., and Tong, Y.: The influence of photochemical aging on light absorption of atmospheric black carbon and aerosol single-scattering albedo, Atmos. Chem. Phys., 18, 16829–16844, https://doi.org/10.5194/acp-18-16829-2018, 2018.
Yang, X., Zhao, C., Zhou, L., Wang, Y., and Liu, X.: Distinct impact of different types of aerosols on surface solar radiation in China, J. Geophys. Res.-Atmos., 121, 6459–6471, https://doi.org/10.1002/2016jd024938, 2016.
Yu, C., Liu, D., Broda, K., Joshi, R., Olfert, J., Sun, Y., Fu, P., Coe, H., and Allan, J. D.: Characterising mass-resolved mixing state of black carbon in Beijing using a morphology-independent measurement method, Atmos. Chem. Phys., 20, 3645–3661, https://doi.org/10.5194/acp-20-3645-2020, 2020.
Zhang, X., Kim, H., Parworth, C. L., Young, D. E., Zhang, Q., Metcalf, A. R., and Cappa, C. D.: Optical Properties of Wintertime Aerosols from Residential Wood Burning in Fresno, CA: Results from DISCOVER-AQ 2013, Environ. Sci. Technol., 50, 1681–1690, https://doi.org/10.1021/acs.est.5b04134, 2016.
Zhang, Y., Zhang, Q., Cheng, Y., Su, H., Li, H., Li, M., Zhang, X., Ding, A., and He, K.: Amplification of light absorption of black carbon associated with air pollution, Atmos. Chem. Phys., 18, 9879–9896, https://doi.org/10.5194/acp-18-9879-2018, 2018a.
Zhang, Y., Favez, O., Canonaco, F., Liu, D., Močnik, G., Amodeo, T., Sciare, J., Prévôt, A. S. H., Gros, V., and Albinet, A.: Evidence of major secondary organic aerosol contribution to lensing effect black carbon absorption enhancement, npj Climate and Atmospheric Science, 1, 47, https://doi.org/10.1038/s41612-018-0056-2, 2018b.
Zhao, D., Liu, D., Yu, C., Tian, P., Hu, D., Zhou, W., Ding, S., Hu, K., Sun, Z., Huang, M., Huang, Y., Yang, Y., Wang, F., Sheng, J., Liu, Q., Kong, S., Li, X., He, H., and Ding, D.: Vertical evolution of black carbon characteristics and heating rate during a haze event in Beijing winter, Sci. Total Environ., 709, 136251, https://doi.org/10.1016/j.scitotenv.2019.136251, 2020.
Zhao, G., Shen, C., and Zhao, C.: Technical note: Mismeasurement of the core-shell structure of black carbon-containing ambient aerosols by SP2 measurements, Atmos. Environ., 243, 117885, https://doi.org/10.1016/j.atmosenv.2020.117885, 2020.
Zhao, X., Sun, Y., Zhao, C., and Jiang, H.: Impact of Precipitation with Different Intensity on PM2.5 over Typical Regions of China, Atmosphere, 11, 906, https://doi.org/10.3390/atmos11090906, 2020.