the Creative Commons Attribution 4.0 License.
the Creative Commons Attribution 4.0 License.
 | 02 Dec 2021
Cloud droplet formation at the base of tropical convective clouds: closure between modeling and measurement results of ACRIDICON–CHUVA
Ramon Campos Braga
Daniel Rosenfeld
Meinrat O. Andreae
Jan-David Förster
Daniel Fütterer
Lianet Hernández Pardo
Bruna A. Holanda
Tina Jurkat-Witschas
Ovid O. Krüger
Oliver Lauer
Luiz A. T. Machado
Christopher Pöhlker
Daniel Sauer
Christiane Voigt
Adrian Walser
Manfred Wendisch
Ulrich Pöschl
Mira L. Pöhlker
Aerosol–cloud interactions contribute to the large uncertainties in current estimates of climate forcing. We investigated the effect of aerosol particles on cloud droplet formation by model calculations and aircraft measurements over the Amazon and over the western tropical Atlantic during the ACRIDICON–CHUVA campaign in September 2014. On the HALO (High Altitude Long Range Research) research aircraft, cloud droplet number concentrations (Nd) were measured near the base of clean and polluted growing convective cumuli using a cloud combination probe (CCP) and a cloud and aerosol spectrometer (CAS-DPOL). An adiabatic parcel model was used to perform cloud droplet number closure studies for flights in differently polluted air masses. Model input parameters included aerosol size distributions measured with an ultra-high sensitive aerosol spectrometer (UHSAS), in combination with a condensation particle counter (CPC). Updraft velocities (w) were measured with a boom-mounted Rosemount probe. Over the continent, the aerosol size distributions were dominated by accumulation mode particles, and good agreement between measured and modeled Nd values was obtained (deviations ≲ 10 %) assuming an average hygroscopicity of κ∼0.1, which is consistent with Amazonian biomass burning and secondary organic aerosol. Above the ocean, fair agreement was obtained assuming an average hygroscopicity of κ∼0.2 (deviations ≲ 16 %) and further improvement was achieved assuming different hygroscopicities for Aitken and accumulation mode particles (κAit=0.8, κacc=0.2; deviations ≲ 10 %), which may reflect secondary marine sulfate particles. Our results indicate that Aitken mode particles and their hygroscopicity can be important for droplet formation at low pollution levels and high updraft velocities in tropical convective clouds.
- Article
(1271 KB) - Full-text XML
-
Supplement
(8277 KB) - BibTeX
- EndNote


Aerosol–cloud interactions represent one of the largest uncertainties in our current understanding of the Earth's climate system, according to the latest report by the Intergovernmental Panel on Climate Change (IPCC, 2021). Aerosols have a strong effect on cloud properties since cloud droplets form on cloud condensation nuclei (CCN) by condensation of water vapor. The uptake of water vapor by aerosol particles and the subsequent activation and growth of cloud droplets is described by the Köhler theory (Köhler, 1936), relates the water vapor saturation ratio (s) to the water activity in the aqueous solution (aw, Raoult term), which is the size and composition dependencies of the droplet's solute effect as well as the increase in equilibrium water vapor pressure due to droplet's surface curvature (Kelvin term). The Raoult effect (solute term) is commonly parameterized using the hygroscopicity parameter κ with values ranging from ∼0.1 to ∼0.9 for single components of atmospheric aerosol particles (Petters and Kreidenweis, 2007). The κ values of ambient aerosol particles are in the range of for the complex mixtures of organic aerosols and for biomass burning aerosol (e.g., Andreae and Rosenfeld, 2008; Carrico et al., 2010; Engelhart et al., 2012).
Many CCN closure studies in various parts of the world have been performed to improve our understanding of the relationship between aerosol properties and their ability to form cloud droplets (e.g., Rissler et al., 2004; Broekhuizen et al., 2006; Wang et al., 2008; Ervens et al., 2010). Such closure studies compare the predicted CCN number concentration (NCCN) according to Köhler theory based on particle size and composition (hygroscopicity) to results from CCN measurements, i.e., for equilibrium conditions at different supersaturations in CCN counters. Much fewer studies compare predicted (Nd,p) and measured cloud droplet number concentrations (Nd,m) (“cloud droplet number closure”), since often direct measurements or estimates of the updraft velocities (w) near cloud base are not available. Nd,p at cloud bases is commonly calculated in adiabatic cloud models based on the hygroscopic growth of CCN particles with a prescribed κ and w. These models simulate the expansion and cooling of air, the resulting changes in relative humidity, and the condensational growth of cloud droplets (Reutter et al., 2009; Ervens et al., 2010; Leaitch et al., 2010). Updraft velocity is often used as a fitting parameter to match Nd,m (e.g., Anttila et al., 2012). Other studies used w distributions to predict a range of Nd,p (Chuang et al., 2000; Peng et al., 2005; Meskhidze et al., 2005; Hsieh et al., 2009). Previous cloud droplet number closure studies suggested that w is one of the most poorly constrained parameters leading to large uncertainties in the predictions of Nd,p (e.g., Conant et al., 2004; Fountoukis et al., 2007).
The Amazon Basin is a unique region to test our understanding of aerosol–cloud interactions in shallow and deep convective clouds due to large variability in aerosol concentration during the dry and wet seasons (e.g., Artaxo, 2002; Andreae et al., 2004; Pöhlker et al., 2016, 2018). The properties and dynamics of clouds over this pristine rain forest region can be fundamentally changed by anthropogenic emissions (e.g., Roberts et al., 2003; Rosenfeld et al., 2008; Reutter et al., 2009; Pöhlker et al., 2018). To explore aerosol–cloud interactions, cloud microstructure, and precipitation-forming processes above the Amazon rain forest, the ACRIDICON–CHUVA (Aerosol, Cloud, Precipitation, and Radiation Interactions and Dynamics of Convective Cloud Systems – Cloud processes of tHe main precipitation systems in Brazil: A contribUtion to cloud resolVing modeling and to the GlobAl Precipitation Measurements) campaign with the HALO (High Altitude Long Range Research) aircraft took place during the dry season in September 2014 (Wendisch et al., 2016).
The focus of this study is to describe a closure analysis based on the Nd,m at cloud bases of convective clouds and Nd,p calculated from an adiabatic parcel model (Feingold and Heymsfield, 1992; Ervens et al., 2005) that is based on other independently measured properties. To this end, measurements of droplet concentrations at cloud bases performed during the ACRIDICON–CHUVA campaign were used. Furthermore, our calculations explicitly simulated the condensational growth of aerosol particles from below cloud base up to a height of several meters above the level at which they grow to cloud droplet sizes. We compared Nd,m at cloud bases of convective clouds in different air masses with Nd,p, using in situ measurements of aerosol size distributions as model input.
The closure analysis was performed separately for two cloud probes (cloud droplet number concentrations and size distributions were measured by a cloud combination probe–cloud droplet probe, CCP-CDP, and cloud and aerosol spectrometer with depolarization, CAS-DPOL) mounted onboard HALO (Wendisch et al., 2016; Voigt et al., 2017). This was performed to verify our methodology using two types of instruments to measure number concentrations of droplets with different particle inlet characteristics and uncertainties. Our study was performed to explore the sensitivities of effective particle hygroscopicity (κ), aerosol particle number concentration (Na), and w to Nd. The results reveal the sensitivity of Nd to κ, Na, and w for measurements over the Amazon Basin during the dry season and over the Atlantic Ocean.
The measurements were performed aboard the High Altitude LOng Range aircraft (HALO), a modified business jet G550 (manufactured by Gulfstream, Savannah, USA). In situ meteorological and avionics data, such as the vertical velocity, were obtained at 1 Hz from the BAsic HALO Measurement And Sensor System (BAHAMAS). A boom-mounted Rosemount model 858 AJ air velocity probe was used to measure the updraft velocity with BAHAMAS, measuring in a range of . The uncertainties in measured w are Δw<0.2 m s−1 for w<5 m s−1 and Δw≈0.25 m s−1 for w>5 m s−1. Further details on the uncertainties of w measurements are described by Mallaun et al. (2015). The measurements took place over the Amazon Basin and over the western tropical Atlantic in September 2014 during the ACRIDICON–CHUVA campaign (Wendisch et al., 2016).
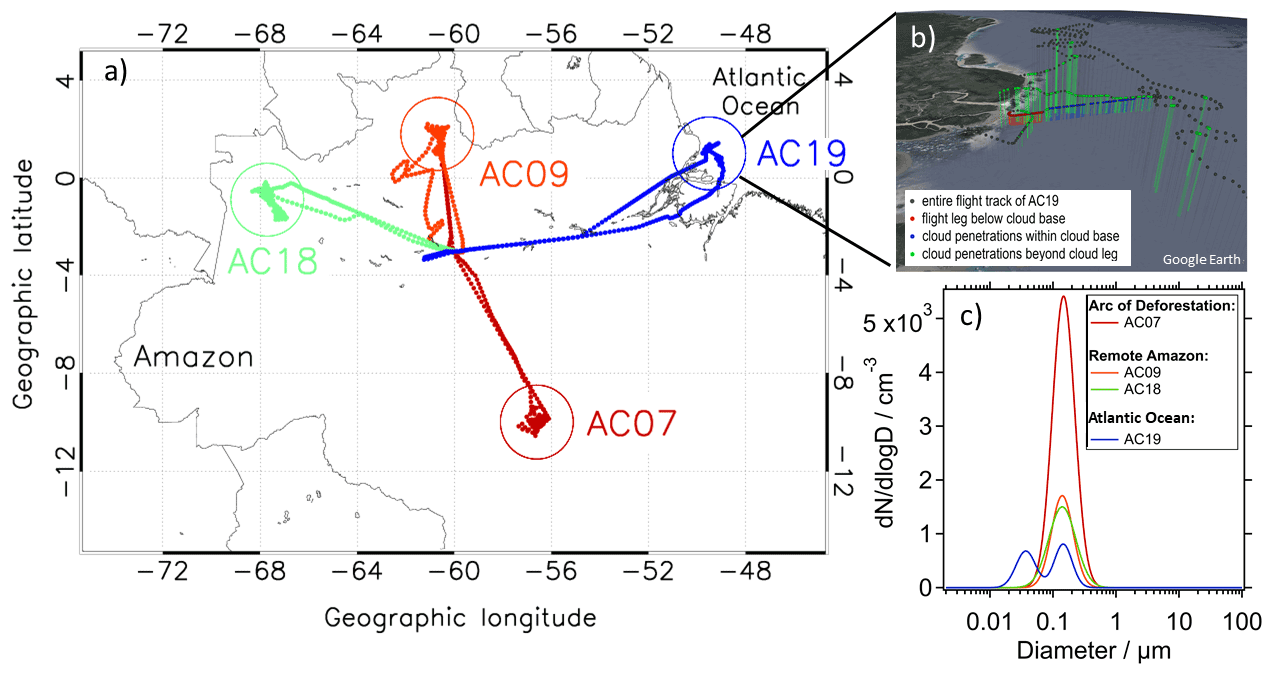
Figure 1(a) HALO flight tracks during the ACRIDICON–CHUVA experiment, color-coded for the different flights. Circles indicate the region of aerosol and cloud measurements. The average aerosol particle concentration measured below cloud bases during flights AC07, AC09, AC18, and AC19 was 2417, 737, 809, and 428 cm−3, respectively. (b) Cloud profiling maneuvers during flight AC19 above the Atlantic Ocean near the Amazon River delta shown as three-dimensional profiles corresponding to the two-dimensional profile in panel (a). Relevant flight segments – particularly legs below cloud base and within cloud base as well as cloud penetrations above cloud base – are emphasized by color-coding. (c) Aerosol size distributions for each flight as used in this study.
Figure 1a shows the measurement region for the flights analyzed in this study (the flights are labeled with “AC” and a running number, in agreement with the naming in, e.g., Wendisch et al., 2016). The region of cloud base measurements is indicated by circles for each flight. The measurement strategy was developed such that measurements were made within at most 10 min and 60 km from each other. This was performed to assure that droplet measurements at cloud base pertain to the same air mass as the aerosol measurements below cloud base. A conceptual representation of the cloud profiling, including flight legs below and within cloud base, is shown for measurements during flight AC19 in Fig. 1b. For the present study, the flight legs below and at cloud base are of primary relevance. Such flight legs, during which the relevant aerosol and cloud microphysical data were obtained, are distinguished by different colors. During flight AC19 the profiling of the marine shallow cumulus clouds was conducted up to an altitude of 4.3 km; details on the air mass origin and the aerosol properties during this flight can be found in Sect. 2.1. Aerosol properties were investigated during the flight leg below cloud base, which had a length of about 19 km at an altitude of ∼450 (above sea level). Cloud microphysical properties of the marine shallow cumulus clouds (Atlantic Ocean) were investigated during the flight leg near cloud base, which had a length of ∼60 km at an altitude at ∼600 A similar strategy was applied for in-land flights. Convective cumuli formed in very polluted environments (arc of deforestation) directly above the Amazonian deforestation arc during flight AC07. Less polluted clouds were found farther away from the deforestation fires over the tropical rain forest (remote Amazon) during flights AC09 and AC18.
2.1 Aerosol size distribution below cloud base
Aerosol size distributions were measured using an ultra-high-sensitivity aerosol spectrometer (UHSAS; Droplet Measurement Technologies, Inc., Longmont, CO, USA) (Cai et al., 2008; Moore et al., 2021). The UHSAS combines a high-power infrared laser (λ=1054 nm) and a large solid-angle range in a sideways direction for the detection of light scattered by individual particles (Andreae et al., 2018). The aircraft instrument measures particles in the diameter size range between 92 and 600 nm. The instrument is mounted in an under-wing canister. The sampled air enters the instrument by a forward-facing diffusor inlet, and the airflow is reduced by a second inlet to approximately isokinetic conditions. The measured particle diameters can be assumed to be close to their dry diameters due to heating effects (Chubb et al., 2016). The UHSAS was calibrated with monodisperse polystyrene latex (PSL) spheres of known size. Typical uncertainties of UHSAS measurements are both 15 % in diameter and concentration (Cai et al., 2008; Moore et al., 2021).
The total particle number concentration in the size range of ∼10 to ∼500 nm (NCN) below cloud base was measured using the Aerosol Measurement System (AMETYST); the uncertainty of these measurements is estimated to be 10 % (Andreae et al., 2018). NCN was measured by a butanol-based condensation particle counter (CPC, modified Grimm CPC 5.410 by Grimm Aerosol Technik, Ainring, Germany) with a flow of 0.6 L min−1. Particle losses in the sampling lines have been estimated and taken into account with the particle loss calculator by von der Weiden et al. (2009). Typical uncertainties of CPC measurements are on the order of ∼10 % (Petzold et al., 2011; Andreae et al., 2018).
The geometric mean of the aerosol size distribution and NCN below cloud were calculated. The mean aerosol size distribution was fitted by one-modal lognormal distributions. The integral of the fit for the aerosol size distribution should be similar to NCN if mainly accumulation mode particles are present. This was fulfilled for AC07, AC09, and AC18 but not for AC19 (Tables S1–S4 in the Supplement). For this latter flight, the integrated number concentration of the monomodal lognormal fit made up approximately half of the total NCN. This discrepancy led to the assumption that a significant number concentration of particles in the size range of Aitken mode particles was present during AC19 but not captured by the UHSAS measurements. Consequently, the shape of a bimodal aerosol size distribution (ASD) was inferred. The geometric parameters for the lognormal distribution assumed for measurements during AC19 were based on averages of bimodal aerosol size distributions measured above the ocean in previous studies (Fig. S4 in the Supplement) (Wex et al., 2016; Quinn et al., 2017; Gong et al., 2019). Other shapes of marine aerosol size distributions, e.g., as reported by Leaitch et al. (2010), were not considered for our lognormal fit because they were not in agreement with the measured UHSAS data. The resulting shape of the two modes based on literature data was weighted by the difference between UHSAS and CPC measurements (Table S4). The number concentrations of all fitted aerosol size distributions were normalized to the measured NCN. The variability of the aerosol number size distributions was calculated by the standard deviation: on average ∼10 % and up to ∼20 % for very clean conditions. As a conservative approach ∼20 % was used in our model sensitivity study to take into account the impact of this variability on cloud droplet number concentration (Sect. 4.2). All concentrations are reported for normalized atmospheric conditions (corrected for standard conditions: T=273.15 ∘C and p=1013.25 mbar).
2.2 Cloud droplet measurements at cloud base
Cloud droplet number concentrations and size distributions were measured by a cloud combination probe–cloud droplet probe (CCP-CDP) and by a cloud and aerosol spectrometer with depolarization (CAS-DPOL) mounted onboard HALO (Wendisch et al., 2016; Voigt et al., 2017). Cloud droplet number size distributions (DSDs) between 3 and 50 µm in diameter were measured at a temporal resolution of 1 s by the CAS-DPOL and CCP–CDP probes (Baumgardner et al., 2011; Voigt et al., 2010, 2011; Kleine et al., 2018; Wendisch and Brenguier, 2013). These probes have different measurement characteristics, such as particle inlet, sampling area of detection, and size sensitivities. The CCP-CDP is an open-path instrument that detects forward-scattered laser light from cloud particles as they pass through the CDP detection area (Lance et al., 2010). CAS-DPOL collects forward-scattered light to determine particle size and number that pass the sampling area centered in an inlet shaft that guides the airflow. CCP-CDP and CAS-DPOL have similar values of uncertainty (∼10 %) in the sample area. However, particle velocities in the sampling tube may be modified by the CAS tube when compared to the open-path instruments (like CCP-CDP). This results in an additional uncertainty in the droplet number concentration measured by CAS-DPOL. During the ACRIDICON–CHUVA campaign the resulting uncertainty in the droplet concentration measured by CCP-CDP and CAS-DPOL was ∼10 % and ∼ 21 %, respectively (Braga et al., 2017a).
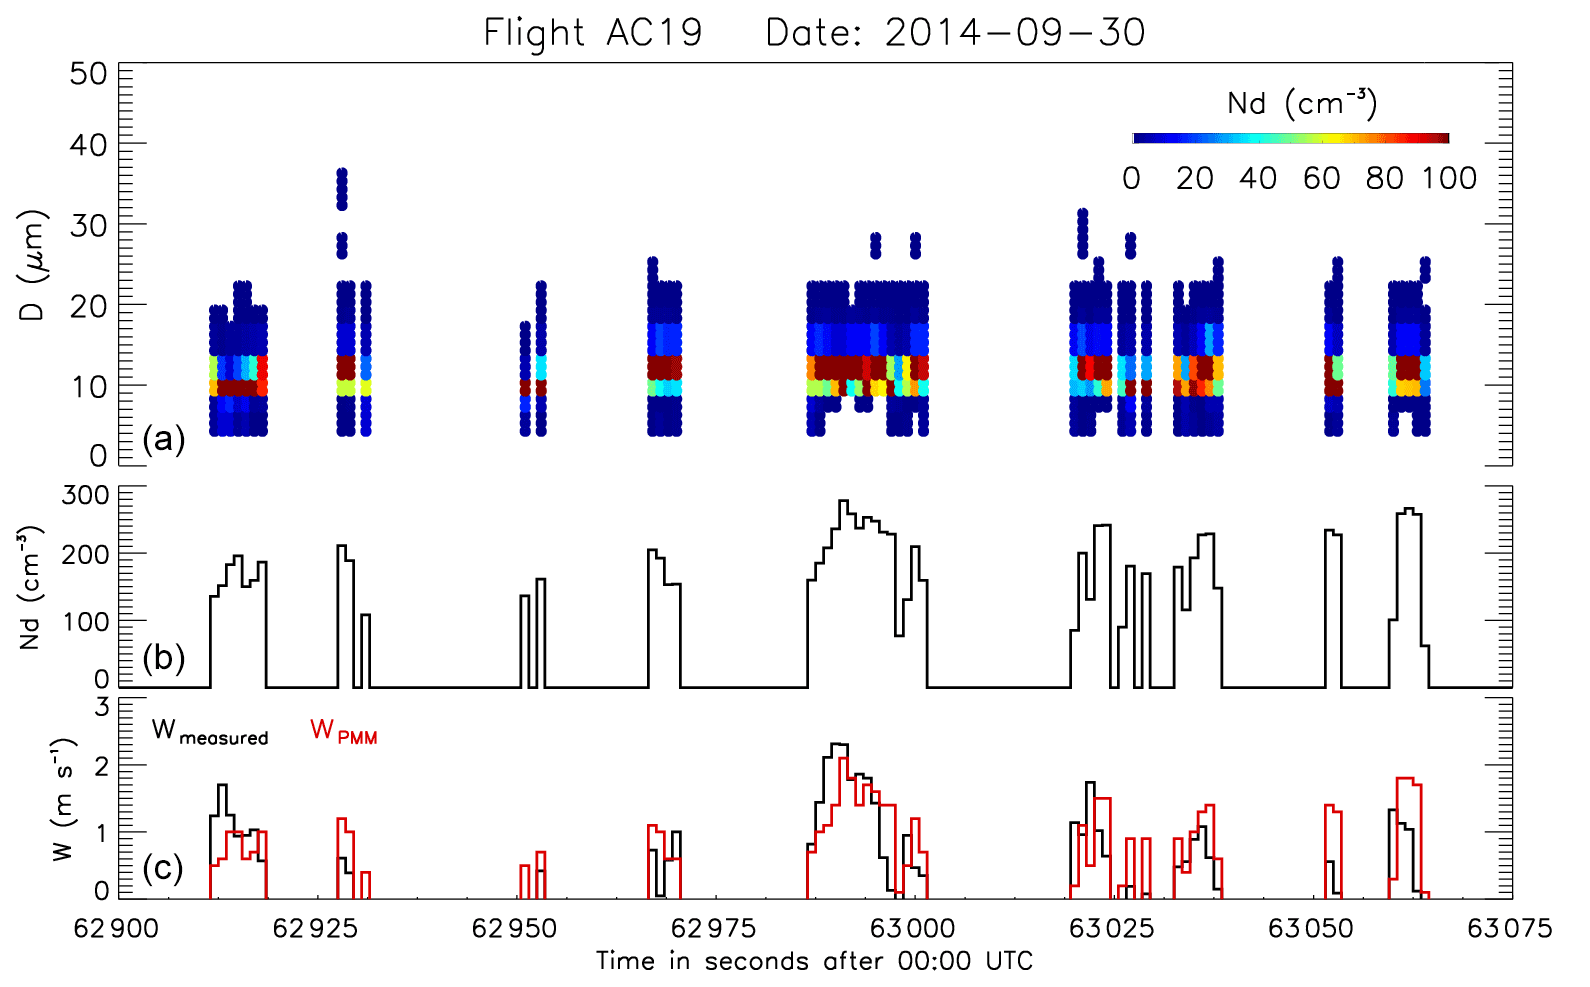
Figure 2Time series of (a) droplet size distribution measured by CCP-CDP, (b) number concentration of droplets (Nd), (c) measured vertical velocities w, and estimated w based on the PMM. The measurements were performed during flight AC19 above the Atlantic Ocean.
For cloud base measurements, each probe DSD spectrum represented 1 s of flight path (covering between 70 to 120 m of horizontal distance for the aircraft speed at cloud bases). We refer in the current study to the measurements closest to cloud base as “cloud base” measurements, even if the actual cloud base might have been slightly below this altitude of measurements (Sect. 3.2.2 and Fig. 2). The cloud base measurements were selected based on the videos recorded by the HALO cockpit forward-looking camera. From the DSDs, the droplet number concentrations were derived by size integration. Braga et al. (2017a) showed that both probes were in agreement within their uncertainty range for probe DSDs (). The overall systematic errors in the cloud probe integrated water content with respect to a King type hot-wire device are ∼6 % for CAS-DPOL and ∼21 % for CCP-CDP. A positive bias of ∼20 % was found for CAS-DPOL droplet concentration in comparison with those measured with CCP-CDP for cloud passes with cloud droplet effective radius <7 µm (mostly measured at cloud bases). Cloud passes were defined for conditions under which the number droplet concentration (i.e., particles with a diameter larger than 3 µm) exceeded 20 cm−3. This criterion was applied to avoid cloud passes well mixed with subsaturated environment air (RH<100 %) and counts of haze particles, typically found at cloud edges. Additional details about the cloud probe measurements at cloud bases used in this study can be found in Tables S5–S6 in the Supplement.
3.1 Probability matching method (PMM): pairing measured updraft velocities (w) and droplet number concentrations (Nd,m)
The thermal instability in the boundary layer promotes the formation of clouds consisting of regions with updrafts and downdrafts. At cloud bases, the variability in vertical velocities and droplet concentration is high due to air turbulence. Clouds develop in updrafts, and during their vertical development the continued movement as a turbulent eddy adds a large random component to the relationship of w with Nd,m. These intrinsic characteristics of clouds reduce the confidence that a measured w in the cloud led to the simultaneously measured Nd,m. Such inconsistencies often result in poor correlations of w and Nd,m. As w is highly variable in clouds and is measured independently from Nd,m, we apply the “probability matching method” (PMM, Haddad and Rosenfeld, 1997) to statistically determine the most probable combinations of Nd,m and w values using the same percentiles of their occurrence. The PMM analysis is based on the assumption that these two related variables increase monotonically with each other. This assumption implies that entrainment – which may lead to a reversal of the assumed trend – can be neglected near cloud base, which is likely a valid assumption under these conditions. Measured Nd,m and w values were sorted in ascending order and the most likely w value was assigned to Nd,m for each of the four flights. To avoid biases caused by outlier measurements, Nd,m above the 97.5th and below the 2.5th percentile were removed. Only cloud passes with positive vertical velocities (i.e., updrafts) were considered in the analysis. Furthermore, we take into account only data of non-precipitating clouds, typically from cumulus humilis and cumulus mediocris clouds. Braga et al. (2017a) have shown that the PMM can be used to find the best agreement between measured and estimated Nd at cloud base as a function of w. In the current study, PMM analysis is used to compare the Nd,m at cloud base and its assigned w with Nd,p at a constant w in the model. Figure 2 shows an example of measured w at cloud bases and estimated w based on the PMM analysis (wPMM). The figure shows that wPMM are in good agreement with measurements at cloud bases. Furthermore, for cloud passes in which the values of w are negative, realistic w are estimated based on PMM.
3.2 Adiabatic cloud parcel model
3.2.1 Model description and simulations
The adiabatic parcel model describes the growth of aerosol particles by water vapor uptake on a moving mass grid (Feingold and Heymsfield, 1992; Ervens et al., 2005). The air parcel is described to rise with a constant w below and inside of the cloud. Saturation with respect to water vapor in the air parcel is calculated based on the standard thermodynamic equations for adiabatic conditions as a function of w and particle properties (Na, particle sizes and hygroscopicity) (Pruppacher and Klett, 1997). It is assumed that the aerosol particles are internally mixed with identical hygroscopicity (κ) of all particles. This assumption was made based on previous sensitivity studies that have shown that for marine and aged continental air masses, internal mixtures are suitable approximations (Ervens et al., 2010). We note that κ is regarded here as an effective parameter, encompassing all factors that affect water uptake. Simulations are performed up to a height of 70 m above the level of predicted maximum supersaturation. The initial conditions for the model simulations are summarized in Tables S1–S4. Particles that exceed a diameter of 3 µm are defined as droplets; this definition allows a direct comparison of Nd,p and Nd,m. Collision–coalescence processes are not considered as we restrict our analysis to heights near cloud base where droplets are relatively small and the cloud droplet size distribution is narrow. Under such conditions, collision–coalescence is likely negligible (Shaw et al., 1998; Xue et al., 2008; Rosenfeld, 2018; Braga et al., 2017b). Sensitivity studies are performed for the observed ranges of w and Na±40 % and the assumed range of to identify parameter ranges and combinations for which droplet closure can be achieved.
3.2.2 Determination of in-cloud height to compare Nd,m and Nd,p
The cloud base measurements were performed at an approximately constant altitude during each research flight and were selected based on the videos recorded by the HALO cockpit forward-looking camera. However, these measurements might represent different levels in relation to the level of maximum supersaturation at cloud bases, which depends on the updraft velocity and turbulence in cloud. In order to determine the height at which Nd,m and Nd,p should be compared, the measured liquid water content (LWC) was compared to the simulated LWC using the aerosol size distribution for the different flights together with w measured at cloud base and an assumed hygroscopicity of κ=0.1.
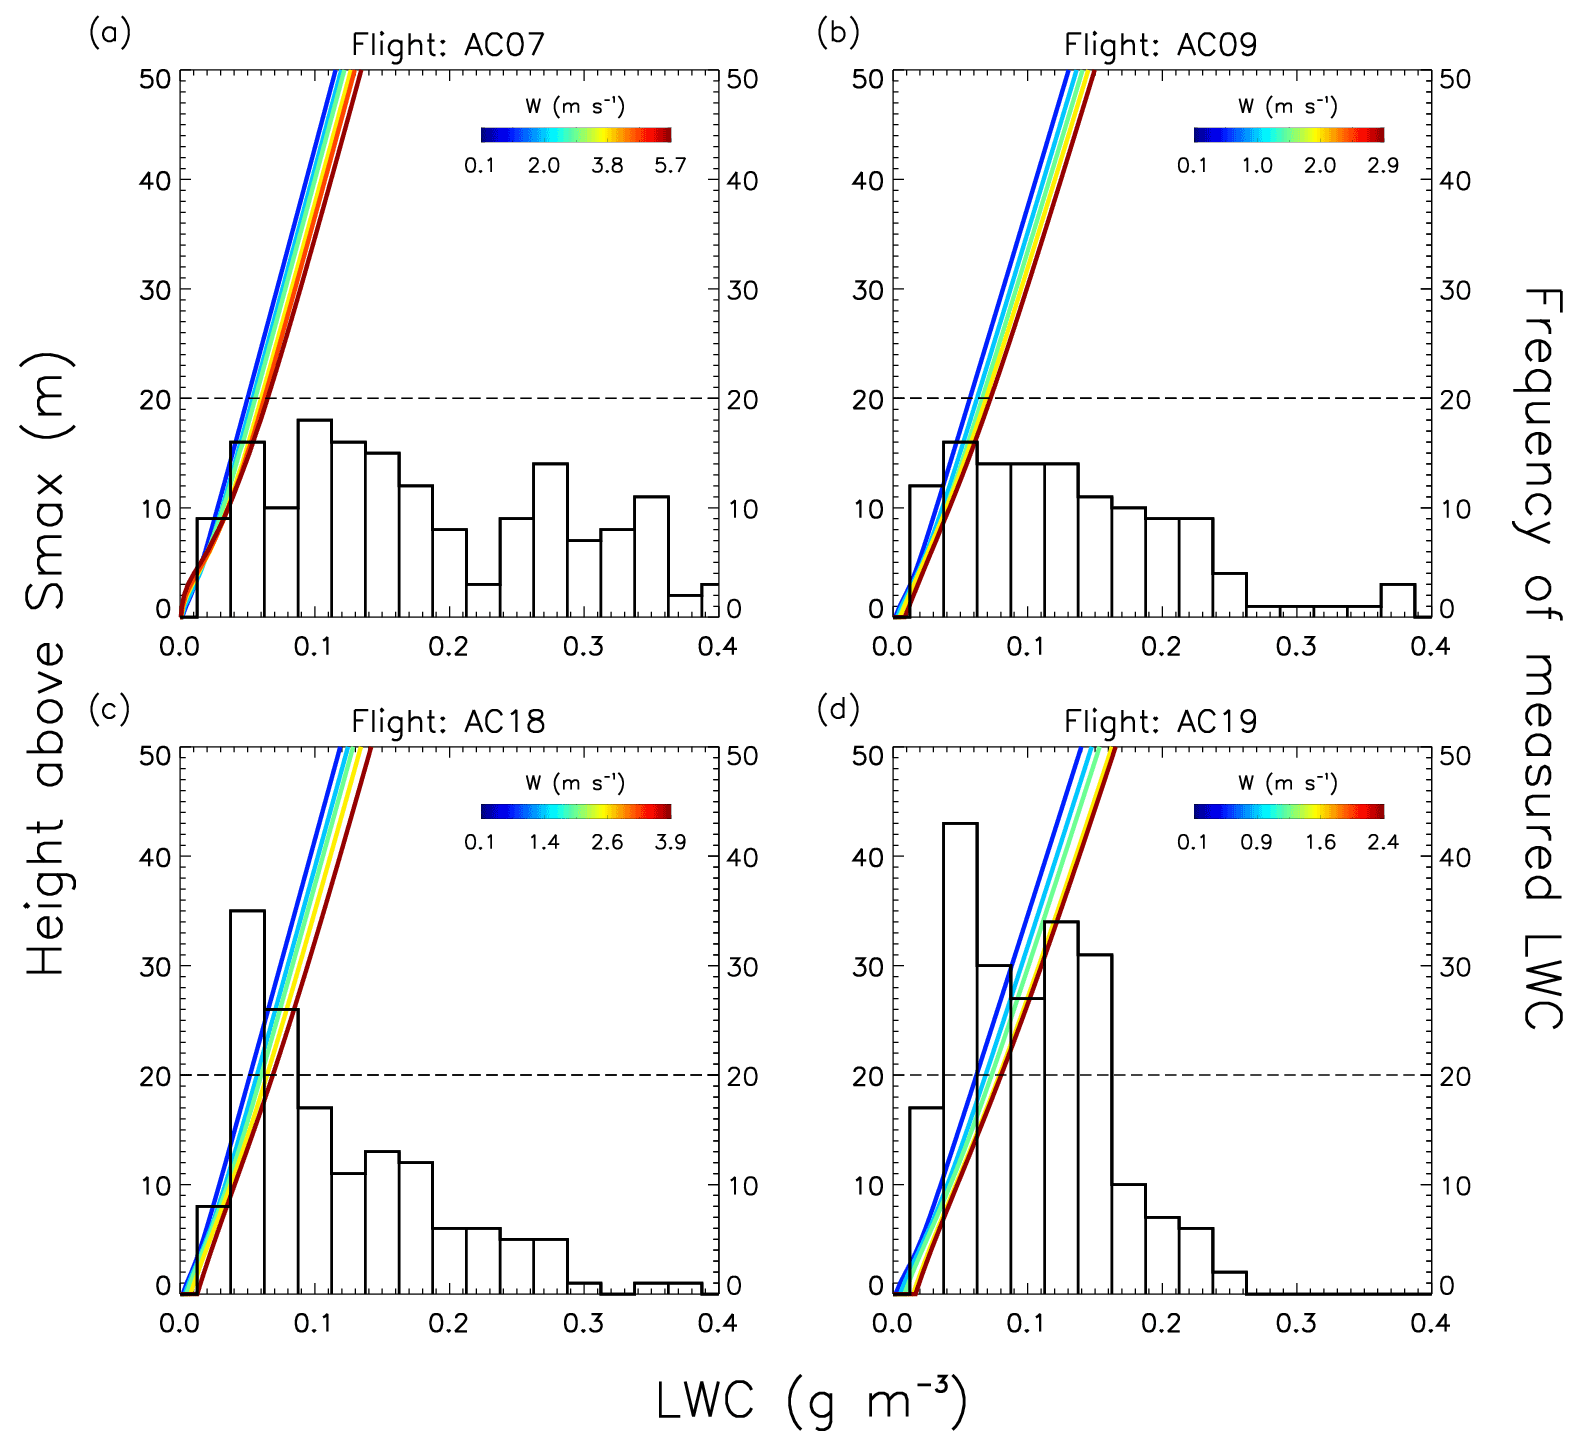
Figure 3Predicted LWC [g m−3] as a function of height above the level of Smax (left axis) and w (lines, color-coded by w [m s−1]) for flights (a) AC07, (b) AC09, (c) AC18, and (d) AC19. The vertical bars indicate the number of cloud passes (with a temporal resolution of 1 s) as a function of the measured LWC by CAS-DPOL and CCP-CDP in cloud (right axis). The dashed line denotes the level of 20 m above predicted maximum supersaturation, at which Nd,p is predicted (Sect. 3.2.2).
Under adiabatic conditions, Nd,p is predicted to be approximately constant at ∼20 m above the level of the maximum supersaturation Smax (Fig. S5 in the Supplement). Figure 3 shows the values of predicted LWC based on the simulations as a function of height above Smax for the four flights. Overlaid on the model results (colored lines) are the frequencies of measured LWC by the cloud probes near cloud base (white bars). The measured LWC represents the cumulative mass size distribution. For all flights, the model predictions in most of cases match the minimum LWC measured at ∼20 m above the Smax level. This height level might represent slightly different absolute heights above the surface and the level of saturation estimated by the model (RH=100 %) (Fig. S6 in the Supplement). However, since we focus our discussion in the following section on the comparison of Nd,m and Nd,p, we perform our analysis based on model predictions at a height of 20 m above Smax.
4.1 Constraining aerosol hygroscopicity (κ) based on Nd and w
Figure 4 shows the range of Nd,m as a function of w as determined by the PMM (Sect. 3.1); the symbols indicate Nd,m from CAS-DPOL (black diamonds) and CCP-CDP (black triangles). The lines in Fig. 4a–d represent model predictions for the assumption of κ=0.05, κ=0.1, κ=0.3, and κ=0.6 for up to 38 w values for each flight, covering the measured w range. Figure 4e shows results of additional simulations for Flight AC19 (marine conditions) assuming κ=0.6 and κ=0.8 for aerosol particles from Aitken (d<70 nm) and κ=0.1 and κ=0.2 for aerosol particles from accumulation (d≥70 nm) mode sizes. For all flights, Nd,m values are reasonably reproduced by the model assuming a particle hygroscopicity of ; Nd,p is closer to the measured values from CCP-CDP assuming a slightly lower κ, whereas Nd,m from CAS-DPOL indicates a slightly higher κ. However, these deviations are within the uncertainty range of the cloud probe measurements, i.e., ∼10 % and ∼21 % for CCP-CDP and CAS-DPOL, respectively (Braga et al., 2017a).
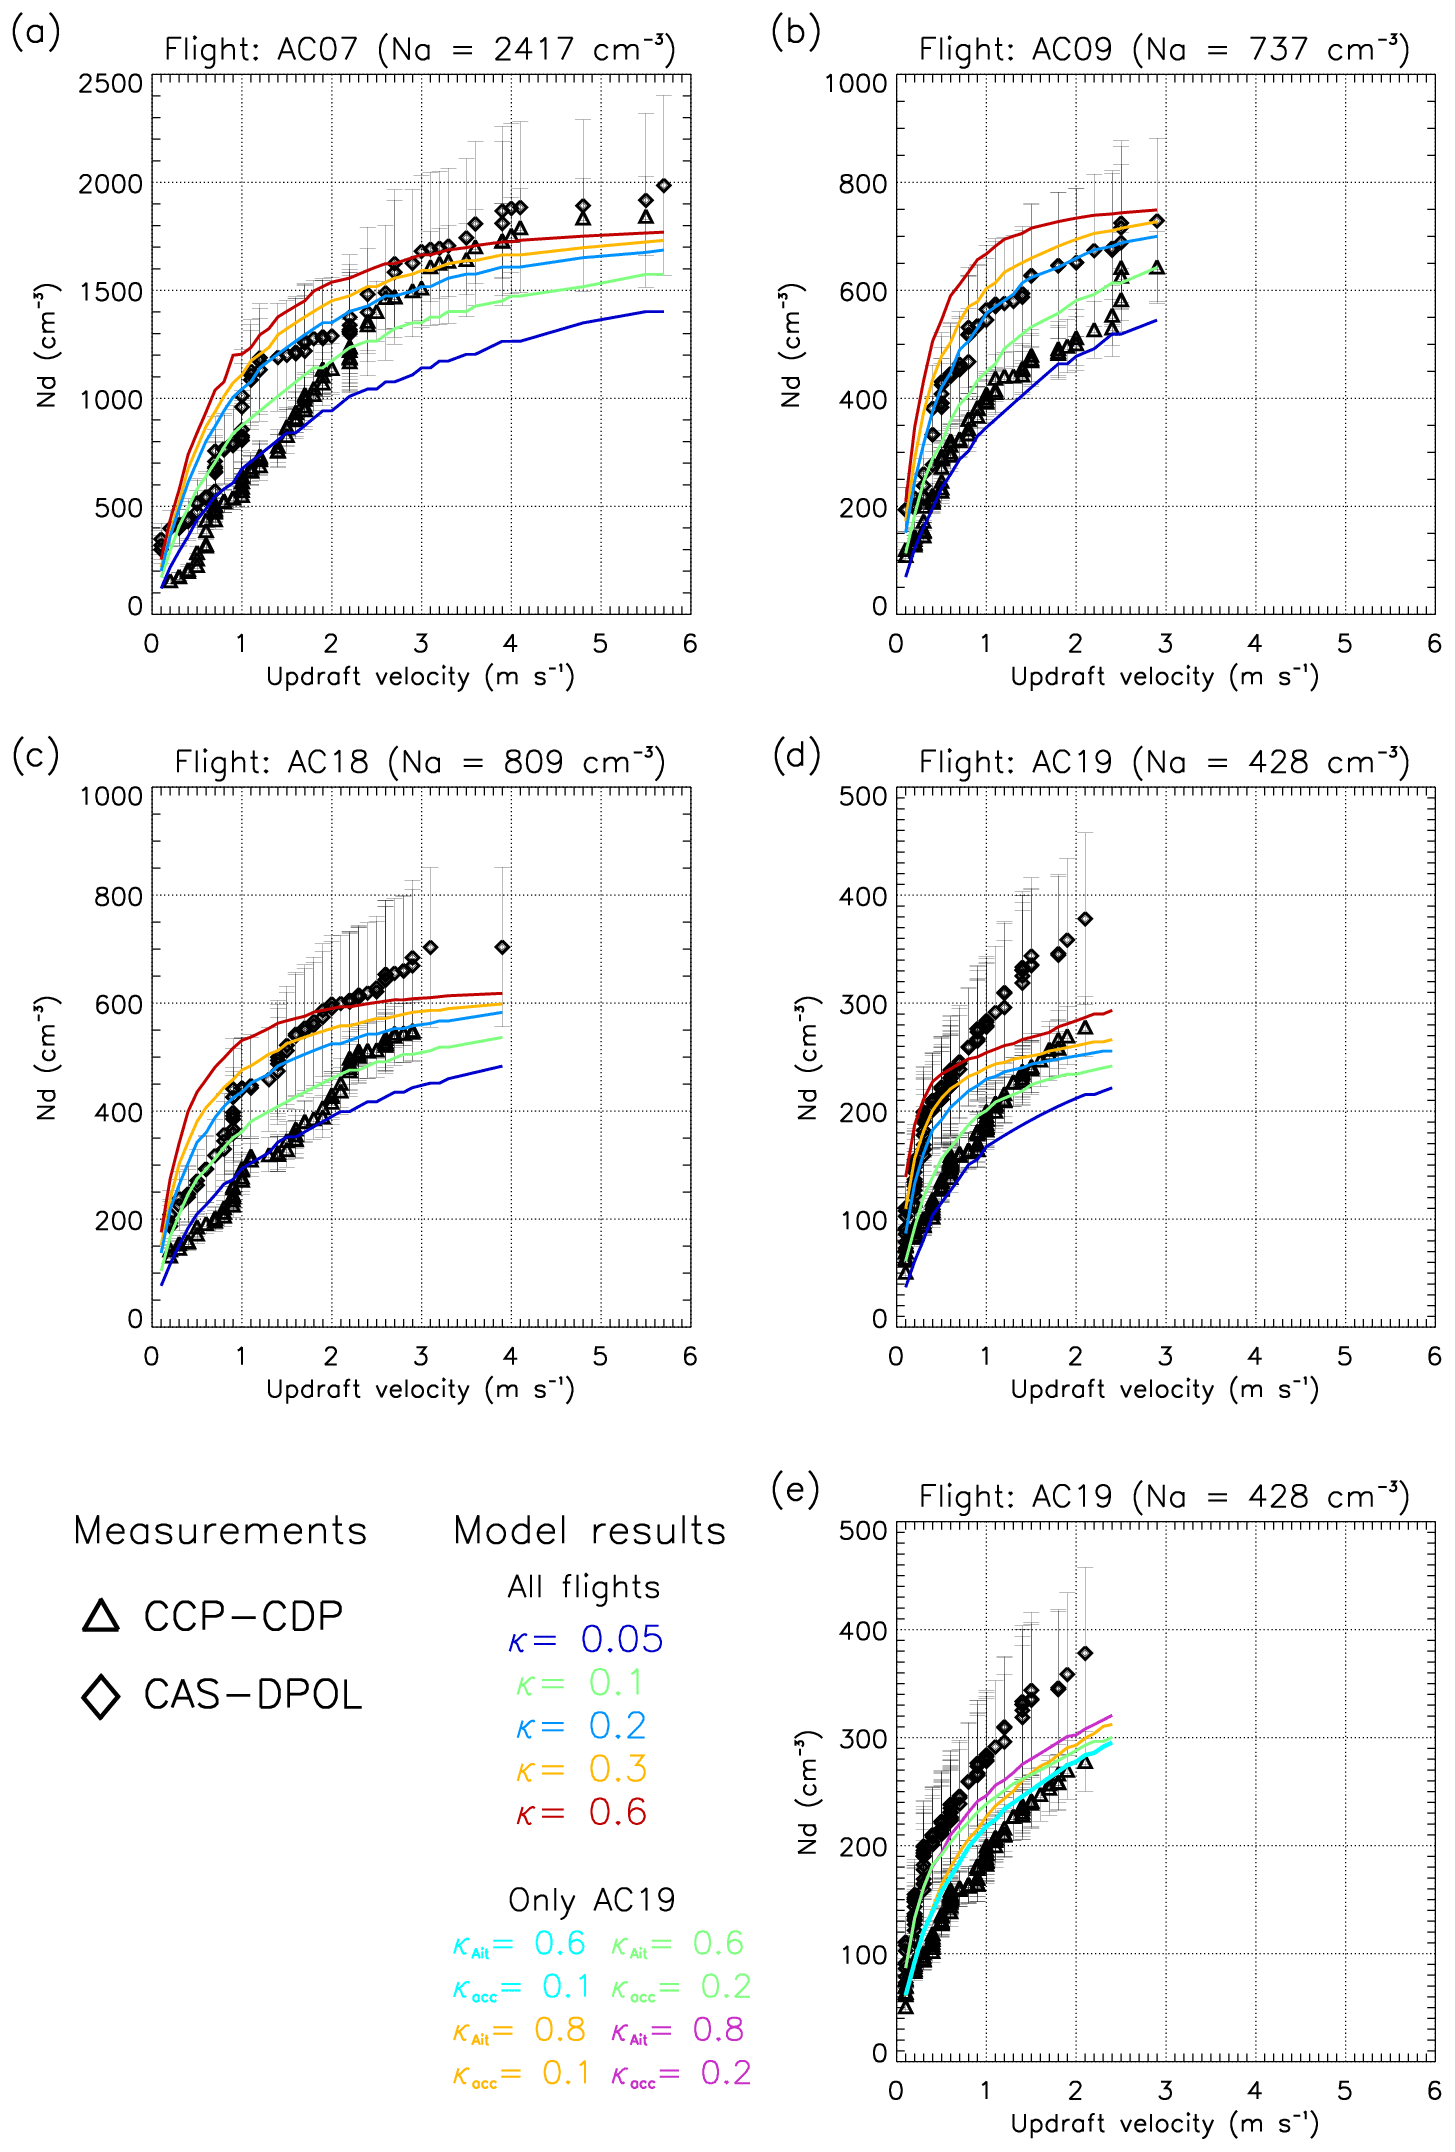
Figure 4Cloud droplet number concentration (Nd) as a function of updraft velocity near cloud base of convective clouds during flights: (a) AC07, (b) AC09, (c) AC18, (d), and (e) AC19. The measured updraft velocities are based on the “probability matching method” (PMM) using the same percentiles for updraft velocity and Nd,m (Sect. 3.1). The black diamonds and triangles represent Nd,m near cloud base from the CAS-DPOL and CCP-CDP probes, respectively. Measurement uncertainties, indicated by error bars, are ∼21 % and ∼10 % for CAS-DPOL and CCP-CDP data (Braga et al., 2017a). The colored lines in panels (a–d) show Nd,p assuming a single κ value for both modes (labeled on the left). Panel (e) shows Nd,p based on simulations assuming different values of κ for Aitken and accumulation mode particles during flight AC19.
Figure 4 shows that the agreement between measured and predicted cloud droplet number concentration is obtained for low w during all flights. However, the value of w, above which the model predictions deviate from measurements varies among the flights: for continental clouds as encountered during AC07, AC18, and AC09, the model results agree well with observations for w ≲ 2.5 m s−1. At higher w, Nd,m shows a much stronger increase with w than predicted by the model. For AC19, i.e., above the ocean, this trend is even obvious for w ≳ 0.5 m s−1. The statistical analysis based on bias, root mean square error (RMSE), and mean absolute error (MAE) from the closure analysis is shown in Tables S7–S18 in the Supplement. This analysis suggests that the use of two probes to perform the closure does not have a large effect on the inferred value of κ. We find best agreement, quantified by the smallest absolute bias and RMSE, for all cases for single κ values of The deviations between Nd,m from CCP-CDP and CAS-DPOL (∼21 % on average) reinforce the advantage of duplicate measurements for the closure analysis. The use of a single cloud probe might lead to a biased κ estimate based on the data set of each cloud probe separately. The consideration of both cloud probes shows the uncertainty in Nd measurements and therefore the uncertainty range of κ and/or Na values for Nd closure. Therefore, we base our conclusions in the following on the statistical analysis of all data from both probes together (Tables S9, S12, S15, and S18).
The results in Fig. 4 imply that the assumption of an internally mixed aerosol population with moderate hygroscopicity (κ∼0.1) is justified to reproduce Nd,m for flights AC07, AC09, and AC18 for wide ranges of updraft speeds ( m s−1). This κ value has been suggested previously for comparable air masses during the dry season in the Amazon Basin (e.g., Pöhlker et al., 2016, 2018). In these prior studies, κ was constrained based on size-resolved CCN measurements and measurements of the aerosol chemical composition, dominated by an aged organic fraction. Our results are in agreement with previous studies. The value range is representative of internally mixed aerosol particle populations during the dry season in the Amazon Basin, which are influenced by fresh and aged biomass burning aerosol from the Amazon and Africa.
While particles of different hygroscopicities and activation thresholds depending on w might also explain the trends in Fig. 4a–c, there is no indication of higher hygroscopicity of smaller accumulation mode aerosol particles during the Amazonian dry season (e.g., Pöhlker et al., 2016, 2018). In air masses of different origin, aerosol particles would likely not only exhibit different chemical composition and hygroscopicity but also large variability in their particle number concentrations. Given the relatively small standard deviations in the measured Na (Tables S1–S4), we are confident that the sampled aerosol populations did not have large variability in their composition. The chemical composition of Aitken mode particles often differs significantly from that of accumulation mode particles, which are more aged and internally mixed (e.g., Wex et al., 2016; Pöhlker et al., 2018), and thus continental Aitken mode particles usually exhibit a lower hygroscopicity than accumulation mode particles (McFiggans et al., 2006).
The air masses below cloud encountered during flight AC19 were mostly impacted by marine air, as supported by prior back trajectory analysis (Sect. S1 in the Supplement and Holanda et al., 2020) and exhibited a bimodal aerosol size distribution with low Nd,m (Fig. 1c). For this flight, the cloud droplet closure is worse as compared to the reasonable agreement for the other three cases. Not only is the absolute difference between Nd,m and Nd,p relatively larger (Fig. 4d) but the trend of Nd,m with w cannot be well reproduced either: while at w<0.5 m s−1, the range of Nd,p agrees well with Nd,m, above this threshold the model strongly underestimates the droplet number concentration even for κ=0.3 (Fig. 4d). Assuming κ=0.6 only slightly increases Nd,p as compared to the results for κ=0.3. This trend shows that Nd,p is rather insensitive to κ if particles are very hygroscopic (κ ≳ 0.3). While all κ values lead to reasonable agreement at low w, none of the model results can reproduce the strongly increased Nd,m with w. Therefore, we conclude that the simplifying assumptions made in the model, i.e., identical hygroscopicities across both aerosol modes, may not be appropriate.
The measured aerosol size distribution during flight AC19 differed significantly from the other ones (Fig. 1c) because of (i) low Na and (ii) a distinct Aitken mode (mean diameter 37 nm) that comprised ∼47 % of the particle number concentration. At such low Na, the maximum supersaturation in the clouds is relatively high so that at sufficiently high w, Aitken mode particles (diameter ≲ 70 nm) may be activated into cloud droplets and contribute to Nd (Pöhlker et al., 2021). Highly hygroscopic Aitken mode particles over the ocean may reflect secondary marine sulfate aerosols (Andreae and Raemdonck, 1983).
To account for different hygroscopicities in Aitken and accumulation modes, we performed further sensitivity analyses using combinations of κ=0.1 and 0.6 for the two modes (Fig. 4e). It is obvious that the choice of κ for the Aitken mode (κAit) does not affect Nd,p for w ≲ 1 m s−1 in the presence of very hygroscopic accumulation mode particles (κacc=0.6) or below w ≲ 0.5 m s−1 with κacc=0.1. Even assuming rather extreme values of κAit=0.8 cannot fully reproduce the large increase in Nd at w ≳ 1.5 m s−1 as observed by the CAS probes; assuming very hygroscopic Aitken mode and less hygroscopic accumulation mode particles can approximately reproduce the trend in Nd,m from the CDP. It should be kept in mind that κ is considered an effective parameter that may also reflect water uptake due to additional processes or effects that are not represented in our model and therefore cannot be further reconciled here.
Varying κacc from 0.1 to 0.6 leads to a large increase in Nd,p at all w. The corresponding change in Nd,p by increasing κAit is much smaller. The reason for this relatively smaller sensitivity of Nd,p to κAit is the fact that the supersaturation in the cloud is mostly controlled by the droplet growth on accumulation mode particles. The sensitivity of Nd,p formed on Aitken mode particles to κacc is slightly larger if κacc=0.1 as compared to κacc=0.6 because in the latter case the supersaturation is efficiently suppressed, preventing a higher number of Aitken mode particles from activating. Overall we can conclude that assuming different κ values for accumulation and Aitken mode leads to a better representation of the observed trends of Nd,m with w (Tables S16 and S17). However, in the absence of more information on the particle hygroscopicity we cannot state with certainty that the assumptions of the two κ values are appropriate for this aerosol population. Figure 4d clearly shows that the simplified assumption of a single κ is not appropriate to infer Nd,p for low aerosol loading and when the particle number concentrations of the accumulation and Aitken modes are comparable. By using a single κ value, we cannot reproduce the observed continuously strong increase in Nd,m for the whole w range. Instead we predict a smaller increase at w∼1 m s−1, i.e., a flattening of the curve.
In general, the observed trends of Nd with w for flights AC07, AC09, and AC18 confirm results from previous sensitivity studies that have shown that with increasing w, changes in Nd become small and, thus, sensitivity of Nd to κ and w decreases (Ervens et al., 2005; Fountoukis et al., 2007; Reutter et al., 2009). In these studies, it was demonstrated that the sensitivity of Nd to Na becomes small when nearly all particles are activated (“aerosol-limited regime”). For these simulations, either only an accumulation mode was considered or Nd closure studies were performed for situations with low w and/or fairly small Aitken mode particles (<40 nm) that were not predicted to activate.
In a model study focusing only on Aitken mode particles, Anttila and Kerminen (2007) showed that Nd is highly sensitive to the chemical composition of Aitken mode particles. In our recent model study, we systematically explored the extent to which the presence of an Aitken mode might significantly affect Nd as a function of updraft velocity (Pöhlker et al., 2021). In that study, we show that the sensitivities of Nd,p are different to the properties (Na, κ) of accumulation and Aitken mode particles, respectively. Generally, we find that Nd,m is not highly sensitive to Aitken mode particle properties in the presence of a dominant accumulation mode, which is in agreement with our results in Figs. 4 and S7 in the Supplement.
4.2 Influence of aerosol number concentration (Na) on predicted Nd
The measurements of Na were associated with uncertainties of % (Sect. 2.1). In order to account for this uncertainty and possible fluctuation in Na at cloud base, Nd,m and Nd,p are compared for all flights, using Na (Fig. 1), reduced and increased by 20 %, 30 %, and 40 % as model input. Figure 5 shows the comparison of measured and predicted Nd assuming the uncertainty range of Na. Figure 4a–d shows the Nd,p with the values of κ that are within the uncertainty range of cloud probe measurements. The green lines show the model results for κ=0.1 for flights AC07, AC09, and AC18 and κ=0.2 for flight AC19, which show the smallest absolute bias and RMSE for the measured data (Tables S9, S12, S15, and S18); the other lines denote Nd,p using the higher and lower input Na. For flights AC07, AC09, and AC18, Nd,p is within the range of Nd,m for the assumed model parameter space. Also, the curves for Nd,p as a function of w exhibit a similar shape as predicted for a variation in κ. The agreement between measurements and model results decreases with increasing w. However, unlike the Nd,p curves for high κ that level off at high w when all particles are activated, an increase in Na leads to continuously higher Nd as the aerosol-limited regime is not yet reached.
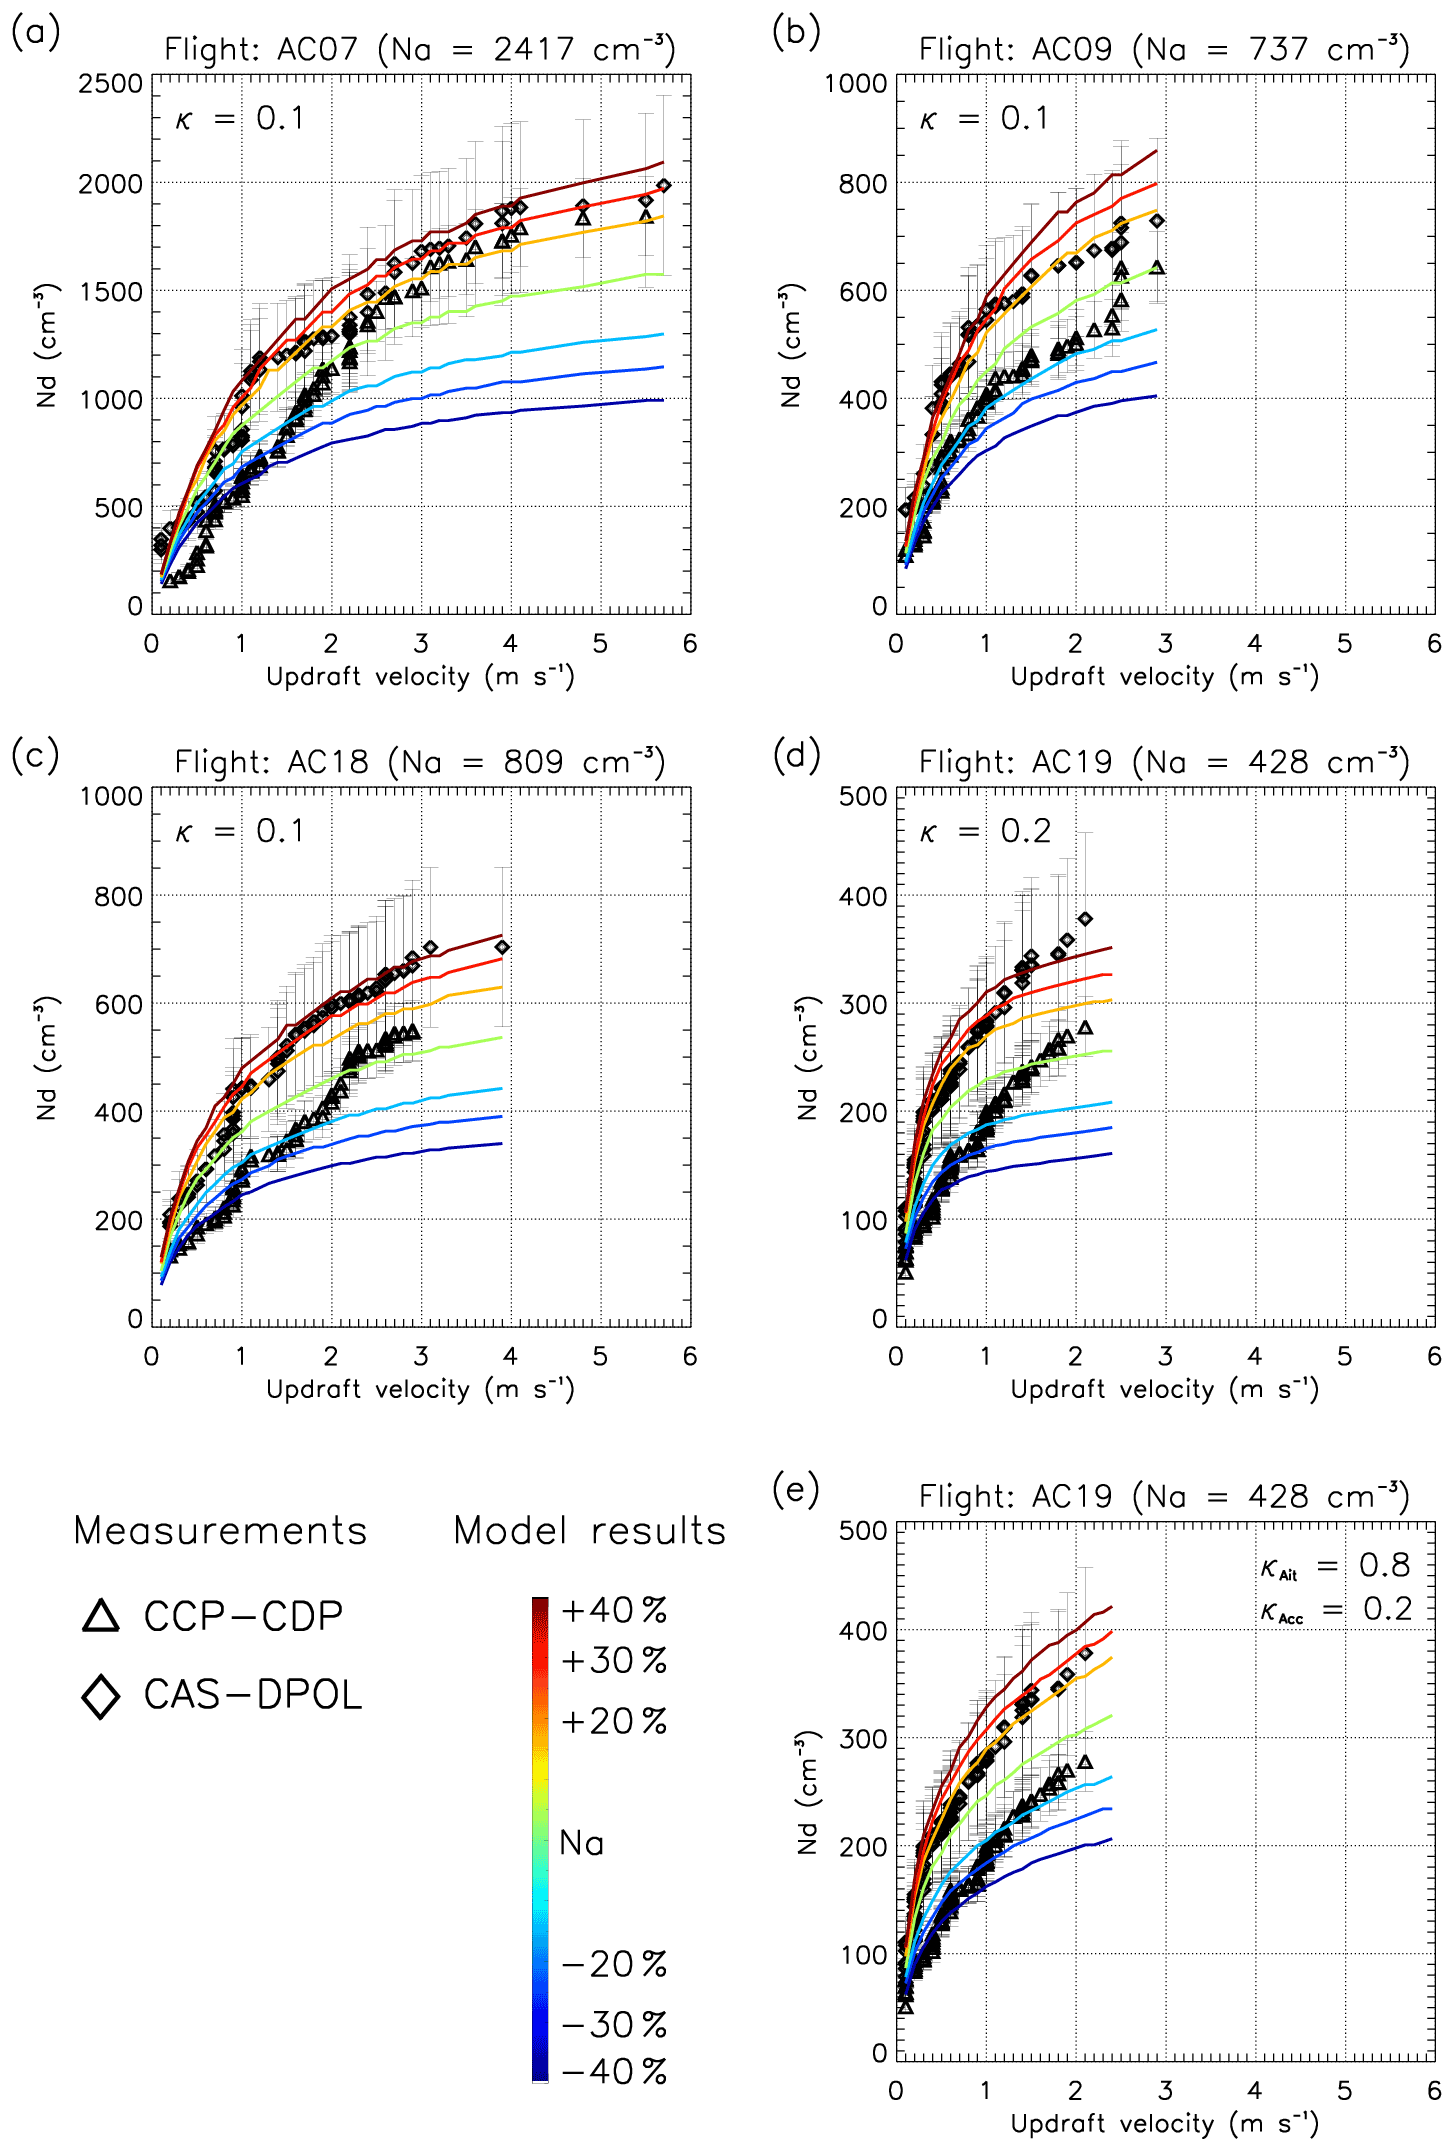
Figure 5Cloud droplet number concentration (Nd) as a function of updraft velocity near cloud base of convective clouds during flights: (a) AC07, (b) AC09, (c) AC18, (d), and (e) AC19. The measured updraft velocities are based on the “probability matching method” (PMM) using the same percentiles for updraft velocity and Nd,m (Sect. 3.1). The black diamond and triangle symbols represent Nd,m near cloud base with the CAS-DPOL and CCP-CDP probes, respectively. Measurement uncertainties (indicated by error bars) are ∼21 % and ∼10 % for CAS-DPOL and CCP-CDP data (Braga et al., 2017a). The lines show Nd,p assuming the uncertainty range of Na measurements, colored-coded by ΔNa [%].
Using different κ values for the two modes leads to a better representation of the Nd trend with w, i.e., the shape of the curve can be fairly reproduced for different combinations of separate values of κacc and κAit. However, Nd is systematically underestimated which suggests that in addition uncertainties in Na are important for Nd closure and likely more important than those in κ. In fact, the closure results in Fig. 5 show that Nd,m can be reproduced well by the model over wide w ranges if the variability in Na of ±20 % and the uncertainty in Nd,m is taken into account, and an average hygroscopicity of κ=0.1 is assumed for the aerosol in the Amazon Basin during the dry season and κ=0.2 for that in the western tropical Atlantic. However, the assumption of two different κ values also leads to good Nd closure for the bimodal ASD as observed during flight AC19 (Fig. 5e). These two different assumptions on the mode hygroscopicities result in ambiguous conclusions on the importance of the knowledge of κ values for Aitken mode particles' contribution to Nd (Pöhlker et al., 2021). Generally, for both sets of simulations, i.e., varying Na or κ, the agreement between model and measurements is best at low w. At w ≳ 2 m s−1, the Nd,p curves flatten, suggesting a decreasing sensitivity of Nd,p above this w threshold. Unlike the trends in Nd,p for different κ values, the lines for different Na keep diverging with increasing w. Thus, the sensitivity of Nd,p to Na is predicted to remain high and nearly independent of w which may point to conditions near the aerosol-limited regime.
4.3 Sensitivities of Nd predictions to w, Na, and κ
The sensitivities of cloud drop number concentrations to hygroscopicity (κ), Na and w have been explored in numerous previous studies. In the following, we place our results in the context of such studies. Consistent with such previous sensitivity studies, we calculated the sensitivity ξ of Nd,p to κ, Na and w:
where X is κ, Na, or w, respectively. The results are summarized in Fig. S7. They show that ξ(κ) is smallest as compared to ξ(Na) and ξ(w). ξ(κ) is highest for low κ conditions as under such conditions, the activated fraction is smallest, and thus a small change in κ might cause a significant change in Nd. κ is often termed “effective hygroscopicity” since it is used as a parameter that reflects multiple parameters that affect the water uptake by the particles. Generally, sensitivities are high under conditions of high supersaturation which are present at high w and/or low Na. While the sensitivities calculated for flights AC07, AC09, and AC18 follow these general trends according to Na, the ξ(X) values are higher for AC19 even though Na was lowest. for this flight. The reason for this difference is the successive activation of Aitken mode particles at high w (Pöhlker et al., 2021). A sensitivity study for the same flights has been performed previously (Cecchini et al., 2017) in which the sensitivities of Nd and effective cloud droplet diameter to Na and w were explored in detail at various heights in cloud. The focus of that study was the change in the sensitivities during cloud evolution, i.e., as a function of height in cloud. In the present study, we focus on the sensitivities of Nd near cloud base but additionally explore the importance of κ in determining Nd. Such an analysis can be used to give guidance for future measurements in similar clouds on the absolute values and relative importance of the three parameters to predict Nd.
Generally, prior sensitivity studies agree in the rankings of the relative importance of hygroscopicity (κ), Na, and w, as also shown in Fig. S7. Feingold (2003) has shown that Na has the largest influence on effective radius which is indirectly related to Nd. The sensitivities to the effective radius are typically smaller than those to Nd (Hernández Pardo et al., 2019). In our recent model study, we have shown that in the transitional regime, i.e., in the parameter space between the aerosol- and updraft-limited regimes, as defined by Reutter et al. (2009), Nd can be equally sensitive to κ and w (Pöhlker et al., 2021). In that latter study, it was shown that with increasing Na, the sensitivities to both parameters decrease; however, the sensitivity of Nd to w remains higher under such conditions than that to κ.
The uncertainties in updraft measurements are larger than those of hygroscopicity due to the great variability of w near cloud base. Peng et al. (2005) compared Nd,p based on a w distribution in a range of 0.09–1 m s−1 and using characteristic single w values. They found differences in Nd,p on the order of <10 % for the two sets of model simulations. Meskhidze et al. (2005) performed model simulations of low-level cumuliform clouds for which a range of m s−1 had been observed. They concluded that parameterizations of Nd,p should include a weighting factor for high values of w as otherwise Nd might be biased high due to enhanced vertical velocity within in cloud cores as compared to cloud base.
In turbulent clouds with high w, the determination of w near cloud bases might be challenging; however, the resulting uncertainties in updraft velocity or its distributions cannot explain the discrepancies between Nd,m and Nd,p at high w (Figs. 4 and 5). Under such conditions, the activated fraction approaches unity and any increase in w would not lead to higher Nd and improve the overall Nd closure (e.g., Hsieh et al., 2009). Therefore under such condition, ξ(w) becomes small (Fig. S7b, e, h, k). These previous Nd sensitivity and closure studies either regarded w as a fitting parameter to obtain good closure or used w values or distributions as relatively poorly constrained parameters. The PMM analysis as applied in the current study partially overcomes these uncertainties as it provides a stronger constraint of the w and Nd pairs for the full w range (Sect. 3.1), as opposed to the previous studies that derived their w distributions from averaging measured updraft velocities without sorting w and Nd,m data based on their frequency occurrence.
Reutter et al. (2009) termed conditions under which nearly all particles are activated into cloud droplets as aerosol-limited regime when Nd is only dependent on Na and not on w. Such conditions are present at relatively low total Na and high w, i.e., when the maximum supersaturation in the cloud is relatively high. When an increase in Na results in an equal increase in Nd, ξ(Na) approaches unity (Fig. S7c, f, i, l). The measured and predicted activated fractions for flights AC07, AC09, and AC18 reach ≥80 % at updraft velocities of w ≳ 1 m s−1 if the measured value is based on the CAS data (Fig. 4). Therefore, we conclude that the sensitivity of Nd to Na is much greater than that to w under these conditions, which is also reflected by the rather small increase in Nd with w at high updraft velocities.
Overall, the variability of predicted Nd due to inferred κ ranges in the present study confirms trends from previous sensitivity studies for monomodal aerosol size distributions: the sensitivity to Nd decreases with increasing w, i.e., when the activated fraction is large and activation of additional smaller particles increases Nd only to a small extent (Fig. S7 and Ervens et al., 2005; Reutter et al., 2009; Cecchini et al., 2017; Hernández Pardo et al., 2019). If low hygroscopicity limits the water vapor uptake, a small change in κ may lead to a significant change in Nd, resulting in high ξ(κ) values. A change in κ by the same factor for highly hygroscopic particles, however, might not lead to a significant change in Nd due to the regulation of the supersaturation (“buffering”), i.e., the efficient growth of more cloud droplets which, in turn, reduces the supersaturation. Our sensitivity study of AC19 exceeds these previous sensitivity studies that focused on monomodal aerosol size distributions. We show that the uncertainties in Nd,p become larger under conditions when Aitken mode particles contribute to Nd. Under such aerosol-limited conditions, ξ(κ) and ξ(w) decrease with the increasing w. Qualitatively this was also suggested in a previous Nd closure study for marine stratocumulus clouds, where it was concluded that only the presence of an Aitken mode could explain the high Nd,m at updraft velocities of w≥1 m s−1 (Schulze et al., 2020). Generally, the conditions at which Aitken mode particles contribute to CCN depend on the combinations of the parameter values of Na, w, and κ (Pöhlker et al., 2021). Therefore, Aitken mode particles were shown to contribute to CCN in Arctic stratocumulus clouds or fog that are characterized by low w and Na (Korhonen et al., 2008; Leaitch et al., 2016; Jung et al., 2018), whereas both updraft and aerosol loading are much higher in the convective cumulus clouds in the Amazon. Our analysis exceeds these studies as we show that the w threshold above which Aitken mode particles contribute to Nd depends on the properties (e.g., κ, Nacc) of the accumulation mode. In addition, we show that various combinations of inferred κacc and κAit result in similar Nd,p and thus cannot be constrained without more detailed composition measurements. While these conclusions are drawn from a single observationally based case study, a more systematic analysis of parameter ranges of Aitken and accumulation mode particles is provided in our recent study (Pöhlker et al., 2021).
Airborne measurements of cloud droplet number concentrations (Nd,m), aerosol particle size distributions and updraft velocities (w) near cloud base were performed during the ACRIDICON–CHUVA campaign in September 2014. Using an adiabatic air parcel model, the importance of aerosol particle number concentration (Na) and effective hygroscopicity (κ) and their uncertainties on predicted cloud droplet number concentrations (Nd,p) near cloud bases of growing convective cumuli, formed over the Amazon and western Atlantic, were explored. Data from aerosol and cloud probes onboard HALO were used as model input for this cloud droplet closure analysis. Model results for four different scenarios in terms of aerosol loading and size distributions and of w confirm previously suggested values of the hygroscopicity parameter κ to reasonably predict Nd for most conditions: best Nd closure is achieved for an effective hygroscopicity of κ∼0.1 for the Amazon Basin during the dry season using the full data set of CCP-CDP and CAS-DPOL measurements. Above the western Atlantic best Nd closure was achieved for κ∼0.2 applying a single κ value for both Aitken and accumulation modes; an even better representation of the increase in Nd with w was obtained when moderately hygroscopic accumulation mode particles (κacc=0.2) and highly hygroscopic Aitken mode particles (κAit=0.8) were assumed.
While we could not further constrain the hygroscopicities of the two modes based on the available data, our results suggest that knowledge of Aitken mode particle properties is required to predict cloud droplet number concentrations in convective clouds and/or clean air masses. We conclude that in the case of a bimodal aerosol size distribution with distinct Aitken and accumulation modes as encountered during flight AC19, Nd,p may be significantly underestimated as compared to Nd,p for w ≳ 0.5 m s−1 if a single κ for both modes is assumed that might only be appropriate for the larger accumulation mode particles. Our results also suggest that the ratio of the number concentrations of the Aitken and accumulation modes and their κ values can influence cloud properties near cloud base differently than for one-modal aerosol size distributions. More detailed sensitivity studies of cloud properties to Aitken mode aerosol properties (Na, κ) have been recently performed for wider parameter ranges to identify conditions under which they might affect aerosol–cloud interactions (Pöhlker et al., 2021).
Our droplet closure study represents a complementary approach to constrain CCN hygroscopicity, in addition to previous studies in the same region, in which a similar κ range (0.1–0.35) was determined for aerosol in the Amazon Basin, and a range of above the ocean, based on CCN measurements and detailed analysis of chemical composition (Wex et al., 2016; Thalman et al., 2017; Pöhlker et al., 2016, 2018). Our comparison between predicted and measured Nd showed largest discrepancies at high updraft velocities (w>2.5 m s−1), which could possibly be explained by non-adiabaticity and/or entrainment of aerosol particles near cloud bases of convective clouds.
While in previous cloud droplet number closure studies the updraft velocity was often assumed to be a major factor of uncertainty, this parameter was well constrained in the current study. Implying that higher Nd is formed in regions of higher updraft velocities, we sorted observed data of Nd and w by their frequency of occurrence (probability matching method). Using this approach, we reduced the uncertainty of w for the Nd closure. Therefore, we could largely limit our sensitivity analysis to the investigation of the importance of particle hygroscopicity and number concentration for cloud droplet number concentrations.
Variability in Na measurements ( %) translate into similar differences in predicted droplet number concentration as uncertainties assuming different κ values, in particular at low w. In previous cloud droplet number closure studies, composition effects, such as slow dissolution of soluble compounds (Asa-Awuku and Nenes, 2007), reduced surface tension, or variation in the water mass accommodation coefficient (Conant et al., 2004) have been inferred to explain observed droplet number concentrations. Our analysis shows that measurement uncertainties in basic aerosol properties might equally explain such differences. If particles exceed a hygroscopicity threshold (κ ≳ 0.3), predicted cloud droplet number concentration becomes very insensitive to κ when a large fraction of all particles is activated (aerosol-limited regime). In the presence of a distinct Aitken mode, the parameter space (w, Na, κ) at which this regime prevails is suggested to shift to even higher updraft velocity regimes than in the presence of monomodal accumulation mode size distributions.
The data used in this study can be found at https://halo-db.pa.op.dlr.de/mission/5 (last access: 1 October 2021, Deutsches Zentrum für Luft- und Raumfahrt, 2014).
The supplement related to this article is available online at: https://doi.org/10.5194/acp-21-17513-2021-supplement.
RCB, BE, and MLP led the analyses and the paper preparation. The measurements of aerosol and cloud properties were conducted and analyzed by RCB, DF, BAH, TJ, OOK, CP, DS, CV, AW, and MLP. The measurements were led by MOA, MW, and UP. The modeling studies were performed and interpreted by RCB, BE, DR, JDF, OL, LHP, LATM, and MLP.
Some authors are members of the editorial board of Atmospheric Chemistry and Physics. The peer-review process was guided by an independent editor, and the authors have also no other competing interests to declare.
Publisher's note: Copernicus Publications remains neutral with regard to jurisdictional claims in published maps and institutional affiliations.
The ACRIDICON–CHUVA campaign was supported by the Max Planck Society (MPG), the German Science Foundation (DFG Priority Program SPP 1294), the German Aerospace Center (DLR), and a wide range of other institutional partners. Barbara Ervens was supported by the French National Research Agency (ANR) (grant no. ANR-17-MPGA- 0013).The article processing charges for this open-access publication were covered by the Max Planck Society.
This paper was edited by Markus Petters and reviewed by three anonymous referees.
Andreae, M. O. and Raemdonck, H.: Dimethyl Sulfide in the Surface Ocean and the Marine Atmosphere: A Global View, Science, 221, 744–747, https://doi.org/10.1126/science.221.4612.744, 1983. a
Andreae, M. O. and Rosenfeld, D.: Aerosol-cloud-precipitation interactions. Part 1. The nature and sources of cloud-active aerosols, Earth-Sci. Rev., 89, 13–41, https://doi.org/10.1016/j.earscirev.2008.03.001, 2008. a
Andreae, M. O., Rosenfeld, D., Artaxo, P., Costa, A. A., Frank, G. P., Longo, K. M., and Silva-Dias, M. A. F.: Smoking rain clouds over the Amazon, Science, 303, 1337–1342, https://doi.org/10.1126/science.1092779, 2004. a
Andreae, M. O., Afchine, A., Albrecht, R., Holanda, B. A., Artaxo, P., Barbosa, H. M. J., Borrmann, S., Cecchini, M. A., Costa, A., Dollner, M., Fütterer, D., Järvinen, E., Jurkat, T., Klimach, T., Konemann, T., Knote, C., Krämer, M., Krisna, T., Machado, L. A. T., Mertes, S., Minikin, A., Pöhlker, C., Pöhlker, M. L., Pöschl, U., Rosenfeld, D., Sauer, D., Schlager, H., Schnaiter, M., Schneider, J., Schulz, C., Spanu, A., Sperling, V. B., Voigt, C., Walser, A., Wang, J., Weinzierl, B., Wendisch, M., and Ziereis, H.: Aerosol characteristics and particle production in the upper troposphere over the Amazon Basin, Atmos. Chem. Phys., 18, 921–961, https://doi.org/10.5194/acp-18-921-2018, 2018. a, b, c
Anttila, T. and Kerminen, V.-M.: On the contribution of Aitken mode particles to cloud droplet populations at continental background areas – a parametric sensitivity study, Atmos. Chem. Phys., 7, 4625–4637, https://doi.org/10.5194/acp-7-4625-2007, 2007. a
Anttila, T., Brus, D., Jaatinen, A., Hyvärinen, A.-P., Kivekäs, N., Romakkaniemi, S., Komppula, M., and Lihavainen, H.: Relationships between particles, cloud condensation nuclei and cloud droplet activation during the third Pallas Cloud Experiment, Atmos. Chem. Phys., 12, 11435–11450, https://doi.org/10.5194/acp-12-11435-2012, 2012. a
Artaxo, P.: Physical and chemical properties of aerosols in the wet and dry seasons in Rondônia, Amazonia, J. Geophys. Res., 107, 8081, https://doi.org/10.1029/2001JD000666, 2002. a
Asa-Awuku, A. and Nenes, A.: Effect of solute dissolution kinetics on cloud droplet formation: Extended Köhler theory, J. Geophys. Res.-Atmos., 112, D22201, https://doi.org/10.1029/2005JD006934, 2007. a
Baumgardner, D., Brenguier, J. L., Bucholtz, A., Coe, H., DeMott, P., Garrett, T. J., Gayet, J. F., Hermann, M., Heymsfield, A., Korolev, A., Krämer, M., Petzold, A., Strapp, W., Pilewskie, P., Taylor, J., Twohy, C., Wendisch, M., Bachalo, W., and Chuang, P.: Airborne instruments to measure atmospheric aerosol particles, clouds and radiation: A cook's tour of mature and emerging technology, 102, 10–29, https://doi.org/10.1016/j.atmosres.2011.06.021, 2011. a
Braga, R. C., Rosenfeld, D., Weigel, R., Jurkat, T., Andreae, M. O., Wendisch, M., Pöhlker, M. L., Klimach, T., Pöschl, U., Pöhlker, C., Voigt, C., Mahnke, C., Borrmann, S., Albrecht, R. I., Molleker, S., Vila, D. A., Machado, L. A. T., and Artaxo, P.: Comparing parameterized versus measured microphysical properties of tropical convective cloud bases during the ACRIDICON–CHUVA campaign, Atmos. Chem. Phys., 17, 7365–7386, https://doi.org/10.5194/acp-17-7365-2017, 2017a. a, b, c, d, e, f
Braga, R. C., Rosenfeld, D., Weigel, R., Jurkat, T., Andreae, M. O., Wendisch, M., Pöschl, U., Voigt, C., Mahnke, C., Borrmann, S., Albrecht, R. I., Molleker, S., Vila, D. A., Machado, L. A. T., and Grulich, L.: Further evidence for CCN aerosol concentrations determining the height of warm rain and ice initiation in convective clouds over the Amazon basin, Atmos. Chem. Phys., 17, 14433–14456, https://doi.org/10.5194/acp-17-14433-2017, 2017b. a
Broekhuizen, K., Chang, R. Y.-W., Leaitch, W. R., Li, S.-M., and Abbatt, J. P. D.: Closure between measured and modeled cloud condensation nuclei (CCN) using size-resolved aerosol compositions in downtown Toronto, Atmos. Chem. Phys., 6, 2513–2524, https://doi.org/10.5194/acp-6-2513-2006, 2006. a
Cai, Y., Montague, D. C., Mooiweer-Bryan, W., and Deshler, T.: Performance characteristics of the ultra high sensitivity aerosol spectrometer for particles between 55 and 800 nm: Laboratory and field studies, J. Aerosol Sci., 39, 759–769, https://doi.org/10.1016/j.jaerosci.2008.04.007, 2008. a, b
Carrico, C. M., Petters, M. D., Kreidenweis, S. M., Sullivan, A. P., McMeeking, G. R., Levin, E. J. T., Engling, G., Malm, W. C., and Collett Jr., J. L.: Water uptake and chemical composition of fresh aerosols generated in open burning of biomass, Atmos. Chem. Phys., 10, 5165–5178, https://doi.org/10.5194/acp-10-5165-2010, 2010. a
Cecchini, M. A., Machado, L. A. T., Andreae, M. O., Martin, S. T., Albrecht, R. I., Artaxo, P., Barbosa, H. M. J., Borrmann, S., Fütterer, D., Jurkat, T., Mahnke, C., Minikin, A., Molleker, S., Pöhlker, M. L., Pöschl, U., Rosenfeld, D., Voigt, C., Weinzierl, B., and Wendisch, M.: Sensitivities of Amazonian clouds to aerosols and updraft speed, Atmos. Chem. Phys., 17, 10037–10050, https://doi.org/10.5194/acp-17-10037-2017, 2017. a, b
Chuang, P. Y., Collins, D. R., Pawlowska, H., Snider, J. R., Jonsson, H. H., Brenguier, J. L., Flagan, R. C., and Seinfeld, J. H.: CCN measurements during ACE-2 and their relationship to cloud microphysical properties, Tellus B, 52, 843–867, https://doi.org/10.1034/j.1600-0889.2000.00018.x, 2000. a
Chubb, T., Huang, Y., Jensen, J., Campos, T., Siems, S., and Manton, M.: Observations of high droplet number concentrations in Southern Ocean boundary layer clouds, Atmos. Chem. Phys., 16, 971–987, https://doi.org/10.5194/acp-16-971-2016, 2016. a
Conant, W. C., VanReken, T. M., Rissman, T. A., Varutbangkul, V., Jonsson, H. H., Nenes, A., Jimenez, J. L., Delia, A. E., Bahreini, R., Roberts, G. C., Flagan, R. C., and Seinfeld, J. H.: Aerosol-cloud drop concentration closure in warm cumulus, J. Geophys. Res.-Atmos., 109, D13204, https://doi.org/10.1029/2003JD004324, 2004. a, b
Deutsches Zentrum für Luft- und Raumfahrt: Mission: ACRIDI-CONCHUVA, HALO [data set], available at: https://halo-db.pa.op.dlr.de/mission/5 (last access: 1 October 2021), 2014. a
Engelhart, G. J., Hennigan, C. J., Miracolo, M. A., Robinson, A. L., and Pandis, S. N.: Cloud condensation nuclei activity of fresh primary and aged biomass burning aerosol, Atmos. Chem. Phys., 12, 7285–7293, https://doi.org/10.5194/acp-12-7285-2012, 2012. a
Ervens, B., Feingold, G., and Kreidenweis, S. M.: Influence of water-soluble organic carbon on cloud drop number concentration, J. Geophys. Res.-Atmos., 110, 1–14, https://doi.org/10.1029/2004JD005634, 2005. a, b, c, d
Ervens, B., Cubison, M. J., Andrews, E., Feingold, G., Ogren, J. A., Jimenez, J. L., Quinn, P. K., Bates, T. S., Wang, J., Zhang, Q., Coe, H., Flynn, M., and Allan, J. D.: CCN predictions using simplified assumptions of organic aerosol composition and mixing state: a synthesis from six different locations, Atmos. Chem. Phys., 10, 4795–4807, https://doi.org/10.5194/acp-10-4795-2010, 2010. a, b, c
Feingold, G.: Modeling of the first indirect effect: Analysis of measurement requirements, Geophys. Res. Lett., 30, 1997, https://doi.org/10.1029/2003GL017967, 2003. a
Feingold, G. and Heymsfield, A. J.: Parameterizations of condensational growth of droplets for use in general circulation models, J. Atmos. Sci., 49, 2325–2342, https://doi.org/10.1175/1520-0469(1992)049<2325:POCGOD>2.0.CO;2, 1992. a, b
Fountoukis, C., Nenes, A., Meskhidze, N., Bahreini, R., Conant, W. C., Jonsson, H., Murphy, S., Sorooshian, A., Varutbangkul, V., Brechtel, F., Flagan, R. C., and Seinfeld, J. H.: Aerosol-cloud drop concentration closure for clouds sampled during the International Consortium for Atmospheric Research on Transport and Transformation 2004 campaign, J. Geophys. Res.-Atmos., 112, D10S30, https://doi.org/10.1029/2006JD007272, 2007. a, b
Gong, X., Wex, H., Müller, T., Wiedensohler, A., Höhler, K., Kandler, K., Ma, N., Dietel, B., Schiebel, T., Möhler, O., and Stratmann, F.: Characterization of aerosol properties at Cyprus, focusing on cloud condensation nuclei and ice-nucleating particles, Atmos. Chem. Phys., 19, 10883–10900, https://doi.org/10.5194/acp-19-10883-2019, 2019. a
Haddad, Z. S. and Rosenfeld, D.: Optimality of Empirical Z-R Relations, Q. J. Roy. Meteor. Soc., 123, 1283–1293, https://doi.org/10.1002/qj.49712354107, 1997. a
Hernández Pardo, L., Toledo Machado, L. A., Amore Cecchini, M., and Sánchez Gácita, M.: Quantifying the aerosol effect on droplet size distribution at cloud top, Atmos. Chem. Phys., 19, 7839–7857, https://doi.org/10.5194/acp-19-7839-2019, 2019. a, b
Holanda, B. A., Pöhlker, M. L., Walter, D., Saturno, J., Sörgel, M., Ditas, J., Ditas, F., Schulz, C., Franco, M. A., Wang, Q., Donth, T., Artaxo, P., Barbosa, H. M. J., Borrmann, S., Braga, R., Brito, J., Cheng, Y., Dollner, M., Kaiser, J. W., Klimach, T., Knote, C., Krüger, O. O., Fütterer, D., Lavrič, J. V., Ma, N., Machado, L. A. T., Ming, J., Morais, F. G., Paulsen, H., Sauer, D., Schlager, H., Schneider, J., Su, H., Weinzierl, B., Walser, A., Wendisch, M., Ziereis, H., Zöger, M., Pöschl, U., Andreae, M. O., and Pöhlker, C.: Influx of African biomass burning aerosol during the Amazonian dry season through layered transatlantic transport of black carbon-rich smoke, Atmos. Chem. Phys., 20, 4757–4785, https://doi.org/10.5194/acp-20-4757-2020, 2020. a
Hsieh, W. C., Nenes, A., Flagan, R. C., Seinfeld, J. H., Buzorius, G., and Jonsson, H.: Parameterization of cloud droplet size distributions: Comparison with parcel models and observations, J. Geophys. Res.-Atmos., 114, D11205, https://doi.org/10.1029/2008JD011387, 2009. a, b
IPCC: Climate Change 2021 – The Physical Science Basis, Cambridge University Press, Cambridge, 2021. a
Jung, C. H., Yoon, Y. J., Kang, H. J., Gim, Y., Lee, B. Y., Ström, J., Krejci, R., and Tunved, P.: The seasonal characteristics of cloud condensation nuclei (CCN) in the arctic lower troposphere, Tellus B, 70, 1–13, https://doi.org/10.1080/16000889.2018.1513291, 2018. a
Kleine, J., Voigt, C., Sauer, D., Schlager, H., Scheibe, M., Jurkat-Witschas, T., Kaufmann, S., Kärcher, B., and Anderson, B. E.: In Situ Observations of Ice Particle Losses in a Young Persistent Contrail, Geophys. Res. Lett., 45, 13553–13561, https://doi.org/10.1029/2018GL079390, 2018. a
Köhler, H.: The nucleus in and the growth of hygroscopic droplets, T. Faraday Soc., 32, 1152–1161, 1936. a
Korhonen, H., Carslaw, K. S., Spracklen, D. V., Ridley, D. A., and Ström, J.: A global model study of processes controlling aerosol size distributions in the Arctic spring and summer, J. Geophys. Res.-Atmos., 113, D08211, https://doi.org/10.1029/2007JD009114, 2008. a
Lance, S., Brock, C. A., Rogers, D., and Gordon, J. A.: Water droplet calibration of the Cloud Droplet Probe (CDP) and in-flight performance in liquid, ice and mixed-phase clouds during ARCPAC, Atmos. Meas. Tech., 3, 1683–1706, https://doi.org/10.5194/amt-3-1683-2010, 2010. a
Leaitch, W. R., Lohmann, U., Russell, L. M., Garrett, T., Shantz, N. C., Toom-Sauntry, D., Strapp, J. W., Hayden, K. L., Marshall, J., Wolde, M., Worsnop, D. R., and Jayne, J. T.: Cloud albedo increase from carbonaceous aerosol, Atmos. Chem. Phys., 10, 7669–7684, https://doi.org/10.5194/acp-10-7669-2010, 2010. a, b
Leaitch, W. R., Korolev, A., Aliabadi, A. A., Burkart, J., Willis, M. D., Abbatt, J. P. D., Bozem, H., Hoor, P., Köllner, F., Schneider, J., Herber, A., Konrad, C., and Brauner, R.: Effects of 20–100 nm particles on liquid clouds in the clean summertime Arctic, Atmos. Chem. Phys., 16, 11107–11124, https://doi.org/10.5194/acp-16-11107-2016, 2016. a
Mallaun, C., Giez, A., and Baumann, R.: Calibration of 3-D wind measurements on a single-engine research aircraft, Atmos. Meas. Tech., 8, 3177–3196, https://doi.org/10.5194/amt-8-3177-2015, 2015. a
McFiggans, G., Artaxo, P., Baltensperger, U., Coe, H., Facchini, M. C., Feingold, G., Fuzzi, S., Gysel, M., Laaksonen, A., Lohmann, U., Mentel, T. F., Murphy, D. M., O'Dowd, C. D., Snider, J. R., and Weingartner, E.: The effect of physical and chemical aerosol properties on warm cloud droplet activation, Atmos. Chem. Phys., 6, 2593–2649, https://doi.org/10.5194/acp-6-2593-2006, 2006. a
Meskhidze, N., Nenes, A., Conant, W. C., and Seinfeld, J. H.: Evaluation of a new cloud droplet activation parameterization with in situ data from CRYSTAL-FACE and CSTRIPE, J. Geophys. Res.-Atmos., 110, 1–10, https://doi.org/10.1029/2004JD005703, 2005. a, b
Moore, R. H., Wiggins, E. B., Ahern, A. T., Zimmerman, S., Montgomery, L., Campuzano Jost, P., Robinson, C. E., Ziemba, L. D., Winstead, E. L., Anderson, B. E., Brock, C. A., Brown, M. D., Chen, G., Crosbie, E. C., Guo, H., Jimenez, J. L., Jordan, C. E., Lyu, M., Nault, B. A., Rothfuss, N. E., Sanchez, K. J., Schueneman, M., Shingler, T. J., Shook, M. A., Thornhill, K. L., Wagner, N. L., and Wang, J.: Sizing response of the Ultra-High Sensitivity Aerosol Spectrometer (UHSAS) and Laser Aerosol Spectrometer (LAS) to changes in submicron aerosol composition and refractive index, Atmos. Meas. Tech., 14, 4517–4542, https://doi.org/10.5194/amt-14-4517-2021, 2021. a, b
Peng, Y., Lohmann, U., and Leaitch, W. R.: Importance of vertical velocity variations in the cloud droplet nucleation process of marine stratus clouds, J. Geophys. Res.-Atmos., 110, 1–13, https://doi.org/10.1029/2004JD004922, 2005. a, b
Petters, M. D. and Kreidenweis, S. M.: A single parameter representation of hygroscopic growth and cloud condensation nucleus activity, Atmos. Chem. Phys., 7, 1961–1971, https://doi.org/10.5194/acp-7-1961-2007, 2007. a
Petzold, A., Marsh, R., Johnson, M., Miller, M., Sevcenco, Y., Delhaye, D., Ibrahim, A., Williams, P., Bauer, H., Crayford, A., Bachalo, W. D., and Raper, D.: Evaluation of Methods for Measuring Particulate Matter Emissions from Gas Turbines, Environ. Sci. Technol., 45, 3562–3568, https://doi.org/10.1021/es103969v, 2011. a
Pöhlker, M. L., Pöhlker, C., Ditas, F., Klimach, T., Hrabe de Angelis, I., Araújo, A., Brito, J., Carbone, S., Cheng, Y., Chi, X., Ditz, R., Gunthe, S. S., Kesselmeier, J., Könemann, T., Lavrič, J. V., Martin, S. T., Mikhailov, E., Moran-Zuloaga, D., Rose, D., Saturno, J., Su, H., Thalman, R., Walter, D., Wang, J., Wolff, S., Barbosa, H. M. J., Artaxo, P., Andreae, M. O., and Pöschl, U.: Long-term observations of cloud condensation nuclei in the Amazon rain forest – Part 1: Aerosol size distribution, hygroscopicity, and new model parametrizations for CCN prediction, Atmos. Chem. Phys., 16, 15709–15740, https://doi.org/10.5194/acp-16-15709-2016, 2016. a, b, c, d
Pöhlker, M. L., Ditas, F., Saturno, J., Klimach, T., Hrabě de Angelis, I., Araùjo, A. C., Brito, J., Carbone, S., Cheng, Y., Chi, X., Ditz, R., Gunthe, S. S., Holanda, B. A., Kandler, K., Kesselmeier, J., Könemann, T., Krüger, O. O., Lavrič, J. V., Martin, S. T., Mikhailov, E., Moran-Zuloaga, D., Rizzo, L. V., Rose, D., Su, H., Thalman, R., Walter, D., Wang, J., Wolff, S., Barbosa, H. M. J., Artaxo, P., Andreae, M. O., Pöschl, U., and Pöhlker, C.: Long-term observations of cloud condensation nuclei over the Amazon rain forest – Part 2: Variability and characteristics of biomass burning, long-range transport, and pristine rain forest aerosols, Atmos. Chem. Phys., 18, 10289–10331, https://doi.org/10.5194/acp-18-10289-2018, 2018. a, b, c, d, e, f
Pöhlker, M. L., Zhang, M., Campos Braga, R., Krüger, O. O., Pöschl, U., and Ervens, B.: Aitken mode particles as CCN in aerosol- and updraft-sensitive regimes of cloud droplet formation, Atmos. Chem. Phys., 21, 11723–11740, https://doi.org/10.5194/acp-21-11723-2021, 2021. a, b, c, d, e, f, g, h
Pruppacher, H. and Klett, J. D.: Microphysics of Clouds and Precipitation, 2nd edn., Kluwer Academic Publishers, Dordrecht, Netherlands, 1997. a
Quinn, P. K., Coffman, D. J., Johnson, J. E., Upchurch, L. M., and Bates, T. S.: Small fraction of marine cloud condensation nuclei made up of sea spray aerosol, Nat. Geosci., 10, 674–679, https://doi.org/10.1038/ngeo3003, 2017. a
Reutter, P., Su, H., Trentmann, J., Simmel, M., Rose, D., Gunthe, S. S., Wernli, H., Andreae, M. O., and Pöschl, U.: Aerosol- and updraft-limited regimes of cloud droplet formation: influence of particle number, size and hygroscopicity on the activation of cloud condensation nuclei (CCN), Atmos. Chem. Phys., 9, 7067–7080, https://doi.org/10.5194/acp-9-7067-2009, 2009. a, b, c, d, e, f
Rissler, J., Swietlicki, E., Zhou, J., Roberts, G., Andreae, M. O., Gatti, L. V., and Artaxo, P.: Physical properties of the sub-micrometer aerosol over the Amazon rain forest during the wet-to-dry season transition – comparison of modeled and measured CCN concentrations, Atmos. Chem. Phys., 4, 2119–2143, https://doi.org/10.5194/acp-4-2119-2004, 2004. a
Roberts, G. C., Nenes, A., Seinfeld, J. H., and Andreae, M. O.: Impact of biomass burning on cloud properties in the Amazon Basin, J. Geophys. Res.-Atmos., 108, 4062, https://doi.org/10.1029/2001JD000985, 2003. a
Rosenfeld, D.: Cloud-Aerosol-Precipitation Interactions Based of Satellite Retrieved Vertical Profiles of Cloud Microstructure, in: Remote Sensing of Aerosols, Clouds, and Precipitation, Elsevier, Amsterdam, Netherlands, 129–152, https://doi.org/10.1016/B978-0-12-810437-8.00006-2, 2018. a
Rosenfeld, D., Lohmann, U., Raga, G. B., O'Dowd, C. D., Kulmala, M., Fuzzi, S., Reissell, A., and Andreae, M. O.: Flood or drought: how do aerosols affect precipitation?, Science, 321, 1309–1313, https://doi.org/10.1126/science.1160606, 2008. a
Schulze, B. C., Charan, S. M., Kenseth, C. M., Kong, W., Bates, K. H., Williams, W., Metcalf, A. R., Jonsson, H. H., Woods, R., Sorooshian, A., Flagan, R. C., and Seinfeld, J. H.: Characterization of Aerosol Hygroscopicity Over the Northeast Pacific Ocean: Impacts on Prediction of CCN and Stratocumulus Cloud Droplet Number Concentrations, Earth and Space Science, 7, e2020EA001098, https://doi.org/10.1029/2020EA001098, 2020. a
Shaw, R. A., Reade, W. C., Collins, L. R., and Verlinde, J.: Preferential Concentration of Cloud Droplets by Turbulence: Effects on the Early Evolution of Cumulus Cloud Droplet Spectra, J. Atmos. Sci., 55, 1965–1976, https://doi.org/10.1175/1520-0469(1998)055<1965:PCOCDB>2.0.CO;2, 1998. a
Thalman, R., de Sá, S. S., Palm, B. B., Barbosa, H. M. J., Pöhlker, M. L., Alexander, M. L., Brito, J., Carbone, S., Castillo, P., Day, D. A., Kuang, C., Manzi, A., Ng, N. L., Sedlacek III, A. J., Souza, R., Springston, S., Watson, T., Pöhlker, C., Pöschl, U., Andreae, M. O., Artaxo, P., Jimenez, J. L., Martin, S. T., and Wang, J.: CCN activity and organic hygroscopicity of aerosols downwind of an urban region in central Amazonia: seasonal and diel variations and impact of anthropogenic emissions, Atmos. Chem. Phys., 17, 11779–11801, https://doi.org/10.5194/acp-17-11779-2017, 2017. a
Voigt, C., Schumann, U., Jurkat, T., Schäuble, D., Schlager, H., Petzold, A., Gayet, J.-F., Krämer, M., Schneider, J., Borrmann, S., Schmale, J., Jessberger, P., Hamburger, T., Lichtenstern, M., Scheibe, M., Gourbeyre, C., Meyer, J., Kübbeler, M., Frey, W., Kalesse, H., Butler, T., Lawrence, M. G., Holzäpfel, F., Arnold, F., Wendisch, M., Döpelheuer, A., Gottschaldt, K., Baumann, R., Zöger, M., Sölch, I., Rautenhaus, M., and Dörnbrack, A.: In-situ observations of young contrails – overview and selected results from the CONCERT campaign, Atmos. Chem. Phys., 10, 9039–9056, https://doi.org/10.5194/acp-10-9039-2010, 2010. a
Voigt, C., Schumann, U., Jessberger, P., Jurkat, T., Petzold, A., Gayet, J. F., Krmer, M., Thornberry, T., and Fahey, D. W.: Extinction and optical depth of contrails, Geophys. Res. Lett., 38, L11806, https://doi.org/10.1029/2011GL047189, 2011. a
Voigt, C., Schumann, U., Minikin, A., Abdelmonem, A., Afchine, A., Borrmann, S., Boettcher, M., Buchholz, B., Bugliaro, L., Costa, A., Curtius, J., Dollner, M., Dörnbrack, A., Dreiling, V., Ebert, V., Ehrlich, A., Fix, A., Forster, L., Frank, F., and Zoeger, M.: ML-CIRRUS: The Airborne Experiment on Natural Cirrus and Contrail Cirrus with the High-Altitude Long-Range Research Aircraft HALO, B. Am. Meteorol. Soc., 98, 271–288, https://doi.org/10.1175/BAMS-D-15-00213.1, 2017. a, b
von der Weiden, S.-L., Drewnick, F., and Borrmann, S.: Particle Loss Calculator – a new software tool for the assessment of the performance of aerosol inlet systems, Atmos. Meas. Tech., 2, 479–494, https://doi.org/10.5194/amt-2-479-2009, 2009. a
Wang, J., Lee, Y.-N., Daum, P. H., Jayne, J., and Alexander, M. L.: Effects of aerosol organics on cloud condensation nucleus (CCN) concentration and first indirect aerosol effect, Atmos. Chem. Phys., 8, 6325–6339, https://doi.org/10.5194/acp-8-6325-2008, 2008. a
Wendisch, M. and Brenguier, J. L.: Airborne measurements for environmental research: methods and instruments, Wiley-VCH Verlag GmbH and Co. KGaA, Weinheim, Germany, https://doi.org/10.1002/9783527653218, 2013. a
Wendisch, M., Pöschl, U., Andreae, M. O., Machado, L. A. T., Albrecht, R., Schlager, H., Rosenfeld, D., Martin, S. T., Abdelmonem, A., Afchine, A., Araùjo, A., Artaxo, P., Aufmhoff, H., Barbosa, H. M. J., Borrmann, S., Braga, R., Buchholz, B., Cecchini, M. A., Costa, A., Curtius, J., Dollner, M., Dorf, M., Dreiling, V., Ebert, V., Ehrlich, A., Ewald, F., Fisch, G., Fix, A., Frank, F., Fütterer, D., Heckl, C., Heidelberg, F., Hüneke, T., Jäkel, E., Järvinen, E., Jurkat, T., Kanter, S., Kästner, U., Kenntner, M., Kesselmeier, J., Klimach, T., Knecht, M., Kohl, R., Kölling, T., Krämer, M., Krüger, M., Krisna, T. C., Lavric, J. V., Longo, K., Mahnke, C., Manzi, A. O., Mayer, B., Mertes, S., Minikin, A., Molleker, S., Münch, S., Nillius, B., Pfeilsticker, K., Pöhlker, C., Roiger, A., Rose, D., Rosenow, D., Sauer, D., Schnaiter, M., Schneider, J., Schulz, C., de Souza, R. A. F., Spanu, A., Stock, P., Vila, D., Voigt, C., Walser, A., Walter, D., Weigel, R., Weinzierl, B., Werner, F., Yamasoe, M. A., Ziereis, H., Zinner, T., and Zöger, M.: The ACRIDICON-CHUVA campaign: Studying tropical deep convective clouds and precipitation over Amazonia using the new German research aircraft HALO, B. Am. Meteorol. Soc., 97, 10, 1885–1908, https://doi.org/10.1175/BAMS-D-14-00255.1, 2016. a, b, c, d, e
Wex, H., Dieckmann, K., Roberts, G. C., Conrath, T., Izaguirre, M. A., Hartmann, S., Herenz, P., Schäfer, M., Ditas, F., Schmeissner, T., Henning, S., Wehner, B., Siebert, H., and Stratmann, F.: Aerosol arriving on the Caribbean island of Barbados: physical properties and origin, Atmos. Chem. Phys., 16, 14107–14130, https://doi.org/10.5194/acp-16-14107-2016, 2016. a, b, c
Xue, Y., Wang, L.-P., and Grabowski, W. W.: Growth of Cloud Droplets by Turbulent Collision–Coalescence, J. Atmos. Sci., 65, 331–356, https://doi.org/10.1175/2007JAS2406.1, 2008. a