the Creative Commons Attribution 4.0 License.
the Creative Commons Attribution 4.0 License.
 | 01 Dec 2021
Impacts of long-range-transported mineral dust on summertime convective cloud and precipitation: a case study over the Taiwan region
Jiwen Fan
Shuai Liu
As one of the most abundant atmospheric aerosols and effective ice nuclei, mineral dust affects clouds and precipitation in the Earth system. Here numerical experiments are carried out to investigate the impacts of dust aerosols on summertime convective clouds and precipitation over the mountainous region of Taiwan by acting as ice-nucleating particles. We run the Weather Research and Forecasting model (WRF) with the Morrison two-moment and spectral-bin microphysics (SBM) schemes at 3 km resolution, using dust number concentrations from a global chemical transport model (GEOS-Chem-APM). The case study indicates that the long-range-transported mineral dust, with relatively low number concentrations, can notably affect the properties of convective clouds (ice and liquid water contents, cloud top height, and cloud coverage) and precipitation (spatial pattern and intensity). The effects of dust are evident during strong convective periods, with significantly increased ice water contents in the mixed-phase regime via the enhanced heterogeneous freezing. With both the Morrison and SBM schemes, we see the invigoration effects of dust aerosols on the convective intensity through enhanced condensation and deposition latent heating. The low-altitude dust particles are uplifted to the freezing level by updrafts, which, in turn, enhance the convective cloud development through immersion freezing and convective invigoration. Compared to the Morrison scheme, the SBM scheme predicts more realistic precipitation and different invigoration effects of dust. The differences are partially attributed to the saturation adjustment approach utilized in the bulk scheme, which leads to a stronger enhancement of condensation at midlatitudes to low altitudes and a weaker deposition increase at the upper level.
- Article
(6744 KB) - Full-text XML
-
Supplement
(588 KB) - BibTeX
- EndNote


Due to the enormous global emission rate (Zender et al., 2004; Textor et al., 2006), relatively long lifetime (days up to weeks) (Penner et al., 2001; Prospero, 1999), and the long-range transport ability (Husar et al., 2001; Perry et al., 2004; Engelstaedter et al., 2006; Liu et al., 2008; Uno et al., 2009), mineral dust is one of the most abundant aerosol components in the atmosphere (Andreae et al., 1986; Carslaw et al., 2010; Kok et al., 2017). Previous studies indicate that mineral dust significantly affects air quality (Prospero, 1999), public health (Pope et al., 2002; Chiu et al., 2008), biogeochemical cycles (Jickells et al., 2005), and climate systems. In the atmosphere, mineral dust is suggested to have important impacts on the radiation budget of the Earth system through direct effects (scattering and absorbing shortwave and longwave radiation) (X. Li et al., 1996; Miller and Tegen, 1998; Fu et al., 2009; Zhao et al., 2011; Guo and Yin, 2015; Z. Li et al., 2019) and semi-direct effects through changes in the atmospheric temperature structure and cloud lifetime (Hansen et al., 1997; Koren et al., 2004; Huang et al., 2006).
Besides the effects on radiative properties of the atmosphere, dust aerosols are also suggested to influence cloud properties and enhance or suppress clouds and precipitation by serving as cloud condensation nuclei (CCN) and ice nuclei (IN) (Gunn and Phillips, 1957; Rosenfeld, 2001; Yin et al., 2002; Sassen et al., 2003; Chen et al., 2008; Han et al., 2009; Min et al., 2009; Solomos et al., 2011; Seigel et al., 2013; Creamean et al., 2015, 2016; Zhang et al., 2020b). Due to its large atmospheric loading and high ice-nucleating ability, mineral dust is well recognized as the most important atmospheric ice nucleating particle (INP) (Knopf and Koop, 2006; Klein et al., 2010; Si et al., 2018), and a series of field observations and laboratory studies demonstrate its effects on ice-nucleating and heterogeneous freezing in cirrus and mixed-phase clouds (Roberts and Hallett, 1968; Zimmermann et al., 2008; Hoose and Möhler 2012; Atkinson et al., 2013; DeMott et al., 2010, 2015). However, the effects of dust on cloud and precipitation still have significant uncertainties and are highly dependent on specific cloud types and meteorological conditions (Huang et al., 2014). Near the dust sources, the outbreaks of dust events provide high number concentrations of INPs, leading to more ice particles at warmer temperatures through heterogeneous ice nucleation processes (Bangert et al., 2012), which can influence the mixed-phase clouds and enhance the cloud water and precipitation (Smoydzin et al., 2012; Gibbons et al., 2018). Meanwhile, in the relatively dry atmosphere, water vapor competition limits ice particles' growth and reduces the effective radius of cloud particles, suppressing the precipitation as a result (Rosenfeld et al., 2001; Levin et al., 2005; Teller and Levin, 2006; Min et al., 2009; Wang et al., 2010). Over regions remote from dust sources, transport of dust in the middle and upper troposphere is indicated to lead to dust entrainment into mixed-phase clouds, contributing to ice nuclei populations and enhancing the precipitation under the condition with adequate water vapor inputs (DeMott et al., 2003; Muhlbauer and Lohmann, 2009; Ault et al., 2011; Creamean et al., 2013; Fan et al., 2014, 2017).
In this paper, we choose the Taiwan region to study the impacts of mineral dust on deep convective clouds and precipitation. Previous studies using backward trajectory analyses, satellite observation, site measurement, particle chemical characteristics, and model simulation indicate that the atmospheric dust loading over the Taiwan area is dominated by the long-range-transported dust from various dust sources with different dust chemical compositions (East Asia, Sahara, Middle East, etc.) (Hsu et al., 2012; Lin et al., 2012; Chen et al., 2015; Chou et al., 2017; Wu and Huang, 2021). Taiwan is also significantly affected by summertime extreme rainfall events (Chen and Chen, 2003; Xu et al., 2009; Chen et al., 2010; Lin et al., 2011; Yim et al., 2015; Zhang et al., 2020a). In our previous studies (Zhang et al., 2020b), we found a positive correlation between the number concentration of dust particles and the summertime rainfall intensity over Taiwan, showing that the cloud water and non-typhoon rainfall generally increase with the atmospheric dust loading over this mountainous region. The main objective of this paper is to investigate the detailed physical processes underlying this positive correlation, focusing on the impacts of the low-altitude-transported mineral dust (under 4 km) which has relatively low number concentrations (< 1 cm−3). In this study, we incorporate the DeMott et al. (2015) immersion freezing parameterization into cloud microphysics schemes in the Weather Research and Forecasting (WRF) model (Skamarock et al., 2019) to connect dust with ice nucleation, following Fan et al. (2014). We utilize this modified WRF model to simulate a heavy rainfall case over the mountainous region of Taiwan, occurring on 8 July 2006, influenced by a dust event.
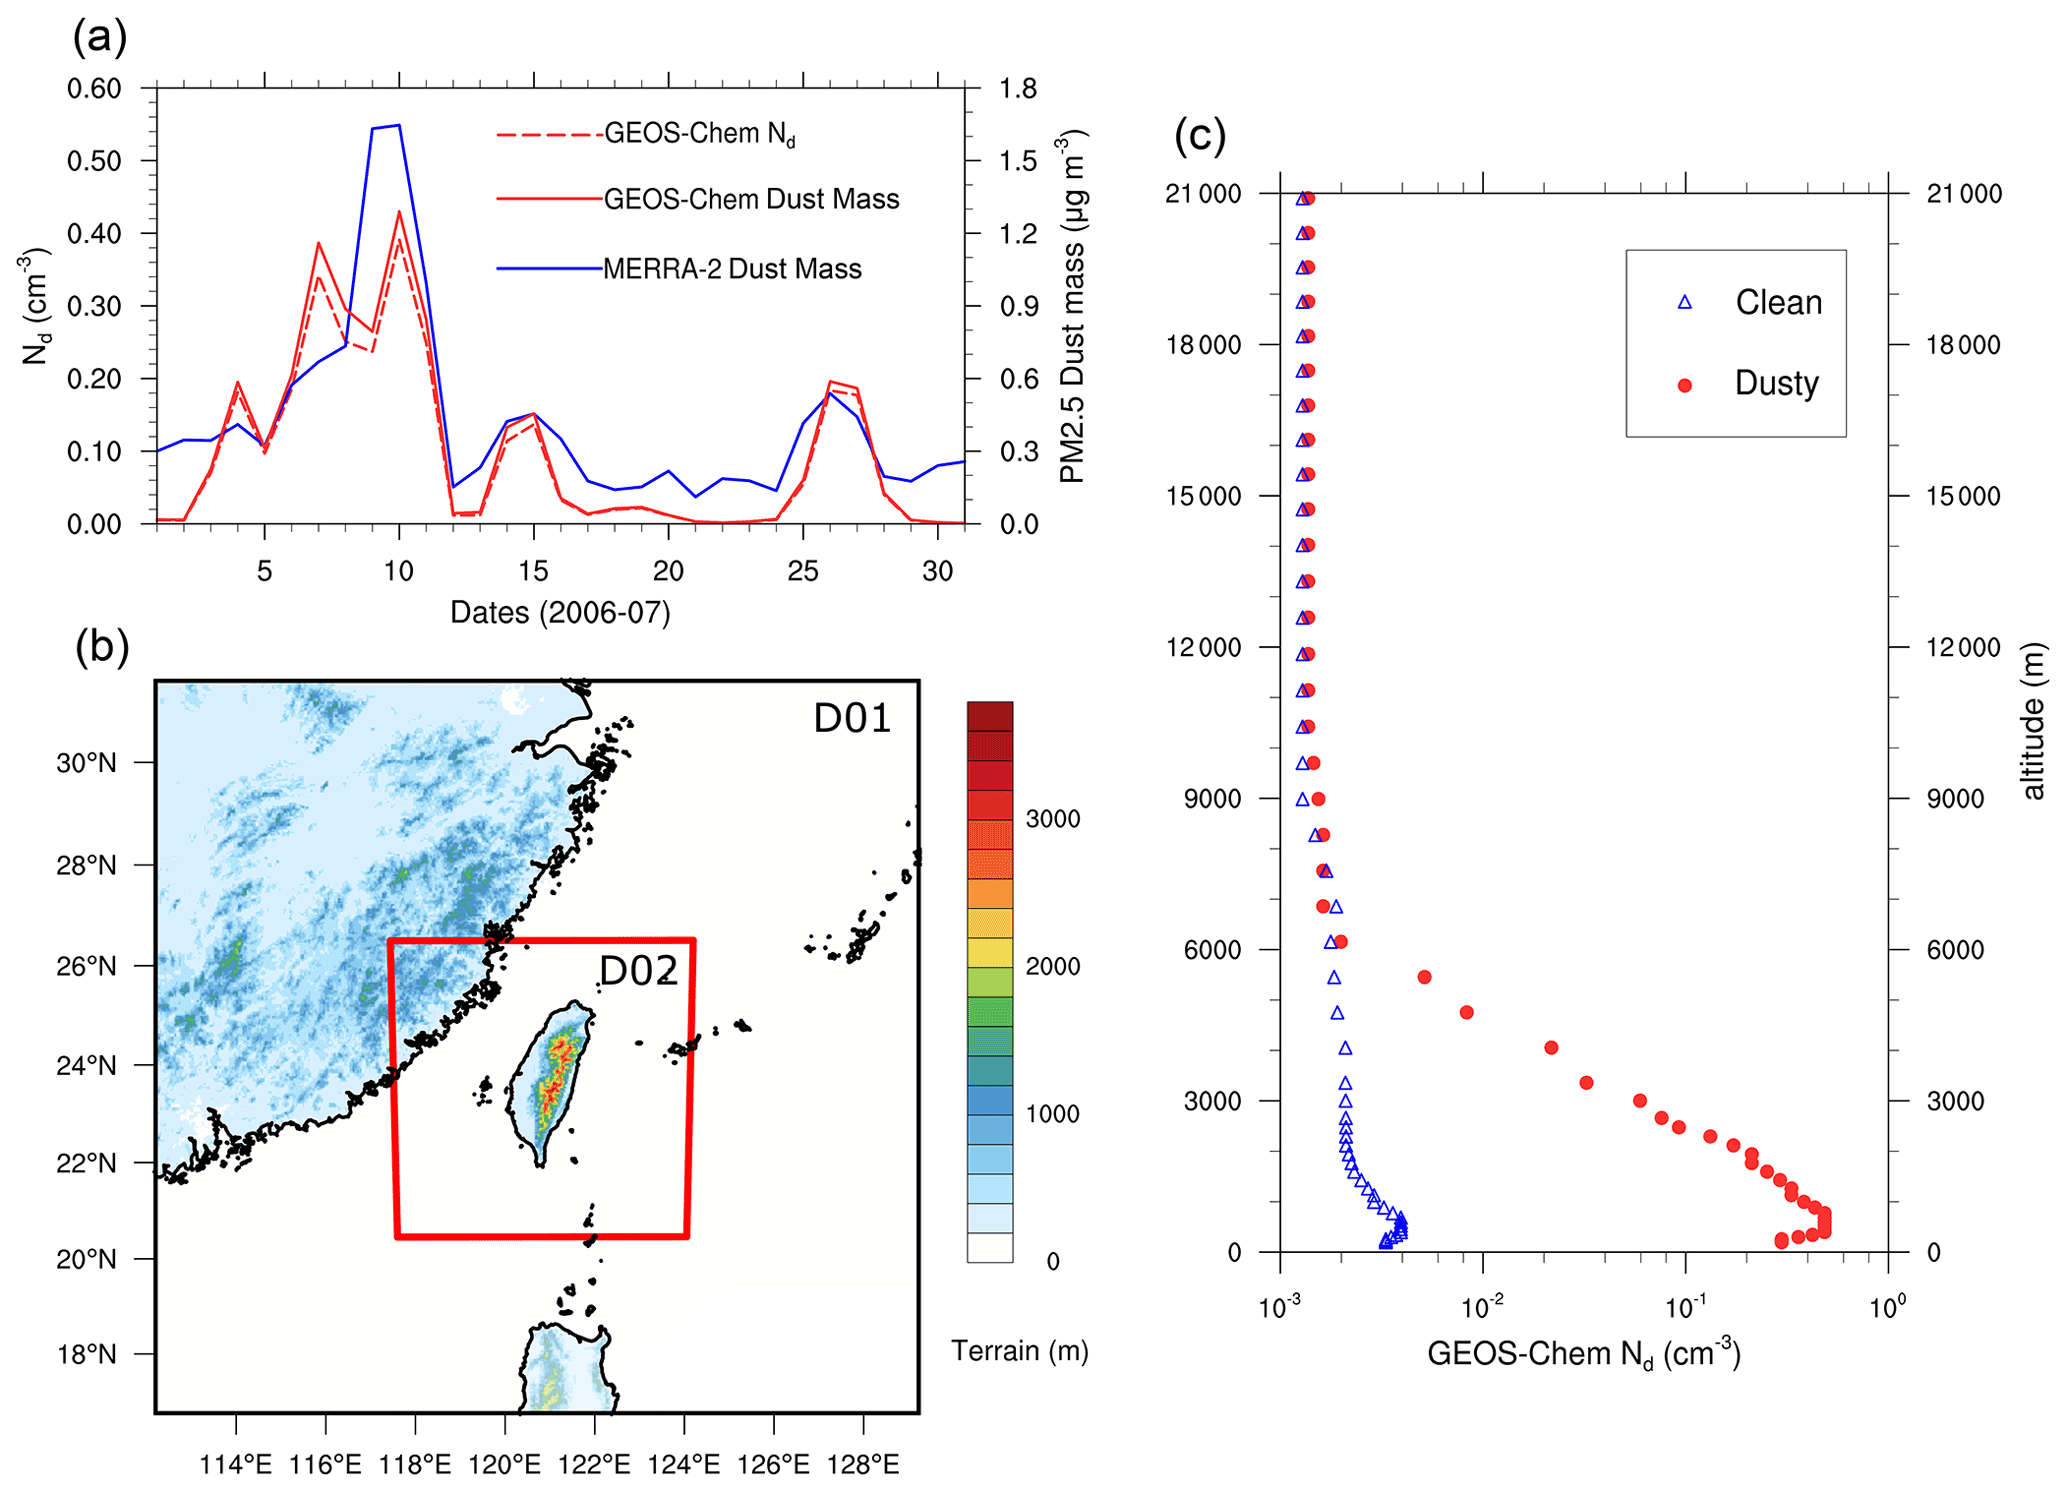
Figure 1(a) Time series of the GEOS-Chem-APM simulated dust number concentration (Nd: dashed red line) and dust mass mixing ratio (solid red line) and MERRA-2 dust mass mixing ratio reanalysis (blue line) in July 2006, (b) simulation domains and terrain height, and (c) vertical profiles of WRF boundary conditions of dust number concentration in clean (blue triangles) and dusty (red dots) runs.
Here we use numerical experiments and multiple datasets to study the interactions between dust aerosol and convective clouds and precipitation. We selected a severe precipitation event over Taiwan on 8 July 2006 at local time (LT), with 24 h accumulated precipitation over 220 mm in the precipitation center. This event was influenced by a remote typhoon system, leading to a strong water vapor transport to the mountainous region in the northwestern part of the island of Taiwan. At the same time, a dust event occurred over this region during the study period (Fig. 1a).
2.1 Data
The datasets used in this study are listed below:
-
Dust number concentrations. In this study, the DeMott et al. (2015) immersion freezing scheme is used to describe the INP formation rate which is dependent on the atmospheric temperature and dust number concentration (diameter > 500 nm) (Nd). Due to the lack of measurements, Nd simulated by the GEOS-Chem model with size-resolved advanced particle microphysics (APM) (Yu and Luo, 2009) is used for the dust conditions in the WRF simulations. We run the GEOS-Chem-APM model at 2∘ × 2.5∘ horizontal resolution with 47 vertical levels, and the daily and hourly mean Nd simulations are globally outputted at selected sites. The GEOS-Chem-APM model is driven by meteorological input from the Goddard Earth Observing System (GEOS) of the NASA Global Modeling and Assimilation Office (GMAO). In this model, dust emission is calculated with the Mineral Dust Entrainment and Deposition (DEAD) scheme (Zender et al., 2003), and dust aerosols from 30 nm to 25 µm are represented by 15 bins. The GEOS-Chem dust simulations have been widely used in studies of dust aerosol (Generoso et al., 2008; Kim et al., 2015; Ridley et al., 2016; Xu et al., 2017), and the GEOS-Chem dust simulation over the Taiwan region is validated by our previous research, indicating that the GEOS-Chem model can reasonably capture the occurrence of dust events and variations of dust concentrations (Zhang et al., 2019, 2020a).
-
MERRA-2 dust mass mixing ratio reanalysis. The time series and vertical profile of dust aerosols can be difficult to observe continuously, especially during summertime with relatively low dust loadings. For the validation of the GEOS-Chem dust simulation, the MERRA-2 reanalysis of dust mass mixing ratio (inst3_3d_aer_Nv) (Gelaro et al., 2017; GMAO, 2015) is used as a reference for the time series and vertical distributions of the atmospheric dust aerosols. MERRA-2 is a NASA atmospheric reanalysis for the satellite era using the GEOS Model, Version 5 (GEOS-5), with its Atmospheric Data Assimilation System (ADAS), version 5.12.4. The MERRA project focuses on historical climate analyses for a broad range of weather and climate timescales and places the NASA EOS suite of observations in a climate context. The three-dimensional aerosol reanalysis (inst3_3d_aer_Nv) is 3-hourly data at 0.5∘ × 0.625∘ horizontal resolution with 72 vertical layers. As the dust number concentration is not directly provided in the MERRA-2 reanalysis, the MERRA-2 dust mass mixing ratio in July 2006 is used to compare with and validate the temporal and vertical distributions of the dust mass concentration simulated by the GEOS-Chem-APM model. Previous studies suggest that the mass and number concentrations of dust aerosol are generally controlled by particles in coarse and fine modes, respectively (Hoffmann et al., 2008; Kaaden et al., 2009; Mahowald et al., 2014; Denjean et al., 2016). Since this study focuses more on the dust number concentration, we chose the first two bins (diameters 1.46 and 2.8 µm) of the MERRA-2 dust mixing ratio to qualitatively compare with the model dust mass simulation (diameter from 0.5 to 2.5 µm).
-
Precipitation measurements. The daily precipitation data with 1 km resolution from the Taiwan Climate Change Projection Information and Adaptation Knowledge Platform (TCCIP) project are used for the rainfall observation. The TCCIP precipitation data have been widely used in previous studies for extreme rainfall events in Taiwan (Chen and Chen, 2003; Su et al., 2012; Kuo et al., 2016; Henny et al., 2021). We also use the half-hourly rainfall observation at 0.1∘ × 0.1∘ horizontal resolution from the Integrated Multi-satellitE Retrievals for GPM (IMERG) (Huffman et al., 2019) for the rain rate observation.
-
Satellite observation. In this study, cloud measurements from the Moderate Resolution Imaging Spectroradiometer (MODIS) aboard the Aqua (EOS PM) satellites (Platnick et al., 2015) are used to compare with the model simulations. The level-2 MODIS/Aqua (MYD06_L2) cloud product consists of cloud optical and physical parameters at a spatial resolution of either 1 or 5 km, which are derived using remotely sensed infrared (cloud top temperature, cloud top height, effective emissivity, cloud phase, and cloud fraction), visible (cloud optical thickness and effective particle radius and cloud shadow effects), and near-infrared (additional information in the retrieval of cloud particle phase) solar reflected radiances.
In this study, all the data are processed in local time (LT) (Greenwich mean time +8).
2.2 Model configuration and experiment design
2.2.1 Immersion freezing parameterization and dust aerosol
To study the detailed physical processes of the dust–cloud–precipitation interactions in the selected case event, we conducted numerical experiments with the WRFv4.20 Model. As given in Fig. 1b, two nested domains with horizontal grid spacings of 9 km (181 × 181) and 3 km (223 × 223) for Domain 1 (D01) and Domain 2 (D02), respectively, are used with 50 vertical levels up to 50 hPa. Hourly ERA5 reanalysis is used for the model initial and boundary meteorological conditions (European Centre for Medium-Range Weather Forecasts, 2017). The physical parameterization schemes used in the model include the RRTMG longwave radiation scheme, the RRTMG shortwave radiation scheme (Iacono et al., 2008), and the Mellor–Yamada–Janjic PBL (planetary boundary layer) scheme (Janjic, 1994). The Tiedtke cumulus scheme (Tiedtke, 1989) is used in D01 and turned off in D02. The simulations were initiated at 00:00 UTC on 7 July with 16 h spin-up time and ended at 00:00 UTC on 9 July 2006. Simulations in D01 are mainly used to provide meteorological conditions for D02, and the analysis in this study is focused on the fine-resolution simulation results in D02.
Table 1Six numerical runs with different settings of the immersion freezing parameterization are considered in this study. The default Morrison and SBM schemes in WRFv4.2.0 with Bigg (1953) immersion freezing parameterization are used as control runs (Morr2-Org and SBM-Org). Four simulations with modified Morr2 and SBM schemes were run with different dust profiles simulated by the GEOS-Chem model, respectively.
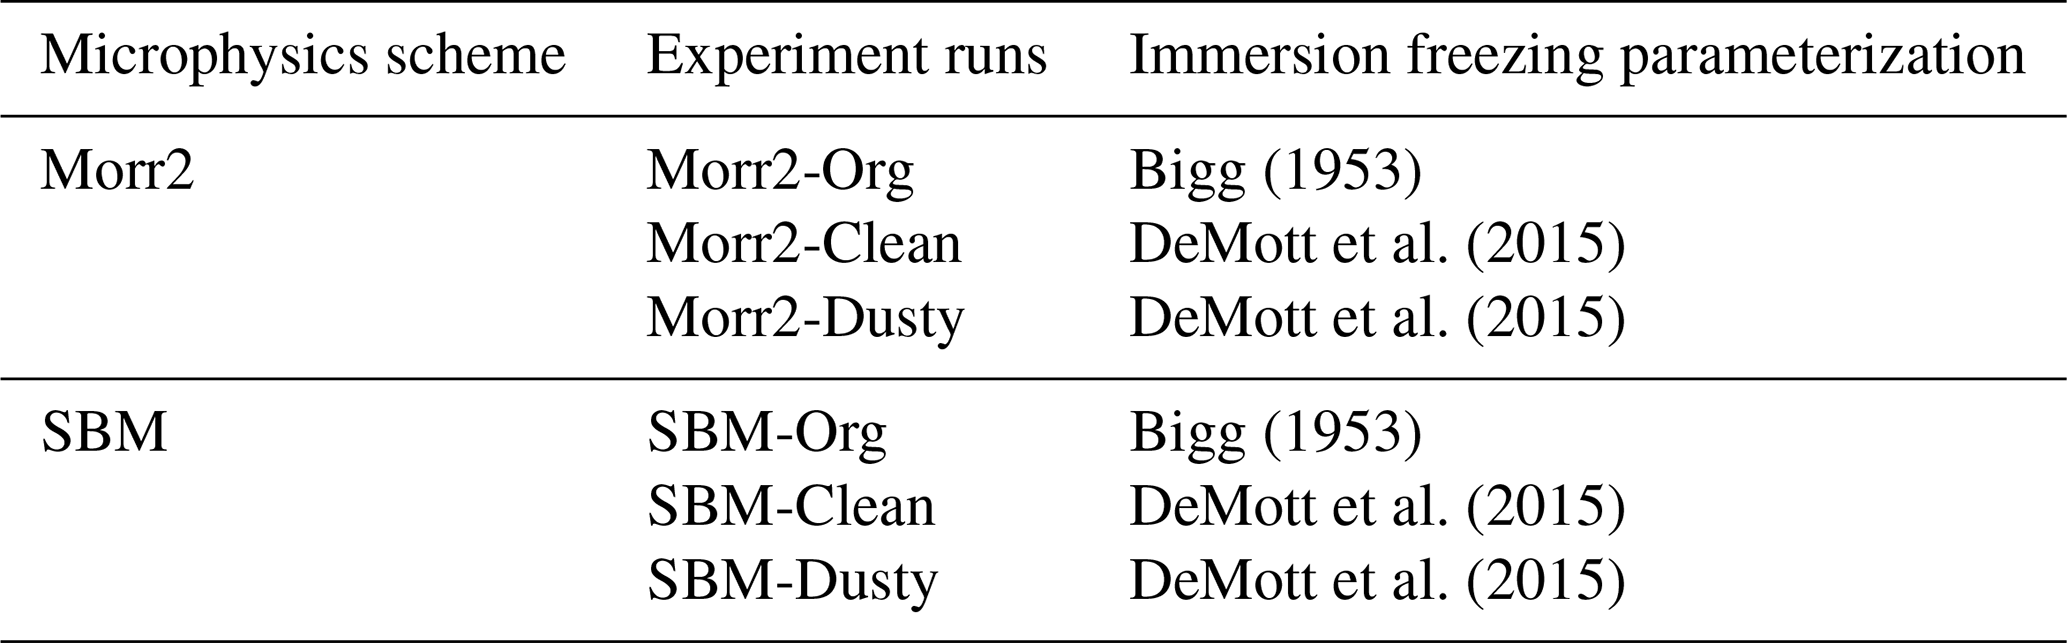
In summertime, the dust number concentration is relatively low over this region remote from dust sources, with the Nd≈ 0.12 cm−3 in the top 10 % of dust events simulated by the GEOS-Chem model (Zhang et al., 2020a). During the selected heavy rainfall event, the atmospheric dust loading over this region is too low to influence the optical properties of the atmosphere (∼ 0.6 cm−3); the direct effects of dust on solar radiation are not considered, and this study focuses on the effects of dust as INPs. To investigate the impacts of dust aerosols on clouds and precipitation, we employed two cloud microphysics parameterizations: the spectral-bin microphysics scheme (SBM; Khain et al., 2004; Fan et al., 2012) and two-moment Morrison microphysics scheme (Morr2; Morrison et al., 2009). This is to evaluate how the effects of dust vary with the two typical types of cloud microphysics parameterizations. Based on the SBM and Morr2 schemes, we designed six sensitivity experiments using different settings of the immersion freezing parameterizations and dust conditions (Table 1). In the control runs (Morr2-Org and SBM-Org), the default Morr2 and SBM schemes in WRF v4.2.0 with the Bigg (1953) immersion freezing parameterization are utilized without considering the effects of dust. In the four dust-related runs (Morr2-Clean and Dusty, SBM-Clean and Dusty), to connect dust with ice nucleation, the immersion freezing parameterization of DeMott et al. (2015) is implemented to replace the original Bigg (1953) immersion freezing in both the SBM and Morr2 microphysics schemes. The Nd vertical profile simulated by the GEOS-Chem-APM model during this event (7–8 July 2006) is used in the Morr2-Dusty and SBM-Dusty runs, to represent the Nd condition of this dust event (red dots in Fig. 1c); and for comparison to investigate the effects of dust, the long-term mean Nd profile averaged in the clean atmosphere (with Nd < the 50th percentile of daily dust number concentrations in July, from 1989 to 2018) is used in the clean runs (Morr2-Clean and SBM-Clean) (blue triangles in Fig. 1c). The vertical profiles of Nd show that during this long-range dust transport event, the dust number concentration increased by about 2 orders of magnitude from the clean atmosphere. This mineral dust transport event occurred at a low altitude (under ∼ 3 km), with no evident impacts on Nd at the upper level (above ∼ 6 km). Following Fan et al. (2014), the horizontal and vertical transports of dust are driven by WRF dynamic and ice formation through immersion freezing acting as the sink of dust and liquid droplets. Rainout and dry deposition of dust are not considered in this study. Here, only the immersion freezing is modified to depend on dust aerosol concentrations, while other ice formation processes (homogeneous, deposition freezing, etc.) remain unmodified as in the default SBM and Morr2 microphysics schemes in WRF v4.2.
To validate the dust simulated by the GEOS-Chem-APM model, the MERRA-2 dust mixing ratio reanalysis is used to qualitatively compare with the dust simulation. Figure 1a shows the time series of the GEOS-Chem-APM dust number concentration (dashed red line) and dust mixing ratio (solid red line) simulations and MERRA-2 dust mixing ratio reanalysis (blue line) in July 2006. The comparison shows that the time series of the GEOS-Chem dust simulation is generally consistent with the MERRA-2 reanalysis, predicting a strong dust signal from 7–11 July 2006 during the selected severe precipitation event. The vertical distribution of Nd from the GEOS-Chem-APM is also consistent with that of the MERRA-2 reanalysis (Fig. S1 in the Supplement), with the highest dust loading at ∼ 1 km and decreasing with altitude. Overall, the GEOS-Chem-APM model captures the occurrence and vertical distribution of this dust event, and the dust profile used in the dusty runs is reasonable to represent the actual dust conditions of this case.
2.2.2 Supersaturation-based condensation
Previous studies indicate that the saturation adjustment approach for condensation and evaporation in the Morr2 microphysics scheme influences the simulations of the invigoration effects of aerosols on the deep convective clouds (Lebo and Seinfeld, 2011; Lebo et al., 2012; Wang et al., 2013; Khain et al., 2005; Zhang et al., 2021). To figure out the potential influences of the saturation adjustment on the dust–cloud interaction in this case, we modified the Morr2 scheme by replacing the saturation adjustment assumption with the explicit calculation of condensation and evaporation based on supersaturation. Following Lebo and Seinfeld (2011), the change of the water vapor surplus within each time step as a result of phase changes based on the microphysical forcing is expressed as
where , qv is the water vapor mixing ratio, and qv,s is the saturation water vapor mixing ratio. C is a function of temperature (T), pressure (P), droplet mass (qc), and number concentrations (nc), with details given in Pruppacher and Klett (1997) and Porz et al. (2018). The supersaturation in Eq. (1) is solved by analytical integration over the time step, and the integrated water vapor surplus change is used to calculate the cloud droplet condensation. The growth equation of qc following Porz et al. (2018) is expressed as
where ρ is the air density, and d is a function of pressure (P) and temperature (T), defined as
where ρw is the density of liquid water, D is the diffusion term depending on T and P, and G is the term of latent heat influence.
Table 2Cases to investigate the influences of the saturation adjustment on the dust–cloud interaction based on the settings of Morr2-Clean and Dusty. The saturation adjustment assumption is replaced by the explicit calculation of the water vapor surplus/condensation (Morr2-ec-Clean and Dusty).
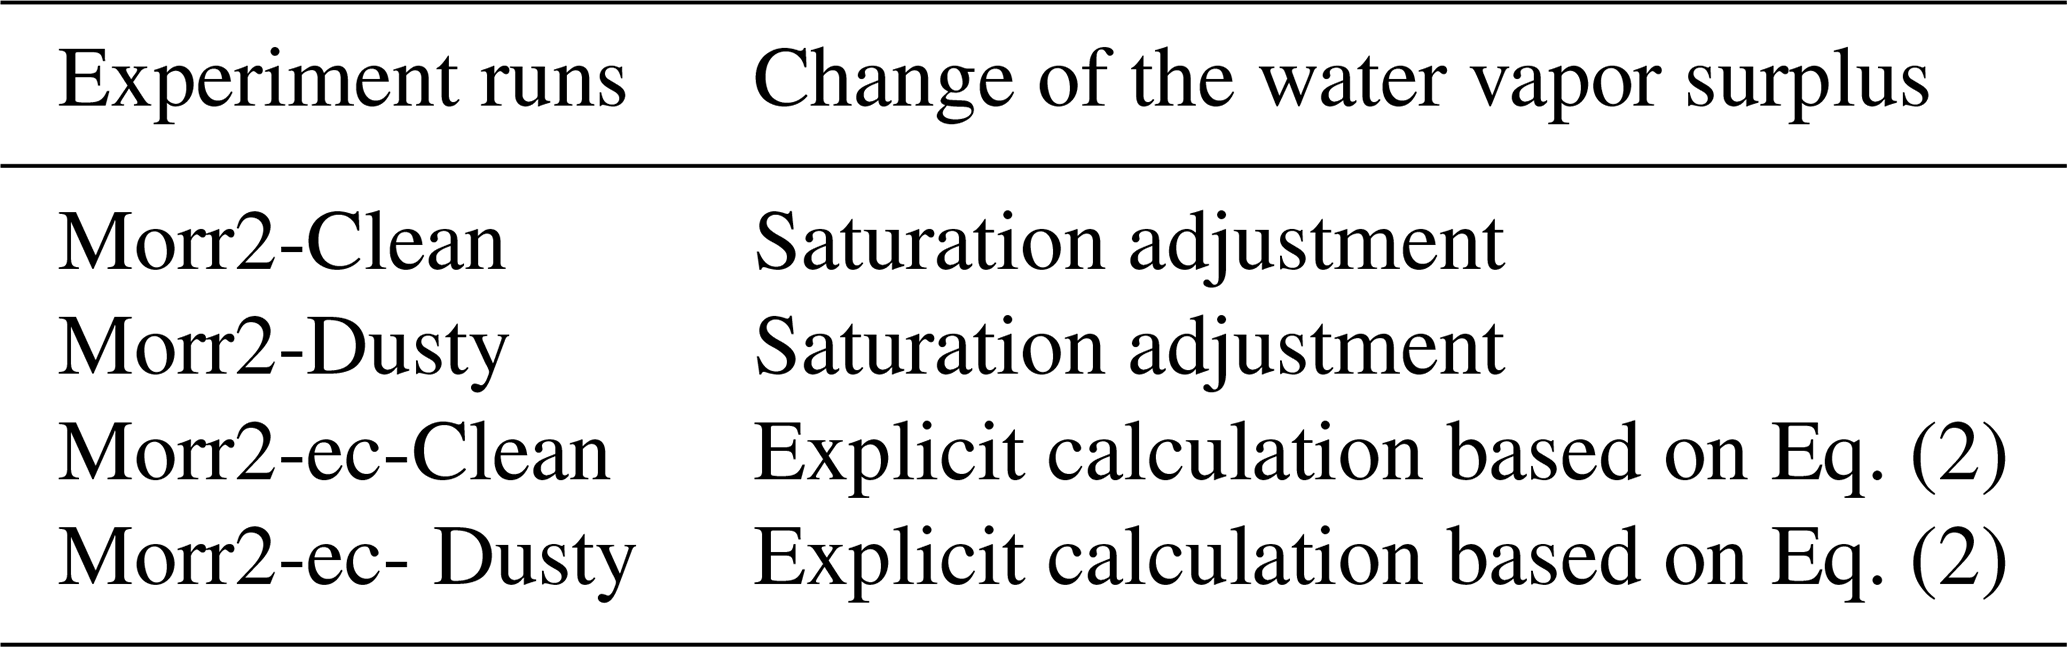
In Morr2-Clean and Morr2-Dusty, Eq. (2) is used to replace the saturation adjustment approach in the Morr2 scheme and integrated analytically over the time step to explicitly calculate condensation/evaporation growth of cloud droplets. These two simulations are referred to as Morr2-ec-Clean and Morr2-ec-Dusty (Table 2), respectively. Due to the constant droplet concentration assumption in the Morr2 scheme, the influences of supersaturation on the cloud condensation nuclei activation are not considered in this study.
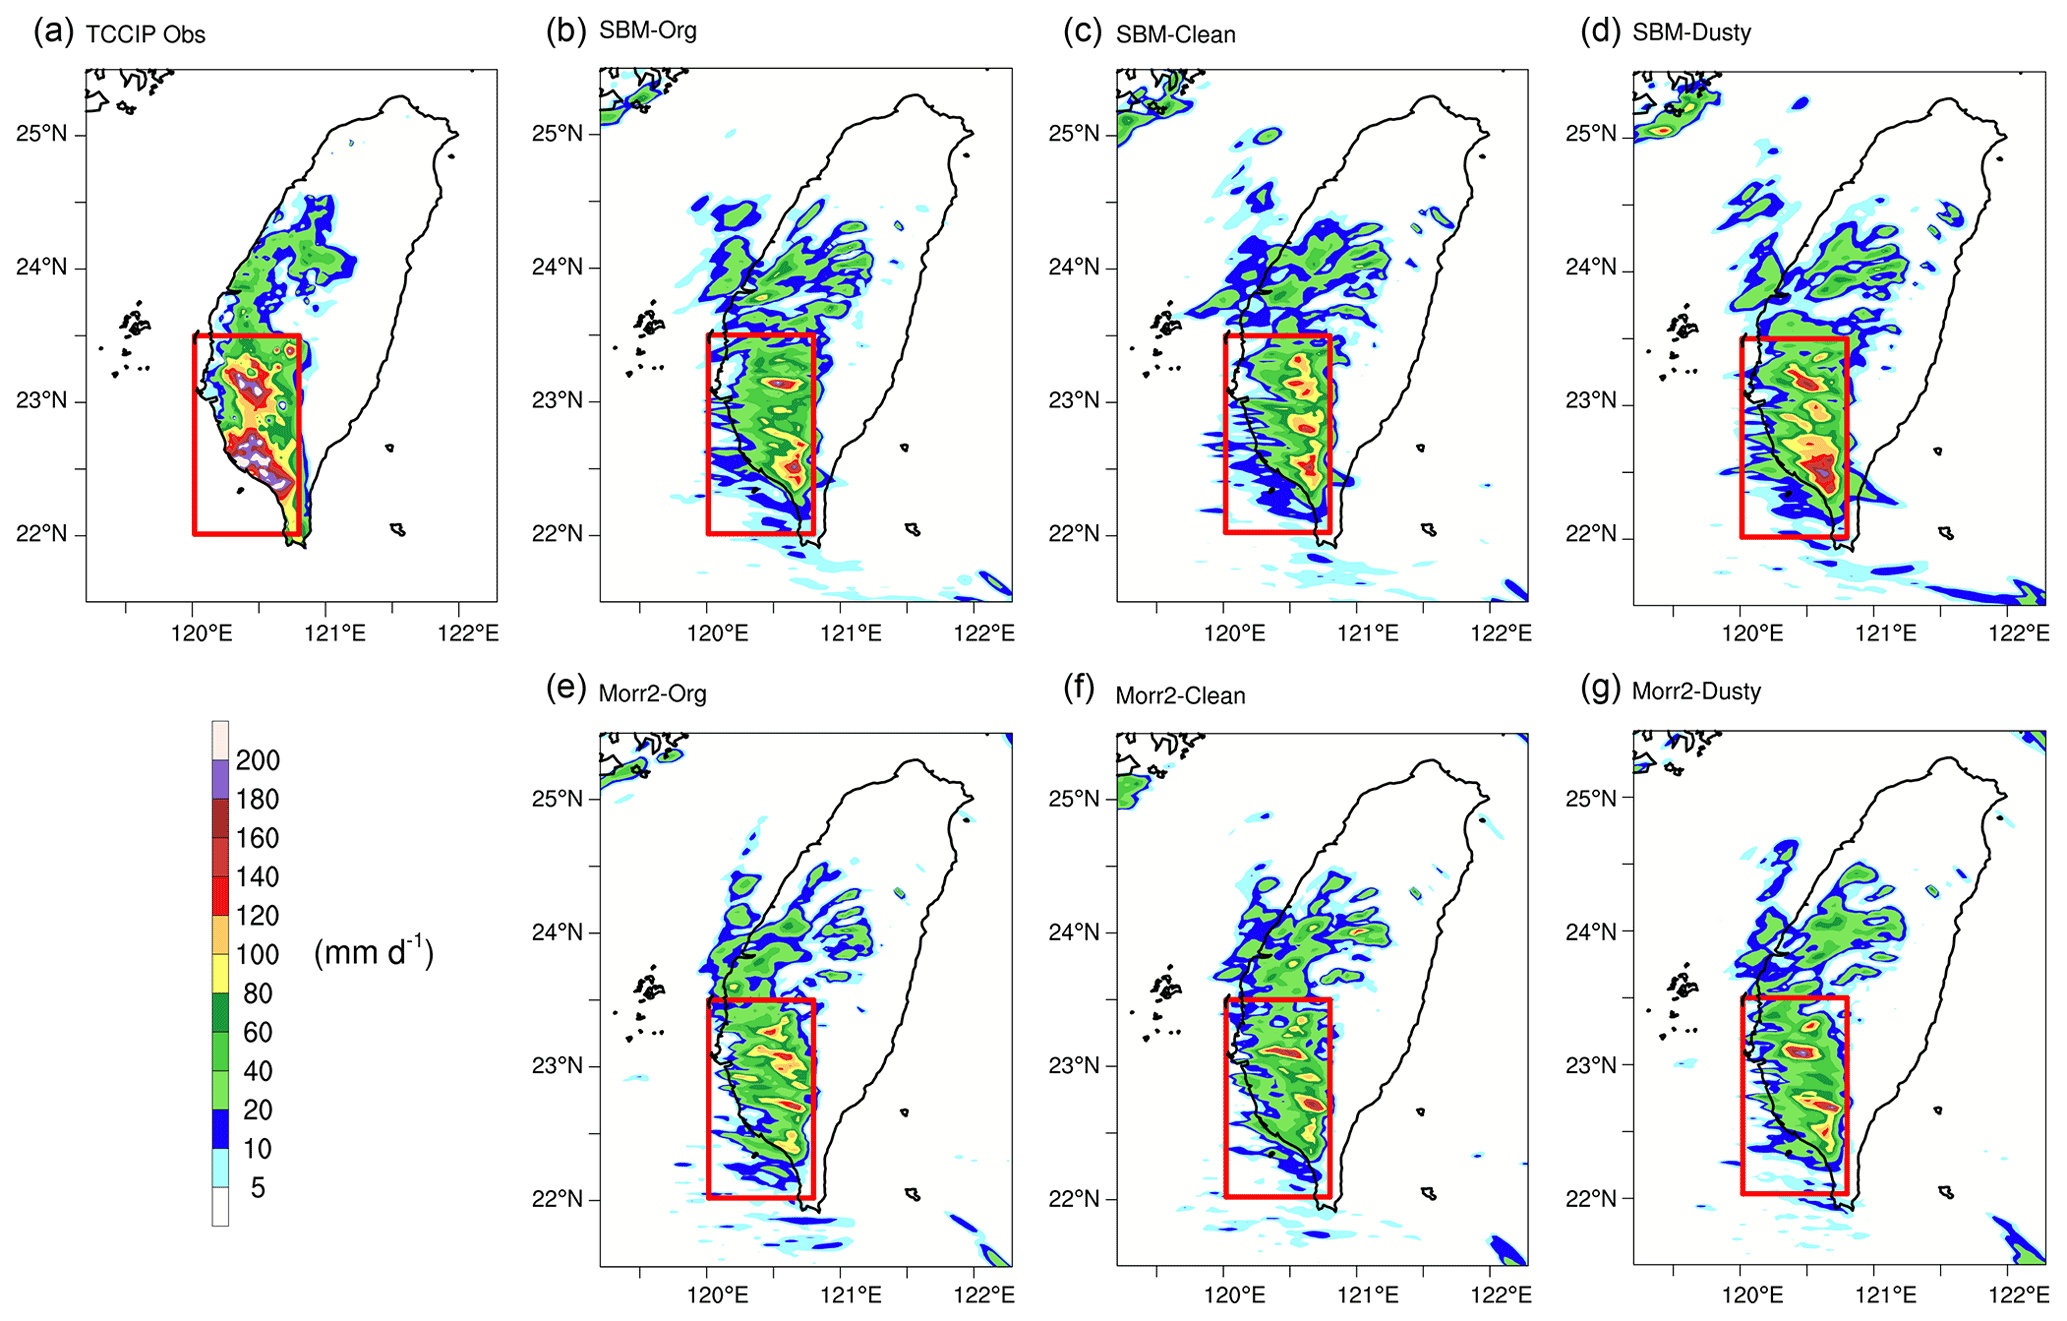
Figure 224 h accumulated precipitation (r24 h) (LT 8 July 2006) observations from (a) TCCIP, and simulations by (b) SBM-Org, (c) SBM-Clean, (d) SBM-Dusty, (e) Morr2-Org, (f) Morr2-Clean, and (g) Morr2-Dusty. The heavy precipitation is mainly located in the area marked by the red box (High-Pcp).
3.1 Simulated effects of dust on precipitation
In order to investigate the influences of dust aerosols on clouds and precipitation, the simulation results of the six runs are compared and evaluated with available observations and reanalysis. Figure 2a shows the 24 h accumulated precipitation (r24 h) from 00:00 to 23:00 LT on 8 July from the TCCIP observation system. The observation shows that the rain band is located along the west coast of Taiwan, and two precipitation centers are located at ∼ 23.25∘ N, 120.5∘ E and ∼ 22.5∘ N, 120.5∘ E, respectively, with a heavy rainfall amount larger than 220 mm d−1. Overall, the six model runs capture the spatial pattern of the observed precipitation on the windward slope of the mountainous region, consistent with the observation. However, distributions of the rainfall centers simulated by the SBM-Clean (Fig. 2c) and Morr2-Org (Fig. 2e) runs mismatch with the rainfall measurement. SBM-Org (Fig. 2b), SBM-Dusty (Fig. 2d), Morr2-Clean (Fig. 2f), and Morr2-Dusty (Fig. 2g) generally capture the observed double-center rainfall distribution. From Morr2-Clean to Morr2-Dusty, r24 h averaged over all rainfall grids (r24 h > 1 mm d−1) and the strong precipitation grids (top 10th percentiles of the r24 h, 90th to 100th) in the heavy precipitation area (High-Pcp) marked by the red box increased by around 10 % (36 to 40 mm d−1) and 15 % (122 to 140 mm d−1), respectively. From SBM-Clean to SBM-Dusty, r24 h averaged over all rainfall grids and the strong precipitation grids in the High-Pcp area increased by about 18 % (44 to 52 mm d−1) and 20 % (128 to 153 mm d−1), respectively. These results illustrate that both the bulk and bin schemes predict the stronger accumulated precipitations with the effect of dust considered, and the SBM scheme simulates the observed precipitation pattern and intensity better compared to the Morr2 scheme. Nevertheless, the WRF model underpredicts the intensity of the rainfall centers in all six runs to differing degrees. Among them, SBM-Dusty simulates the highest rainfall amount with ∼ 200 mm d−1 in the precipitation centers, which is still weaker than the observation. Some factors could lead to this underestimation predicted by the WRF runs. One of the possible reasons is that the contributions of other natural and anthropogenic aerosols to CCN and INPs are not considered in the Morr2 or SBM schemes in this numerical study, and another factor could be the relatively coarse resolution (3 km), which cannot resolve the orographically forcing and mountain–valley circulation well.
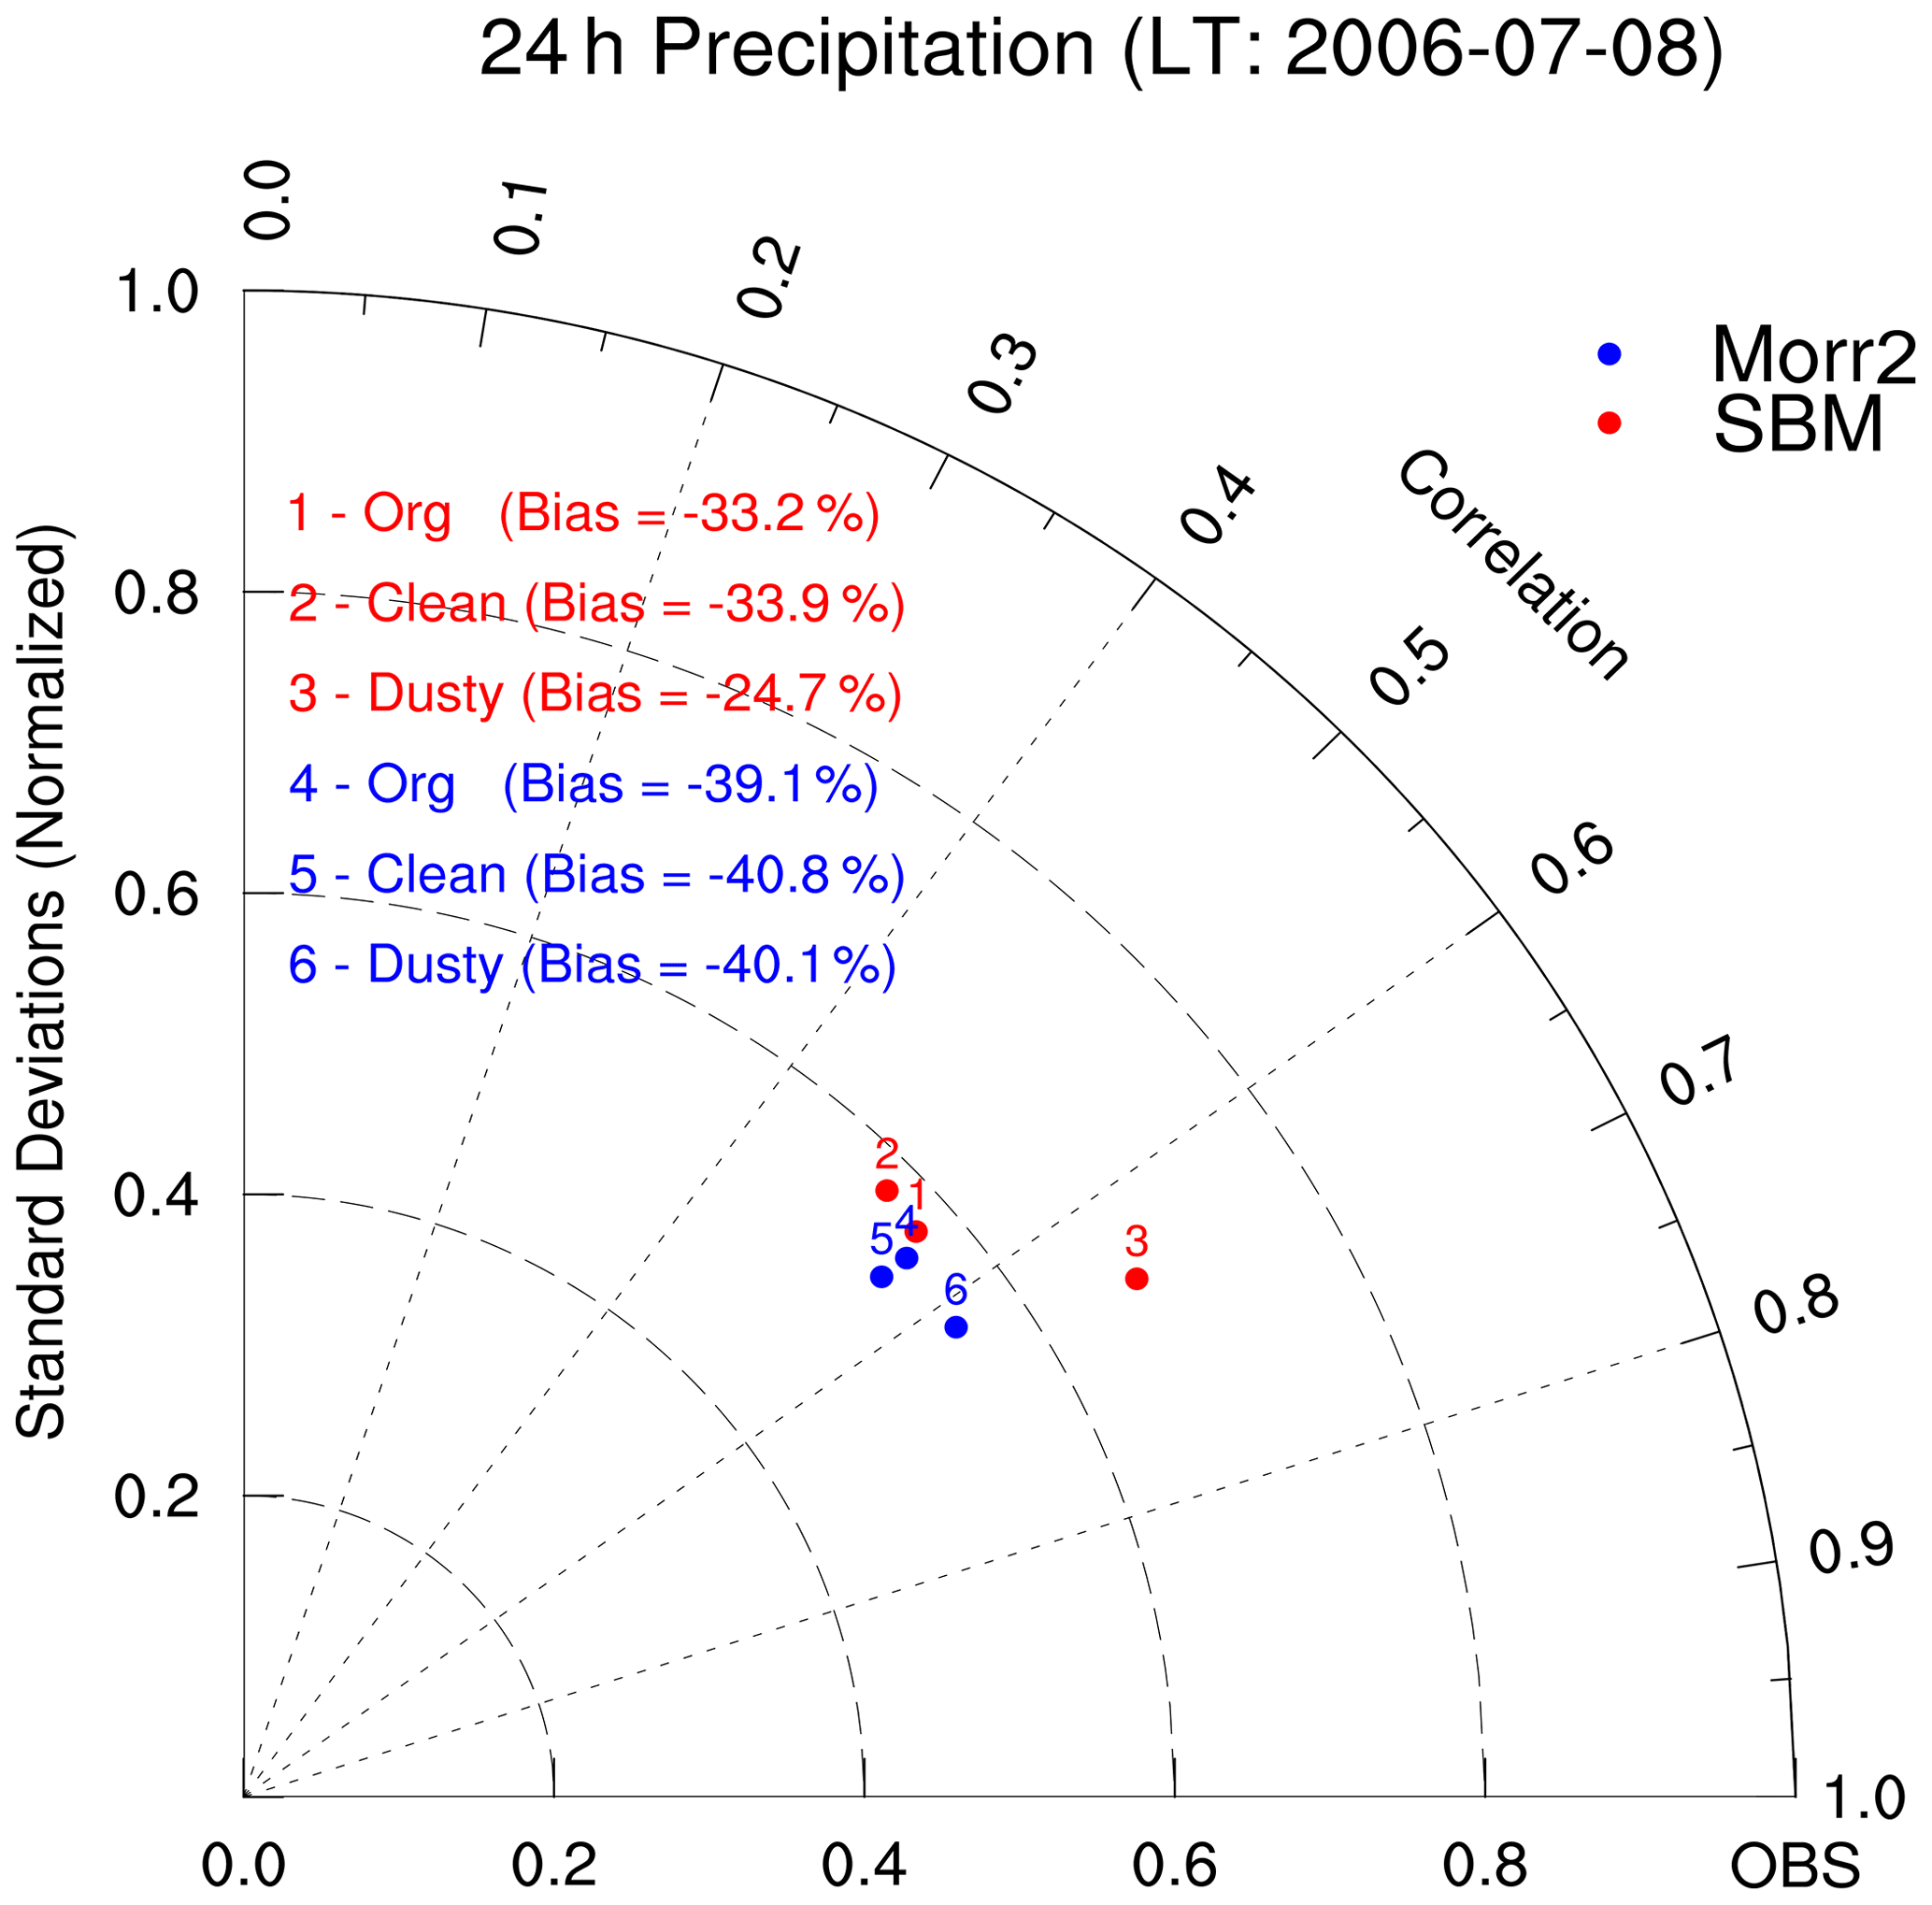
Figure 3Taylor diagram showing spatial correlations coefficients (r), standard deviations (SDs), and bias (%) between simulations by the six numerical runs and the observation of the 24 h accumulated precipitation.
To quantitatively exhibit the difference among the six runs, the Taylor diagram (Fig. 3) is used to evaluate the simulations of the 24 h accumulated precipitation. Dusty runs simulate improved precipitation patterns compared to the control and clean runs, with spatial correlation coefficients (r) improved from ∼ 0.56 to 0.62 and from ∼ 0.55 to 0.66 with Morr2 and SBM schemes, respectively. SBM-Dusty simulates stronger precipitation more consistent with the observation, with normalized standard deviation increased from ∼ 0.58 to 0.67 and normalized bias decreased from ∼ −33 % to −24.7 %, respectively. Although Morr2-Dusty predicts a better rainfall pattern than the control and clean runs, its simulation of the 24 h accumulated precipitation amount shows no apparent improvement.
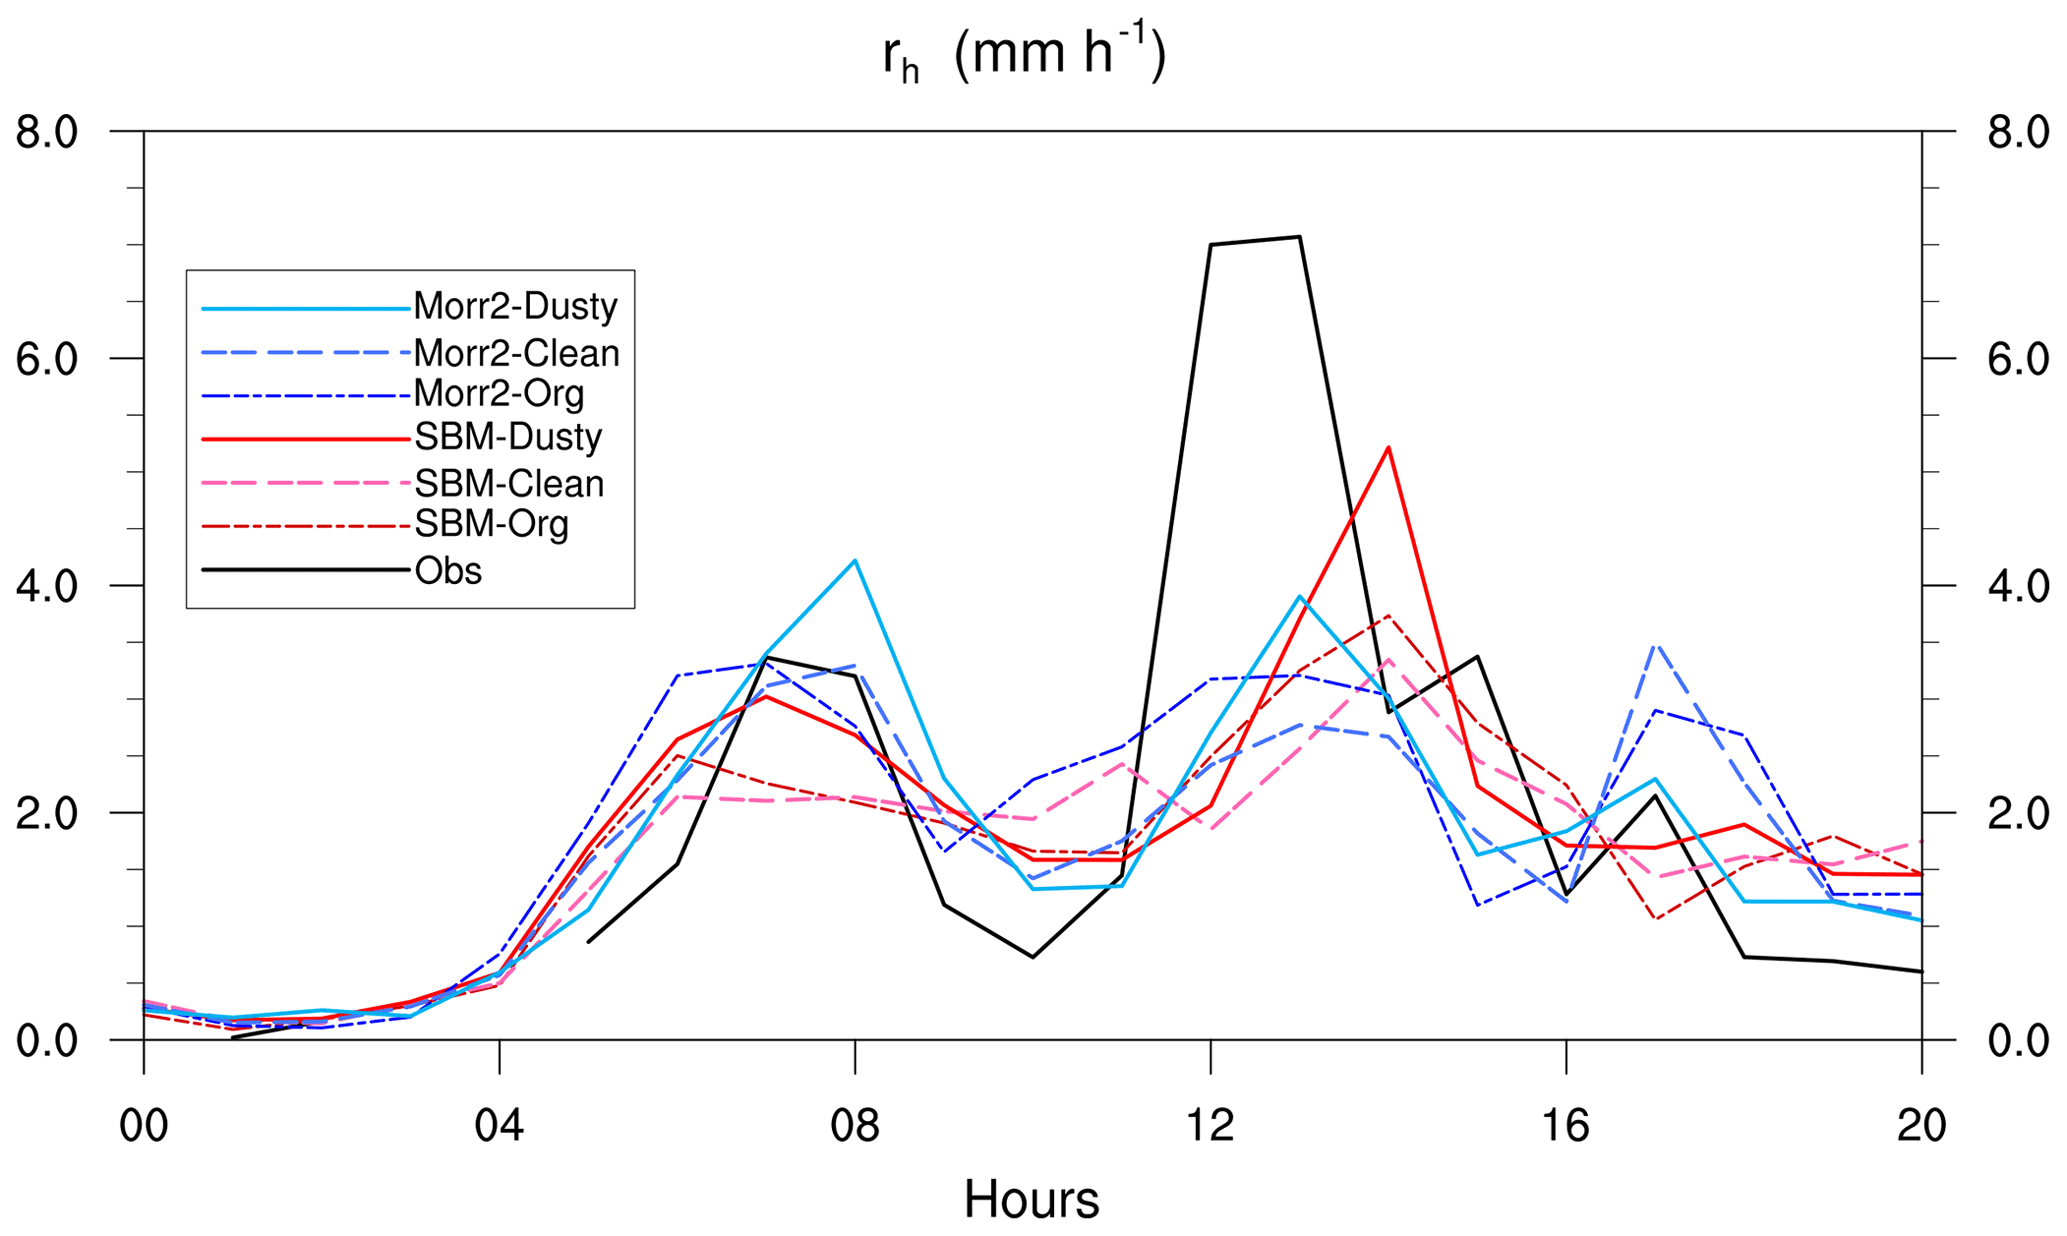
Figure 4Hourly rainfall rates from IMERG observation (black line) and six numerical runs (colored lines) (00:00–20:00 LT, 8 July 2006), averaged among rainfall grids (> 0 mm h−1) in the High-Pcp area.
As shown in Fig. 2, the strong precipitation, based on observation and simulations, is mainly located in the High-Pcp area, which is selected to investigate the precipitation and cloud properties in detail. The hourly rain rates (rh) by the six runs and the IMERG half-hourly observation are averaged among the precipitation grids (rh > 0 mm h−1). The 24 h accumulated precipitation from IMERG is given in Fig. S2 in the Supplement, with the intensity and distribution consistent with the rain gauge–radar observation from TCCIP (Fig. 2a). In Fig. 4, the observed hourly rain rate (black line) shows two peaks; the weaker one occurred in the morning (LT 06:00–10:00) (P1, maximum rh = 3.5 mm h−1) and the stronger one in the afternoon (LT 11:00–15:00) (P2, maximum rh = 7.1 mm h−1). The observed bimodal distribution is generally captured by all six runs. However, the simulated rain rate intensities are generally weaker than the observation, especially during the P2 period. With both the Morr2 and SBM schemes, the dusty runs show stronger rain rate intensities at the two peak times. During the period of P1, the maximum rh simulated by SBM-Dusty is 3.1 mm h−1, about 45 % stronger than SBM-Org and Clean runs; during the P2 period, SBM-Dusty simulates maximum rh = 5.2 mm h−1, about 38 % and 55 % stronger than SBM-Org and Clean runs, respectively. SBM-Dusty also captures the observed precipitation evolution, which is a weaker rainfall intensity of P1 compared with P2. During the P1 period, the maximum rain rate simulated by Morr2-Dusty is 4.2 mm h−1, about 24 % stronger than Morr2-Org and Morr2-Clean runs. During the P2 period, Morr2-Dusty simulates maximum rh = 4.0 mm h−1, about 18 % and 42 % stronger than Morr2-Org and Morr2-Clean runs. It is notable that Morr2-Org and Morr2-Clean dramatically overestimated the precipitation from 16:00 to 20:00 LT compared to the observation, and the false signal is reduced when the effect of dust is considered (Morr2-Dusty). Although the total rainfall volumes simulated among the Morr2 runs are similar (Fig. 3), Morr2-Dusty predicts an improved precipitation development compared to the control and clean runs, with maximum rain rates closer to the observation. Morr2-Dusty still simulates a stronger rainfall intensity of P1 than P2, mismatching the observed precipitation evolution.
Therefore, connecting dust aerosols with ice nucleation improves the predicted intensity, distribution, and development of precipitation with both the bulk and bin schemes. In this case, the result also suggests that the SBM scheme outperforms Morr2 in simulating the rainfall intensity, distribution, and temporal evolution. The effects of dust (dusty vs. clean) increase the rainfall intensities in the heavy precipitation area and periods, and SBM simulated a stronger effect of dust than Morr2.
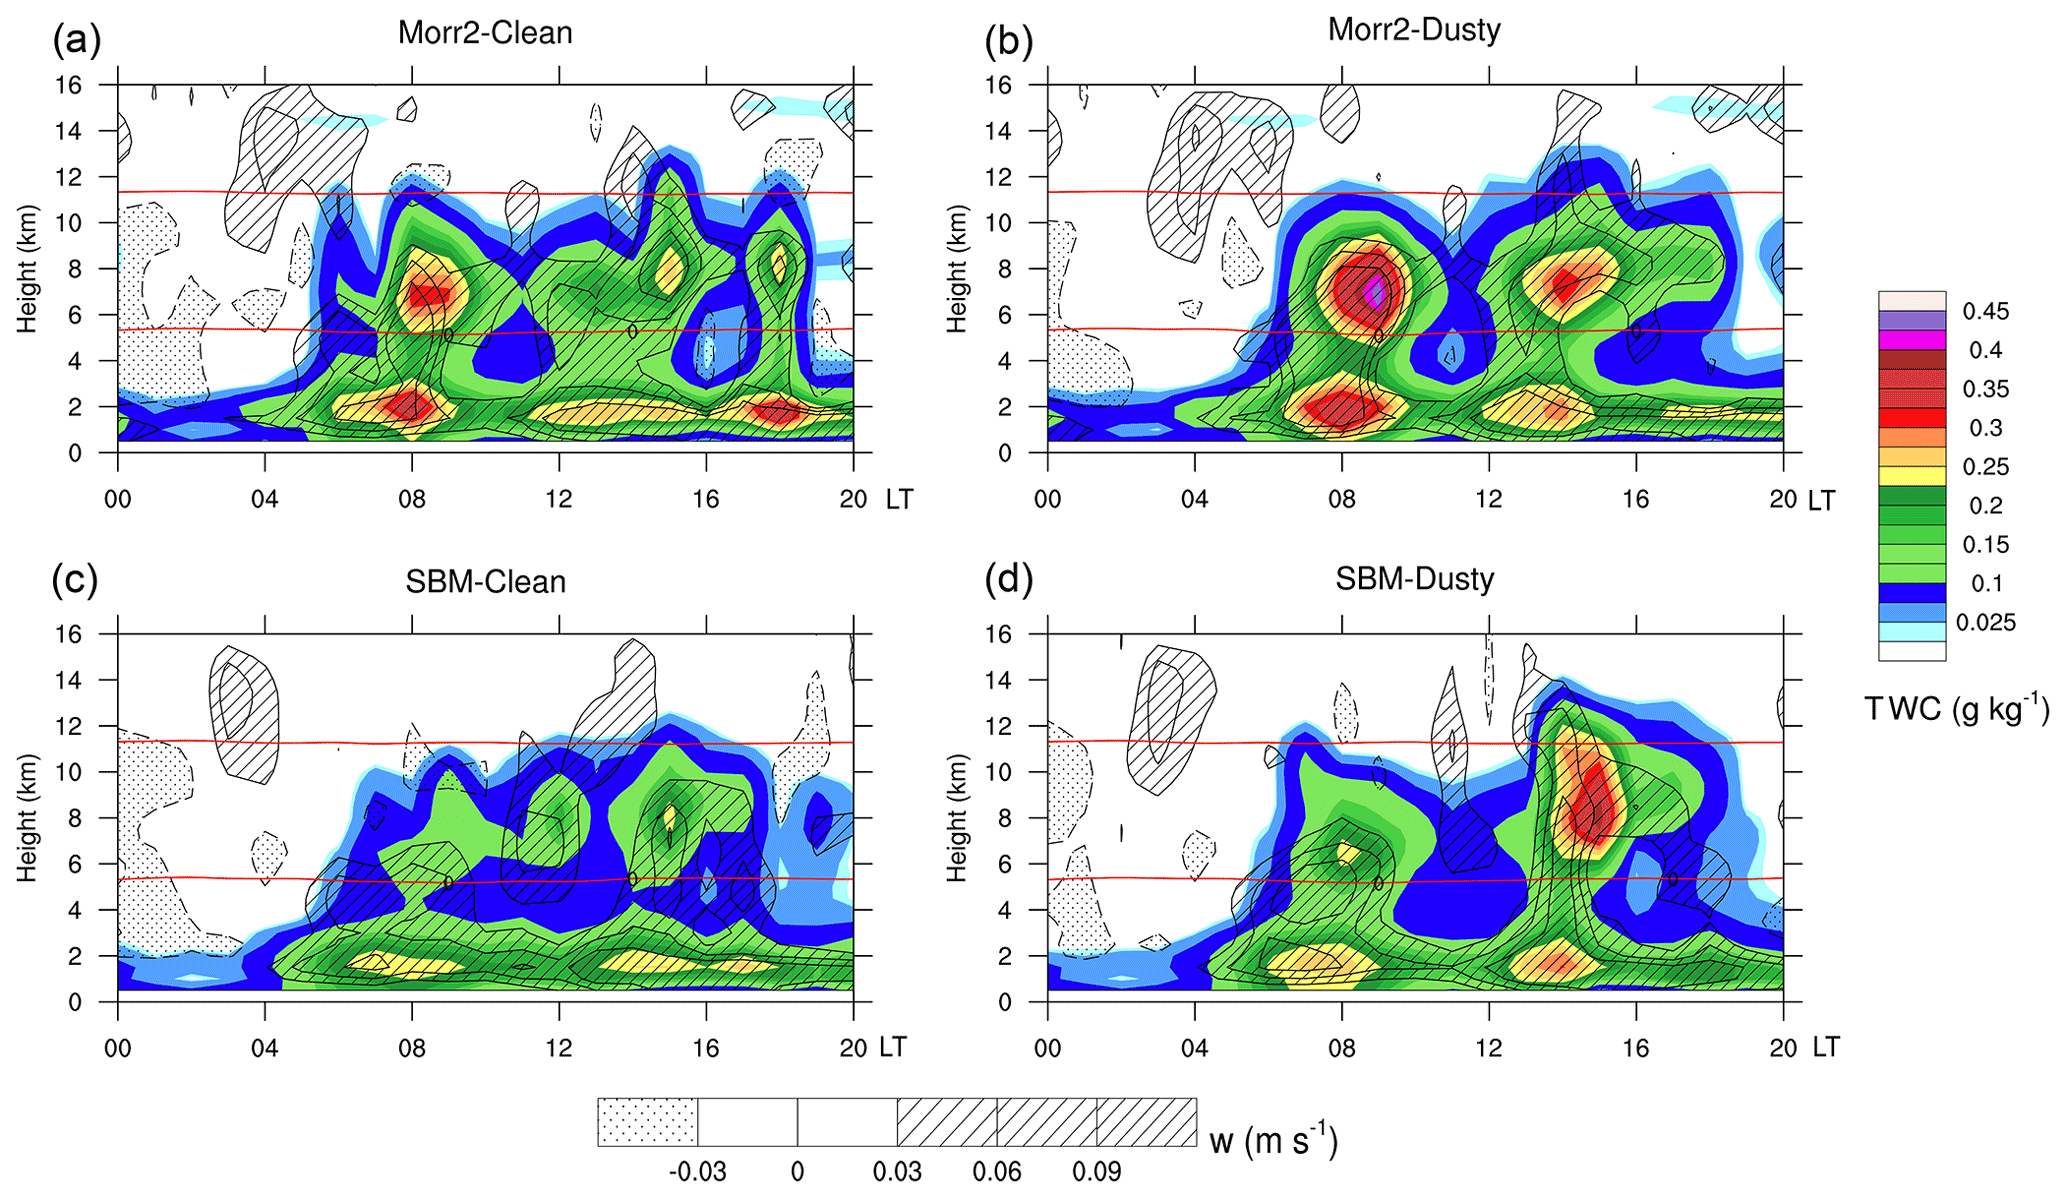
Figure 5(a–d) Time series of total water content (TWC; shaded) and vertical velocity (contours) averaged among rainfall grids (> 0 mm h−1) in the High-Pcp area for model simulations of Morr2-Clean, Morr2-Dusty, SBM-Clean, and SBM-Dusty, respectively. The two red lines denote the temperature of 0 and −38 ∘C.
3.2 Dust impacts on cloud properties
We further investigate the effects of dust on the cloud evolution by investigating the time series of the total (ice + liquid) water content (TWC). Figure 5a–d show that WRF runs predict the time series of cloud properties with two distinct periods of convection, explaining the temporal distribution of the hourly rain rates in the observation and simulation. The comparisons between clean and dusty runs (Fig. 5a and c vs. Fig. 5b and d) suggest significant impacts of dust on cloud development. In the Morr2-Dusty and SBM-Dusty runs, the high Nd enhances the heterogeneous freezing process (immersion freezing), leading to the increased TWC during the strong convection periods (P1 and P2). From Morr2-Clean to Dusty runs, the maximum ice water content (IWCmax) increased by about 50 % and 35 % during P1 and P2, respectively. From SBM-Clean to Dusty runs, the maximum liquid water content (LWCmax) increased by ∼ 20 % and 30 %, and the IWCmax increased by about 70 % and 60 % during P1 and P2, respectively. Along with the enhanced TWC, the mean cloud top height (CTH) during P2 increases from ∼ 12 to 14 km with Morr2 and SBM schemes, when the long-range transport of dust is considered.
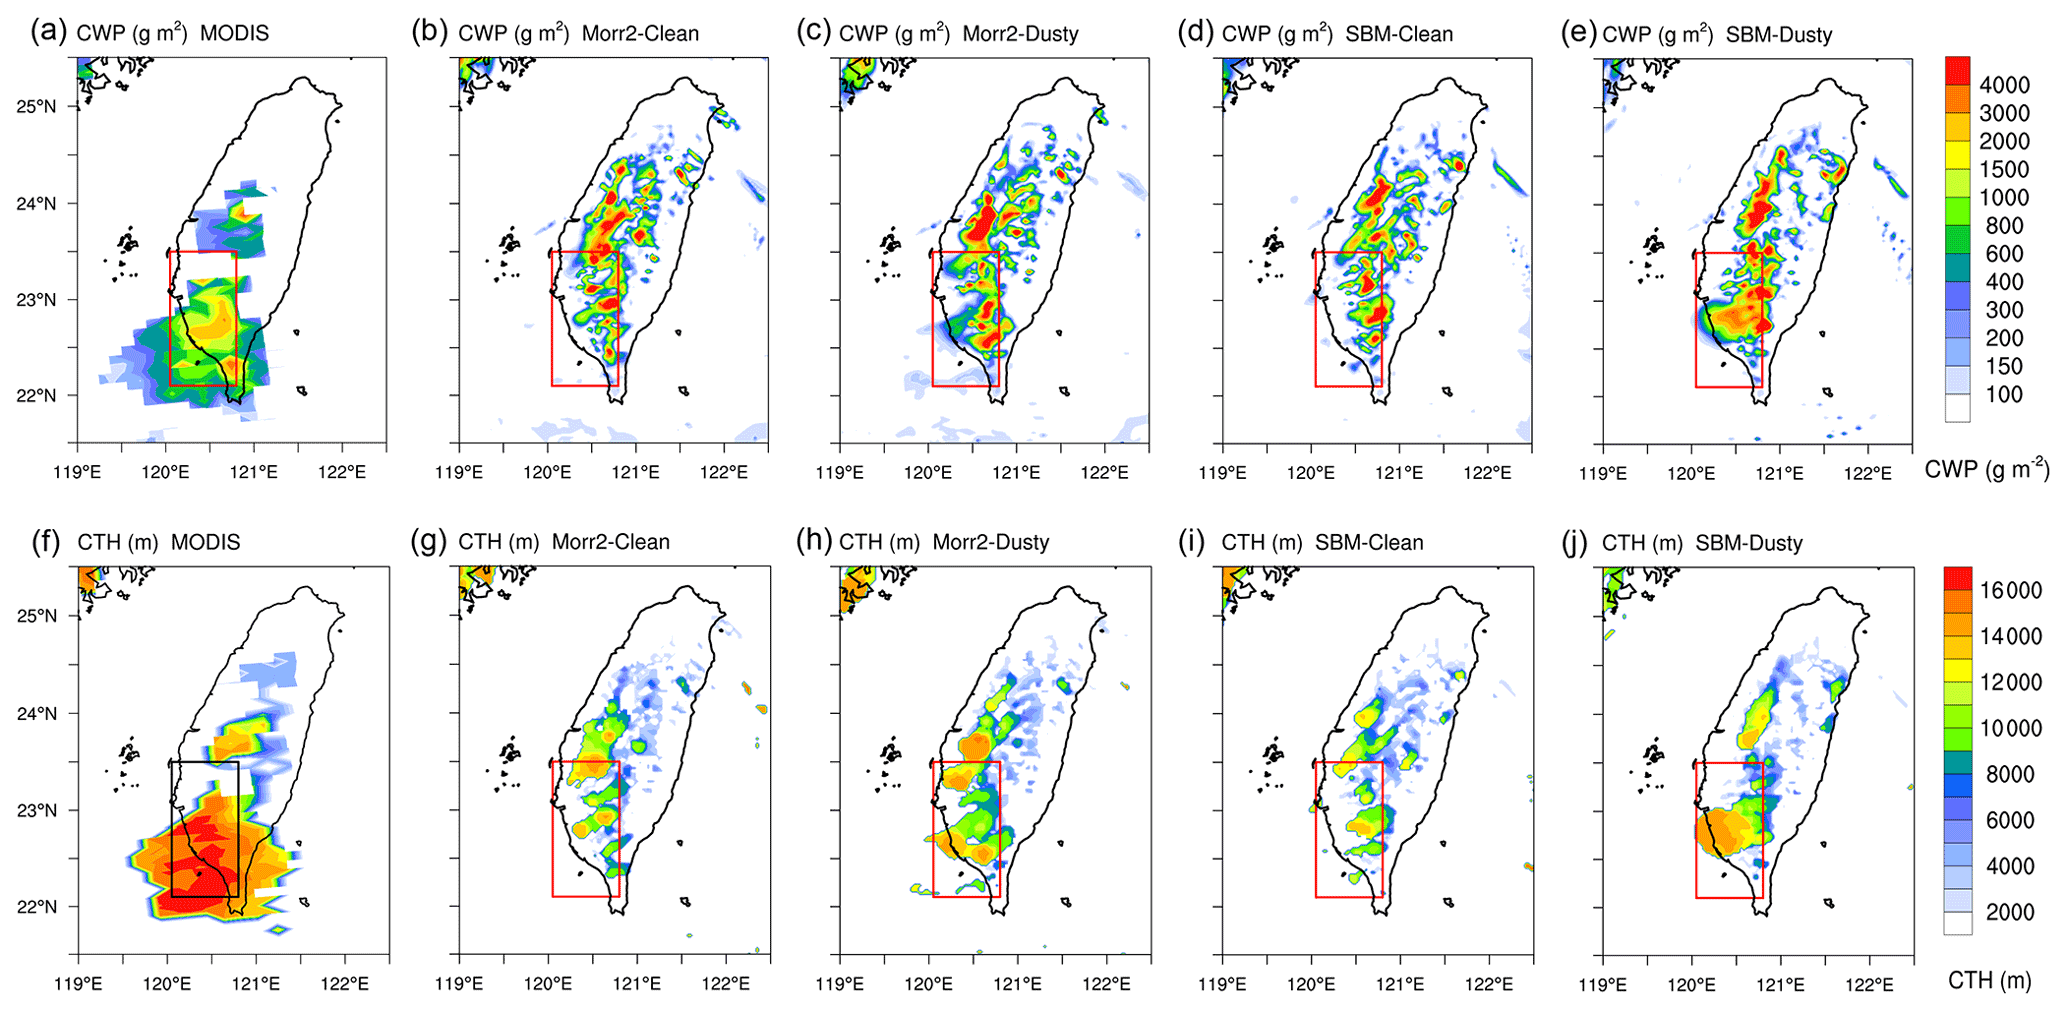
Figure 6The cloud water path (CWP) at 14:00 LT from (a) MODIS observation, (b) Morr2-Clean, (c) Morr2-Dusty, (d) SBM-Clean, and (e) SBM-Dusty simulations. Cloud top height (CTH) on grids with CWP larger than 100 g m−2 from (f) MODIS observation, (g) Morr2-Clean, (h) Morr2-Dusty, (i) SBM-Clean, and (j) SBM-Dusty simulations.
During the strong convective period (P2) with the observed precipitation peak, the MODIS Aqua satellite passed the simulation region at 14:00 LT. To further investigate the effects of dust on the simulated cloud properties, we use the MODIS observations of the cloud water path (CWP, liquid water path + ice water path) and CTH as references to compare with the Morr2 and SBM simulations in clean and dusty conditions. This study concentrates on mixed-phase and convective clouds, and the grid cells are selected with a minimum TWC of 0.05 g kg−1 and minimum CWP of 100 g m−2 (Choi et al., 2010; Huang et al., 2015). MODIS observations (Fig. 6a and f) show that, during P2, the convective cloud is distributed along the mountainous region, especially over the northern part of the island. The observed high values of CWP and CTH along the southwestern coast indicate that the deep convective cloud is concentrated in the key area as given in Fig. 2 (120.2–120.75∘ E, 22.25–23.25∘ N). Now we examine the effects of dust on the convective cloud simulated with the SBM and Morr2 microphysics schemes. In comparison to the MODIS observations, the Morr2 and SBM runs generally capture the cloud distribution over the mountainous region but underestimate the observed cloud coverage and cloud top height (over 15 km). This underestimation could be caused by various factors: one possible reason is that the limitation of the minimum TWC cannot be applied in the MODIS observation to eliminate high-altitude cirrus clouds; also the underprediction of CTH could be related to the relatively coarse model resolution. Comparisons between clean (Fig. 6b and d) and dusty (Fig. 6c and e) runs show that the cloud coverages are enhanced in the key area when the effect of dust is considered. At the same time, Fig. 6g–j show that the effect of dust enhances the CTH from 12 to over 14 km (Fig. 6g and i vs. Fig. 6h and j), more consistent with the MODIS measurement (CTH > 15 km).
During the P2 period, the simulated rain rate, cloud coverage, and CTH are notably enhanced due to the effects of dust. The change of these cloud properties can be caused by both convective invigoration and the microphysics effect (Futyan and Del Genio, 2007; Fan et al., 2013; Gibbons et al., 2018). Thus, we focus on the strong convective period P2 to further study the effects of dust on cloud properties in detail.
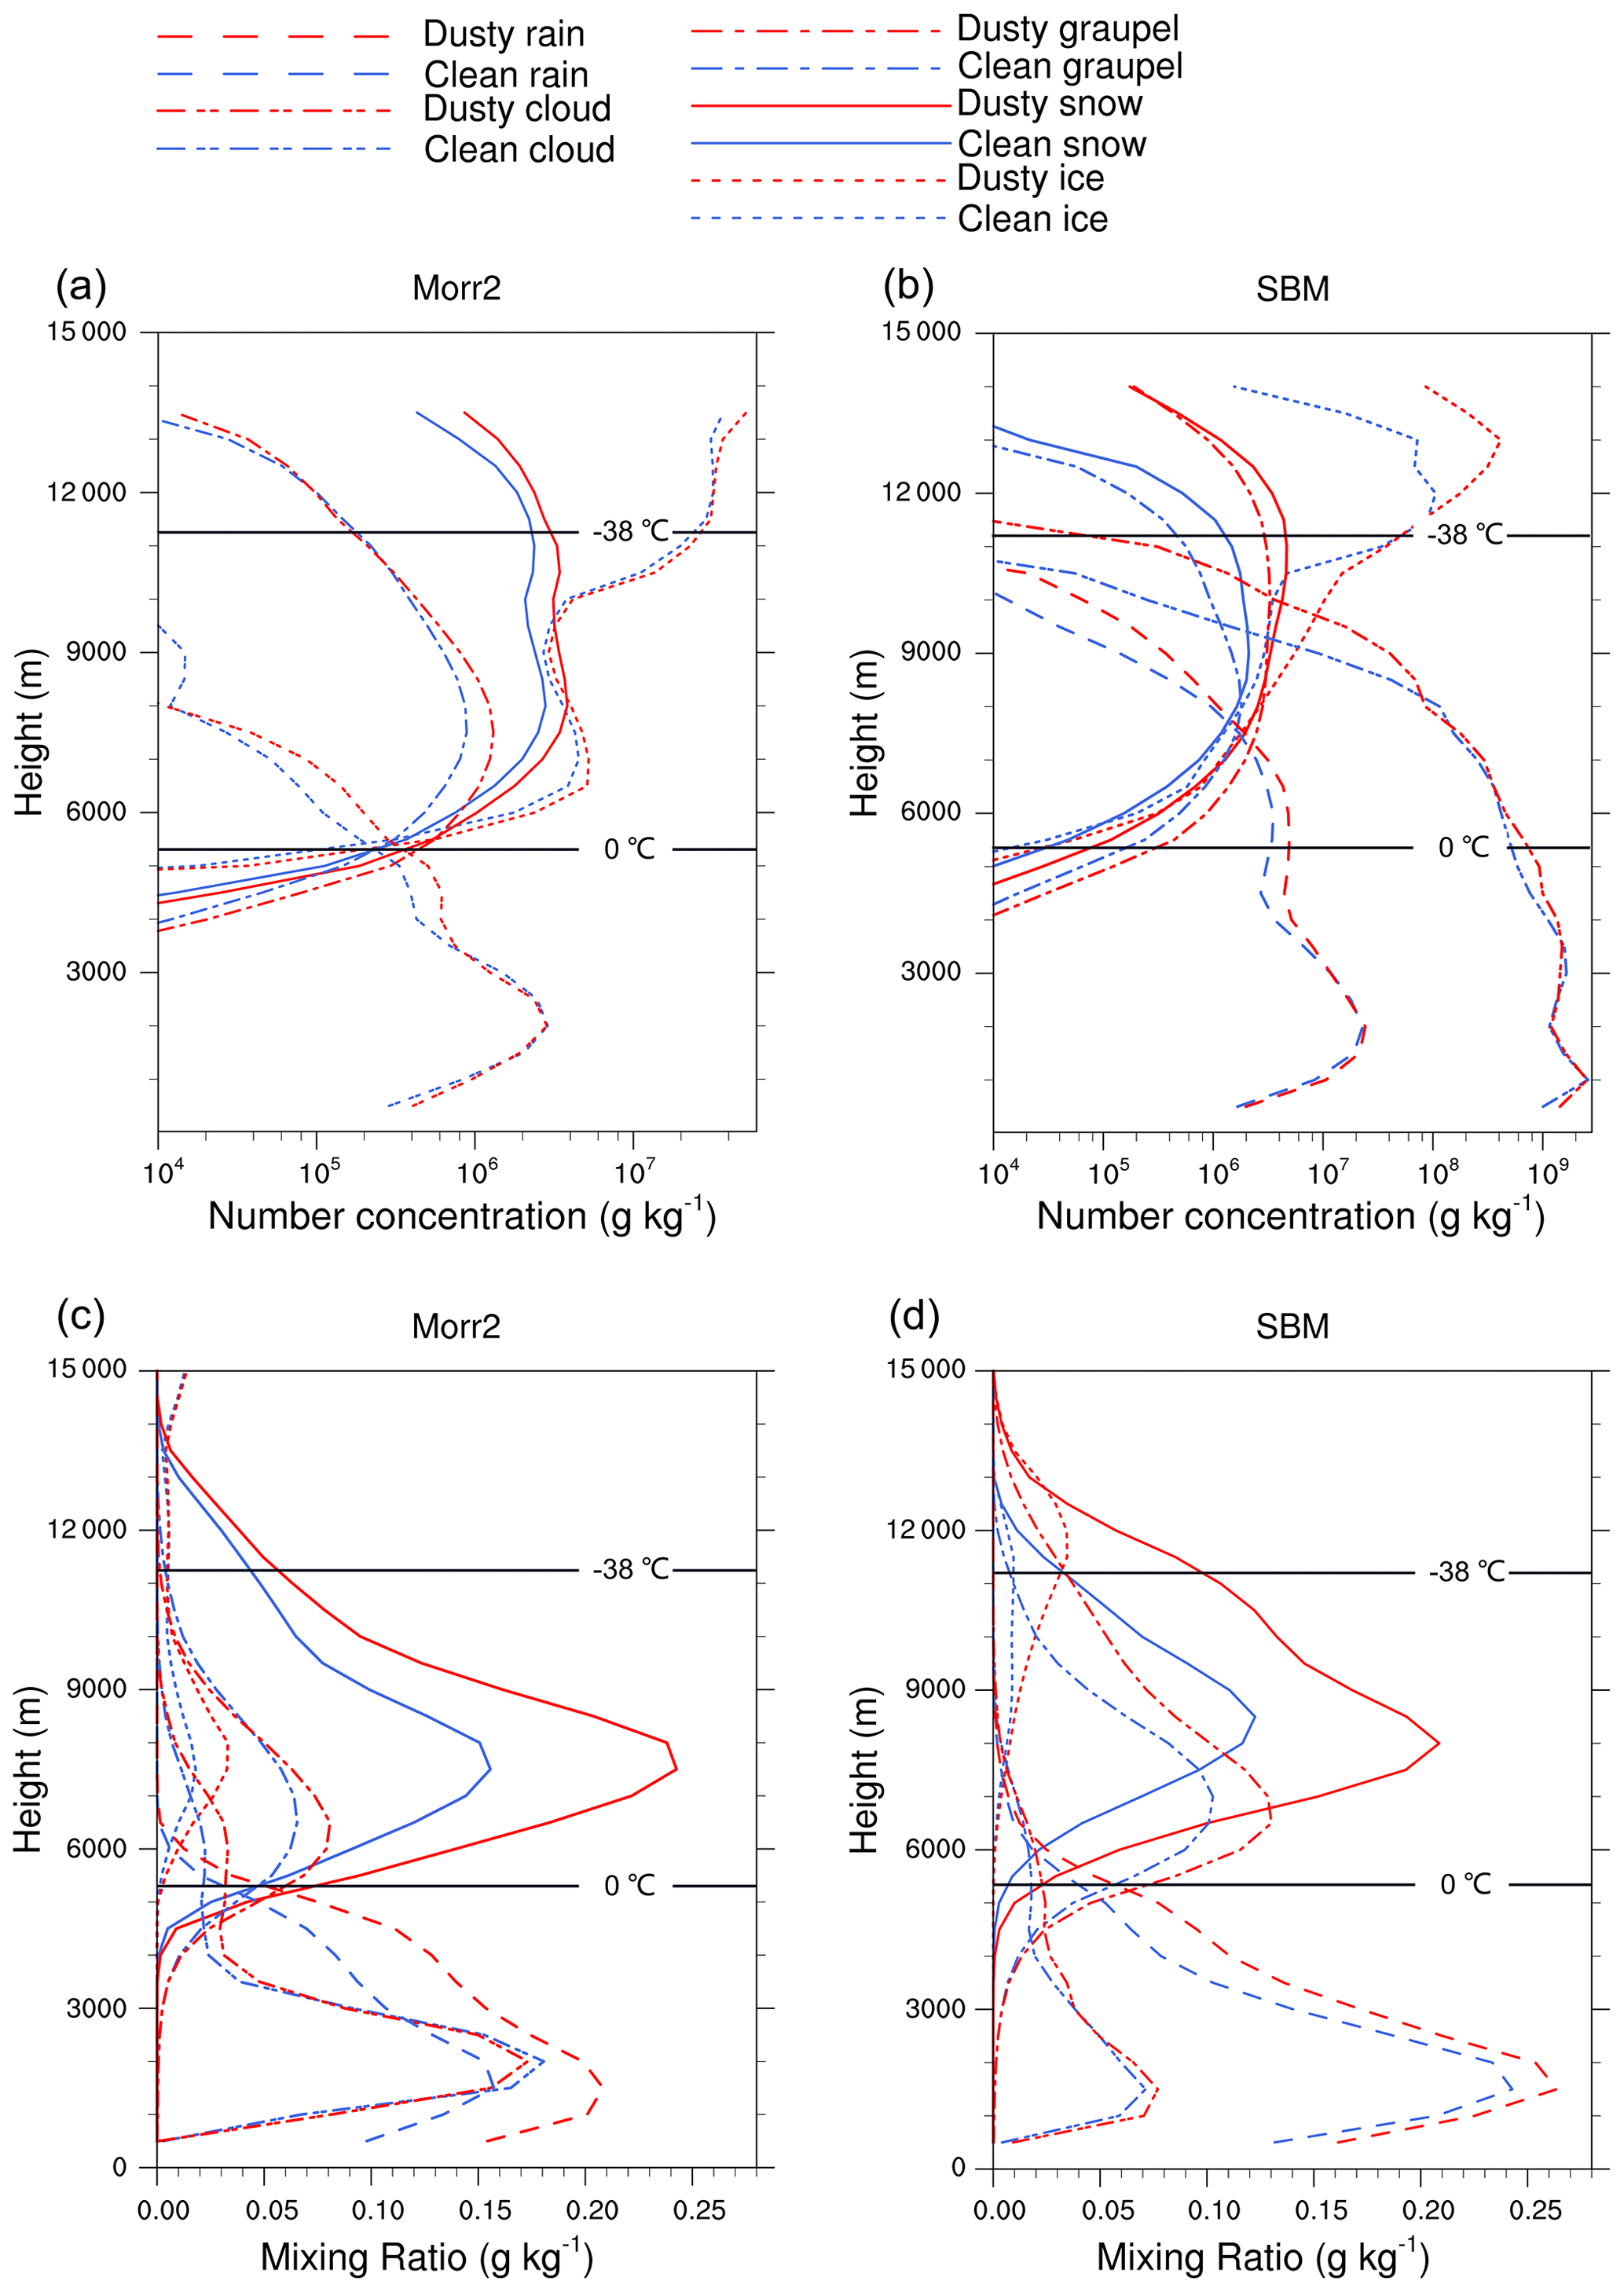
Figure 7Vertical profiles of number concentrations of cloud hydrometers averaged among precipitation grids in the High-Pcp area from 11:00–15:00 LT simulated by (a) Morr2-Clean (blue lines) and Dusty (red lines), and (b) SBM-Clean (blue lines) and Dusty (red lines) runs. Similar time–space-averaged vertical profiles of hydrometeor mass mixing ratios by (c) Morr2-Clean (blue lines) and Dusty (red lines) and (d) SBM-Clean (blue lines) and Dusty (red lines).
In this numerical study, mineral dust is directly connected with the cloud ice/snow particle formation through the immersion freezing process. The changes of the hydrometeor species are analyzed to exhibit the dust microphysical effects in detail. Figure 7 shows vertical profiles of the number concentration and mixing ratio of hydrometeor particles averaged among the rainfall grids (> 0 mm h−1) in the High-Pcp area in the P2 period. In Fig. 7 the Morr2 and SBM schemes simulate similar vertical distributions of cloud hydrometeors, with the largest IWC and LWC appearing at ∼ 8 and under 3 km, respectively. Comparisons between clean and dusty runs (Fig. 7 blue vs. red) show notable effects of dust in the mixed-phase layer (∼ 5–11 km). With both the Morr2 and SBM schemes, dust aerosol remarkably enhances the formation of snow particles in the mixed-phase layer, with the snow number concentration about doubled and snow mixing ratios increased by ∼ 60 %–70 % at ∼ 8 km altitude. From clean to dusty conditions, the increase in snow particles causes stronger riming and collision–coalescence processes, leading to the increased number and mass mixing ratios of graupel in both Morr2 and SBM runs.
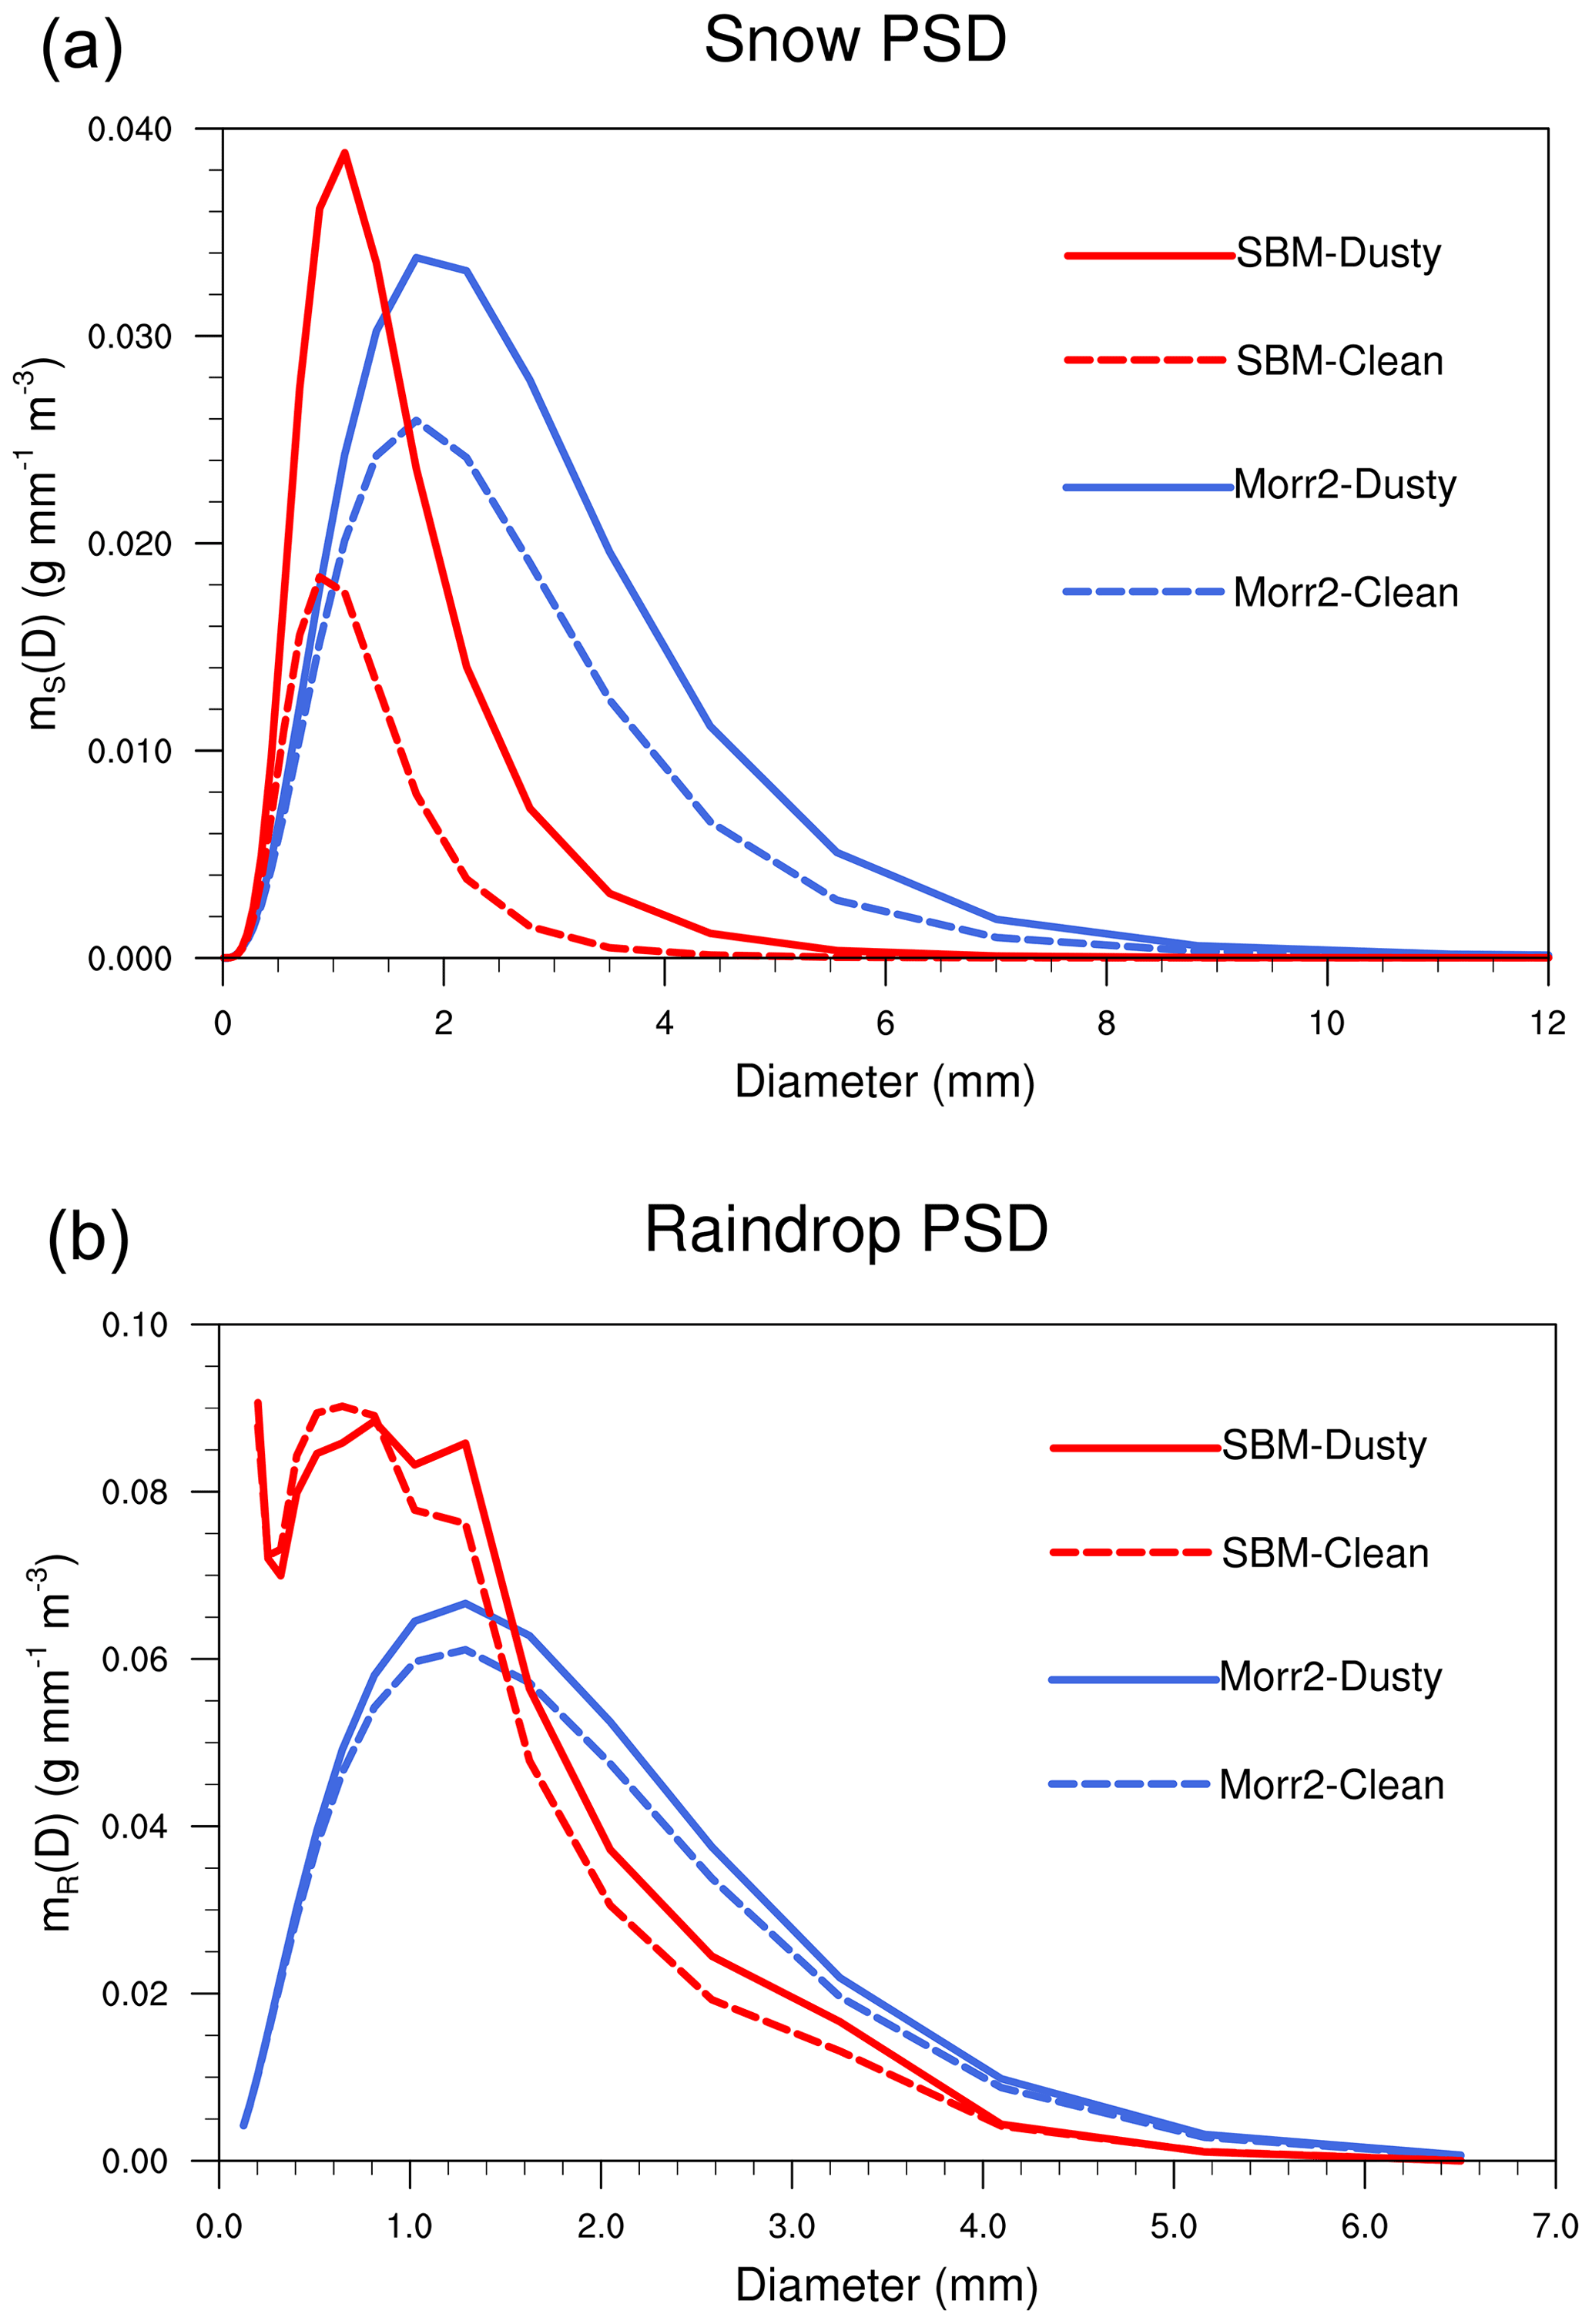
Figure 8Particle mass spectrum size distributions of the (a) snow particles and (b) raindrops from SBM-Clean (dashed red line) and Dusty (solid red line) and Morr2-Clean (dashed blue line) and Dusty (solid blue line) runs averaged over all the precipitation grids in the High-Pcp area during P2.
In Fig. 7, from clean to dusty conditions, the raindrop number and mass concentrations notably increase in the mixed-phase regime (around 4–9 km) and under the melting layer (under ∼ 5 km altitude) with both Morr2 and SBM schemes. The dust aerosol not only influences the LWC, but also shows impacts on the raindrop particle size distribution (PSD), which is an important factor influencing the collisional growth of raindrops and the cloud microphysics precipitation efficiency. The PSD in the SBM microphysical scheme is represented by the particular bin microphysical information, and the PSD in the Morr2 scheme is represented by gamma functions based on the predicted hydrometeor mass, number, and the fixed shape parameters (Morrison et al., 2009). The particle mass spectrum size distributions of snow particles in the mixed-phase layer (4–7 km) and raindrops under the melting layer (under 4 km) averaged in P2 are given in Fig. 8. The result shows, during the P2 period, that more and larger snow particles are generated through the enhanced immersion freezing process in the dusty condition (Fig. 8 a), and the melting of larger snow particle further leads to the increased raindrop size under the melting layer and enhanced surface rain rate.
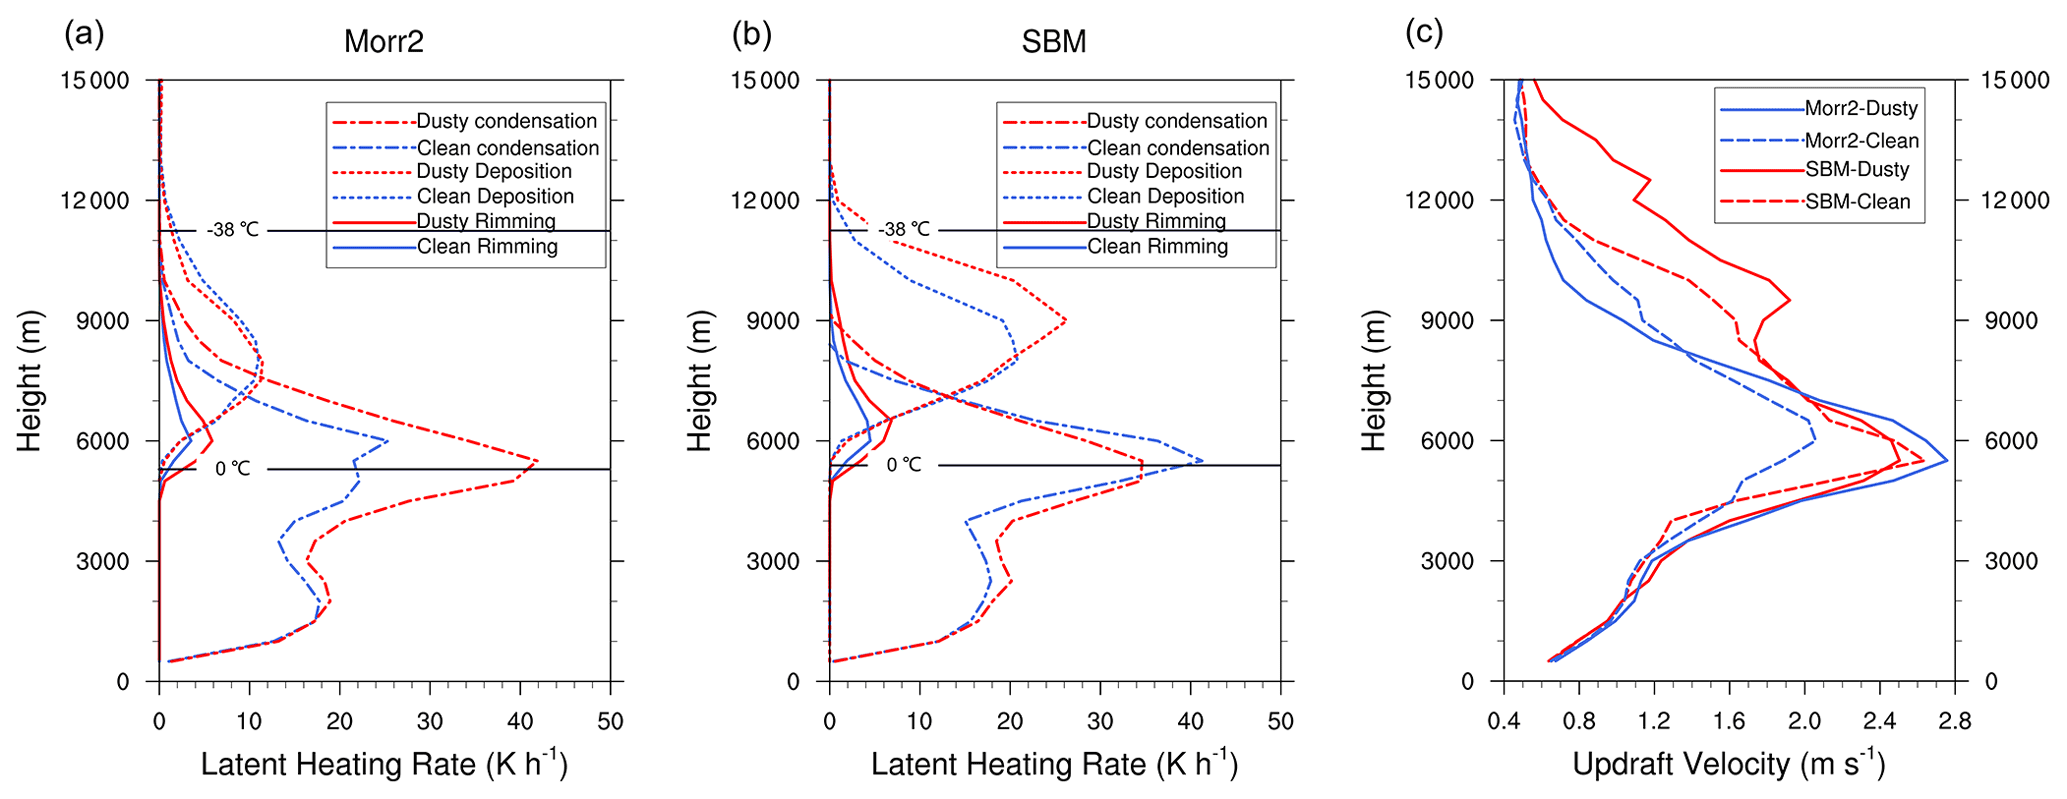
Figure 9Vertical profiles of latent heating rates averaged over the top 10th percentiles of the updrafts (w > 0.5 m s−1) from (a) Morr2-Clean (blue lines) and Dusty (red lines), and (b) SBM-Clean (blue lines) and Dusty (red lines) in High-Pcp area during 12:00–16:00 LT (P2). (c) Similar time–space-averaged vertical profiles of updraft velocity averaged over the top 10th percentiles of the updrafts (90th to 100th, with w ≳ 0.5 m s−1) simulated by Morr2-Clean and Dusty (blue) and SBM-Clean and Dusty (red).
The more numerous and larger hydrometeor particles generated in the dusty atmosphere could also be a result of the enhanced convective intensities due to the effects of dust. As described in Sect. 2.2.1, Nd is only connected with the immersion freezing processes of the microphysics schemes; the direct radiative forcing by dust aerosols is not considered. The dynamic and thermodynamic effects of dust are caused through latent heating from the formation and growth of hydrometeor particles. To tease out the dust aerosol impacts on the convection, the vertical profiles of mean updraft velocities and latent heating rates averaged over the strong convective grids of the top 10th percentile updrafts (with the value greater than ∼ 0.5 m s−1) during the P2 period are given in Fig. 9. The result shows that the effect of dust leads to an enhancement of the riming latent heating in the mixed-phase layer (∼ 5–10 km) with the Morr2 and SBM schemes (Fig. 9a–b). In this process, with the effects of dust considered, the stronger riming and Wegener–Bergeron–Findeisen (WBF) processes lead to increasing latent heat release in the mixed-phase regime, which enhances the convective intensities. However, the convective invigoration effects lead to different further impacts on the updrafts and condensation and deposition processes in the Morr2 and SBM runs. From Morr2-Clean to Morr2-Dusty runs, the effects of dust notably increase the condensation latent heating at 4–8 km altitude (Fig. 9a), leading to the significantly increased convective intensity (by ∼ 34 %) at the same level (Fig. 9c). At the upper level (8–12 km), the Morr2 scheme predicts limited the effects of dust on the deposition latent heating and the convective intensity. With the SBM microphysics scheme, dust aerosol shows a weaker convective invigoration effect at the lower level compared to that in the Morr2 runs. Meanwhile, at upper levels, the SBM scheme predicts a stronger enhancement of deposition latent heating due to the effect of dust, leading to the notably increased convective intensity (increased by ∼ 20 % at 10 km and about doubled at higher altitudes) (Fig. 9b and c). Figure 9b shows that over the intense convective grids, SBM-Dusty simulates the lower condensation latent heating at ∼ 5–7 km than in the clean condition. This weaker condensation latent heating rate between ∼ 5–7 km in the SBM-Dusty case could be caused by the drier updrafts as a result of stronger condensation below the layer (< 5 km) consuming more water vapor (Fig. S3a in the Supplement). This weaker latent heating rate in the dusty condition caused by the updraft and the vertical vapor transport is limited within the strong convective grids. Figure S3b in the Supplement shows that, over the whole High-Pcp area, the effect of dust leads to the enhanced latent heating at all altitudes, consistent with the enhanced cloud hydrometers in the dusty condition (Fig. 7).
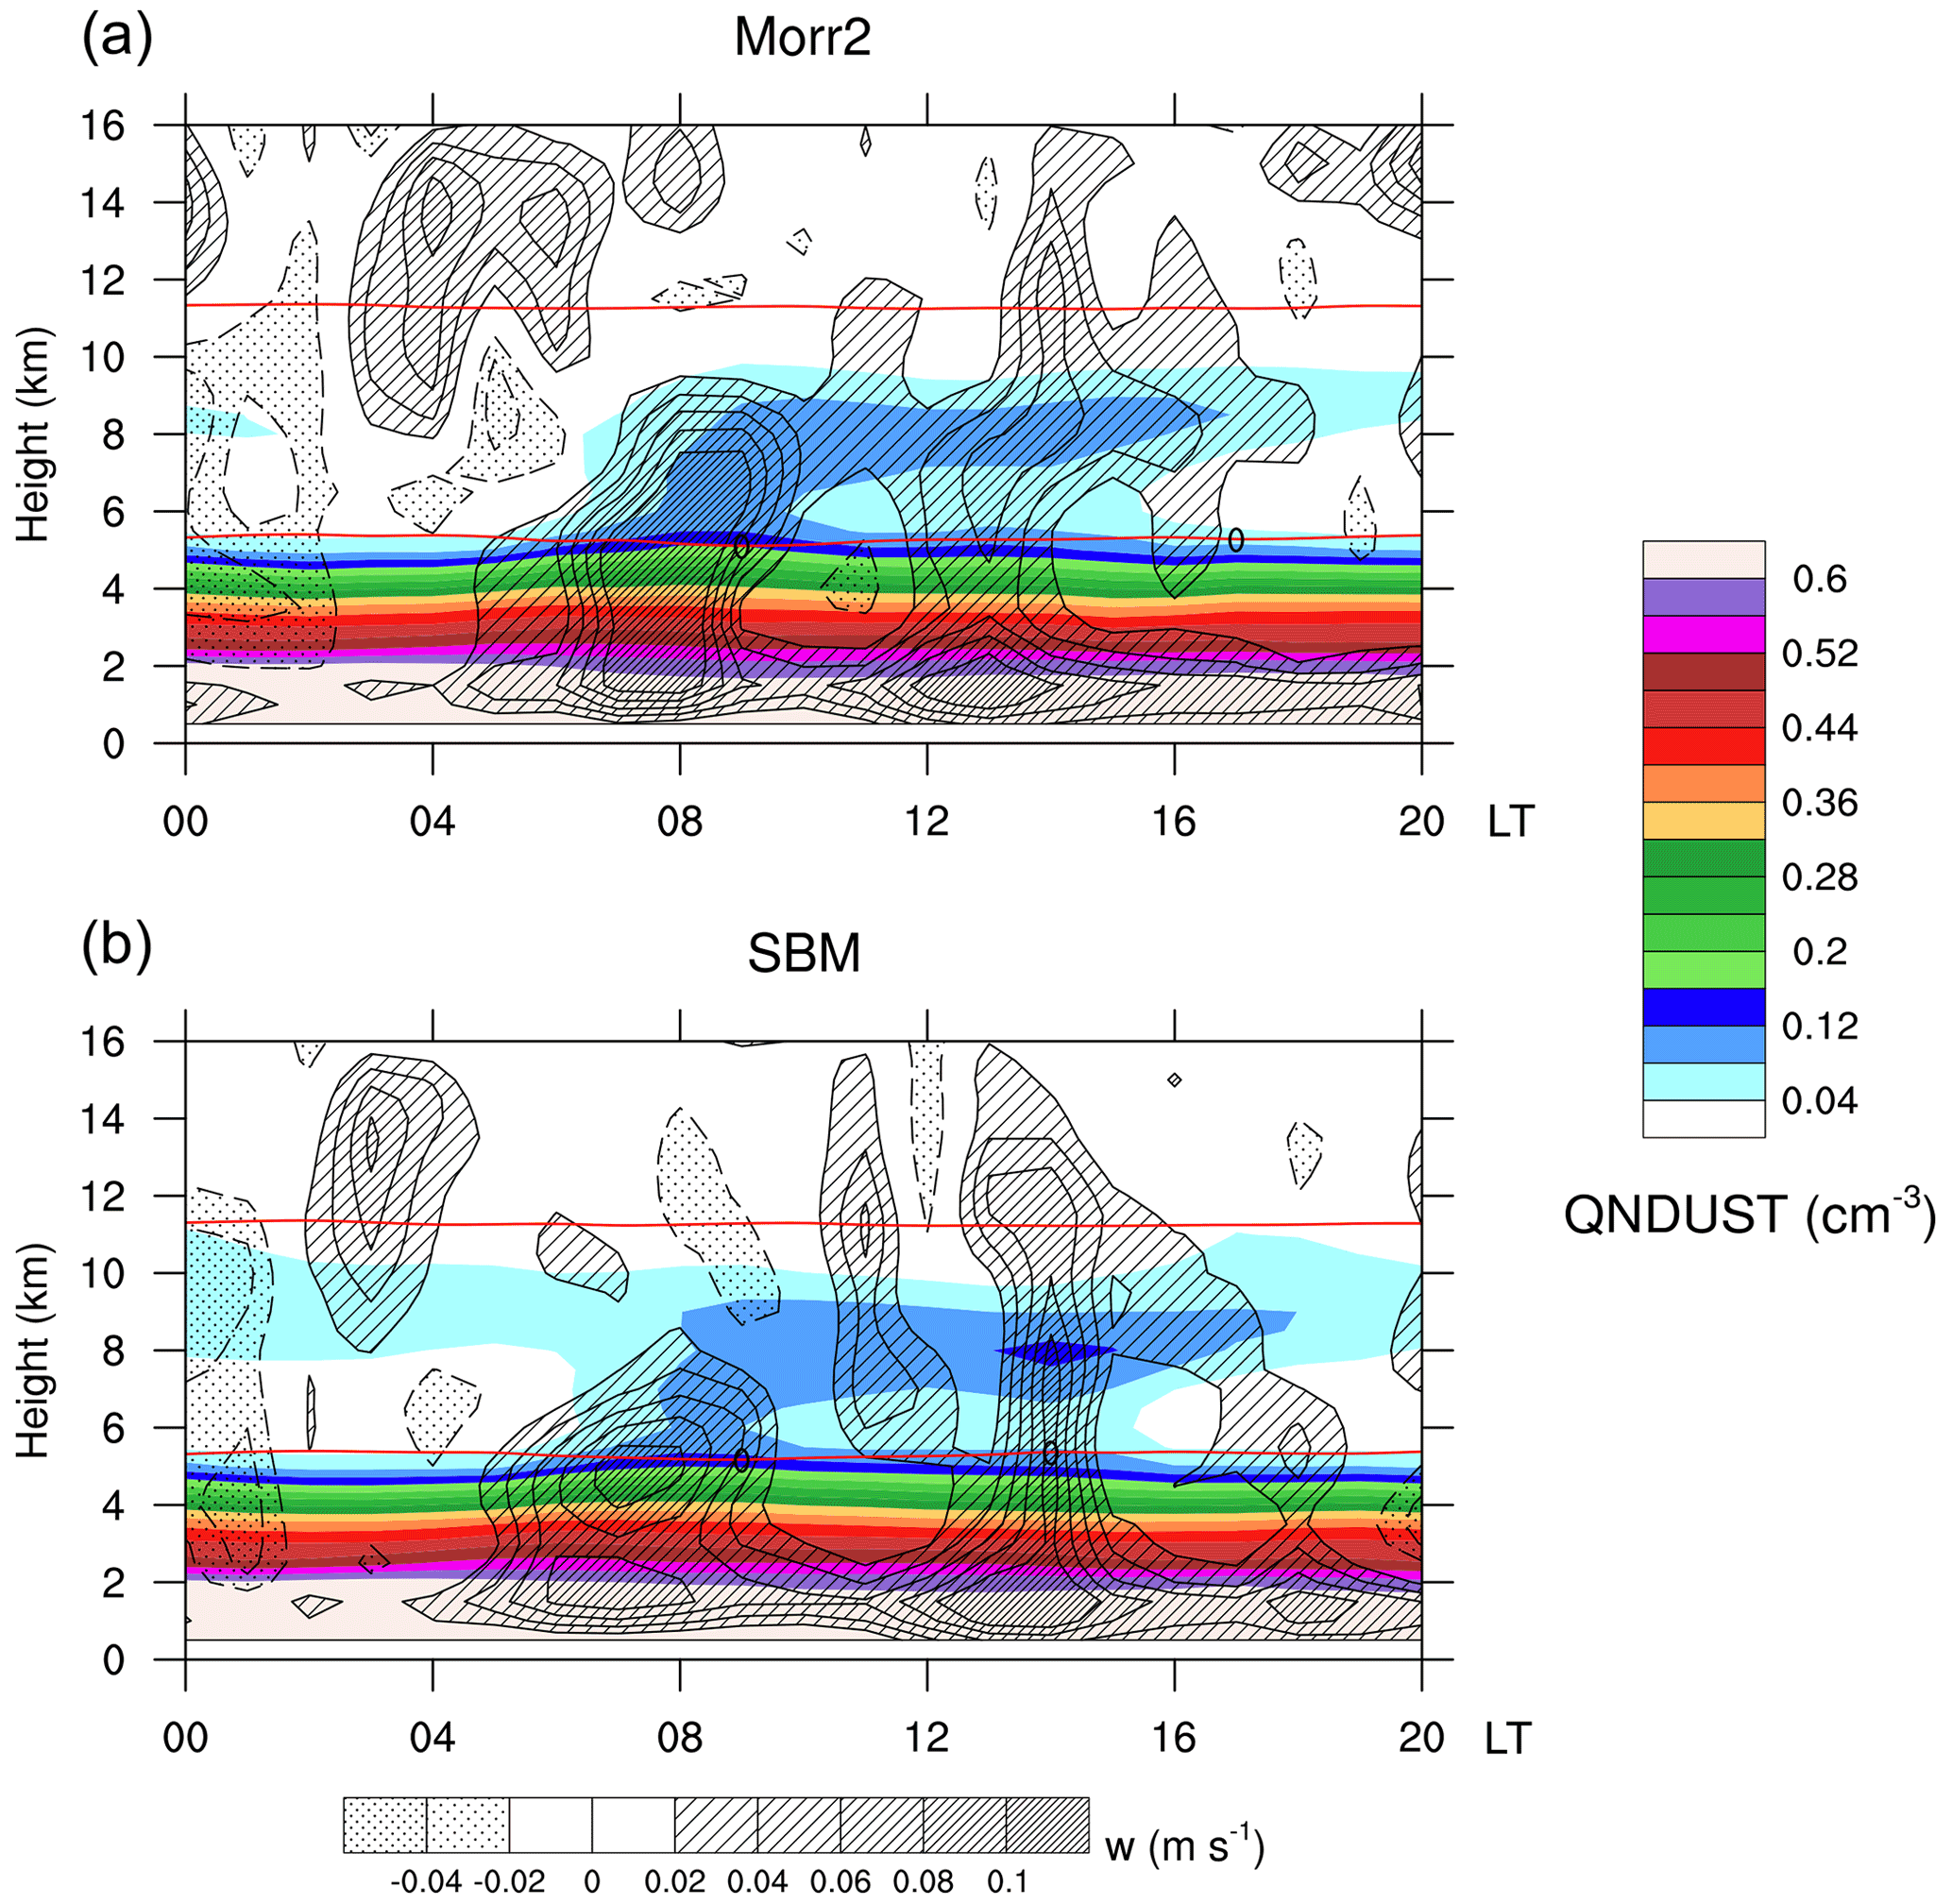
Figure 10Time series of dust number concentration (shaded) and temperature (red line) and vertical velocity (contours) averaged among precipitation grids (> 0 mm h−1) in the High-Pcp area from (b) Morr2-Dusty and (c) SBM-Dusty.
The analysis shows the effects of dust aerosols on clouds and precipitation, enhancing the convective system via microphysical processes and latent heat release. At the same time, the convection system also has impacts on the advection and vertical transport of dust. The Nd vertical profiles (Fig. 1c) show that without the convective transport of dust, the dust loadings above the freezing level (> 6 km) are similar in both clean and dusty conditions (Nd < 0.002 cm−3). Figure 10 shows that, even with the orographic uplifting effect, the low-level-transported dust aerosols are distributed below the freezing level (0 ∘C) without the occurrence of convections, which have no effects on warm clouds and precipitation without ice-phase processes. During the strong convection stage (P1 and P2), dust aerosols are lifted to the upper level, and Nd can reach about 0.12 cm−3 at 9 km altitude (∼ −20∘), about 2 orders of magnitude higher than in the clean atmosphere, which could have considerable impacts on the cloud ice formation and enhance the development of cloud and convection in return.

Figure 11Vertical profiles of (a) latent heating rates and (b) vertical velocities averaged over the top 10th percentiles of the updrafts (90th to 100th, with w ≳ 0.5 m s−1) in High-Pcp area during P2 (12:00–16:00 LT) from Morr2-ec-Clean (blue lines) and Morr2-ec-Dusty (red lines). (c) Vertical profiles of cloud hydrometer mixing ratios averaged among precipitation grids in the High-Pcp area during P2 simulated by Morr2-ec-Clean (blue lines) and Morr2-ec-Dusty (red lines).
The result above shows the differences in simulated effects of dust on the cloud microphysical and convective properties with the Morr2 and SBM microphysics schemes. The Morr2 microphysics scheme predicts the more notable enhancement of LWC than the SBM scheme in and under the mixed-phase layer; at the upper level (∼ 9–12 km), with the effects of dust considered, the snow and graupel mass concentrations increase more significantly with the SBM scheme than with the Morr2 scheme (Fig. 7c vs. d). And compared to the Morr2 scheme, the SBM scheme predicts a weaker increase of updraft at the middle level (around 4–8 km) and a more dramatic enhancement of updraft at the upper level (∼ 8–12 km) (Fig. 9). These different effects of dust could be caused by the different assumptions and parameterizations of the various microphysical processes between bulk and bin microphysics schemes. Among various factors, the saturation adjustment approach in the bulk scheme is indicated to have impacts on the simulations of the aerosol–cloud interaction processes compared to the explicit representation of the supersaturation-forced condensation growth in the bin models (Lebo and Seinfeld, 2011; Lebo et al. 2012; Khain et al., 2016; Porz et al., 2018; Zhang et al., 2021). As described in Sect. 2.2.2, based on the Morr2-Clean and Morr2-Dusty, the saturation adjustment approach is replaced with the explicit condensation growth (as Morr2-ec-Clean and Morr2-ec-Dusty).
Comparing the differences in latent heating (Fig. 9a vs. Fig. 11a), updraft (Fig. 9c vs. Fig. 11b), and hydrometeor mixing ratio (Fig. 7c vs. Fig. 11c) simulated by the Morr2 and Morr2-ec runs demonstrates the differences in the prediction of the effects of dust. The explicit supersaturation scheme produces a weaker enhancement of the condensation (increased by ∼ 30 % from Morr2-ec-Clean to Morr2-ec-Dusty) than the saturation adjustment approach (increased by ∼ 60 % from Morr2-Clean to Morr2-Dusty) at the middle level (∼ 4–7 km). And at the upper level (∼ 8–12 km), Morr2-ec predicts an enhanced deposition latent heating from clean to dusty conditions (Fig. 11a), which is not predicted by the saturation adjustment scheme (Fig. 9a). Accordingly, from clean to dusty conditions, Morr2-ec predicts a smaller increase in liquid hydrometeor mixing ratio at low altitude and a larger enhancement of the ice particle mass concentrations at the upper level (Fig. 11c). The latent heating rate can influence the buoyancy and updraft strength; thus the Morr2-ec predicts a smaller increase in updraft strength at the middle level (∼ 4–7 km) and more obviously invigorated convection at upper altitude (∼ 8–12 km). The possible reason for the differences between the saturation adjustment (Morr2) and explicit supersaturation approach (Morr2-ec) is that the use of the saturation adjustment approach turns all excess water vapor into liquid water at the end of each time step, leading to the stronger enhancement of condensation and latent heating at middle to low levels, and limits buoyancy increase and convective invigoration at upper levels, which is demonstrated in previous studies (Lebo et al., 2012; Grabowski and Morrison, 2017). The different simulations from the Morr2, SBM, and Morr2-ec scheme runs suggest that the use of the saturation adjustment approach in the bulk scheme is one of the most important factors contributing to the different effects of dust predicted by the Morr2 and SBM runs. The accumulated precipitation and rain rate (Figs. S4 and S5 in the Supplement) from Morr2-ec runs are still different from the SBM runs, indicating that the saturation adjustment approach cannot explain all the differences in the predicted dust–cloud interactions by the bin and bulk schemes.
This study explores the influences of long-range-transported (under ∼ 5 km) mineral dust on the convective clouds and precipitation. We have conducted numerical simulations of a heavy rainfall case occurring over the mountainous region of Taiwan, using the WRF model with the Morrison and SBM cloud microphysics schemes. The dust-related immersion freezing parameterization is implemented in the bulk and bin schemes to connect the model with the dust number concentrations in clean and dusty conditions. Multiple datasets including TCCIP precipitation observation, satellite retrieved measurements, and reanalysis are used as references to compare with the model simulations.
The precipitations simulated by the default and modified schemes are shown to be generally consistent with the observations but underestimate the accumulated precipitation and the peak rain rates. The sensitivity simulation results indicate that the long-range-transported dust particles can notably affect the convective cloud and precipitation by acting as ice-nucleating particles, even with relatively low number concentrations (∼ 0.6 cm−3). We find that from clean to dusty conditions, in the heavy precipitation area (High-Pcp), the effect of dust enhances the accumulated precipitation by ∼ 15 % and ∼ 20 % in the precipitation centers and the peak precipitation rate by ∼ 41 % and ∼ 55 % with Morr2 and SBM, respectively. Both the Morr2 and SBM schemes predict improved precipitation patterns (pattern correlations increase from 0.56 to 0.6 with Morr2 and ∼ 0.55 to 0.66 with SBM) and time series (reduce false predicted rainfall) when the effect of dust is involved. By comparing the precipitations simulated by the Morr2 and SBM runs, the result also suggests that the SBM microphysics scheme predicts a better rainfall intensity, pattern, and time series than the Morr2 scheme in this case.
During the strong convective period (P2, 11:00–15:00 LT), the simulated cloud properties (ice/liquid water contents, cloud area, and cloud top height) are notably impacted due to the effects of dust through both convective invigoration and the microphysics effect. Dust aerosols dramatically impact the cloud heterogeneous freezing process during the strong convective periods, with the ice water content increasing by ∼ 35 % and 60 % with Morr2 and SBM schemes from clean to dusty conditions. The increased ice and snow particles in the mixed-phase regime cause the stronger riming and WBF processes and enhanced latent heating, which invigorate convective intensity and enhance the condensation and melting, leading to increasing liquid water content and raindrop stronger surface precipitations. During the deep convective period (P2), the mean updraft velocities and latent heating rates averaged over the strong convective grids (over the top 10th percentiles of the updrafts, with w > 0.5 m s−1) show that dust aerosol effects remarkably increase the condensation and deposition latent heating rates, leading to the intensified updraft. This study demonstrates the bidirectional influences between dust aerosols and the convective system; i.e., the low-altitude dust aerosols are lifted to the freezing layer by the strong convection and, in return, leading to the enhanced convective intensity via microphysical and invigoration effects.
The result also shows that the Morr2 and SBM schemes simulate different invigoration effects of the dust aerosol, with a much stronger effect with SBM. From Morr2-Clean to Morr2-Dusty runs, the convective intensity significantly increases at 4–8 km altitude (by ∼ 34 %) due to the enhanced condensation latent heating. Meanwhile, with the SBM microphysics scheme, the effects of dust intensify the updraft more significantly at upper levels, corresponding to the increase in high-level latent heating from the deposition process. The different convective invigoration effects of dust simulated by the Morr2 and SBM schemes are indicated partially caused by the saturation adjustment approach used by the bulk scheme. Compared to the explicit supersaturation forced condensation, the model run with the saturation adjustment approach predicts a stronger enhancement of the condensation process at middle to low levels by turning all supersaturated water vapor into liquid water at the end of each time step, which limits the deposition process and convective invigoration at upper levels.
In the dust–cloud interaction process, it is difficult to untangle the microphysical effect and convective invigoration effect. With the effects of dust, the enhanced freezing and riming can increase latent heat release and boost the convection, and an increase in latent heating can intensify the updraft and increase condensation and deposition processes in turn. In this study, the model simulations (SBM, Morr2, and Morr2-ec) averaged over the rain band area demonstrate that both bin and bulk microphysics schemes can predict the microphysical effects of dust, manifesting as the enhanced immersion freezing and IWC in the mixed-phase layer. But, among the strong convective grids, the different simulations suggest that the effect of dust on the intensity and vertical profile of the convection is sensitive to the supersaturation and condensation approaches (Morr2 vs. SBM and Morr2 vs. Morr2-ec) in the microphysics schemes. Besides the saturation adjustment, the different effects of dust predicted by the Morr2 and SBM schemes can also be caused by the different assumptions and parameterizations of the various microphysical processes between the bulk and bin microphysics schemes.
This study shows that the dust aerosols transported at low altitudes (below the freezing level) with relatively low number concentrations have remarkable impacts on the orographic convective clouds and precipitation. The extremely low background dust loading in summer over this region is one possible factor responsible for the significant effect of dust that Nd increases by about 2 orders of magnitudes from clean to dusty conditions. The abundant moisture transported by the circulation could be another influencing factor, which is suggested to be important in the dust–cloud–precipitation interactions by our previous study (Zhang et al., 2020b). This study demonstrates the importance of the effects of dust in the predictions of convective cloud and heavy precipitation, and the effect of dust improves the simulation by the bulk scheme, which requires less computational resources and is widely used in operational weather forecasting. This study could provide a possible pointcut to improve the numerical weather prediction of extreme precipitation events.
The GEOS-Chem-APM dust number concentration data can be accessed by contacting the corresponding authors Yanda Zhang (yzhang31@albany.edu) and Fangqun Yu (fyu@albany.edu). The MERRA-2 inst3_3d_aer_Nv and GPM IMERG half-hourly precipitation data are available at Goddard Earth Sciences Data and Information Services Center (GES DISC) (https://doi.org/10.5067/LTVB4GPCOTK2, Global Modeling and Assimilation Office (GMAO), 2015; https://doi.org/10.5067/GPM/IMERG/3B-HH-E/06, Huffman et al., 2019). The TCCIP precipitation data can be applied and acquired from the Taiwan Climate Change Projection Information and Adaptation Knowledge Platform (http://tccip.ncdr.nat.gov.tw/NCDR/main/index.aspx, last access: 23 November 2021, Weng and Yang, 2018). MODIS MYD06_L2 data used in this work were acquired from Atmosphere Archive and Distribution System (LAADS) Distributed Active Archive Center (DAAC) (https://ladsweb.modaps.eosdis.nasa.gov/search/order/1/MYD06_L2-61, last access: 23 November 2021, Platnick et al., 2015, https://doi.org/10.5067/MODIS/MYD06_L2.006).
The supplement related to this article is available online at: https://doi.org/10.5194/acp-21-17433-2021-supplement.
YZ, FY, and GL developed the project idea. JF contributed the model code. YZ updated the model. YZ carried out the numerical simulations. YZ and SL analyzed the data, with contributions from JF. YZ wrote the paper, with contributions from FY, GL, and JF.
Some authors are members of the editorial board of Atmospheric Chemistry and Physics. The peer-review process was guided by an independent editor, and the authors have also no other competing interests to declare.
Publisher's note: Copernicus Publications remains neutral with regard to jurisdictional claims in published maps and institutional affiliations.
Jiwen Fan acknowledges the support of the U.S. Department of Energy Early Career Research Program. The GEOS-Chem model used in this study is a freely accessible community model managed by the Atmospheric Chemistry Modeling Group at Harvard University with support from NASA.
This research has been supported by the Office of International Science and Engineering (grant no. OISE-1545917) and the National Aeronautics and Space Administration (grant no. NNX17AG35G).
This paper was edited by Jianping Huang and reviewed by two anonymous referees.
Andreae, M. O., Charlson, R. J., Bruynseels, F., Storms, H., Van Grieken, R., and Maenhaut, W.: Internal mixture of sea salt, silicates, and excess sulfate in marine aerosols, Science, 232, 1620–1623, https://doi.org/10.1126/science.232.4758.1620, 1986.
Atkinson, J. D., Murray, B. J., Woodhouse, M. T., Whale, T. F., Baustian, K. J., Carslaw, K. S., Dobbie, S., O'Sullivan, D., and Malkin, T. L.: The importance of feldspar for ice nucleation by mineral dust in mixed-phase clouds, Nature, 498, 355–358, https://doi.org/10.1038/nature12278, 2013.
Ault, A. P., Williams, C. R., White, A. B., Neiman, P. J., Creamean, J. M., Gaston, C. J., Ralph, F. M., and Prather, K. A.: Detection of Asian dust in California orographic precipitation, J. Geophys. Res., 116, D16205, https://doi.org/10.1029/2010JD015351, 2011.
Bangert, M., Nenes, A., Vogel, B., Vogel, H., Barahona, D., Karydis, V. A., Kumar, P., Kottmeier, C., and Blahak, U.: Saharan dust event impacts on cloud formation and radiation over Western Europe, Atmos. Chem. Phys., 12, 4045–4063, https://doi.org/10.5194/acp-12-4045-2012, 2012.
Bigg, E. K.: The supercooling of water, Proceedings of the Physical Society. Section B, 66, 688, https://doi.org/10.1088/0370-1301/66/8/309, 1953.
Carslaw, K. S., Boucher, O., Spracklen, D. V., Mann, G. W., Rae, J. G. L., Woodward, S., and Kulmala, M.: A review of natural aerosol interactions and feedbacks within the Earth system, Atmos. Chem. Phys., 10, 1701–1737, https://doi.org/10.5194/acp-10-1701-2010, 2010.
Chen, C. S. and Chen, Y. L.: The rainfall characteristics of Taiwan, Mon. Weather Rev., 131, 1323–1341, https://doi.org/10.1175/1520-0493(2003)131%3C1323:TRCOT%3E2.0.CO;2, 2003.
Chen, J. M., Li, T., and Shih, C. F.: Tropical cyclone- and monsoon-induced rainfall variability in Taiwan, J. Climate, 23, 4107–4120, https://doi.org/10.1175/2010JCLI3355.1, 2010.
Chen, J.-P., Hazra, A., Shiu, C.-J., Tsai, I.-C., and Lee, H.-H.: Interaction between Aerosols and Clouds: Current Understanding, in: Recent Progress in Atmospheric Sciences: Applicatons to the Asia-Pacific Region, edited by: Liou, K. N. and Chou, M.-D., World Scientific Publishing Co. Pte. Ltd., 231–281, https://doi.org/10.1142/9789812818911_0013, 2008.
Chen, J. P., Yang, C. E., and Tsai, I. C.: Estimation of foreign versus domestic contributions to Taiwan's air pollution, Atmos. Environ., 112, 9–19, https://doi.org/10.1016/j.atmosenv.2015.04.022, 2015.
Chiu, H. F., Tiao, M. M., Ho, S. C., Kuo, H. W., Wu, T. N., and Yang, C. Y.: Effects of Asian dust storm events on hospital admissions for chronic obstructive pulmonary disease in Taipei, Taiwan, Inhal. Toxicol., 20, 777–781, https://doi.org/10.1080/08958370802005308, 2008.
Choi, Y. S., Lindzen, R. S., Ho, C. H., and Kim, J.: Space observations of cold-cloud phase change, P. Natl. Acad. Sci. USA, 107, 11211–11216, https://doi.org/10.1073/pnas.1006241107, 2010.
Chou, C. C. K., Hsu, W. C, Chang, S. Y., Chen, W. N., Chen, M. J., Huang, W. R., Huang, S. H., Tsai, C. Y., Chang, S. C., Lee, C. T., and Liu, S. C.: Seasonality of the mass concentration and chemical composition of aerosols around an urbanized basin in East Asia, J. Geophys. Res.-Atmos., 122, 2026–2042, https://doi.org/10.1002/2016JD025728, 2017.
Creamean, J., Suski, K., Rosenfeld, D., Cazorla, A., DeMott, P., Sullivan, R., White, A., Ralph, F., Minnis, P., Comstock, J., Tomlinson, J., and Prather, K.: Dust and biological aerosols from the Sahara and Asia influence precipitation in the Western U.S., Science, 339, 1572–1578, https://doi.org/10.1126/science.1227279, 2013.
Creamean, J. M., Ault, A. P., White, A. B., Neiman, P. J., Ralph, F. M., Minnis, P., and Prather, K. A.: Impact of interannual variations in sources of insoluble aerosol species on orographic precipitation over California's central Sierra Nevada, Atmos. Chem. Phys., 15, 6535–6548, https://doi.org/10.5194/acp-15-6535-2015, 2015.
Creamean, J. M., White, A. B., Minnis, P., Palikonda, R., Spangenberg, D. A., and Prather, K. A.: The relationships between insoluble precipitation residues, clouds, and precipitation over California's southern Sierra Nevada during winter storms, Atmos. Environ., 140, 298–310, https://doi.org/10.1016/j.atmosenv.2016.06.016, 2016.
DeMott, P. J., Sassen, K., Poellot, M. R., Baumgardner, D., Rogers, D. C., Brooks, S. D., Prenni, A. J., and Kreidenweis, S. M.: African dust aerosols as atmospheric ice nuclei, Geophys. Res. Lett., 30, 1732, https://doi.org/10.1029/2003GL017410, 2003.
DeMott, P. J., Prenni, A. J., Liu, X., Kreidenweis, S. M., Petters, M. D., Twohy, C. H., Richardson, M. S., Eidhammer, T., and Rogers, D. C.: Predicting global atmospheric ice nuclei distributions and their impacts on climate, P. Natl. Acad. Sci. USA, 107, 11217–11222, 205, https://doi.org/10.1073/pnas.0910818107, 2010.
DeMott, P. J., Prenni, A. J., McMeeking, G. R., Sullivan, R. C., Petters, M. D., Tobo, Y., Niemand, M., Möhler, O., Snider, J. R., Wang, Z., and Kreidenweis, S. M.: Integrating laboratory and field data to quantify the immersion freezing ice nucleation activity of mineral dust particles, Atmos. Chem. Phys., 15, 393–409, https://doi.org/10.5194/acp-15-393-2015, 2015.
Denjean, C., Cassola, F., Mazzino, A., Triquet, S., Chevaillier, S., Grand, N., Bourrianne, T., Momboisse, G., Sellegri, K., Schwarzenbock, A., Freney, E., Mallet, M., and Formenti, P.: Size distribution and optical properties of mineral dust aerosols transported in the western Mediterranean, Atmos. Chem. Phys., 16, 1081–1104, https://doi.org/10.5194/acp-16-1081-2016, 2016.
Engelstaedter, S., Tegen, I., and Washington, R.: North African dust emissions and transport, Earth-Sci. Rev., 79, 73–100, https://doi.org/10.1016/j.earscirev.2006.06.004, 2006.
European Centre for Medium-Range Weather Forecasts: ERA5Reanalysis, Research Data Archive at the National Center for Atmospheric Research, Computational and Information Systems Laboratory [data set], https://doi.org/10.5065/D6X34W69, 2017.
Fan, J., Leung, L. R., Li, Z., Morrison, H., Chen, H., Zhou, Y., Qian, Y., and Wang, Y.: Aerosol impacts on clouds and precipitation in eastern China: Results from bin and bulk microphysics, J. Geophys. Res., 117, D00K36, https://doi.org/10.1029/2011JD016537, 2012.
Fan, J., Leung, L. R., Rosenfeld, D., Chen, Q., Li, Z., Zhang, J., and Yan, H.: Microphysical effects determine macrophysical response for aerosol impacts on deep convective clouds, P. Natl. Acad. Sci. USA, 110, E4581–E4590, https://doi.org/10.1073/pnas.1316830110, 2013.
Fan, J., Leung, L. R., DeMott, P. J., Comstock, J. M., Singh, B., Rosenfeld, D., Tomlinson, J. M., White, A., Prather, K. A., Minnis, P., Ayers, J. K., and Min, Q.: Aerosol impacts on California winter clouds and precipitation during CalWater 2011: local pollution versus long-range transported dust, Atmos. Chem. Phys., 14, 81–101, https://doi.org/10.5194/acp-14-81-2014, 2014.
Fan, J., Leung, L. R., Rosenfeld, D., and DeMott, P. J.: Effects of cloud condensation nuclei and ice nucleating particles on precipitation processes and supercooled liquid in mixed-phase orographic clouds, Atmos. Chem. Phys., 17, 1017–1035, https://doi.org/10.5194/acp-17-1017-2017, 2017.
Fu, Q., Thorsen, T. J., Su, J., Ge, J. M., and Huang, J. P.: Test of Mie-based single-scattering properties of non-spherical dust aerosols in radiative flux calculations, J. Quant. Spectrosc. Ra., 110, 1640–1653, https://doi.org/10.1016/j.jqsrt.2009.03.010, 2009.
Futyan, J. M. and Del Genio, A. D.: Deep convective system evolution over Africa and the tropical Atlantic, J. Climate, 20, 5041–5060, https://doi.org/10.1175/JAS-D-16-0255.1, 2007.
Gelaro, R., McCarty, W., Suárez, M. J., Todling, R., Molod, A., Takacs, L., Randles, C., Darmenov, A., Bosilovich, M. G.,Reichle, R., Wargan, K., Coy, L., Cullather, R., Draper, C., Akella, S., Buchard, V.,Conaty, A., da Silva, A., Gu, W., Kim,G.- K., Koster, R., Lucchesi, R., Merkova, D., Nielsen, J. E., Partyka, G., Pawson, S., Putman, W., Rienecker, M., Schubert, S. D., Sienkiewicz, M., and Zhao, B.: The Modern-Era Retrospective Analysis for Research and Applications, Version 2 (MERRA-2), J. Climate, 30, 5419–5454, https://doi.org/10.1175/JCLI-D-16-0758.1, 2017.
Generoso, S., Bey, I., Labonne, M., and Breon, F.-M.: Aerosol vertical distribution in dust outflow over the Atlantic: Comparisons between GEOS-Chem and Cloud-Aerosol Lidar and Infrared Pathfinder Satellite Observation (CALIPSO), J. Geophys. Res., 113, D24209, https://doi.org/10.1029/2008JD010154, 2008.
Gibbons, M., Min, Q., and Fan, J.: Investigating the impacts of Saharan dust on tropical deep convection using spectral bin microphysics, Atmos. Chem. Phys., 18, 12161–12184, https://doi.org/10.5194/acp-18-12161-2018, 2018.
Global Modeling and Assimilation Office (GMAO): MERRA-2 inst3_3d_aer_Nv: 3d,3-Hourly,Instantaneous,Model-Level,Assimilation,Aerosol Mixing Ratio V5.12.4, Goddard Earth Sciences Data and Information Services Center (GES DISC) [data set], Greenbelt, MD, USA, https://doi.org/10.5067/LTVB4GPCOTK2, 2015.
Grabowski, W. W. and Morrison, H.: Modeling condensation in deep convection, J. Atmos. Sci., 74, 2247–2267, https://doi.org/10.1175/JAS-D-16-0255.1, 2017.
Gunn, R. and Phillips, B. B.: An experimental investigation of the effect of air pollution on the initiation of rain, J. Meteorol., 14, 272–280, https://doi.org/10.1175/1520-0469(1957)014<0272:AEIOTE>2.0.CO;2, 1957.
Guo, J. and Yin, Y.: Mineral dust impacts on regional precipitation and summer circulation in East Asia using a regional coupled climate system model, J. Geophys. Res.-Atmos., 120, 10–378, https://doi.org/10.1002/2015JD023096, 2015.
Han, Y., Fang, X., Zhao, T., Bai, H., Kang, S., and Song, L.: Suppression of precipitation by dust particles originated in the Tibetan Plateau, Atmos. Environ.,
Hansen, J., Sato, M., and Ruedy, R.: Radiative forcing and climate response, J. Geophys. Res.-Atmos., 102, 6831–6864, https://doi.org/10.1029/96JD03436, 1997.
Henny, L., Thorncroft, C. D., Hsu, H. H., and Bosart, L. F.: Extreme Rainfall in Taiwan: Seasonal Statistics and Trends, J. Climate, 34, 4711–4731, https://doi.org/10.1175/JCLI-D-20-0999.1, 2021.
Hoffmann, C., Funk, R., Sommer, M., and Li, Y.: Temporal variations in PM10 and particle size distribution during Asian dust storms in Inner Mongolia, Atmos. Environ., 42, 8422–8431, https://doi.org/10.1016/j.atmosenv.2008.08.014, 2008.
Hoose, C. and Möhler, O.: Heterogeneous ice nucleation on atmospheric aerosols: a review of results from laboratory experiments, Atmos. Chem. Phys., 12, 9817–9854, https://doi.org/10.5194/acp-12-9817-2012, 2012.
Hsu, S. C., Huh, C. A., Lin, C. Y., Chen, W. N., Mahowald, N. M., Liu, S. C., Chou, C. C. K., Liang, M. C., Tsai, C. J., Lin, F. J., Chen, J. P., and Huang, Y. T.: Dust transport from non-East Asian sources to the North Pacific, Geophys. Res. Lett., 39, L12804, https://doi.org/10.1029/2012GL051962, 2012.
Huang, J., Lin, B., Minnis, P., Wang, T., Wang, X., Hu, Y., Yi, Y., and Ayers, J. K.: Satellite-based assessment of possible dust aerosols semi-direct effect on cloud water path over East Asia, Geophys. Res. Lett, 33, L19802, https://doi.org/10.1029/2006GL026561, 2006.
Huang, J., Wang, T., Wang, W., Li, Z., and Yan, H.: Climate effects of dust aerosols over East Asian arid and semi-arid regions, J. Geophys. Res., 119, 11398–11416, https://doi.org/10.1002/2014JD021796, 2014.
Huang, L., Jiang, J. H., Wang, Z., Su, H., Deng, M., and Massie, S.: Climatology of cloud water content associated with different cloud types observed by A-Train satellites, J. Geophys. Res.-Atmos., 120, 4196–4212, https://doi.org/10.1002/2014JD022779, 2015.
Huffman, G. J., Stocker, E. F., Bolvin, D. T., Nelkin, E. J., and Tan, J.: GPM IMERG Early Precipitation L3 Half Hourly 0.1 degree x 0.1 degree V06, Goddard Earth Sciences Data and Information Services Center (GES DISC) [data set], Greenbelt, MD, https://doi.org/10.5067/GPM/IMERG/3B-HH-E/06, 2019.
Husar, R. B., Tratt, D. M., Schichtel, B. A., Falke, S. R., Li, F., Jaffe, D., Gassó, S., Gill, T., Laulainen, N. S., Lu, F., Reheis, M. C., Chun, Y., Westphal, D., Holben, B. N., Gueymard, C., McKendry, I., Kuring, N., Feldman, G. C., McClain, C., Frouin, R. J., Merrill, J., DuBois, D., Vignola, F., Murayama, T., Nickovic, S., Wilson, W. E., Sassen, K., Sugimoto, N., and Malm, W. C.: Asian dust events of April 1998, J. Geophys. Res.-Atmos., 106, 18317–18330, https://doi.org/10.1029/2000JD900788, 2001.
Iacono, M. J., Delamere, J. S., Mlawer, E. J., Shephard, M. W., Clough, S. A., and Collins, W. D.: Radiative forcing by long-lived greenhouse gases: Calculations with the AER radiative transfer models, J. Geophys. Res., 113, D13103, https://doi.org/10.1029/2008jd009944, 2008.
Janjić, Z. I.: The step-mountain eta coordinate model: Further developments of the convection, viscous sublayer, and turbulence closure schemes, Mon. Weather Rev., 122, 927–945, https://doi.org/10.1175/1520-0493(1994)122<0927:TSMECM>2.0.CO;2, 1994.
Jickells, T. D., An, Z. S., Andersen, K. K., Baker, A. R., Bergametti, G., Brooks, N., Cao, J. J., Boyd, P. W., Duce, R. A., Hunter, K. A., Kawahata, H., Kubilay, N., laRoche, J., Liss, P. S., Mahowald, N., Prospero, J. M., Ridgwell, A. J., Tegen, I., and Torres, R.: Global iron connections between desert dust, ocean biogeochemistry, and climate, Science, 308, 67–71, https://doi.org/10.1126/science.1105959, 2005.
Kaaden, N., Massling, A., Schladitz, A., Muller, T., Kandler, K., Schutz, L., Weinzierl, B., Petzold, A., Tesche, M., Leinert, S., and Wiedensohler, A.: State of mixing, shape factor, number size distribution, and hygroscopic growth of the Saharan anthropogenic and mineral dust aerosol at Tinfou, Morocco, Tellus B, 61, 51–63, https://doi.org/10.1111/j.1600-0889.2008.00388.x, 2009.
Khain, A., Pokrovsky, A., Pinsky, M., Seifert, A., and Phillips, V.: Simulation of effects of atmospheric aerosols on deep turbulent convective clouds using a spectral microphysics mixed-phase cumulus cloud model. Part I: Model description and possible applications, J. Atmos. Sci., 61, 2963–2982, https://doi.org/10.1175/Jas-3350.1, 2004.
Khain, A., Rosenfeld, D., and Pokrovsky, A.: Aerosol impact on the dynamics and microphysics of deep convective clouds, Q. J. Roy. Meteor. Soc., 131, 2639–2663, https://doi.org/10.1256/qj.04.62, 2005.
Khain, A., Lynn, B., and Shpund, J.: High resolution WRF simulations of Hurricane Irene: Sensitivity to aerosols and choice of microphysical schemes, Atmos. Res., 167, 129–145, https://doi.org/10.1016/j.atmosres.2015.07.014, 2016.
Kim, P. S., Jacob, D. J., Fisher, J. A., Travis, K., Yu, K., Zhu, L., Yantosca, R. M., Sulprizio, M. P., Jimenez, J. L., Campuzano-Jost, P., Froyd, K. D., Liao, J., Hair, J. W., Fenn, M. A., Butler, C. F., Wagner, N. L., Gordon, T. D., Welti, A., Wennberg, P. O., Crounse, J. D., St. Clair, J. M., Teng, A. P., Millet, D. B., Schwarz, J. P., Markovic, M. Z., and Perring, A. E.: Sources, seasonality, and trends of southeast US aerosol: an integrated analysis of surface, aircraft, and satellite observations with the GEOS-Chem chemical transport model, Atmos. Chem. Phys., 15, 10411–10433, https://doi.org/10.5194/acp-15-10411-2015, 2015.
Klein, H., Nickovic, S., Haunold, W., Bundke, U., Nillius, B., Ebert, M., Weinbruch, S., Schuetz, L., Levin, Z., Barrie, L. A., and Bingemer, H.: Saharan dust and ice nuclei over Central Europe, Atmos. Chem. Phys., 10, 10211–10221, https://doi.org/10.5194/acp-10-10211-2010, 2010.
Knopf, D. A. and Koop, T.: Heterogeneous nucleation of ice on surrogates of mineral dust, J. Geophys. Res., 111, D12201, https://doi.org/10.1029/2005JD006894, 2006.
Kok, J., Ridley, D., Zhou, Q., Miller, R. L., Zhao, C., Heald, C. L., Ward, D. S., Albani, S., and Haustein, K.: Smaller desert dust cooling effect estimated from analysis of dust size and abundance, Nat. Geosci., 10, 274–278, https://doi.org/10.1038/ngeo2912, 2017.
Koren, I., Kaufman, Y. J., Remer, L. A., Kaufman, Y. J., Remer, L. A., Koren, I., Martins, J. V., and Martins, J. V.: Measurement of the effect of Amazon smoke on inhibition of cloud formation, Science, 303, 1342–1345, https://doi.org/10.1126/science.1089424, 2004.
Kuo, Y. C., Lee, M. A., and Lu, M. M.: Association of Taiwan's rainfall patterns with large‐scale oceanic and atmospheric phenomena, Adv. Meteorol., 2016, 3102895, https://doi.org/10.1155/2016/3102895, 2016.
Lebo, Z. J. and Seinfeld, J. H.: Theoretical basis for convective invigoration due to increased aerosol concentration, Atmos. Chem. Phys., 11, 5407–5429, https://doi.org/10.5194/acp-11-5407-2011, 2011.
Lebo, Z. J., Morrison, H., and Seinfeld, J. H.: Are simulated aerosol-induced effects on deep convective clouds strongly dependent on saturation adjustment?, Atmos. Chem. Phys., 12, 9941–9964, https://doi.org/10.5194/acp-12-9941-2012, 2012.
Levin, Z., Teller, A., Ganor, E., and Yin, Y.: On the interactions of mineral dust, sea-salt particles, and clouds: A measurement and modeling study from the Mediterranean Israeli Dust Experiment campaign, J. Geophys. Res., 110, D20202, https://doi.org/10.1029/2005JD005810, 2005.
Li, X., Maring, H., Savoie, D., Voss, K., and Prospero, J. M.: Dominance of mineral dust in aerosol light-scattering in the North Atlantic trade winds, Nature, 380, 416–419, https://doi.org/10.1038/380416a0, 1996.
Li, Z., Wang, Y., Guo, J., Zhao, C., Cribb, M. C., Dong, X., Fan, J., Gong, D., Huang, J., Jiang, M., Jiang, Y., Lee, S.-S., Li, H., Li, J., Liu, J., Qian, Y., Rosenfeld, D., Shan, S., Sun, Y., Wang, H., Xin, J., Yan, X., Yang, X., Yang, X.-q., Zhang, F., and Zheng, Y.: East asian study of tropospheric aerosols and their impact on regional clouds, precipitation, and climate (EAST-AIRCPC), J. Geophys. Res.-Atmos., 124, 13026–13054, https://doi.org/10.1029/2019JD030758, 2019.
Lin, C.-Y., Hsu, H.-m., Sheng, Y.-F., Kuo, C.-H., and Liou, Y.-A.: Mesoscale processes for super heavy rainfall of Typhoon Morakot (2009) over Southern Taiwan, Atmos. Chem. Phys., 11, 345–361, https://doi.org/10.5194/acp-11-345-2011, 2011.
Lin, C. Y., Chou, C. C., Wang, Z., Lung, S. C., Lee, C. T., Yuan, C. S., Chen, W.-N., Chang, S.-Y., Hsu, S.-C., Chen, W.-C., and Liu, S. C.: Impact of different transport mechanisms of Asian dust and anthropogenic pollutants to Taiwan, Atmos. Environ., 60, 403–418, https://doi.org/10.1016/j.atmosenv.2012.06.049, 2012.
Liu, Z., Omar, A., Vaughan, M., Hair, J., Kittaka, C., Hu, Y., Powell, K., Trepte, C., Winker, D., Hostetler, C., Ferrare, R., and Pierce, R.: CALIPSO lidar observations of the optical properties of Saharan dust: A case study of long-range transport, J. Geophys. Res., 113, D07207, https://doi.org/10.1029/2007JD008878, 2008.
Mahowald, N., Albani, S., Kok, J. F., Engelstaeder, S., Scanza, R., Ward, D. S., and Flanner, M. G.: The size distribution of desert dust aerosols and its impact on the Earth system, Aeolian Res., 15, 53–71, https://doi.org/10.1016/j.aeolia.2013.09.002, 2014.
Miller, R. L. and Tegen, I.: Climate response to soil dust aerosols, J. Climate, 11, 3247–3267, https://doi.org/10.1175/1520-0442(1998)011<3247:CRTSDA>2.0.CO;2, 1998.
Min, Q.-L., Li, R., Lin, B., Joseph, E., Wang, S., Hu, Y., Morris, V., and Chang, F.: Evidence of mineral dust altering cloud microphysics and precipitation, Atmos. Chem. Phys., 9, 3223–3231, https://doi.org/10.5194/acp-9-3223-2009, 2009.
Morrison, H., Thompson, G., and Tatarskii, V.: Impact of cloud microphysics on the development of trailing stratiform precipitation in a simulated squall line: Comparison of one-and two-moment schemes, Mon. Weather Rev., 137, 991–1007, https://doi.org/10.1175/2008MWR2556.1, 2009.
Muhlbauer, A. and Lohmann, U.: Sensitivity studies of aerosol–cloud interactions in mixed-phase orographic precipitation, J. Atmos. Sci., 66, 2517–2538, https://doi.org/10.1175/2009JAS3001.1, 2009.
Penner, J. E., Andreae, M., Annegarn, H., Barrie, L., Feichter, J., Hegg, D., Jayaraman, A., Leaitch, R., Murphy, D., Nganga, J., and Pitar, G.: Aerosols, their Direct and Indirect Effects, in: Climate Change 2001: The Scientific Basis, Contribution of Working Group I to the Third Assessment Report of the Intergovernmental Panel on Climate Change, edited by: Houghton, J. T., Ding, Y., Griggs, D. J., Noguer, M., van der Linden, P. J., Dai, X., Maskell, K., and Johnson, C. A., Cambridge University Press, Cambridge, United Kingdom and New York, NY, USA, 2001.
Perry, K. D., Cliff, S. S., and Jimenez-Cruz, M. P.: Evidence for hygroscopic mineral dust particles from the Intercontinental Transport and Chemical Transformation Experiment, J. Geophys. Res.-Atmos., 109, D23S28, https://doi.org/10.1029/2004JD004979, 2004.
Platnick, S., Ackerman, S., King, M. D., Meyer, K., Menzel, W. P., Holz, R. E., Baum, B. A., and Yang, P.: MODIS atmosphere L2 cloud product (06_L2), NASA MODIS Adaptive Processing System, Goddard Space Flight Center [data set], https://doi.org/10.5067/MODIS/MYD06_L2.006, 2015 (data available at: https://ladsweb.modaps.eosdis.nasa.gov/search/order/1/MYD06_L2-61, last access: 23 November 2021).
Pope, C. A., Burnett, R. T., Thun, M. J., Calle, E. E., Krewski, D., Ito, K., and Thurston, G. D.: Lung cancer, cardiopulmonary mortality, and long-term exposure to fine particulate air pollution, JAMA-J. Am. Med. Assoc., 287, 1132–1141, https://doi.org/10.1001/jama.287.9.1132, 2002.
Porz, N., Hanke, M., Baumgartner, M., and Spichtinger, P.: A model for warm clouds with implicit droplet activation, avoiding saturation adjustment, Mathematics of Climate and Weather Forecasting, 4, 50–78, https://doi.org/10.1515/mcwf-2018-0003, 2018.
Prospero, J. M.: Long-term measurements of the transport of African mineral dust to the southeastern United States: Implications for regional air quality, J. Geophys. Res.-Atmos., 104, 15917–15927, 1999.
Pruppacher, H. R. and Klett, J. D.: Microphysics of Clouds and Precipitation, Kluwer Academic Publishers, Boston, 1997.
Ridley, D. A., Heald, C. L., Kok, J. F., and Zhao, C.: An observationally constrained estimate of global dust aerosol optical depth, Atmos. Chem. Phys., 16, 15097–15117, https://doi.org/10.5194/acp-16-15097-2016, 2016.
Roberts, P. and Hallett, J.: A laboratory study of the ice nucleating properties of some mineral particulates, Q. J. Roy. Meteor. Soc, 94, 25–34, https://doi.org/10.1002/qj.49709439904, 1968.
Rosenfeld, D., Rudich, Y., and Lahav, R.: Desert dust suppressing precipitation: A possible desertification feedback loop, P. Natl. Acad. Sci. USA, 98, 5975–5980, https://doi.org/10.1073/pnas.101122798, 2001.
Sassen, K., DeMott, P. J., Prospero, J. M., and Poellot, M. R.: Saharan dust storms and indirect aerosol effects on clouds: CRYSTAL-FACE results, Geophys. Res. Lett., 30, 1633, https://doi.org/10.1029/2003GL017371, 2003.
Seigel, R. B., van den Heever, S. C., and Saleeby, S. M.: Mineral dust indirect effects and cloud radiative feedbacks of a simulated idealized nocturnal squall line, Atmos. Chem. Phys., 13, 4467–4485, https://doi.org/10.5194/acp-13-4467-2013, 2013.
Si, M., Irish, V. E., Mason, R. H., Vergara-Temprado, J., Hanna, S. J., Ladino, L. A., Yakobi-Hancock, J. D., Schiller, C. L., Wentzell, J. J. B., Abbatt, J. P. D., Carslaw, K. S., Murray, B. J., and Bertram, A. K.: Ice-nucleating ability of aerosol particles and possible sources at three coastal marine sites, Atmos. Chem. Phys., 18, 15669–15685, https://doi.org/10.5194/acp-18-15669-2018, 2018.
Skamarock, W. C., Klemp, J. B., Dudhia, J., Gill, D. O., Liu, Z., Berner, J., Wang, W., Powers, J. G., Duda, M. G., Barker, D. M., and Huang, X.-Y.: A Description of the Advanced Research WRF Version 4, NCAR Tech. Note NCAR/TN-556+STR, National Center for Atmospheric Research [code], Boulder, Colorado, USA, 145 pp., https://doi.org/10.5065/1dfh-6p97, 2019.
Smoydzin, L., Teller, A., Tost, H., Fnais, M., and Lelieveld, J.: Impact of mineral dust on cloud formation in a Saharan outflow region, Atmos. Chem. Phys., 12, 11383–11393, https://doi.org/10.5194/acp-12-11383-2012, 2012.
Solomos, S., Kallos, G., Kushta, J., Astitha, M., Tremback, C., Nenes, A., and Levin, Z.: An integrated modeling study on the effects of mineral dust and sea salt particles on clouds and precipitation, Atmos. Chem. Phys., 11, 873–892, https://doi.org/10.5194/acp-11-873-2011, 2011.
Su, S. H., Kuo, H. C., Hsu, L. H., and Yang, Y. T.: Temporal and spatial characteristics of typhoon extreme rainfall in Taiwan, J. Meteorol. Soc. Jpn. Ser. II, 90, 721–736, ]doi10.2151/jmsj.2012‐510, 2012.
Tiedtke, M.: A comprehensive mass flux scheme for cumulus parameterization in large-scale models, Mon. Weather Rev., 117, 1779–1800, https://doi.org/10.1175/1520-0493(1989)117<1779:ACMFSF>2.0.CO;2, 1989.
Teller, A. and Levin, Z.: The effects of aerosols on precipitation and dimensions of subtropical clouds: a sensitivity study using a numerical cloud model, Atmos. Chem. Phys., 6, 67–80, https://doi.org/10.5194/acp-6-67-2006, 2006.
Textor, C., Schulz, M., Guibert, S., Kinne, S., Balkanski, Y., Bauer, S., Berntsen, T., Berglen, T., Boucher, O., Chin, M., Dentener, F., Diehl, T., Easter, R., Feichter, H., Fillmore, D., Ghan, S., Ginoux, P., Gong, S., Grini, A., Hendricks, J., Horowitz, L., Huang, P., Isaksen, I., Iversen, I., Kloster, S., Koch, D., Kirkevåg, A., Kristjansson, J. E., Krol, M., Lauer, A., Lamarque, J. F., Liu, X., Montanaro, V., Myhre, G., Penner, J., Pitari, G., Reddy, S., Seland, Ø., Stier, P., Takemura, T., and Tie, X.: Analysis and quantification of the diversities of aerosol life cycles within AeroCom, Atmos. Chem. Phys., 6, 1777–1813, https://doi.org/10.5194/acp-6-1777-2006, 2006.
Uno, I., Eguchi, K., Yumimoto, K., Takemura, T., Shimizu, A., Uematsu, M., Liu, Z., Wang, Z., Hara, Y., and Sugimoto, N.: Asian dust transported one full circuit around the globe, Nat. Geosci., 2, 557, https://doi.org/10.1038/ngeo583, 2009.
Wang, W., Huang, J., Minnis, P., Hu, Y., Li, J., Huang, Z., Ayers, J. K., and Wang, T.: Dusty cloud properties and radiative forcing over dust source and downwind regions derived from A-Train data during the Pacific Dust Experiment, J. Geophys. Res., 115, D00H35, https://doi.org/10.1029/2010JD014109, 2010.
Wang, Y., Fan, J., Zhang, R., Leung, L. R., and Franklin, C.: Improving bulk microphysics parameterizations in simulations of aerosol effects, J. Geophys. Res.-Atmos., 118, 5361–5379, https://doi.org/10.1002/jgrd.50432, 2013.
Weng, S.-P. and Yang, C.-D.: The construction and verification of daily gridded rainfall dataset (1960–2015) in Taiwan, Taiwan Water Conserv. [data set], 66, 33–52, 2018 (in Chinese with English abstract) (data available at: http://tccip.ncdr.nat.gov.tw/NCDR/main/index.aspx, last access: 23 November 2021).
Wu, P. C. and Huang, K. F.: Tracing local sources and long-range transport of PM10 in central Taiwan by using chemical characteristics and Pb isotope ratios, Scientific Reports, 11, 7593, https://doi.org/10.1038/s41598-021-87051-y, 2021.
Xu, J.-W., Martin, R. V., Morrow, A., Sharma, S., Huang, L., Leaitch, W. R., Burkart, J., Schulz, H., Zanatta, M., Willis, M. D., Henze, D. K., Lee, C. J., Herber, A. B., and Abbatt, J. P. D.: Source attribution of Arctic black carbon constrained by aircraft and surface measurements, Atmos. Chem. Phys., 17, 11971–11989, https://doi.org/10.5194/acp-17-11971-2017, 2017.
Xu, W., Zipser, E. J., and Liu, C.: Rainfall characteristics and convective properties of mei-yu precipitation systems over South China, Taiwan, and the South China Sea. Part I: TRMM observations, Mon. Weather Rev., 137, 4261–4275, https://doi.org/10.1175/2009MWR2982.1, 2009.
Yim, S. Y., Wang, B., Xing, W., and Lu, M. M.: Prediction of Meiyu rainfall in Taiwan by multi-lead physical–empirical models, Clim. Dynam., 44, 3033–3042, https://doi.org/10.1007/s00382-014-2340-0, 2015.
Yin, Y., Wurzler, S., Levin, Z., and Reisin, T. G.: Interactions of mineral dust particles and clouds: Effects on precipitation and cloud optical properties, J. Geophys. Res., 107, 4724, https://doi.org/10.1029/2001JD001544, 2002.
Yu, F. and Luo, G.: Simulation of particle size distribution with a global aerosol model: contribution of nucleation to aerosol and CCN number concentrations, Atmos. Chem. Phys., 9, 7691–7710, https://doi.org/10.5194/acp-9-7691-2009, 2009.
Zender, C. S., Bian, H., and Newman, D.: Mineral Dust Entrainment and Deposition (DEAD) model: Description and 1990s dust climatology, J. Geophys. Res.-Atmos., 108, 4416, https://doi.org/10.1029/2002JD002775, 2003.
Zender, C. S., Miller, R. L., and Tegen, I.: Quantifying mineral dust mass budgets: Terminology, constraints, and current estimates, EOS T. Am. Geophys. Un., 85, 509–512, 2004.
Zhang, Y., Luo, G., and Yu, F.: Seasonal Variations and Long-Term Trend of Dust Particle Number Concentration Over the Northeastern United States, J. Geophys. Res.-Atmos., 124, 13140–13155, https://doi.org/10.1029/2019JD031388, 2019.
Zhang, Y., Cai, Y. J., Yu, F., Luo, G., and Chou, C. C. K.: Seasonal Variations and Long-term Trend of Mineral Dust Aerosols over the Taiwan Region, Aerosol Air Qual. Res., 21, 200433, https://doi.org/10.4209/aaqr.2020.07.0433, 2020a.
Zhang, Y., Yu, F., Luo, G., Chen, J. P., and Chou, C. C. K.: Impact of mineral dust on summertime precipitation over the Taiwan region, J. Geophys. Res.-Atmos., 125, e2020JD033120, https://doi.org/10.1029/2020JD033120, 2020b.
Zhang, Y., Fan, J., Li, Z., and Rosenfeld, D.: Impacts of cloud microphysics parameterizations on simulated aerosol–cloud interactions for deep convective clouds over Houston, Atmos. Chem. Phys., 21, 2363–2381, https://doi.org/10.5194/acp-21-2363-2021, 2021.
Zhao, C., Liu, X., Ruby Leung, L., and Hagos, S.: Radiative impact of mineral dust on monsoon precipitation variability over West Africa, Atmos. Chem. Phys., 11, 1879–1893, https://doi.org/10.5194/acp-11-1879-2011, 2011.
Zimmermann, F., Weinbruch, S., Schütz, L., Hofmann, H., Ebert, M., Kandler, K., and Worringen, A.: Ice nucleation properties of the most abundant mineral dust phases, J. Geophys. Res., 113, D23204, https://doi.org/10.1029/2008JD010655, 2008.