the Creative Commons Attribution 4.0 License.
the Creative Commons Attribution 4.0 License.
 | 01 Dec 2021
Measurement report: Observation-based formaldehyde production rates and their relation to OH reactivity around the Arabian Peninsula
John N. Crowley
Efstratios Bourtsoukidis
Achim Edtbauer
Philipp G. Eger
Lisa Ernle
Hartwig Harder
Bettina Hottmann
Monica Martinez
Uwe Parchatka
Jean-Daniel Paris
Eva Y. Pfannerstill
Roland Rohloff
Jan Schuladen
Christof Stönner
Ivan Tadic
Sebastian Tauer
Nijing Wang
Jonathan Williams
Jos Lelieveld
Horst Fischer
Formaldehyde (HCHO) is the most abundant aldehyde in the troposphere. While its background mixing ratio is mostly determined by the oxidation of methane, in many environments, especially in the boundary layer, HCHO can have a large variety of precursors, in particular biogenic and anthropogenic volatile organic compounds (VOCs) and their oxidation products. Here we present shipborne observations of HCHO, hydroxyl radical (OH) and OH reactivity (R(OH)), which were obtained during the Air Quality and Climate Change in the Arabian Basin (AQABA) campaign in summer 2017. The loss rate of HCHO was inferred from its reaction with OH, measured photolysis rates and dry deposition. In photochemical steady state, the HCHO loss is balanced by production via OH-initiated degradation of VOCs, photolysis of oxygenated VOCs (OVOCs) and the ozonolysis of alkenes. The slope αeff from a scatter plot of the HCHO production rate versus the product of OH and R(OH)eff (excluding inorganic contribution) yields the fraction of OH reactivity that contributes to HCHO production. Values of αeff varied between less than 2 % in relatively clean air over the Arabian Sea and the southern Red Sea and up to 32 % over the polluted Arabian Gulf (also known as Persian Gulf), signifying that polluted areas harbor a larger variety of HCHO precursors. The separation of R(OH)eff into individual compound classes revealed that elevated values of αeff coincided with increased contribution of alkanes and OVOCs, with the highest reactivity of all VOCs over the Arabian Gulf.
- Article
(5624 KB) - Full-text XML
-
Supplement
(918 KB) - BibTeX
- EndNote


Formaldehyde (HCHO) is a ubiquitous trace gas that can help provide insight into the dynamical and chemical processes controlling atmospheric composition as an important source of hydroperoxyl radicals (HO2) (Volkamer et al., 2010; Whalley et al., 2010; Anderson et al., 2017). The global atmospheric distribution of HCHO is dominated by in situ production during the oxidation of volatile organic compounds (VOCs) (Fortems-Cheiney et al., 2012; Anderson et al., 2017), although primary emissions from biomass burning (Akagi et al., 2011; Coggon et al., 2019; Kluge et al., 2020), vegetation (DiGangi et al., 2011), the industry sector (Parrish et al., 2012), shipping (Marbach et al., 2009; Celik et al., 2020) and agriculture (Kaiser et al., 2015) can contribute significantly to the local HCHO abundance. HCHO is the most abundant aldehyde in the atmosphere and one of the few oxygenated volatile organic compounds (OVOCs) that can be measured directly from satellites (De Smedt et al., 2008, 2012, 2015, 2018; Marbach et al., 2009; Zhu et al., 2020). In particular, the ability to measure HCHO from satellites has instigated several studies on the relation between HCHO column densities and emissions of isoprene, one of its dominant biogenic precursors (Palmer et al., 2003; Shim et al., 2005; Millet et al., 2008; Wolfe et al., 2016). In most of the free troposphere and the remote marine boundary layer (MBL), HCHO mixing ratios are determined by methane (CH4) oxidation (Ayers et al., 1997; Weller et al., 2000; Wagner et al., 2002; Anderson et al., 2017) and degradation of the oxidation products methanol (CH3OH), methylhydroperoxide (CH3OOH) and other ubiquitous OVOCs like acetone (Kormann et al., 2003; Reeves and Penkett 2003; Stickler et al., 2006; Anderson et al., 2017). In polluted areas, the oxidation of a large variety of biogenic and anthropogenic precursors contributes to HCHO production (Liu et al., 2007; DiGangi et al., 2012; Wolfe et al., 2016; Wennberg et al., 2018; Kluge et al., 2020). ratios have been used to differentiate between nitrogen oxide (NOx = NO + NO2) and VOC-limited ozone production (Martin et al., 2004; Duncan et al., 2010; Schroeder et al., 2017; Tadic et al., 2020) and to infer global hydroxyl radical (OH) concentrations (Wolfe et al., 2019). If HCHO loss rates are well defined, estimation of the concentrations of OH from HCHO mixing ratios is feasible since HCHO production is dominated by the oxidation of VOCs via OH.
Formaldehyde production in the troposphere results from reactions of VOCs with OH; ozone (O3) and the nitrate radical (NO3), with the oxidation processes to be dominated by OH over the day and by NO3 during nighttime, for many trace gases of biogenic origin. Liebmann et al. (2018) showed that the daytime loss of biogenic compounds via reaction with NO3 can also be significant in forested areas. Unsaturated hydrocarbons (e.g. ethene, isoprene and terpenes) additionally react with O3 in the form of a cycloaddition to form energy-rich primary ozonides (Criegee intermediates) that rapidly fragment, releasing HCHO (Cox et al., 2020). This class of reactions is most important in relation to biogenic emissions in forested regions. Many OVOCs (e.g. alcohols, aldehydes, hydroperoxides, alkylnitrates) also produce HCHO in reactions with OH, chlorine radicals or via photolysis. Alkanes react with OH, forming saturated peroxy radicals (RO2) that further react with NO to form alkoxy radicals and subsequently carbonyl compounds including HCHO. Since the oxidation of almost every VOC can produce HCHO, some with a yield greater than unity (Luecken et al., 2018), HCHO is an ideal candidate to test our understanding of VOC chemistry using zero-dimensional box models (Wagner et al., 2002; Fried et al., 2011) and three-dimensional general circulation models (Kormann et al., 2003; Liu et al., 2007; Klippel et al., 2011; Anderson et al., 2017).
In addition to the integral of contributions by individual HCHO production pathways, the production rate of HCHO resulting from reactions involving OH chemistry (POH(HCHO)) can be deduced from the OH concentration ([OH]), the HCHO yield αi and the OH reactivity (R(OH)), which represents the summation of trace gases Ri that react with OH with the rate coefficient ki; Wolfe et al., 2019):
with
R(OH) includes reactions of OH with species like carbon monoxide (CO), sulfur dioxide (SO2), nitrogen dioxide (NO2) or nitrogen oxide (NO) that do not result in HCHO formation as well as reactions with VOCs like methane, alkanes, alkenes, aromatics or OVOCs (Williams and Brune, 2015). Calculating POH(HCHO) this way has the advantage that reactions of non-measured VOCs with OH will be included. Not all reactions with OH will produce HCHO, which is accounted for by the yield factor α (Wolfe et al., 2019), which is a summation over the HCHO yield αi of each ki⋅Ri. For reactants that do not yield HCHO (e.g. NO, NO2, SO2, CO, O3 and HCHO itself), αi is zero. Species that yield HCHO have positive αi values (e.g. CH4, isoprene, etc.). Note that the individual αi values and thus the overall α can be functions of NOx (Wolfe et al., 2016). For example, the yield of HCHO from methane oxidation depends on the fate of the initially formed methyl peroxy radical (CH3O2). At high NOx levels, CH3O2 will react with NO, subsequently forming HCHO. At low NOx, CH3O2 preferentially reacts with the hydroperoxy radical (HO2) forming methyl hydroperoxide (CH3OOH), reducing the yield of HCHO production from CH4 oxidation (Wagner et al., 2002). Since the production of HCHO is not only controlled by OH chemistry, Padd(HCHO) represents additional sources for instance direct emissions, its production due to photolysis (e.g. CH3OOH, acetaldehyde (CH3CHO) and further OVOCs) and the ozonolysis of alkenes (Stickler et al., 2006; Parrish et al., 2012; Anderson et al., 2017).
In photochemical steady state (PSS), P(HCHO) is expected to be balanced by HCHO losses (L(HCHO)) and is most likely achieved at midday (jHCHO ∼ 7 × 10⁻⁵ s−1; R(OH+HCHO) ∼ 4 × 10⁻⁵ s−1), when the formaldehyde lifetime is ∼ 2.5 h. In this study we used the PSS assumption to calculate P(HCHO) via its loss reactions:
The first term within brackets in Eq. (4) represents HCHO loss due to reaction with OH radicals, while the second term describes total losses due to photolysis (both the radical and molecular channel). In the boundary layer, additional loss due to dry deposition has to be considered and depends on the deposition velocity vd and the boundary layer height (BLH), i.e. its mixing volume. Further loss due to wet deposition has been neglected in this study since we did not encounter significant precipitation during the AQABA campaign. The derived production and loss rates of HCHO can be influenced by direct emissions or by advective transport. Obvious direct emissions from ship plumes or other sources were excluded from the dataset. The potential role of transport is addressed in Sect. 4.
In this study we use in situ observations of HCHO, OH, R(OH) and jHCHO together with the HCHO deposition velocity vd (calculated for 34 m above the ocean; Stickler et al., 2007) and ERA-5 meteorological data of the BLH (https://www.ecmwf.int/en/forecasts/datasets/reanalysis-datasets/era5, last access: 3 December 2020), which were obtained during a ship cruise around the Arabian Peninsula as part of the AQABA (Air Quality and Climate Change in the Arabian Basin) campaign in summer 2017. From this dataset, we calculated the loss rates of HCHO, which represent P(HCHO) during PSS conditions. Scatter plots of [OH] × R(OH) versus P(HCHO) yield the lower estimate of the formaldehyde yield α with respect to total OH chemistry (including NOx, SO2 and other non-HCHO-producing reactions; see Fig. S2 in the Supplement), reflecting the transition between rather clean to highly polluted conditions, both with respect to NOx and VOCs.
For further interpretation, the effective HCHO yield αeff was determined for each region by removal of non-HCHO-yielding reactions (of NO, NO2, SO2, CO, HCHO and O3 with OH) from the OH reactivity data (R(OH)eff, Fig. S1).
The major questions addressed in this study are the following:
-
Are reactions involving OH the dominant HCHO source in the different regions around the Arabian Peninsula, or do photolysis (e.g. of oxidized organics), reactions (e.g. of unsaturated hydrocarbons) with O3 or direct emissions contribute significantly to the HCHO distribution?
-
Can this method be used to identify whether the local HCHO distribution can be explained through OH oxidation only?
-
What is the contribution of different VOC compound classes (alkanes, alkenes, aromatics, OVOC) towards HCHO production via reaction with OH?
In Sect. 2, we give a brief outline of the AQABA cruise and the measurements performed. An investigation of the balance between HCHO production via the product of R(OH) and OH (Eq. 1) and production deduced from HCHO loss assuming PSS (Eq. 3) is given in Sect. 3. Section 4 covers a discussion of the variation of α and αeff in different regions, and a summary of the results obtained is presented in Sect. 5.
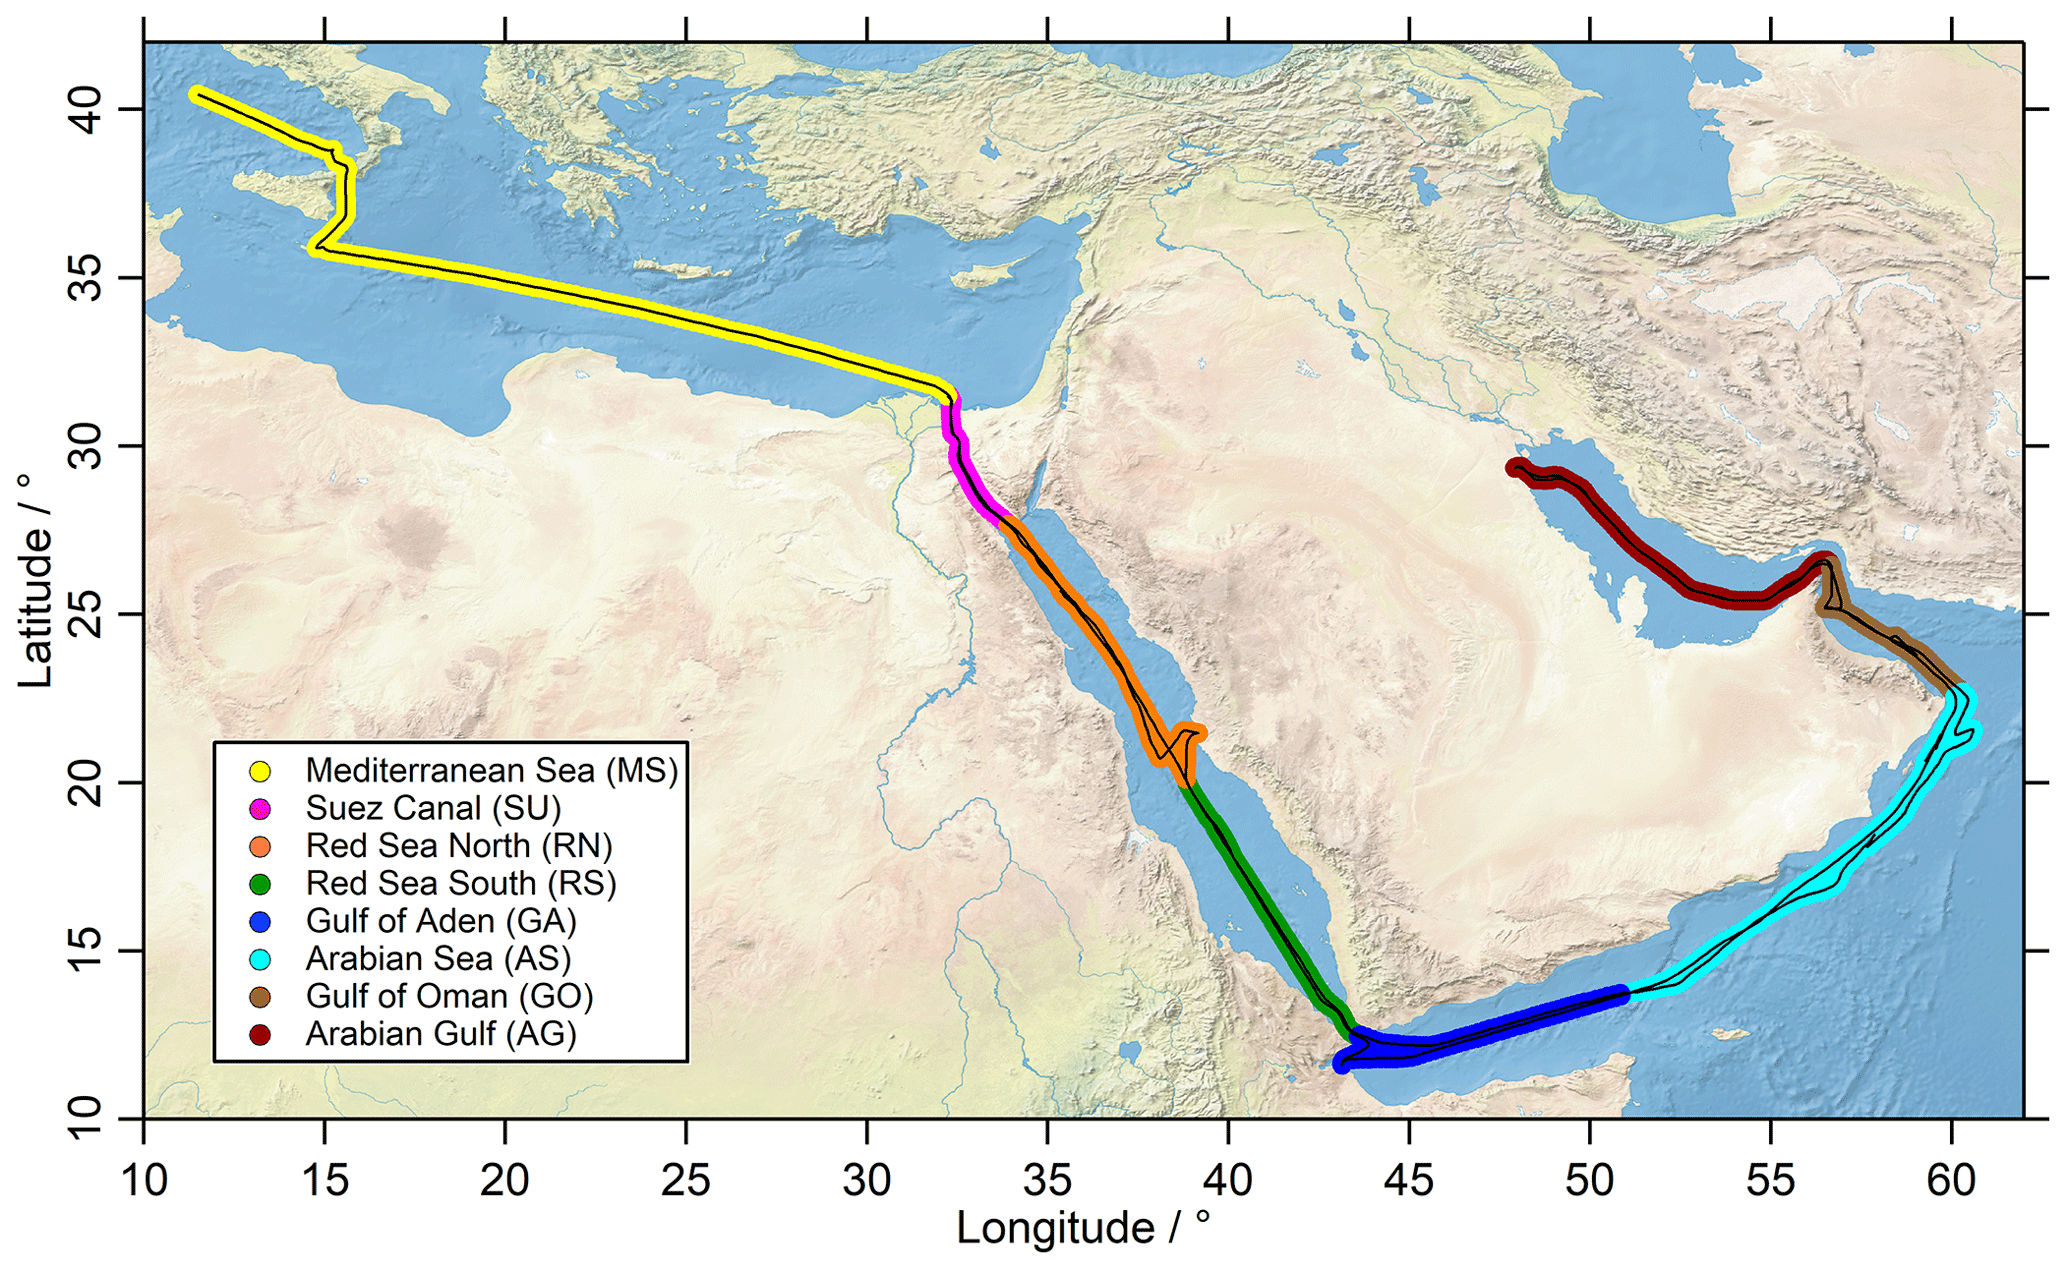
Figure 1The ship route (black) of the Kommandor Iona during the AQABA cruise subdivided into eight regions: Mediterranean Sea (MS: yellow), Suez Canal (SU: pink), Red Sea north (RN: orange), Red Sea south (RS: green), Gulf of Aden (GA: blue), Arabian Sea (AS: turquoise), Gulf of Oman (GO: brown) and Arabian Gulf (AG: red).
Measurements during AQABA took place on board the research and survey vessel Kommandor Iona from 25 June to 3 September 2017. The first leg from southern France to Kuwait started in La Seyne-sur-Mer (near Toulon, France) and continued via the Mediterranean Sea, the Suez Canal, the Red Sea, the Arabian Sea, the Gulf of Oman and the Arabian Gulf (also known as the Persian Gulf) to Kuwait. During the second leg, the vessel returned via the same route (Fig. 1).
Four laboratory containers with instrumentation for in situ and offline monitoring of a large suite of trace gases, particles and radicals were mounted on the front deck of the ship. With the exception of aerosols and radical measurements (OH and HO2), air sampling was achieved from a high-flow (10 m3 min−1) cylindrical stainless-steel inlet (HFI, sampling height: 5.5 m above deck, diameter: 0.2 m), placed between the containers on the front deck of the ship. Air was drawn from the center of the HFI into the air-conditioned laboratory containers using PFA (perfluoroalkoxy alkane) tubing. The inlet for OH and HO2 measurements was mounted on top of a laboratory container closest to the bow.
Formaldehyde measurements were based on the Hantzsch technique using a commercial instrument (Aero-Laser, model AL4021, Garmisch-Partenkirchen, Germany). The limit of detection (LOD), determined from the reproducibility of on-board zero-air measurements, was between 80 and 128 pptv (influenced by wave-induced rolling of the ship) with a confidence interval of 1σ. The total measurement uncertainty including line losses was 13 % (Dienhart et al., 2021).
Measurements of OH radicals were performed using laser-induced fluorescence (LIF) with the HORUS instrument (Martinez et al., 2010; Hens et al., 2014; Marno et al., 2020). Typical detection limits for OH were between 1 × 10⁵ and 5 × 10⁵ molecules cm−3 with the total uncertainty of ∼ 30 %. OH measurements below the instrumental LOD were excluded from this study. Note that an inlet pre-injector (IPI) was used to determine the OH background signal via chemical modulation (Novelli et al., 2014).
Total OH reactivity was measured using the comparative reactivity method (Sinha et al., 2008; Fuchs et al., 2017). A detailed description of the measurement technique and the results from the AQABA campaign can be found in Pfannerstill et al. (2019). The 5 min detection limit was 5.4 s−1, derived from the 2σ standard deviation of clean air measurements over the Arabian Sea. Total uncertainty (1σ) of the OH reactivity measurements was between 7 % and 60 % with mean and average of 50 %.
Nitrogen oxides (NOx = NO + NO2) were measured with a two-channel chemiluminescence instrument (CLD 790 SR, ECO Physics AG, Dürnten, Switzerland). A detailed description of the instrument during AQABA can be found in Tadic et al. (2020). The measurement uncertainty of the NO data was calculated to be 6 % at 5 min integration time and a confidence level of 1σ. The LOD for the NO channel was estimated as the full width at half maximum of the frequency distribution of all zero-air measurements obtained during the campaign to be 9 pptv with a confidence level of 1σ. The total uncertainty of the NO2 data was estimated as a conservative upper limit at 23 % as the average of the relative uncertainties of all data points obtained during the campaign. The absolute detection limit of the NO2 instrument was estimated at 112 pptv (Tadic et al., 2020).
O3 measurements were performed with a commercial absorption photometer (model 202 ozone monitor, 2B Technologies, Boulder, Colorado, USA). Water and particle interferences during the expedition were minimized by sampling through a Nafion tube and a Teflon filter; the overall uncertainty of the data was 2 % (Tadic et al., 2020).
CO and CH4 mixing ratios were determined with a cavity ring-down spectrometer (Picarro G2401; Santa Clara, USA) with a precision of ≤8 ppbv for CO and ≤0.3 ppbv for CH4. The air was not dried prior to analysis, and water vapor effects were corrected. The data were quality-controlled following ICOS (Integrated Carbon Observing System) standards; further details can be found in Paris et al. (2021).
Non-methane hydrocarbons (NMHCs) were measured with two coupled GC–FID systems (GC5000VOC and GC5000BTX; AMA Instruments GmbH, Germany). The GC5000VOC was used for the quantification of light hydrocarbons (C2–C6), while the CG5000BTX was used for the heavier hydrocarbons and aromatics (C6–C8). The NMHCs have average detection limits in the range of 1–25 pptv and a total uncertainty in the range of 6 %–13 % (Bourtsoukidis et al., 2019).
OVOCs were detected with a proton-transfer-reaction time-of-flight mass spectrometer (PTR-ToF-MS 8000, Ionicon Analytik GmbH, Innsbruck, Austria) with a total measurement uncertainty in the range of 6 %–17 %; an accuracy of ∼ 50 %; and 3σ detection limits (derived by background measurements) of 52 ± 26 pptv for acetaldehyde, 22 ± 9 pptv for acetone, and 9 ± 6 pptv for methyl ethyl ketone (Wang et al., 2020).
Sulfur dioxide (SO2) was detected with a chemical ionization quadrupole mass spectrometer (CI-QMS) using an electrical, radio-frequency discharge ion source with a detection limit of 38 pptv and a total uncertainty of 20 % ± 23 pptv. Further details about the instrument and ionization method are described in Eger et al. (2019).
Photolysis rates for a large number of trace gases were calculated from wavelength-resolved actinic flux measurements with a spectral radiometer (Metcon GmbH, Glashütten, Germany) located approximately 10 (∼ 5 m above the front deck). The total uncertainty of the HCHO photolysis rates obtained are ∼ 10 %, based on the calibration of the instrument (Bohn et al., 2008), and the data were not corrected for upwelling radiation, which is considered to be insignificant at the sea surface.
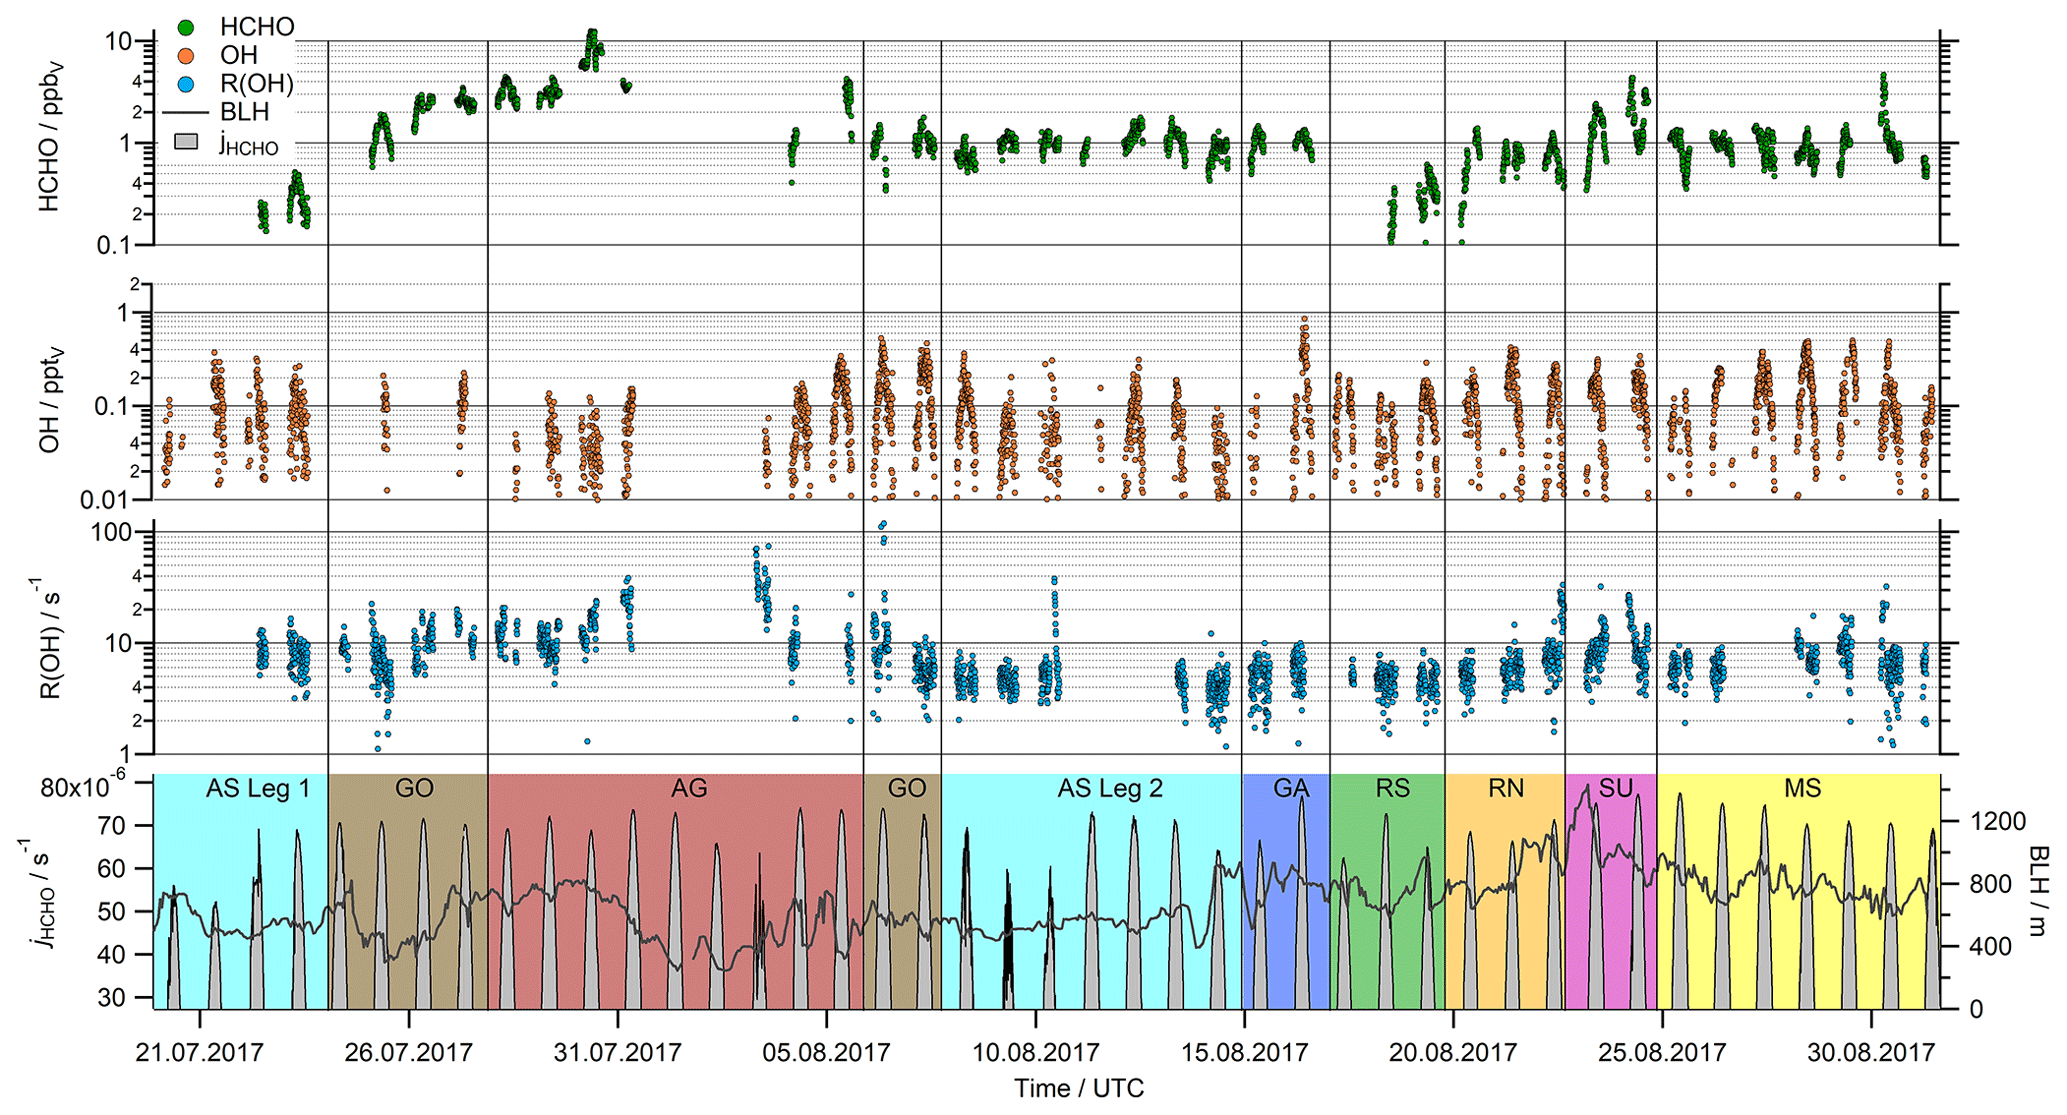
Figure 2Time series of HCHO, OH, R(OH) and the HCHO photolysis (jHCHO, sum of the molecular and the radical channel) in 5 min resolution. For the boundary layer height (BLH), we used the ERA-5 meteorological reanalysis data in hourly averages, which resolve the earth's atmosphere on a 30 km grid (https://www.ecmwf.int/en/forecasts/datasets/reanalysis-datasets/era5, last access: 3 December 2020).
As the sampling location was in front of the ship's chimney, contamination of the measurements with the ship's own exhaust occurred when the vessel was sailing ahead of the wind. Thus, a data filter based on relative wind direction and NO, CO and SO2 observations was used to eliminate contaminated data (including other ship exhaust emissions and the stops in Jeddah and Kuwait). This affected mainly the measurements during the first leg of the cruise (Tadic et al., 2020).
The daytime observations of HCHO, OH, R(OH) and the photolysis rate of HCHO (jHCHO) during the AQABA cruise are displayed in Fig. 2. Note that only daytime observations ( ≥ 3 × 10⁻³ s−1) after 20 July 2017 (the start of the OH measurements) were used in this study. Formaldehyde mixing ratios varied between minimum values of approximately 0.1 ppbv over the Arabian Sea during the first leg (AS Leg 1; 20–23 July) and the Red Sea south (RS; 17–19 August) up to more than 10 ppbv over the Arabian Gulf (AG; 28 July to 5 August). The highest values were detected at the center of the gulf, coincident with the highest ozone (O3) mixing ratios > 150 ppbv during AQABA (Tadic et al., 2020). Simultaneously, elevated ethene (Bourtsoukidis et al., 2019), OVOCs (Wang et al., 2020) and organic peroxides (Dienhart et al., 2021) highlight that this area as a hotspot of photochemical air pollution. Median HCHO concentrations between 1 and 2 ppbv were measured in most of the other regions (Mediterranean Sea (MS); Red Sea north (RN); Gulf of Aden (GA); Arabian Sea leg 2 (AS Leg 2); Gulf of Oman (GO)), while pollution events also occurred in the area around the Suez Canal (SU). In general, diurnal variations of HCHO with maximum values around local noon were observed, while the diurnal variation in clean regions like the Arabian Sea was quite small (Fig. 2).
Strong diurnal variations were observed for OH mixing ratios with noontime maximum values varying between 0.1 and 0.5 pptv in most regions. The highest noontime mixing ratios (∼ 0.8 pptv) were observed over the Gulf of Aden (GA; 16 August), while air masses over the Gulf of Oman (GO) and the Mediterranean Sea (MS) also showed elevated concentrations of OH (Fig. 2). Although there is some regional variation, there is no clear trend with respect to the different locations, as, for example, found for HCHO mixing ratios.
Large regional variations were also found for the OH reactivity, with noontime values ranging from close to the detection limit over the Arabian Sea (AS Legs 1 and 2), the Gulf of Aden (GA) and the Red Sea (RS and RN) to values of more than 30 s−1, predominately in the polluted regions of the Arabian Gulf (AG) and the Suez Canal (SU). For a detailed discussion of the OH reactivity in different regions and its relations to VOCs and inorganic compounds, see Pfannerstill et al. (2019).
Noontime maxima of the formaldehyde photolysis rates varied between 4.5 × 10⁻⁵ and 7.8 × 10⁻⁵ s−1. On most days, clear diurnal profiles were observed under clear-sky conditions. Significant cloud cover was observed only on 20–22 July and 8–10 August.
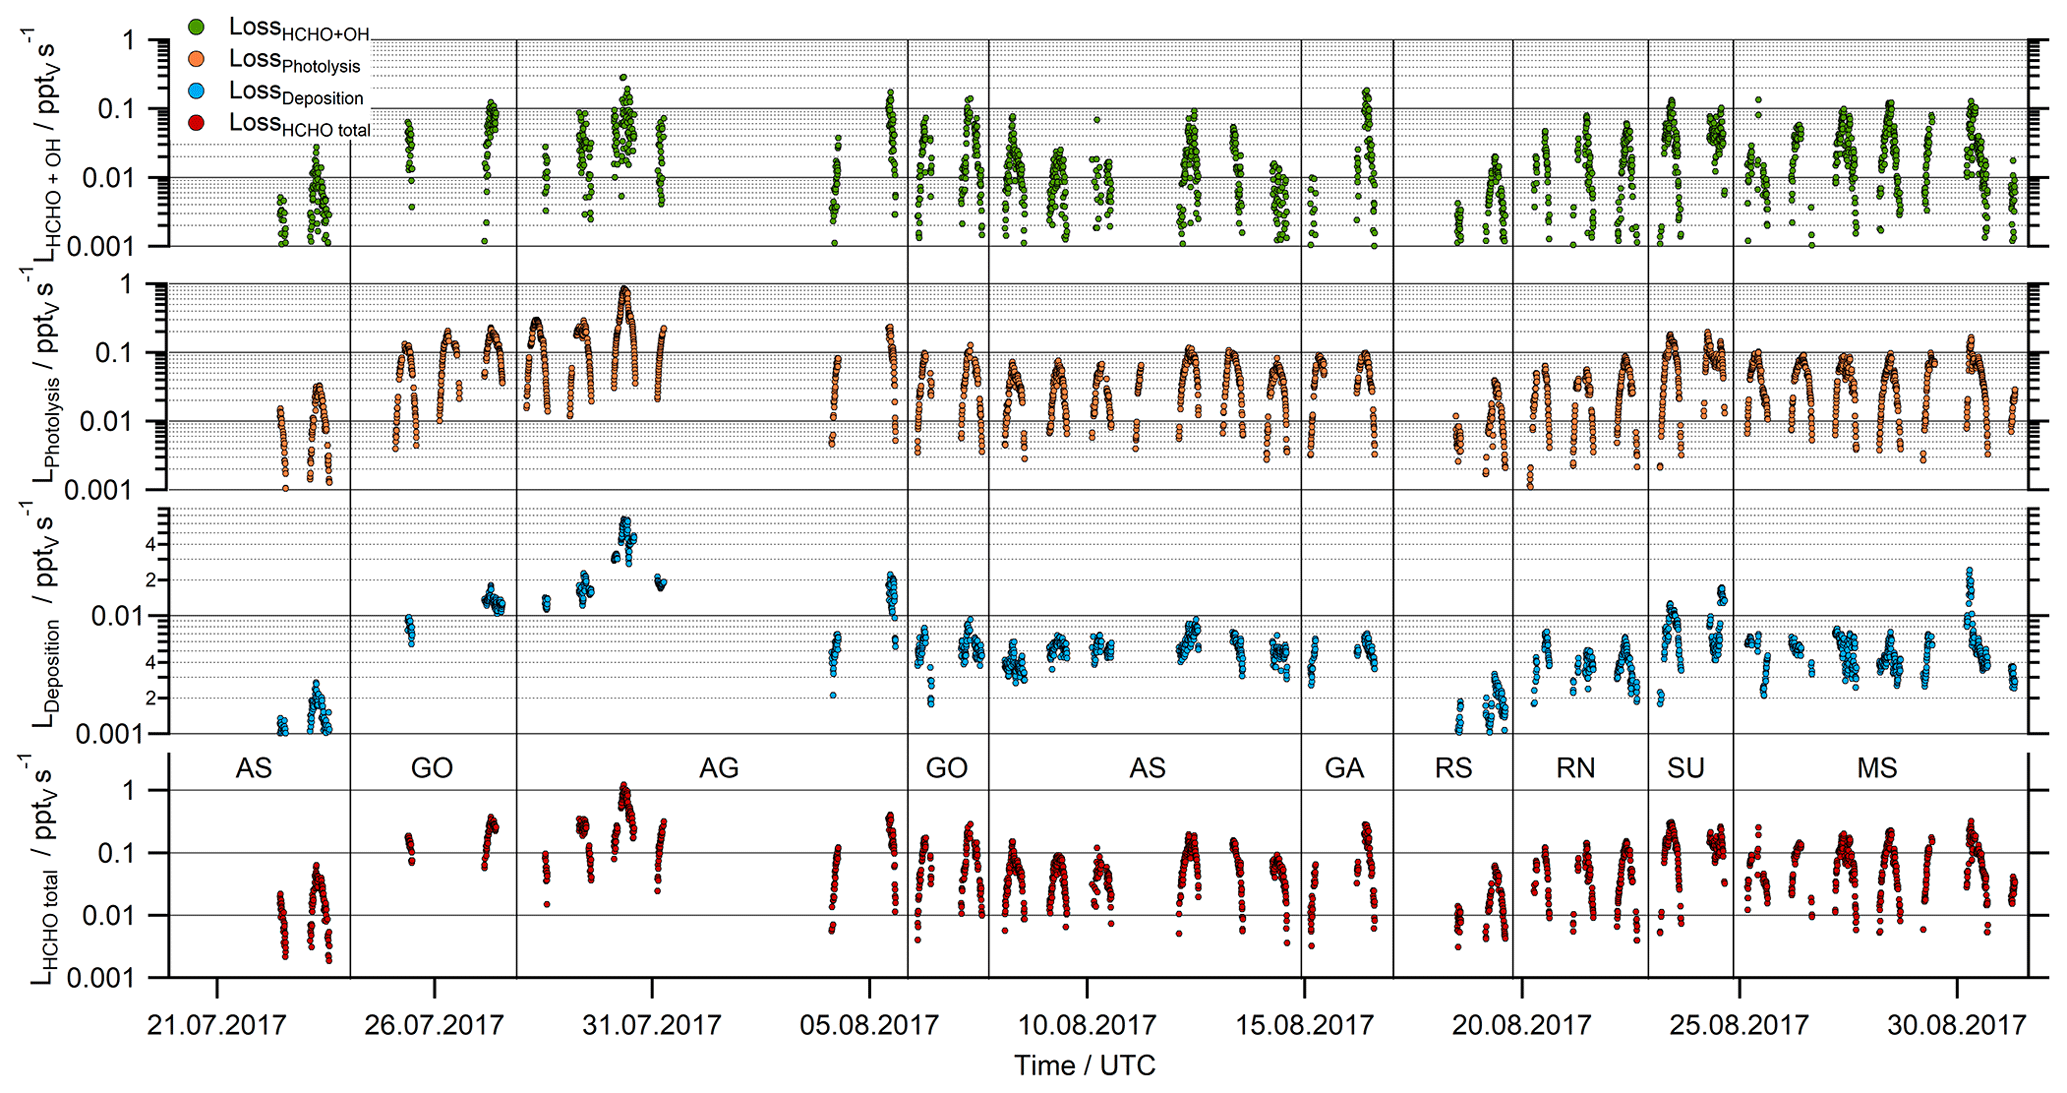
Figure 3HCHO loss rates due to reaction with OH, photolysis, dry deposition and the total sink as the sum of all three processes.
The boundary layer height varied between 250 and 1400 m (Fig. 2), with least diurnal variation in the Arabian Sea and the Mediterranean Sea with a mean of 566 and 780 m, respectively. The boundary layer height in other regions was more variable, with a mean value (± 1σ) for the entire dataset (excluding the stop in Kuwait) of 750 ± 113 m.
The sink of HCHO was calculated by summing the loss rate coefficients through reaction with OH, photolysis and dry deposition (Eq. 4, Fig. 3). Based on Gaussian error propagation of uncertainty in the HCHO and OH mixing ratios, jHCHO, and in the rate coefficient kOH for reaction of OH with HCHO, the total uncertainties of the loss rates due to OH and jHCHO are 33 % and 15 %, respectively. Loss of HCHO via photolysis and reaction with OH were found to be of the same order of magnitude, with total noontime loss rates varying from 0.01 up to 1 pptv s−1. The formaldehyde sinks due to OH and photolysis were on the order of 0.1 pptv s−1 during noon, with the lowest values over the Arabian Sea, the Gulf of Aden (8–15 August) and the southern Red Sea (18–20 August). Significantly enhanced noontime values (> 0.2 pptv s−1) were found for the loss through photolysis over the Arabian Gulf (28–31 August) due to the elevated HCHO mixing ratios.
The removal of HCHO by dry deposition depends on turbulent transport and also on the wind speed. Since our results for the HCHO mixing ratio are just one dimensional, the dry deposition could not be calculated directly for the AQABA dataset and was thus inferred with the literature value for the HCHO deposition velocity (vd) over sea and the boundary layer height. In our analysis we used a fixed value of 0.36 ± 0.18 cm s−1 for vd based on the findings by Stickler et al. (2007). For the BLH, we used the mean value (± 1σ) of the ERA-5 results (750 ± 113 m). Assuming an uncertainty of 50 % for vd and 15 % for the BLH as conservative estimate results in an uncertainty of 52 % for the dry deposition term.
Close to local noon, the loss rate due to dry deposition was in general below 0.1 pptv s−1 and thus much smaller than HCHO removal by either photolysis or reaction with OH (Fig. 3). Only close to sunrise and sunset was dry deposition of similar magnitude to photochemical loss processes. The lowest panel in Fig. 3 shows the sum of all three loss processes according to Eq. (4). Based on Gaussian error propagation, the estimated uncertainty of L(HCHO) is 62 %.
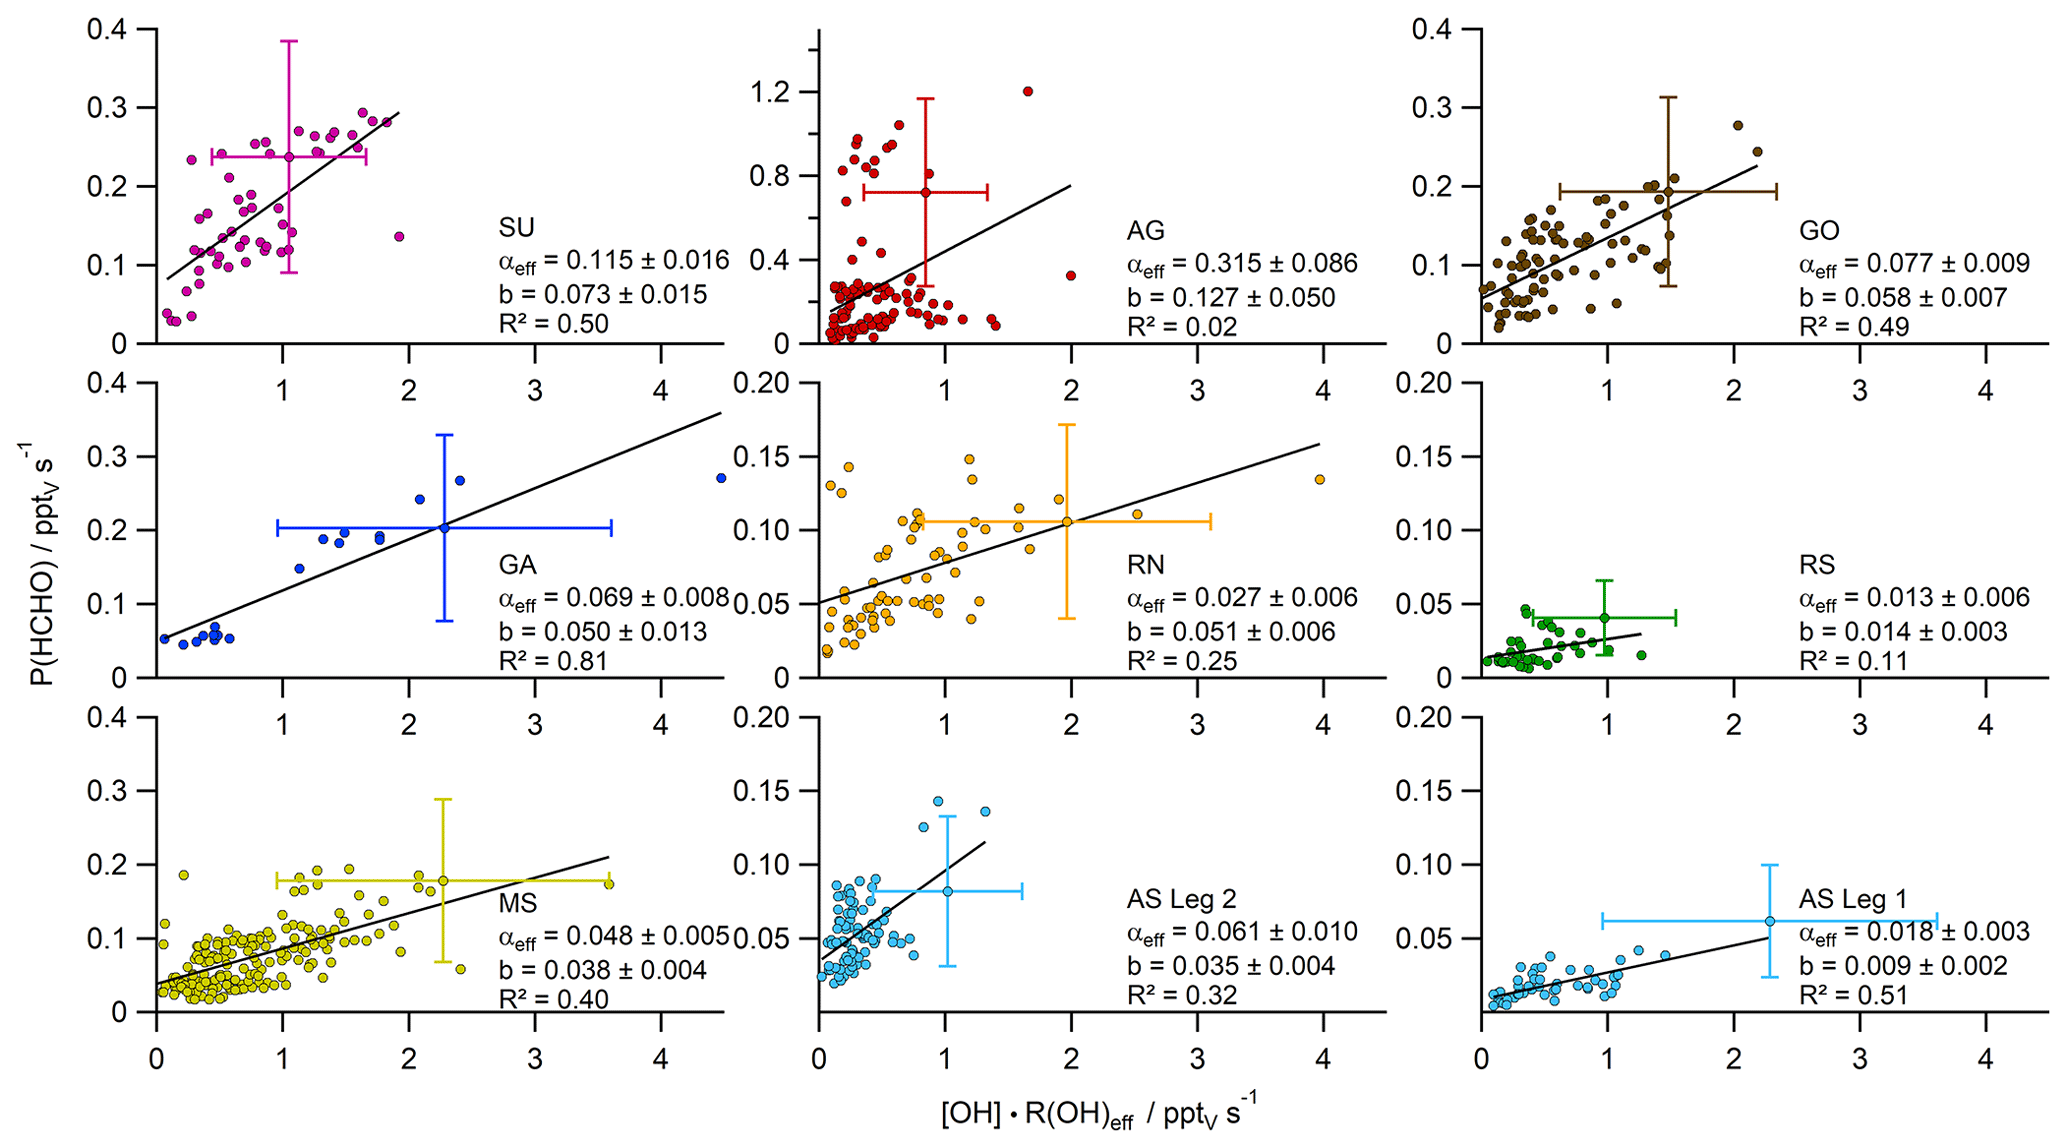
Figure 4Scatter plots with bivariate fits (York et al., 2004) of the product [OH] × R(OH)eff (± 58 %) versus the HCHO production rate P(HCHO) (± 62 %), subdivided into the different regions probed during the AQABA cruise. The slope of the respective regression represents the HCHO yield αeff, while the intercept can be interpreted as additional HCHO sources not related to OH chemistry (Padd(HCHO)).
In photochemical steady state the HCHO loss and production balance each other, and a scatter plot of the product of the OH reactivity R(OH) (s−1) and the OH mixing ratio (pptv) versus the HCHO production rate P(HCHO) (= LHCHO total) yields the slope, i.e. the factor α according to Eq. (5) (Fig. 4). A compact linear relationship is expected under PSS conditions if chemical conditions do not change and the air mass is not affected by transport, while data points that do not fulfill PSS (e.g. due to direct emissions from point sources or advection of HCHO-enriched or HCHO-depleted air masses) are expected to not follow the regression line, yielding additional scatter. For example, a fresh pollution plume (e.g. containing unsaturated hydrocarbons and no primary HCHO) would result in data shifted below the regression line since a high OH reactivity is expected along with low initial HCHO production, as secondary processes taking place over longer timescales (e.g. photolysis) are involved in the HCHO production from unsaturated hydrocarbons. The dataset covers a highly polluted event in AG (30 July 2017), although the high ratio, as well as enhanced methanol, acetaldehyde and O3 mixing ratios (Wang et al., 2020; Tadic et al., 2020), indicates rather processed air masses which could also include primary emissions of HCHO. Primary emission from point sources would likely shift data above the regression line due to the correlation with the HCHO mixing ratio (although this effect can be compensated for depending on the OH concentration in emission plumes). The primary emission of HCHO cannot be accurately identified, but we removed obvious pollution events (e.g. plumes from ships or oil rigs) via covariance with elevated NOx, CO and SO2 mixing ratios. Furthermore, rainout can affect the relationship, because it would result in data points shifted below the regression line, although the impact can be neglected in this study as only minor precipitation occurred in AS on the 12 August 2017 during the night.
In our analysis, we first subdivided the data into the smaller regions according to Fig. 1 and examined the correlation between P(HCHO) and [OH] × R(OH) for each subregion (Fig. S2). For the Arabian Sea, the dataset has been further partitioned into the two individual legs heading towards and away from the Gulf of Oman. This is justified by the significant differences in HCHO mixing ratios and R(OH) during the two legs (AS Legs 1 and 2), reflecting different air-mass origins. For the individual regions, bivariate fits were performed according to York et al. (2004). In general, values of R2 varied between 0.08 (Arabian Gulf) and 0.82 for the Gulf of Aden, while the slopes (α) varied between less than 0.02 for the Arabian Sea during the first leg and the southern Red Sea and up to 0.26 for the Arabian Gulf. The highly elevated P(HCHO) values over the Arabian Gulf (Fig. S2) also include data during a pollution event on 30 July 2017 in the center of the gulf (Fig. 2; see also Tadic et al., 2020; Wang et al., 2020; Pfannerstill et al., 2019; Bourtsoukidis et al., 2019) and thus the evaluated α in AG is likely influenced by primary emissions or transport of air pollution from the western coast of the gulf. However, this pollution event seems to be representative for this unique region; thus, we did not exclude the data from the study. Primary emissions of HCHO at low [OH] × R(OH) would result in data shifted towards the y axis and thus may be partially responsible for the positive intercept on the y axis. This would also bias the regression analysis and impact α. Primary emissions of HCHO at low [OH] × R(OH) would tend to increase the intercept, whereas primary emissions at high [OH] × R(OH) would bias α to larger values.
Table 1Average speciated reactivity (R(OH)x ± 1σ standard deviation) of certain compound classes (based on the results of Pfannerstill et al., 2019), R(OH)eff and αeff (± uncertainty of the slope of the bivariate fit). For NOx, the median values are listed instead of the means.
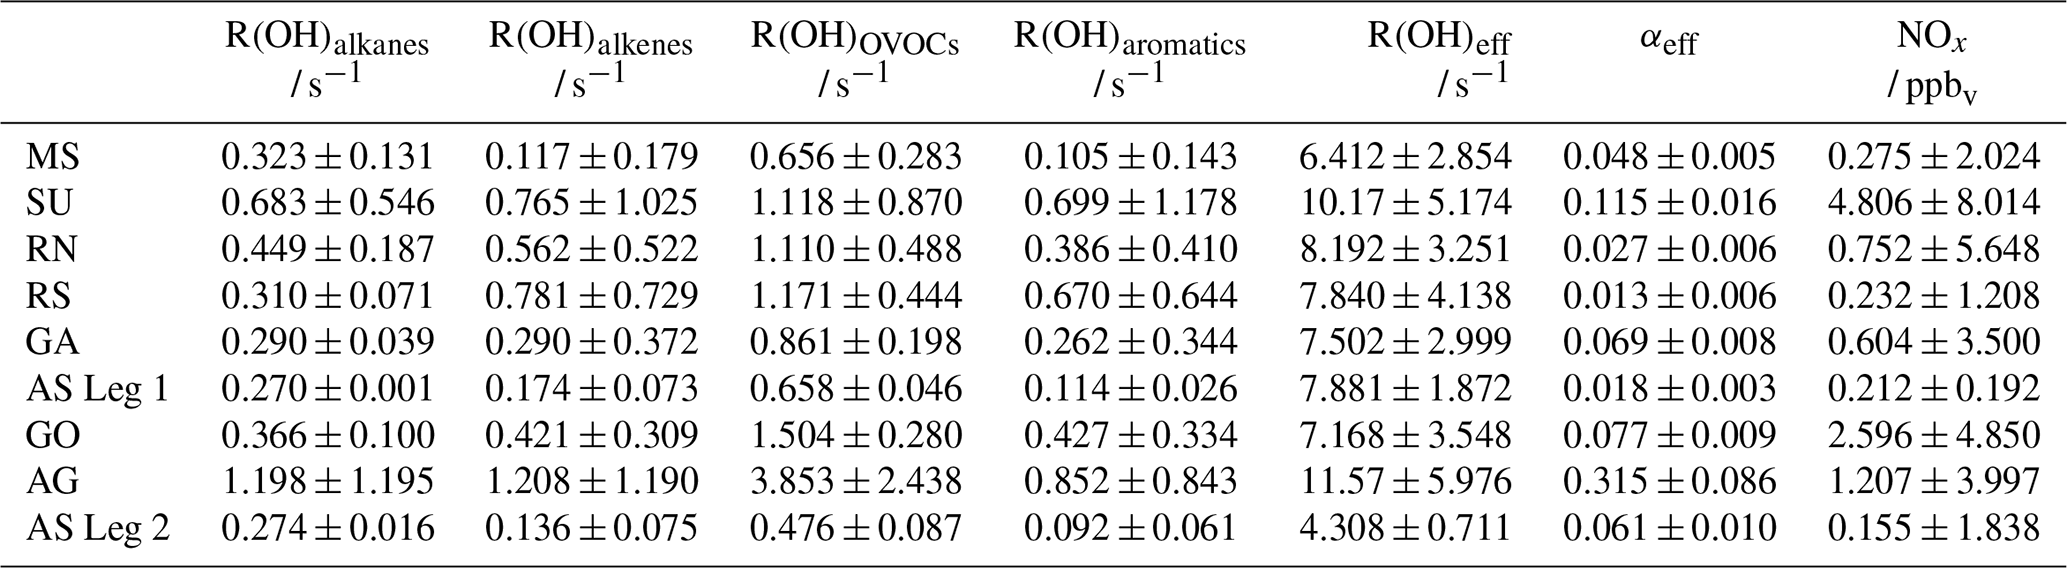
In general, the values of α represent lower limits, since the R(OH) data still include reactions with inorganic trace gases and other species that do not yield HCHO (e.g. CO, NO2 and SO2). The inorganics and CO account for ∼ 10 % of the reactivity, except for the Suez Canal (∼ 16 %) (see Table 1 in Pfannerstill et al., 2019). Nonzero P(HCHO) at zero [OH] × R(OH), corresponding to the intercept b of the linear regression, can be interpreted as the result of several processes including additional chemical loss and production, dry deposition, and may also be related to partial break-down of the PSS assumption when OH is low (e.g. early morning, late evening). The intercept should thus not be overinterpreted and used to calculate deposition velocities. Values for the intercept b (Padd(HCHO)) were less or equal to 0.05 pptv s−1 in most regions; the cleanest regions with respect to NOx and VOCs also showed very low values for Padd(HCHO) with approximately 0.01 pptv s−1 over the Arabian Sea during the first leg and the southern Red Sea, indicating that HCHO production was dominated by OH chemistry. Highest values of Padd(HCHO) were found over the Arabian Gulf (0.14 pptv s−1) and the area around the Suez Canal (0.09 pptv s−1), where enhanced mixing ratios of unsaturated hydrocarbons and OVOCs (Wang et al., 2020) as well as elevated O3 mixing ratios prevailed (Tadic et al., 2020).
For further analysis, we removed the highest contributors to inorganic reactivity (NO, NO2, SO2, O3) and major non-HCHO-yielding reactions (CO, HCHO) from R(OH), which resulted in so-called effective OH reactivity (R(OH)eff). Even though the dataset was already filtered for stack emissions, NOx showed the highest contribution of these reactants (Fig. S1, Table S1 in the Supplement), especially over the Gulf of Oman and while passing Bab-el-Mandeb (16 August 2017) and the Strait of Messina (30 August 2017). Over the Arabian Gulf the correction was dominated by contributions from CO, O3 and HCHO. The use of R(OH)eff resulted in reduced data coverage and an increased slope compared to when using non-adjusted R(OH) (Figs. 4 and S2). The effective HCHO yield αeff increased significantly in five subregions (Suez, Arabian Gulf, Gulf of Oman, Gulf of Aden, Arabian Sea Leg 2), and the plots show in general slightly reduced scatter. Values for the intercept b were not substantially affected by choice of R(OH) or R(OH)eff, and both methods yielded similar results within their uncertainties, except for the Arabian Sea during the second leg, where the intercept decreased to similar values of the Mediterranean Sea when R(OH)eff was used.
According to Eq. (4), formaldehyde loss L(HCHO) is the product of the HCHO mixing ratio and the loss rates due to reaction with OH, photolysis and dry deposition. In photochemical steady state (typical lifetime of HCHO ∼ 2.5 h), formaldehyde loss is equal to its production P(HCHO) (Eq. 4). P(HCHO) varied between 0 and approximately 1.2 pptv s−1, with values above 0.4 pptv s−1 only detected over the Arabian Gulf. Air masses encountered in this region were likely influenced by air pollution, which was mainly transported from the west coast of the gulf and Kuwait, where oil and gas industries are numerous (Pfannerstill et al., 2019). We also detected a biomass burning plume close to the Suez Canal (Wang et al., 2020), which was excluded from this study as it occurred in the early morning and thus a steady state analysis is not appropriate. Additionally, the entire region is well known for its intensive ship transport (Celik et al., 2020); thus, the interference with other primary HCHO sources or, for example, elevated background concentrations are likely. Maximum P(HCHO) was determined at the center of the Arabian Gulf during the first leg, where elevated mixing ratios of unsaturated hydrocarbons, OVOCs and O3 were observed (Bourtsoukidis et al., 2019; Wang et al., 2020; Tadic et al., 2020). This air mass was characterized by rather low OH, slightly elevated OH reactivity and the highest HCHO mixing ratios during AQABA (30 July 2017, Fig. 2), which resulted in data points shifted towards the y axis (Fig. 4). We nevertheless decided to include the data as they represent highly polluted air within the center of this unique region. Minimum values of P(HCHO) were determined over the southern Red Sea and the Arabian Sea during the first leg (≤ 0.05 pptv s−1). In general, these results emphasize the limits of the method used in this study, since primary emissions and transport can significantly affect the local HCHO distribution. Furthermore, some HCHO-yielding reactions require oxidation (not only via OH) and subsequent photolysis steps of rather long-lived oxidation products before releasing HCHO and are thus temporarily decoupled from measurements of OH and OH reactivity. Values of [OH] × R(OH)eff varied between practically zero and more than 4 pptv s−1 with maximum values over the northern Red Sea, the Mediterranean Sea and the Gulf of Aden, while most data represents values ≤ 3 pptv s−1. Rather compact correlations between P(HCHO) and [OH] × R(OH)eff were observed over the Gulf of Aden, the Arabian Sea during Leg 1, the Suez Canal and the Gulf of Oman as indicated by R2 values between 0.49 and 0.81 (Fig. 4). Decreased R2 (less than 0.40) were found for the Mediterranean Sea, the Red Sea, the Arabian Sea during the second leg and the Arabian Gulf. The weak correlation in the Arabian Sea during Leg 2 results from a cluster of data points at low values on both the x and the y axes. In this subregion there was little variation in chemical composition as air masses (during the Indian summer monsoon) originated from the east coast of Africa (Edtbauer et al., 2020, Tegtmeier et al., 2020). In contrast, the results for the Arabian Gulf cover the highest variation of HCHO and VOCs (Bourtsoukidis et al., 2019; Wang et al., 2020) and are characterized by substantial changes in chemical composition, although obvious point sources (e.g. ship exhaust) with enhanced NOx, CO and SO2 mixing ratios were excluded from the entire study.
Based on Eq. (5), the intercept b of the bivariate fit can be interpreted either as an additional loss of HCHO (e.g. washout, dry deposition) or as a region-wide attribution of additional HCHO sources not related to OH chemistry (Padd(HCHO), Fig. 4). The effect of washout should be negligible, since we only experienced a short rain event on the 12 August 2017 during the night. Dry deposition can only account for 8 %–19 % of the intercept, based on our calculation with literature values for the deposition velocity (Stickler et al., 2007) and the ERA5 boundary layer height. The elevated intercept of the Arabian Gulf is biased by the pollution event encountered at the center of the gulf, although further regions which covered enhanced concentrations of air pollution (SU, GO, RN) also show significantly elevated intercepts within their uncertainties (0.051–0.127 pptv s−1). In the relatively clean regions (AS, MS, RS) we determined smaller intercepts (0.009–0.038 pptv s−1). Additional HCHO production via the ozonolysis of alkenes seems very likely in AG and SU, indicated by elevated levels of O3 (Tadic et al., 2020) and ethene (Bourtsoukidis et al., 2019). Furthermore, we detected enhanced concentrations of OVOCs (Wang et al., 2020) and CH3OOH (Dienhart et al., 2021) in these regions. Therefore, it seems more appropriate to evaluate the intercept as an indication of additional HCHO sources (Padd(HCHO)), which are not necessarily related to OH chemistry.
Large variability was observed for the slope m of the regression line along the different regions probed. This slope can be equated to the regional HCHO yield αeff (Eq. 6), quantifying the fraction of OH reactivity that results in HCHO production. Inorganic species and CO made up ∼ 10 % of the reactivity in most regions and 16 % over the Suez Canal (Pfannerstill et al., 2019); thus, subtraction of the inorganic reactivity reduced the span on the x axis significantly. Removal of non-HCHO-yielding reactions from total OH reactivity indicates that between 1 % and 32 % of R(OH)eff contributed to HCHO production, with the largest values determined for the Arabian Gulf (0.315), the Suez Canal (0.115) and the Gulf of Oman (0.077). However, values of αeff show low variability among the other regions and reflect rather comparable chemical regimes. Pfannerstill et al. (2019) compared the R(OH) measurements to the calculated reactivity from all measured species. In summary, accumulation of the measured trace gases resulted in ∼ 20 % unattributed OH reactivity over the Arabian Gulf and up to 55 % over the Gulf of Aden, which could bias the derived αeff towards lower values.
We expect HCHO to be produced from methane (CH4), non-methane hydrocarbons such as alkanes and alkenes, OVOCs, and to a lesser extent from aromatic hydrocarbons (Wagner et al., 2002). For further analysis, we have recalculated mean OH reactivities (± 1σ standard deviation) of the individual substance classes (R(OH)x, e.g. alkanes, alkenes, OVOCs, aromatics) based on the findings by Pfannerstill et al. (2019). We assume that the unmeasured VOCs occurred at levels proportional to the measured compounds of a certain compound class, so these values represent general trends for the VOC oxidation of the subdivided regions. Please note that we removed the reaction of HCHO with OH from the OVOC class, which is usually included when presenting the speciated reactivity (Table S2; see also Table 1 in Pfannerstill et al., 2019). The ratio of then represents the relative contribution of a certain compound class to the regional OH reactivity, which reflects the measured VOC oxidation plus unattributed reactivity. Alkanes (including CH4) contributed on average 3 %–10 %, alkenes 2 %–10 %, OVOCs 8 %–33 % and aromatics 1 %–9 % to regional R(OH)eff (Table 1, Fig. 5). All sulfur-containing VOCs together contributed less than 1 % to the total R(OH)eff and were thus neglected. Elevated contributions of alkanes to R(OH)eff were found in SU and AG, while their contribution in the remaining regions was rather constant (∼ 5 %) and dominated by the oxidation of methane. Lowest relative contributions of the other compound classes were generally found over the Mediterranean Sea and the Arabian Sea, where also the lowest total OH reactivity has been detected (Table 1; see also Fig. 1 in Pfannerstill et al., 2019). Highest relative contributions were observed over the Arabian Gulf, with alkanes and alkenes each contributing ∼ 10 % and OVOCs ∼ 33 % to R(OH)eff. The largest relative contribution of aromatic compounds was found over the area near the Suez Canal with ∼ 9 %. The sum of alkanes, alkenes, OVOCs and aromatic compounds contributed on average 19 % over the Mediterranean Sea, 32 % over the Suez Canal, 31 % over the northern Red Sea, 37 % over the southern Red Sea, 23 % over the Gulf of Aden, 16 % on the first leg over the Arabian Sea, 38 % over the Gulf of Oman, 62 % over the Arabian Gulf and 23 % on the second leg over the Arabian Sea to R(OH)eff.
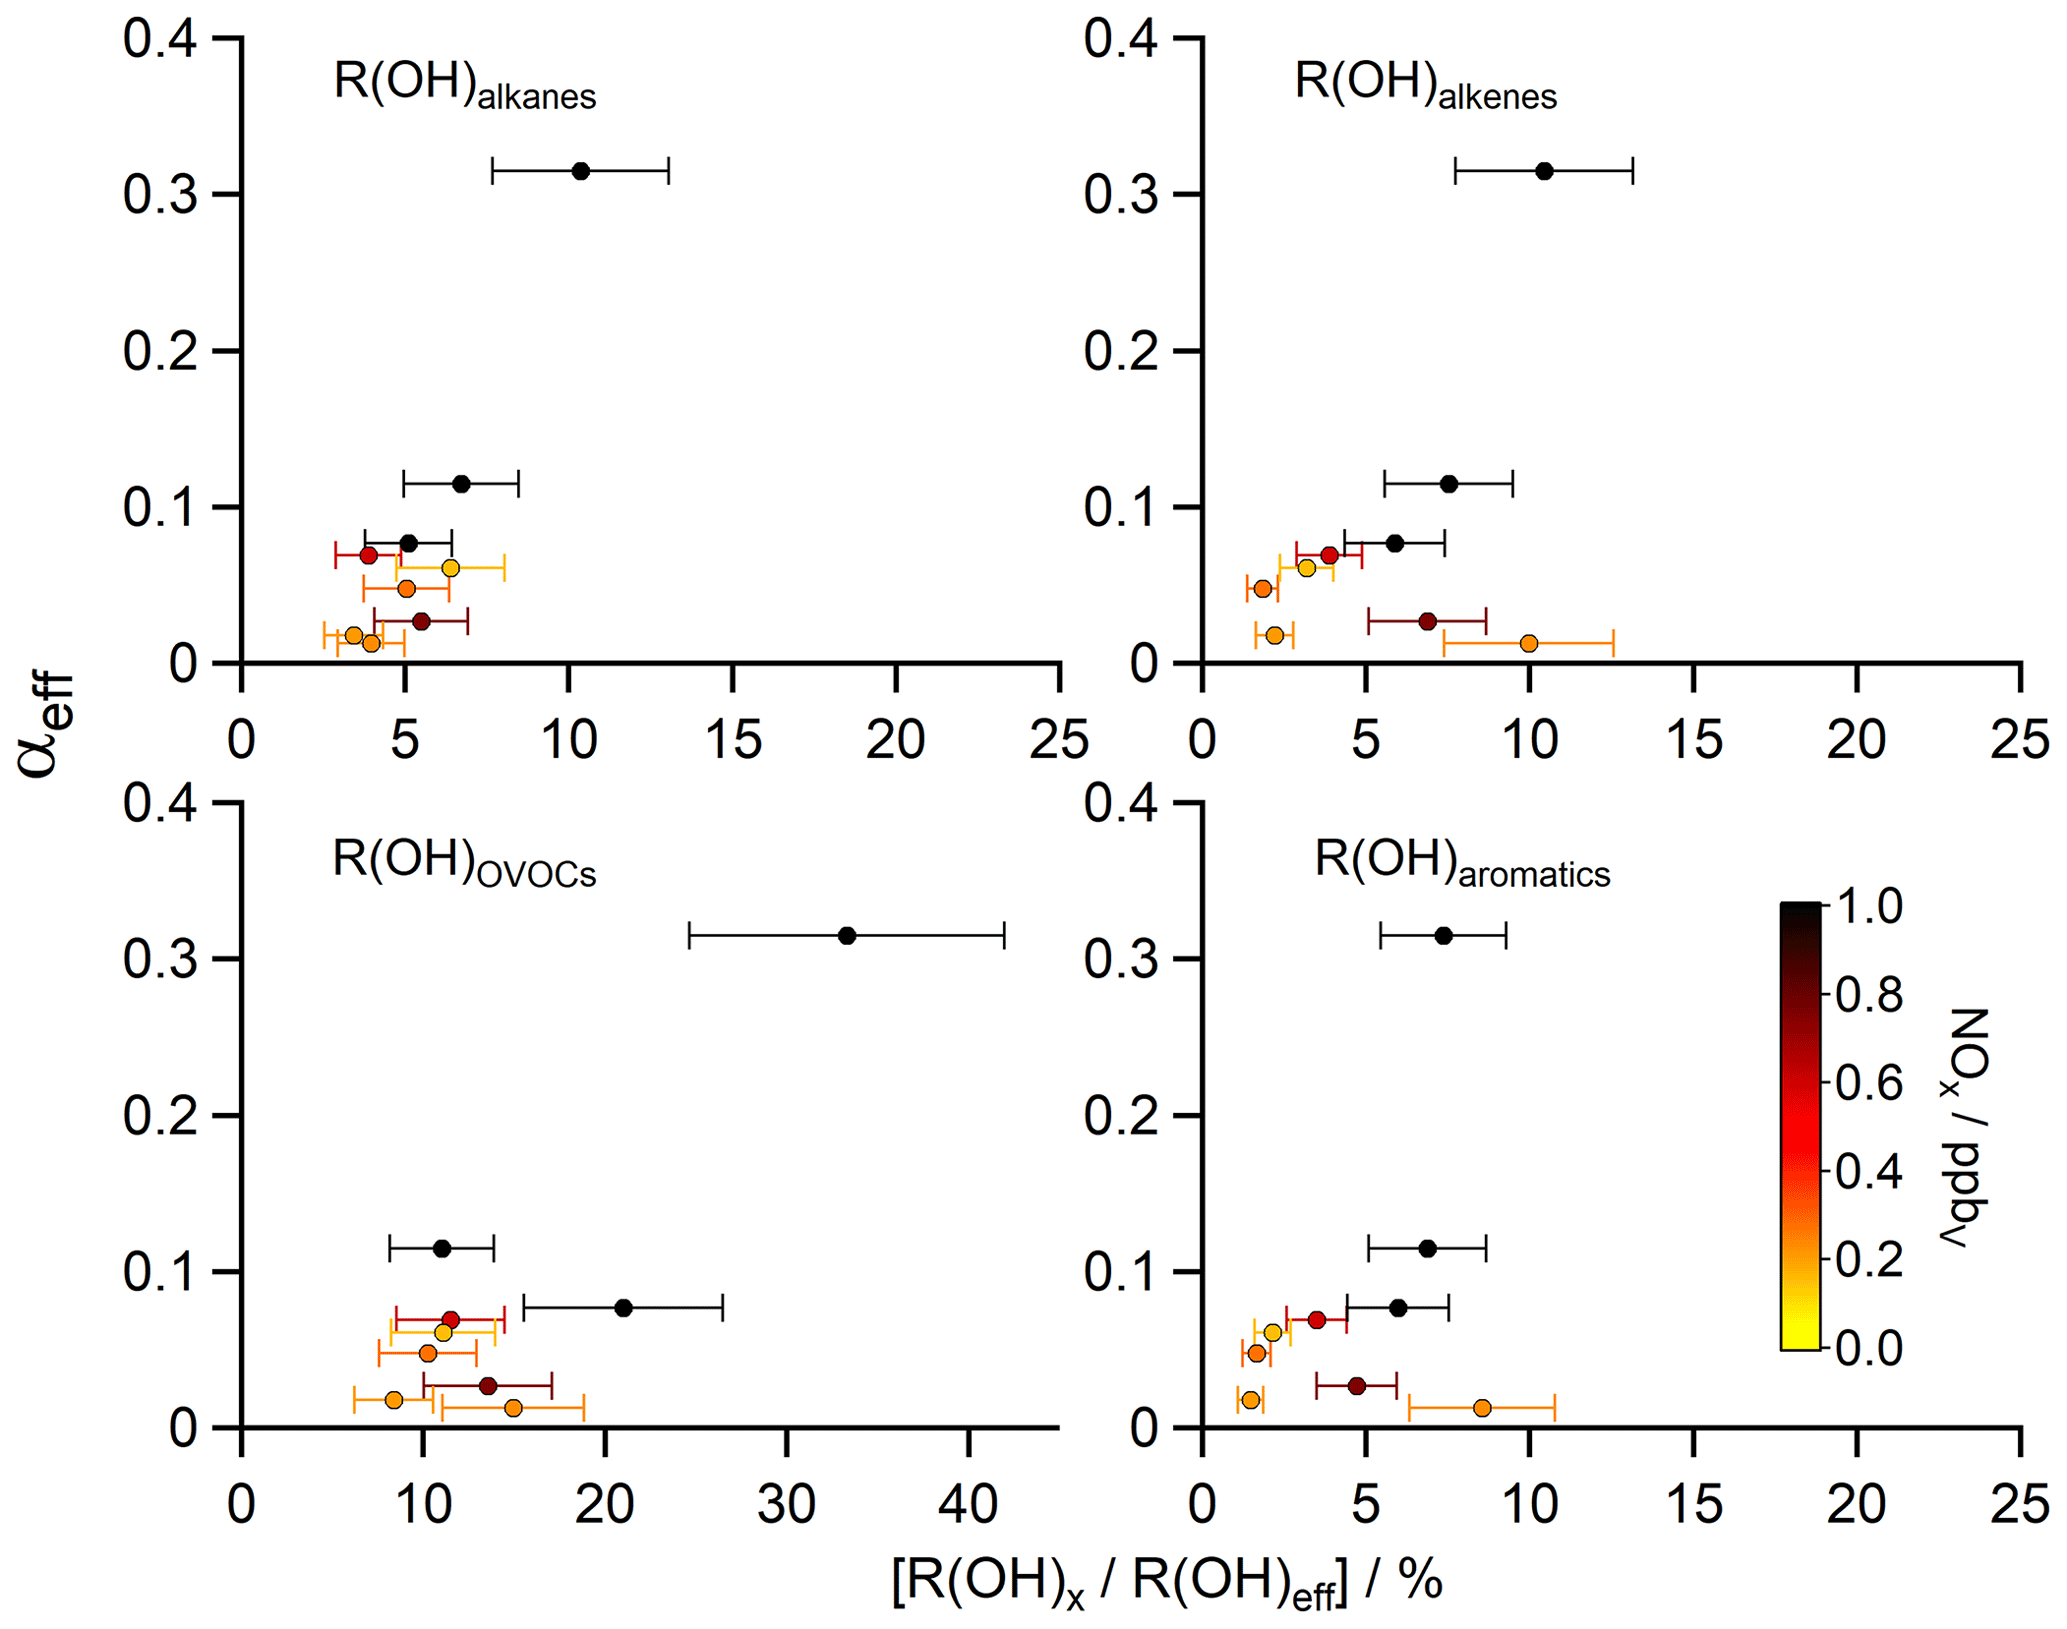
Figure 5Scatter plots of the contribution of certain substance classes R(OH)x (e.g. alkanes, alkenes, OVOCs, aromatics) to the total OH reactivity without the contribution of inorganic reactions ([]) versus the HCHO yield αeff (calculated with R(OH)eff via Eq. 6). The z axis was color-coded with the measured NOx median values, representative for the nine different regions during AQABA (Table 1).
In general, the sensitivity of HCHO production to different VOCs results from both the per molecule yield (amount of HCHO produced per VOC molecule lost) and the total abundance (or anthropogenic emissions) of the VOC. Luecken et al. (2018) showed for the continental United States that the per molecule sensitivity of HCHO is highest for anthropogenic emissions of alkenes and comparable within the uncertainties for alkanes, OVOCs and aromatics. Methane oxidation via OH and other oxidants (e.g. chlorine, Cl) is expected to be the main source of HCHO in the remote marine boundary layer, via the production of methyl peroxy radicals (CH3O2). The fate of these CH3O2 radicals determines the main production pathway of HCHO, as they can react to form other species, e.g. methyl hydroperoxide (CH3OOH) or methanol (CH3OH) under low-NOx conditions (Anderson et al., 2017). The determining step to produce HCHO is the reaction of CH3O2 with NO; thus, it can be expected that HCHO production is suppressed in very clean regimes, since these favor the recombination of CH3O2 and the reaction with HO2. Emission of rather short-lived alkenes (e.g. ethene, isoprene) can significantly enhance HCHO production via reaction with O3 or OH and the subsequent formation of OVOCs (e.g. acetone, acetaldehyde). The release of HCHO from these secondary products not only depends on their chemical structure but also on additional photolysis steps involved. While methane oxidation dominates the HCHO production in the MBL, isoprene is expected to be the main precursor over continents for near-surface HCHO. The results by Wolfe et al. (2016) also highlight that the HCHO yield from isoprene oxidation is a nonlinear function of NOx.
As demonstrated above, the yield of HCHO from OH × R(OH)eff is expected to depend on the composition of R(OH)eff with respect to alkanes, alkenes, OVOCs and aromatic compounds and also on the presence of NOx. Mixing ratios of biogenic hydrocarbons, in particular isoprene, were very low during AQABA with the exception of dimethylsulfide (Edtbauer et al., 2020). In clean MBL environments, emissions of alkenes and aromatics are less relevant; thus, the distribution of HCHO should be controlled mainly via variability of HOx (= OH + HO2) and the presence of NOx (> 0.1 ppbv), while we expect the HCHO budget to be highly complex under more polluted conditions, e.g. for the area around the Suez Canal and over the Arabian Gulf.
In order to investigate if the change in chemical composition along the different regions correlates with the determined HCHO yield, Fig. 5 shows scatter plots of the HCHO yield αeff versus the measured OH reactivity towards certain compound classes (alkanes, alkenes, OVOCs, aromatics). We also color-coded the z axis with the median of measured NOx as an indicator for air pollution and in order to identify the regions more easily.
The relative contribution of alkanes to R(OH)eff shows little variation at ∼ 4 %–5 % except over the area near the Suez Canal (∼ 7 %) and over the Arabian Gulf (∼ 10 %), where methane (Paris et al., 2021) and a variety of NMHCs (Bourtsoukidis et al., 2019) showed significantly elevated mixing ratios. Over the Arabian Gulf, these were likely caused by emissions from the oil and gas industry, indicated by the ratio between i-pentane and n-pentane of 0.93 ± 0.03 ppbv ppbv−1. Bourtsoukidis et al. (2019) found a ratio of 1.71 ± 0.06 ppbv ppbv−1 over the Suez Canal, which is representative of ship emissions. From visual inspection, a slight increase in the relative reactivity of alkanes leads to a small but significant increase in αeff with simultaneously elevated values of NOx. Alkenes contributed on average between ∼ 2 %–10 % to R(OH)eff, with the highest values over the Arabian Gulf, the southern Red Sea and the Suez Canal. Interestingly, a high reactivity of alkenes was detected over the southern Red Sea, which was similar to the enhanced values over the Suez Canal (Table 1), although with a higher relative contribution. The NOx measurements indicate rather clean air over the southern Red Sea (median 0.23 ppbv), where we experienced mostly winds coming from the west (Eritrea, Sudan). As a first result, a higher reactivity of alkenes is not necessarily correlated with an increase in αeff, which can be partly explained by the fact that release of HCHO from alkene oxidation depends on photolysis steps and other reactions involved, and our method does not take into account chemical aging. Additionally, the availability of other oxidants (e.g. O3) was higher over the Suez Canal and the Arabian Gulf, where the highest amounts of O3 were detected during AQABA (Tadic et al., 2020). This likely interferes with the presented results and could lead to an increase in Padd(HCHO). In general, emissions of alkenes favor HCHO production, which was also mentioned by Luecken et al. (2018), who found a high sensitivity of HCHO to anthropogenic and biogenic emissions of alkenes with isoprene as the main contributor in summer. We therefore emphasize the limits of our method, as it only takes into account the “immediate yield” of HCHO. OVOCs showed overall the highest contribution to R(OH)eff with ∼ 8 %–33 % during AQABA, and elevated R(OH)OVOCs generally resulted in an increased αeff, with the highest contribution over the Arabian Gulf, the Gulf of Oman and the Suez Canal. The production of HCHO through OVOCs strongly depends on the composition and amounts of anthropogenic emissions. Some C1–C3 OVOCs (e.g. methanol, acetaldehyde, acetone, glyoxal) are expected to have a strong influence on the local HCHO distribution depending on their mixing ratio, although this effect is minor in remote marine boundary layer conditions with the least amounts of anthropogenic contributions (Anderson et al., 2017). The largest mean mixing ratios of the aliphatic carbonyls acetaldehyde (1.73 ± 1.61 ppbv), acetone (4.50 ± 2.40 ppbv) and HCHO (3.83 ± 2.55 ppbv) were observed over the Arabian Gulf (Wang et al., 2020) and highlight this region as a hotspot of photochemical air pollution, which is reflected in the highest αeff and R(OH)OVOCs. R(OH)aromatics showed in general the lowest contribution to R(OH)eff with 1 %–9 % with again highest contribution over the Arabian Gulf, the southern Red Sea and the Suez Canal. Luecken et al. (2018) showed that HCHO concentrations over the United States had about the same sensitivity towards aromatic and alkane emissions. Aromatic compounds do not necessarily release HCHO during their oxidation, but they generally can be useful to identify complex anthropogenic emissions, e.g. from ships or the industry sector. These results overall underscore the elevated levels and complexity of air pollution detected over the Arabian Gulf and the Suez Canal. Also, an absolute increase in R(OH)x is mostly accompanied by an increase in αeff, although the majority of data points is scattered at low values of αeff, and there is no clear correlation with R(OH)aromatics and R(OH)alkenes. Our results are not directly comparable to the findings by Luecken et al. (2018), since in their analysis reactions with O3 (alkenes) and photolysis of HCHO precursors (OVOCs) were included. These sources of HCHO are not represented by R(OH)x used in our study and additionally our method would be more valuable by “following” an air mass, to account for air mass aging.
The yield of HCHO can also be interpreted as a function of NOx levels if there are processes (at low NO) that lead to formation of, for example, peroxides rather than HCHO (Wolfe et al., 2016), as already mentioned above. NO also directly affects the availability of OH, first of all as a sink by the formation of nitrous acid (HONO). HONO rapidly regenerates NO and OH by photolysis during the day, which was identified as a major source of daytime background NOx during AQABA (Friedrich et al., 2021). Additionally, NO enhances the conversion of HO2 radicals to OH and thus accelerates VOC oxidation (Wolfe et al., 2016). Valin et al. (2016) found that in isoprene-rich regions, the influence of NOx on HCHO production is primarily due to its feedback on the production of OH. Wolfe et al. (2016) showed that the chemical link between HCHO and isoprene is a strong, nonlinear function of NOx. They demonstrated an increase in the prompt yield of HCHO by a factor of 3 (from 0.3 to 0.9 ppbv ppbv−1) over the range of observed NOx (0.1–2 ppbv), while background HCHO increased by a factor of 2 (from 1.6 to 3.3 ppbv ppbv−1). We found a similar trend, as the increased reactivity of alkenes in the southern Red Sea at rather low NOx (median 0.23 ppbv) was not accompanied by enhanced HCHO mixing ratios, although high values of αeff coincided with elevated NOx. In general, the impact of NOx on HCHO production can be reduced to two factors: radical recycling and the termination of RO2 radicals (Wolfe et al., 2016). The fact that very clean background MBL air was rarely sampled during AQABA (lowest median NOx of 0.16 ppbv over AS Leg 2) suggests that we hardly achieved conditions in which the production of peroxides through the reaction of CH3O2 with HO2 would dominate the production of HCHO through CH3O2 + NO. Tadic et al. (2020) also showed that most regions were in the O3 production regime (signaling sufficient NO), which indicates that the production of HCHO was more likely limited by the abundance of oxidants and reactive VOCs rather than NOx.
In situ observations of HCHO and its sinks due to reaction with OH, photolysis and dry deposition to the ocean surface have been compared to its production from the reaction of OH with VOCs by using the total OH reactivity (R(OH)) and measured OH concentrations during the AQABA ship campaign around the Arabian Peninsula. Large variation of HCHO mixing ratios about more than an order of magnitude with maximum values (up to ∼ 12 ppbv) in the center of the Arabian Gulf highlight the region as a hotspot of photochemical air pollution with elevated mixing ratios of several VOCs and high amounts of ozone (≥ 150 ppbv; Tadic et al., 2020). Lowest concentrations of HCHO and its precursors identified the Arabian Sea as the cleanest region of the measurement campaign, related to the stable winds of the Indian summer monsoon, originating near the east coast of Africa (Edtbauer et al., 2020). Rather clean air (from a NOx perspective) was also detected over the southern Red Sea, which showed enhanced alkene and aromatic compound concentrations. In photochemical steady state, compact relationships between HCHO production and loss were found for some regions along the ship route. Excluding inorganic reactivity and non-HCHO-yielding reactions from total R(OH) slightly improved the correlation between production and loss of HCHO. The region-wide yield of HCHO per reacting OH (αeff) differs along the various chemical regimes encountered with lowest values (less than 2 %) deduced over the Arabian Sea during the first leg and the southern Red Sea and with highest values (∼ 32 %) over the Arabian Gulf. In most regions less than 10 % of R(OH)eff contributed to HCHO production. The separation of R(OH)eff into certain compound classes showed that OVOCs had the highest overall contribution to OH reactivity and were most variable. In general, elevated values of αeff coincided with elevated contributions of alkanes and OVOCs, with highest reactivity of all compound classes over the Arabian Gulf. The increased reactivity of alkenes and aromatic compounds over the southern Red Sea at rather low NOx (median 0.23 ppbv) was not accompanied by an elevated αeff. A clear dependence of αeff on NOx could not be identified, although highest values of αeff coincided with elevated NOx. Future studies on the HCHO budget around the Arabian Peninsula would likely benefit from longer stationary measurements, e.g. to identify the regularity of highly polluted events over the Arabian Gulf and to evaluate diurnal variation.
The data used in this study can be accessed for all scientists agreeing to the AQABA protocol at https://doi.org/10.5281/zenodo.3354117 (Pfannerstill et al., 2019) and through the KEEPER service of the Max Planck Digital Library via the person responsible on request.
The supplement related to this article is available online at: https://doi.org/10.5194/acp-21-17373-2021-supplement.
HF and DD designed the study. DD and BH performed the HCHO measurements. IT and UP provided the NOx measurements. RR, ST, MM and HH performed the LIF OH and HO2 measurements during AQABA. EP and NW provided the OH reactivity measurements. NW, AE and CS were responsible for the OVOC measurements. EB and LE carried out the VOC measurements during AQABA, which were used together with the OVOCs by EP to calculate speciated OH reactivity. JW supervised the VOC, OVOC and OH reactivity measurements. PE and JNC performed the O3 and SO2 measurements during AQABA. JS and JNC provided the actinic flux measurements and calculated photolysis rates. JL designed and supervised the AQABA project.
The authors declare that they have no conflict of interest.
Publisher's note: Copernicus Publications remains neutral with regard to jurisdictional claims in published maps and institutional affiliations.
We thankfully acknowledge the cooperation with The Cyprus Institute (CyI), King Abdullah University of Science and Technology (KAUST) and Kuwait Institute for Scientific Research (KISR). We thank Hays Ships Ltd., captain Pavel Kirzner and the Kommandor Iona's ship crew for the great support during all weather or wavy conditions and for an unforgettable time on board. We would like to especially thank Marcel Dorf and Claus Koeppel for the organization of the campaign and Hartwig Harder for the management on board. Last but not least we are grateful for the whole AQABA community for a successful campaign. Efstratios Bourtsoukidis, Jonathan Williams and Jos Lelieveld additionally acknowledge the European Union's Horizon 2020 Research and Innovation Programme, as well as matching co-funding by the government of the Republic of Cyprus.
The AQABA campaign was funded by the Max Planck Society. Efstratios Bourtsoukidis, Jonathan Williams and Jos Lelieveld were supported by the EMME-CARE project from the European Union's Horizon 2020 Research and Innovation Programme (grant agreement no. 856612), as well as matching co-funding by the government of the Republic of Cyprus.
The article processing charges for this open-access publication were covered by the Max Planck Society.
This paper was edited by John Orlando and reviewed by two anonymous referees.
Akagi, S. K., Yokelson, R. J., Wiedinmyer, C., Alvarado, M. J., Reid, J. S., Karl, T., Crounse, J. D., and Wennberg, P. O.: Emission factors for open and domestic biomass burning for use in atmospheric models, Atmos. Chem. Phys., 11, 4039–4072, https://doi.org/10.5194/acp-11-4039-2011, 2011.
Anderson, D. C., Nicely, J. M., Wolfe, G. M., Hanisco, T. F., Salawitch, R. J., Canty, T. P., Dickerson, R. R., Apel, E. C., Baidar, S., Bannan, T. J., Blake, N. J., Chen, D., Dix, B., Fernandez, R. P., Hall, S. R., Hornbrook R. S., Huey, L. G., Josse, B., Jöckel, P., Kinnision, D. E., Koenig, T. K., Le Breton, M., Marécal, V., Morgenstern, O., Oman, L. D., Pan, L. L., Percival, C., Plummer, D., Revell, L. E., Rozanow, E., Saiz-Lopez, A., Stenke, A., Sudo, K., Tilmes S., Ullmann, K., Volkamer, R., Weinheimer, A. J. and Zeng, G.: Formaldehyde in the tropical western Pacific: Chemical sources and sinks, convective transport, and representation in CAM-Chem and the CCMI models, J. Geophys. Res.-Atmos., 122, 11, 201–11, 226, https://doi.org/10.1002/2016JD026121, 2017.
Ayers, G. P., Gillet, R. W., Granek, H., de Sreves, C., and Cox, R. A.: Formaldehyde production in clean marine air, Geophys. Res. Lett., 24, 401–404, https://doi.org/10.1029/97GL00123, 1997.
Bohn, B., Corlett, G. K., Gillmann, M., Sanghavi, S., Stange, G., Tensing, E., Vrekoussis, M., Bloss, W. J., Clapp, L. J., Kortner, M., Dorn, H.-P., Monks, P. S., Platt, U., Plass-Dülmer, C., Mihalopoulos, N., Heard, D. E., Clemitshaw, K. C., Meixner, F. X., Prevot, A. S. H., and Schmitt, R.: Photolysis frequency measurement techniques: results of a comparison within the ACCENT project, Atmos. Chem. Phys., 8, 5373–5391, https://doi.org/10.5194/acp-8-5373-2008, 2008.
Bourtsoukidis, E., Ernle, L., Crowley, J. N., Lelieveld, J., Paris, J.-D., Pozzer, A., Walter, D., and Williams, J.: Non-methane hydrocarbon sources and sinks around the Arabian Peninsula, Atmos. Chem. Phys., 19, 7209–7232, https://doi.org/10.5194/acp-19-7209-2019, 2019.
Celik, S., Drewnick, F., Fachinger, F., Brooks, J., Darbyshire, E., Coe, H., Paris, J.-D., Eger, P. G., Schuladen, J., Tadic, I., Friedrich, N., Dienhart, D., Hottmann, B., Fischer, H., Crowley, J. N., Harder, H., and Borrmann, S.: Influence of vessel characteristics and atmospheric processes on the gas and particle phase of ship emission plumes: in situ measurements in the Mediterranean Sea and around the Arabian Peninsula, Atmos. Chem. Phys., 20, 4713–4734, https://doi.org/10.5194/acp-20-4713-2020, 2020.
Coggon, M. M., Lim, C. Y., Koss, A. R., Sekimoto, K., Yuan, B., Gilman, J. B., Hagan, D. H., Selimovic, V., Zarzana, K. J., Brown, S. S., Roberts, J. M., Müller, M., Yokelson, R., Wisthaler, A., Krechmer, J. E., Jimenez, J. L., Cappa, C., Kroll, J. H., de Gouw, J., and Warneke, C.: OH chemistry of non-methane organic gases (NMOGs) emitted from laboratory and ambient biomass burning smoke: evaluating the influence of furans and oxygenated aromatics on ozone and secondary NMOG formation, Atmos. Chem. Phys., 19, 14875–14899, https://doi.org/10.5194/acp-19-14875-2019, 2019.
Cox, R. A., Ammann, M., Crowley, J. N., Herrmann, H., Jenkin, M. E., McNeill, V. F., Mellouki, A., Troe, J., and Wallington, T. J.: Evaluated kinetic and photochemical data for atmospheric chemistry: Volume VII – Criegee intermediates, Atmos. Chem. Phys., 20, 13497–13519, https://doi.org/10.5194/acp-20-13497-2020, 2020.
De Smedt, I., Müller, J.-F., Stavrakou, T., van der A, R., Eskes, H., and Van Roozendael, M.: Twelve years of global observations of formaldehyde in the troposphere using GOME and SCIAMACHY sensors, Atmos. Chem. Phys., 8, 4947–4963, https://doi.org/10.5194/acp-8-4947-2008, 2008.
De Smedt, I., Van Roozendael, M., Stavrakou, T., Müller, J.-F., Lerot, C., Theys, N., Valks, P., Hao, N., and van der A, R.: Improved retrieval of global tropospheric formaldehyde columns from GOME-2/MetOp-A addressing noise reduction and instrumental degradation issues, Atmos. Meas. Tech., 5, 2933–2949, https://doi.org/10.5194/amt-5-2933-2012, 2012.
De Smedt, I., Stavrakou, T., Hendrick, F., Danckaert, T., Vlemmix, T., Pinardi, G., Theys, N., Lerot, C., Gielen, C., Vigouroux, C., Hermans, C., Fayt, C., Veefkind, P., Müller, J.-F., and Van Roozendael, M.: Diurnal, seasonal and long-term variations of global formaldehyde columns inferred from combined OMI and GOME-2 observations, Atmos. Chem. Phys., 15, 12519–12545, https://doi.org/10.5194/acp-15-12519-2015, 2015.
De Smedt, I., Theys, N., Yu, H., Danckaert, T., Lerot, C., Compernolle, S., Van Roozendael, M., Richter, A., Hilboll, A., Peters, E., Pedergnana, M., Loyola, D., Beirle, S., Wagner, T., Eskes, H., van Geffen, J., Boersma, K. F., and Veefkind, P.: Algorithm theoretical baseline for formaldehyde retrievals from S5P TROPOMI and from the QA4ECV project, Atmos. Meas. Tech., 11, 2395–2426, https://doi.org/10.5194/amt-11-2395-2018, 2018.
Dienhart, D., Hottmann, B., Crowley, J. N., Eger, P. G., Hafermann, S., Harder, H., Röder, L., Martinez, M., Parchatka, U., Pozzer, A., Rohloff, R., Schuladen, J., Tadic, I., Tauer, S., Walter, D., Lelieveld, J., and Fischer, H.: Formaldehyde (HCHO) and Hydroperoxide distribution around the Arabian Peninsula – A comparison of ship-based measurements with the general circulation model EMAC, Atmos. Chem. Phys., in preparation, 2021.
DiGangi, J. P., Boyle, E. S., Karl, T., Harley, P., Turnipseed, A., Kim, S., Cantrell, C., Maudlin III, R. L., Zheng, W., Flocke, F., Hall, S. R., Ullmann, K., Nakashima, Y., Paul, J. B., Wolfe, G. M., Desai, A. R., Kajii, Y., Guenther, A., and Keutsch, F. N.: First direct measurements of formaldehyde flux via eddy covariance: implications for missing in-canopy formaldehyde sources, Atmos. Chem. Phys., 11, 10565–10578, https://doi.org/10.5194/acp-11-10565-2011, 2011.
DiGangi, J. P., Henry, S. B., Kammrath, A., Boyle, E. S., Kaser, L., Schnitzhofer, R., Graus, M., Turnipseed, A., Park, J.-H., Weber, R. J., Hornbrook, R. S., Cantrell, C. A., Maudlin III, R. L., Kim, S., Nakashima, Y., Wolfe, G. M., Kajii, Y., Apel, E. C., Goldstein, A. H., Guenther, A., Karl, T., Hansel, A., and Keutsch, F. N.: Observations of glyoxal and formaldehyde as metrics for the anthropogenic impact on rural photochemistry, Atmos. Chem. Phys., 12, 9529–9543, https://doi.org/10.5194/acp-12-9529-2012, 2012.
Duncan, B. N., Yoshida, Y., Olson, J. R., Sillman, S., Martin, R. V., Lamsal, L., Hu, Y., Pickering, K. E., Retscher, C., Allen, D. J., and Crawford, J. H.: Application of OMI observations to a space-based indicator of NOx and VOC controls on surface ozone formation, J. Atmos. Env., 44, 2213–2223, https://doi.org/10.1016/j.atmosenv.2010.03.010, 2010.
Edtbauer, A., Stönner, C., Pfannerstill, E. Y., Berasategui, M., Walter, D., Crowley, J. N., Lelieveld, J., and Williams, J.: A new marine biogenic emission: methane sulfonamide (MSAM), dimethyl sulfide (DMS), and dimethyl sulfone (DMSO2) measured in air over the Arabian Sea, Atmos. Chem. Phys., 20, 6081–6094, https://doi.org/10.5194/acp-20-6081-2020, 2020.
Eger, P. G., Friedrich, N., Schuladen, J., Shenolikar, J., Fischer, H., Tadic, I., Harder, H., Martinez, M., Rohloff, R., Tauer, S., Drewnick, F., Fachinger, F., Brooks, J., Darbyshire, E., Sciare, J., Pikridas, M., Lelieveld, J., and Crowley, J. N.: Shipborne measurements of ClNO2 in the Mediterranean Sea and around the Arabian Peninsula during summer, Atmos. Chem. Phys., 19, 12121–12140, https://doi.org/10.5194/acp-19-12121-2019, 2019.
Fortems-Cheiney, A., Chevallier, F., Pison, I., Bousquet, P., Saunois, M., Szopa, S., Cressot, C., Kurosu, T. P., Chance, K., and Fried, A.: The formaldehyde budget as seen by a global-scale multi-constraint and multi-species inversion system, Atmos. Chem. Phys., 12, 6699–6721, https://doi.org/10.5194/acp-12-6699-2012, 2012.
Fried, A., Cantrell, C., Olson, J., Crawford, J. H., Weibring, P., Walega, J., Richter, D., Junkermann, W., Volkamer, R., Sinreich, R., Heikes, B. G., O'Sullivan, D., Blake, D. R., Blake, N., Meinardi, S., Apel, E., Weinheimer, A., Knapp, D., Perring, A., Cohen, R. C., Fuelberg, H., Shetter, R. E., Hall, S. R., Ullmann, K., Brune, W. H., Mao, J., Ren, X., Huey, L. G., Singh, H. B., Hair, J. W., Riemer, D., Diskin, G., and Sachse, G.: Detailed comparisons of airborne formaldehyde measurements with box models during the 2006 INTEX-B and MILAGRO campaigns: potential evidence for significant impacts of unmeasured and multi-generation volatile organic carbon compounds, Atmos. Chem. Phys., 11, 11867–11894, https://doi.org/10.5194/acp-11-11867-2011, 2011.
Friedrich, N., Eger, P., Shenolikar, J., Sobanski, N., Schuladen, J., Dienhart, D., Hottmann, B., Tadic, I., Fischer, H., Martinez, M., Rohloff, R., Tauer, S., Harder, H., Pfannerstill, E. Y., Wang, N., Williams, J., Brooks, J., Drewnick, F., Su, H., Li, G., Cheng, Y., Lelieveld, J., and Crowley, J. N.: Reactive nitrogen around the Arabian Peninsula and in the Mediterranean Sea during the 2017 AQABA ship campaign, Atmos. Chem. Phys., 21, 7473–7498, https://doi.org/10.5194/acp-21-7473-2021, 2021.
Fuchs, H., Novelli, A., Rolletter, M., Hofzumahaus, A., Pfannerstill, E. Y., Kessel, S., Edtbauer, A., Williams, J., Michoud, V., Dusanter, S., Locoge, N., Zannoni, N., Gros, V., Truong, F., Sarda-Esteve, R., Cryer, D. R., Brumby, C. A., Whalley, L. K., Stone, D., Seakins, P. W., Heard, D. E., Schoemaecker, C., Blocquet, M., Coudert, S., Batut, S., Fittschen, C., Thames, A. B., Brune, W. H., Ernest, C., Harder, H., Muller, J. B. A., Elste, T., Kubistin, D., Andres, S., Bohn, B., Hohaus, T., Holland, F., Li, X., Rohrer, F., Kiendler-Scharr, A., Tillmann, R., Wegener, R., Yu, Z., Zou, Q., and Wahner, A.: Comparison of OH reactivity measurements in the atmospheric simulation chamber SAPHIR, Atmos. Meas. Tech., 10, 4023–4053, https://doi.org/10.5194/amt-10-4023-2017, 2017.
Hens, K., Novelli, A., Martinez, M., Auld, J., Axinte, R., Bohn, B., Fischer, H., Keronen, P., Kubistin, D., Nölscher, A. C., Oswald, R., Paasonen, P., Petäjä, T., Regelin, E., Sander, R., Sinha, V., Sipilä, M., Taraborrelli, D., Tatum Ernest, C., Williams, J., Lelieveld, J., and Harder, H.: Observation and modelling of HOx radicals in a boreal forest, Atmos. Chem. Phys., 14, 8723–8747, https://doi.org/10.5194/acp-14-8723-2014, 2014.
Kaiser, J., Wolfe, G. M., Bohn, B., Broch, S., Fuchs, H., Ganzeveld, L. N., Gomm, S., Häseler, R., Hofzumahaus, A., Holland, F., Jäger, J., Li, X., Lohse, I., Lu, K., Prévôt, A. S. H., Rohrer, F., Wegener, R., Wolf, R., Mentel, T. F., Kiendler-Scharr, A., Wahner, A., and Keutsch, F. N.: Evidence for an unidentified non-photochemical ground-level source of formaldehyde in the Po Valley with potential implications for ozone production, Atmos. Chem. Phys., 15, 1289–1298, https://doi.org/10.5194/acp-15-1289-2015, 2015.
Klippel, T., Fischer, H., Bozem, H., Lawrence, M. G., Butler, T., Jöckel, P., Tost, H., Martinez, M., Harder, H., Regelin, E., Sander, R., Schiller, C. L., Stickler, A., and Lelieveld, J.: Distribution of hydrogen peroxide and formaldehyde over Central Europe during the HOOVER project, Atmos. Chem. Phys., 11, 4391–4410, https://doi.org/10.5194/acp-11-4391-2011, 2011.
Kluge, F., Hüneke, T., Knecht, M., Lichtenstern, M., Rotermund, M., Schlager, H., Schreiner, B., and Pfeilsticker, K.: Profiling of formaldehyde, glyoxal, methylglyoxal, and CO over the Amazon: normalized excess mixing ratios and related emission factors in biomass burning plumes, Atmos. Chem. Phys., 20, 12363–12389, https://doi.org/10.5194/acp-20-12363-2020, 2020.
Kormann, R., Fischer, H., de Reus, M., Lawrence, M., Brühl, Ch., von Kuhlmann, R., Holzinger, R., Williams, J., Lelieveld, J., Warneke, C., de Gouw, J., Heland, J., Ziereis, H., and Schlager, H.: Formaldehyde over the eastern Mediterranean during MINOS: Comparison of airborne in-situ measurements with 3D-model results, Atmos. Chem. Phys., 3, 851–861, https://doi.org/10.5194/acp-3-851-2003, 2003.
Liebmann, J. M., Muller, J. B. A., Kubistin, D., Claude, A., Holla, R., Plass-Dülmer, C., Lelieveld, J., and Crowley, J. N.: Direct measurements of NO3 reactivity in and above the boundary layer of a mountaintop site: identification of reactive trace gases and comparison with OH reactivity, Atmos. Chem. Phys., 18, 12045–12059, https://doi.org/10.5194/acp-18-12045-2018, 2018.
Liu, L., Flatøy, F., Ordóñez, C., Braathen, G. O., Hak, C., Junkermann, W., Andreani-Aksoyoglu, S., Mellqvist, J., Galle, B., Prévôt, A. S. H., and Isaksen, I. S. A.: Photochemical modelling in the Po basin with focus on formaldehyde and ozone, Atmos. Chem. Phys., 7, 121–137, https://doi.org/10.5194/acp-7-121-2007, 2007.
Luecken, D. J., Napelenok, S. L., Strum, M., Scheffe, R., and Phillips, S.: Sensitivity of ambient atmospheric formaldehyde and ozone to precursor species and source types across the United States, Environ. Sci. Technol., 52, 4668–4675, https://doi.org/10.1021/acs.est.7b05509, 2018.
Marbach, T., Beirle, S., Platt, U., Hoor, P., Wittrock, F., Richter, A., Vrekoussis, M., Grzegorski, M., Burrows, J. P., and Wagner, T.: Satellite measurements of formaldehyde linked to shipping emissions, Atmos. Chem. Phys., 9, 8223–8234, https://doi.org/10.5194/acp-9-8223-2009, 2009.
Marno, D., Ernest, C., Hens, K., Javed, U., Klimach, T., Martinez, M., Rudolf, M., Lelieveld, J., and Harder, H.: Calibration of an airborne HOx instrument using the All Pressure Altitude-based Calibrator for HOx Experimentation (APACHE), Atmos. Meas. Tech., 13, 2711–2731, https://doi.org/10.5194/amt-13-2711-2020, 2020.
Martin, R. V., Fiore, A. M., and Van Donkelaar, A.: Space-based diagnosis of surface ozone sensitivity to anthropogenic emissions, Geophys. Res. Lett., 31, L06120, https://doi.org/10.1029/2004GL019416, 2004.
Martinez, M., Harder, H., Kubistin, D., Rudolf, M., Bozem, H., Eerdekens, G., Fischer, H., Klüpfel, T., Gurk, C., Königstedt, R., Parchatka, U., Schiller, C. L., Stickler, A., Williams, J., and Lelieveld, J.: Hydroxyl radicals in the tropical troposphere over the Suriname rainforest: airborne measurements, Atmos. Chem. Phys., 10, 3759–3773, https://doi.org/10.5194/acp-10-3759-2010, 2010.
Millet, D. B., Jacob, D. J., Boersma, K. F., Fu, T. M., Kurosu, T. P., Chance, K., Heald, C. L., and Guenther, A.: Spatial distribution of isoprene emissions from North America derived from formaldehyde column measurements by the OMI satellite sensor, J. Geophys. Res., 113, D02307, https://doi.org/10.1029/2007JD008950, 2008.
Novelli, A., Hens, K., Tatum Ernest, C., Kubistin, D., Regelin, E., Elste, T., Plass-Dülmer, C., Martinez, M., Lelieveld, J., and Harder, H.: Characterisation of an inlet pre-injector laser-induced fluorescence instrument for the measurement of atmospheric hydroxyl radicals, Atmos. Meas. Tech., 7, 3413–3430, https://doi.org/10.5194/amt-7-3413-2014, 2014.
Palmer, P. I., Jacob, D. J., Fiore, A. M., Martin, R. V., Chance, K., and Kurosu, T. P.: Mapping isoprene emissions over North America using formaldehyde column observations from space, J. Geophys. Res., 108, 4180, https://doi.org/10.1029/2002JD002153, 2003.
Paris, J.-D., Riandet, A., Bourtsoukidis, E., Delmotte, M., Berchet, A., Williams, J., Ernle, L., Tadic, I., Harder, H., and Lelieveld, J.: Shipborne measurements of methane and carbon dioxide in the Middle East and Mediterranean areas and the contribution from oil and gas emissions, Atmos. Chem. Phys., 21, 12443–12462, https://doi.org/10.5194/acp-21-12443-2021, 2021.
Parrish, D. D., Ryerson, T. B., Mellqvist, J., Johansson, J., Fried, A., Richter, D., Walega, J. G., Washenfelder, R. A., de Gouw, J. A., Peischl, J., Aikin, K. C., McKeen, S. A., Frost, G. J., Fehsenfeld, F. C., and Herndon, S. C.: Primary and secondary sources of formaldehyde in urban atmospheres: Houston Texas region, Atmos. Chem. Phys., 12, 3273–3288, https://doi.org/10.5194/acp-12-3273-2012, 2012.
Pfannerstill, E. Y., Wang, N., Edtbauer, A., Bourtsoukidis, E., Crowley, J. N., Dienhart, D., Eger, P. G., Ernle, L., Fischer, H., Hottmann, B., Paris, J.-D., Stönner, C., Tadic, I., Walter, D., Lelieveld, J., and Williams, J.: Shipborne measurements of total OH reactivity around the Arabian Peninsula and its role in ozone chemistry, Atmos. Chem. Phys., 19, 11501–11523, https://doi.org/10.5194/acp-19-11501-2019, 2019.
Pfannerstill, E. Y., Wang, N., and Williams, J.: Total OH reactivity measured around the Arabian Peninsula July-August 2017, 3.2, Zenodo [data set], https://doi.org/10.5281/zenodo.3354117, 2019.
Reeves, C. E. and Penkett, S. A.: Measurements of peroxides and what they tell us, Chem. Rev., 103, 5199–5218, https://doi.org/10.1021/cr0205053, 2003.
Schroeder, J. R., Crawford, J. H., Fried, A., Walega, J., Weinheimer, A., Wisthaler, A., Müller, M., Mikoviny, T., Chen, G., Shook, M., Blake, D. R., and Tonnesen, G. S.: New insights into the column ratio as an indicator of near-surface ozone sensitivity, J. Geophys. Res.-Atmos., 122, 8885–8907, https://doi.org/10.1002/2017JD026781, 2017.
Shim, C., Wang, Y., Choi, Y., Palmer, P. I., Abbot, D. S., and Chance, K.: Constraining global isoprene emissions with Global Ozone Monitoring Experiment (GOME) formaldehyde column measurements, J. Geophys. Res., 110, D24301, https://doi.org/10.1029/2004JD005629, 2005.
Sinha, V., Williams, J., Crowley, J. N., and Lelieveld, J.: The Comparative Reactivity Method – a new tool to measure total OH Reactivity in ambient air, Atmos. Chem. Phys., 8, 2213–2227, https://doi.org/10.5194/acp-8-2213-2008, 2008.
Stickler, A., Fischer, H., Williams, J., de Reus, M., Sander, R., Lawrence, M. G., Crowley, J. N., and Lelieveld, J.: Influence of summertime deep convection on formaldehyde in the middle and upper troposphere over Europe, J. Geophys. Res., 111, D14308, https://doi.org/10.1029/2005JD007001, 2006.
Stickler, A., Fischer, H., Bozem, H., Gurk, C., Schiller, C., Martinez-Harder, M., Kubistin, D., Harder, H., Williams, J., Eerdekens, G., Yassaa, N., Ganzeveld, L., Sander, R., and Lelieveld, J.: Chemistry, transport and dry deposition of trace gases in the boundary layer over the tropical Atlantic Ocean and the Guyanas during the GABRIEL field campaign, Atmos. Chem. Phys., 7, 3933–3956, https://doi.org/10.5194/acp-7-3933-2007, 2007.
Tadic, I., Crowley, J. N., Dienhart, D., Eger, P., Harder, H., Hottmann, B., Martinez, M., Parchatka, U., Paris, J.-D., Pozzer, A., Rohloff, R., Schuladen, J., Shenolikar, J., Tauer, S., Lelieveld, J., and Fischer, H.: Net ozone production and its relationship to nitrogen oxides and volatile organic compounds in the marine boundary layer around the Arabian Peninsula, Atmos. Chem. Phys., 20, 6769–6787, https://doi.org/10.5194/acp-20-6769-2020, 2020.
Tegtmeier, S., Marandino, C., Jia, Y., Quack, B., and Mahajan, A. S.: Atmospheric gas-phase composition over the Indian Ocean, Atmos. Chem. Phys. Discuss. [preprint], https://doi.org/10.5194/acp-2020-718, in review, 2020.
Valin, L. C., Fiore, A. M., Chance, K., and González Abad, G.: The role of OH production in interpreting the variability of CH2O columns in the southeast U.S., J. Geophys. Res.-Atmos., 121, 478–493, https://doi.org/10.1002/2015JD024012, 2016.
Volkamer, R., Sheehy, P., Molina, L. T., and Molina, M. J.: Oxidative capacity of the Mexico City atmosphere – Part 1: A radical source perspective, Atmos. Chem. Phys., 10, 6969–6991, https://doi.org/10.5194/acp-10-6969-2010, 2010.
Wagner, V., von Glasow, R., Fischer, H., and Crutzen, P. J.: Are CH2O measurements in the marine boundary layer suitable for testing the current understanding of CH4 photooxidation?: A model study, J. Geophys. Res., 107, ACH 3-1–ACH 3-14, https://doi.org/10.1029/2001JD000722, 2002.
Wang, N., Edtbauer, A., Stönner, C., Pozzer, A., Bourtsoukidis, E., Ernle, L., Dienhart, D., Hottmann, B., Fischer, H., Schuladen, J., Crowley, J. N., Paris, J.-D., Lelieveld, J., and Williams, J.: Measurements of carbonyl compounds around the Arabian Peninsula: overview and model comparison, Atmos. Chem. Phys., 20, 10807–10829, https://doi.org/10.5194/acp-20-10807-2020, 2020.
Weller, R., Schrems, O., Boddenberg, A., Gäb, S., and Gautrois, M.: Meridional distribution of hydroperoxides and formaldehyde in the marine boundary layer of the Atlantic (48∘ N–35∘ S) measured during the Albatross campaign, J. Geophys. Res., 105, 14401–14412, https://doi.org/10.1029/1999JD901145, 2000.
Wennberg, P. O., Bates, K. H., Crounse, J. D., Dodson, L. G., Mc-Vay, R. C., Mertens, L. A., Nguyen, T. B., Praske, E., Schwantes, R. H., Smarte, M. D., St Clair, J. M., Teng, A. P., Zhang, X., and Seinfeld, J. H.: Gas-Phase Reactions of Isoprene and Its Major Oxidation Products, Chem. Rev., 118, 3337–3390, https://doi.org/10.1021/acs.chemrev.7b00439, 2018.
Williams, J. and Brune, W.: A roadmap for OH reactivity research, Atmos. Environ., 106, 371–372, https://doi.org/10.1016/j.atmosenv.2015.02.017, 2015.
Whalley, L. K., Furneaux, K. L., Goddard, A., Lee, J. D., Mahajan, A., Oetjen, H., Read, K. A., Kaaden, N., Carpenter, L. J., Lewis, A. C., Plane, J. M. C., Saltzman, E. S., Wiedensohler, A., and Heard, D. E.: The chemistry of OH and HO2 radicals in the boundary layer over the tropical Atlantic Ocean, Atmos. Chem. Phys., 10, 1555–1576, https://doi.org/10.5194/acp-10-1555-2010, 2010.
Wolfe, G. M., Kaiser, J., Hanisco, T. F., Keutsch, F. N., de Gouw, J. A., Gilman, J. B., Graus, M., Hatch, C. D., Holloway, J., Horowitz, L. W., Lee, B. H., Lerner, B. M., Lopez-Hilifiker, F., Mao, J., Marvin, M. R., Peischl, J., Pollack, I. B., Roberts, J. M., Ryerson, T. B., Thornton, J. A., Veres, P. R., and Warneke, C.: Formaldehyde production from isoprene oxidation across NOx regimes, Atmos. Chem. Phys., 16, 2597–2610, https://doi.org/10.5194/acp-16-2597-2016, 2016.
Wolfe, G. M., Nicely, J. M., St. Clair, J. M., Hanisco, T. F., Liao, J., Oman, L. D., Brune, W. B., Miller, D., Thames, A., Gonzalez Abad, G., Ryerson, T. B., Thompson, C. R., Peischl, J., McCain, K., Sweeney, C., Wennberg, P. O., Kim, M., Crounse, J. D., Hall, S. R., Ullmann, K., Diskin, G., Bui, P., Chang, C., and Dean-Day, J.: Mapping hydroxyl variability throughout the global remote troposphere via synthesis of airborne and satellite formaldehyde observations, P. Natl. Acad. Sci. USA, 116, 11171–11180, https://doi.org/10.1073/pnas.1821661116, 2019.
York, D., Evensen, N. M., Lopez Martinez, M., and De Basabe Delgado, J.: Unified equations for the slope, intercept, and standard errors of the best straight line, Am. J. Phys., 72, 367–375, https://doi.org/10.1119/1.1632486, 2004.
Zhu, L., González Abad, G., Nowlan, C. R., Chan Miller, C., Chance, K., Apel, E. C., DiGangi, J. P., Fried, A., Hanisco, T. F., Hornbrook, R. S., Hu, L., Kaiser, J., Keutsch, F. N., Permar, W., St. Clair, J. M., and Wolfe, G. M.: Validation of satellite formaldehyde (HCHO) retrievals using observations from 12 aircraft campaigns, Atmos. Chem. Phys., 20, 12329–12345, https://doi.org/10.5194/acp-20-12329-2020, 2020.