the Creative Commons Attribution 4.0 License.
the Creative Commons Attribution 4.0 License.
 | 09 Feb 2021
Non-target and suspect characterisation of organic contaminants in ambient air – Part 1: Combining a novel sample clean-up method with comprehensive two-dimensional gas chromatography
Laura Röhler
Pernilla Bohlin-Nizzetto
Pawel Rostkowski
Roland Kallenborn
Martin Schlabach
Long-term monitoring of regulated organic chemicals, such as legacy persistent organic pollutants (POPs) and polycyclic aromatic hydrocarbons (PAHs), in ambient air provides valuable information about the compounds' environmental fate as well as temporal and spatial trends. This is the foundation to evaluate the effectiveness of national and international regulations for priority pollutants. Extracts of high-volume air samples, collected on glass fibre filters (GFF for particle phase) and polyurethane foam plugs (PUF for gaseous phase), for targeted analyses of legacy POPs are commonly cleaned by treatment with concentrated sulfuric acid, resulting in extracts clean from most interfering compounds and matrices that are suitable for multi-quantitative trace analysis. Such standardised methods, however, severely restrict the number of analytes for quantification and are not applicable when targeting new and emerging compounds as some may be less stable under acid treatment. Recently developed suspect and non-target screening analytical strategies (SUS and NTS, respectively) are shown to be effective evaluation tools aimed at identifying a high number of compounds of emerging concern. These strategies, combining highly sophisticated analytical technology with extensive data interpretation and statistics, are already widely accepted in environmental sciences for investigations of various environmental matrices, but their application to air samples is still very limited. In order to apply SUS and NTS for the identification of organic contaminants in air samples, an adapted and more wide-scope sample clean-up method is needed compared to the traditional method, which uses concentrated sulfuric acid. Analysis of raw air sample extracts without clean-up would generate extensive contamination of the analytical system, especially with PUF matrix-based compounds, and thus highly interfered mass spectra and detection limits which are unacceptable high for trace analysis in air samples.
In this study, a novel wide-scope sample clean-up method for high-volume air samples has been developed and applied to real high-volume air samples, which facilitates simultaneous target, suspect and non-target analyses. The scope and efficiency of the method were quantitatively evaluated with organic compounds covering a wide range of polarities (logP 2–11), including legacy POPs, brominated flame retardants (BFRs), chlorinated pesticides and currently used pesticides (CUPs). In addition, data reduction and selection strategies for SUS and NTS were developed for comprehensive two-dimensional gas chromatography separation with low-resolution time-of-flight mass spectrometric detection (GC × GC-LRMS) data and applied to real high-volume air samples. Combination of the newly developed clean-up procedure and data treatment strategy enabled the prioritisation of over 600 compounds of interest in the particle phase (on GFF) and over 850 compounds in the gas phase (on PUF) out of over 25 000 chemical features detected in the raw dataset. Of these, 50 individual compounds were identified and confirmed with reference standards, 80 compounds were identified with a probable structure, and 774 compounds were assigned to various compound classes. In the dataset available here, 11 hitherto unknown halogenated compounds were detected. These unknown compounds were not yet listed in the available mass spectral libraries.
- Article
(982 KB) - Full-text XML
- Companion paper
-
Supplement
(633 KB) - BibTeX
- EndNote


Air monitoring programmes and case studies on the environmental fate of anthropogenic pollutants including legacy persistent organic pollutants (POPs) are important tools for environmental risk assessment. Furthermore, data generated in monitoring programmes and case studies form the foundations for integrated modern pollutant regulations and the effectivity assessment of international agreements and conventions on POPs (UNECE, 1998; UNEP, 2009a, b; EMEP, 2019). Air measurements of POPs are commonly done using quantitative targeted analytical approaches in combination with highly selective sample clean-up methods, often involving destructive sample clean-up with concentrated sulfuric acid (H2SO4 conc.), sodium hydroxide (NaOH) or other very selective preparation methods for an effective removal of interfering matrix compounds originating either from polyurethane-foam-based (PUF-based) sampling material or from naturally occurring air compounds. These methodologies are well-proven and appropriate for most legacy POPs, and therefore recommended as standard methods for POPs in the UNECE–EMEP (United Nations Economic Commission for Europe's European Monitoring and Evaluation Programme) manual for sampling and chemical analysis (EMEP, 2019). The outcomes of the established targeted analytical methods for quantitative measurements of important environmental pollutants are, however, limited as they only cover a minor part of the currently available list of priority substances identified as potential contaminants (Arnot et al., 2011; Breivik et al., 2012; McLachlan et al., 2014; Vorkamp and Rigét, 2014; Reppas-Chrysovitsinos et al., 2017; NORMAN network, 2016).
The current demand for various chemicals in technical and day-to-day consumer products is steadily expanding, leading to a constantly increasing number of new compounds identified as potential environmental contaminants. In the light of the continuously increasing numbers of chemicals in commerce, the development of single-compound quantitative analytical methods for each of these new compound groups is now considered ineffective, time-consuming and expensive. Therefore, there is a strong demand to develop targeted multi-compound analytical methods with the potential supplementation with suspect screening and non-target screening strategies (SUS and NTS). Many potential emerging contaminants are less persistent and therefore rapidly degrade during destructive sample extraction clean-up and processes (i.e. acid treatment, saponification, lyophilisation). This limitation is a fundamental restriction for quantitative analyses of such labile compounds and the identification of hitherto unknown potential contaminants with similar physical–chemical properties. Hence, there is an obvious incentive for the development of an alternative mild, non-destructive sample clean-up procedure in order to retain the broadest possible range of chemicals and as little as possible interfering matrix in the clean extract. Today, the combination of unspecific sample extraction and clean-up, together with high-resolution chromatographic and detection methods, is considered a prerequisite for NTS and SUS strategies. In particulate, the application of ultra-high-resolution chromatographic methods (either liquid or gas chromatographic) in combination with high-resolution mass spectrometry (HRMS) enabled the identification and characterisation of hitherto unknown environmental contaminants in different matrices (López Zavala and Reynoso-Cuevas, 2015; Alygizakis et al., 2016; Hernández et al., 2015; Masiá et al., 2014; Al-Qaim et al., 2014; Hernández et al., 2007; Rostkowski et al., 2019; Schymanski et al., 2015). Another advanced analytical tool for non-target-specific analysis of environmental samples is comprehensive two-dimensional gas chromatography (GC × GC) coupled to either low-resolution or high-resolution time-of-flight mass spectrometry (GC × GC-LRMS or GC × GC-HRMS, respectively). Earlier studies have already successfully applied this technology for the identification and characterisation of chemical profiles in petroleum product characterisation (Ruiz-Guerrero et al., 2006; Van De Weghe et al., 2006; Arey et al., 2005; van Mispelaar et al., 2005) and in environmental sample analysis (Millow et al., 2015; Ubukata et al., 2015; Mao et al., 2009; Ralston-Hooper et al., 2008; van Leeuwen and de Boer, 2008; Lebedev et al., 2018; Veenaas and Haglund, 2017). As extracts for SUS and NTS analyses will contain a much broader range of compounds compared with extracts prepared for single-compound targeted analyses, it is essential to increase the resolution for both associated chromatographic separation and the detection technology compared to traditional target-specific quantitative analysis. Comprehensive GC × GC allows the two-dimensional chromatographic separation of analytes from interfering matrix in complex samples (Figs. 1 and S1 in the Supplement). However, in the GC × GC separation, potential matrix interferences will also reduce the quality of the chromatographic separation. This will also reduce the quality of the collected mass spectra, making the identification of a compound an even more difficult task. Therefore, sample clean-up needs to be optimised for the detection and characterisation of substances often present in ultra-trace amounts.

The overall aim of this study was the development of a wide-scope sample clean-up method for high-volume air samples and the development of SUS and NTS strategies optimised for GC × GC-LRMS data. This novel sample clean-up method was evaluated by target analytical methods covering compounds within a wide range of polarities (logP 2–11). The target methods included legacy POPs, brominated flame retardants (BFRs), halogenated agrochemicals, industrial chemicals and currently used pesticides (CUPs). The presented newly developed clean-up method, in combination with SUS and NTS strategies, was applied to real high-volume atmospheric samples from a background monitoring station in southern Norway with the aim of identifying known and new potential chemicals of emerging concern (CECs).
2.1 Method evaluation samples and real high-volume air samples
The samples of this study were based on the following: (i) the evaluation of the novel wide-scope clean-up method, which was based on a recovery test covering compounds within a wide range of polarities using spiked surrogate method evaluation samples and target analysis; and (ii) the application of the novel clean-up method to real high-volume air samples from the Birkenes Observatory in combination with the development of SUS and NTS strategies. For both (i) and (ii), glass fibre filters (GFF; 142 mm in diameter) and PUF plugs (7 cm in diameter, 4 cm in height), commonly used in high-volume air sampling (Kallenborn et al., 2013), were used.
For (i), spiked surrogate method evaluation samples (unexposed PUFs and GFFs) were spiked with 13C-labelled standards representing POPs and CECs analysed within the UNECE–EMEP and AMAP (Arctic Monitoring and Assessment Program) monitoring programmes, as well as native CUPs and pesticide standards, covering a wide range of polarity. A set of three parallel samples of each standard mixture was prepared for quality assurance (POP, brominated, CUP A, CUP B and CUP C); in total 15 method evaluation samples were prepared (Table 1). A detailed list of all compounds in the standard mixtures used can be found in the Supplement in Tables S2–S5.
Table 1Spiked standard mixtures for method evaluation samples.

For (ii), two dedicated real high-volume air samples were collected during March–April 2015 at an EMEP background monitoring station, the Birkenes Observatory in southern Norway (Aust-Agder; 58∘23′ N, 8∘15′ E; 190 m a.s.l.). The particle phase was collected on GFF (cut-off 10 µm) and the gas phase on PUF plugs at a flow rate of ∼50 m3 h−1. The sampling time was 6 d, resulting in sample volumes of 6100 and 6200 m3, respectively. Details on the GFF–PUF high-volume air sampling methodology can be found in Kallenborn et al. (2013).
2.2 Extraction and sample clean-up
Extraction. The spiked surrogate method evaluation samples (i), GFF and PUF combined, were Soxhlet-extracted for 8 h in acetone n-hexane (1:1, ), resulting in one combined extract for GFF and PUF per sample. The extracts were reduced to 0.5 mL with a Zymark TurboVap evaporator and solvent-changed to isooctane before clean-up.
The exposed real high-volume air samples (GFF and PUF) from Birkenes (ii) were spiked with internal standard (ISTD) mixture (see Supplement Table S6 for details) and GFFs and PUFs were Soxhlet-extracted separately for 8 h in acetone n-hexane (1:1, ), resulting in separate extracts for PUFs and for GFFs for each sample, respectively. After extraction, the individual extracts were reduced to 0.5 mL and the solvent was changed to isooctane. The same steps were carried out for (i) and (ii) with sample blanks (PUFs and GFFs without exposure to outdoor air) for quality assurance (see Sect. 2.6).
Sample clean-up. For each extract from (i) spiked surrogate method evaluation samples and (ii) real high-volume air samples from Birkenes as well as sample blanks of (i) and (ii), a custom-made three-layer liquid chromatography column was applied for clean-up. The columns consisted of a glass column (l= 250 mm, i.d. = 20 mm) packed with cotton. The bottom layer consisted of a mixture of Z-Sep+ and DSC-18 (2 g each), the middle layer of Florisil (10 g) and the top layer of sodium sulfate (1 cm). After conditioning the column with an excessive amount of acetone (1.5× the volume of the column), the column was dried using a vacuum pump (the column outlet was connected to a vacuum pump). The individual extracts were applied to the dry column and eluted with 80 mL acetonitrile (ACN) 0.5 % citric acid (). After clean-up, the individual extracts were reduced to 0.5 mL with a TurboVap and further concentrated to approximately 200 µL under a gentle stream of nitrogen gas. After clean-up and prior to analysis, the recovery standard (1,2,3,4-tetrachloronaphthalene, TCN) was added. Details on the chemicals and equipment used can be found in the Supplement in Table S1.
2.3 Target GC-HRMS analysis for method evaluation samples
The samples from part (i) were quantitatively evaluated by target analysis using GC-HRMS. The detailed quantitative analytical methods applied here are described in Halse et al. (2011) and Kallenborn et al. (2013). A short description of these methods can also be found in the Supplement.
2.4 SUS and NTS of real high-volume air samples
The real high-volume air samples (ii) were analysed on a comprehensive high-resolution two-dimensional gas chromatograph coupled to a low-resolution time-of-flight mass spectrometer with unit mass resolution (GC × GC-LRMS, Pegasus® 4D, LECO, St. Joseph, MI, USA). The GC was equipped with a Restek (Bellefonte, PA, USA) Siltek Guard column (4 m, 0.25 mm), an SGE (Trajan Scientific and Medical, Ringwood, VIC, Australia) BPX-50 (25 m, 0.25 mm × 0.25 µm) first-dimension column and an Agilent J&W (Folsom, CA, USA) VF-1ms (1.5 m, 0.15 mm × 0.15 µm) second-dimension column. The samples were processed with the SUS and NTS strategies developed here, optimised and developed for GC × GC-LRMS (Sects. 2.5 and 3.2)
Further details on chromatographic specifications are given in the Supplement.
2.5 Data processing and post-acquisition data treatment
LECOs® ChromaTOF® (V 4.50.8) software (including its advanced features “Scripts” and “Statistical Compare”), which also controls the GC × GC-LRMS system, was used for data analysing and processing including automatic peak finding, spectral deconvolution for coeluting peaks, modulation slice combination and mass spectral searching compared to the mass spectral libraries used. In this study, an in-house custom library with mass spectra of reference standards and 13C 2H-labelled ISTDs was used in combination with the National Institute of Standards and Technology (NIST) 2014 mass spectral library and the Scientific Working Group for the Analysis of Seized Drugs (SWGdrug; Oulton, 2019) mass spectral library. For more efficient suspect screening and flagging of potential suspects during data processing, a customised library, containing selected suspect spectra from NIST14, was created. More details about the chosen suspect lists, creation of the customised library and the alignment with the final peak list can be found in Sect. 3.4 and in the Supplement.
An in-house-developed post-acquisition workflow for GC × GC-LRMS data from the real high-volume air samples was used for the combined chemical work, target, SUS and NTS (Figs. 2 and 3). The level classification concept, developed from Schymanski et al. (2015), describing the levels of classification and identification confidence is currently a gold standard used for reporting results from SUS and NTS data evaluation. However, the scheme was developed with the LC-HRMS data in mind and is therefore not directly applicable to the data produced with GC-MS-based methods (Rostkowski et al., 2019). The combination of columns applied in this study (medium-polar combined with non-polar) had an improved matrix separation from compounds of interest compared to the most common combination (non-polar combined with medium-polar). However, as stated by Röhler et al. (2020), this column combination is not suitable to use with any available retention indices for further identification confidence. The most comprehensive databases are available for non-polar (5 % phenyl) columns, whereas this study used a medium-polar column. Limited concepts for retention indices are available for GC × GC (e.g. Mazur et al., 2018; Veenaas and Haglund, 2018) using a non-polar column as a first dimension and a medium-polar column as a second column for GC × GC separation. A new model would be necessary to enable the possibility of retention indices for the column combination used in this study.
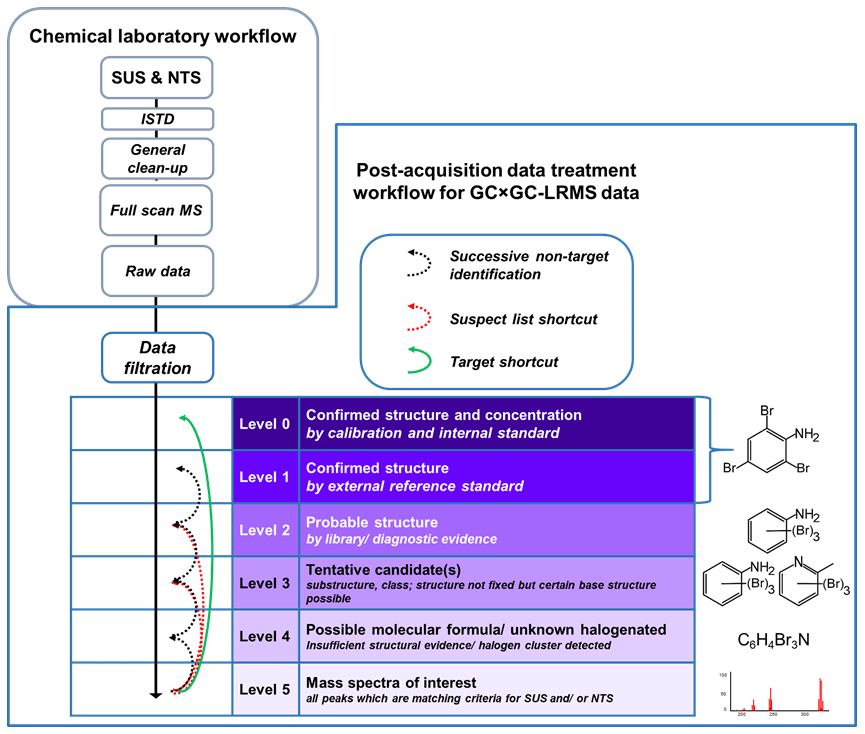
Figure 2General strategy and levels of identification confidence for GC × GC-LRMS. Adapted from Schymanski et al. (2015).

2.6 Quality control
Laboratory blank samples were included for both sample types (i) and (ii). The blanks consisted of unexposed PUFs and GFFs and were treated as their respective sample type (i) or (ii) regarding extraction, clean-up and analyses. To ascertain whether a detected or reported compound has its origin in sample (i) or (ii) and does not occur in the respective laboratory blank samples for (i) or (ii), a compound needs to exceed a sample concentration factor ≥ 10 compared to a blank sample in target analysis for (i) or an area factor ≥ 100 compared to a blank sample in SUS and NTS for (ii).
There were no targeted compounds detected in blanks for part (i). ISTDs, used in SUS and NTS of real high-volume air samples (part ii), were used for quality assurance and sample normalisation but not for target quantification. Visual comparisons of peak intensity and intensity ratios from ISTDs were used to identify potential contamination and/or performance issues of the GC × GC-LRMS system. This was done for samples and blank samples from (ii) as well as ISTD mixture analysis, which were analysed in between blank samples and samples from (ii).
PUF plugs used for active air sampling would normally be reused after sample extraction and a complete cleaning procedure. Thus, PUF plugs for sampling and blank samples may be of different age, and thus the extractable PUF matrix will vary. Extracts from exposed, real high-volume air samples and laboratory blank samples can thus contain different peak distribution profiles. Blank filtration strategies are described in Sect. 3.2.1.
3.1 Evaluation of the novel sample clean-up method
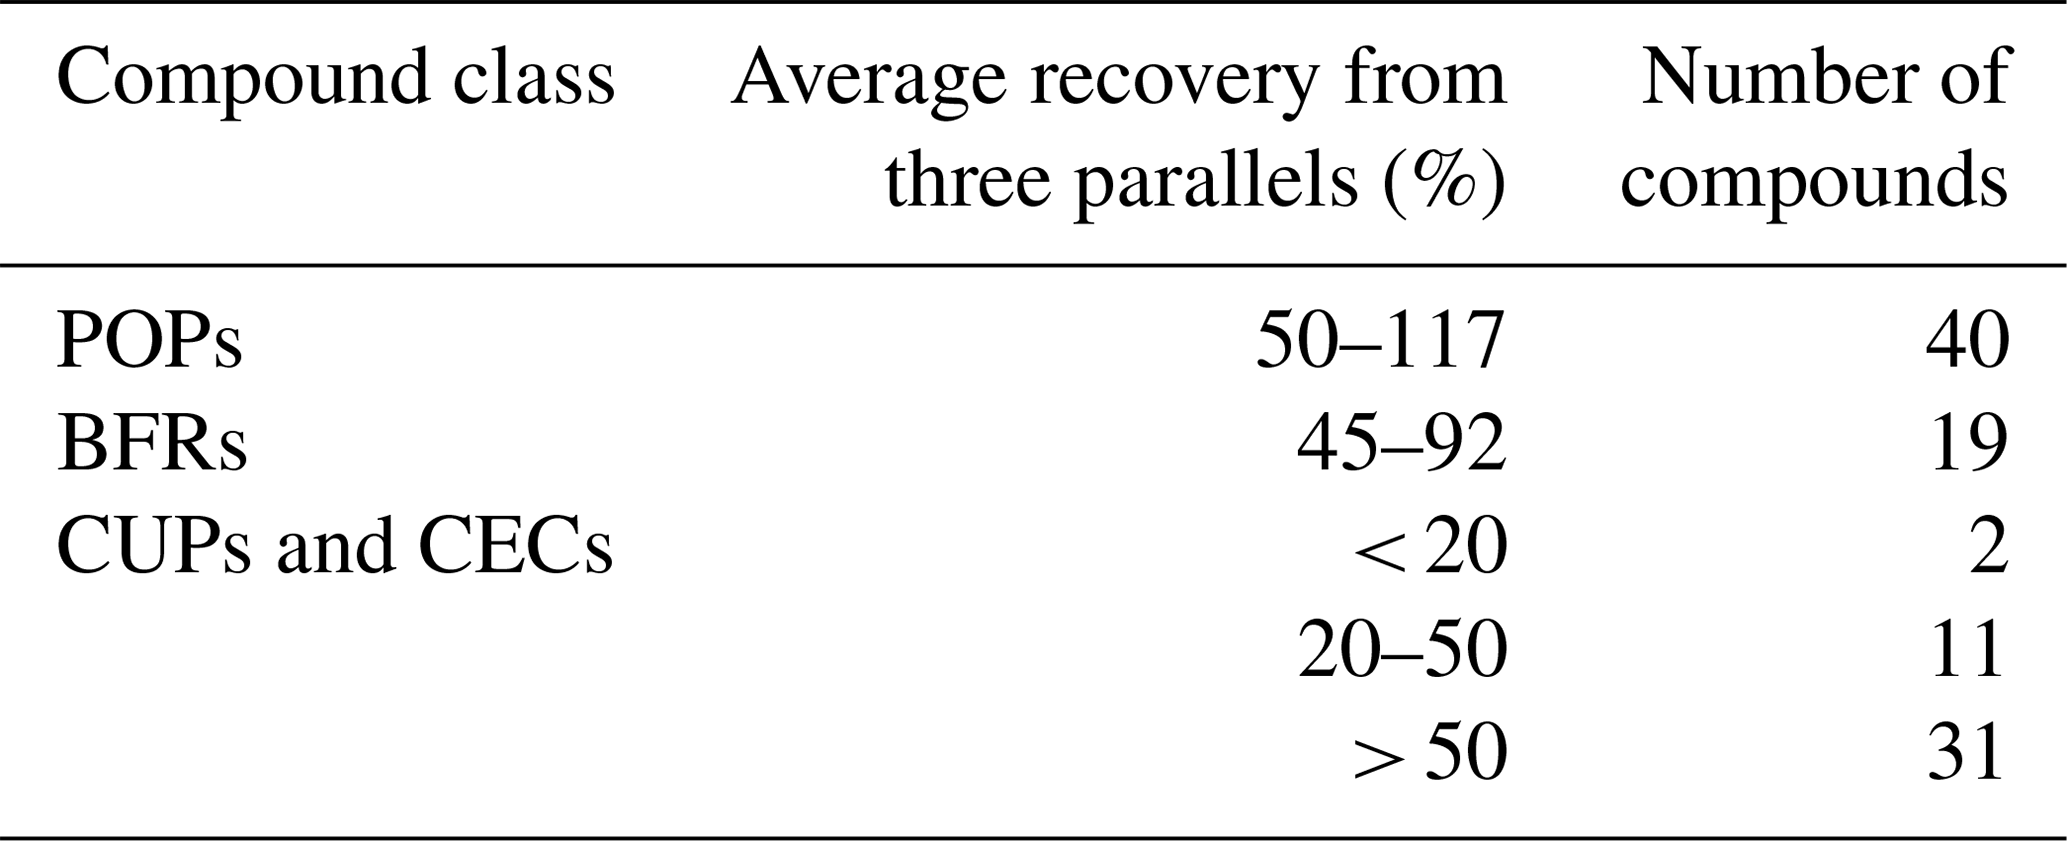
The application of the novel wide-scope sample clean-up method, with a custom three-layer liquid chromatography method, was quantitatively evaluated with targeted analyses using GC-HRMS of triplicates of unexposed samples (PUFs and GFFs) spiked with a mixture of various compound classes covering a wide range of polarity (logP 2–11). The results show that the novel clean-up method provided extracts of similar cleanness and comparable recoveries for acid-stable POPs as routine methods in monitoring programmes for POPs. The recoveries of most of the targeted compounds were over 50 % using the novel clean-up method (Table 2), which is in accordance with the standard quality control (QC) requirements for this type of analysis. For acid-labile compounds such as dieldrin, endrin, aldrin, isodrin, heptachlor-exo-epoxide, endosulfan I and II, endosulfan sulfate, ATE (allyl 2,4,6-tribromophenyl ether), and BATE (2-bromoallyl 2,4,6-tribromophenyl ether), the recoveries with the novel clean-up method were 62 %–117 %, while they are not detected or detected with low recoveries using routine clean-up methods. This shows the advantage of this method to also allow quantitative extraction of acid-labile organic contaminants. More details on the recovery of single compounds and relative standard deviations (RSDs) can be found in Tables S2–S5 in the Supplement.
Table 2Summary of average recovery rates (%) for legacy POPs, BFRs, CUPs and CECs.
A few of the spiked compounds had no recorded recovery (i.e. chlorfenvinphos, chlorobenzilate, dichlorvos, endrine aldehyde and etridiazole) or very low recovery (i.e. bromacil and chloroneb). The most probable reason seems to be insufficient elution with the solvent used (ACN 0.5 % citric acid) due to strong and/or irreversible interactions with Florisil and/or strong Lewis acid–base interactions with Z-Sep+ (zirconium oxide and C18 coated silica particles). A stronger solvent mixture could not be applied as this results in increased amounts of interfering PUF-related matrix compounds in the final extracts (unpublished data).
3.2 SUS and NTS identification approach
For compound characterisation, an already reported level classification system for identification confidence by Schymanski et al. (2015) was adopted and optimised for the GC × GC-LRMS technique used here (Fig. 2). This level classification is a useful tool to report results from SUS and NTS. The original version was developed for classification of SUS and NTS results from interpretation of LC-HRMS data. This classification strategy provides a suitable platform for a compound's level of identification confidence. The defined confidence levels by Schymanski et al. (2015) cover identification criteria from accurate mass identification of a compound (Level 5, L5) to directly match with a reference standard (Level 1, L1). As proposed by Rostkowski et al. (2019), the original version of Schymanski et al. is not directly applicable for GC-HRMS, mainly due to different data filtration strategies compared to LC-HRMS. Additionally, in contrast to other previously reported SUS and NTS studies, our work is based on LRMS data and thus cannot provide accurate masses of compounds of interest. As a potential molecular formula and further structural information are not easily available with the GC × GC-LRMS technique used here, slight adjustments of the criteria for each level of confidence in the classification scheme were necessary to better comply with the needs and limitations of LRMS data treatment. However, our adjusted approach is kept it as close as possible to the original version from Schymanski et al. (2015). An additional Level 0 (L0) was included, allowing us to distinguish between compounds identified by external reference standards after the original sample analysis (L1) and those compounds identified by ISTDs (L0) added to the sample before sample extraction. Here, direct target quantification of L0 compounds is possible although not further examined in the study reported here. For Level 2 (L2) compounds, a probable structure derived from a good library match in combination with a plausible position on the GC × GC 3D surface or an isomer of an available reference standard could be assigned. An example of an L2 compound could be a penta-chlorinated polychlorinated biphenyl (PCB). The mass spectral information matches well with a penta-chlorinated PCB; however, as there are several possible different penta-chlorinated PCB congeners (n= 47), the individual penta-chlorinated PCB congener could not be identified. For compounds classified as Level 3 (L3), a certain substructure or compound class could be assigned. Here the structure of a compound is not totally clear, but a certain base structure confirmation is possible due to the available information. An example of an L3 compound could be a tentative polycyclic aromatic hydrocarbon (PAH) for which the fragment pattern of the mass spectra (MS) was assigned to be a PAH with a possible molecular formula. Since there are too many possible PAHs (n > 100) with various structures matching the given MS and molecular formula, it is only possible to assign a compound class to this compound. Compounds classified as Level 4 (L4) are only defined by a possible molecular formula or by characteristic halogen cluster(s). They do not match any MS in the MS libraries used. All peaks which matched the criteria for SUS and/or NTS during data processing (DP) (Fig. 3, before reaching A) were classified as Level 5 (L5) mass spectra of interest.
In comparison to target analysis, developed for the highest confidence level of identification, SUS and NTS results have different confidence levels as described above. In target analysis, isotope dilution analysis with ISTDs is, beside others, a commonly applied technique (EFSA, 2010; European Commission, 2017). The specific sample clean-up used here for those selected compounds removes the bulk of disturbing matrix and other potential deteriorating issues with potential effects on the chromatographic separation. Hence, the results are reported as validated concentration levels in table form for all target analytes (Fig. 2, Level 0), whereas for SUS and NTS a more general sample clean-up procedure is necessary, which often does not remove all interfering matrix. These SUS and NTS results are identified as extensive lists of relevant peaks (often ≥ 20 000 peaks), typically detected via retention time (RT) and full-scan mass spectra information (Rostkowski et al., 2019). Usually, the original peak list identified automatically by the analytical software needs to be systematically reduced and categorised according to the confidence identification criteria described above (Fig. 2, Level 1–5). Such a data reduction is necessary for a sound interpretation of the results (Fig. 3). As described in Sect. 2.5, the instrumental software generates an initial peak list containing tens of thousands of entries. In order to have an efficient data treatment, properly prioritising and reducing the originally long peak lists are requirements. This first reduction step is to identify and remove compound signals which also occur in sample blanks. Based on the available software tools a data processing workflow was applied including compound identification with MS libraries, identification of compounds which occur in one or more samples, and identification of halogen isotopic clusters or other specific ions (e.g. as the base peak for phthalates). After these automated processes, the received peak list was further reduced by manual or semi-automatic inspections, resulting in a shortened peak list corresponding to previously defined quality thresholds. To increase the level of identification confidence, manual inspection of each peak is necessary. This evaluation step is very time-consuming and thus limits the number of compounds for which such semi-automated and/or manual inspection could be performed.
3.2.1 Automatic blank filtration
The first step in reducing the originally long peak lists produced by deconvolution of raw data is to identify and remove compound signals which also occur in sample blanks. Since SUS and NTS at this stage result in qualitative and semiquantitative rather than quantitative results, the exact compound concentration in the collected air samples and blanks is unknown. Therefore, blank compound filtration is based on comparison of signal areas only. In order to compensate for response variation occurring between real sample extracts and method blanks, a high threshold for detection is applied that is considerably higher than utilised for traditional target analysis. In our case, a compound in a real sample must exceed an area factor ≥ 100 compared to a blank sample to be confirmed as a detected compound.
After automatic sample blank filtration for NTS and SUS analysis, the peak list of the air samples from Birkenes still covered a large number of compounds also confirmed in sample blanks. This poor efficiency of automated blank filtration can be explained by the differences in peak distribution profiles for the different blank samples and for the average of the blank samples compared to the real samples. Only 50 %–75 % of the identified blank contaminants were identical in the different blank samples. However, the automatic filtration procedure reduced approximately 10 % of the total peak number (reduction from about 26 000 to 24 000 peaks for PUF samples and 25 000 to 22 000 peaks for GFFs). Further strategies for peak filtration had to be applied to reduce the number of peaks. Such an effective filtration is necessary to provide a suitable platform for priority compound identification (Fig. 3, to reach A) and classification of the different confidence levels (Fig. 2, L1–L5).
During initial data processing, the ChromaTOF® software used here automatically finds all relevant signals or peaks, deconvolutes coeluting mass spectra, combines modulation slices and compares this spectral information against the set of chosen MS libraries. Hereby, it may happen that one signal in the chromatogram is associated with several peak markers, e.g. if the peak width is broader than the specifications used for automatic peak finding or peaks are tailing. Unfortunately, the automated deconvolution algorithm from ChromaTOF® can mark a single compound with several peak markers, which was shown in a study by Lu et al. (2008). Due to these limitations, the total number of originally detected compounds is usually lower than the number of peak markers. First, during comprehensive manual inspection (Fig. 3A), these additional false peak markers will be discovered and peak lists corrected for duplicate peak markers.
3.2.2 SUS data processing workflow
In this study, the data processing (DP) strategy was split into two parts, SUS (Fig. 3I) and NTS (Fig. 3II). After the initial automated peak identification, the peak lists from both DP approaches were merged to one L5 list for a manual check of identity (Fig. 3A) and further level of identity confidence classification.
During SUS DP (Fig. 3I), all MS of the automatically detected peaks were searched against the MS library reference information for SUS (in-house custom libraries of reference standards and ISTDs, customised suspect library as described in Sect. 2.5, and the SWGdrug mass spectral library; Oulton, 2019). Added ISTDs were identified (L0), as were sample blank compounds. A second blank filtration was performed and only compounds which exceed an area of factor ≥ 100 compared to the sample blank were kept for further inspection. As described in the previous section (Sect. 3.2.1), this high threshold is necessary to compensate for different sample volumes and unknown variation of the response between extracts. After blank filtration, all peaks with a forward match of ≥ 70 % to the MS listed in custom suspect libraries for SUS were identified (Fig. 3I: preliminary L5 list). These peaks from “I: preliminary L5 list” (Fig. 3) were further processed by including the entire NIST14 MS library in addition to the previously applied custom suspect libraries to ensure the quality of the library identification procedure (Fig. 3I: L5 list to manually check identity). Applying this procedure, approx. 600 suspects were identified in the PUF and approx. 400 suspects in the GFF samples. These signals were only identified by MS library matching; without a manual check of their identity, the confidence level of identification is L5 here, and for the found ISTDs and their respective native compounds it is L0 (Fig. 2). In order to improve the confidence level of identification for these compounds, a manual check for the right identification is required as the next step (Fig. 3A; in combination with results from NTS).
3.2.3 NTS data processing workflow
For NTS DP (Fig. 3II), the LECOs statistical compare® tool for the identification of all compounds occurring in both PUF samples or both GFF samples was applied. With this approach, it was possible to reduce the peak lists from approx. 30 000 to 3800 peaks for PUF and from approx. 25 000 to 5000 peaks for GFF samples. After the initial automatic blank filtration (see Sect. 3.2.1), DP with the NIST14 and suspect libraries as well as the application of NT scripts for the identification of specific compounds of interest (i.e. halogenated) were performed. The resulting peak list was further reduced to approx. 1000 peaks per sample. These NT scripts, written in Visual Basic, were applied during DP to identify brominated and chlorinated compounds based on their isotopic clusters, as well as PAHs, phthalates and nitro compounds, with the help of recognisable features in fragmentation patterns (Hilton et al., 2010). These scripts are especially useful to detect compounds which would be overlooked by a low MS library match or not listed in the MS libraries used. In addition, a second blank filtration was performed, and only compounds which exceed an area of factor ≥ 100 compared to the sample blank were kept for further inspection. Like in SUS DP, during NTS DP it was also necessary to reduce the number of peaks for manual inspection. As a final method, all peaks identified with NT scripts and all peaks with a forward match of ≥ 80 % to the MS libraries (NIST14 and suspect libraries) were kept for further processing. Thereby it was possible to identify approx. 550 compounds in the PUF sample and approx. 400 compounds in the GFF sample with NTS DP. Those identified compounds were classified as L5, and ISTDs and their respective native compounds were classified as L0 (Fig. 3II: L5 list to manually check for the right identity).
Similar to SUS, a manual check of the right identity of these NTS L5 compounds is needed in order to increase the level of identification confidence since all confirmations are only based on MS library comparisons or NT script filtrations. For manual inspection of each compound and further level classification, the lists from SUS and NTS were merged to one list for a more effective process (Fig. 3A).
Both DPs, SUS and NTS, used the forward match percentage to MS library entries to reduce the number of peaks which require manual inspection. In this step, the quality of an MS from a compound is of high importance to match an MS library entry and thus be kept for further processing. The quality of the MS of a compound is not only affected by interferences or S N ratios, but the quality might also be affected by the unit mass resolution of the GC × GC-LRMS instrument used. In particular, the limited unit mass resolution of the GC × GC-LRMS used has negative consequences for MS of compounds with higher mass defects, e.g. brominated, higher-chlorinated or mixed halogenated compounds. Even when acquired under optimal conditions, the obtained MS are not identical to the reference MS from the NIST14 MS library (Fig. 4), and hence those compounds would be rejected during DP due to a low match percentage to the NIST14 library. The NT scripts used during DP, developed by Hilton et al. (2010), were specifically developed for MS obtained by LECOs GC × GC-LRMS for the identification of isotopic clusters of brominated and chlorinated compounds and were used as a tool during DP for the identification of compounds of interest for manual inspection.
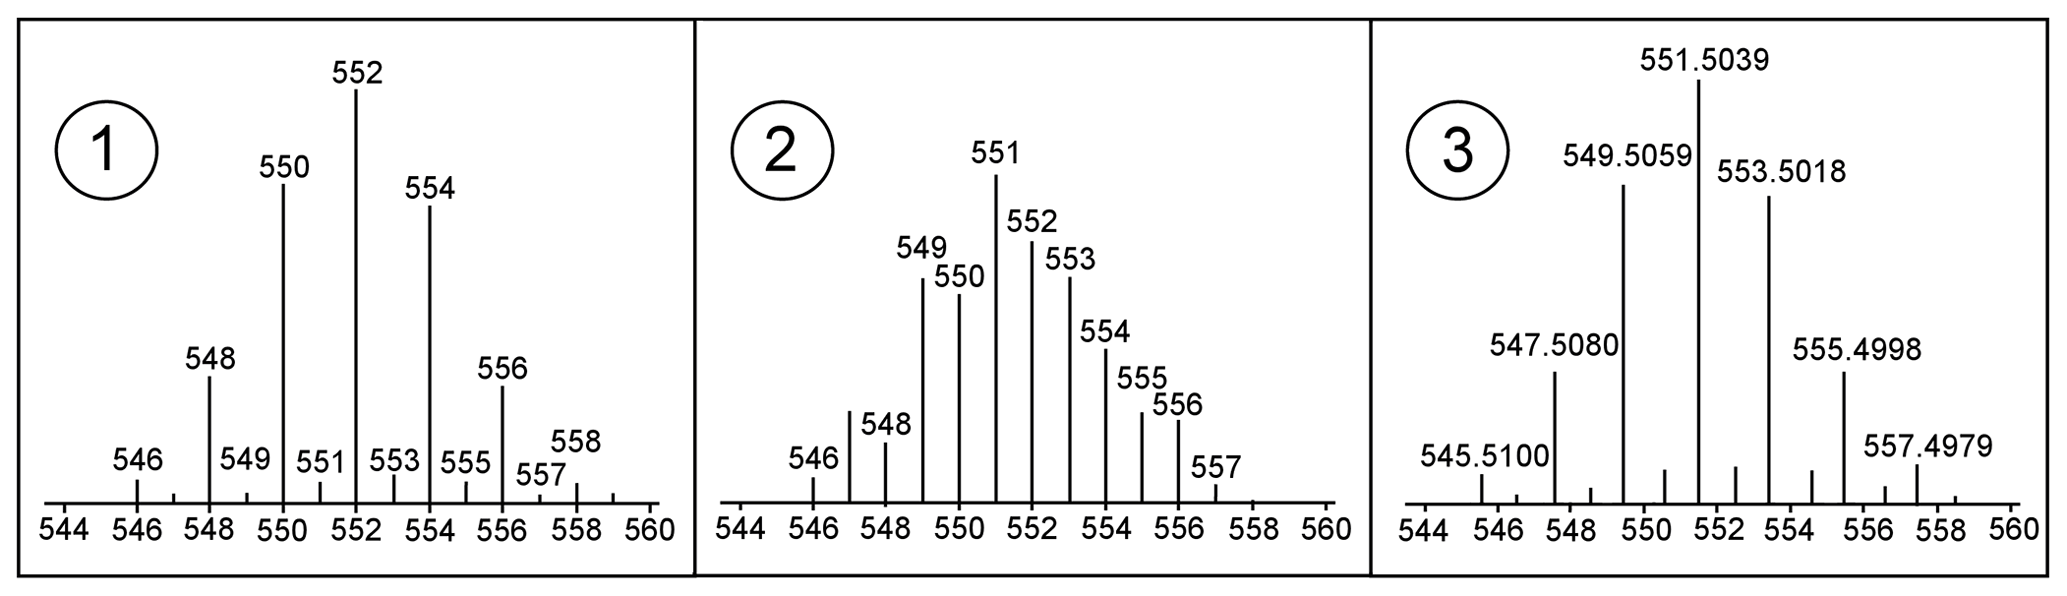
Figure 4(1) Isotope cluster of hexabromobenzene (HBB) in NIST14, (2) own measured HBB on GC × GC-LRMS and (3) HRMS isotope cluster HBB.
In addition to the MS quality affected by the unit mass resolution of the ToF-MS detector, a lower library match could also be caused by different fragmentation patterns compared to the MS from the NIST14 library, which were obtained with a quadrupole mass filter in electron ionisation mode. Also here it was possible that compounds of interest could be rejected during a DP step due to a low match percentage to a NIST14 MS.
Further factors may limit the positive identification of a compound including potential loss during sample clean-up. Our sample clean-up method was optimised for the analysis of compounds covering a wide range of polarity for GC × GC-LRMS analysis. However, the substantial loss of substances purely adsorbing and accumulating on PUF and GFF sampling materials cannot be excluded. Furthermore, compounds may degrade, evaporate or not elute from adsorbents used during sample clean-up. During GC × GC-LRMS analyses, thermolabile substances may degrade in the injector or be irreversibly bound or degraded on the chromatographic column. Furthermore, compound-specific low sensitivity in the positive electron ionisation mode used here may prevent the positive identification of a possible target compound.
In the DP strategy chosen here, all confirmed compounds need to match all selection criteria used. However, the priority criteria need individual fine tuning for each dataset examined to avoid false positive and false negative listings as well as to minimise the occurrence of blank compounds. However, even after following this comprehensive data processing protocol, the possibility cannot be excluded that unconfirmed or excluded substances do not occur in air from Birkenes, southern Norway.
3.3 Number of detected and classified compounds
After comprehensive peak filtration from raw data to a reduced peak list for manual inspection, all remaining compounds were initially classified as L5 (mass spectra of interest) (Fig. 3A), and all compounds identified with ISTDs were classified as L0. The compounds classified as L5 are further checked manually for their identity to reach a higher level of identification confidence. For some compounds with a high match percentage compared with the reference MS libraries and recognisable pattern(s) in the MS, this check for the right identification is a straightforward procedure for classification as L2 or L3 compounds. Others with less characteristic patterns or just an identification due to their inherent halogen isotopic pattern might be classified as L3 or L4 (Fig. 2). The procedure for the correct classification of such substances is time-consuming and requires comprehensive scientific experience. Before comparing compounds to in-house and/or new reference standards, L2 and L3 compounds were, in addition to the automatic blank filtration during initial data processing, manually checked against sample blanks to ensure that these compounds have an area which exceeds the area threshold (factor ≥ 100). This manual blank check is essential, since the automatic blank filtration routine during DP may lead to missing compounds (low match factors between the blank and the real sample), partly caused by coelution or matrix-related retention time shifts. After this initial step, further characterisation of potential compounds based on sales numbers, inherent physical chemical properties (adsorption, transformation, reactivity), application sources and profiles, and/or seasonal patterns may be beneficial in addition to confidence level determination (L0, L1, L2, L3, L4 or L5).
For the high-volume air samples studied here from the Birkenes Observatory, the merged L5 list from SUS and NTS available for manual inspection (Fig. 3A) contains almost 1500 compound suggestions: over 600 compounds from the GFF extracts (particulate phase) and over 850 compounds from the PUF extracts (gaseous phase). More than 50 % of these compounds could be further identified and classified as L4, L3 and L2 during manual inspection of MS. This was possible for 350 compounds from the GFF and for 655 compounds from the PUF. All L2 and L3 compounds were manually checked against the blank sample before comparison to new and in-house reference standards. For quality assurance, all reference standards were analysed with the same GC × GC-LRMS method as the air samples, and a reference mixture of ISTDs was analysed to account for retention time shifts (Fig. 3B). Thereby, five compounds were confirmed with ISTDs as L0 ( GFF PUF) and 45 compounds with reference standards as L1 ( GFF PUF). In addition, 80 compounds were classified as L2 ( GFF PUF) and 774 compounds as L3 ( GFF PUF). The remaining 81 compounds were characterised as L4 ( GFF PUF) compounds as summarised in Fig. 3C and Table 3.
Table 3Overview of the L0–L4 compounds classified in air samples from Birkenes (southern Norway).

a Showing similarity to suspect lists, isomer not confirmed; b not applicable.
The L2 compounds include 11 potential PCBs. For those compounds the exact number of congeners might deviate since single reference standards for each PCB congener were not analysed. Polycyclic aromatic compounds (PACs) made up the largest subgroup of L3 compounds (see Fig. 6). Unknown halogenated compounds, which did not have any MS library match, were included in L4. An overview of the distribution of L0–L4 compounds in the GFF and PUF can be found in Table 3. The complete peak list of L0–L4 compounds is available in the Excel spreadsheet in the Supplement.
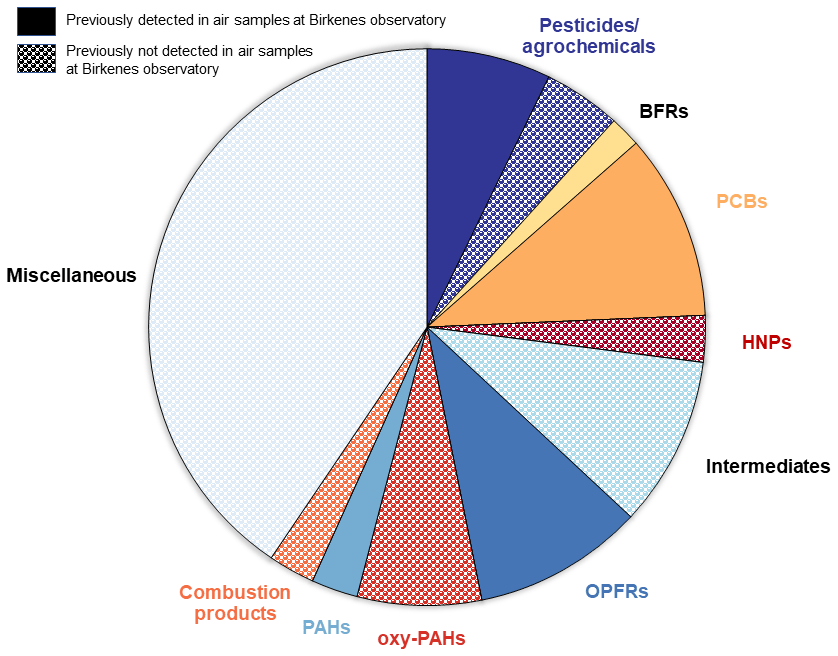
Figure 5Overview of detected compounds confirmed with reference standards (L0 and L1) and probable structures (L2).
From 45 compounds classified as L1, 22 compounds are listed in one or more suspect lists, and from 80 compounds classified as L2, 28 compounds show similarity to one or more suspect lists (Table 3). As L2 compounds are not confirmed with reference standards, matches to suspect lists are slightly uncertain and compounds listed as L2 in Excel-SI may also represent different isomers.
The priority suspect lists chosen here were selected for the identification of the long-range atmospheric transport potential (LRATP) of CECs and hitherto unidentified CECs. However, the chosen suspects do cover the bulk of legacy POPs, CECs previously analysed at the Birkenes Observatory, and a large number of CUPs and non-regulated chemicals, especially own measured MS in the customised self-built libraries. The chosen suspect lists are considered relevant for Arctic air samples, and suspect prioritisation lists originate from different authors (Reppas-Chrysovitsinos et al., 2017; Brown and Wania, 2008; Coscollà et al., 2011; Hoferkamp et al., 2010; Howard and Muir, 2010; NORMAN network, 2016; Vorkamp and Rigét, 2014; Zhong et al., 2012) as well as self-built in-house suspect libraries (Table 3). A short summary of the data alignment of the suspect lists used and findings in our samples can be found in the Supplement.
The compounds and compound groups identified in the air samples from the Birkenes Observatory in this study are divided into three groups: (i) legacy POPs and PAHs, (ii) known CECs, and (iii) new potential CECs not previously reported in southern Norway (Birkenes; status October 2019). In addition to 36 already reported organic contaminants at Birkenes (including legacy POPs and known CECs), 92 new potential CECs with a match to reference standards (L1) or probable structures (L2) were identified (64 in PUF and 28 in GFF samples). It is interesting to note that 11 chemicals were common to the GFF and PUF sample. A total of 29 of the new potential CECs have an LRATP according to the Stockholm convention (UNEP, 2009a) half-life in air exceeding 2 d and may hence undergo long-range atmospheric transport.
Overall, 41 compounds identified as L0, L1 or L2 were also detected in high-volume air samples from the Zeppelin station (Ny-Ålesund) in Svalbard using the same analytical approach as in this study (Röhler et al., 2020).
A complete overview can be found in the Excel-SI spreadsheet, including information on the complementary findings in Arctic air samples, physical–chemical properties, additional information from a literature search, and further parameters on environmental properties (including persistence as well as the bioaccumulation and toxicity – PBT – classification by REACH and the Stockholm convention; European Parliament, 2018; UNEP, 2009a; see Table S7).
3.4 Identified compound groups
As summarised in Fig. 5, identified compounds were grouped into different compound classes and arranged as previously detected or previously not detected in air samples at the Birkenes Observatory (only including L0, L1 and L2 compounds). For approximately of the identified compounds, an application purpose could be identified and is discussed in detail in the following sections.
3.4.1 Legacy POPs and PAHs in air from Birkenes
In total, 23 legacy POPs and PAHs were identified as L0, L1 or L2. The L0 and L1 were hexachlorocyclohexanes (α-HCH and γ-HCH), HCB, -DDE, -DDT, PCB 153, dieldrin, trans-nonachlor and a metabolite of heptachlor (heptachloro exo-epoxide), and three PAHs routinely measured at Birkenes, such as biphenyl, fluorene and benzo[ghi]fluoranthene (UNEP, 2009a). An extensive list of PAHs was detected, showing their presence in air samples from Birkenes, but only a few single PAH reference standards were available for analyses, which hampers the identification of individual PAHs. Most of the detected PAHs were therefore classified as L3 (Sect. 3.4.4). In addition, 11 PCB congeners were classified as L2. Besides dieldrin and heptachloro exo-epoxide, the remaining legacy POPs are regularly measured using target methods in the Norwegian monitoring programme for long-range-transported atmospheric contaminants (Nizzetto and Aas, 2016) at the same monitoring station. The detection of those compounds with our novel wide-scope sample clean-up method, combined with SUS and NTS characterisation methods in real air samples, provides additional confidence in the quality of the comprehensive analytical strategy reported here.
3.4.2 Known CECs
The presence of four known CECs (L0, L1 and L2), recently reported in Birkenes air samples, was also confirmed by the approach applied here (Nizzetto et al., 2019). These include the BFRs pentabromotoluene (PeBT, L2) and hexabromobenzene (HBB, L0) as well as the organo-phosphorous flame retardants (OPFRs) triisobutyl phosphate (TBP, L1) and tris(1,3-dichloro-2-propyl)phosphate (TDCPP, L1). In addition to the monitored OPFRs, it was possible to detect nine isomers of previously monitored OPFRs as L2: two positional isomers of tris(4-isopropylphenyl) phosphate (TiPPP), three isomers of di(isopropylphenyl)phenyl phosphate, one isomer of isopropylphenyl diphenyl phosphate, one positional isomer of tris(2-chloroisopropyl)phosphate (TCPP), one isomer of cresyl-diphenyl phosphate and one TBP-related isomer as L2. The six isopropylphenyl phosphate congeners are all part of the technical mixture of TiPPP.
3.4.3 New potential CECs
In addition to the identification of legacy POPs, PAHs and known CECs in air samples from Birkenes, it was possible to detect 90 new potential CECs that to our knowledge have not been previously reported in air samples from this region. Most of these new potential CECs (n= 62), identified with a match to reference standards (L1) or probable structure (L2), were detected in the gas phase (PUF), while 28 were detected in the particle phase (GFF).
Compounds with LRATP. According to half-life data ((air)) from the AOPWIN model of the US EPA EPI Suite programme (U.S. EPA, 2019), 29 of the detected new potential CECs have an LRATP according to the Stockholm convention criteria (UNEP, 2009a), (air), exceeding 2 d.
Of these 29 compounds, 14 were identified as L1 ( GFF PUF; of those are 4 common to GFF and PUF) and 15 compounds were identified as L2 ( GFF PUF). The structures, sample, name and CAS number for L1 compounds can be found in Table 4, and all further information is available in the Excel-SI spreadsheet.
The four L1 compounds, which were identified in both the GFF and PUF samples, were benzenesulfonamide (BSA), p-toluenesulfonamide (pTSA), 2-methyl-9,10-anthraquinone (2-MAQ) and 4H-cyclopenta[def]phenanthren-4-one. BSA and pTSA have similar molecular structures, since BSA is the parent compound of pTSA. BSA is used as an industrial intermediate in the synthesis of widespread products like disinfectants, dyes and photochemical products, and pTSA is used as a fungicide in paints and coatings or as a plasticiser (ECHA, 2019b; Naccarato et al., 2014; Herrero et al., 2014). Since BSA and pTSA can be widely used in many products, a local source cannot be excluded. The identified 2-MAQ is a potential wood combustion product, an intermediate in the industrial production of coating products, inks, toners, laboratory chemicals and explosives, which is used for the production of plastic products (Czech et al., 2018; Lui et al., 2017; Vicente et al., 2016; ECHA, 2019a). It is also possible that 2-MAQ could be formed through atmospheric reactions (Alam et al., 2014). All three oxy-PAHs, 2-MAQ and 4H-cyclopenta[def]phenanthren-4-one (identified in GFF and PUF) and 9,10-anthraquinone (PUF only), are related to emissions of diesel and petrol vehicles (Karavalakis et al., 2010; Alam et al., 2014, 2013). 4H-Cyclopenta[def]phenanthren-4-one as well as 9,10-anthraquinone are also identified as oxidation products of PAHs (Singh et al., 2017). The three identified oxy-PAHs are known air contaminants, but to our knowledge they have never been measured in Norwegian background air samples before. To understand the origin of these oxy-PAHs, further research is necessary, e.g. diagnostic ratios to distinguish between different sources (Alam et al., 2013).
The remaining five L1 compounds (only detected in PUF) were two intermediates, 1,4-benzenedicarbonitrile (terephthalonitrile) and 1-methyl-2-nitrobenzene (2-nitrotoluene), the biodegradation product tetrachloroveratrole, and the two combustion products 1-methoxy-2-nitrobenzene (2-nitroanisole) and 2-naphthalenecarbonitrile. Terephthalonitrile might be an intermediate for the production of the pesticide dacthal (Meng, 2012) and was detected together with two isomers of terephthalonitrile (probably positional isomers), which were classified as L2. 2-Nitrotoluene is used as an intermediate for the production of azo dyes and other dyes, rubber chemicals, agriculture chemicals, pharmaceuticals, and explosives (IARC, 2013; ECHA, 2008). The presence of 2-nitrotoluene may also indicate a degradation product of explosives like TNT (trinitrotoluene) (Mohsen et al., 2013). A possible local source could be a shooting range (6 km south-westerly) or military training area, which is approximately 30 km south-westerly from the Birkenes Observatory (NOU, 2004). The pesticide metabolite, or the bacterial biodegradation product tetrachloroveratrole, is formed during bleaching of wood pulp or chlorination of wastewaters in the pulp and paper industry (GovCanada, 2019; Su et al., 2008; Arinaitwe et al., 2016). Tetrachloroveratrole is a known priority pollutant found and monitored even in the Arctic (Su et al., 2008) but not previously reported in southern Norway background air. 2-Nitroanisole is mainly derived from combustion processes but can also be formed by atmospheric reactions (Stiborova, 2002). Large quantities of 2-nitroanisole were released into the atmosphere in the course of an accident at the Hoechst plant, Germany, in 1993 (Weyer et al., 2014). 2-Naphthalenecarbonitrile is related to plastic combustion, e.g. ABS (acrylonitrile–butadiene–styrene) plastic and polyester fabrics (Moltó et al., 2009; Watanabe et al., 2007; Wang et al., 2007; Moltó et al., 2006), but can also be used for the bluing of steel surfaces (Stefanye, 1972). The corresponding isomer 1-naphtalenecarbonitrile was classified as L2. Other compounds identified as L2 can be found in the Excel-SI spreadsheet.
Table 4Structural overview of L1 compounds classified as new potential CECs with LRATP.
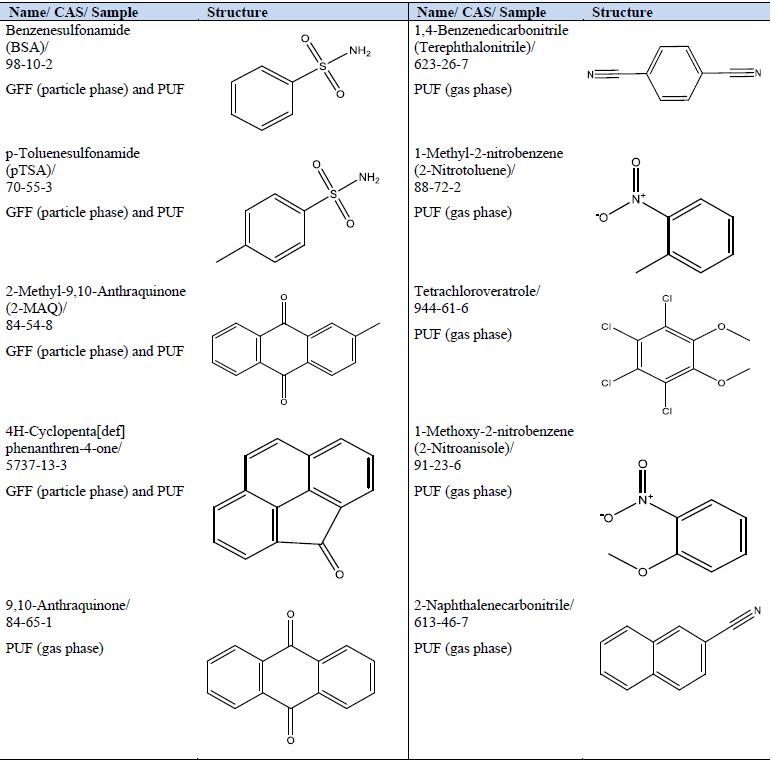
Table 5Structural overview of L1 compounds classified as new potential CECs without LRATP.
Compounds without LRATP. The other new potential CECs detected in this study (n= 61) do not have LRATP, according to the Stockholm convention criteria (UNEP, 2009a), (air), needing to exceed 2 d. The origin of these compounds is still considered to be through LRAT as Birkenes is a background monitoring station where background air is being measured. The presence of these compounds at Birkenes is therefore itself evidence for the LRAT of these compounds. It shows a limitation of modelling calculations for LRATP. The results of this study can be compared with data from the Zeppelin observatory on Svalbard (Arctic background air samples) reported earlier (Röhler et al., 2020). In brief, 16 of 17 L1 compounds without LRATP (all compounds in Table 5, except 3,6-dimethylphenanthrene) from the Birkenes dataset were also confirmed in the Arctic air samples, further confirming the LRATP of these compounds. For more details see Excel-SI.
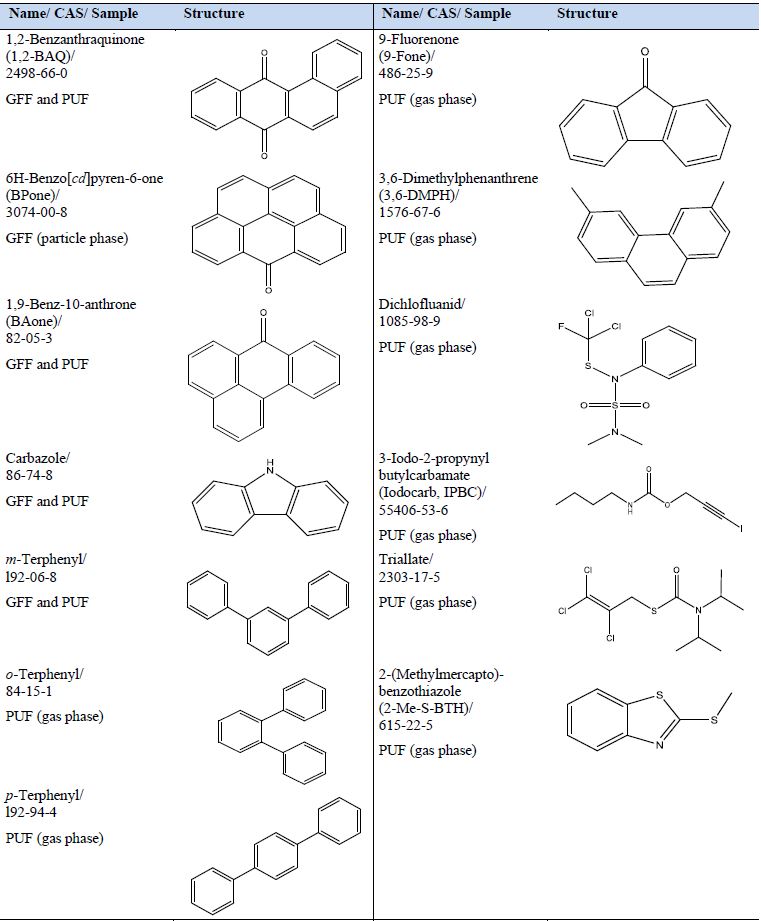
Overall, 61 new potential CECs without LRATP were classified in Birkenes air samples; 17 compounds were identified as L1 ( GFF PUF; 4 are common to GFF and PUF) and 44 compounds classified as L2 ( GFF PUF; 3 are common to GFF and PUF). For L1 compounds, the CAS, name, sample and structure are listed in Table 5, and further information on all compounds identified can be found in Excel-SI.
Four oxy-PAHs (1,2-BAQ, BPone, BAone, 9-Fone and one PAH: 3,6-DMPH) have been previously detected in particle-related samples from three southern European cities, with the highest concentrations during winter (Alves et al., 2017), but to our knowledge they have not been previously measured in southern Norwegian air samples. 3,6-DMPH and 9-Fone were found in the PUF. BPone was found in the GFF, and 1,2-BAQ and BAone were found in the GFF and PUF sample. The identified PAH and four oxy-PAHs were all previously detected in wood combustion experiments (Czech et al., 2018), and a local source cannot be excluded. A further group of compounds, consisting of three terphenyl isomers (), was previously detected during pyrolysis and combustion experiments with polyether fabric (Moltó et al., 2006). The commercial mixture of all three terphenyl isomers is used for heat transfer and as a storage agent in industrial processes. Also, applications as textile dye carriers and as intermediates for non-spreading lubricants are reported (Health Council of the Netherlands, 2002). All three terphenyl isomers were identified in the PUF sample, and m-terphenyl was additionally detected in the GFF sample. The terphenyls have to our best knowledge never been analysed before in air samples from southern Norway, but they were part of a larger screening study from Oslo in 2018. In that study, terphenyls were found in indoor air, sewage water and sediment samples, indicating their widespread emission to the environment (Schlabach et al., 2019).
Carbazole is mainly used in carbazole-containing polymers (PVK, poly(-N-vinylcarbazole)), which could be used in photovoltaic devices or in semiconducting polymers (Zhao et al., 2017; Grazulevicius et al., 2003). This compound is also used in the production of various pharmaceuticals (Zawadzka et al., 2015). Carbazole was identified in both the GFF and PUF sample. For two identified wood preservatives, dichlofluanid and IPBC, a local source cannot be excluded. IPBC is also used in cosmetics and personal care products (ECHA, 2019c, d). Both compounds were detected in the PUF sample. Triallate, which was detected in the PUF sample, is used as an agricultural pesticide (herbicide). While never detected in air samples from southern Norway, there was a previous finding in air samples from Manitoba (Canada) during winter, suggesting relatively high persistence in air and possibly LRATP (Messing et al., 2014). A major methylation product of 2-mercaptobenzothiazole (2-S-BTH), 2-Me-S-BTH, could be identified in the PUF sample. 2-S-BTH is used as a vulcanisation accelerator in rubber for car tires, shoes, cables, rubber gloves and toys (Herrero et al., 2014; Leng and Gries, 2017). Due to its widespread use, the finding of 2-Me-S-BTH could be affected by local sources.
3.4.4 Summary for Level 3 compounds
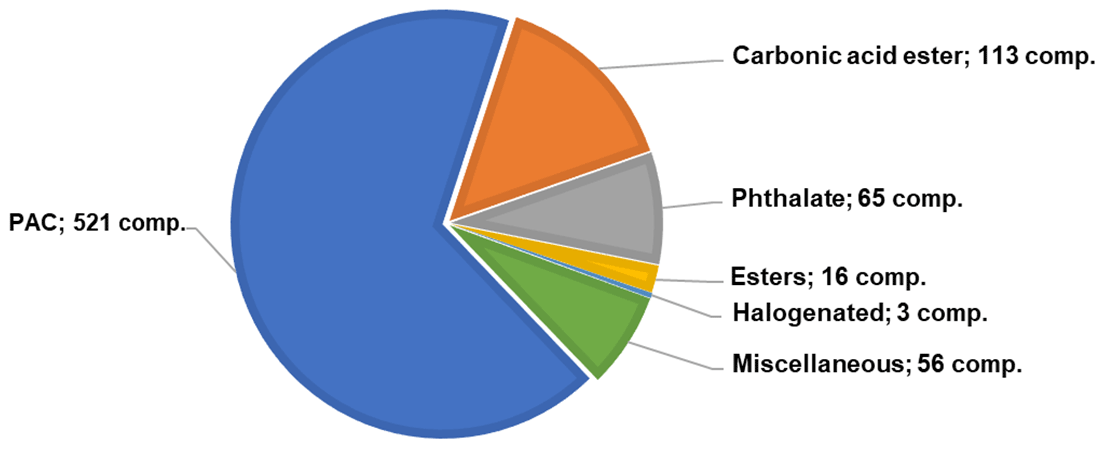
A large number of L3 compounds (tentative candidates; n= 774) were identified. After grouping those L3 compounds into classes, the largest groups of compounds are PACs (polyaromatic compounds), carbonic acid esters and phthalates. Other detected esters and a few halogenated compounds formed two minor groups. All further compounds were grouped as miscellaneous (Fig. 6). The list of L3 compounds can be found in Excel-SI.
3.4.5 Summary for Level 4 compounds
In the group of L4 compounds, 81 possible molecular formulas and unknown halogenated compounds could be detected. Of these, 11 were classified as potential unknown halogenated compounds ( GFF PUF) and the other 70 compounds only had a possible molecular formula ( GFF PUF; 2 are common to GFF and PUF). The detected unknown halogenated compounds did not match MS from NIST14 or in-house MS libraries. It was, however, possible to extract a potential content of chlorine and/or bromine, a potential molecular weight, and structural fragments from the given LRMS spectra. For further identification and to receive more structural information or a potential molecular formula, investigation with HRMS instruments is required. The list of detected L4 compounds can be found in Excel-SI.
A comprehensive sample clean-up method is one of the key factors for successful SUS and NTS approaches. An ideal method removes interfering matrix and at the same time keeps a maximum number of compounds of interest in the extract. In this study, a novel sample clean-up method has been developed and tested on spiked samples and real air samples. The results demonstrate that this method is promising for target as well as SUS and NTS analyses of regulated and emerging organic compounds in air samples. The recoveries for legacy POPs and BFRs were comparable to those obtained with the traditional acid clean-up method, but with the possibility to quantify an extended range of compounds including the acid-labile POPs and BFRs. The GC × GC-LRMS analyses in combination with the newly developed SUS and NTS data evaluation strategies for real air samples resulted in the identification of 90 new potential CECs detected in southern Norway for the first time. With the application of ISTD to SUS and NTS, we extended the SUS and NTS approach into a potential quantitative target analysis.
In order to increase the effectiveness of future SUS and NTS studies in air, expanding the suspect library with entries of relevant airborne contaminants is considered essential. GFF- and PUF-based high-volume air sampling is a widely used air sampling technique, but the polyurethane polymer used in the foams generates a massive load of PUF-related matrix (often more than 20 000 compounds) which needs to be removed during sample clean-up or during post-acquisition data filtration. Reducing this load by developing cleaner PUFs or replacing PUF with another adsorbent is an important next step in further development of SUS and NTS methods for air samples. In future work, the application of GC × GC-HRMS would be an important step for further improvement of the presented SUS and NTS method as it enables the structural elucidation of CECs not yet present in MS libraries. In addition, the application of retention indices and retention index prediction data would provide additional information for the selection of the most likely compound structure.
All data are available in the Supplement. No further data available.
The supplement related to this article is available online at: https://doi.org/10.5194/acp-21-1697-2021-supplement.
LR, MS, PBN and RK developed the idea behind this study.
LR performed chemical work and analysis, created the figures, and wrote the paper.
MS and PBN provided guidance and contributed to the paper preparation.
PR provided guidance for Z-Sep+ C18 method development and paper preparation.
RK provided financial support from internal NMBU funding, provided academic guidance and contributed to the paper preparation.
All authors read and approved the submitted paper.
The authors declare that they have no conflict of interest.
Special thanks to Anders Borgen at NILU for his help with target CUP A-C GC-HRMS analysis and quantification.
Compound structures were created using ChemOffice19 (PerkinElmerInformatics, 2019).
LogP and logD values were created using JChem for Excel (ChemAxon, 2019).
This research has been supported by the NMBU (grant no. 1205051013) and the NILU (grant nos. B111088, B116037). The study was funded by the following: NMBU, Norwegian University of Life Sciences, Ås, with an internal PhD grant; NILU, the Norwegian Institute for Air Research, Kjeller; and the Norwegian Ministry of Climate and Environment through two Strategic Institute Programs granted by the Norwegian Research Council (“Speciation and quantification of emerging pollutants” and “New measurement methods for emerging organic pollutants”).
This paper was edited by Ralf Ebinghaus and reviewed by two anonymous referees.
Alam, M. S., Delgado-Saborit, J. M., Stark, C., and Harrison, R. M.: Using atmospheric measurements of PAH and quinone compounds at roadside and urban background sites to assess sources and reactivity, Atmos. Environ., 77, 24–35, https://doi.org/10.1016/j.atmosenv.2013.04.068, 2013.
Alam, M. S., Delgado-Saborit, J. M., Stark, C., and Harrison, R. M.: Investigating PAH relative reactivity using congener profiles, quinone measurements and back trajectories, Atmos. Chem. Phys., 14, 2467–2477, https://doi.org/10.5194/acp-14-2467-2014, 2014.
Al-Qaim, F. F., Abdullah, M. P., Othman, M. R., Latip, J., and Zakaria, Z.: Multi-residue analytical methodology-based liquid chromatography-time-of-flight-mass spectrometry for the analysis of pharmaceutical residues in surface water and effluents from sewage treatment plants and hospitals, J. Chromatogr. A, 1345, 139–153, https://doi.org/10.1016/j.chroma.2014.04.025, 2014.
Alves, C. A., Vicente, A. M., Custódio, D., Cerqueira, M., Nunes, T., Pio, C., Lucarelli, F., Calzolai, G., Nava, S., Diapouli, E., Eleftheriadis, K., Querol, X., and Musa Bandowe, B. A.: Polycyclic aromatic hydrocarbons and their derivatives (nitro-PAHs, oxygenated PAHs, and azaarenes) in PM2.5 from Southern European cities, Sci. Total Environ., 595, 494–504, https://doi.org/10.1016/j.scitotenv.2017.03.256, 2017.
Alygizakis, N. A., Gago-Ferrero, P., Borova, V. L., Pavlidou, A., Hatzianestis, I., and Thomaidis, N. S.: Occurrence and spatial distribution of 158 pharmaceuticals, drugs of abuse and related metabolites in offshore seawater, Sci. Total Environ., 541, 1097–1105, https://doi.org/10.1016/j.scitotenv.2015.09.145, 2016.
Arey, J. S., Nelson, R. K., Xu, L., and Reddy, C. M.: Using comprehensive two-dimensional gas chromatography retention indices to estimate environmental partitioning properties for a complete set of diesel fuel hydrocarbons, Anal. Chem., 77, 7172–7182, https://doi.org/10.1021/ac051051n, 2005.
Arinaitwe, K., Kiremire, B. T., Muir, D. C. G., Fellin, P., Li, H., Teixeira, C., and Mubiru, D. N.: Legacy and currently used pesticides in the atmospheric environment of Lake Victoria, East Africa, Sci. Total Environ., 543, 9–18, https://doi.org/10.1016/j.scitotenv.2015.10.146, 2016.
Arnot, J. A., Armitage, J. M., McCarty, L. S., Wania, F., Cousins, I. T., and Toose-Reid, L.: Toward a Consistent Evaluative Framework for POP Risk Characterization, Environ. Sci. Technol., 45, 97–103, 2011.
Breivik, K., Arnot, J. A., Brown, T. N., McLachlan, M. S., and Wania, F.: Screening organic chemicals in commerce for emissions in the context of environmental and human exposure, J. Environ. Monitor., 14, 2028–2037, 2012.
Brown, T. N. and Wania, F.: Screening chemicals for the potential to be persistent organic pollutants: A case study of Arctic contaminants, Environ. Sci. Technol., 42, 5202–5209, https://doi.org/10.1021/es8004514, 2008.
ChemAxon: JChem for Excel Add-In V 19.25.0.559., available at: https://chemaxon.com/, last access: 19 December 2019.
Coscollà, C., Castillo, M., Pastor, A., and Yusà, V.: Determination of 40 currently used pesticides in airborne particulate matter (PM10) by microwave-assisted extraction and gas chromatography coupled to triple quadrupole mass spectrometry, Anal. Chim. Acta, 693, 72–81, https://doi.org/10.1016/j.aca.2011.03.017, 2011.
Czech, H., Miersch, T., Orasche, J., Abbaszade, G., Sippula, O., Tissari, J., Michalke, B., Schnelle-Kreis, J., Streibel, T., Jokiniemi, J., and Zimmermann, R.: Chemical composition and speciation of particulate organic matter from modern residential small-scale wood combustion appliances, Sci. Total Environ., 612, 636–648, https://doi.org/10.1016/j.scitotenv.2017.08.263, 2018.
ECHA: Summary Risk Assessment Report 2-Nitrotoluene, availabe at: https://echa.europa.eu/documents/10162/8658f490-2965-4ad8-ac18-7aa7f80d331a (last access: 18 November 2019), 2008.
ECHA: ECHA substance information 2-Methylanthraquinone, availabe at: https://echa.europa.eu/substance-information/-/substanceinfo/100.001.399 (last access: 7 February 2020), 2019a.
ECHA: ECHA substance information Benzenesulfonamide, availabe at: https://echa.europa.eu/substance-information/-/substanceinfo/100.002.398 (last access: 7 February 2020), 2019b.
ECHA: ECHA substance information 3-iodo-2-propynyl butylcarbamate, available at: https://echa.europa.eu/substance-information/-/substanceinfo/100.054.188 (last access: 7 February 2020), 2019c.
ECHA: ECHA substance information Dichlofluanid, available at: https://echa.europa.eu/substance-information/-/substanceinfo/100.012.835 (last access: 7 February 2020), 2019d.
EFSA – European Food Safety Authority: Results of the monitoring of non dioxin-like PCBs in food and feed, EFSA Journal, 8, https://doi.org/10.2903/j.efsa.2010.1701, 2010.
EMEP: The co-operative programme for monitoring and evaluation of the long-range transmission of air pollutants in Europe (inofficially “European Monitoring and Evaluation Programme” = EMEP) is a scientifically based and policy driven programme under the Convention on Long-range Transboundary Air Pollution (CLRTAP) for international co-operation to solve transboundary air pollution problems, available at: https://www.emep.int/ (last access: 7 February 2020), 2019.
European Commission: Commission Regulation (EU) 2017/644 of 5 April 2017 – laying down methods of sampling and analysis for the control of levels of dioxins, dioxin-like PCBs and non-dioxin-like PCBs in certain foodstuffs and repealing Regulation (EU) No 589/2014, 6 April 2017, European Commission, Brussels, Belgium, 2017.
European Parliament: Regulation (EC) No 1907/2006 of the European Parliament and of the Council, 18 December 2006, concerning the Registration, Evaluation, Authorisation and Restriction of Chemicals (REACH), establishing a European Chemicals Agency, amending Directive 1999/45/EC and repealing Council Regulation (EEC) No 793/93 and Commission Regulation (EC) No. 1488/94 as well as Council Directive 76/769/EEC and Commission Directives 91/155/EEC, 93/67/EEC, 93/105/EC and 2000/21/EC, The European Parliament and the Council of the European Union, Brussels, Belgium, 2018.
GovCanada: Chemicals of high priority, Batch 8 of the Challenge: Tetrachloroveratrole, available at: https://www.canada.ca/en/health-canada/services/chemical-substances/challenge/batch-8/tetrachloroveratrole.html (last access: 7 February 2020), 2019.
Grazulevicius, J. V., Strohriegl, P., Pielichowski, J., and Pielichowski, K.: Carbazole-containing polymers: synthesis, properties and applications, Prog. Polym. Sci., 28, 1297–1353, https://doi.org/10.1016/S0079-6700(03)00036-4, 2003.
Halse, A. K., Schlabach, M., Eckhardt, S., Sweetman, A., Jones, K. C., and Breivik, K.: Spatial variability of POPs in European background air, Atmos. Chem. Phys., 11, 1549–1564, https://doi.org/10.5194/acp-11-1549-2011, 2011.
Health Council of the Netherlands: Committee on Updating of Occupational Exposure Limits. o-, m-, p-Terphenyl (mixture); Health-based Reassessment of Administrative Occupational Exposure Limits, Health Council of the Netherlands, The Hague, The Netherlands, 16 pp., 2002.
Hernández, F., Portolés, T., Pitarch, E., and López, F. J.: Target and Nontarget Screening of Organic Micropollutants in Water by Solid-Phase Microextraction Combined with Gas Chromatography/High-Resolution Time-of-Flight Mass Spectrometry, Anal. Chem., 79, 9494–9504, https://doi.org/10.1021/ac071551b, 2007.
Hernández, F., Ibáñez, M., Botero-Coy, A.-M., Bade, R., Bustos-López, M. C., Rincón, J., Moncayo, A., and Bijlsma, L.: LC-QTOF MS screening of more than 1,000 licit and illicit drugs and their metabolites in wastewater and surface waters from the area of Bogotá, Colombia, Anal. Bioanal. Chem., 407, 6405–6416, https://doi.org/10.1007/s00216-015-8796-x, 2015.
Herrero, P., Borrull, F., Pocurull, E., and Marcé, R. M.: An overview of analytical methods and occurrence of benzotriazoles, benzothiazoles and benzenesulfonamides in the environment, TRAC-Trend Anal. Chem., 62, 46–55, https://doi.org/10.1016/j.trac.2014.06.017, 2014.
Hilton, D. C., Jones, R. S., and Sjödin, A.: A method for rapid, non-targeted screening for environmental contaminants in household dust, J. Chromatogr. A, 1217, 6851–6856, https://doi.org/10.1016/j.chroma.2010.08.039, 2010.
Hoferkamp, L., Hermanson, M. H., and Muir, D. C. G.: Current use pesticides in Arctic media, 2000–2007, Sci. Total Environ., 408, 2985–2994, https://doi.org/10.1016/j.scitotenv.2009.11.038, 2010.
Howard, P. H. and Muir, D. C. G.: Identifying New Persistent and Bioaccumulative Organics Among Chemicals in Commerce, Environ. Sci. Technol., 44, 2277–2285, https://doi.org/10.1021/es903383a, 2010.
IARC: Some Chemicals Present in Industrial and Consumer Products, Food and Drinking-Water: 2-Nitrotoluene, in: IARC monographs on the evaluation of carcinogenic risks to humans, No 101, IARC Working Group on the Evaluation of Carcinogenic Risks to Humans, International Agency for Research on Cancer, Lyon (France), available at: https://www.ncbi.nlm.nih.gov/books/NBK373187/ (last access: 18 November 2019), 2013.
Kallenborn, R., Breivik, K., Eckhardt, S., Lunder, C. R., Manø, S., Schlabach, M., and Stohl, A.: Long-term monitoring of persistent organic pollutants (POPs) at the Norwegian Troll station in Dronning Maud Land, Antarctica, Atmos. Chem. Phys., 13, 6983–6992, https://doi.org/10.5194/acp-13-6983-2013, 2013.
Karavalakis, G., Fontaras, G., Ampatzoglou, D., Kousoulidou, M., Stournas, S., Samaras, Z., and Bakeas, E.: Effects of low concentration biodiesel blends application on modern passenger cars, Part 3: Impact on PAH, nitro-PAH, and oxy-PAH emissions, Environ. Pollut., 158, 1584–1594, https://doi.org/10.1016/j.envpol.2009.12.017, 2010.
Lebedev, A. T., Mazur, D. M., Polyakova, O. V., Kosyakov, D. S., Kozhevnikov, A. Y., Latkin, T. B., Andreeva Yu, I., and Artaev, V. B.: Semi volatile organic compounds in the snow of Russian Arctic islands: Archipelago Novaya Zemlya, Environ. Pollut., 239, 416–427, https://doi.org/10.1016/j.envpol.2018.03.009, 2018.
Leng, G. and Gries, W.: New specific and sensitive biomonitoring methods for chemicals of emerging health relevance, Int. J. Hyg. Envir. Heal., 220, 113–122, https://doi.org/10.1016/j.ijheh.2016.09.014, 2017.
López Zavala, M. Á. and Reynoso-Cuevas, L.: Simultaneous extraction and determination of four different groups of pharmaceuticals in compost using optimized ultrasonic extraction and ultrahigh pressure liquid chromatography-mass spectrometry, J. Chromatogr. A, 1423, 9–18, https://doi.org/10.1016/j.chroma.2015.10.051, 2015.
Lu, H., Liang, Y., Dunn, W. B., Shen, H., and Kell, D. B.: Comparative evaluation of software for deconvolution of metabolomics data based on GC-TOF-MS, TRAC-Trend Anal. Chem., 27, 215–227, https://doi.org/10.1016/j.trac.2007.11.004, 2008.
Lui, K. H., Bandowe, B. A., Tian, L., Chan, C. S., Cao, J. J., Ning, Z., Lee, S. C., and Ho, K. F.: Cancer risk from polycyclic aromatic compounds in fine particulate matter generated from household coal combustion in Xuanwei, China, Chemosphere, 169, 660–668, https://doi.org/10.1016/j.chemosphere.2016.11.112, 2017.
Mao, D., Lookman, R., Van De Weghe, H., Weltens, R., Vanermen, G., De Brucker, N., and Diels, L.: Combining HPLC-GCXGC, GCXGC/ToF-MS, and selected ecotoxicity assays for detailed monitoring of petroleum hydrocarbon degradation in soil and leaching water, Environ. Sci. Technol., 43, 7651–7657, https://doi.org/10.1021/es9015603, 2009.
Masiá, A., Campo, J., Blasco, C., and Picó, Y.: Ultra-high performance liquid chromatography – quadrupole time-of-flight mass spectrometry to identify contaminants in water: An insight on environmental forensics, J. Chromatogr. A, 1345, 86–97, https://doi.org/10.1016/j.chroma.2014.04.017, 2014.
Mazur, D. M., Zenkevich, I. G., Artaev, V. B., Polyakova, O. V., and Lebedev, A. T.: Regression algorithm for calculating second-dimension retention indices in comprehensive two-dimensional gas chromatography, J. Chromatogr. A, 1569, 178–185, https://doi.org/10.1016/j.chroma.2018.07.038, 2018.
McLachlan, M. S., Kierkegaard, A., Radke, M., Sobek, A., Malmvarn, A., Alsberg, T., Arnot, J. A., Brown, T. N., Wania, F., Breivik, K., and Xu, S. H.: Using Model-Based Screening to Help Discover Unknown Environmental Contaminants, Environ. Sci. Technol., 48, 7264–7271, 2014.
Meng, J.: Production of dacthal from xylene, Copyright (C) 2019 American Chemical Society (ACS), All Rights Reserved, China, Patent, CAPLUS AN 2012:647168(Patent), Patent number CN102432470A, 2012.
Messing, P. G., Farenhorst, A., Waite, D. T., and Sproull, J. F.: Current-Use Herbicides in Air as Influenced by Their Estimated Agricultural Use at Various Distances from Six Sampling Locations, Water Air Soil Poll., 225, 2013, https://doi.org/10.1007/s11270-014-2013-y, 2014.
Millow, C. J., Mackintosh, S. A., Lewison, R. L., Dodder, N. G., and Hoh, E.: Identifying bioaccumulative halogenated organic compounds using a nontargeted analytical approach: seabirds as sentinels, PLOS One, 10, e0127205, https://doi.org/10.1371/journal.pone.0127205, 2015.
Mohsen, Y., Sanchez, J.-B., Berger, F., Lahlou, H., Bezverkhyy, I., Fierro, V., Weber, G., Celzard, A., and Bellat, J.-P.: Selection and characterization of adsorbents for the analysis of an explosive-related molecule traces in the air, Sensor. Actuat. B-Chem., 176, 124–131, https://doi.org/10.1016/j.snb.2012.10.042, 2013.
Moltó, J., Font, R., and Conesa, J. A.: Study of the Organic Compounds Produced in the Pyrolysis and Combustion of Used Polyester Fabrics, Energ. Fuel., 20, 1951–1958, https://doi.org/10.1021/ef060205e, 2006.
Moltó, J., Font, R., Gálvez, A., and Conesa, J. A.: Pyrolysis and combustion of electronic wastes, J. Anal. Appl. Pyrol., 84, 68–78, https://doi.org/10.1016/j.jaap.2008.10.023, 2009.
Naccarato, A., Gionfriddo, E., Sindona, G., and Tagarelli, A.: Simultaneous determination of benzothiazoles, benzotriazoles and benzosulfonamides by solid phase microextraction-gas chromatography-triple quadrupole mass spectrometry in environmental aqueous matrices and human urine, J. Chromatogr. A, 1338, 164–173, https://doi.org/10.1016/j.chroma.2014.02.089, 2014.
Nizzetto, P. B. and Aas, W.: Monitoring of environmental contaminants in air and precipitation, Annual report 2015, NILU, Kjeller, Norway M-579, 1–98, 2016.
Nizzetto, P. B. Aas, W., and Nikiforov, V. A.,: Monitoring of environmental contaminants in air and precipitation, Annual report 2018, NILU, Kjeller, Norway, 2019.
NORMAN network: List of emergin substances, available at: https://www.norman-network.com/sites/default/files/files/Emerging_substances_list_Feb_16/NORMAN list_2016_FINAL.XLSX (last access: 7 February 2020), 2016 (updated 2016).
NOU: Forsvarets skyte- og øvingsfelt: Hovedrapport fra Det rådgivende utvalg til vurdering av Forsvarets øvingsmuligheter, 2004:27. Statens forvaltningstjeneste Informasjonsforvaltning, Lobo Media AS, Oslo, Norway, 2004.
Oulton, S.: Scientific working group for the analysis of seized drugs, availabe at: http://swgdrug.org/ms.htm (last access: 7 February 2020), 2019.
PerkinElmerInformatics: ChemOffice19: ChemDraw for Excel V 19.0., available at: https://www.perkinelmer.com (last access: 4 February 2020), 2019.
Ralston-Hooper, K., Hopf, A., Oh, C., Zhang, X., Adamec, J., and Sepulveda, M. S.: Development of GCxGC/TOF-MS metabolomics for use in ecotoxicological studies with invertebrates, Aquat. Toxicol., 88, 48–52, https://doi.org/10.1016/j.aquatox.2008.03.002, 2008.
Reppas-Chrysovitsinos, E., Sobek, A., and MacLeod, M.: Screening-level exposure-based prioritization to identify potential POPs, vPvBs and planetary boundary threats among Arctic contaminants, Emerging Contaminants, 3, 85–94, https://doi.org/10.1016/j.emcon.2017.06.001, 2017.
Röhler, L., Kallenborn, R., and Schlabach, M.: Comprehensive two-dimensional gas chromatography (GCxGC/TOF-MS): Environmetal non-target analysis, Kjemi, 5, 32–36, 2014.
Röhler, L., Schlabach, M., Haglund, P., Breivik, K., Kallenborn, R., and Bohlin-Nizzetto, P.: Non-target and suspect characterisation of organic contaminants in Arctic air – Part 2: Application of a new tool for identification and prioritisation of chemicals of emerging Arctic concern in air, Atmos. Chem. Phys., 20, 9031–9049, https://doi.org/10.5194/acp-20-9031-2020, 2020.
Rostkowski, P., Haglund, P., Aalizadeh, R., Alygizakis, N., Thomaidis, N., Arandes, J. B., Nizzetto, P. B., Booij, P., Budzinski, H., Brunswick, P., Covaci, A., Gallampois, C., Grosse, S., Hindle, R., Ipolyi, I., Jobst, K., Kaserzon, S. L., Leonards, P., Lestremau, F., Letzel, T., Magnér, J., Matsukami, H., Moschet, C., Oswald, P., Plassmann, M., Slobodnik, J., and Yang, C.: The strength in numbers: comprehensive characterization of house dust using complementary mass spectrometric techniques, Anal. Bioanal. Chem., 411, 1957–1977, https://doi.org/10.1007/s00216-019-01615-6, 2019.
Ruiz-Guerrero, R., Vendeuvre, C., Thiebaut, D., Bertoncini, F., and Espinat, D.: Comparison of comprehensive two-dimensional gas chromatography coupled with sulfur-chemiluminescence detector to standard methods for speciation of sulfur-containing compounds in middle distillates, J. Chromatogr. Sci., 44, 566–573, https://doi.org/10.1093/chromsci/44.9.566, 2006.
Schlabach, M., Halse, A. K., Kringstad, A., Nikiforov, V. A., Nizzetto, P. B., Pfaffhuber, K. A., Reid, M. J., Rostkowski, P., and Vogelsang, C.: Screening program 2018: Volatiles, Gd, BADGE, UV filters, Additives and Medicines, NILU, Kjeller, Norway, 97 pp., 2019.
Schymanski, E. L., Singer, H. P., Slobodnik, J., Ipolyi, I. M., Oswald, P., Krauss, M., Schulze, T., Haglund, P., Letzel, T., Grosse, S., Thomaidis, N. S., Bletsou, A., Zwiener, C., Ibanez, M., Portoles, T., de Boer, R., Reid, M. J., Onghena, M., Kunkel, U., Schulz, W., Guillon, A., Noyon, N., Leroy, G., Bados, P., Bogialli, S., Stipanicev, D., Rostkowski, P., and Hollender, J.: Non-target screening with high-resolution mass spectrometry: critical review using a collaborative trial on water analysis, Anal. Bioanal. Chem., 407, 6237–6255, https://doi.org/10.1007/s00216-015-8681-7, 2015.
Singh, D. K., Kawamura, K., Yanase, A., and Barrie, L. A.: Distributions of Polycyclic Aromatic Hydrocarbons, Aromatic Ketones, Carboxylic Acids, and Trace Metals in Arctic Aerosols: Long-Range Atmospheric Transport, Photochemical Degradation/Production at Polar Sunrise, Environ. Sci. Technol., 51, 8992–9004, https://doi.org/10.1021/acs.est.7b01644, 2017.
Stefanye, D.: Bluing of steel surfaces, Copyright (C) 2019 American Chemical Society (ACS), All Rights Reserved, Patent number US3677829A CAPLUS AN 1972:504620(Patent), 1972.
Stiborova, M.: Nitroaromatic compounds: Environmental pollutants with carcinogenic potential for humans, Chem. Listy, 96, 784–791, 2002.
Su, Y., Hung, H., Blanchard, P., Patton, G. W., Kallenborn, R., Konoplev, A., Fellin, P., Li, H., Geen, C., Stern, G., Rosenberg, B., and Barrie, L. A.: A circumpolar perspective of atmospheric organochlorine pesticides (OCPs): Results from six Arctic monitoring stations in 2000–2003, Atmos. Environ., 42, 4682–4698, https://doi.org/10.1016/j.atmosenv.2008.01.054, 2008.
Ubukata, M., Jobst, K. J., Reiner, E. J., Reichenbach, S. E., Tao, Q., Hang, J., Wu, Z., Dane, A. J., and Cody, R. B.: Non-targeted analysis of electronics waste by comprehensive two-dimensional gas chromatography combined with high-resolution mass spectrometry: Using accurate mass information and mass defect analysis to explore the data, J. Chromatogr. A, 1395, 152–159, https://doi.org/10.1016/j.chroma.2015.03.050, 2015.
UNECE: The 1998 Aarhus Protocol on Persistent Organic Pollutants (POPs), available at: https://www.unece.org/env/lrtap/pops_h1.html (last access: 7 February 2020), 1998.
UNEP: Stockholm Convention on Persistent Organic Pollutants (POPs), available at: http://www.pops.int/TheConvention/Overview/TextoftheConvention/tabid/2232/Default.aspx (last access: 4 February 2020), 2009a.
UNEP: The global monitoring plan for persistent organic pollutants (POPs), available at: http://chm.pops.int/Implementation/GlobalMonitoringPlan/Overview/tabid/83/Default.aspx (last access: 4 February 2020), 2009b.
US EPA: Estimation Programs Interface Suite™for Microsoft® Windows, v 4.11, United States Environmental Protection Agency, Washington, DC, USA, 2019.
Van De Weghe, H., Vanermen, G., Gemoets, J., Lookman, R., and Bertels, D.: Application of comprehensive two-dimensional gas chromatography for the assessment of oil contaminated soils, J. Chromatogr. A, 1137, 91–100, https://doi.org/10.1016/j.chroma.2006.10.014, 2006.
van Leeuwen, S. P. and de Boer, J.: Advances in the gas chromatographic determination of persistent organic pollutants in the aquatic environment, J. Chromatogr. A, 1186, 161–182, https://doi.org/10.1016/j.chroma.2008.01.044, 2008.
van Mispelaar, V. G., Smilde, A. K., de Noord, O. E., Blomberg, J., and Schoenmakers, P. J.: Classification of highly similar crude oils using data sets from comprehensive two-dimensional gas chromatography and multivariate techniques, J. Chromatogr. A, 1096, 156–164, https://doi.org/10.1016/j.chroma.2005.09.063, 2005.
Veenaas, C. and Haglund, P.: Methodology for non-target screening of sewage sludge using comprehensive two-dimensional gas chromatography coupled to high-resolution mass spectrometry, Anal. Bioanal. Chem., 409, 4867–4883, https://doi.org/10.1007/s00216-017-0429-0, 2017.
Veenaas, C. and Haglund, P.: A retention index system for comprehensive two-dimensional gas chromatography using polyethylene glycols, J. Chromatogr. A, 1536, 67–74, https://doi.org/10.1016/j.chroma.2017.08.062, 2018.
Vicente, E. D., Vicente, A. M., Musa Bandowe, B. A., and Alves, C. A.: Particulate phase emission of parent polycyclic aromatic hydrocarbons (PAHs) and their derivatives (alkyl-PAHs, oxygenated-PAHs, azaarenes and nitrated PAHs) from manually and automatically fired combustion appliances, Air Qual. Atmos. Hlth., 9, 653–668, https://doi.org/10.1007/s11869-015-0364-1, 2016.
Vorkamp, K. and Rigét, F. F.: A review of new and current-use contaminants in the Arctic environment: Evidence of long-range transport and indications of bioaccumulation, Chemosphere, 111, 379–395, https://doi.org/10.1016/j.chemosphere.2014.04.019, 2014.
Wang, Z., Li, K., Lambert, P., and Yang, C.: Identification, characterization and quantitation of pyrogenic polycylic aromatic hydrocarbons and other organic compounds in tire fire products, J. Chromatogr. A, 1139, 14–26, https://doi.org/10.1016/j.chroma.2006.10.085, 2007.
Watanabe, M., Nakata, C., Wu, W., Kawamoto, K., and Noma, Y.: Characterization of semi-volatile organic compounds emitted during heating of nitrogen-containing plastics at low temperature, Chemosphere, 68, 2063–2072, https://doi.org/10.1016/j.chemosphere.2007.02.022, 2007.
Weyer, V., Blettner, M., Cholmakow-Bodechtel, C., and Heudorf, U.: Chemical accident at Hoechst AG Frankfurt/Main, Germany, 1993: a 15 year follow-up analysis of mortality, Eur. J. Epidemiol., 29, 73–76, https://doi.org/10.1007/s10654-013-9870-3, 2014.
Zawadzka, K., Bernat, P., Felczak, A., and Lisowska, K.: Carbazole hydroxylation by the filamentous fungi of the Cunninghamella species, Environ. Sci. Pollut. R., 22, 19658–19666, https://doi.org/10.1007/s11356-015-5146-7, 2015.
Zhao, X., Chaudhry, S. T., and Mei, J.: Chapter Five – Heterocyclic Building Blocks for Organic Semiconductors, Adv. Heterocycl. Chem., 121, 133–171, https://doi.org/10.1016/bs.aihch.2016.04.009, 2017.
Zhong, G., Xie, Z., Cai, M., Möller, A., Sturm, R., Tang, J., Zhang, G., He, J., and Ebinghaus, R.: Distribution and Air-Sea Exchange of Current-Use Pesticides (CUPs) from East Asia to the High Arctic Ocean, Environ. Sci. Technol., 46, 259–267, https://doi.org/10.1021/es202655k, 2012.