the Creative Commons Attribution 4.0 License.
the Creative Commons Attribution 4.0 License.
 | 23 Nov 2021
Positive and negative influences of typhoons on tropospheric ozone over southern China
Zhixiong Chen
Xugeng Cheng
Mengmiao Yang
Hong Wang
Based on an ensemble of 17 typhoons that made landfall between 2014 and 2018, we investigate the positive and negative influences of typhoons on tropospheric ozone over southern China. With respect to the proximity of typhoon centres and the typhoon developmental stages, we find that surface ozone is enhanced when typhoons are 400–1500 km away during the initial stages of development (e.g. from 1 d before to 1 d after typhoon genesis). The positive ozone anomalies reach 10–20 ppbv above the background ozone level on average. The maximum enhancement of surface ozone appears at a radial distance of 1100–1300 km from the typhoon centre during these initial stages. As the typhoons approach southern China, the influences of these systems switch to reducing ozone and, hence, lead to negative ozone anomalies of 6–9 ppbv. Exploring the linkages between ozone variations and typhoon-induced meteorological evolution, we find that increasing temperature and weak winds in the atmospheric boundary layer (ABL) and dominating downward motions promote ozone production and accumulation over the outskirts of typhoons during typhoon initial stages, whereas deteriorating weather, accompanied by dropping temperature, wind gales and convective activity, reduces the production and accumulation of surface ozone when typhoons are making landfall.
We further examine the impacts of typhoons on tropospheric ozone profiles vertically, especially the influences of typhoon-induced stratospheric intrusions on lower troposphere and surface ozone. Based on temporally dense ozone profile observations, we find two high-ozone regions, located in the ABL and the middle to upper troposphere respectively, during different typhoon stages. On average, the high-ozone region in the ABL has a maximum ozone enhancement of 10–12 ppbv at 1–1.5 km altitude during the initial typhoon stages. In the high-ozone region in the middle to upper troposphere, ozone enhancement persists over a longer period with a maximum ozone enhancement of ∼ 10 ppbv at 7–8 km altitude shortly after typhoon genesis; this value increases to ∼ 30 ppbv near 12 km altitude when typhoons reach their maximum intensity. When typhoons make landfall, negative ozone anomalies appear and extend upward with a maximum ozone reduction of 14–18 ppbv at 5 km altitude and 20–25 ppbv at 11 km altitude. Although the overall tropospheric ozone is usually reduced during typhoon landfall, we find that five of eight typhoon samples induced ozone-rich air with a stratospheric origin above 4 km altitude; moreover, in three typhoon cases, the ozone-rich air intrusions can sink to the ABL. This suggests that the typhoon-induced stratospheric intrusions play an important role in surface ozone enhancement.
- Article
(8130 KB) - Full-text XML
- BibTeX
- EndNote


It has been noted that high-ozone (O3) episodes are frequently associated with tropical cyclones (TCs) in the warm seasons over southern China (Huang et al., 2005; Lam et al., 2005; Jiang et al., 2008; Shu et al., 2016; Chow et al., 2018; Gao et al., 2020). Previous studies have suggested that TCs often modulate meteorological conditions and, hence, alter photochemical production, accumulation, transport and dispersion of ozone. For example, when TCs approach a region, fine, hot weather is associated with strong solar radiation and high temperatures, and overwhelming downward air motions are conducive to low wind speed and a stable atmospheric boundary layer (ABL), all of which are responsible for high-ozone episodes in the developed and highly populated Pearl River Delta (PRD) and Yangtze River Delta (YRD) regions (e.g. Shu et al., 2016; Zhan et al., 2020). However, it is not clear whether these findings regarding the impacts of TCs, which are based on individual cases, are applicable over large domains (e.g. both coastal regions and neighbouring inland provinces in southern China). In recent years, rapid urbanization and economic development has also taken place in other regions of southern China (in addition to the PRD and YRD), and many areas suffer from continuous increases in ozone levels (Li et al., 2019; Han et al., 2020). Southern China is frequently under the influence of TCs. Around 326 TCs formed over the western Pacific during the 2000–2017 period (Li et al., 2020), and, on average, six typhoons make landfall annually in southern China (Zhang et al., 2013). Therefore, there is an urgent need to statistically investigate the influences of TCs on tropospheric ozone over southern China, given the frequent TC activity from June to October and the close connections between TCs and high-ozone episodes.
Typhoons, also named hurricanes in the Atlantic and the eastern North Pacific, refer to an intense kind of TC with maximum sustained wind speeds exceeding 37.2 m s−1. Typhoons that finally make landfall in China raise more concerns due to their relatively larger sizes, higher severity, and more direct passages toward coastal regions and neighbouring inland provinces in southern China. Although TCs have been regarded as one of the main synoptic patterns influencing surface ozone concentrations, a comprehensive understanding of ozone variations in space and time attributable to typhoons making landfall is lacking, as previous studies have generally been limited to individual cases or regional domains, and have been mostly focused solely on ozone enhancement. Typhoon circulation typifies a radius of O(103 km) and can persist for several days with various intensities and locations that steer ozone behaviour differently. From the occurrence of ozone episodes and the spatio-temporal distribution and properties of typhoons, Huang et al. (2006) found that when a typhoon is about 700–1000 km away from the PRD, the region is already controlled by large-scale typhoon-induced subsidence and suffers from high ozone pollution. Roux et al. (2020) stated that typhoons at a distance of 500–1000 km offshore provide a favourable environment for active photochemical reactions and, hence, high-ozone episodes. It has also been documented that surface ozone concentrations increase over southwestern Taiwan 2 to 4 d before the passage of typhoons (Hung and Lo, 2015). Recently, Zhan et al. (2020) found that ozone pollution episodes in the YRD mainly occur when a typhoon reaches the 24 h warning line (thick dashed line in Fig. 1) and the previous typhoon dies away in mainland China. While it is of value to stress typhoon-induced ozone enhancement in the context of air pollution, the cleansing function associated with typhoons making landfall is also important for a complete evaluation of typhoon influences on surface ozone concentrations and on long-term tropospheric ozone trends. Hence, a full insight into the evolutionary influences of typhoons making landfall, i.e. both ozone enhancement and reduction effects, would further our understanding of the contribution of typhoons to surface ozone variations and tropospheric ozone.
Typhoons consist of bands of convective clouds that can vertically penetrate into the tropopause region. Therefore, they can potentially perturb the structure and chemical composition of the tropopause region and can promote stratosphere–troposphere exchanges (STEs). For example, several studies have shown that typhoons can induce downward intrusions of ozone-rich air (Jiang et al., 2015; Das et al., 2016; Li et al., 2018; Roux et al., 2020). Such intrusions can even reach the ABL and deteriorate the air quality there, as in the case of Typhoon Hagibis over the southeastern coast of China reported by Jiang et al. (2015). However, some previous studies have emphasized the role of typhoons in cleaning the air and reducing tropospheric ozone concentrations. They state that the stratospheric intrusions of ozone-rich air are insignificant, and instead, the uplifting of marine ozone-poor air masses by typhoons decreases tropospheric ozone concentrations. In a recent study, Li et al. (2020) analysed 18-year ozonesonde measurements at a frequency of once per week over Hong Kong and Naha, and found that TCs, including typhoons, reduce ozone by ∼ 20–60 ppbv from the mean near the tropopause. Noticing the positive and negative influences of typhoons on tropospheric ozone, researchers have pointed out that such different influences are closely related to the developmental stages and intensity of typhoons (e.g. Zou and Wu, 2005; Midya et al., 2012). Therefore, given the evolving features of typhoons, sufficient ozone observations are necessary to adequately sample the fine-scale structure of ozone and, hence, quantitatively address the influence of typhoon-induced stratosphere intrusion on tropospheric ozone variations. Unfortunately, few studies have been done because a large ensemble of typhoons and temporally dense ozone vertical observations are required to provide statistically robust results.
In this study, we comprehensively investigate the successive response of ozone concentrations to typhoons making landfall over southern China. A large ensemble of typhoon landfall cases from the 2014–2018 period is applied to examine the overall ozone behaviour and offers statistically reliable conclusions. The typhoons making landfall are divided into several developmental stages to track their evolutionary features with respect to location and intensity. Accordingly, the multiple impacts of typhoons on surface ozone variation, namely the positive (enhancement) and negative (reduction) impacts during the entire lifespan of typhoons, are analysed and gauged. Given the importance of stratospheric intrusions to the tropospheric ozone budget, the ozone profile evolution of typhoons making landfall is analysed to quantify the contribution of external descending stratospheric ozone to lower tropospheric ozone. To realize this, temporally dense observations, including ground-based ozone and vertical ozone profiles collected during typhoon seasons, are synchronized according to typhoon developmental features. Meteorological conditions are also analysed to reveal the physical linkages between typhoon evolution and ozone variation in time and space. We intend to answer the following scientific questions:
-
How do surface ozone concentrations vary spatio-temporally under the influence of typhoons making landfall? What are the meteorological factors responsible for such ozone variations?
-
How do the tropospheric ozone profiles respond to the differential developmental stages of typhoons making landfall? What are the meteorological controls on the vertical ozone variations?
-
Do the typhoon-induced stratospheric intrusions play a significant role in enhancing tropospheric and surface ozone?
The remainder of this paper is structured as follows: Sect. 2 describes the study domain and period, the ozone observations, the meteorological data, and the analysis methods; Sect. 3 presents the statistical distributions of surface ozone concentrations with reference to typhoon developmental features; Sect. 4 shows the vertical variations in ozone concentrations during the evolutionary processes of typhoons making landfall based on temporally dense ozone profile observations, and the impacts of typhoon-induced STE on the vertical ozone distributions is also presented; finally, Sect. 5 offers the conclusions, discussions and suggestions for future work.
2.1 Typhoon data
The best track data of tropical cyclones for China is provided by the China Meteorological Administration (CMA; available at http://tcdata.typhoon.org.cn/zjljsjj_sm.html, last access: 25 October 2021; Ying et al., 2014). TCs can be classified into several categories according to their average wind speed: tropical depression (TD; wind speeds of 10.8–17.1 m s−1), tropical storm (TS; wind speeds of 17.2–24.4 m s−1), severe tropical storm (STS; wind speeds of 24.5–32.6 m s−1), typhoon (TY; wind speeds of 32.7–41.4 m s−1), severe typhoon (STY; wind speeds of 41.5–50.9 m s−1) and super typhoon (super TY; wind speeds exceeding 51.0 m s−1). We extracted information about each typhoon over the 2014–2018 period, including storm category, geolocation of cyclone centres (latitude and longitude), minimum sea level pressure and maximum sustained wind speed. The best track data were collected every 6 h from 1949; however, this has been updated to every 3 h since 2017 in order to better capture typhoon evolution during landfall.
Typhoons making landfall attract much attention due to their severity and their direct passages toward densely populated lands. A total of 17 typhoons landed in China over the 2014–2018 period, as shown in Fig. 1. These storms form a large ensemble that can be used to investigate the impacts of typhoons on overall ozone behaviour with high confidence. Given the evolving nature of typhoons, which vary with respect to location and intensity, we divide typhoon development into several stages with reference to the timing of their genesis, maximum intensity and landfall. The genesis time (hereafter referred to as Tg) is obtained from the best track data when the typhoon is first identified in the TD category. Pre-typhoon periods are examined 1 d before (Tg−1 d) and 2 d before (Tg−2 d) Tg, and the conditions 1 d after Tg (Tg+1 d) are also included in our study. The time of maximum typhoon intensity (Tmax) is determined when the maximum sustained wind speed peaks (also lowest minimum sea level pressure) for the first time. The time of landfall (Tlanding) is determined when typhoons first land in southern China, and Tlanding+1 d represents the post-landfall conditions 1 d after typhoon landfall. Therefore, there are seven developmental stages that represent the evolutionary characteristics of the entire typhoon lifespan: Tg−2 d, Tg−1 d, Tg, Tg+1 d, Tmax, Tlanding and Tlanding+1 d. Ozone and meteorological conditions in the typhoon ensemble are synchronized according to the seven stages and are compared in order to illustrate how ozone varies with distance from typhoons in different typhoon developmental stages in southern China.
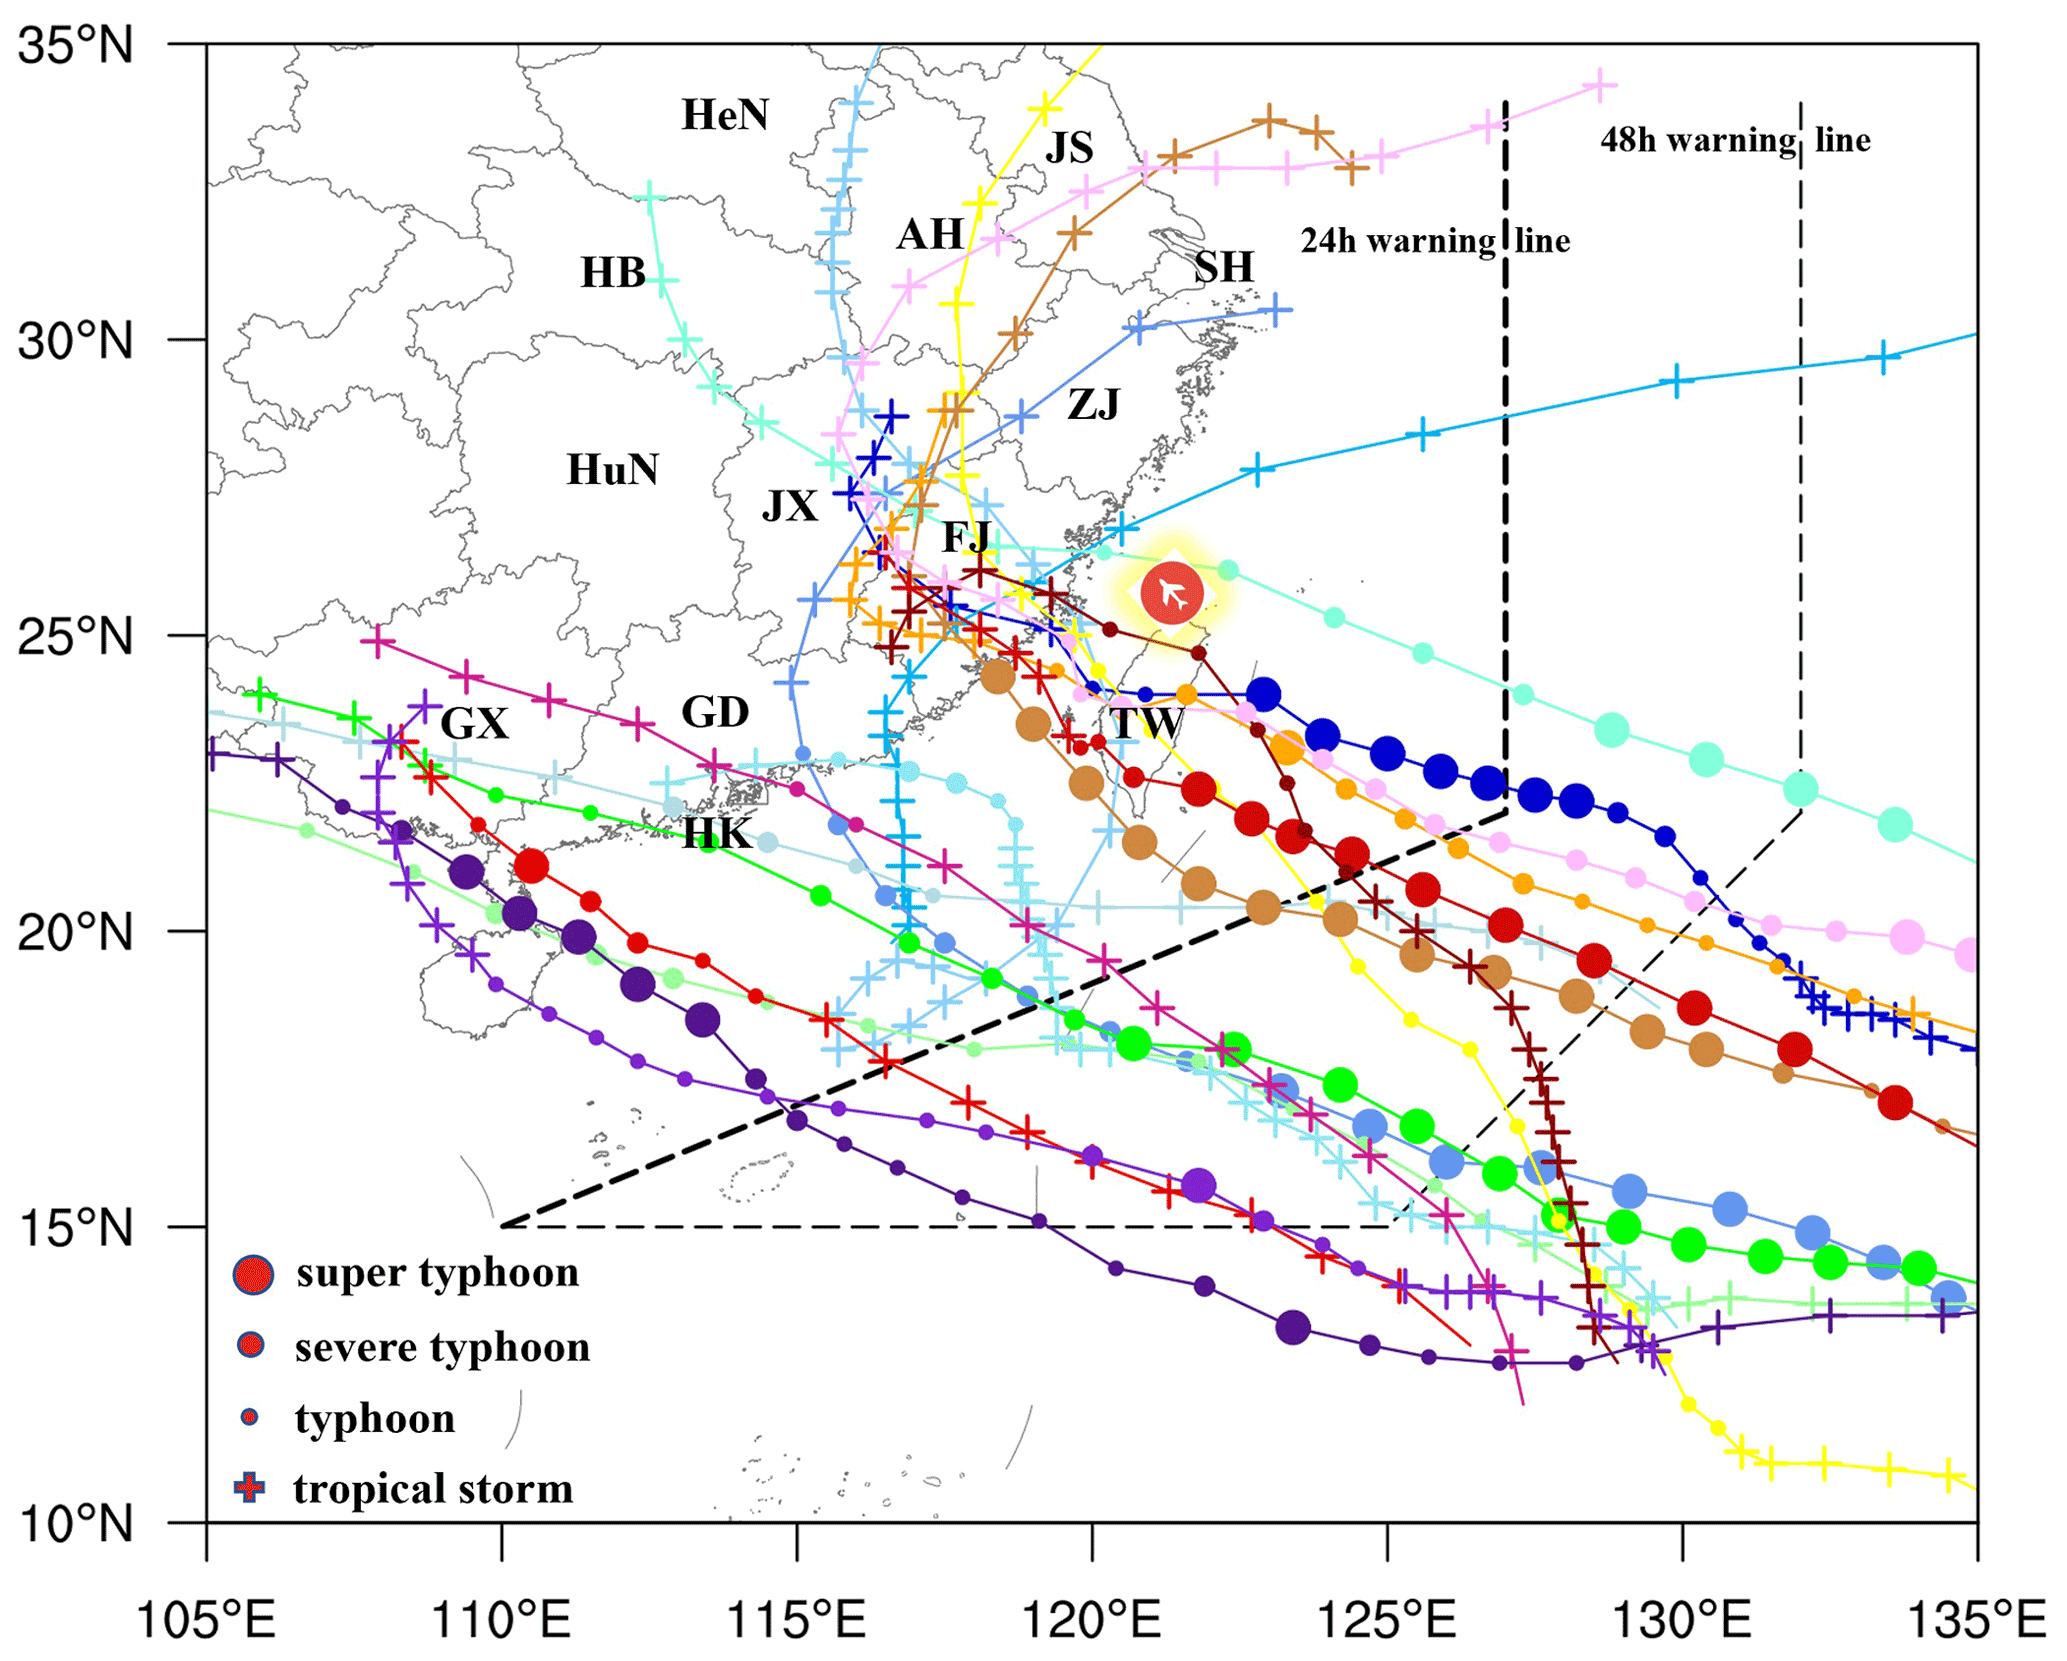
Figure 1The tracks (lines) and categories (symbols) of 17 typhoons that made landfall in Southern China over the western Pacific between 2014 and 2018. The thin and thick black dashed lines represent the 48 and 24 h typhoon warning lines respectively. The locations and boundaries of the provinces of interest are indicated by the following abbreviations: Anhui (AH), Fujian (FJ), Guangdong (GD), Guangxi (GX), Henan (HeN), Hubei (HB), Hunan (HuN), Jiangsu (JS), Jiangxi (JX) and Zhejiang (ZJ). Shanghai (SH) district is also shown. The location where vertical ozone profiles are available at Taoyuan International Airport (25.076∘ N, 121.224∘ E) in Taiwan (TW) is marked using a red plane symbol.
2.2 Ground-based ozone observations
Routine measurements of surface air pollutants are provided by the China National Environmental Monitoring Centre. This nationwide network consists of more than 1500 stations distributed over 454 cities. Each station conducts hourly measurements of six types of air pollutants: fine surface particulate matter with a respective aerodynamic diameter of 2.5 µm (PM2.5) and 10 µm (PM10), ozone (O3), carbon monoxide (CO), nitrogen dioxide (NO2) and sulfur dioxide (SO2) (Lu et al., 2018). The observational data are strictly quality controlled and can be accessed via a real-time air quality reporting website (http://106.37.208.233:20035/, last access: 25 October 2021).
This study focuses on the evolutionary impacts of typhoons on ozone concentrations over coastal regions and neighbouring inland areas in southern China (Fig. 1). The hourly surface ozone concentrations in each city are calculated by averaging the observations from all of the monitoring stations in that city. Two specific hours, 14:00 local standard time (LST; 06:00 UTC) and 02:00 LST (18:00 UTC), are in coincidence with typhoon observation timing and are used to represent typical ozone scenarios during the daytime and night-time respectively.
Using the geolocation of cities and typhoon centres, the radial distances between the ozone observation and the corresponding typhoon centres are calculated at each of the typhoon developmental stage for all of the cities. These ozone concentrations are then spatially averaged with a spacing of 200 km in the radial direction. A background surface ozone concentration (Tavg) value is also calculated as the baseline by averaging the corresponding observations during the typhoon seasons (from June to October) over the 2014–2018 period. Note that, in this calculation, the geolocation of typhoons during the Tg stage is used. For ozone features under pre-typhoon conditions at Tg−2 d and Tg−1 d, the geolocation of a typhoon at stage Tg is also applied, as the typhoons are not generated yet. Ozone variation in the radial direction for each typhoon and during the different typhoon developmental stages are repeatedly calculated and are averaged by taking the mean ozone concentrations over the typhoon ensemble.
2.3 Airborne ozone observations
Airborne measurements of atmospheric chemical compounds are provided by the European Research Infrastructures programme IAGOS (In-service Aircraft for a Global Observing System; https://www.iagos.org, last access: 25 October 2021; Petzold et al., 2015). O3, CO, nitrogen oxides (NOx), and temperature, winds and relative humidity are measured by the in situ sensors during flights around the world. For O3, measurements are carried out by a dual-beam ultraviolet absorption monitor operated at 253.7 nm, and the concentrations are automatically corrected for pressure and temperature influences. The response time for the O3 measurement is 4 s, and the accuracy of ozone observations is estimated to be ±2 ppbv (Thouret et al., 1998).
We collected all IAGOS observations during take-off and landing at Taoyuan International Airport (25.076∘ N, 121.224∘ E; red plane symbol in Fig. 1) in Taiwan (TW). Considering data quality, the airborne observations associated with typhoons making landfall between 2014 and 2018 are screened, and eight typhoons are selected. The ozone profiles are analysed with reference to the seven developmental stages of typhoons defined above. In the end, we obtain 234 profiles in total, including 21 profiles for the genesis stage of typhoons, 34 profiles for the maximum stage and 29 profiles for the landfall stage. These temporally dense ozone profiles guarantee that we can adequately resolve the successive response of the ozone distribution to different typhoon stages and, hence, provide comprehensive insight into the contributions of typhoons to the tropospheric ozone budget. The ozone profile data are processed into a uniform 100 m vertical resolution by averaging observations over 100 m thick layers from 0 to 12 km above sea level. As done for the processing of surface ozone observations, the ozone profiles associated with each developmental stage of each typhoon are averaged over the typhoon ensemble. The vertical profiles of temperature and wind observations are processed in the same way.
2.4 Reanalysis meteorological data
The typhoon-induced meteorological influences on ozone are analysed using the MERRA-2 (Modern-Era Retrospective Analysis for Research and Applications, Version 2) reanalysis data, which are produced by NASA's Global Modeling and Assimilation Office (GMAO; https://gmao.gsfc.nasa.gov/reanalysis/MERRA-2, last access: 25 October 2021; Gelaro et al., 2017). The MERRA-2 data have a spatial resolution of 0.5∘ × 0.625∘ and 72 vertical levels. The reanalysis data have been evaluated and were found to match well with the observations from Chinese weather stations (Li et al., 2019). The gridded meteorological variables, including temperature, wind, vertical velocity and potential vorticity (PV), are extracted from MERRA-2 during each of the typhoon developmental stages in order to investigate meteorological linkages to the production, accumulation, transport and dispersion of ozone.
Figure 1 shows the tracks and categories of the 17 typhoons that made landfall during the 2014–2018 period. These typhoons are marked using four categories ranging from tropical storm to typhoons, severe typhoons and super typhoons. Among the 17 typhoon landfall cases, 11 of them reached super typhoon intensity. Typhoons most frequently made landfall in the Taiwan (TW), Fujian (FJ) and Guangdong (GD) provinces and travelled on to influence neighbouring inland regions. Given the typical size of typhoon circulations – on the order of 1000 km, typhoons making landfall have the potential to influence large-scale meteorological environments and, hence, impact surface ozone concentrations over southern China. Previous studies have shown that surface ozone concentrations in the PRD and YRD are enhanced when typhoons are 700–1000 km away and when typhoons cross the 24 h warning line (thick black dashed line in Fig. 1) (e.g. Huang et al., 2006; Zhan et al., 2020). Extending from these findings of ozone enhancement over regions at a distance from typhoon centres, this paper examines the overall variations in surface ozone with the radial distance of typhoons making landfall over southern China and also comprehensively addresses both positive and negative impacts of typhoons on surface ozone.
Figure 2 shows surface ozone concentrations varying along the radial distance of typhoons at different typhoon developmental stages, based on the mean of the 17 typhoon landfall samples. During the daytime (14:00 LST, Fig. 2a), the background ozone concentrations range between 45 and 55 ppbv with small variations along the radial direction of typhoons. Surface ozone concentrations are obviously elevated from pre-typhoon conditions (Tg−2 d and Tg−1 d) to typhoon genesis (Tg and Tg+1 d). The average ozone enhancement reaches 10–20 ppbv when typhoons are 400–1500 km away, which produces positive anomalies of 20 %–40 % from Tg−2 d to Tg+1 d above the background ozone concentrations. Particularly, surface ozone concentrations are largest within radial distances of 1100–1300 km with a mean magnitude of 83.4 ppbv during the Tg−1 d and Tg stages, yielding positive anomalies of 52.5 % compared with the background ozone concentrations of 54.7 ppbv. During night-time (02:00 LST, Fig. 2b), when the ozone photochemical reactions cease, positive ozone anomalies of ∼ 9 ppbv relative to the background ozone concentrations persist during the Tg−1 d and Tg stages. The zone with significant ozone enhancement is generally similar to that during the daytime. The behaviour of ozone enhancement during daytime and night-time is consistent in the large ensemble of typhoons making landfall; thus, considering the necessity for an ozone episode warning, we suggest that surface ozone concentrations at a radial distance of 1100–1300 km are most significantly enhanced during the initial stages of typhoons.
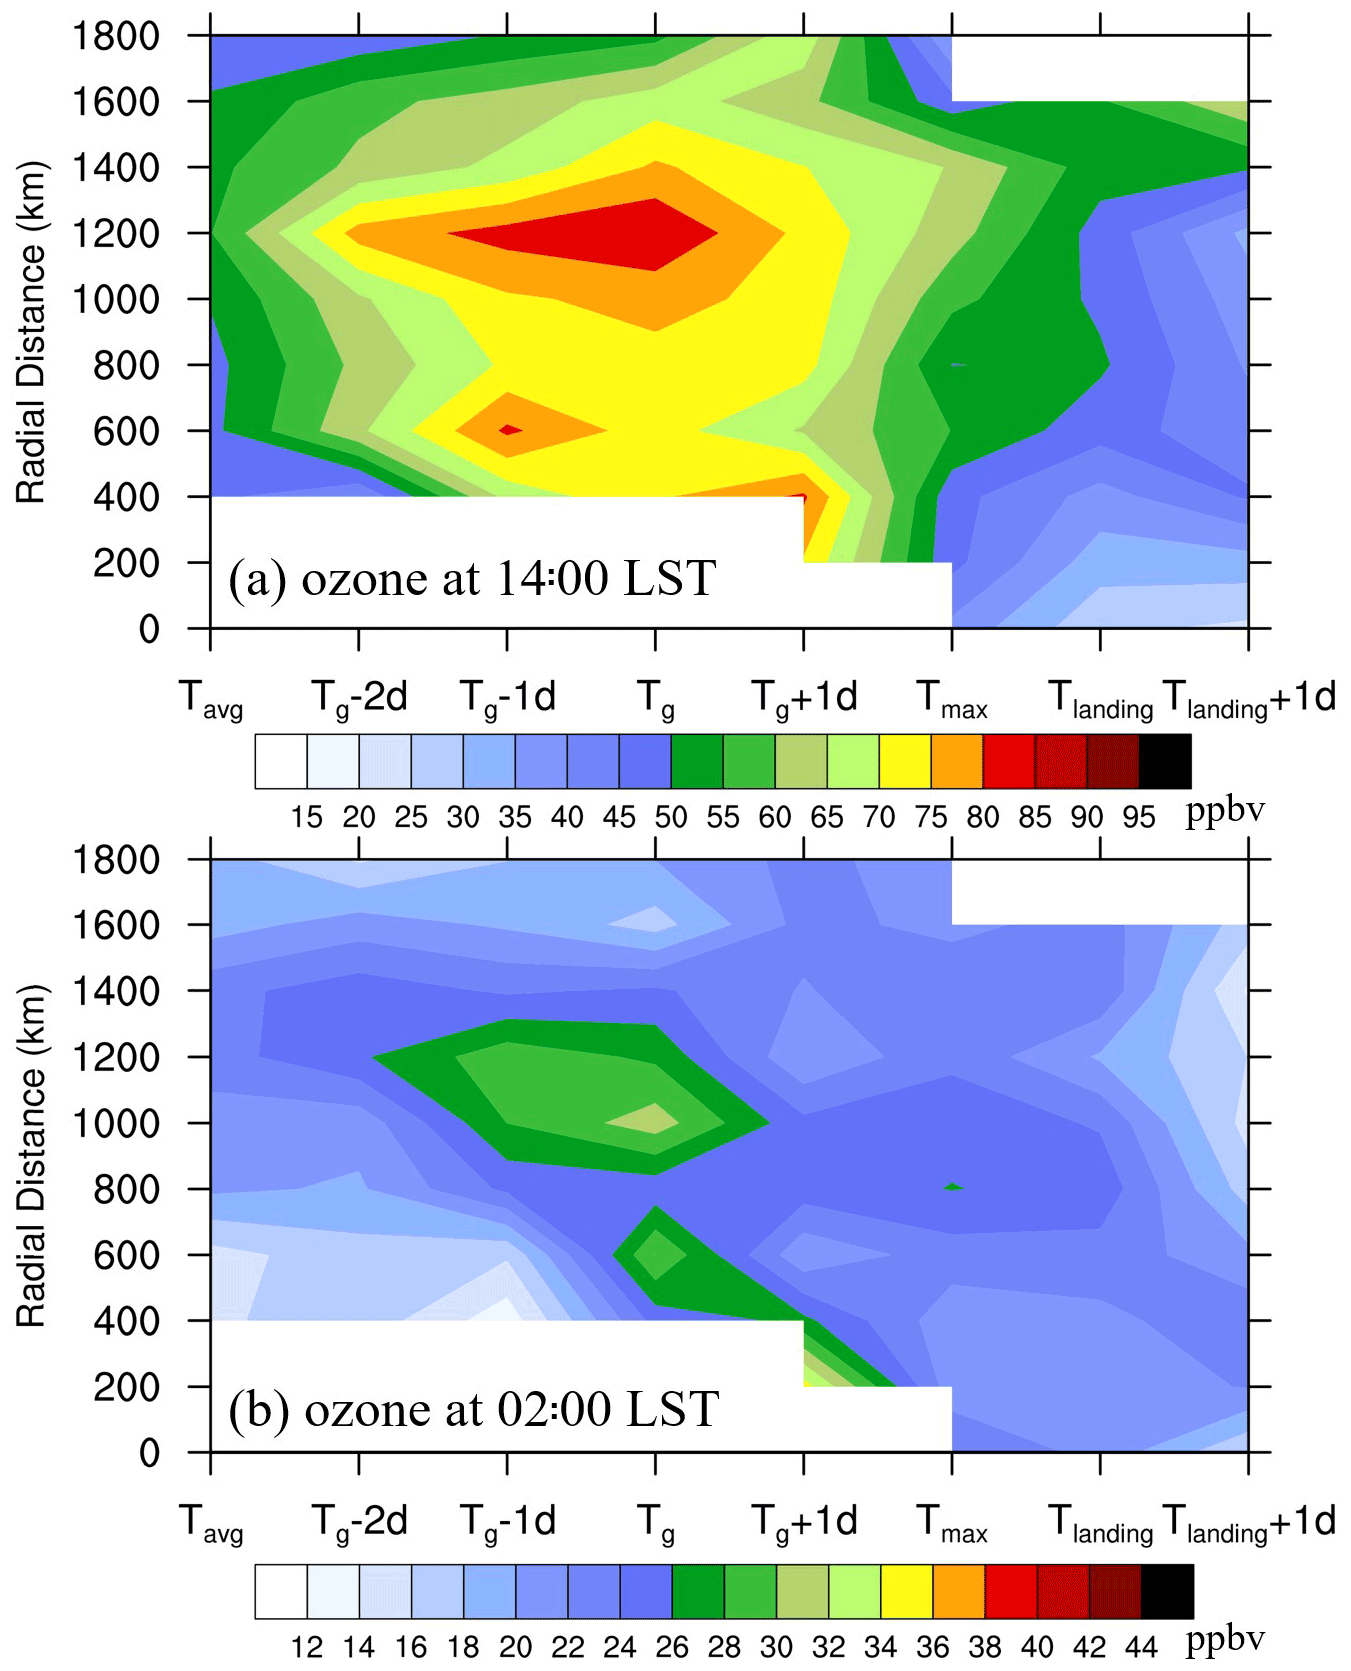
Figure 2Surface ozone concentrations (in ppbv) along the radial distance of typhoons at various typhoon developmental stages at daytime (a) and night-time (b). The concentrations are the mean ozone concentrations of all of the typhoons over the 2014–2018 period. The surface ozone concentration data are from the China National Environmental Monitoring Centre, and the white sections in the bottom-left and top-right parts of the panels are due to missing observations.
As the typhoons develop rapidly and approach southern China, the typhoon influences on surface ozone switch from enhancement to reduction. An obvious region with low ozone concentrations appears right after the Tmax stage when the typhoons have reached their maximum intensity and move closer to the coast. Surface ozone concentrations return to background levels during the Tmax stage and keep decreasing when the typhoons make landfall in southern China. Quantitatively, the negative ozone anomalies are −11.9 % (6 ppbv) at Tlanding and −16.6 % (9 ppbv) at Tlanding+1 d relative to the background ozone concentrations at daytime. Between Tmax and Tlanding+1 d, surface ozone concentrations decrease monotonously with the decrease in the radial distance from the typhoon centres. In other words, partly due to the arrival of marine air masses, ozone is greatly reduced near the typhoon centres.
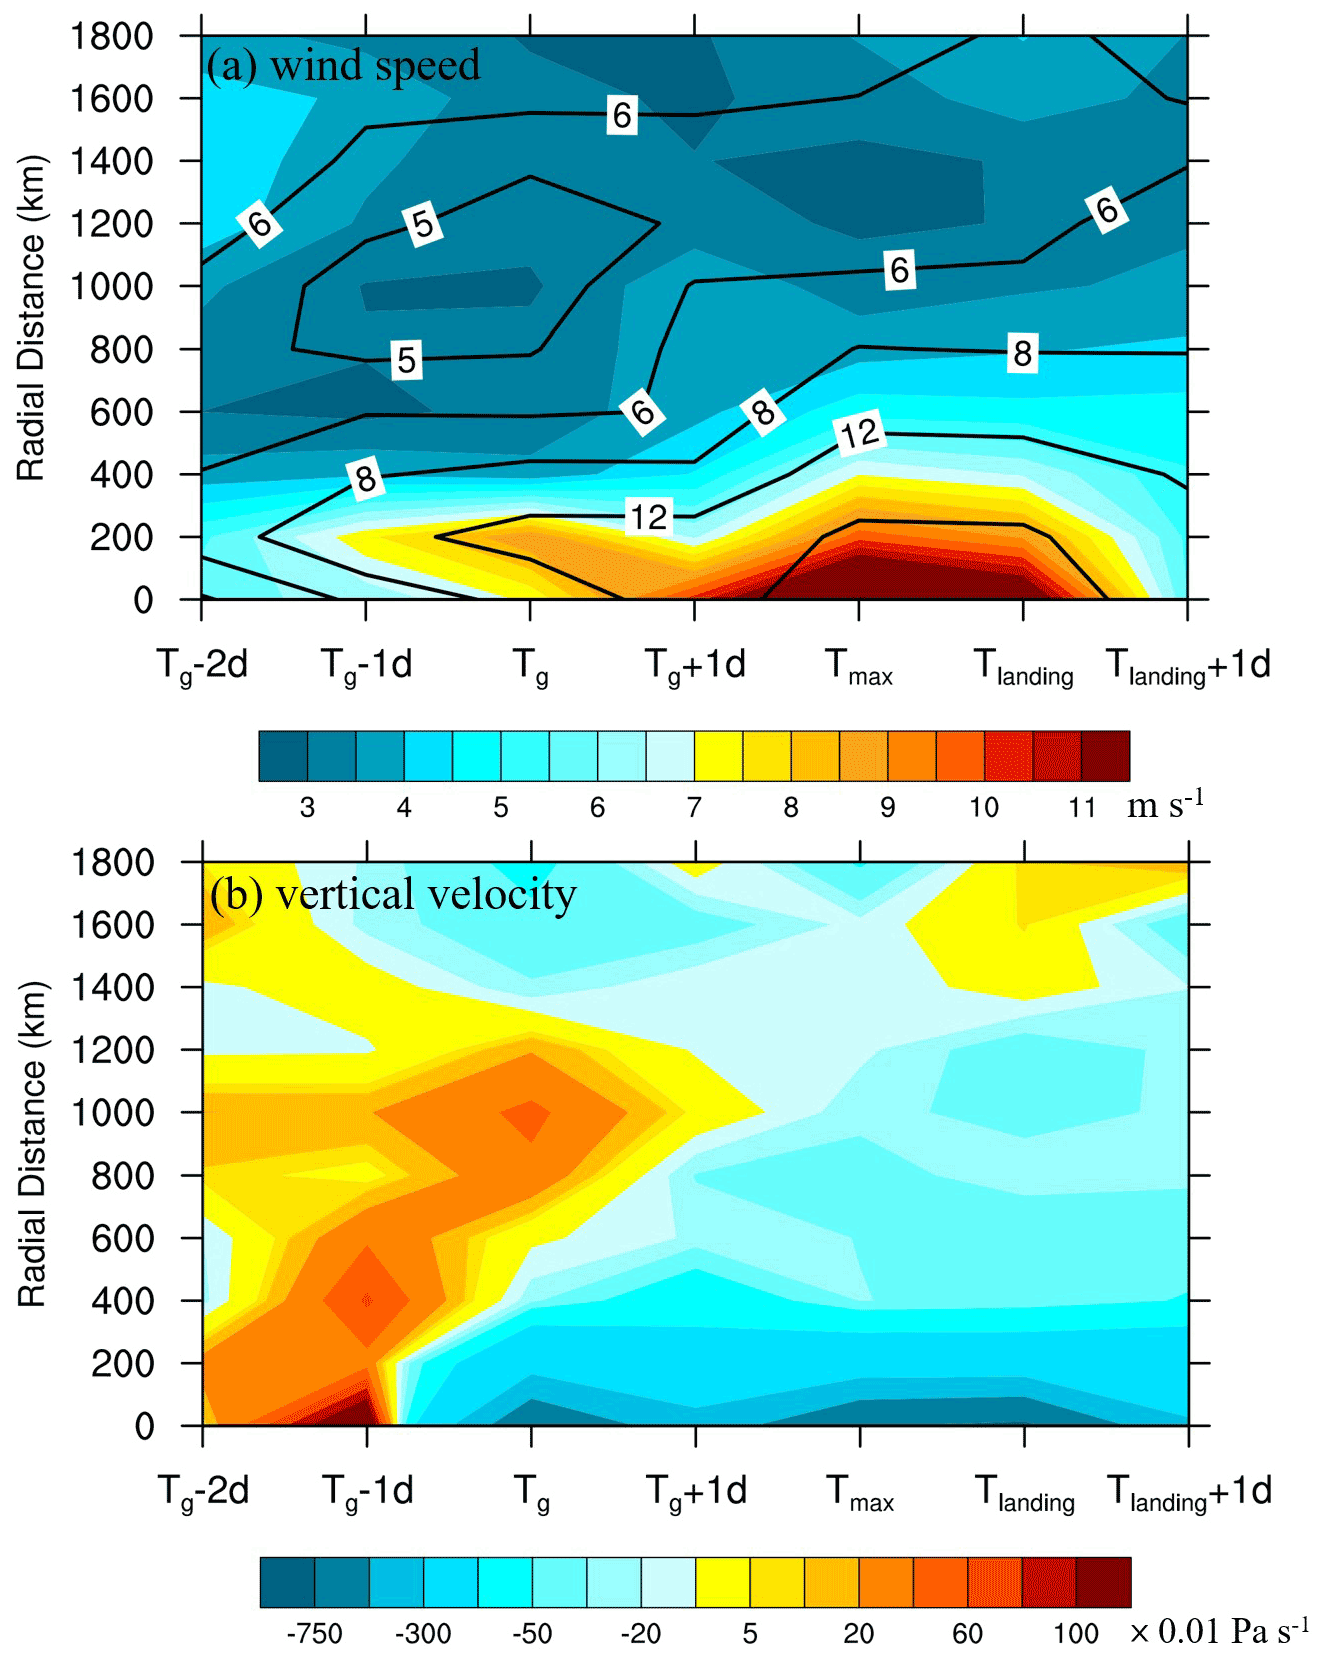
To understand large changes in the influence of typhoons on surface ozone, from enhancing to cleansing ozone during their lifespan, we explore meteorological connections between the evolution of typhoons and the successive response of surface ozone from the perspective of ozone production, accumulation, transport and dispersion. Similar to the analysis applied to surface ozone, meteorological variables are processed considering the radial distance and developmental stages of the typhoons making landfall. Figure 3 shows the evolution of air temperature and wind speed within the ABL as well as the 500 hPa vertical air motions averaged over the 17 typhoons using the MERRA-2 reanalysis. From the Tg−2 d to the Tg+1 d stages, a systematic increase in air temperature is noticed both at the near-surface (first 10 m from the surface) and at 850 hPa height within a radial distance of 400–1500 km from the typhoon centres during daytime (Fig. 3a). Using the air temperature as a proxy of solar radiation intensity, it can be inferred that the boundary layer is dominated by fine, hot weather accompanied by strong solar radiation that promotes the photochemical production of ozone during these stages. In terms of wind fields, belt-like regions with weak winds (< 3–4 m s−1) are found when typhoons are 800–1600 km away during the Tg−2 d to Tg+1 d stages (Fig. 3b). The low-wind-speed zone extends up from the surface to 850 hPa, yielding a stable ABL that is favourable for the accumulation of ozone. Regarding vertical flows, downward air motions dominate in the mid-troposphere over the outskirts of typhoons (800–1500 km in radial direction). This peripheral typhoon-induced subsidence contributes to cloudless conditions and a stable ABL structure, which are favourable for ozone production and accumulation. The meteorological scenario at night-time is similar to that at daytime, supporting the persistence of elevated ozone concentrations, except that ozone photochemical reactions cease due to the lack of sunshine. During the early initial stages of typhoons, stagnation due to low wind speeds caused by these systems is also significant and is accompanied by systematic downward motions between 800 and 1200 km in the radial direction at night (02:00 LST), as shown in Fig. 4.
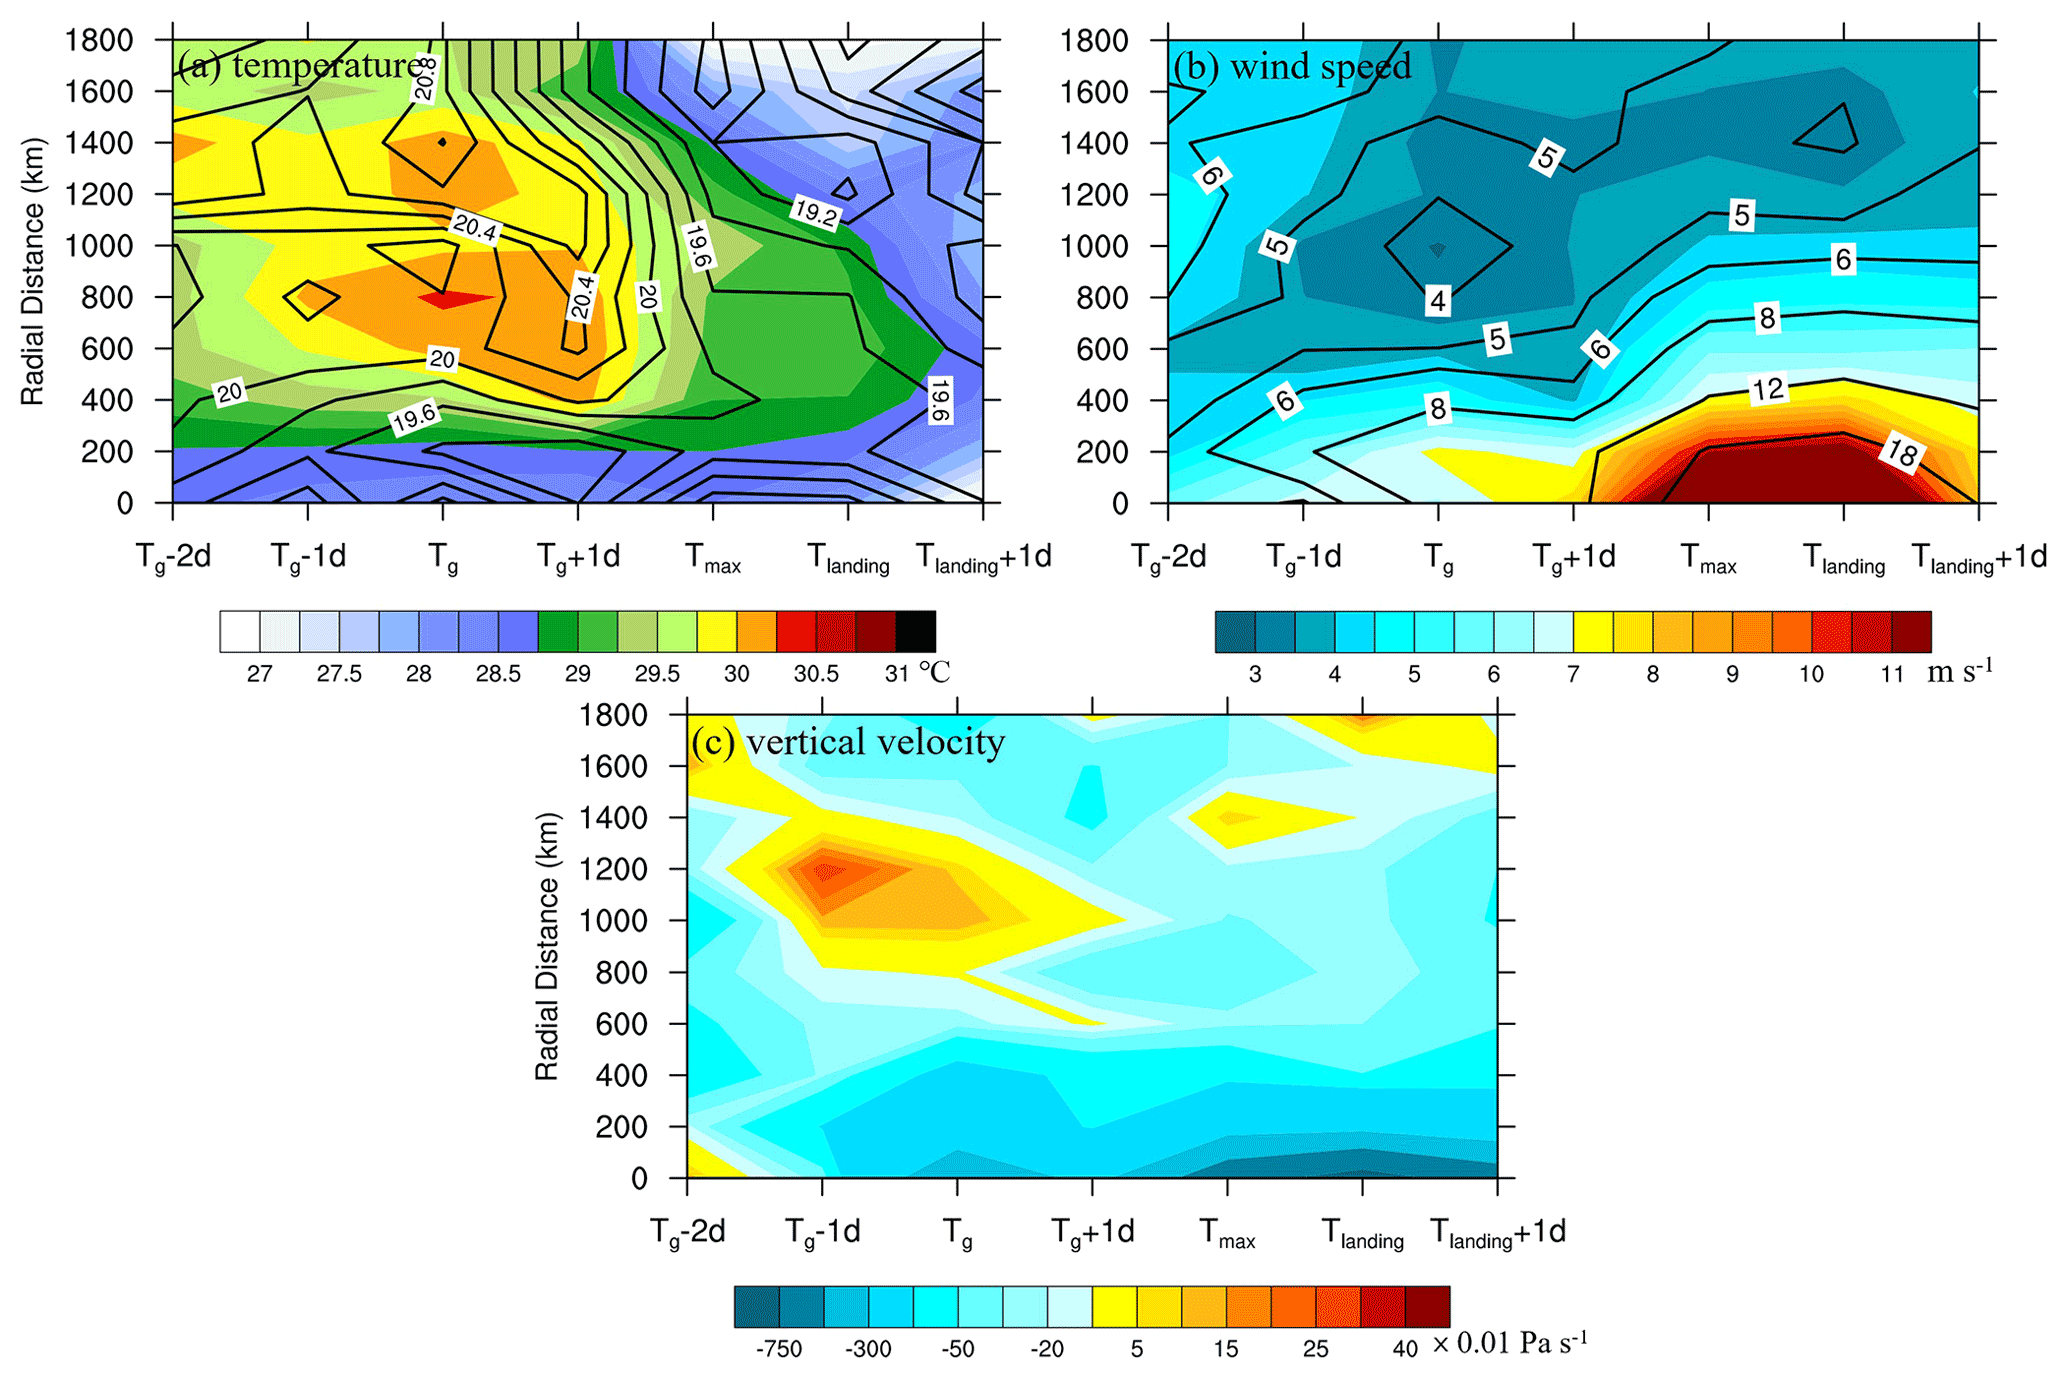
Figure 3The (a) 10 m (shaded) and 850 hPa (contour lines) air temperature (in ∘), (b) 10 m (shaded) and 850 hPa (contour lines) wind speed (in m s−1), and (c) 500 hPa vertical wind velocity (0.01 Pa s−1; positive values for downward air motions and vice versa) at daytime (14:00 LST) based on the MERRA-2 reanalysis at different radial distances and typhoon developmental stages averaged over the large ensemble of typhoons for the 2014–2018 period.
Along with the westward advance of the typhoons, the weather begins to deteriorate and surface ozone concentrations drop after the Tg+1 d stage. Cloudy conditions and convective activities replace the previous fine, hot weather. The air temperature drops significantly, and the wind speed increases steadily from Tmax to Tlanding+1 d, reducing the accumulation of surface ozone (Figs. 3, 4). As the typhoons approach southern China, gales (wind speed >10 m s−1) appear and bring in ozone-poor marine air masses. The upward vertical motions intensify over land and give rise to cloud formation and precipitation, which further reduce ozone concentrations.
The above analysis presents the physical linkages between typhoons making landfall, meteorological conditions and surface ozone variation. The overall meteorological conditions associated with different typhoon developmental stages alter the production, accumulation, transport and dispersion of ozone, leading to different influences, from enhancing to cleansing ozone pollution, during different stages of development. Practically, these results regarding the spatio-temporal variation in ozone when a typhoon is approaching raise challenging demands with respect to the observation and numerical forecasting of typhoon development. The necessary information about the timing and location of typhoon genesis as well as pre-typhoon conditions is only available from reliable numerical forecasting. Therefore, to capture the evolution of ozone over southern China during typhoon landfall, chemical aspects of models are required to describe the reactions between atmospheric components but meteorological conditions in models should also be improved in order to forecast the developmental stages of typhoons. Note that the analysis in this section is mainly related to typhoon influences on ozone production and loss within the ABL. However, several studies have suggested that typhoon-induced STEs can bring ozone-rich air masses from the lower stratosphere and, thus, enhance surface ozone. Therefore, in the next section, variations in the vertical ozone profiles are analysed to assess typhoon influences on tropospheric ozone using temporally dense vertical observations.
It is reported that typhoons may enhance or reduce tropospheric or surface ozone concentrations (e.g. Jiang et al., 2015; Das et al., 2016; Li et al., 2020), which is probably related to the developmental stages and intensity changes of typhoons. Therefore, dense vertical ozone observations are required given the rapid evolution in the intensity and location of these systems. Using airborne observations of the atmospheric composition within the framework of the IAGOS programme, Roux et al. (2020) analysed the ozone profiles collected at Taoyuan International Airport (25.076∘ N, 121.224∘ E) in Taiwan (TW, Fig. 1) during the 2016 typhoon season. They found elevated ozone in the middle and upper troposphere and tracked it back to a stratospheric origin. In this study, dense-temporal-resolution ozone vertical profiles measured during taking-off and landing at Taoyuan airport were collected and processed according to the developmental stages of the typhoon ensemble. A total of 234 ozone profiles covering each developmental stage guarantee that the evolutionary variation in the ozone profiles in response to typhoon development can be well captured.
The averaged vertical ozone profiles at each typhoon developmental stage are shown in Fig. 5a. At Tg−2 d, ozone concentrations range between 30 and 45 ppbv below 4 km altitude and increase slightly to between 45 and 60 ppbv in the middle to upper troposphere. Starting from the Tg−1 d stage, ozone concentrations in all layers increase with different magnitudes. Vertically, two separated regions with high ozone abundances appear: one in the middle ABL and the other in the middle to upper troposphere. The high ozone abundances in the troposphere mainly have two sources (Zhan et al., 2020): active ozone photochemical reactions at daytime in the boundary layer and downward intrusions of ozone-rich air from upper levels. The dense airborne observations show that ozone enhancement below 2 km altitude is only significant in the pre-typhoon and initial stages (Tg−1 d and Tg), suggesting the dependence of photochemical reactions on meteorological conditions controlled by typhoons. Simultaneous measurements of temperature and winds during flights (Fig. 6a, b) show that a peak positive temperature anomaly of 0.3∘ is located at 1.5 km altitude during Tg−1 d and Tg compared with that during the Tg−2 d stage, which is accompanied by a weak wind zone (<6 m s−1) that promotes ozone production and accumulation in the boundary layer. Although the warming continues in the low troposphere due to the approaching warm core of typhoons, wind flows intensify rapidly in the ABL and exceed 10 m s−1, effectively transporting clean air masses and leading to lower ozone concentrations after the Tg+1 d stage. In the middle to upper troposphere, ozone is enhanced; thus, a region of high ozone concentrations (75–80 ppbv) appears at an altitude of 12 km in the Tmax stage. As shown in Fig. 6c, the overall vertical air flows shift from weak subsidence to intensifying upward motions that perturb the structure of tropopause. The decreasing tropopause might facilitate stratosphere-to-troposphere exchange and provide chances for ozone-rich air in the lower stratosphere to intrude into the troposphere. This may explain the asynchronous evolution of ozone in the boundary layer and the middle to upper troposphere.
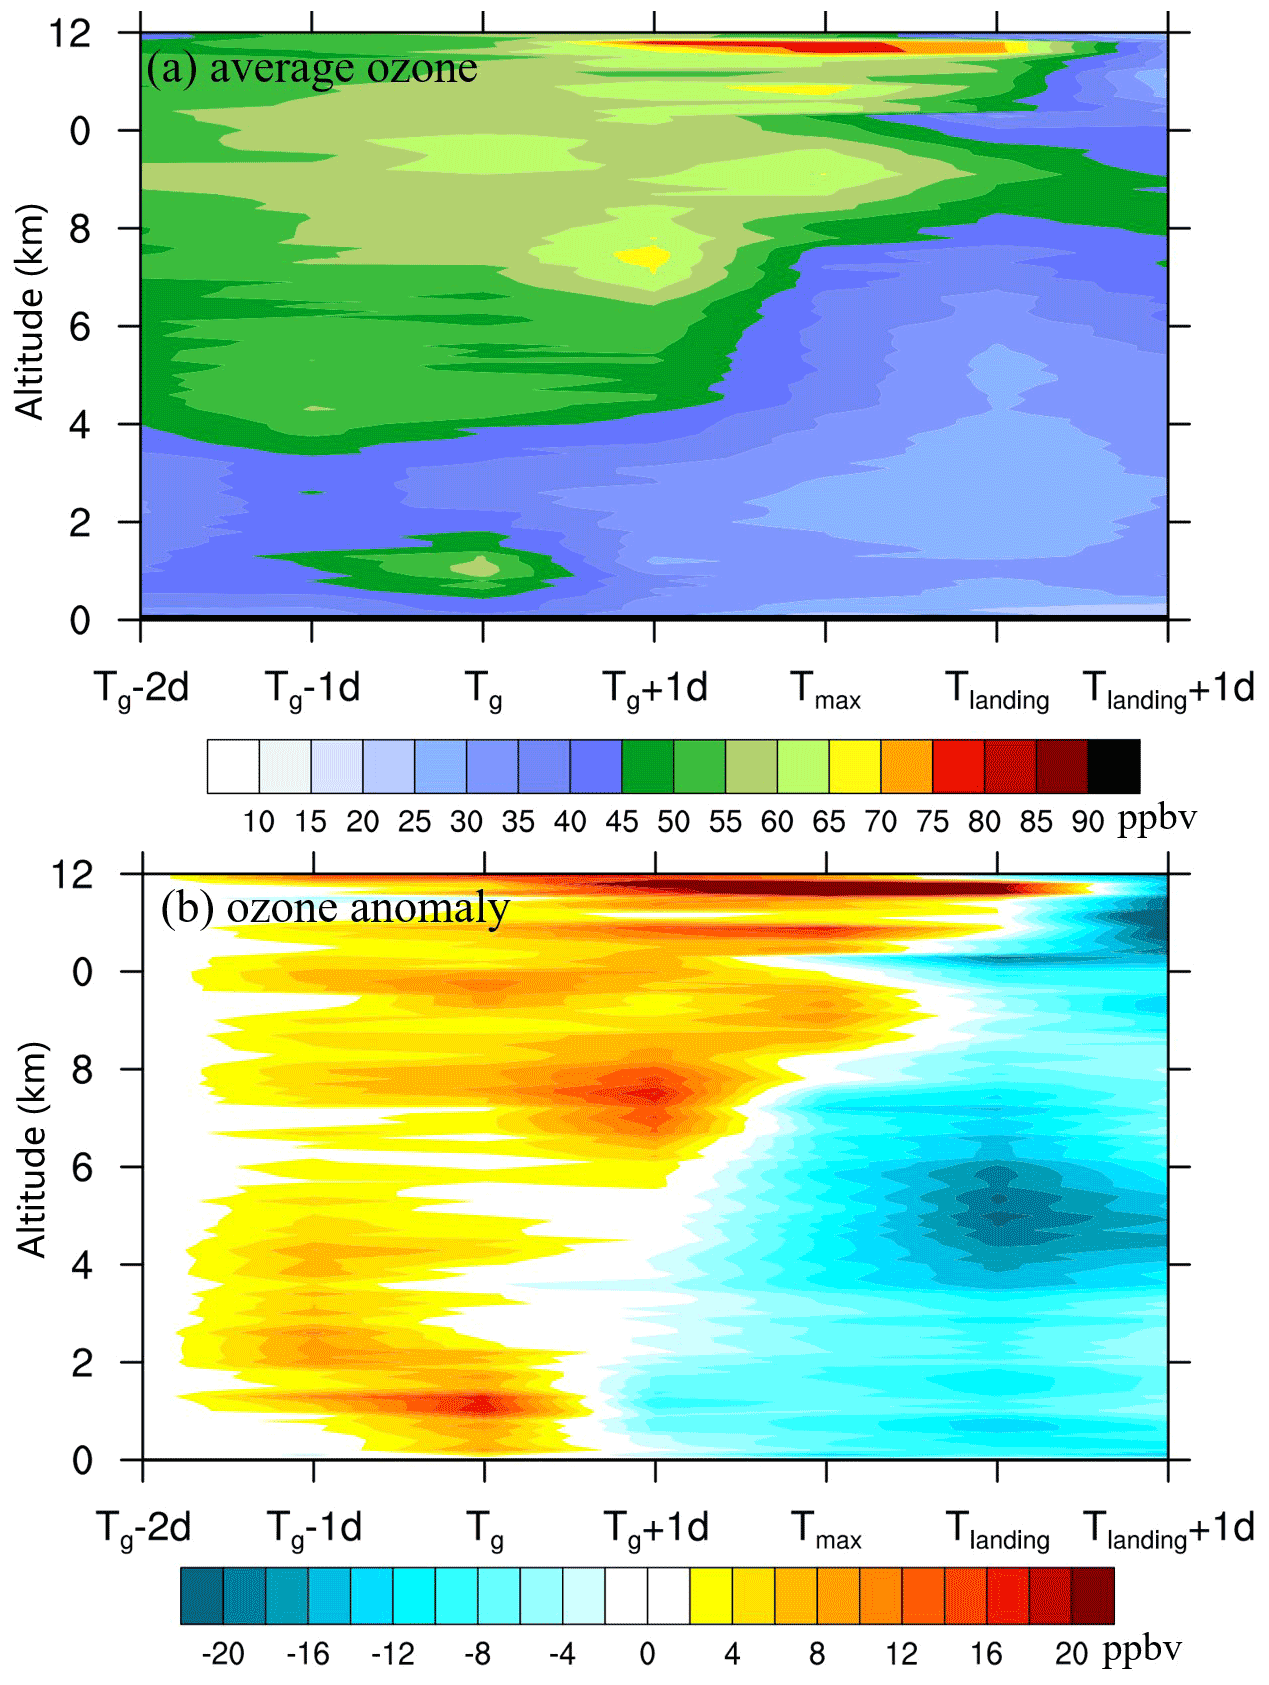
Figure 5(a) Vertical ozone concentrations (in ppbv) at each typhoon developmental stage averaged over the typhoon ensemble for 2014–2018 in Taiwan. (b) Anomalies in the vertical ozone concentrations relative to the Tg−2 d stage for the subsequent typhoon developmental stages. The temporally dense ozone profiles are available from airborne observations of the atmospheric composition collected at Taoyuan International Airport in Taiwan within the framework of the IAGOS programme.
Using the ozone concentrations at Tg−2 d as a reference, a tilted structure of ozone anomalies is obvious (Fig. 5b) due to the asynchronous evolution at different heights. Quantitatively, the maximum magnitude of ozone variations is 10–12 ppbv at 1–1.5 km altitude, resulting in a 25 % positive ozone anomaly during the Tg stage in the boundary layer. These results are consistent with Zhan et al. (2020), who suggested that ozone is mainly generated inside the boundary layer (∼ 1 km) instead of at the surface. In the middle to upper troposphere, positive ozone anomalies persist for a long time within a deep layer (4–12 km). The positive ozone anomalies reach 10 ppbv at 7–8 km altitude during the Tg+1 d stage and 30 ppbv near 12 km altitude during the Tmax stage. However, along with typhoon development, negative ozone anomalies form and stretch upward from the Tg+1 d stage, which is probably a compromise between the upward transport of clean marine air masses and the downward transport of ozone-rich air from upper levels. Hence, the largest negative differences of 14–18 ppbv at around 5 km altitude and of 20–25 ppbv around 11 km altitude are found in the Tlanding stage and the Tlanding+1 d stage respectively relative to ozone concentrations in the Tg−2 d stage.
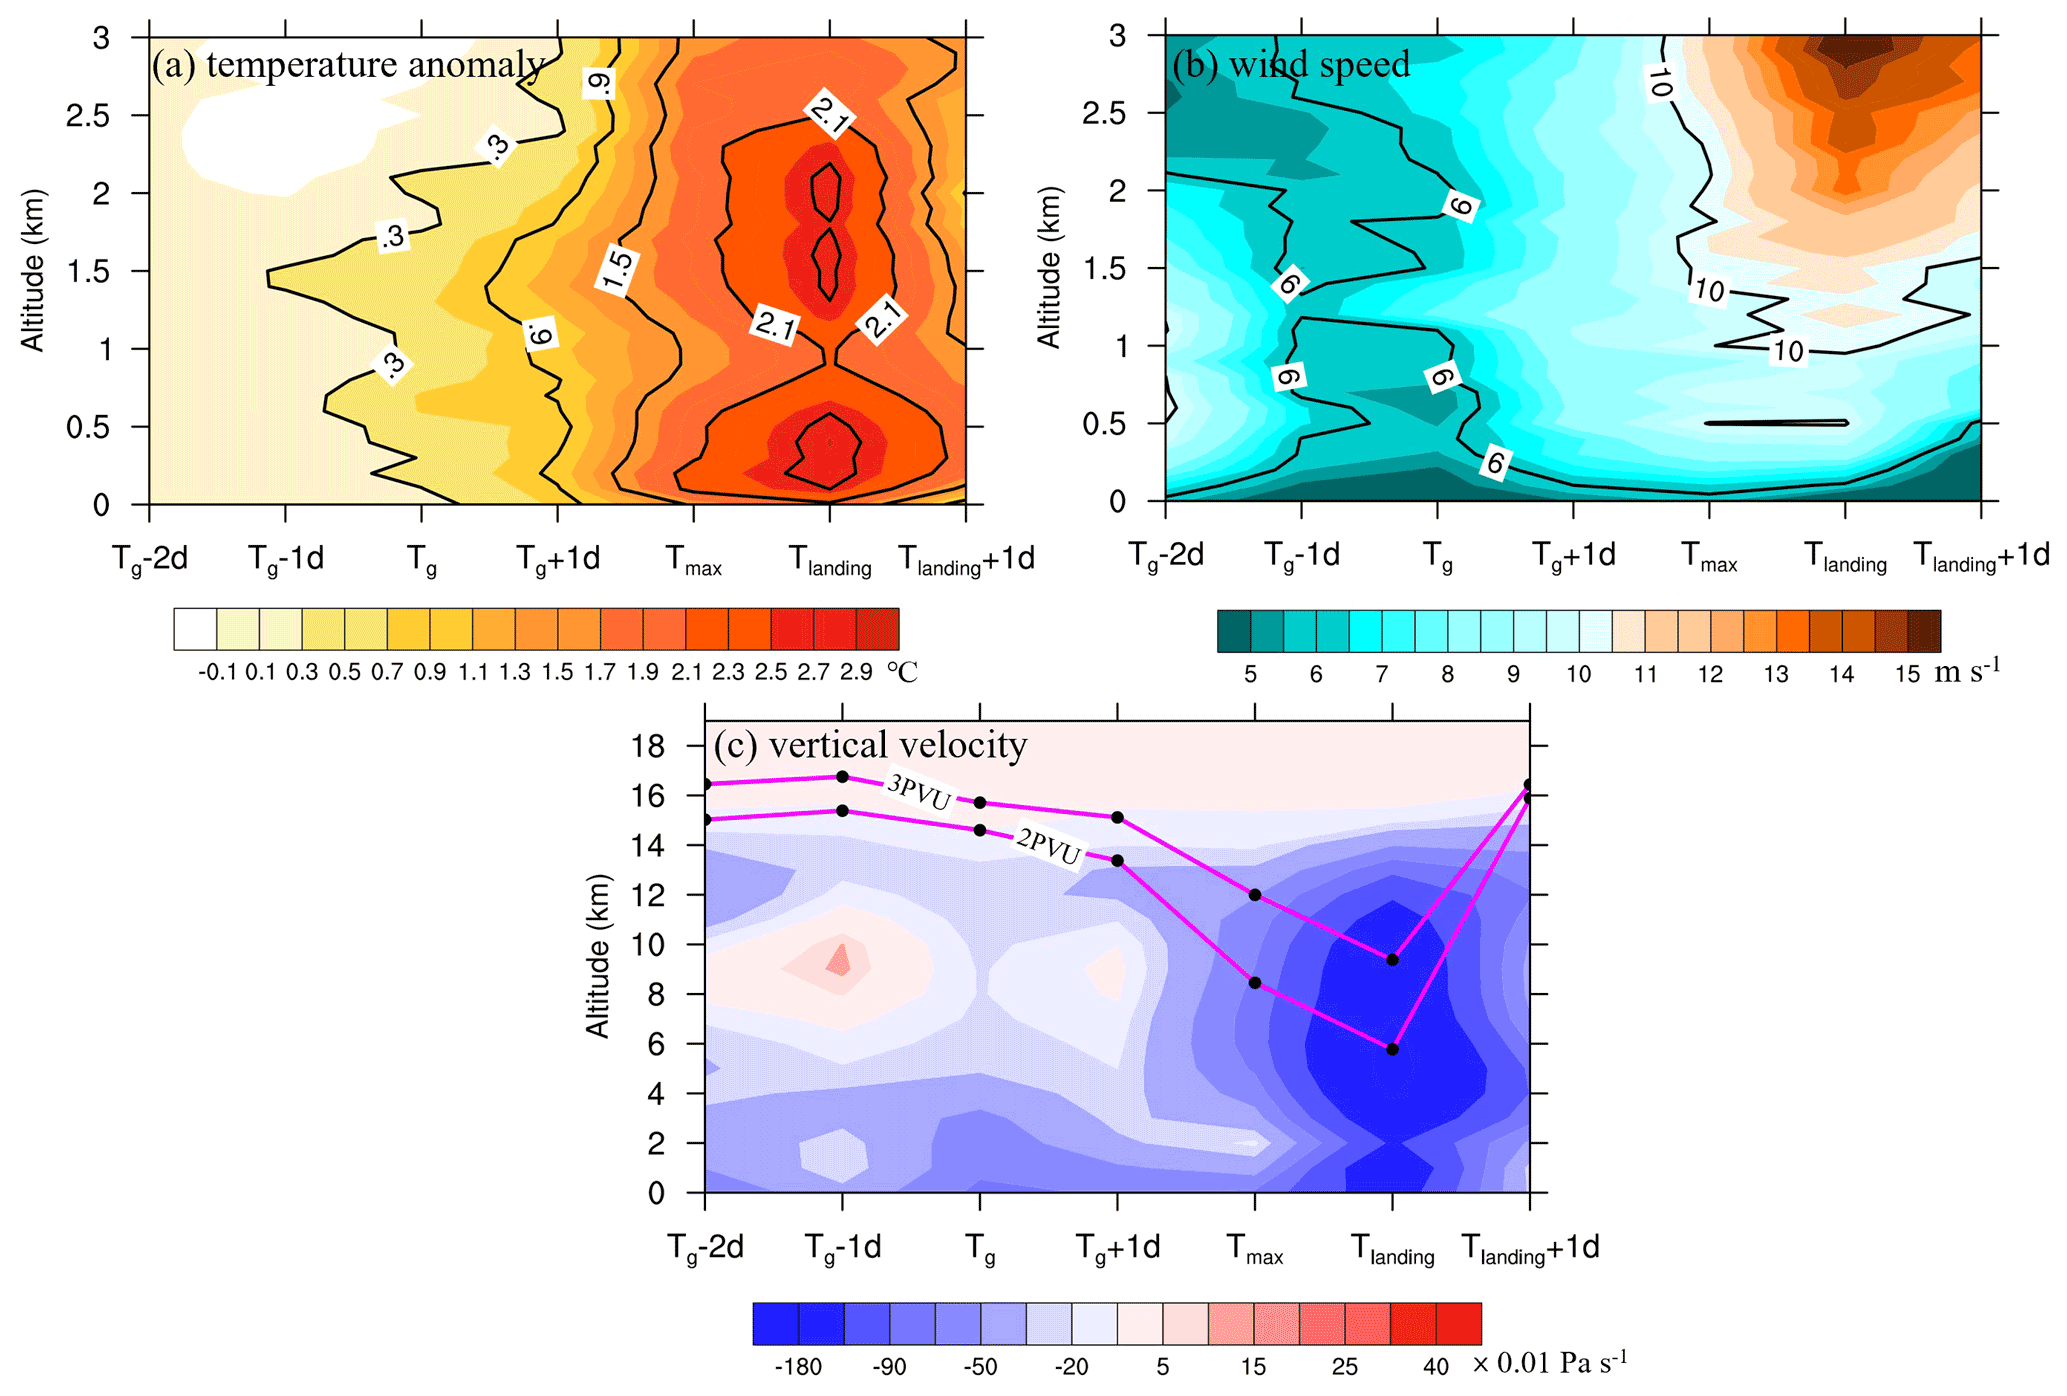
Figure 6(a) Temperature anomalies relative to Tg−2 d (in ∘) and (b) wind speed at each typhoon developmental stage within the boundary layer using the simultaneous flight observations at Taoyuan International Airport in Taiwan. (c) Vertical velocity (shaded; 0.01 Pa s−1) and the average height of 2 PVU (potential vorticity units, 1 PVU = 10−6 m2 s−1 K kg−1) and 3 PVU regions. The data are averaged over the large ensemble of typhoons for the 2014–2018 period.
The above analysis is based on the observational mean of eight typhoons that occurred between 2014 and 2018, suggesting that tropospheric ozone concentrations are reduced by clean marine air masses caused by strong uplift from typhoons making landfall. Another question is how frequently the ozone-rich air masses from the upper levels can sink down to the lower troposphere and even enhance surface ozone during the passing of typhoons. As reported in case studies by Das et al. (2016), the typhoon-induced downward propagation of air masses can bring high ozone concentrations from the upper to the lower troposphere. Considering that such downward transport of ozone-rich air masses could easily be smoothed by averaging all samples (e.g. Fig. 5), we re-examine these temporally dense ozone observations by counting the number of ozone concentrations (every 10 ppbv) in each vertical layer (with a 100 m spacing) at different typhoon developmental stages (Fig. 7). As mentioned above, a combination of high temperature and weak winds in the boundary layer promotes active ozone photochemical production and accumulation during the Tg−1 d and Tg stages. High ozone concentrations of up to 130–160 ppbv below 2 km altitude are observed (black arrows in Fig. 7b and c). After the Tg+1 d stage, high-ozone episodes in the boundary layer cease due to less favourable weather; however, high-ozone events are more frequently observed in the upper troposphere. Using 80 ppbv as a threshold for ozone with stratospheric origin, based on the averaged ozone concentrations in Fig. 5a, we find that the intrusions of stratospheric ozone-rich air largely appear above 4 km altitude (red arrows in Fig. 7d, e and f). Despite some mixing processes with ambient air, the stratospheric air masses can also sink down to the lower boundary layer (below 2 km altitude). As shown by the black circles in Fig. 7d–f, the incidence of ozone concentrations over 60 ppbv rises during the Tmax stage compared with the Tg+1 d and Tlanding stages, which evidently confirms the contribution of external stratospheric ozone to lower-troposphere ozone. With a quantitative overview of vertical ozone variation during the eight typhoons, we find that five of them cause stratospheric intrusions, and the ozone-rich stratospheric air masses sink down to the ABL during three of them. Although ozone concentrations are reduced in the entire tropospheric column vertically when typhoons are making landfall, surface ozone can be enhanced by the downward propagation of stratospheric ozone-rich air.
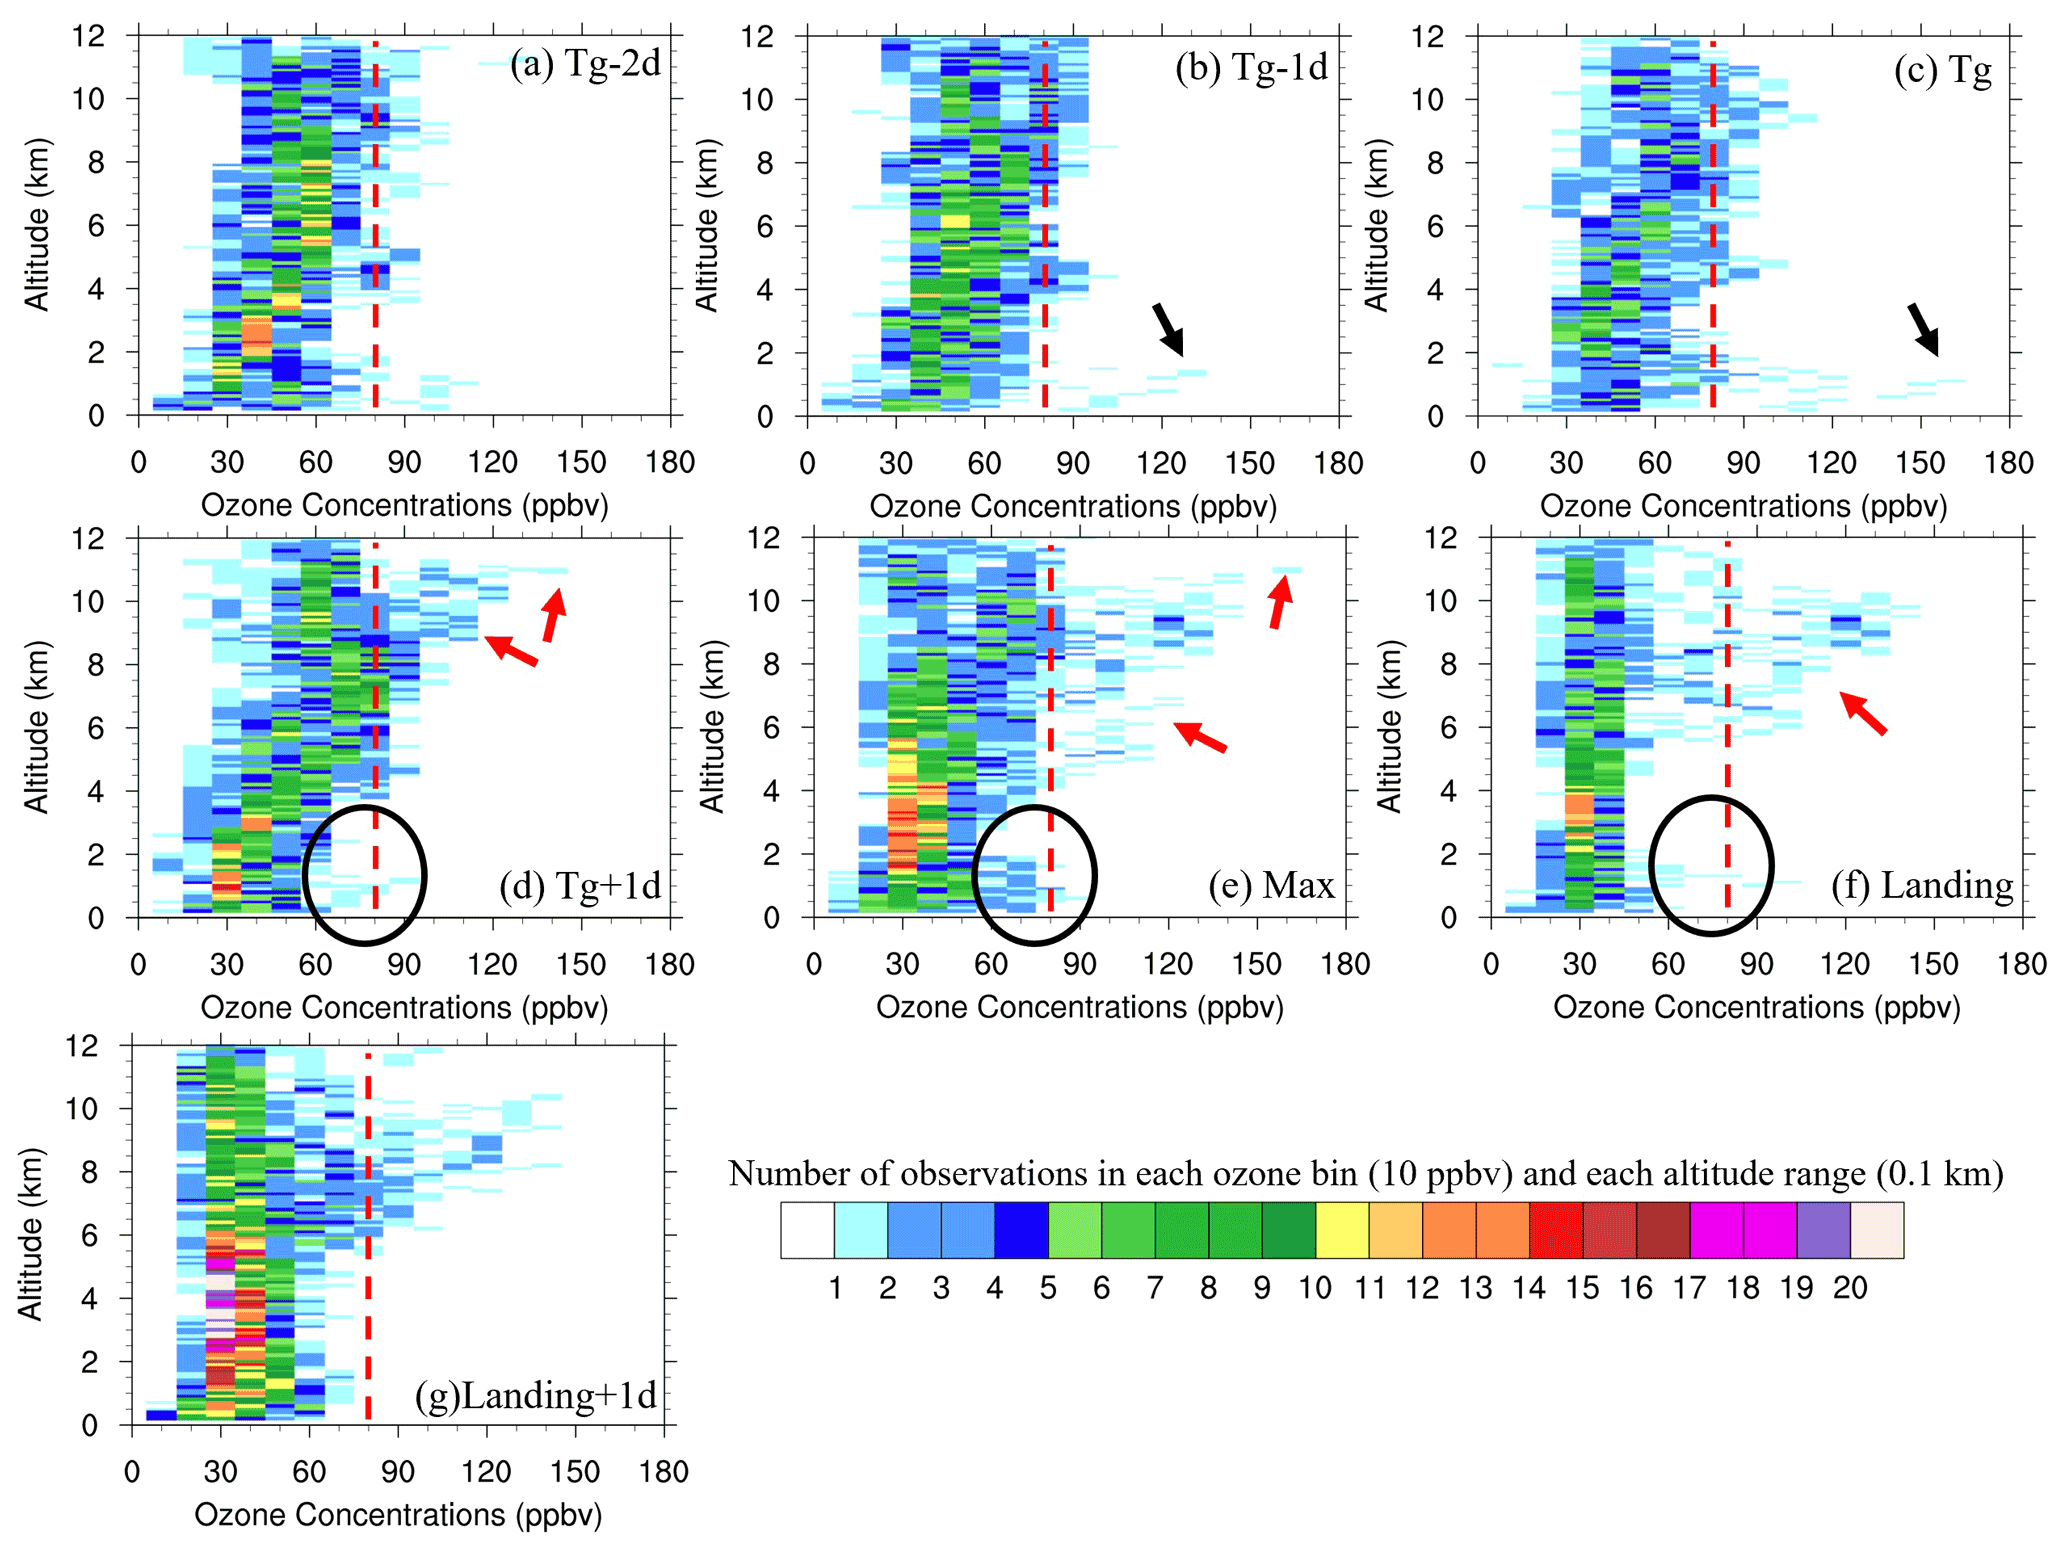
Figure 7Number of ozone concentrations (every 10 ppbv) in each vertical layer (with a 100 m spacing) at different developmental stages of typhoons. The red dashed lines of 80 ppbv represent ozone-rich air masses with a stratosphere origin based on the averaged results from Fig. 5a.
In previous studies, the influences of typhoons on ozone in the ABL have been investigated over developed and highly populated regions in China, such as the PRD and YRD. Given the severity of ozone pollution during rapid urbanization and economic development in southern China, it is of importance to address and quantify the impacts of typhoons on ozone over larger domains that are frequently affected by these systems. In this study, we use an ensemble of 17 typhoons that made landfall between 2014 and 2018 (Fig. 1) in order to investigate the positive and negative influences of typhoons on tropospheric ozone over southern China. Both the proximity of typhoons and their developmental stages are taken into account to reveal the evolutionary response of tropospheric ozone to typhoons making landfall. We find that surface ozone is enhanced when typhoons are 400–1500 km away during the systems' initial stages (e.g. from 1 d before to 1 d after typhoon genesis). On average, the positive ozone anomalies reach 10–20 ppbv during the daytime (14:00 LST) and 9 ppbv at night-time (above the background ozone level). Surface ozone concentrations at radial distances of 1100–1300 km are most significantly enhanced during the initial stages of typhoons. As typhoons move closer to southern China from the west, their influence changes from enhancing to reducing ozone. Typhoons then reach their maximum intensity, which decreases once they make landfall, and surface ozone concentrations are reduced, with negative ozone anomalies of −12 % to −17 % (6 to 9 ppbv) relative to the background ozone level. The linkages between typhoons, meteorological conditions and ozone are investigated. A combination of high air temperatures, weak winds in the ABL and dominating downward motions promotes the photochemical production and accumulation of ozone over the outskirts of typhoons during their initial stages. When typhoons make landfall, the deteriorating weather conditions, decreasing temperatures and wind gales reduce the production and accumulation of surface ozone. Ozone-poor marine air masses are transported inland. In addition, the intensified upward vertical motion gives rise to cloud formation and precipitation as well as further hindering ozone formation and accumulation.
Besides the processes in the ABL that are influenced by typhoons, we also investigate variations in the tropospheric ozone profiles during the different developmental stages of typhoons making landfall. In particular, we examine how the typhoon-induced stratospheric intrusions alter lower-troposphere and surface ozone. Based on the temporally dense ozone vertical observations collected in Taiwan during eight typhoons, we find two regions with cores of high ozone abundance that are located in the ABL and the middle to upper troposphere respectively. In the ABL, during the initial stages of typhoons, ozone below 2 km altitude is generally enhanced because of the warming air and low wind speed. Ozone concentrations then decrease continuously when the wind that transports the clean air masses rapidly intensifies. In the middle to upper troposphere, ozone enhancement persists over a long period and generates a region with high ozone concentrations (75–80 ppbv at 12 km altitude). The tropopause is perturbed due to the decreasing tropopause height as typhoons develop, which might cause stratospheric intrusions that bring ozone-rich air down from the lower stratosphere. The asynchronous evolution of ozone in the ABL and middle to upper troposphere leads to a tilted structure of vertical ozone anomalies during typhoon evolution (Fig. 5). On average, positive ozone anomalies reach a maximum of ∼ 10–12 ppbv at 1–1.5 km altitude during the initial stages of typhoons. In the middle to upper troposphere, the positive ozone anomaly is 10 ppbv at 7–8 km altitude shortly after typhoon genesis, and it reaches 30 ppbv near 12 km altitude when typhoons reach their maximum intensity. When typhoons make landfall, negative ozone anomalies stretch upward with a maximum ozone reduction of 14–18 ppbv at 5 km altitude and 20–25 ppbv at 11 km altitude relative to the pre-typhoon conditions.
We further assess the impacts of typhoon-induced disturbances in the upper troposphere that bring ozone-rich air downward during different developmental stages (Fig. 7). During the initial typhoon stages, high ozone (130–160 ppbv) is observed below 2 km altitude, which can be attributed to active ozone photochemical production and accumulation processes. After typhoon genesis, ozone-rich air from the stratosphere is more frequently observed above 4 km altitude and even propagates downward to the lower boundary layer (below 2 km altitude) despite some mixing processes with ambient air. For the eight typhoons with ozone profile observations covering the entire typhoon lifespan, we find that five of them present ozone-rich air with a stratospheric origin, and the intrusions can penetrate down to the ABL in three cases. This suggests that surface ozone is possibly enhanced by the downward propagation of stratospheric ozone-rich air when typhoons reach their maximum intensity, although the tropospheric column ozone is usually reduced after typhoons make landfall.
Using a large ensemble of typhoons and temporally dense ozone observations, this study characterizes spatio-temporal variations in tropospheric ozone under the influence of typhoons over southern China – a region with frequent typhoon activity. We investigate the positive and negative influences of typhoons on surface ozone and tropospheric ozone vertically. The impact of typhoon-induced stratospheric intrusions is quantitatively examined to establish if surface ozone episodes result from upper-level ozone sources. However, further studies are needed to better assess the contributions of different chemical and physical processes to ozone concentrations in the ABL and to assess the role of STEs in increasing tropospheric and surface ozone during typhoons. Intensive observations of vertical ozone profiles are in high demand over different typhoon regimes; hence, ozonesonde measurements in Fujian Province have been initiated to complement airborne ozone observations in Taiwan, both of which experience frequent typhoon landfall. Numerical simulations of the meteorological and chemical evolution during typhoons, for example, using the Weather Research and Forecasting (WRF) model coupled with Chemistry (WRF-Chem), provide a way to analyse ozone variation at a fine scale. However, both the meteorological and chemical simulations need to be improved so that the evolutionary features of ozone during typhoon landfall can be captured. Furthermore, previous studies have stressed that the lightning associated with the intensive convection of typhoons can produce nitrogen oxides (LNOx) and, hence, influence ozone chemical reactions (Kaynak et al., 2008; Roux et al., 2020; Das et al., 2016). In addition to lightning occurrences and LNOx, deep convection from typhoons can also transport ozone by dynamically dragging stratospheric ozone-rich air down. Pan et al. (2014) reported that ozone-rich stratospheric air wraps around both the leading and trailing edges of mesoscale convective systems and descends to lower levels. Hence, a better representation of the LNOx influence on chemical reactions and meteorology concerning dynamical transport should be included in typhoon simulations. Currently, we are incorporating data assimilation (DA) to improve WRF-Chem simulations. We are also developing a three-dimensional variational DA scheme to assimilate lightning observations over the data-sparse oceans in order to update meteorological conditions (Chen et al., 2020) and LNOx presentations (Allen et al., 2010; Pickering et al., 2016; Kang et al., 2019).
The track data of tropical cyclones for China used in the present study can be obtained from http://tcdata.typhoon.org.cn/zjljsjj_sm.html (Ying et al., 2014). The surface air pollutant observations from the China National Environmental Monitoring Centre can be obtained from http://106.37.208.233:20035/. The airborne measurements of atmospheric chemical compounds provided by the European Research Infrastructures programme IAGOS can be downloaded from https://www.iagos.org (Petzold et al., 2015). The MERRA-2 reanalysis meteorological data can be downloaded from https://gmao.gsfc.nasa.gov/reanalysis/MERRA-2 (Gelaro et al., 2017).
ZC and JL designed the study and performed the research. ZC collected the observations and analysed the data. ZC and JL wrote and revised the paper with input from XC, MY and HW. All authors commented on drafts of the paper.
The contact author has declared that neither they nor their co-authors have any competing interests.
Publisher’s note: Copernicus Publications remains neutral with regard to jurisdictional claims in published maps and institutional affiliations.
The computing resources used in this study were provided by Fujian Normal University High Performance Computation Center (FNU-HPCC). We also acknowledge the free use of flight-based atmospheric chemical measurements from IAGOS. IAGOS is funded by the European Union's IAGOS-DS and IAGOS-ERI projects. The IAGOS database is created with support from the European Commission, national agencies in Germany (BMBF), France (MESR), and the UK (NERC), and the IAGOS member institutions (https://www.iagos.org/organisation/members/, last access: 25 October 2021). The participating airlines (Lufthansa, Air France, Austrian, China Airlines, Iberia, Cathay Pacific, Air Namibia and Sabena) have supported IAGOS by carrying the measurement equipment free of charge since 1994. We thank the anonymous reviewers for constructive comments and suggestions.
This work was supported by the National Natural Science Foundation of China (grant no. 4210050364).
This paper was edited by Geraint Vaughan and reviewed by two anonymous referees.
Allen, D., Pickering, K., Duncan, B., and Damon, M.: Impact of lightning NO emissions on North American photochemistry as determined using the Global Modeling Initiative (GMI) model, J. Geophys. Res., 115, D22301, https://doi.org/10.1029/2010JD014062, 2010.
Chen, Z., Sun, J., Qie, X., Zhang, Y., Ying, Z., Xiao, X., and Cao, D.: A method to update model kinematic states by assimilating satellite-observed total lightning data to improve convective analysis and forecasting, J. Geophys. Res., 125, JD033330, https://doi.org/10.1029/2020JD033330, 2020.
Chow, E. C., Li, R. C., and Zhou, W.: Influence of tropical cyclones on Hong Kong air quality, Adv. Atmos. Sci., 35, 1177–1188, https://doi.org/10.1007/s00376-018-7225-4, 2018.
Das, S. S., Ratnam, M. V., Uma, K. N., Subrahmanyam, K. V., Girach, I. A., Patra, A. K., Aneesh, S., Suneeth, K. V., Kumar, K. K., Kesarkar, A. P., Sijikumar, S., and Ramkumar, G.: Influence of tropical cyclones on tropospheric ozone: possible implications, Atmos. Chem. Phys., 16, 4837–4847, https://doi.org/10.5194/acp-16-4837-2016, 2016.
Gao, D., Xie, M., Chen, X., Wang, T., Liu, J., Xu, Q., Mu, X., Chen, F., Li, S., Zhuang, B., Li, M., Zhao, M., and Ren, Y.: Systematic classification of circulation patterns and integrated analysis of their effects on different ozone pollution levels in the Yangtze River Delta Region, China, Atmos. Environ., 242, 117760, https://doi.org/10.1016/j.atmosenv.2020.117760, 2020.
Gelaro, R., McCarty, W., Suarez, M. J., Todling, R., Molod, A., Takacs, L., Randles, C. A., Darmenov, A., Bosilovich, M. G., Reichle, R., Wargan, K., Coy, L., Cullather, R., Draper, C., Akella, S., Buchard, V., Conaty, A., da Silva, A. M., Gu, W., Kim, G. K., Koster, R., Lucchesi, R., Merkova, D., Nielsen, J. E., Partyka, G., Pawson, S., Putman, W., Rienecker, M., Schubert, S. D., Sienkiewicz, M., and Zhao, B.: The Modern-Era Retrospective Analysis for Research and Applications, Version 2 (MERRA-2), J. Climate, 30, 5419–5454, https://doi.org/10.1175/jcli-d-16-0758.1, 2017 (data available at: https://gmao.gsfc.nasa.gov/reanalysis/MERRA-2, last access: 22 November 2021).
Han, H., Liu, J., Shu, L., Wang, T., and Yuan, H.: Local and synoptic meteorological influences on daily variability in summertime surface ozone in eastern China, Atmos. Chem. Phys., 20, 203–222, https://doi.org/10.5194/acp-20-203-2020, 2020.
Huang, J. P., Fung, J. C. H., Lau, A. K. H., and Qin, Y.: Numerical simulation and process analysis of typhoon-related ozone episodes in Hong Kong, J. Geophys. Res., 110, D05301, https://doi.org/10.1029/2004JD004914, 2005.
Huang, J. P., Fung, C. H., and Lau, K. H.: Integrated processes analysis and systematic meteorological classification of ozone episodes in Hong Kong, J. Geophys. Res., 111, D20309, https://doi.org/10.1029/2005JD007012, 2006.
Hung, C.-H. and Lo, K.-C.: Relationship between ambient ozone concentration changes in southwestern Taiwan and invasion tracks of tropical typhoons, Adv. Meteorol., 2015, 402976, https://doi.org/10.1155/2015/402976, 2015.
Jiang, F., Wang, T., Wang, T., Xie, M., and Zhao, H.: Numerical modeling of a continuous photochemical pollution episodein Hong Kong using WRF–chem, Atmos. Environ., 42, 8717–8727, https://doi.org/10.1016/j.atmosenv.2008.08.034, 2008.
Jiang, Y. C., Zhao, T. L., Liu, J., Xu, X. D., Tan, C. H., Cheng, X. H., Bi, X. Y., Gan, J. B., You, J. F., and Zhao, S. Z.: Why does surface ozone peak before a typhoon landing in southeast China?, Atmos. Chem. Phys., 15, 13331–13338, https://doi.org/10.5194/acp-15-13331-2015, 2015.
Kang, D., Pickering, K. E., Allen, D. J., Foley, K. M., Wong, D. C., Mathur, R., and Roselle, S. J.: Simulating lightning NO production in CMAQv5.2: evolution of scientific updates, Geosci. Model Dev., 12, 3071–3083, https://doi.org/10.5194/gmd-12-3071-2019, 2019.
Kaynak, B., Hu, Y., Martin, R. V., Russell, A. G., Choi, Y., and Wang, Y.: The effect of lightning NOx production on surface ozone in the continental United States, Atmos. Chem. Phys., 8, 5151–5159, https://doi.org/10.5194/acp-8-5151-2008, 2008.
Lam, K. S., Wang, T. J., Wu, C. L., and Li, Y. S.: Study on an ozone episode in hot season in Hong Kong and transboundary air pollution over Pearl River Delta region of China, Atmos. Environ., 39, 1967–1977, https://doi.org/10.1016/j.atmosenv.2004.11.023, 2005.
Li, D., Vogel, B., Müller, R., Bian, J., Günther, G., Li, Q., Zhang, J., Bai, Z., Vömel, H., and Riese, M.: High tropospheric ozone in Lhasa within the Asian summer monsoon anticyclone in 2013: influence of convective transport and stratospheric intrusions, Atmos. Chem. Phys., 18, 17979–17994, https://doi.org/10.5194/acp-18-17979-2018, 2018.
Li, D., Baerbel, V., Rolf, M., Bian, J., Günther, G., and Riese, M.: Tropical cyclones reduce ozone in the tropopause region over the western Pacific: An analysis of 18 years ozonesonde profiles, Earth's Future, 9, e2020EF001635, https://doi.org/10.1029/2020EF001635, 2020.
Li, K., Jacob, D. J., Liao, H., Shen, L., Zhang, Q., and Bates, K. H.: Anthropogenic drivers of 2013–2017 trends in summer surface ozone in China, P. Natl. Acad. Sci. USA, 116, 422–427, https://doi.org/10.1073/pnas.1812168116, 2019.
Lu, X., Hong, J., Zhang, L., Cooper, O. R., Schultz, M. G., Xu, X., Wang, T., Gao, M., Zhao, Y., and Zhang, Y.: Severe Surface Ozone Pollution in China: A Global Perspective, Environ. Sci. Tech. Let., 5, 487–494, https://doi.org/10.1021/acs.estlett.8b00366, 2018 (data available at: http://106.37.208.233:20035/, last access: 22 November 2021).
Midya, S. K., Dey, S. S., and Chakraborty, B.: Variation of the total ozone column during tropical cyclones over the Bay of Bengal and the Arabian Sea, Meteorol. Atmos. Phys., 117, 63–71, https://doi.org/10.1007/S00703-011-0169-1, 2012.
Pan, L. L., Homeyer, C. R., Honomochi, S., Ridley, B. A., Weisman, M., Barth, M. C., Hair, J. W., Fenn, M. A., Butler, C., Diskin, G. S., Crawford, J. H., Ryerson, T. B., Pollack, I., Peischl, J., and Huntrieser, H.: Thunderstorms enhance tropospheric ozone by wrapping and shedding stratospheric air, Geophys. Res. Lett., 41, 7785–7790, https://doi.org/10.1002/2014GL061921, 2014.
Petzold, A., Thouret, V., Gerbig, C., Zahn, A., Brenninkmeijer, C. A. M., Gallagher, M., Hermann, M., Pontaud, M., Ziereis, H., Boulanger, D., Marshall, J., Nédélec, P., Smit, H. G. J., Friess, U., Flaud, J.-M., Wahner, A., Cammas, J.-P., Volz-Thomas, A., and IAGOS TEAM: Global-scale atmosphere monitoring by in-service aircraft – current achievements and future prospects of the European Research Infrastructure IAGOS, Tellus B, 67, 1–24, https://doi.org/10.3402/tellusb.v67.28452, 2015 (data available at: https://www.iagos.org, last access: 25 October 2021).
Pickering, K. E., Bucsela, E., Allen, D., Ring, A., Holzworth, R., and Krotkov, N.: Estimates of lightning NOx production basedon OMI NO2 observations over the Gulf of Mexico, J. Geophys. Res., 121, 8668–8691, https://doi.org/10.1002/2015JD024179, 2016.
Roux, F., Clark, H., Wang, K.-Y., Rohs, S., Sauvage, B., and Nédélec, P.: The influence of typhoons on atmospheric composition deduced from IAGOS measurements over Taipei, Atmos. Chem. Phys., 20, 3945–3963, https://doi.org/10.5194/acp-20-3945-2020, 2020.
Shu, L., Xie, M., Wang, T., Gao, D., Chen, P., Han, Y., Li, S., Zhuang, B., and Li, M.: Integrated studies of a regional ozone pollution synthetically affected by subtropical high and typhoon system in the Yangtze River Delta region, China, Atmos. Chem. Phys., 16, 15801–15819, https://doi.org/10.5194/acp-16-15801-2016, 2016.
Thouret, V., Marenco, A., Logan, J. A., Nédélec, P., and Grouhel, C.: Comparisons of ozone measurements from the MOZAIC airborne program and the ozone sounding network at eight locations, J. Geophys. Res., 103, 25695–25720, https://doi.org/10.1029/98JD02243, 1998.
Ying, M., Zhang, W., Yu, H., Lu, X., Feng, J., Fan, Y., Zhu, Y., and Chen, D.: An overview of the China Meteorological Administration Tropical Cyclone Database, J. Atmos. Ocean. Technol., 31, 287–301, https://doi.org/10.1175/JTECH-D-12-00119.1, 2014 (data available at: http://tcdata.typhoon.org.cn/zjljsjj_sm.html, last access: 25 October 2021).
Zhan, C., Xie, M., Huang, C., Liu, J., Wang, T., Xu, M., Ma, C., Yu, J., Jiao, Y., Li, M., Li, S., Zhuang, B., Zhao, M., and Nie, D.: Ozone affected by a succession of four landfall typhoons in the Yangtze River Delta, China: major processes and health impacts, Atmos. Chem. Phys., 20, 13781–13799, https://doi.org/10.5194/acp-20-13781-2020, 2020.
Zhang, W., Leung, Y., and Chan, J. L. C.: The analysis of tropical cyclone tracks in the western North Pacific through data mining, Part I: Tropical Cyclone Recurvature, J. Appl. Meteorol. Clim., 52, 1394–1416, https://doi.org/10.1175/JAMC-D-12-045.1, 2013.
Zou, X. and Wu, Y.: On the relationship between Total Ozone Mapping Spectrometer (TOMS) ozone and hurricanes, J. Geophys. Res., 110, D06109, https://doi.org/10.1029/2004JD005019, 2005.
- Abstract
- Introduction
- Data and method
- Surface ozone concentrations affected by typhoons making landfall
- Vertical ozone distributions affected by typhoons making landfall
- Conclusions, discussions and suggestions
- Data availability
- Author contributions
- Competing interests
- Disclaimer
- Acknowledgements
- Financial support
- Review statement
- References