the Creative Commons Attribution 4.0 License.
the Creative Commons Attribution 4.0 License.
 | 19 Nov 2021
Midlatitude mixed-phase stratocumulus clouds and their interactions with aerosols: how ice processes affect microphysical, dynamic, and thermodynamic development in those clouds and interactions?
Seoung Soo Lee
Kyung-Ja Ha
Manguttathil Gopalakrishnan Manoj
Mohammad Kamruzzaman
Hyungjun Kim
Nobuyuki Utsumi
Youtong Zheng
Byung-Gon Kim
Chang Hoon Jung
Junshik Um
Jianping Guo
Kyoung Ock Choi
Go-Un Kim
Midlatitude mixed-phase stratocumulus clouds and their interactions with aerosols remain poorly understood. This study examines the roles of ice processes in those clouds and their interactions with aerosols using a large-eddy simulation (LES) framework. Cloud mass becomes much lower in the presence of ice processes and the Wegener–Bergeron–Findeisen (WBF) mechanism in the mixed-phase clouds compared to that in warm clouds. This is because while the WBF mechanism enhances the evaporation of droplets, the low concentration of aerosols acting as ice-nucleating particles (INPs) and cloud ice number concentration (CINC) prevent the efficient deposition of water vapor. Note that the INP concentration in this study is based on the observed spatiotemporal variability of aerosols. This results in the lower CINC compared to that with empirical dependence of the INP concentrations on temperature in a previous study. In the mixed-phase clouds, the increasing concentration of aerosols that act as cloud condensation nuclei (CCN) decreases cloud mass by increasing the evaporation of droplets through the WBF mechanism and decreasing the intensity of updrafts. In contrast to this, in the warm clouds, the absence of the WBF mechanism makes the increase in the evaporation of droplets inefficient, eventually enabling cloud mass to increase with the increasing concentration of aerosols acting as CCN. Here, the results show that when there is an increasing concentration of aerosols that act as INPs, the deposition of water vapor is more efficient than when there is the increasing concentration of aerosols acting as CCN, which in turn enables cloud mass to increase in the mixed-phase clouds.
- Article
(9281 KB) - Full-text XML
- Companion paper
-
Supplement
(191 KB) - BibTeX
- EndNote


Stratiform clouds such as the stratus and stratocumulus clouds play an important role in global hydrologic and energy circulations (Warren et al., 1986, 1988; Stephens and Greenwald, 1991; Hartmann et al., 1992; Hahn and Warren, 2007; Wood, 2012). Aerosol concentrations have increased significantly as a result of industrialization. Increasing aerosols are known to decrease droplet size and thus increase the albedo of stratiform clouds (Twomey, 1974, 1977). Increasing aerosols may also suppress precipitation and, hence, alter the mass and lifetime of those clouds (Albrecht, 1989; Guo et al., 2016). These aerosol effects strongly depend on how increasing aerosols affect entrainment at the tops of the planetary boundary layer (PBL) (Ackerman et al., 2004) and disrupt global hydrologic and energy circulations. However, these effects are highly uncertain and thus act to cause the highest uncertainty in the prediction of future climate (Ramaswamy et al., 2001; Forster et al., 2007). Most of the previous studies on stratiform clouds and their interactions with aerosols to reduce the uncertainty have dealt with warm stratiform clouds and have seldom considered ice-phase cloud particles (e.g., ice crystals) (Ramaswamy et al., 2001; Forster et al., 2007; Wood, 2012). In reality, especially during wintertime when the surface temperature approaches freezing, stratiform clouds frequently involve ice particles and associated processes such as deposition and freezing. Since particularly in midlatitudes stratiform clouds are generally way below the altitude of homogeneous freezing, in these clouds, liquid and ice particles usually co-exist.
The water-vapor equilibrium saturation (or saturation pressure) is lower for ice particles than for liquid particles. In mixed-phase clouds where liquid- and ice-phase hydrometeors coexist, when a given water-vapor pressure is higher than the equilibrium pressure for liquid particles, ice and liquid particles grow together via deposition and condensation, respectively, while competing for water vapor. When a given water-vapor pressure is lower than or equal to the equilibrium pressure for liquid particles, ice (liquid) particles can experience supersaturation (undersaturation or saturation). In this situation, liquid particles evaporate, while water vapor is deposited onto ice crystals. Water vapor in the air, which is depleted by the deposition onto ice crystals, is re-supplied by water vapor that is produced by the evaporation of droplets. The re-supplied water vapor in turn deposits onto ice crystals. In other words, due to differences in the water-vapor equilibrium saturation pressure between ice and liquid particles, ice particles eventually grow at the expense of liquid particles. This is the so-called Wegener–Bergeron–Findeisen (WBF) mechanism (Wegener, 1911; Bergeron, 1935; Findeisen, 1938).
The occurrence of the WBF mechanism depends on updrafts, humidity, associated supersaturation, and microphysical factors such as cloud-particle concentrations and sizes (Korolev, 2007). Also, it needs to be pointed out that when the WBF mechanism starts and how long it lasts depend on how a timescale for updrafts and associated supersaturation is compared to that for phase-transition processes as a part of microphysical processes (Pruppacher and Klett, 1978). Korolev (2007) have utilized a parcel-model concept to come up with conditions of updrafts and microphysical factors where the WBF mechanism is operative.
The evolution of cloud particles as well as their interactions with aerosols is strongly dependent on thermodynamic and dynamic conditions such as humidity, temperature, and updraft intensity (Pruppacher and Klett, 1978; Khain et al., 2008). Interactions between ice and liquid particles in mixed-phase clouds, which include the WBF mechanism, change thermodynamic and dynamic conditions where cloud particles grow. Impacts of these changes on the development of mixed-phase clouds and their interactions with aerosols have not been understood well.
Over the last decades, numerous studies have been performed to improve our understanding of mixed-phase clouds by focusing on clouds in the Arctic and over the Southern Ocean. It has been found that the prevalence of mixed-phase clouds over the Arctic enables them to have a substantial impact on radiative and hydrologic circulations (e.g., Shupe et al., 2001, 2005; Intrieri et al., 2002; Dong and Mace, 2003; Zuidema et al., 2005; Hu et al., 2010; Kanitz et al., 2011; Morrison et al., 2011; Huang et al., 2012). In addition, Rangno and Hobbs (2001), Lohmann (2002), and Borys et al. (2003) have proposed have not only cloud condensation nuclei (CCN) but also ice-nucleating particles (INPs) affect mixed-phase clouds by altering microphysical variables (e.g., number concentrations and sizes of cloud particles) and dynamic variables (e.g., updrafts). However, Lance et al. (2010) and Jackson et al. (2012) have indicated that these aerosol effects on mixed-phase clouds have not been clearly identified due to lack of data of meteorological and cloud conditions in which aerosols influence those clouds. Naud et al. (2014) and Bodas-Salcedo et al. (2016) have reported that climate models have not been able to represent mixed-phased clouds and their interactions with aerosols reasonably well, and this has been one important reason why climate models have produced large errors in simulating energy and hydrologic budgets and circulations. Young et al. (2017) have reported that the parametrization of ice-crystal nucleation can be a key reason for the misrepresentation of mixed-phase clouds in models.
This study aims to gain a better understanding of mixed-phase stratocumulus clouds and interactions between those clouds and aerosols. The better understanding enables us to gain a more general understanding of stratiform clouds and their interactions with aerosols, which better elucidates roles of clouds and aerosol–cloud interactions in climate. This in turn provides valuable information to better parameterize stratiform clouds and interactions for climate models. To fulfill the aim, this study focuses on effects of the interplay between ice crystals and droplets on those clouds and interactions of these effects with aerosols using a large-eddy simulation (LES) Eulerian framework. The LES framework reasonably resolves microphysical and dynamic processes at turbulence scales, and thus we can obtain process-level understanding of those effects and interactions. Note that with the Eulerian framework, instead of tracking down individual air parcels, which can be pursued with the Lagrangian framework, this study looks at updrafts, microphysical factors, phase-transition processes, and their evolution, which are averaged over grid points in a domain, to examine the overall interplay between ice and liquid particles over the whole domain. Also, in the LES framework, air parcels go through various updrafts, microphysical factors, and feedbacks between them. Thus, unlike in Korolev (2007), an air parcel in the LES framework can repeatedly experience conditions where the WBF mechanism does not work and those where the mechanism works as it moves around three-dimensionally. Hence, chasing down air parcels in terms of conditions (e.g., updrafts and microphysical factors) for processes such as the WBF mechanism is an enormous task and not that viable. This motivates us to embrace the approach that adopts the averaged updrafts, microphysical factors, and phase-transition processes to examine the overall interplay between ice and liquid particles which includes the WBF mechanism. To help this approach to identify the overall interplay between ice and liquid particles clearly, this study utilizes sensitivity simulations.
Mixed-phase stratiform clouds have been formed frequently over the Korean Peninsula in midlatitudes. These clouds have been affected by the advection of aerosols from East Asia (e.g., Lee et al., 2013; Oh et al., 2015; Eun et al., 2016; Ha et al., 2019). However, we do not have a clear understanding of those clouds and impacts of those aerosols, which are particularly associated with the industrialization of East Asia, on them in the Korean Peninsula (Eun et al., 2016). Motivated by this, we examine those clouds and effects of the advected aerosols from East Asia on them over an area in the Korean Peninsula as a way of better understanding those clouds and aerosol–cloud interactions in them.
A system of mixed-phase stratocumulus clouds was observed in the Seoul area in Korea over a period between 00:00 LST (local solar time) on 12 January and 00:00 LST on 14 January in 2013. The Seoul area is a conurbation area composed of the Seoul capital city and adjacent highly populated cities. The population of the Seoul area is estimated at 25 million. Coincidently, during this period, there is advection of an aerosol layer from the west of the Seoul area (or from East Asia) to it, and this lifts aerosol concentrations in the Seoul area. This type of advection has been monitored by island stations in the Yellow Sea (Eun et al., 2016; Ha et al., 2019). For this study, the advection is monitored and identified by comparisons of PM10 and PM2.5, representing aerosol mass, between a ground station in Baekryongdo, located in the Yellow Sea, and ground stations in and around the Seoul area. These stations observe and measure PM10 and PM2.5 using the beta-ray attenuation method (Eun et al., 2016; Ha et al., 2019). PM stands for particulate matter and PM10 (PM2.5) is the total mass of aerosol particles whose diameter is smaller than 10 (2.5) µm per unit volume of the air. In Fig. 1, the island and the Seoul area are included in a rectangle that represents an area of interest in terms of the advection of the aerosol layer. Figure 2a shows the time series of PM10 and PM2.5, observed and measured by the ground station on the island and a representative ground station in the Seoul area, between 10 and 19 January in 2013 when there is strong advection of aerosols from East Asia to the Seoul area. Around 00:00 LST on 12 January, aerosol mass starts to increase and reaches its peak at 09:00 LST on 12 January on the island. Then, there is a subsequent increase in aerosol mass in the Seoul area, which starts around 05:00 LST on 12 January, and it reaches its peak at 18:00 LST on 12 January in the Seoul area due to the advection of aerosols from East Asia to the Seoul area over the island. Figure 2b and c show observed and measured aerosol mass distribution in the rectangle in Fig. 1 at 05:00 and 18:00 LST on 12 January, respectively. To construct Fig. 2b and c, observed and measured aerosol mass concentrations by the ground stations are interpolated into equidistant points in the rectangle. Consistent with the time series, there is the high aerosol mass in and around the island due to the advection of aerosols from the East Asian continent at 05:00 LST on 12 January (Fig. 2b). Then, the advection continues to move aerosol mass eastward further to the Seoul area, resulting in a subsequent decrease in aerosol mass in and around the island and an increase in aerosol mass in the Seoul area at 18:00 LST on 12 January (Fig. 2c).
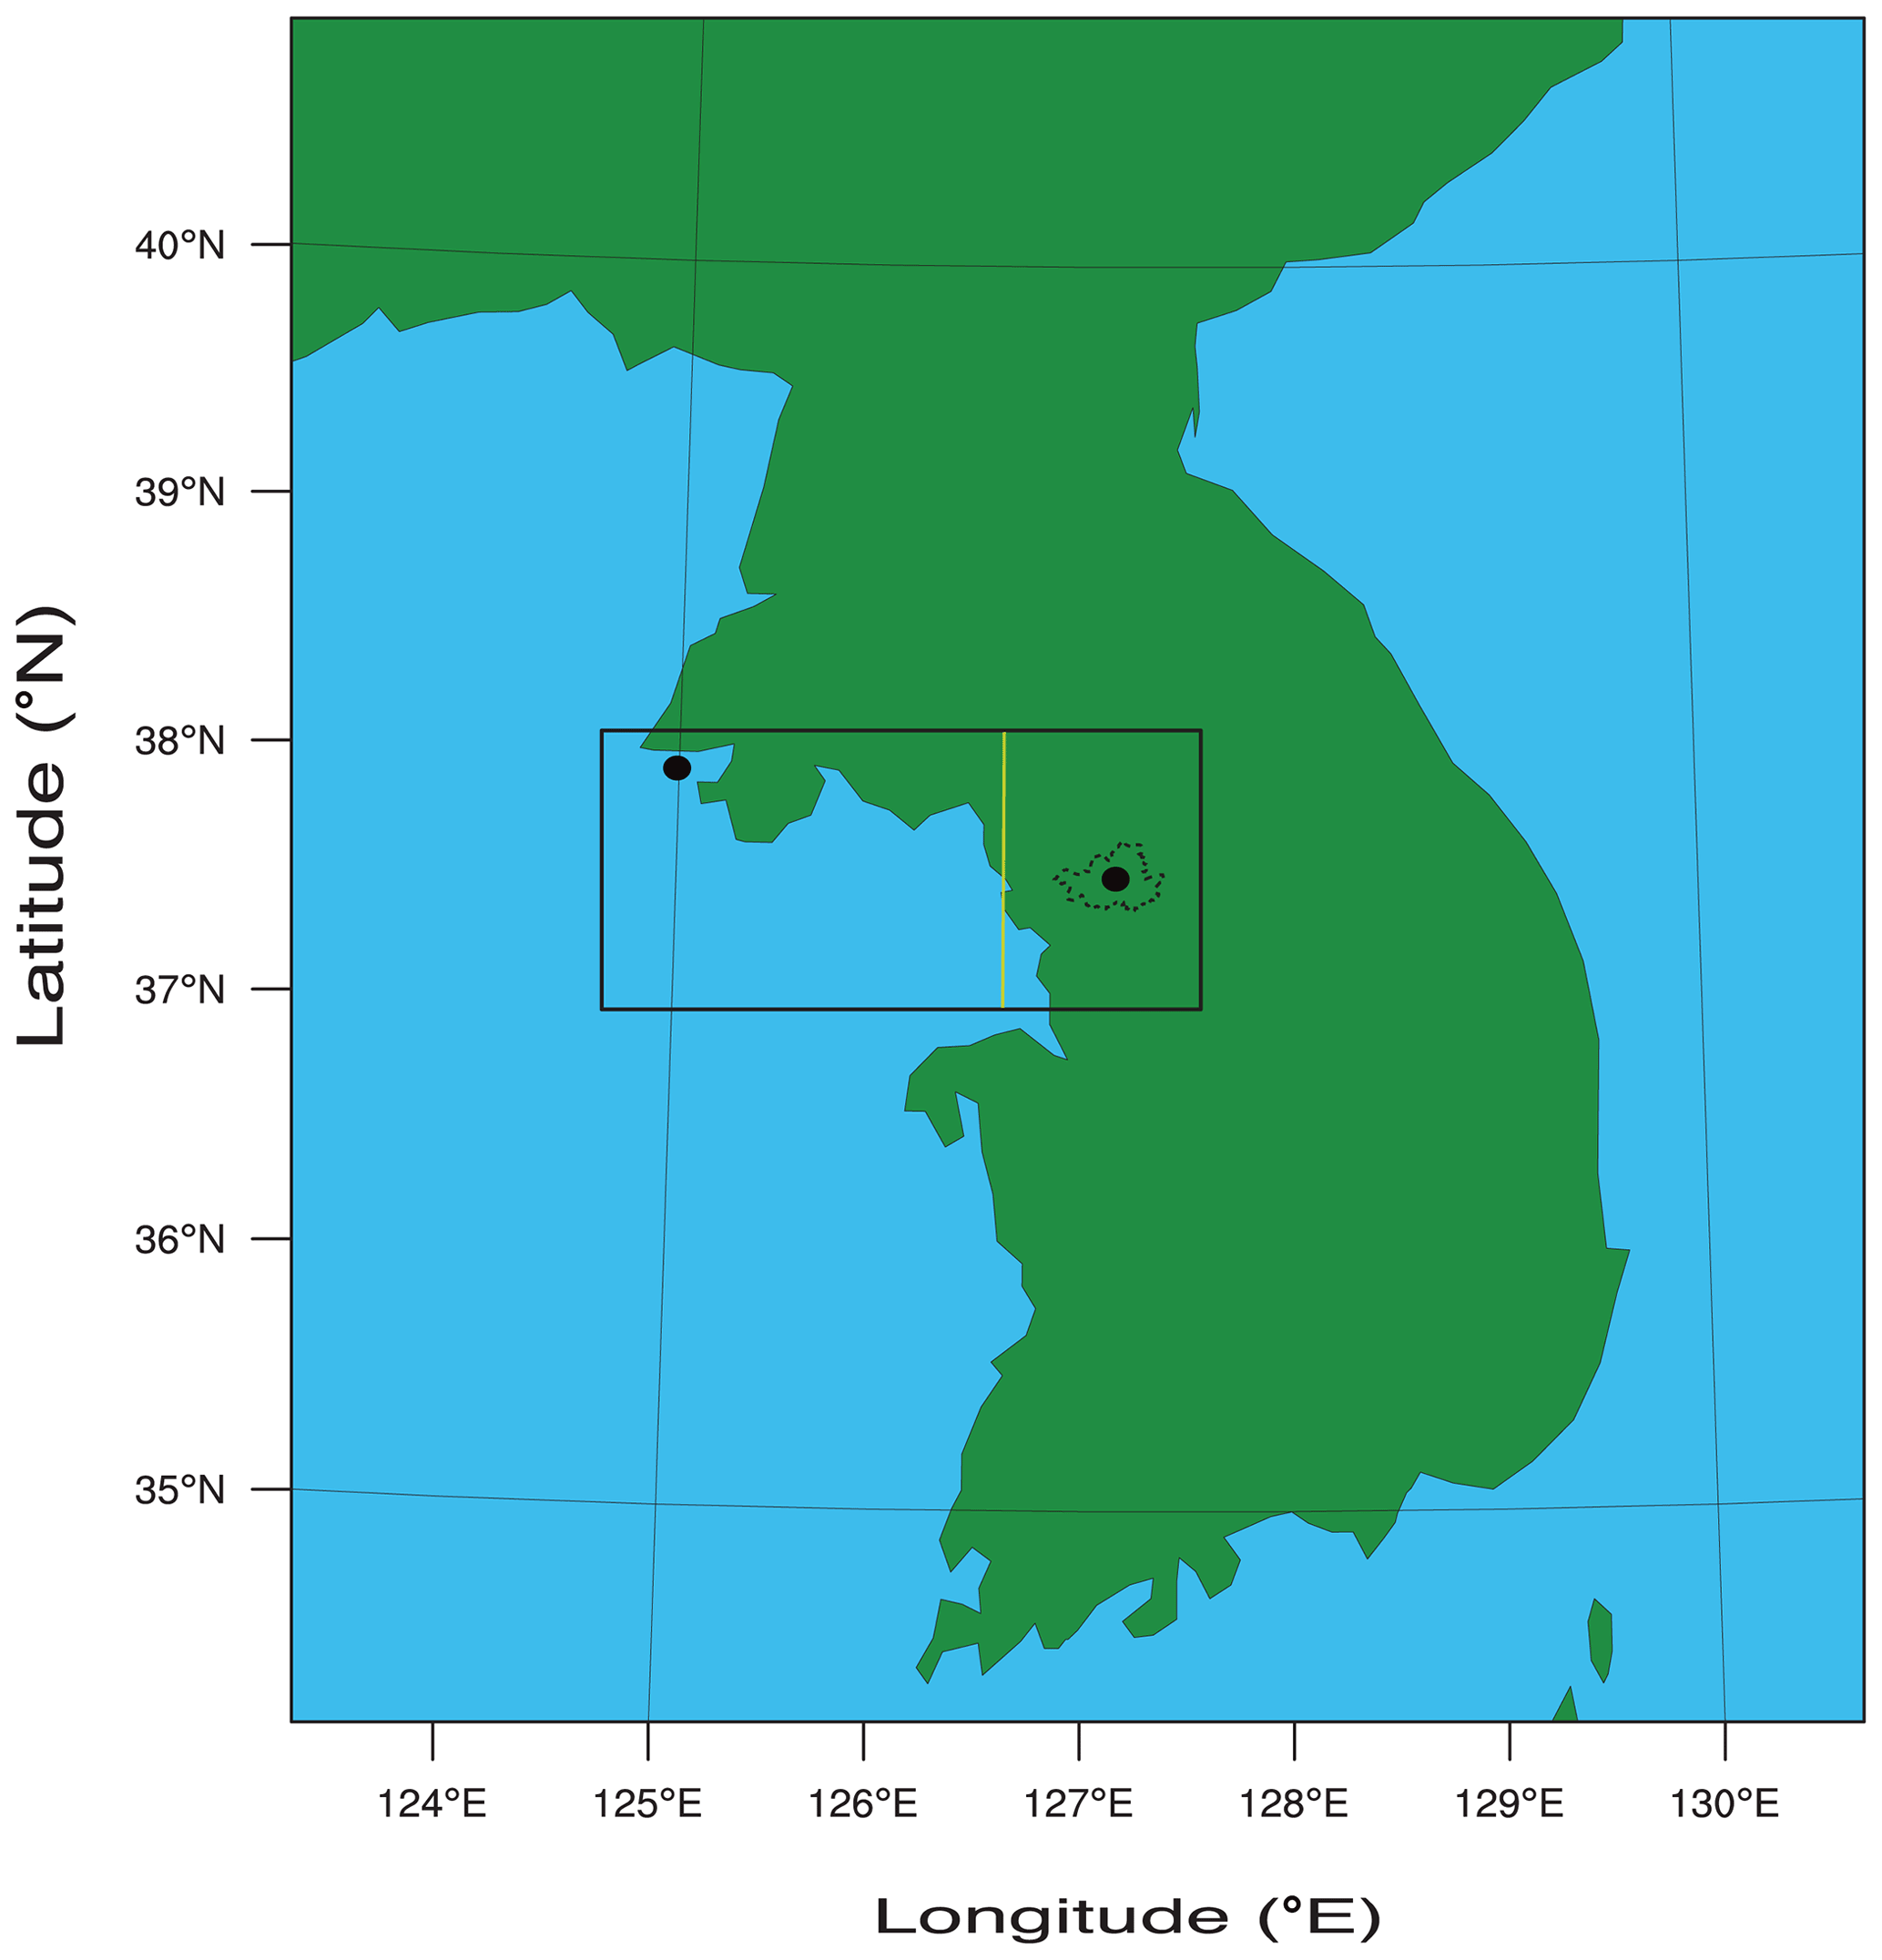
Figure 1A rectangle represents the domain of interest in terms of the aerosol advection. A dot in the top left corner of the rectangle marks a station that measures PM10 and PM2.5 on Baekryongdo as detailed in Sect. 2. An area to the east of the yellow line in the rectangle is the Seoul area. In the Seoul area, a dot marks a representative station that measures PM10 and PM2.5 in the Seoul area as detailed in Sect. 2. A closed dotted line marks the boundary of the Seoul city.
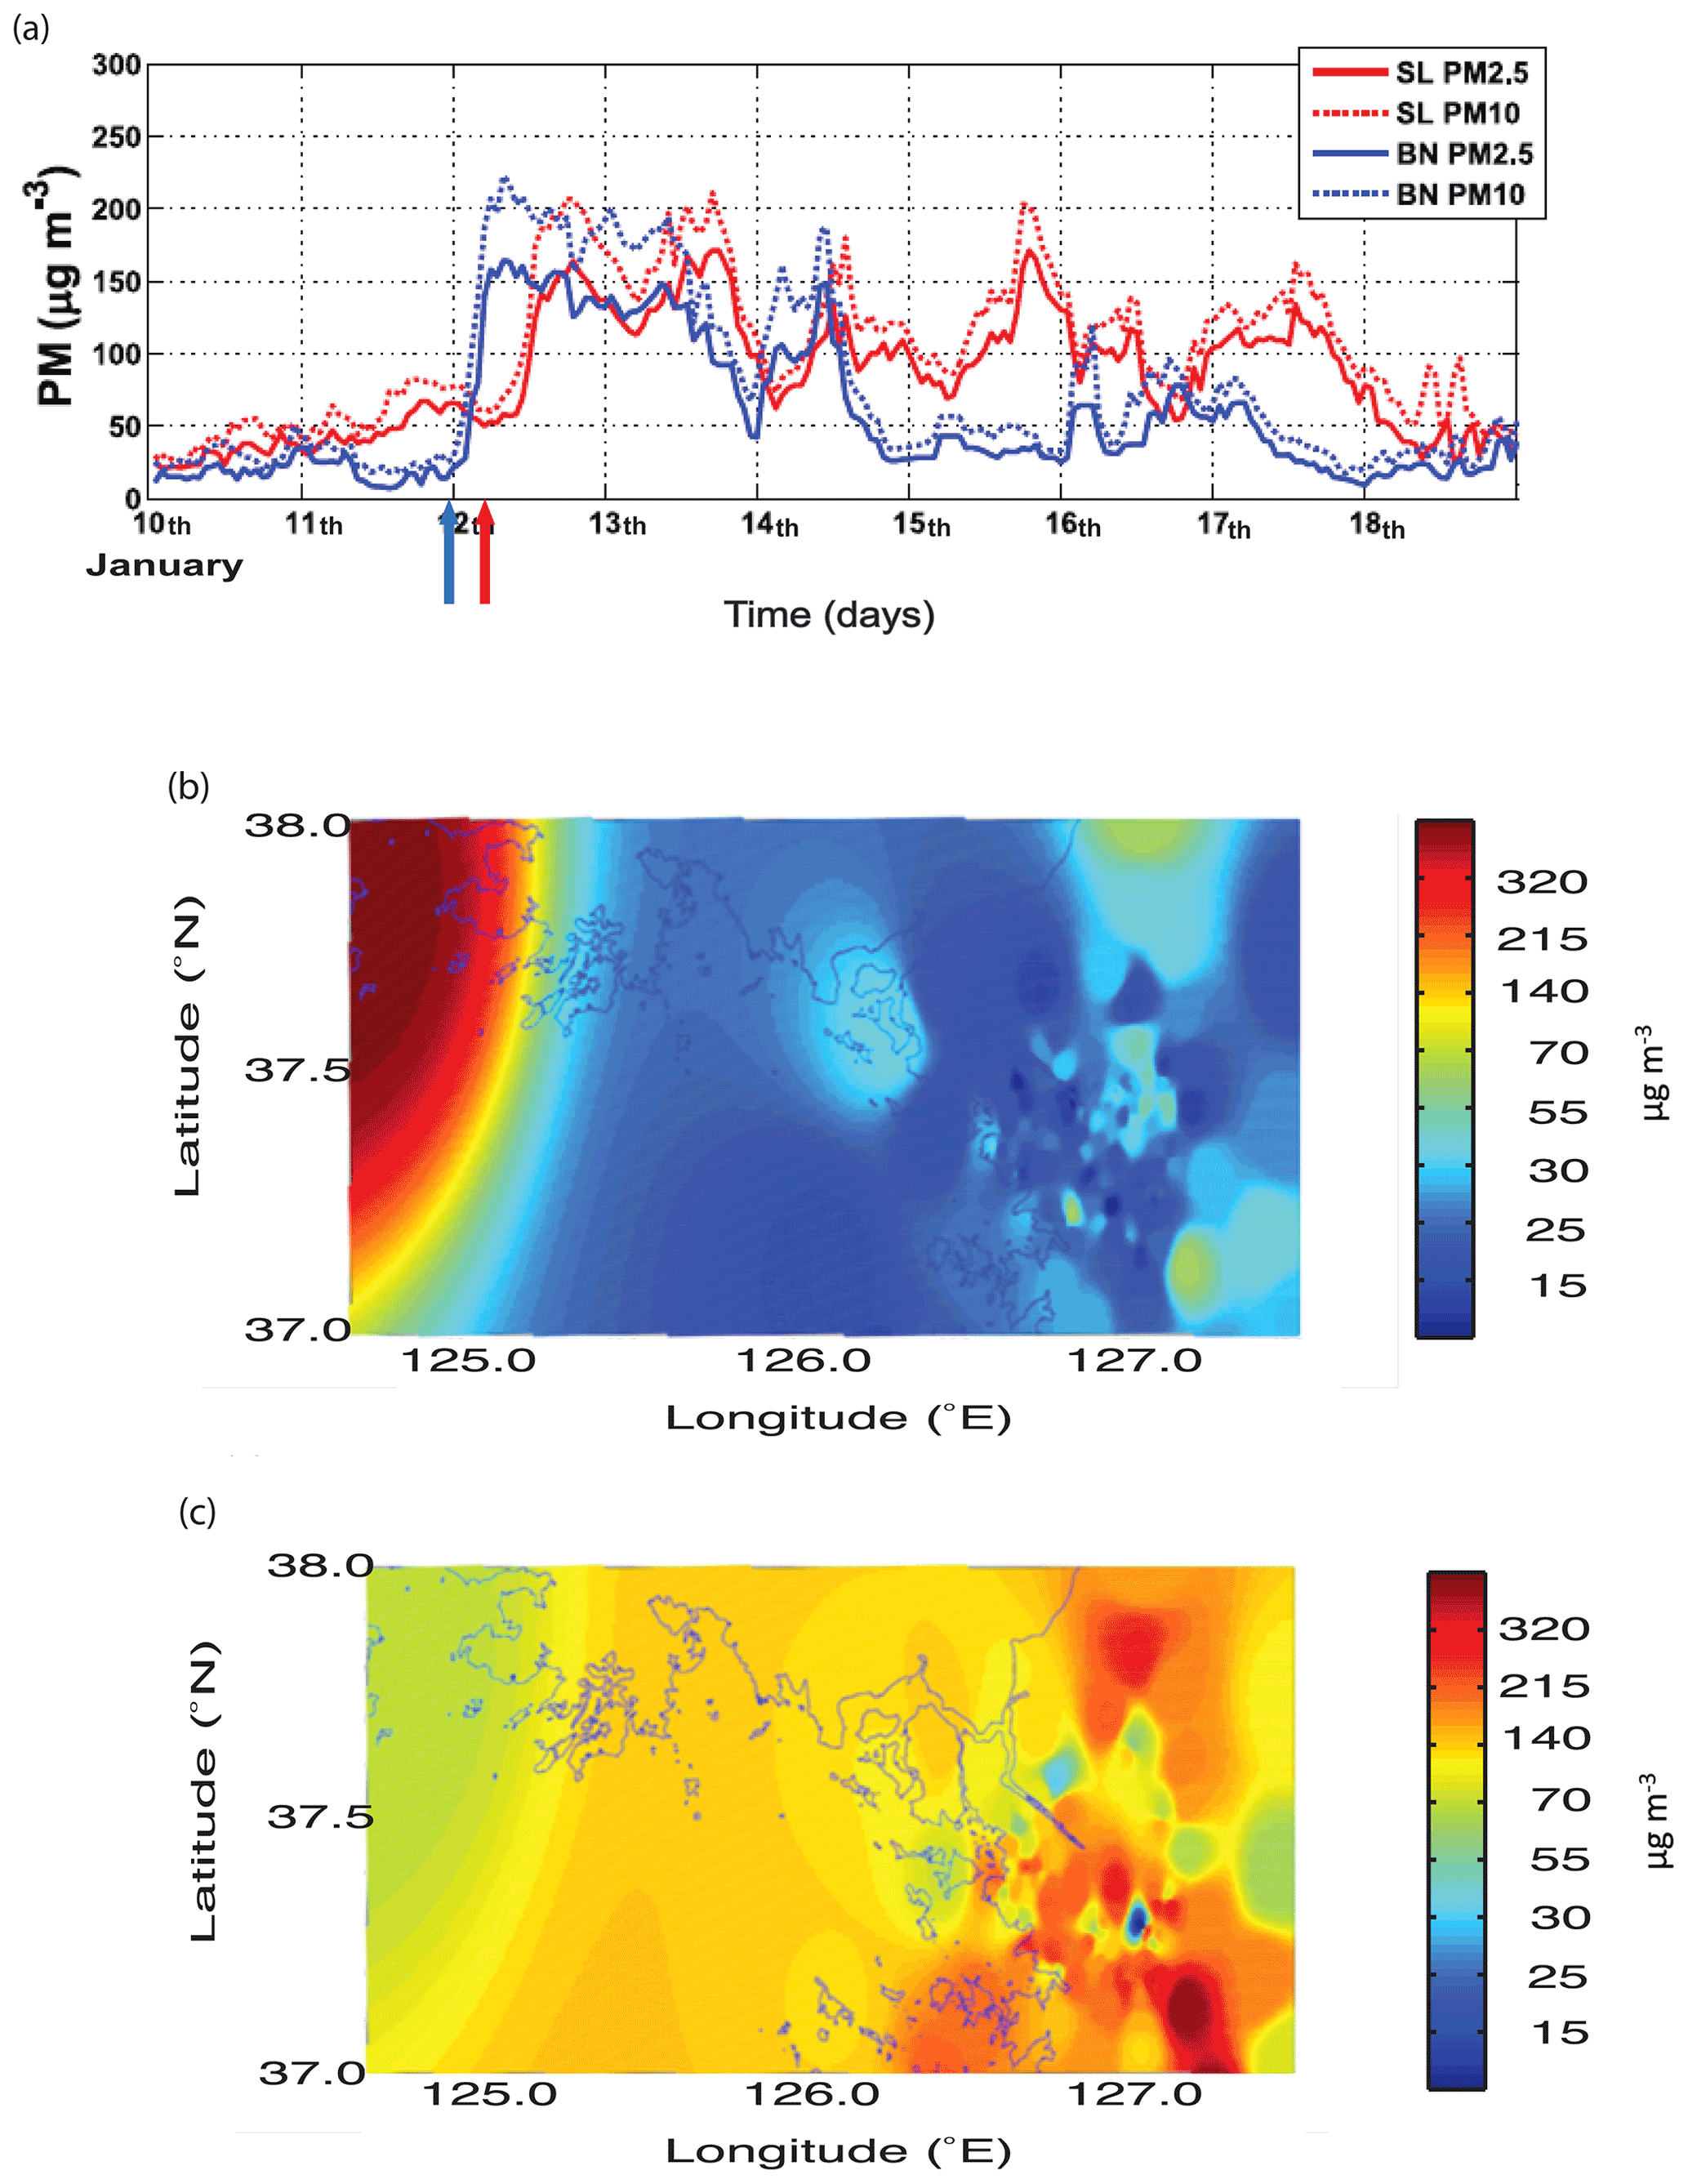
Figure 2(a) Time series of PM10 and PM2.5 observed at the ground station on Baekryongdo (BN) and a representative ground station in the Seoul area (SL). The abscissa represents days between 10 and 19 January in 2013. The blue (red) arrow marks time when aerosol mass starts to increase in BN (SL) due to the advection of aerosols from East Asia to the Seoul area. The spatial distribution of PM2.5, which is observed and measured by the ground stations and interpolated into grid points over the rectangle in Fig. 1, at (b) 05:00 LST and (c) 18:00 LST on 12 January in 2013.
With the advection of aerosols, there is the advection of meteorological conditions. To identify this advection of meteorological conditions in the Seoul area, the vertical distributions of the radiosonde-observed potential temperature and humidity at 03:00 and 15:00 LST on 12 January in the Seoul area are obtained and shown in Fig. 3. At 03:00 LST on 12 January just before when aerosol concentrations start to increase due to the aerosol advection in the Seoul area, there is a stable layer in the PBL whose top is around 1.0 km (Fig. 3a). This stable layer is not favorable for the formation of a deck of stratiform clouds. However, after 03:00 LST on 12 January, the PBL becomes a well-mixed layer, and its top height increases to 1.5 km as seen in comparisons between 03:00 and 15:00 LST on 12 January in the Seoul area (Fig. 3a and b). Hence, with advection-induced increases in aerosol concentrations and the associated advection of meteorological conditions, meteorological conditions become favorable for the formation of a deck of stratocumulus clouds in the Seoul area. In this study, we examine how the advection of aerosols affects the observed mixed-phase stratocumulus clouds in the Seoul area, and impacts of the advection of meteorological conditions on those clouds are out of scope of this study.
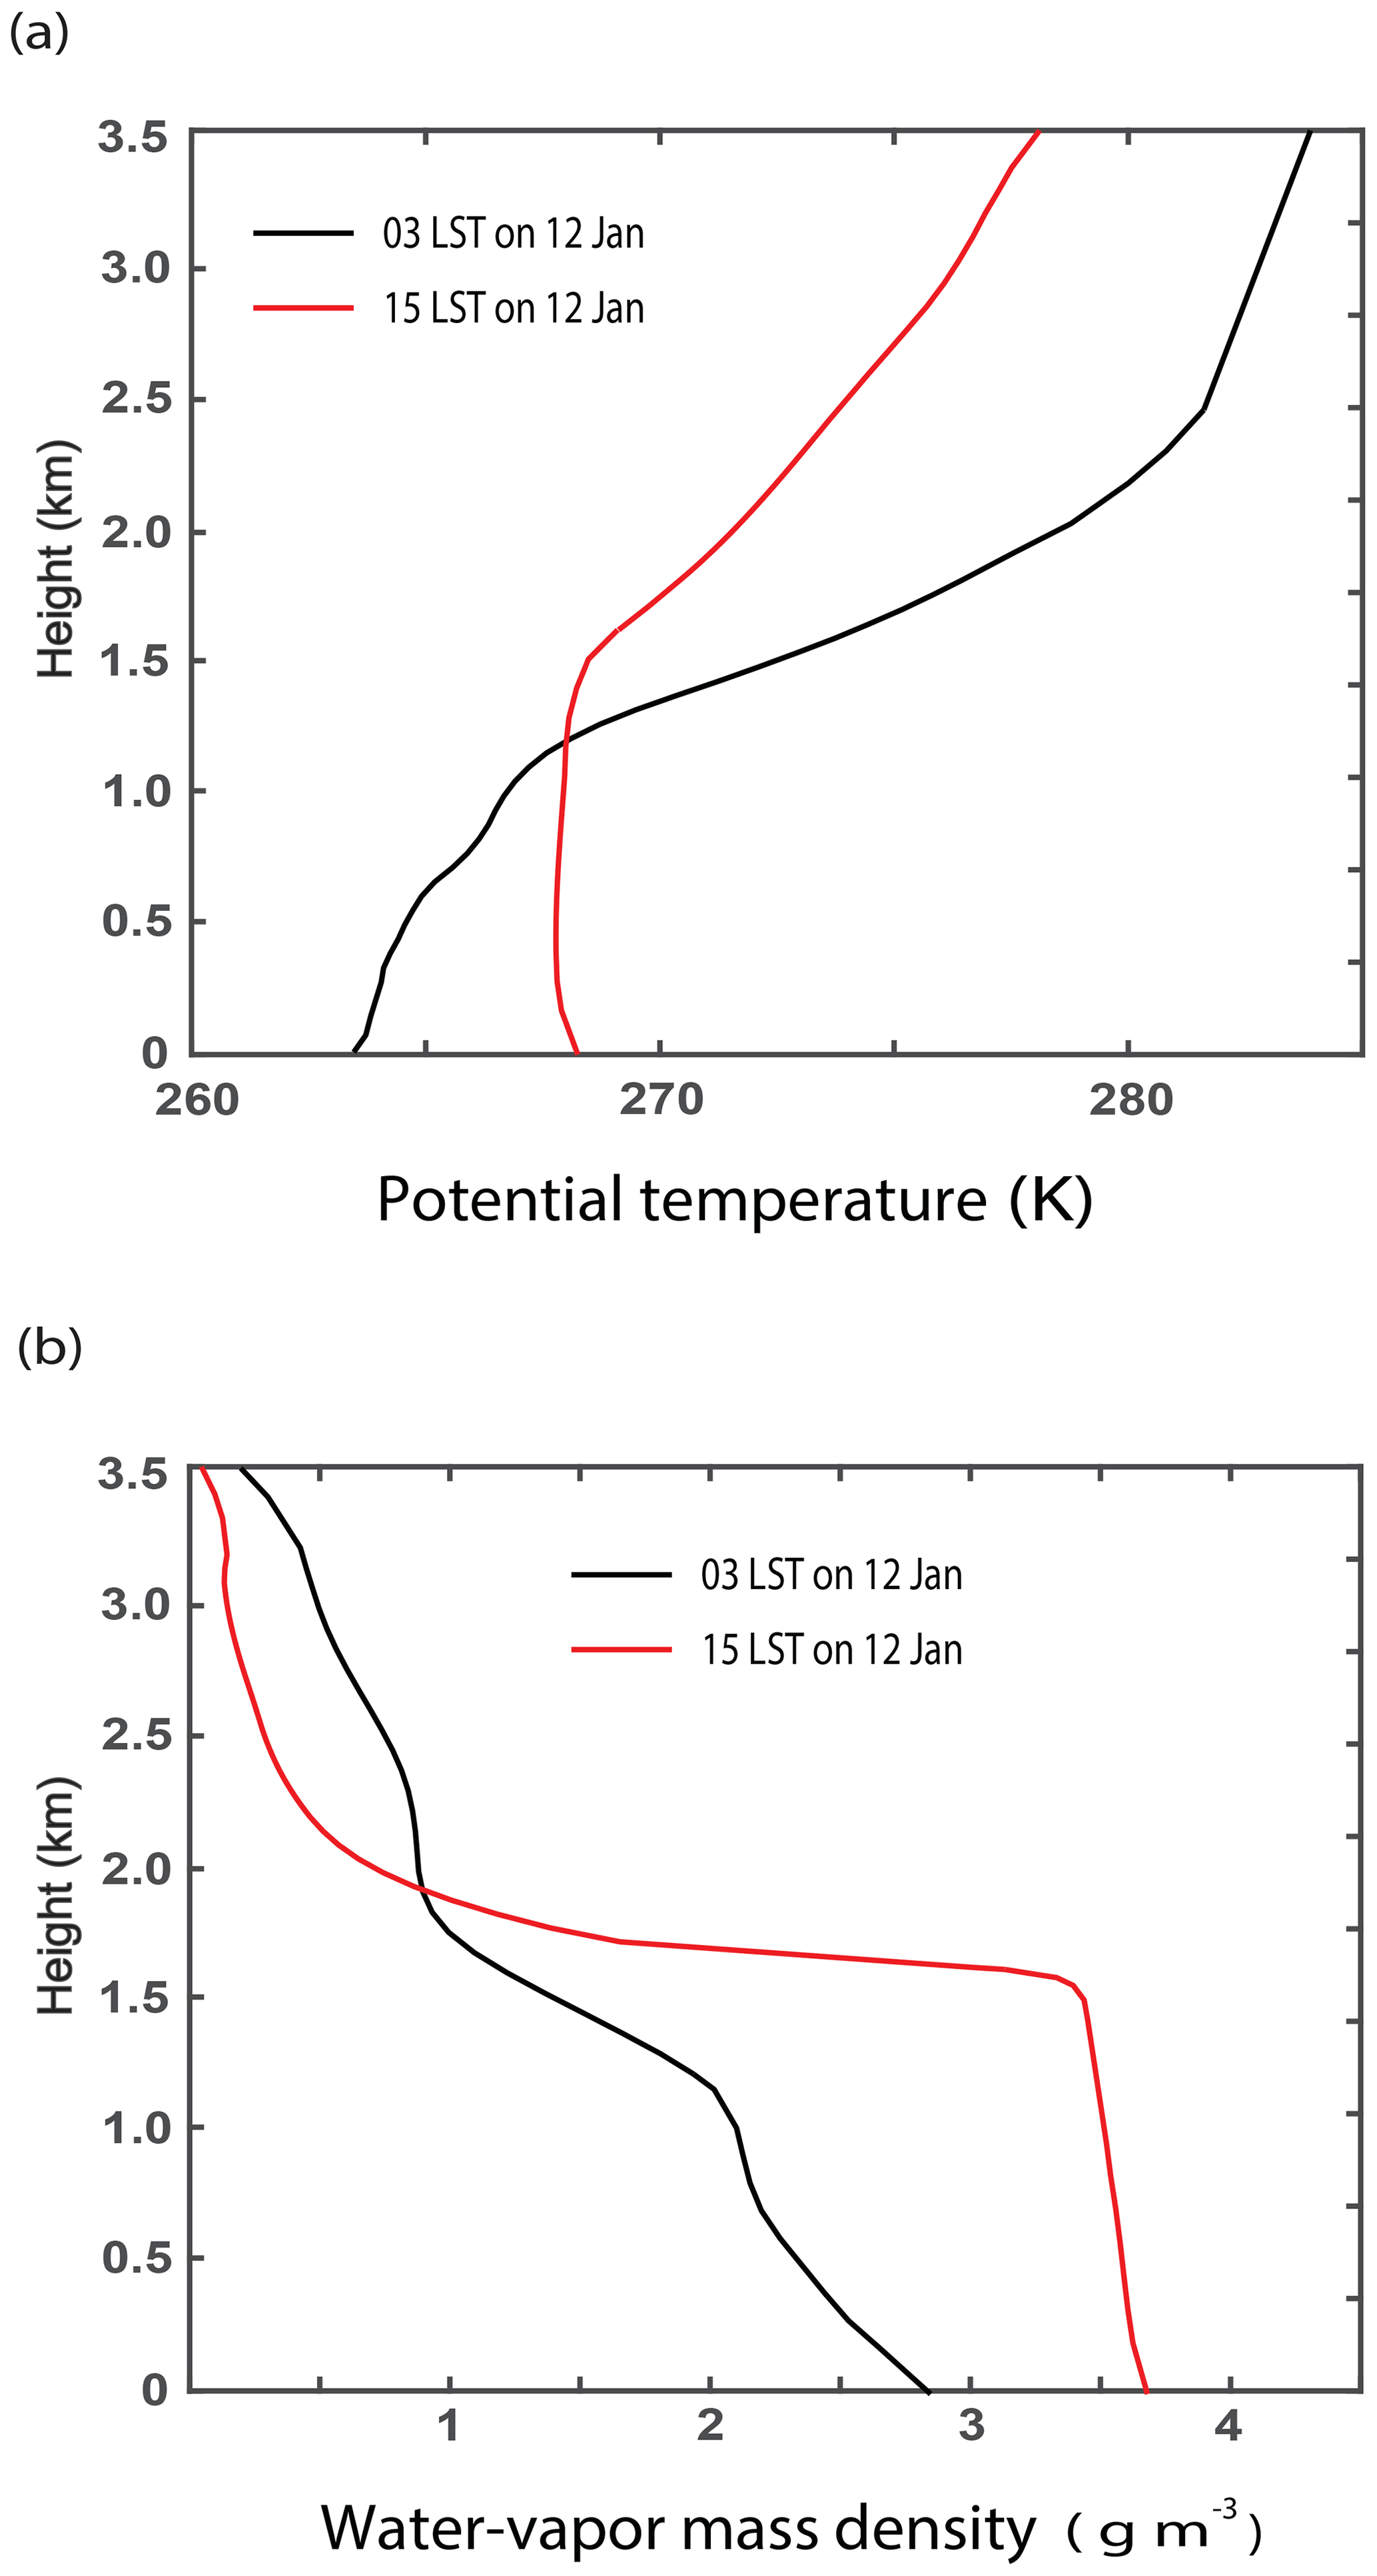
Figure 3The vertical distributions of the radiosonde-observed (a) potential temperature and (b) water-vapor mass density at 03:00 LST and 15:00 LST on 12 January.
3.1 LES
As a LES Eulerian model, we use the Advanced Research Weather Research and Forecasting (ARW) model (version 3.3.1), which is a nonhydrostatic compressible model (Michalakes et al., 2001; Klemp et al., 2007). Prognostic microphysical variables are transported with a fifth-order monotonic advection scheme (Wang et al., 2009). Shortwave and longwave radiation is parameterized by the Rapid Radiation Transfer Model (RRTM; Mlawer et al., 1997; Fouquart and Bonnel, 1980). The effective sizes of hydrometeors are calculated in an adopted microphysics scheme, and the calculated sizes are transferred to the RRTM to consider effects of the effective sizes on radiation.
To represent microphysical processes, the LES model adopts a bin scheme based on the Hebrew University Cloud Model described by Khain et al. (2011). The bin scheme solves a system of kinetic equations for the size distribution functions of water drops, ice crystals or cloud ice (plate, columnar and branch types), snow aggregates, graupel and hail, and CCN and INPs. Water drops whose size is smaller than 80 µm in diameter are classified to be cloud droplets (or cloud liquid), while drops whose size is greater than 80 µm in diameter are classified to be raindrops (or rain). Each size distribution is represented by 33 mass doubling bins, i.e., the mass of a particle mk in the kth bin is determined as .
A cloud-droplet nucleation parameterization based on Köhler theory represents cloud-droplet nucleation. Arbitrary aerosol mixing states and aerosol size distributions can be fed to this parameterization. To represent heterogeneous ice-crystal nucleation, the parameterizations by Lohmann and Diehl (2006) and Möhler et al. (2006) are used. In these parameterizations, contact, immersion, condensation–freezing, and deposition nucleation paths are all considered by taking into account the size distribution of INPs, temperature, and supersaturation. Homogeneous aerosol (or haze particle) and droplet freezing are also considered following the theory developed by Koop et al. (2000).
3.2 Control run
For a three-dimensional simulation of the observed case of mixed-phase stratocumulus clouds, i.e., the control run, a domain with a 100 m resolution just over the Seoul area as shown in Fig. 1 is adopted. The control run is for a period between 00:00 LST on 12 January and 00:00 LST on 14 January in 2013. The length of the domain in the east–west (north–south) direction is 220 (180) km. In the vertical domain, the resolution coarsens with height. The resolution in the vertical domain is 20 m just above the surface and 100 m at the model top that is at ∼ 5 km in altitude.
Initial and boundary conditions of potential temperature, specific humidity, and wind for the simulation are provided by reanalysis data. These data are produced by the Met Office Unified Model (Brown et al., 2012) every 6 h on a 0.11∘ × 0.11∘ grid. These data represent the synoptic-scale environment. An open lateral boundary condition is employed for the control run. Surface heat fluxes are predicted by the Noah land surface model (LSM; Chen and Dudhia, 2001). When clouds start to form around 08:00 LST on 12 January, the average temperature over all grid points at cloud tops and bottoms is 252.0 and 263.9 K, respectively.
The horizontally homogeneous aerosol properties are assumed in the current version of the ARW model. To consider the advection of aerosols and the associated spatiotemporal variation in aerosol properties such as composition and number concentration, this assumption of the aerosol homogeneity is abandoned. For this consideration, an aerosol preprocessor is developed to represent the variability of aerosol properties. Observed background aerosol properties such as aerosol mass (e.g., PM10 and PM2.5) at observation sites are interpolated into model grid points and time steps by this aerosol preprocessor.
Surface sites that measure PM2.5 and PM10 in the domain observe the variability of aerosol properties. Here, we assume that PM2.5 and PM10 represent the mass of aerosols that act as CCN. These sites resolve the variability with high spatiotemporal resolution, since they are distributed with about 1 km distance between them and measure aerosol mass every ∼ 10 min. However, they do not measure other aerosol properties such as aerosol composition and size distributions. There are additional sites of the Aerosol Robotic Network (AERONET; Holben et al., 2001) in the domain with distances of ∼ 10 km between them. Hence, these AERONET sites provide data with coarser resolution compared to those of the PM2.5 and PM10 data, although information on aerosol composition and size distributions are provided by the AERONET sites. In this study, the variability of properties of aerosols that act as CCN over the domain is represented by using data from the high-resolution PM2.5–PM10 sites, while the relatively low-resolution data from the AERONET sites are used to represent aerosol composition and size distributions.
According to AERONET measurements during the period with the observed stratocumulus clouds, aerosol particles, on average, are an internal mixture of 70 % ammonium sulfate and 30 % organic compound. This organic compound is assumed to be water soluble and composed of (by mass) 18 % levoglucosan (C6H10O5, density = 1600 kg m−3, van 't Hoff factor = 1), 41 % succinic acid (C6O4H6, density = 1572 kg m−3, van 't Hoff factor = 3), and 41 % fulvic acid (C33H32O19, density = 1500 kg m−3, van 't Hoff factor = 5) based on a simplification of observed chemical composition. Aerosol chemical composition in this study is assumed to be represented by this mixture in all parts of the domain during the whole simulation period, based on the fact that aerosol composition does not vary significantly over the domain during the whole period with the observed clouds. Aerosols before their activation can affect radiation by changing the reflection, scattering, and absorption of shortwave and longwave radiation. However, these impacts on radiation are not considered in this study, since the mixture does not include a significant amount of radiation absorbers such as black carbon. Based on the AERONET observation, the size distribution of background aerosols acting as CCN is assumed to follow the tri-modal lognormal distribution as shown in Fig. 4. Stated differently, the size distribution of background aerosols acting as CCN in all parts of the domain during the whole simulation period is assumed to follow size distribution parameters or the shape of distribution as shown in Fig. 4; by averaging size distribution parameters (i.e., modal radius and standard deviation of each nuclei, accumulation and coarse modes, and the partition of aerosol number among those modes) over the AERONET sites and the period with the stratocumulus clouds, the assumed shape of the size distribution of background aerosols in Fig. 4 is obtained. Since the AERONET observation shows that the shape of the size distribution does not vary significantly over the domain during the simulation period, we believe that this assumption is reasonable. With the assumption above, PM2.5 and PM10 are converted to the background number concentrations of aerosols acting as CCN. These background number concentrations and associated aerosol size distribution and composition are interpolated or extrapolated to grid points immediately above the surface and time steps in the simulation. Background aerosol concentrations are assumed not to vary with height from immediately above the surface to the PBL top; however, above the PBL top, they are assumed to reduce exponentially with height. Aerosol size distribution, and composition do not vary with height. Once background aerosol properties (i.e., aerosol number concentrations, size distribution and composition) are put into each grid point and time step, those properties at each grid point and time step do not change during the course of the simulation.
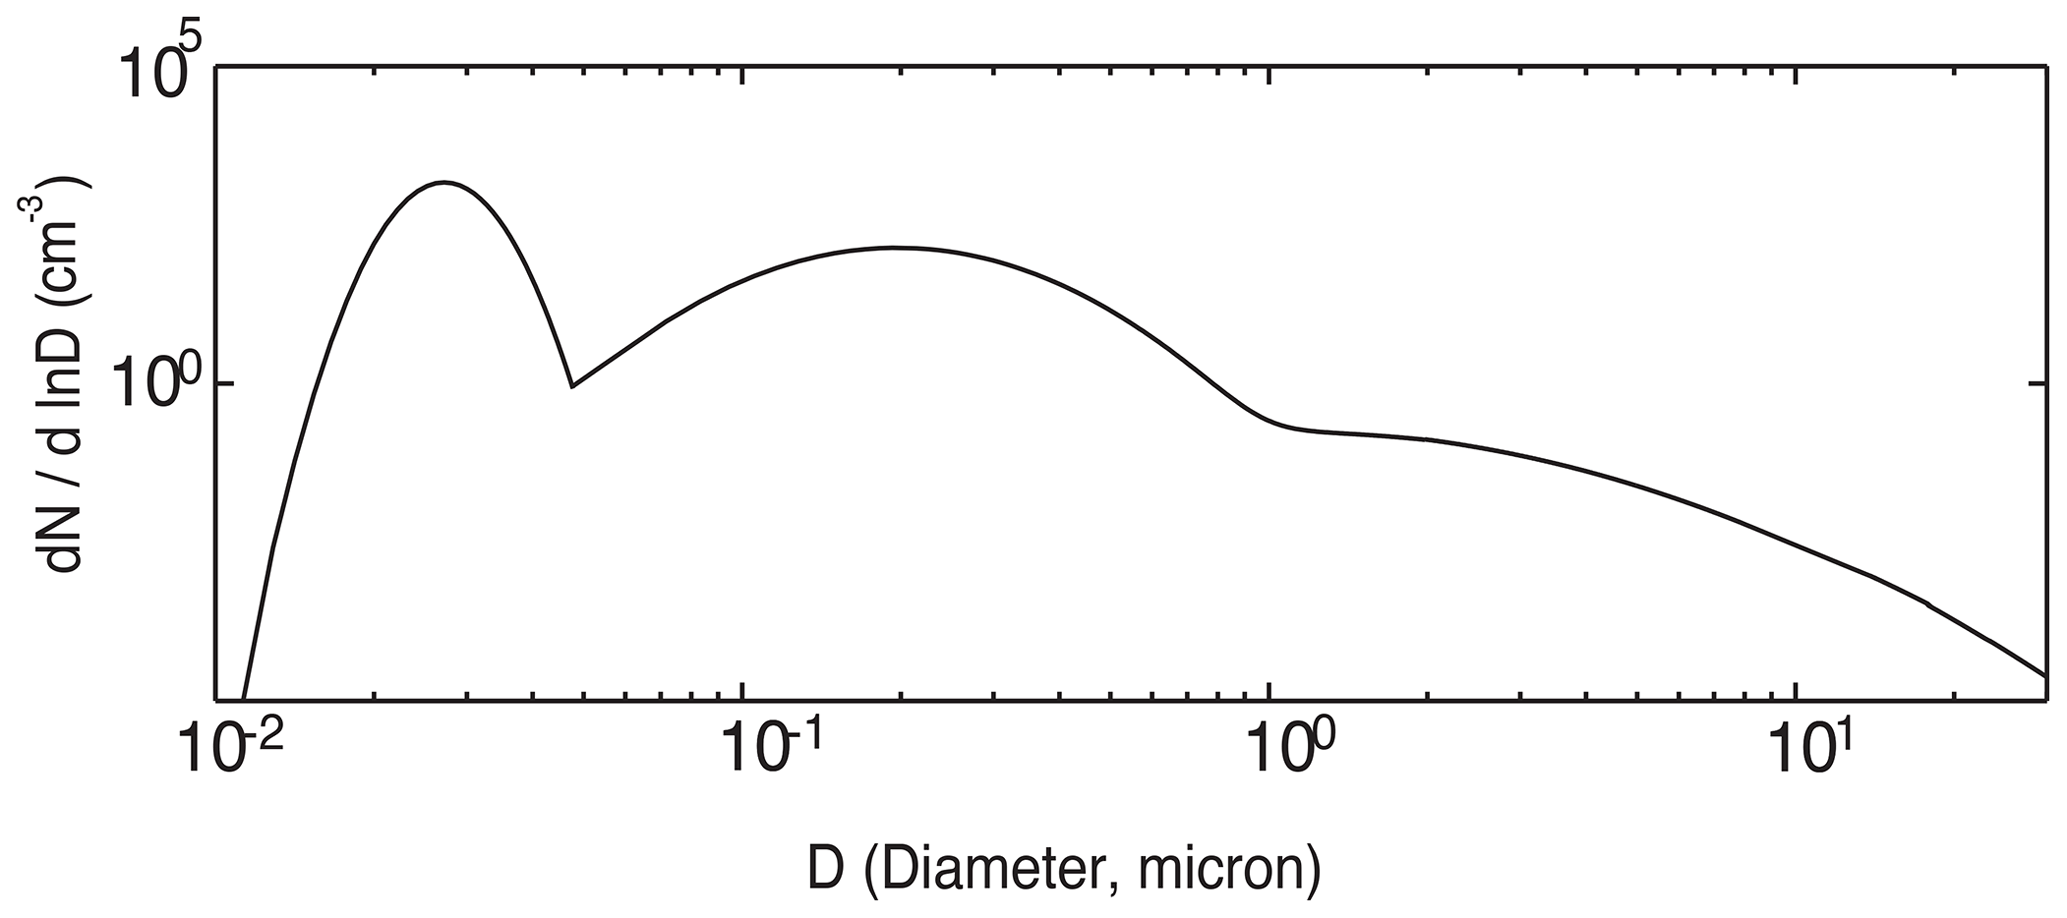
Figure 4Aerosol size distribution at the surface. N represents aerosol number concentration per unit volume of air, and D represents aerosol diameter.
For the control run, aerosol properties of INPs and CCN are assumed to be identical except for the concentration of background aerosols. The concentration of background aerosols acting as INPs is assumed to be 100 times lower than the concentration of background aerosols acting as CCN at each of time steps and grid points. This is based on a general difference in concentration between CCN and INPs (Pruppacher and Klett, 1978).
Once clouds form and background aerosols start to be in clouds, those aerosols are not background aerosols anymore, and the size distribution and concentrations of those aerosols begin to evolve through aerosol sinks and sources. These sinks and sources include advection and aerosol activation (Fan et al., 2009). For example, activated particles are emptied in the corresponding bins of the aerosol spectra. In clouds, aerosol mass included in hydrometeors, after activation, is moved to different classes and sizes of hydrometeors through collision–coalescence and removed from the atmosphere once hydrometeors that contain aerosols reach the surface. In non-cloudy areas, aerosol size and spatial distributions are set to follow background counterparts. In other words, for this study, we use “the aerosol recovery method” where immediately after clouds disappear completely at any grid points aerosol size distributions and number concentrations at those points recover to background properties that background aerosols at those points have before those points are included in clouds. In this method, there is no time interval between the cloud disappearance and the aerosol recovery. Here, when the sum of mass of all types of hydrometeors (i.e., water drops, ice crystals, snow aggregates, graupel and hail) is not zero at a grid point, that grid point is considered to be in clouds. When this sum becomes zero, clouds are considered to disappear.
It is notable that in clouds, processes such as aerosol activation, which is related to aerosol–cloud interactions and the nucleation scavenging, and aerosol transportation by wind and turbulence and impacts of these processes on aerosol size distribution and concentrations are considered in this study as in other models that explicitly predict aerosol size distribution and concentrations such as the chemistry version of the Weather Research and Forecasting (WRF) model (WRF-Chem) (Grell et al., 2005; Skamarock et al., 2008). When clouds disappear, in those other models, without nudging aerosols to observed background counterparts, aerosols just evolve based on the emissions of aerosols around the surface, aerosol chemical and physical processes, aerosol transportation, and so on. However, in the ARW model used here, aerosols are forced to be nudged into observed background aerosols, and this may act as a weakness of the aerosol recovery (or nudging) method.
Numerous CSRM studies have adopted this aerosol recovery method and proven that it is able to simulate overall cloud and precipitation properties reasonably well (e.g., Morrison and Grabowski, 2011; Lebo and Morrison, 2014; Lee et al., 2016, 2018). These properties include cloud fraction, cloud-top height, cloud-bottom height, cumulative precipitation, precipitation frequency distribution, mean precipitation rate, cloud-system organization, and spatiotemporal precipitation distributions. These studies have shown that there is good consistency between those simulated properties and observed counterparts. The good consistency means that the percentage difference in those properties between simulations and corresponding observation is ∼ 10 % to 20 % or less.
The recovery of aerosols to their background counterparts is mainly to keep aerosol concentrations outside clouds in the simulation at observed counterparts. Other models that explicitly predict aerosol concentrations with no use of the aerosol recovery method are not able to simulate aerosol spatiotemporal distributions and their evolutions which are identical to those observed, although those models require a much larger amount of computational resources and time than the aerosol recovery method. This is mainly because there are uncertainties in the representation of aerosol chemical and physical processes, and these processes consume a large amount of computational resources and time in those models. For this study, particularly to simulate the variation in aerosol concentrations over grid points and time steps induced by the aerosol advection as observed with the minimized use of computational resources and time, observed aerosol concentrations, based on the observed PM data and the assumed aerosol size distribution and composition, are applied to grid points and time steps in the simulation directly via the aerosol preprocessor in association with the aerosol recovery method. In this way, background aerosol concentrations (or background aerosols or aerosols outside clouds) in the simulation are exactly identical to those observed, in case we neglect possible errors from the assumption on aerosol size distribution and composition, and the interpolation or extrapolation of observed data to grid points and time steps in the simulation. In addition, those background aerosols from observation are results of processes related to aerosols in real nature (e.g., aerosol emissions, cloud impacts on aerosols via scavenging processes, aerosol chemical and physical processes, and aerosol transportation by wind and turbulence). Hence, by adopting background aerosols, as they are in observation, for the simulation, not only are we able to consider the transportation of background aerosols by wind (or aerosol advection) and associated aerosol evolutions as observed but we are also able to consider the evolution of background aerosols induced by the other aerosol-related processes as observed in the simulation. We believe that this balances out the weakness of the aerosol recovery method to result in the reasonable simulation of the selected case, as is evidently shown by the fact that simulated cloud properties are in good agreement with observed counterparts as described below.
3.3 Additional runs
To examine effects of the aerosol advection on the observed stratocumulus clouds over the Seoul area, the control run is repeated by removing the increase in aerosol concentrations due to the aerosol advection. This repeated run is referred to as the low-aerosol run.
In the low-aerosol run, to remove the increase in aerosol concentrations, background aerosol concentrations after 05:00 LST on 12 January do not evolve with the aerosol advection and are assumed to have background aerosol concentrations at 05:00 LST on 12 January at every time step and grid point only for the concentration of background aerosols acting as CCN. Here, the time- and domain-averaged concentration of background aerosols acting as CCN after 05:00 LST on 12 January in the low-aerosol run is lower than that in the control run by a factor of ∼ 3. It is notable that there are no differences in the concentration of background aerosols acting as INPs between the control and low-aerosol runs. This is to isolate effects of CCN, which accounts for most of aerosols, on clouds from those effects of INPs via comparisons between the runs. Via the comparisons, we are able to identify how advection-induced increases in the concentration of aerosols acting as CCN affect clouds. The ratio of the concentration of background aerosols acting as CCN at 05:00 LST on 12 January to that after 05:00 LST on 12 January varies among grid points and time steps, since the concentration varies spatiotemporally throughout the simulation period in the control run. This means that a factor by which the concentration of background aerosols acting as CCN varies after 05:00 LST on 12 January between the control and low-aerosol runs is different for each of the time steps and grid points.
As mentioned above, impacts of the advection of meteorological conditions, which accompanies the advection of aerosols and associated increases in aerosol concentrations, on the stratocumulus clouds in the Seoul area are out of the scope of this study. Hence, there are no differences in synoptic-scale environment or meteorological conditions between the control and low-aerosol runs. This enables the isolation of impacts of the aerosol advection through comparisons between the runs. If impacts of the advection of meteorological conditions were investigated by repeating the control run, with an assumption that meteorological conditions after 03:00 LST on 12 January do not evolve and are fixed at 03:00 LST on 12 January, for the purpose of comparing the control run to this repeated run, there would be no or nearly no formation of stratocumulus clouds in this repeated run; this is because there is a stable layer at 03:00 LST on 12 January, which is just before the advection of aerosols affects aerosol concentrations in the Seoul area and not favorable for the formation of clouds as described in Sect. 2. As mentioned in Sect. 2, the advection of meteorological conditions, which are with advection-induced increases in aerosol concentrations, enables the formation of the stratocumulus clouds in the Seoul area. This study examines impacts of the aerosol advection on those clouds for this given advection of meteorological conditions.
To examine effects of the interplay between ice crystals and droplets on the adopted system of stratocumulus clouds and its interactions with aerosols, the control and low-aerosol runs are repeated by removing ice processes. These repeated runs are referred to as the control-noice and low-aerosol-noice runs. In the control-noice and low-aerosol-noice runs, only aerosols acting as CCN, droplets (i.e., cloud liquid), raindrops, and associated phase-transition processes (e.g., condensation and evaporation) exist, and aerosols acting as INPs, all solid hydrometeors (i.e., ice crystals, snow, graupel, and hail), and associated phase-transition processes (e.g., deposition and sublimation) are turned off, regardless of temperature. Via comparisons between the control and control-noice runs, we aim to identify effects of the interplay between ice crystals and droplets on the adopted system. Via comparisons between a pair of the control and low-aerosol runs and that of the control-noice and low-aerosol-noice runs, we aim to identify effects of the interplay between ice crystals and droplets on interactions between the system and aerosols. Henceforth, the pair of the control and low-aerosol runs is referred to as the ice runs, while the pair of the control-noice and low-aerosol-noice runs is referred to as the noice runs.
To better understand findings in Sect. 4.1.1, which explain how the interplay between ice crystals and droplets affects stratocumulus clouds, the control run is repeated by increasing the concentration of background aerosols acting as INPs by a factor of 10 and 100 at each time step and grid point. These repeated runs are detailed in Sect. 4.1.2 and referred to as the INP-10 and INP-100 runs, respectively. To better understand findings in Sect. 4.2.1, which explain how aerosols acting as CCN affect the interplay between ice crystals and droplets, the control run is repeated by reducing the concentration of background aerosols acting as INPs in the same way as the concentration of background aerosols acting as CCN is reduced in the low-aerosol-run compared to that in the control run. This repeated run is referred to as the INP-reduced run and detailed in Sect. 4.2.2. To see the roles played by the sedimentation of ice particles (i.e., ice crystals, snow aggregates, graupel, and hail) in stratiform clouds and their interactions with aerosols, the control, INP-10, INP-100, low-aerosol, and INP-reduced runs are repeated with the sedimentation of ice particles turned off. These repeated runs are referred to as the control-no-sedim, INP-10-no-sedim, INP-100-no-sedim, low-aerosol-no-sedim, and INP-reduced-no-sedim runs and detailed in Sect. 4.1.3 and 4.2.3. To examine roles played by the sedimentation of both ice and liquid particles (i.e., droplets and raindrops) in stratiform clouds, the control run is repeated again with the sedimentation of both ice and liquid particles turned off. This repeated run is referred to as the control-no-sedim-ice-liq run. Table 1 summarizes all of the simulations in this study.

4.1 Effects of the interplay between ice crystals and droplets on clouds
4.1.1 The control and control-noice runs
Figure 5a shows the time series of the domain-averaged liquid-water path (LWP), ice-water path (IWP), and water path (WP), which is the sum of LWP and IWP, for the control run, and LWP for the control-noice run. Since in the control-noice run, there are no ice particles, LWP acts as WP in the run. WP is higher in the control-noice run than in the control run throughout the whole simulation period. This higher WP in the control-noice run accompanies the higher average cloud fraction over time steps with a non-zero cloud fraction. The average cloud fraction is 0.98 and 0.92 in the control-noice and control runs, respectively. At the initial stage before 20:00 LST on 12 January, differences in WP between the runs are not as significant as those after 20:00 LST on 12 January (Fig. 5a). The differences in WP between the runs are greatest around 00:00 LST on 13 January when WP reaches its maximum value in each of the runs (Fig. 5a). These differences decrease as time goes by after around 00:00 LST on 13 January (Fig. 5a). The time- and domain-averaged WP over the period between 00:00 LST (local solar time) on 12 January and 00:00 LST on 14 January is 18 and 55 g m−2 in the control and control-noice runs, respectively. Associated with this, the WP peak value reaches 83 g m−2 in the control run, while the value reaches 230 g m−2 in the control-noice run (Fig. 5a). Over most of the simulation period, IWP is greater than LWP in the control run except for the period between ∼ 22:00 LST on 12 January and ∼ 01:00 LST on 13 January (Fig. 5a). In the control run, the time- and domain-averaged IWP and LWP are 11 and 7 g m−2, respectively. Results here indicate that when solid and liquid particles coexist, cloud mass, represented by WP, reduces a lot compared to that when liquid particles alone exist. To evaluate the control run, satellite and ground observations can be utilized. In the case of the Moderate Resolution Imaging Spectroradiometer, one of representative polar orbiting image sensors on board satellites, it passes the Seoul area only at 10:30 and 13:30 LST every day; hence, the sensor is not able to provide reliable data that cover the whole simulation period. Multifunctional Transport Satellites (MTSAT), which are geostationary satellites and available in East Asia, do not provide reliable data of LWP and IWP, although they provide comparatively reliable data of cloud fraction and cloud-top height throughout the whole simulation period (Faller, 2005). Ground observations provide data of cloud fraction and cloud-bottom height throughout the whole simulation period. Here, the simulated cloud fraction and cloud-bottom height are compared to those from ground observations, while the simulated cloud-top height is compared to that from the MTSAT. The average cloud fraction over time steps with non-zero cloud fraction is 0.92 and 0.86 in the control run and observation, respectively. The average cloud-bottom height over grid columns and time steps with non-zero cloud-bottom height is 230 (250) m in the control run (observation). The average cloud-top height over grid columns and time steps with non-zero cloud-top height is 2.2 (2.0) km in the control run (observation). For this comparison between the control run and observation, observation data are interpolated into grid points and time steps in the control run. The percentage difference in each of cloud fraction, cloud-bottom, and cloud-top heights between the control run and observations is ∼ 10 %, and thus the control run is considered to have performed reasonably well for these variables.
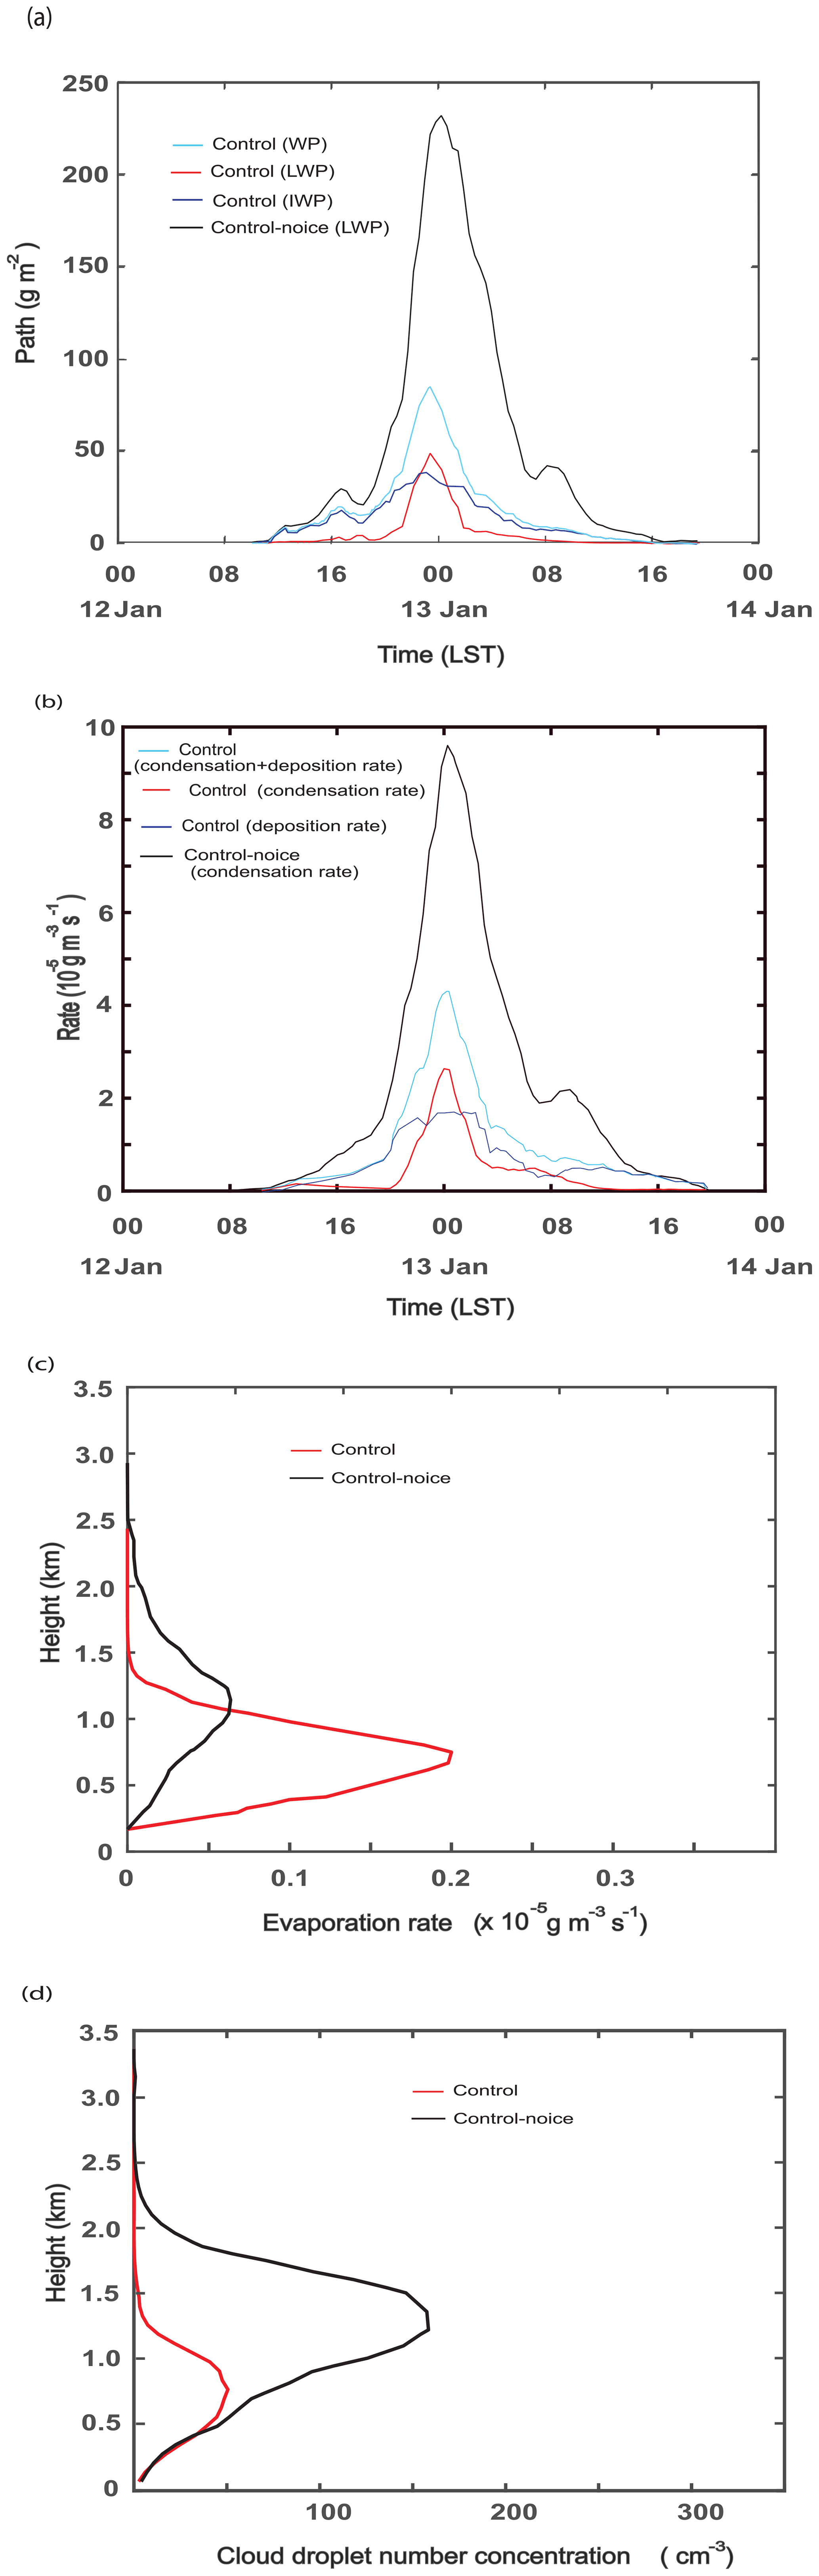
Figure 5Time series of (a) the domain-averaged liquid-water path (LWP), ice-water path (IWP), and water path (WP), which is the sum of LWP and IWP, for the control run and LWP for the control-noice run and (b) the domain-averaged condensation rates, deposition rates, and sum of those rates in the control run and condensation rates in the control-noice run. (c) Vertical distribution of the time- and domain-averaged evaporation rates and (d) the average CDNC over grid points and time steps with non-zero CDNC for the initial stage between 00:00 and 20:00 LST on 12 January.
Condensation and deposition are the main sources of cloud mass in the control run. Since in the control-noice run there are no ice particles, deposition is absent and thus condensation alone acts as the main source of cloud mass. As seen in Fig. 5b, condensation rates in the control-noice run are much higher than the sum of condensation and deposition rates in the control run. Associated with this, there is greater cloud mass in the control-noice run than in the control run, although deposition is absent in the control-noice run. However, at the initial stage before 20:00 LST on 12 January, differences between the sum in the control run and condensation rate in the control-noice run are not as significant compared to those after 20:00 LST on 12 January (Fig. 5b). Hence, those differences increase as time progresses after the initial stage. Those differences are greatest around 00:00 LST on 13 January when the sum in the control run or condensation rate in the control-noice run reaches its maximum value. The differences decrease as time goes by after around 00:00 LST on 13 January. Condensation rate, deposition rate in the control run, and condensation rate in the control-noice run are similar to LWP, IWP in the control run, and LWP in the control-noice run, respectively, in terms of their temporal evolutions (Fig. 5a and b). This similarity confirms that deposition and condensation are the main sources of IWP and LWP, respectively, and control cloud mass. Thus, understanding the evolutions of condensation and deposition is equivalent to understanding those of LWP and IWP, respectively. Hence, in the following, to understand evolutions of cloud mass and its differences between the simulations in this study, we analyze evolutions of condensation, deposition, and their differences between the runs.
The qualitative nature of differences in WP, which represents cloud mass, over the whole simulation period between the control and control-noice runs is initiated and established during the initial stage of cloud development before 20:00 LST on 12 January (Fig. 5a and b). Hence, to understand mechanisms that initiate differences in WP between the control and control-noice runs, deposition, condensation, and associated variables are analyzed for the initial stage. Note that synoptic or environmental conditions such as humidity and temperature are identical between the control and control-noice runs. These conditions act as initial and boundary conditions for the simulations, and thus initial and boundary conditions are identical between the runs. Also, during the initial stage, feedbacks between dynamics (e.g., updrafts) and microphysics just start to form and thus are not fully established compared to those feedbacks after the initial stage. This enables us to perform analyses of deposition and condensation during the initial stage by reasonably excluding a large portion of complexity caused by those feedbacks. Hence, those analyses during the initial stage can provide a clearer picture of either microphysical or dynamic mechanisms that control differences in results between the runs.
During the initial stage before 20:00 LST on 12 January, evaporation rates, averaged over the cloud layer, are higher in the control run than in the control-noice run, and this is contributed by the WBF mechanism which facilitates evaporation of droplets and deposition onto ice crystals (Fig. 5c). In addition, it should be noted that ice crystals consume water vapor that is needed for droplet nucleation. This makes it difficult for droplets to be activated in the control run compared to a situation in the control-noice run. Associated with more evaporation and difficulty in droplet activation, droplets disappear more and form less, leading to a situation where cloud droplet number concentration (CDNC) starts to be lower in the control run during the initial stage (Fig. 5d). This is despite the higher entrainment rate at the PBL tops and associated more with evaporation in the control-noice run than in the control run. The average entrainment rate over all grid points at the PBL tops and over the initial stage is 0.18 and 0.08 cm s−1 in the control-noice and control runs, respectively. In this study, the entrainment rate is calculated as follows:
Here, zi is the PBL height and wsub is the large-scale subsidence rate at the PBL top. Then, during the initial stage, the reduction in CDNC contributes to a reduction in condensation in the control run compared to that in the control-noice run (Fig. 5b). Fewer droplets mean that there is a less integrated droplet surface area where condensation occurs, and this contributes to less condensation in the control run. As seen in Fig. 5c and d, the cloud layer is between ∼ 200 m and ∼ 1.5 km in the control run, while it is between ∼ 200 m and ∼ 2.5 km in the control-noice run. Hence, air parcels go up higher, which also contribute to more condensation in the control-noice run than in the control run. However, aided by the fact that the water-vapor equilibrium saturation pressure is lower for ice particles than for liquid particles, deposition is facilitated at the initial stage in the control run whether the water-vapor pressure is higher than the equilibrium pressure for liquid particles or not as long as the water-vapor pressure is higher than the equilibrium pressure for ice particles. This leads to greater deposition than condensation in the control run at the initial stage (Fig. 5b). This deposition is inefficient, and the subsequent increase in deposition is not sufficient; so, the sum of condensation and deposition rates in the control run is slightly lower than condensation rate in the control-noice run at the initial stage (Fig. 5b); this contributes to slightly lower WP in the control run than in the control-noice run during the initial stage (Fig. 5a). Hence, slightly greater latent heating, which is associated with condensation, in the control-noice run than that in the control run, which is associated with the sum of deposition and condensation, develops during the initial stage. This initiates stronger feedbacks between updrafts and latent heating in the control-noice run than in the control run during the initial stage, and these stronger feedbacks are fully established after the initial stage. This in turn results in much stronger updrafts after the initial stage in the control-noice run than in the control run. Mainly due to these much stronger updrafts after the initial stage, the time- and domain-averaged updrafts over the whole simulation period are also much greater in the control-noice run than in the control run (Fig. 6a). The much stronger updrafts produce much larger WP and associated larger cloud fraction in the control-noice run than in the control run after the initial stage (Fig. 5a).
Results here indicate that the reduced cloud mass, due to the reduced condensation, is not efficiently compensated for by the gain of solid mass via deposition in the control run. If the reduced mass is efficiently compensated for by deposition, that would lead to much smaller differences in WP between the control and control-noice runs. Here, we hypothesize that the inefficient deposition is related to cloud ice number concentration (CINC) as seen in Fig. 6b. Note that the surface of ice crystals is where deposition occurs, and more surface area of ice crystals favors more deposition. We hypothesize that CINC and the associated integrated surface area of ice crystals are not large enough to induce a large amount of deposition that can potentially make WP similar between the control and control-noice runs. Stated differently, it is hypothesized that water vapor is not able to find enough surface area of ice crystals for the large amount of deposition.
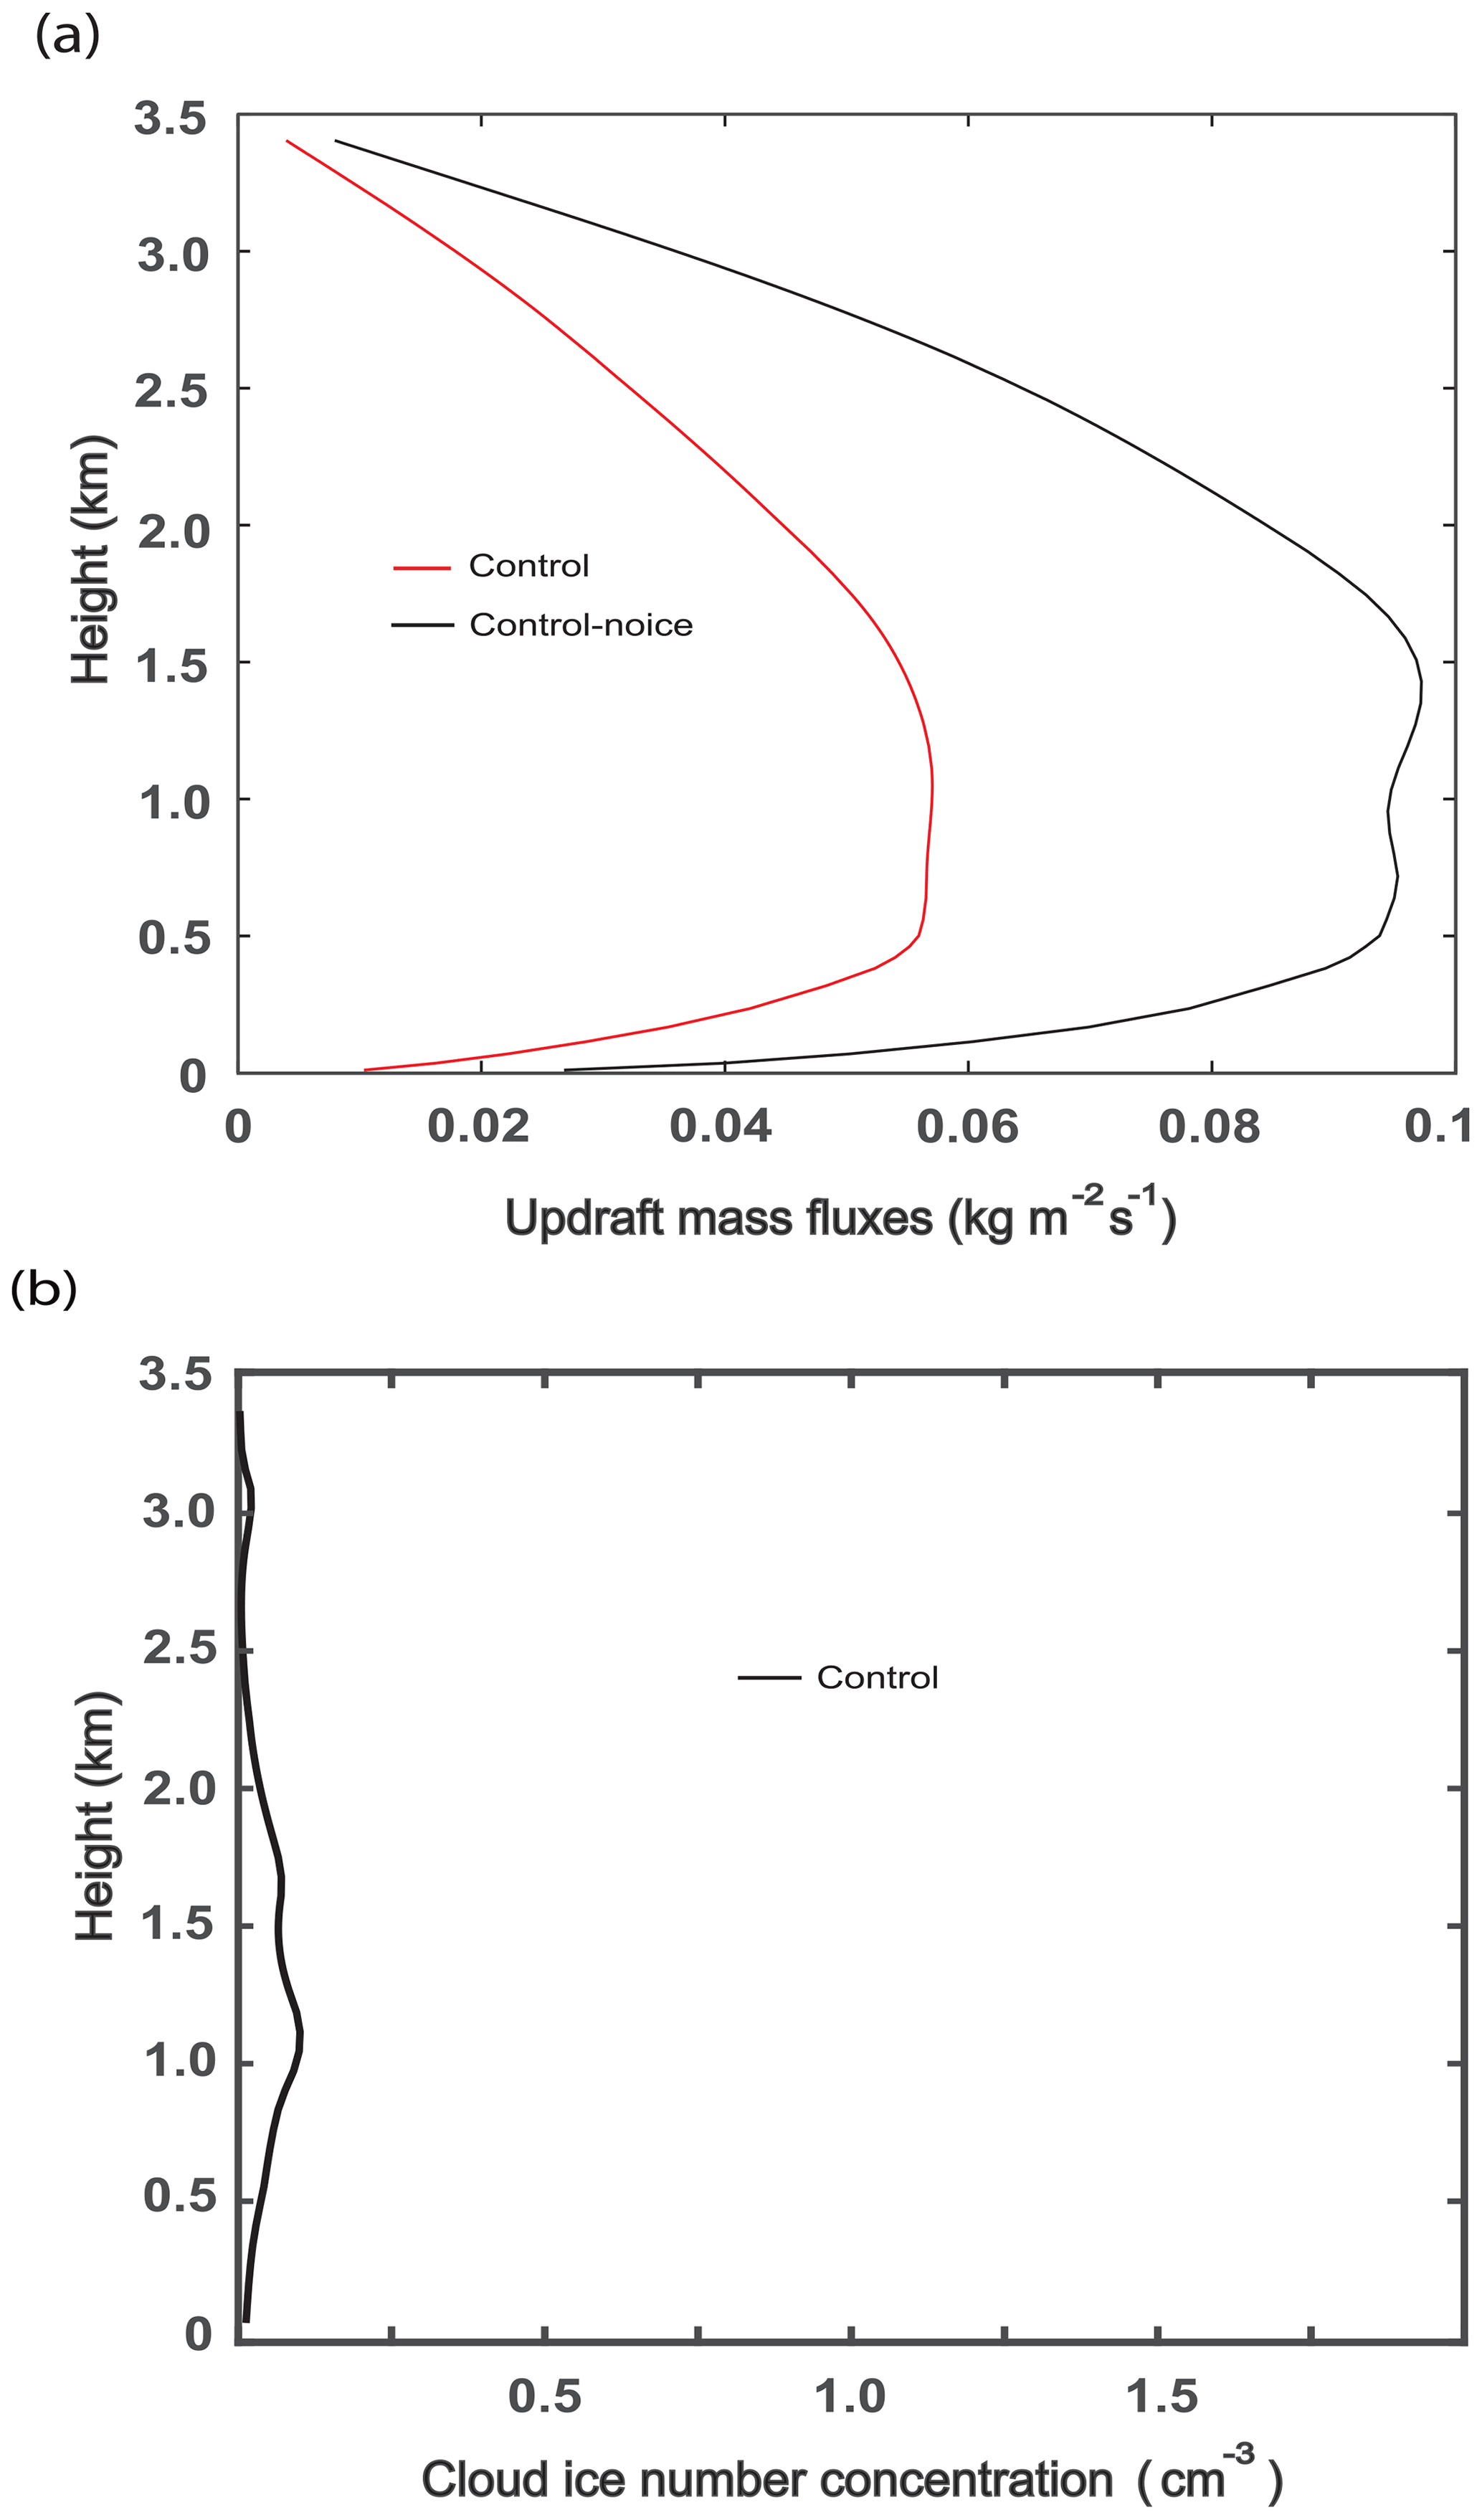
Figure 6Vertical distributions of (a) the time- and domain-averaged updraft mass fluxes for the control and control-noice runs and (b) the average cloud ice number concentration (CINC) over grid points and time steps with non-zero CINC (for the whole domain and simulation period in the control run).
LWP and IWP frequency distributions
As seen in Fig. 7a, the control-noice run has the lower (higher) WP cumulative frequency for WP below (above) ∼ 100 g m−2 than the control run at the last time step. This means that the lower average WP in the control run is mainly due to a reduction in WP above ∼ 100 g m−2 in the control run. The LWP frequency reduces substantially in the control run compared to that in the control-noice run (Fig. 7b). With this reduction, LWP above ∼ 800 g m−2 disappears, and there is in general LWP frequency 2 to 3 orders of magnitude lower for LWP below ∼ 800 g m−2 in the control run than in the control-noice run (Fig. 7b).
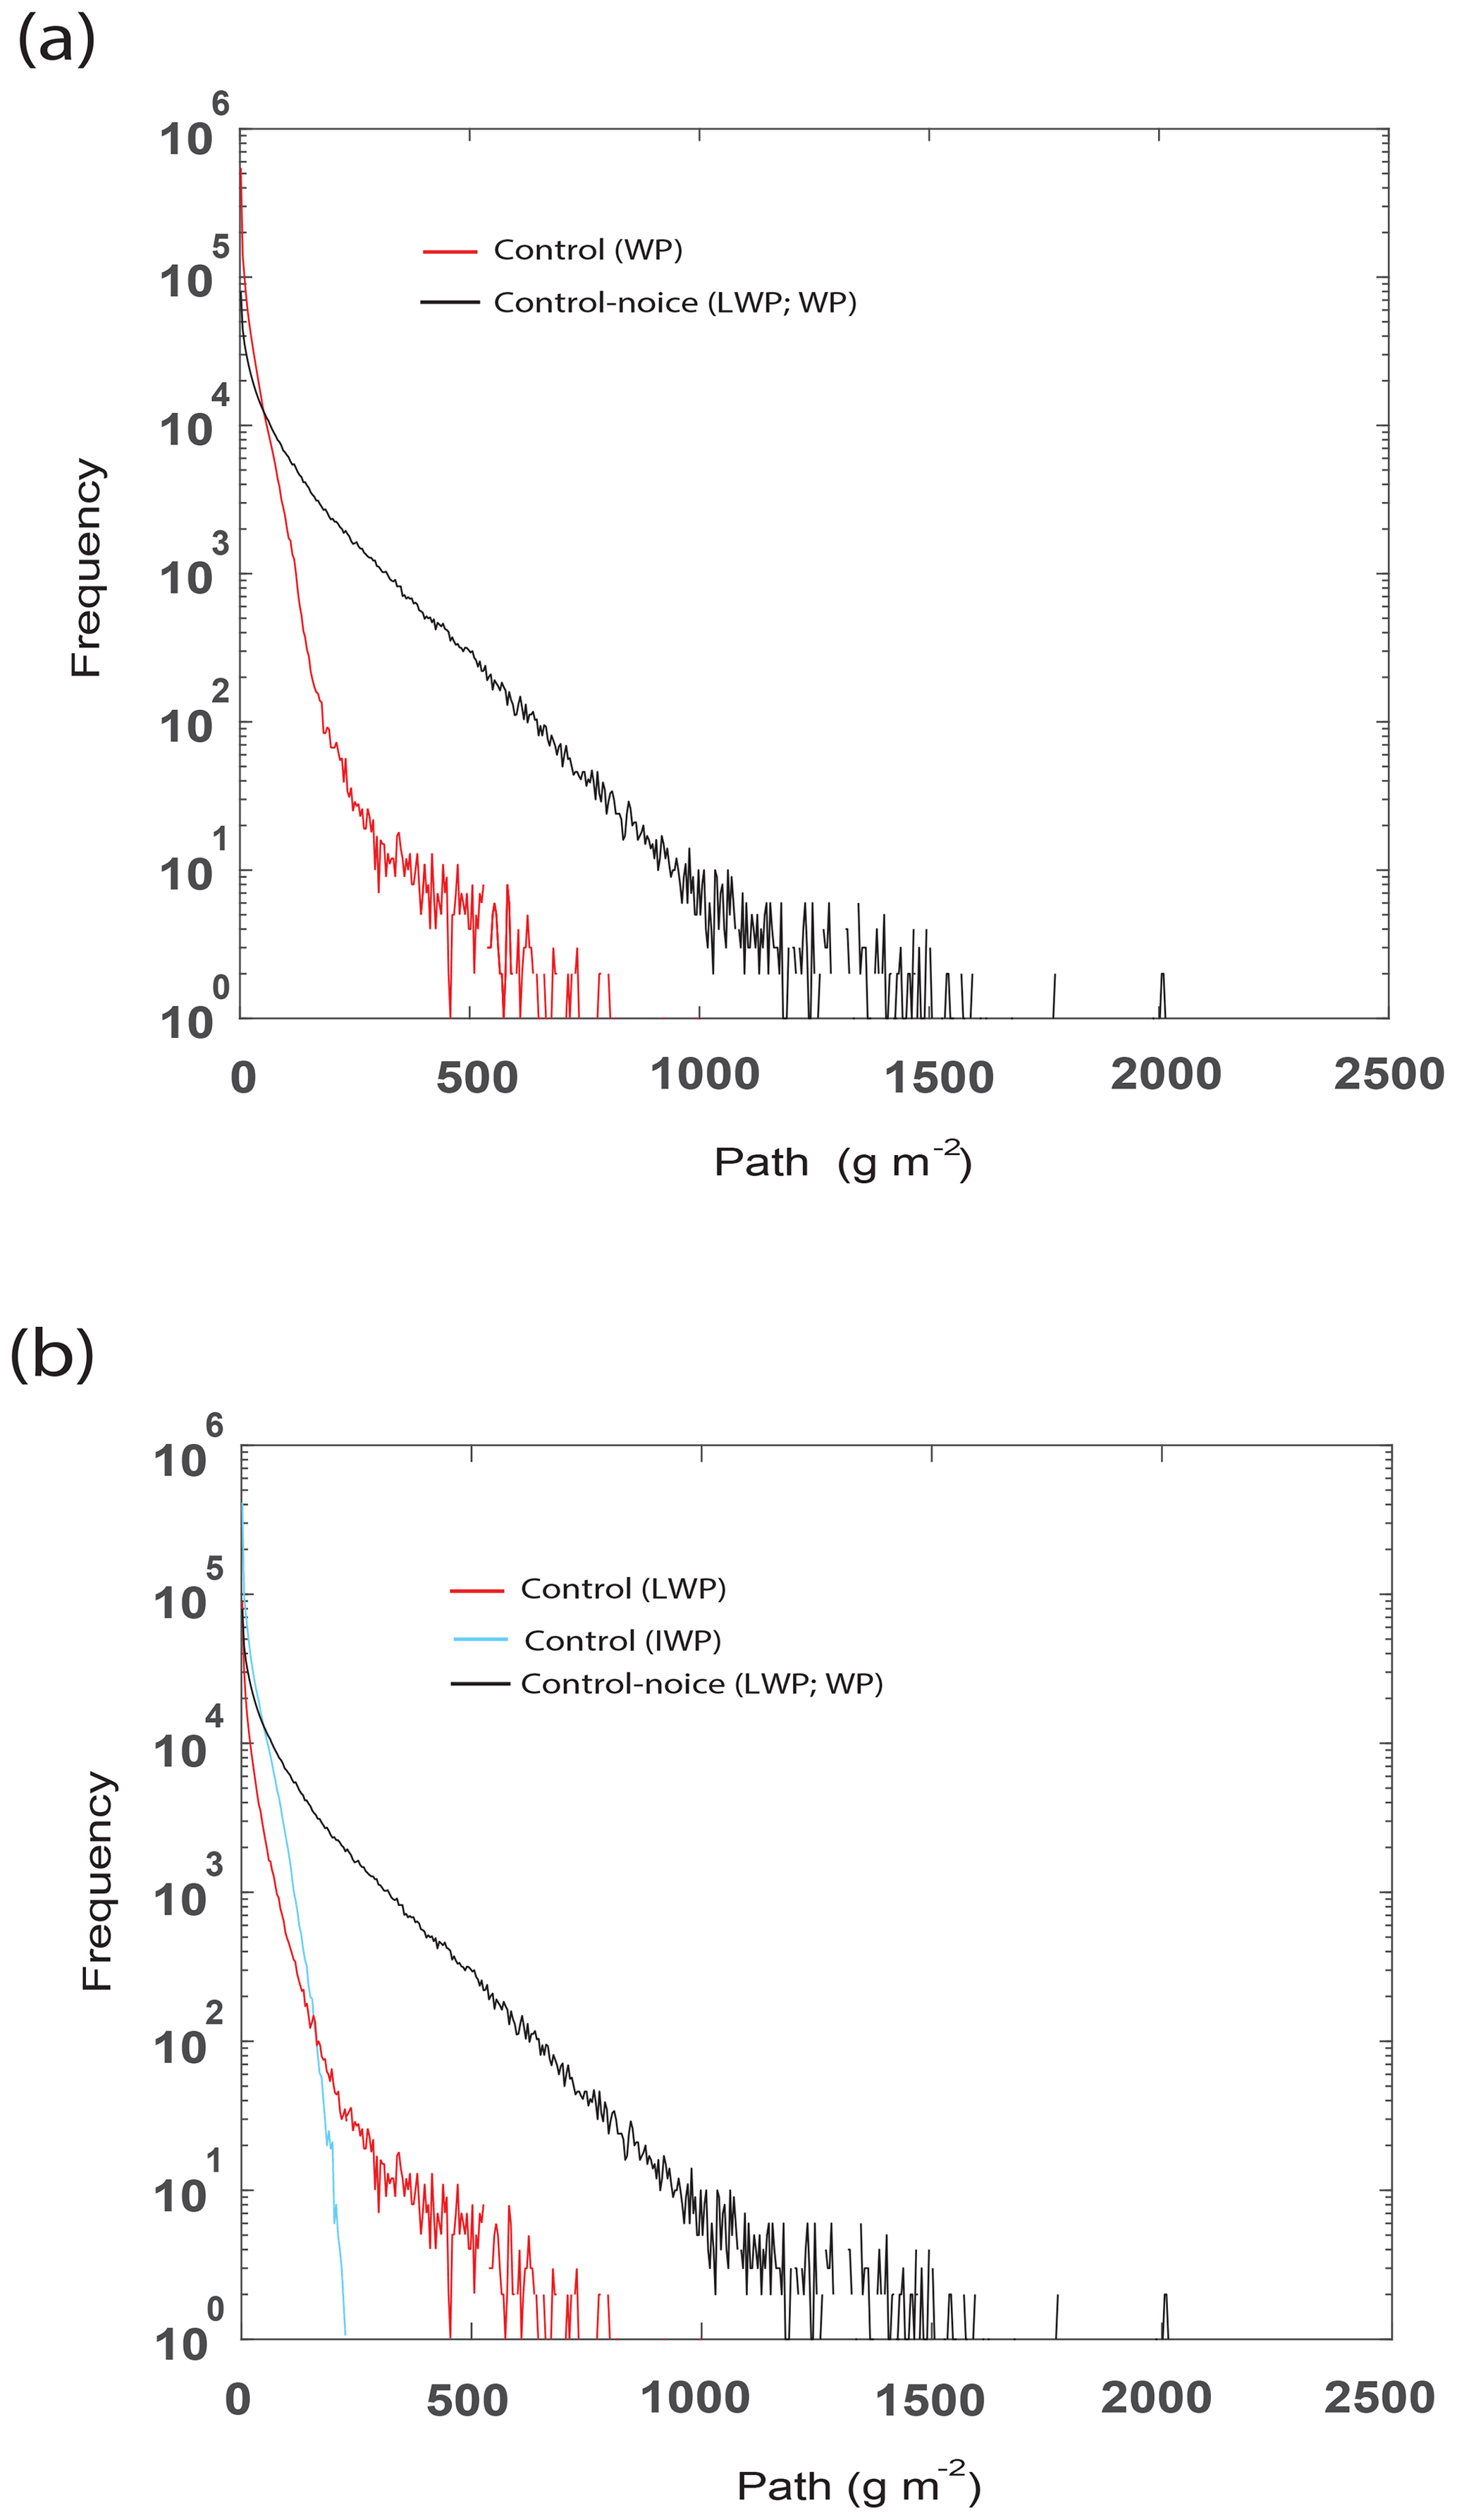
Figure 7Cumulative frequency of (a) WP in the control run and LWP, which is WP, in the control-noice run and (b) LWP and IWP in the control run and LWP in the control-noice run at the last time step.
As seen in Fig. 7b, at the last time step, there is the presence of IWP frequency in addition to the LWP frequency in the control run. Through the facilitated deposition, the IWP frequency is greater than the LWP frequency for IWP below ∼ 200 g m−2 in the control run. Particularly for IWP below ∼ 100 g m−2, the IWP frequency in the control run is greater than the LWP frequency in the control-noice run. This enables greater WP frequency in the control run than in the control-noice run for WP below ∼ 100 g m−2 in spite of the lower LWP frequency below ∼ 100 g m−2 in the control run (Fig. 7a and b). However, the lower IWP frequency for IWP above ∼ 100 g m−2 in the control run than the LWP frequency for LWP above ∼ 100 g m−2 in the control-noice run contributes to the lower WP frequency for WP above ∼ 100 g m−2 in the control run (Fig. 7a and b). The lower WP frequency for WP above ∼ 100 g m−2 in the control run is also contributed by the lower LWP frequency for LWP above ∼ 100 g m−2 in the control run (Fig. 7a and b).
4.1.2 The INP-10 and INP-100 runs
To test the abovementioned hypothesis about the CINC-related inefficient deposition, the control run is compared with the INP-10 and INP-100 runs (Table 1). In particular, in the INP-100 run, the concentration of background aerosols acting as INPs becomes that of background aerosols acting as CCN. This may be unrealistic. However, the main purpose of the INP-10 and INP-100 runs is to test the hypothesis, and it is believed that the high concentrations of background aerosols acting as INPs in the INP-10 and INP-100 runs are able to clearly isolate the role of the INP concentration and CINC in WP by making a stark contrast in the INP concentration and CINC between the control, INP-10, and INP-100 runs.
As seen in Fig. 8a, CINC averaged over grid points and time steps with non-zero CINC increases by a factor of ∼ 5 (∼ 60) when the concentration of background aerosols acting as INPs increases by a factor of 10 (100) from the control run to the INP-10 (INP-100) run. With these increases in CINC, the average radius of ice crystals over grid points and time steps with non-zero CINC decreases by ∼ 15 % and 25 % in the INP-10 and INP-100 runs, respectively. This induces increases in the integrated surface area of ice crystals and thus deposition in the INP-10 and INP-100 runs compared to those in the control run (Figs. 5b, 8b and c). These increases in deposition are more because of greater increases in the integrated surface area in the INP-100 run than in the INP-10 run (Fig. 8b and c). Of interest is that the increase in deposition accompanies a decrease in condensation in the INP-10 and the INP-100 runs compared to that in the control run (Figs. 5b, 8b and c). This is because due to more deposition, more water vapor is transferred from air to ice crystals, which leaves less water vapor for droplet activation and condensation in the INP-10 run and INP-100 runs than in the control run when the water-vapor pressure is higher than the water-vapor saturation pressure for liquid particles in air parcels. Greater deposition leaves less water vapor for droplet activation and condensation, leading to less activation and condensation in the INP-100 run than in the INP-10 run when the water-vapor pressure is higher than the water-vapor saturation pressure for liquid particles in air parcels. When the water-vapor pressure is lower than the water-vapor saturation pressure for liquid particles, increasing deposition induces the increasing evaporation of droplets and decreasing CDNC among the control, INP-10, and INP-100 runs in air parcels. This subsequently contributes to decreasing condensation among those runs when the water-vapor pressure becomes higher than the water-vapor saturation pressure for liquid particles in those air parcels.
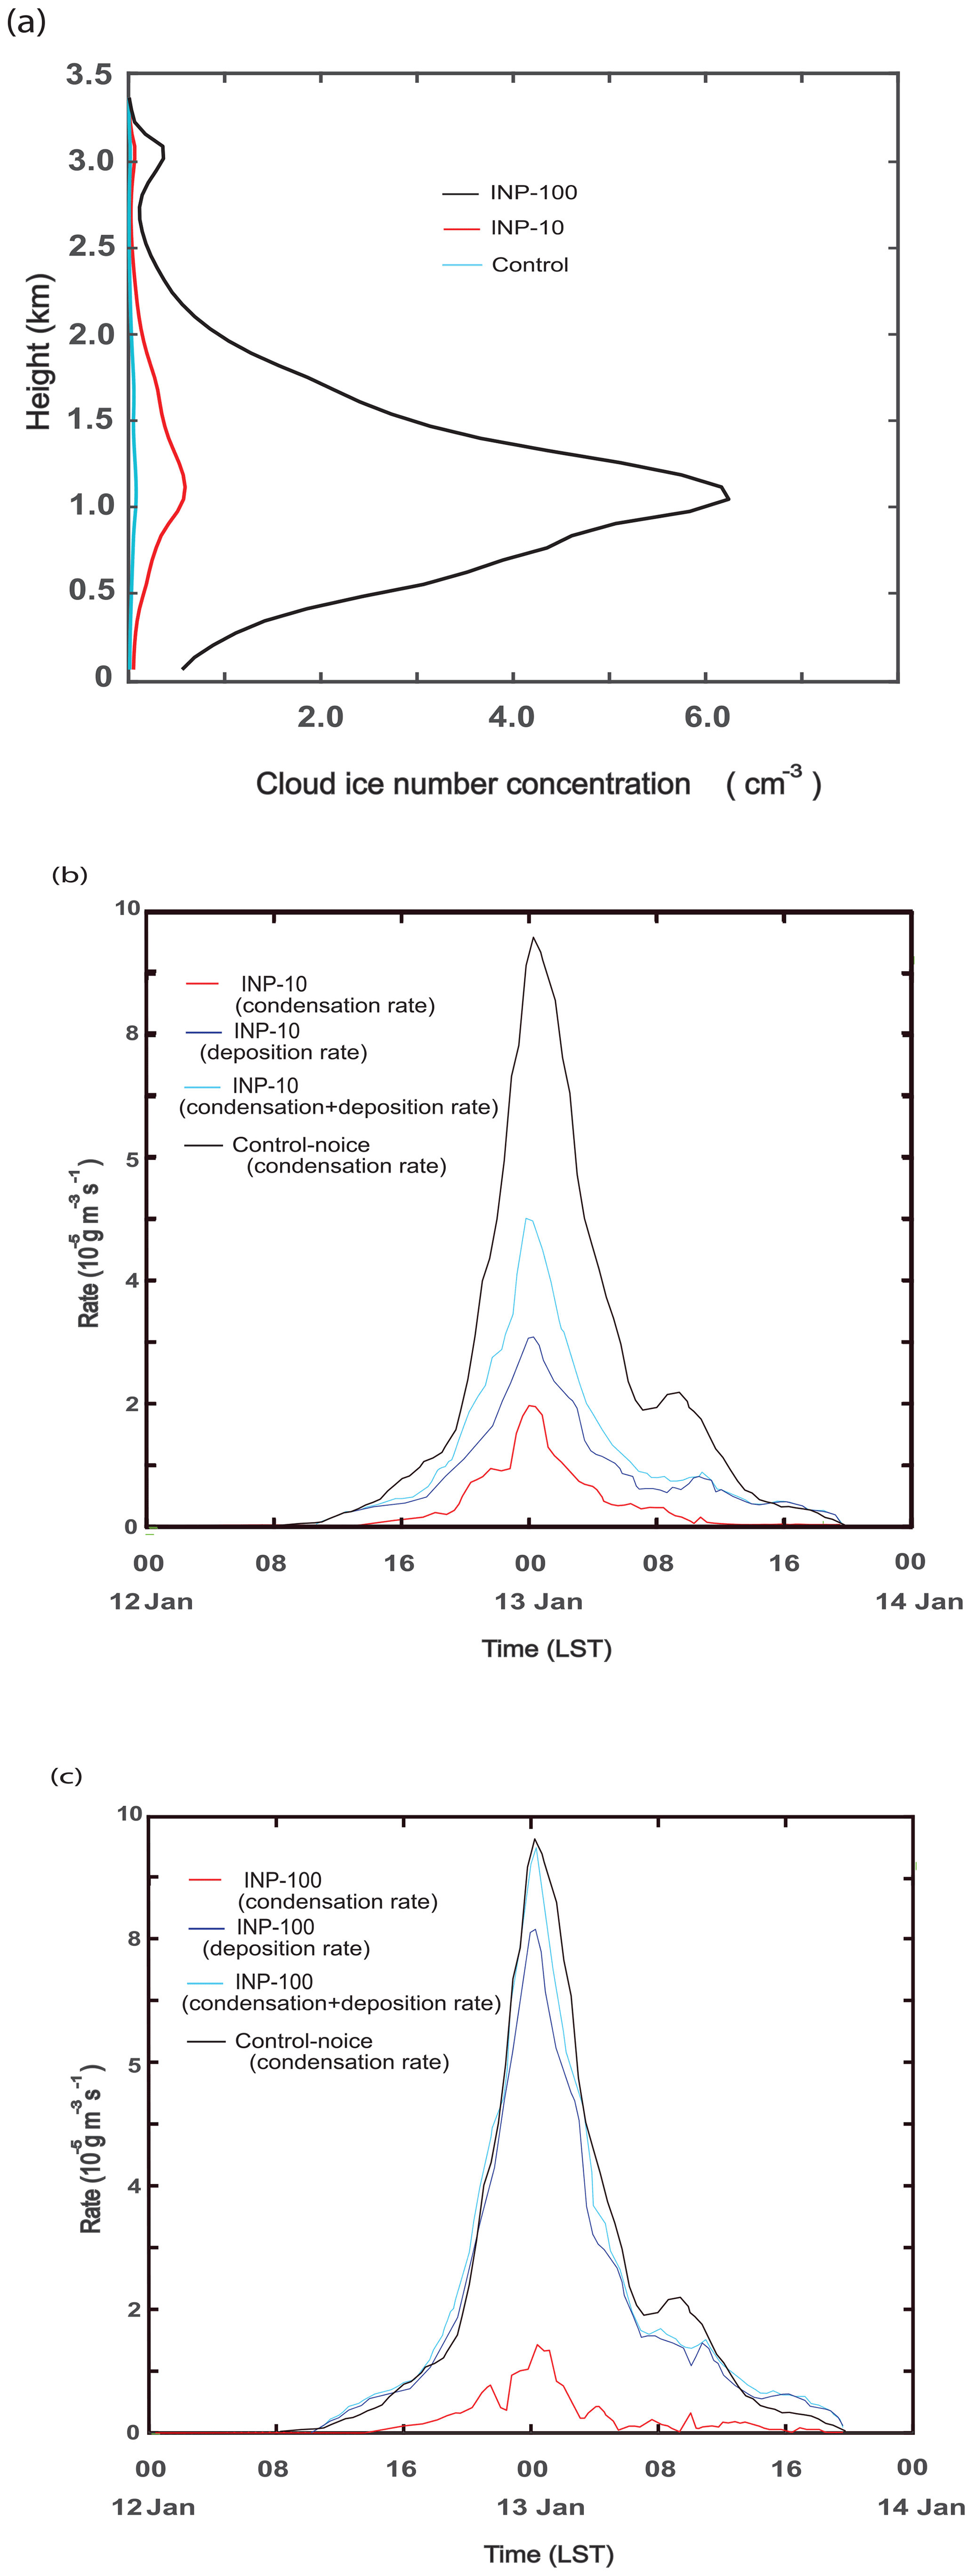
Figure 8(a) Vertical distributions of the average CINC over grid points and time steps with non-zero CINC (for the whole domain and simulation period) in the control, INP-10, and INP-100 runs. Time series of the domain-averaged condensation rates, deposition rates, and the sum of those rates (b) in the INP-10 run and (c) in the INP-100 run. In (b) and (c), condensation rates in the control-noice run are additionally displayed.
Associated with increases in deposition and decreases in condensation, IWP increases and LWP decreases in both of the INP-10 and INP-100 runs compared to those in the control run. The time- and domain-averaged IWP, LWP, and WP are 24 (47), 5 (3), and 29 (50) g m−2 in the INP-10 (INP-100) run. Since there are greater increases in deposition and greater decreases in condensation, these increases in IWP and decreases in LWP are greater in the INP-100 run than in the INP-10 run. The increasing deposition and IWP contribute to increases in WP, while the decreasing condensation and LWP contribute to decreases in WP in the INP-10 and INP-100 runs. Figure 9a shows that there are increases in WP in the INP-10 and INP-100 runs compared to WP in the control run, and those increases are greater in the INP-100 run than in the INP-10 run. This means that the increases in deposition and IWP outweigh the decreases in condensation and LWP, respectively, in the INP-10 and INP-100 runs. This outweighing is greater and leads to greater increases in WP in the INP-100 run than in the INP-10 run (Fig. 9a). As seen in Fig. 9a, the enhanced average WP in the INP-100 (INP-10) run reaches 91 % (53 %) of that in the control-noice run, while the average WP in the control run accounts for only ∼ 30 % of that in the control-noice run. Associated with the enhanced average WP, the average cloud fraction over time steps with non-zero cloud fraction increases from 0.92 in the control run to 0.97 (0.94) in the INP-100 (INP-10) run. Accompanying this is that the time- and domain-averaged updraft mass flux in the INP-100 (INP-10) run over the whole simulation period reaches 95 % (78 %) of that in the control-noice run, while the average updraft mass flux in the control run accounts for only ∼ 50 % of that in the control-noice run. The average cloud-top height over grid columns and time steps with non-zero cloud-top height in the INP-100 (INP-10) run, particularly over the initial stage between 00:00 LST and 20:00 LST on 12 January, reaches 92 % (80 %) of that in the control-noice run. Hence, the increasing deposition in the INP-10 and INP-100 runs involves its positive feedbacks with dynamics (i.e., updrafts). This eventually enables air parcels in the INP-100 run to have stronger updrafts than those in the control run and thus to go up nearly as high as those in the control-noice run. Through the positive feedbacks between the increasing deposition and dynamics, increasing dynamic intensity with the increasing vertical extent of air parcels or clouds in turn enables deposition and IWP to further increase, resulting in the similar WP and cloud fraction between the INP-100 and control-noice runs. Here, comparisons among the control, INP-10, and INP-100 runs confirm the hypothesis that ascribes much lower WP in the control run than in the control-noice run to the CINC-related inefficient deposition in the control run.
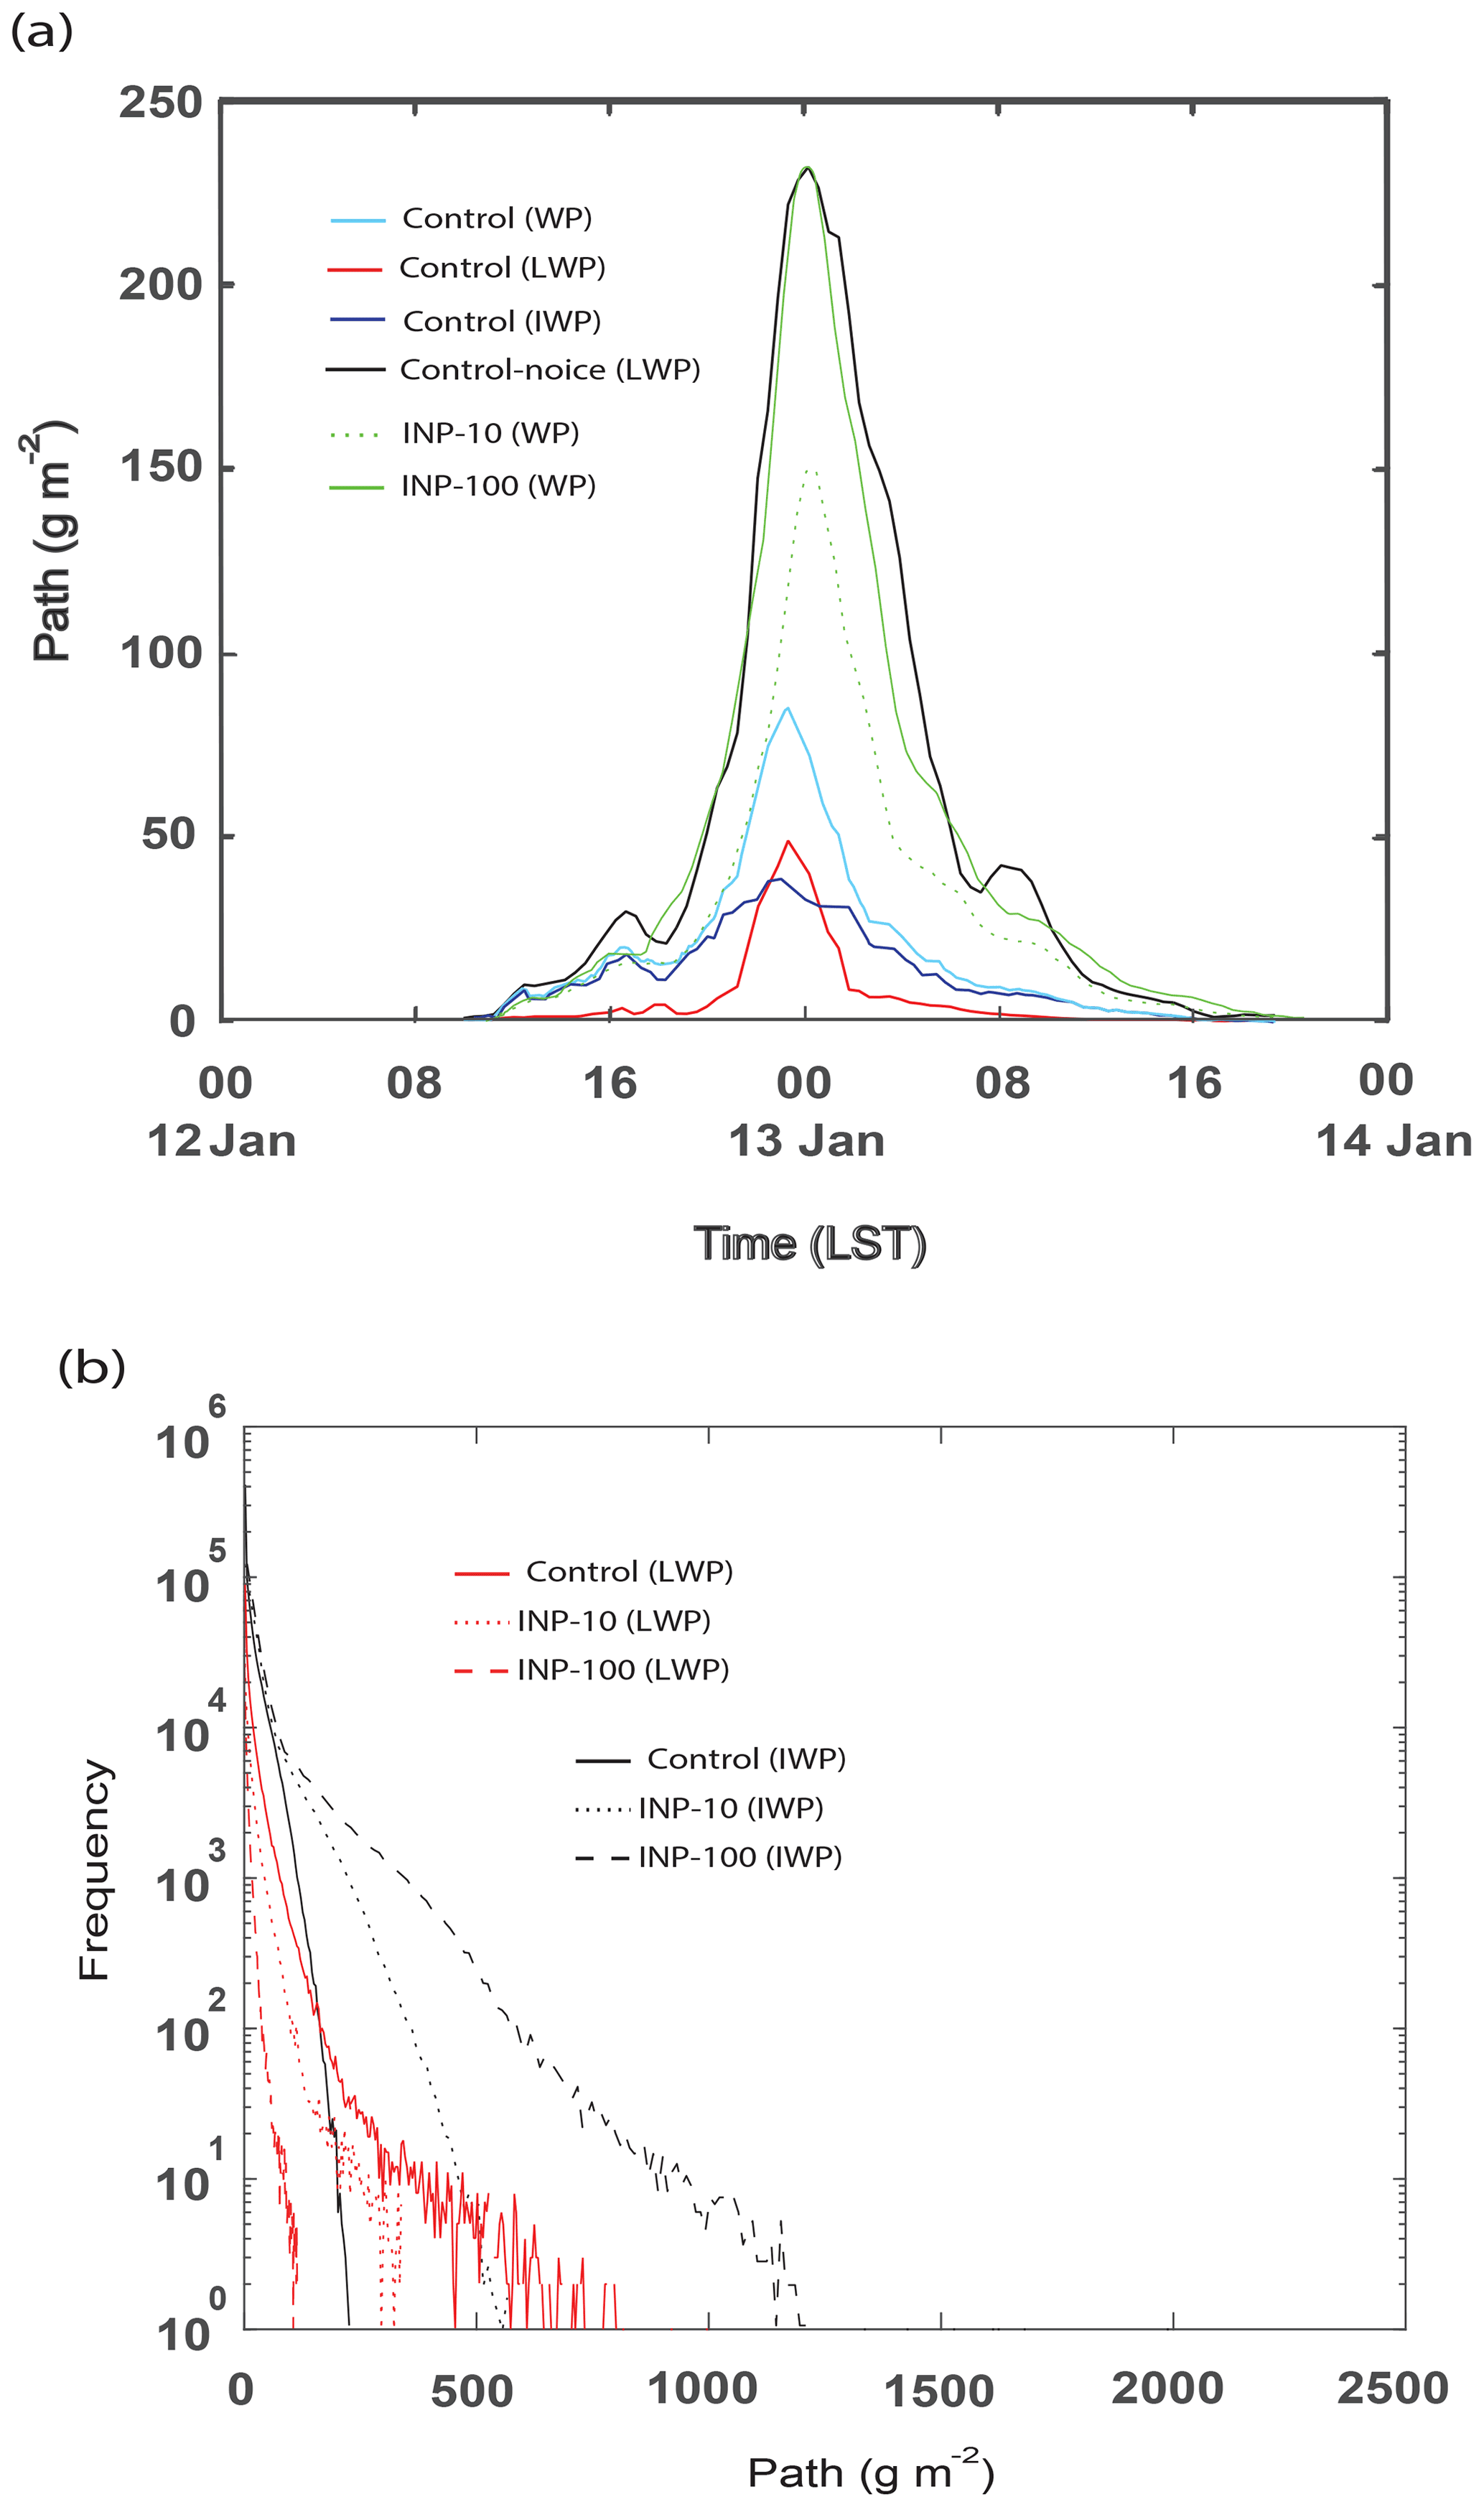
Figure 9(a) Time series of the domain-averaged LWP, IWP, and WP for the control run; LWP for the control-noice run; and WP for the INP-10 and INP-100 runs. (b) Cumulative frequency of LWP, IWP, and WP for the control, INP-10, and INP-100 runs at the last time step.
LWP and IWP frequency distributions
With the increasing concentration of aerosols acting as INPs and CINC from the control run to the INP-10 run to the INP-100 run, there are substantial increases in the IWP cumulative frequency, while there are substantial decreases in the LWP cumulative frequency at the last time step (Fig. 9b). These increases in the IWP frequency accompany increases in the IWP maximum value from ∼ 200 g m−2 in the control run to ∼ 1200 g m−2 in the INP-100 run through ∼ 500 g m−2 in the INP-10 run (Fig. 9b). These decreases in the LWP frequency accompany decreases in the LWP maximum value from ∼ 700 g m−2 in the control run to ∼ 100 g m−2 in the INP-100 run through ∼ 300 g m−2 in the INP-10 run (Fig. 9b). The increases in the IWP frequency outweigh decreases in the LWP frequency between the INP-10 and INP-100 runs (the INP-10 and control runs), leading to the greater average WP in the INP-100 run than in the INP-10 run (in the INP-10 run than in the control run).
4.1.3 Sedimentation of hydrometeors
With increasing concentrations of aerosols acting as INPs between the control, INP-10, and INP-100 runs, there are changes in the sedimentation of ice particles, and this induces changes in the precipitation rate at cloud bases. The average precipitation rate over all grid points at cloud bases and over the whole simulation period is 0.004, 0.002, and 0.0006 g m−2 s−1 in the control, INP-10, and INP-100 runs, respectively. As mentioned above, there are also changes in the deposition rate among those simulations. The time- and column-averaged deposition rate is 0.027, 0.059, and 0.125 g m−2 s−1 in the control, INP-10, and INP-100 runs, respectively. As a first step to obtain the column average of a variable, at each time step, the average value of the variable over each column is obtained by summing up the value of the variable over the vertical domain in each of all columns in the domain and dividing the sum by the total number of grid points in each column. This sum of the value is obtained over all grid points in the vertical domain whether they have zero values of the variable or not. The column average in this study is the average value (in each column) that is summed up over all columns and divided by the total number of columns in the domain.
We see that the change in deposition rate from the control run to the INP-10 run (to the INP-100 run) is 16 (29) times greater than that in the cloud-base precipitation rate. Hence, the varying sedimentation of ice particles and associated precipitation is likely to play an insignificant role in the varying cloud mass among the runs compared to the varying deposition. To confirm this, the control, INP-10, and INP-100 runs are repeated by setting the fall velocity of ice particles to zero. These repeated runs are the control-no-sedim and INP-10-no-sedim and INP-100-no-sedim runs. The time- and domain-averaged IWP, LWP, and WP are 11 (14), 7 (5), and 18 (19) g m−2, respectively, in the control (control-no-sedim) run. The time- and domain-averaged IWP, LWP, and WP are 26 (49), 4 (2), and 30 (51) g m−2, respectively, in the INP-10-no-sedim (INP-100-no-sedim) run. Remember that the time- and domain-averaged IWP, LWP, and WP are 24 (47), 5 (3), and 29 (50) g m−2, respectively, in the INP-10 (INP-100) run. The presence of the sedimentation decreases IWP and increases LWP compared to the situation with no sedimentation for each of the runs. However, the average WP in the control-no-sedim run is still much lower than that in the control-noice run. The average WP in the INP-100-no-sedim run (the INP-10-no-sedim run) reaches 93 % (55 %) of that in the control-noice run, and this is similar to the situation among the INP-10, INP-100, and control-noice runs. This demonstrates that the sedimentation of ice particles and associated precipitation are not main factors that control the variation in cloud mass among the control, INP-10, INP-100, and control-noice runs.
To further examine the role played by the sedimentation of hydrometeors particularly in the lower WP in the control run than that in the control-noice run, the control run is repeated again by setting the fall velocity of both ice and liquid particles to zero. The repeated run is the control-no-sedim-ice-liq run. The time- and domain-averaged IWP, LWP, and WP are 11 (15), 7 (9), and 18 (24) g m−2, respectively, in the control (control-no-sedim-ice-liq) run. The presence of the sedimentation of both ice and liquid particles decreases both IWP and LWP compared to the situation with no sedimentation of both ice and liquid particles. However, the average WP in the control-no-sedim-ice-liq run is still much lower than that in the control-noice run. Hence, the lower WP in the control run than that in the control-noice run does not depend on whether the sedimentation of both ice and liquid particles is present in the control run. This indicates that the sedimentation of both ice and liquid particles is not a factor that causes the lower WP in the control run than in the control-noice run.
4.2 Aerosol–cloud interactions
4.2.1 CCN
With advection-induced increases in aerosol concentrations between the control and low-aerosol runs, there are aerosol-induced increases and decreases in IWP and LWP, respectively (Fig. 10a). The increases in IWP are outweighed by the decreases in LWP, leading to aerosol-induced decreases in the average WP between the ice runs. This involves aerosol-induced decreases in the average cloud fraction over time steps with non-zero cloud fraction from 0.93 in the low-aerosol run to 0.92 in the control run. As seen in Fig. 10b, the WP frequency is greater in particular for WP < ∼ 300 g m−2, leading to the higher average WP in the low-aerosol run than in the control run. As seen in Fig. 10c, particularly for WP below ∼ 200 g m−2, the IWP frequency increases, while the LWP frequency decreases with increasing aerosols between the ice runs. The increase in the IWP frequency is not able to outweigh the decrease in the LWP frequency, leading to aerosol-induced decreases in the average WP between the ice runs. Results here are contrary to the conventional wisdom that increasing concentrations of aerosols acting as CCN tend to increase WP in stratiform clouds (Albrecht, 1989).
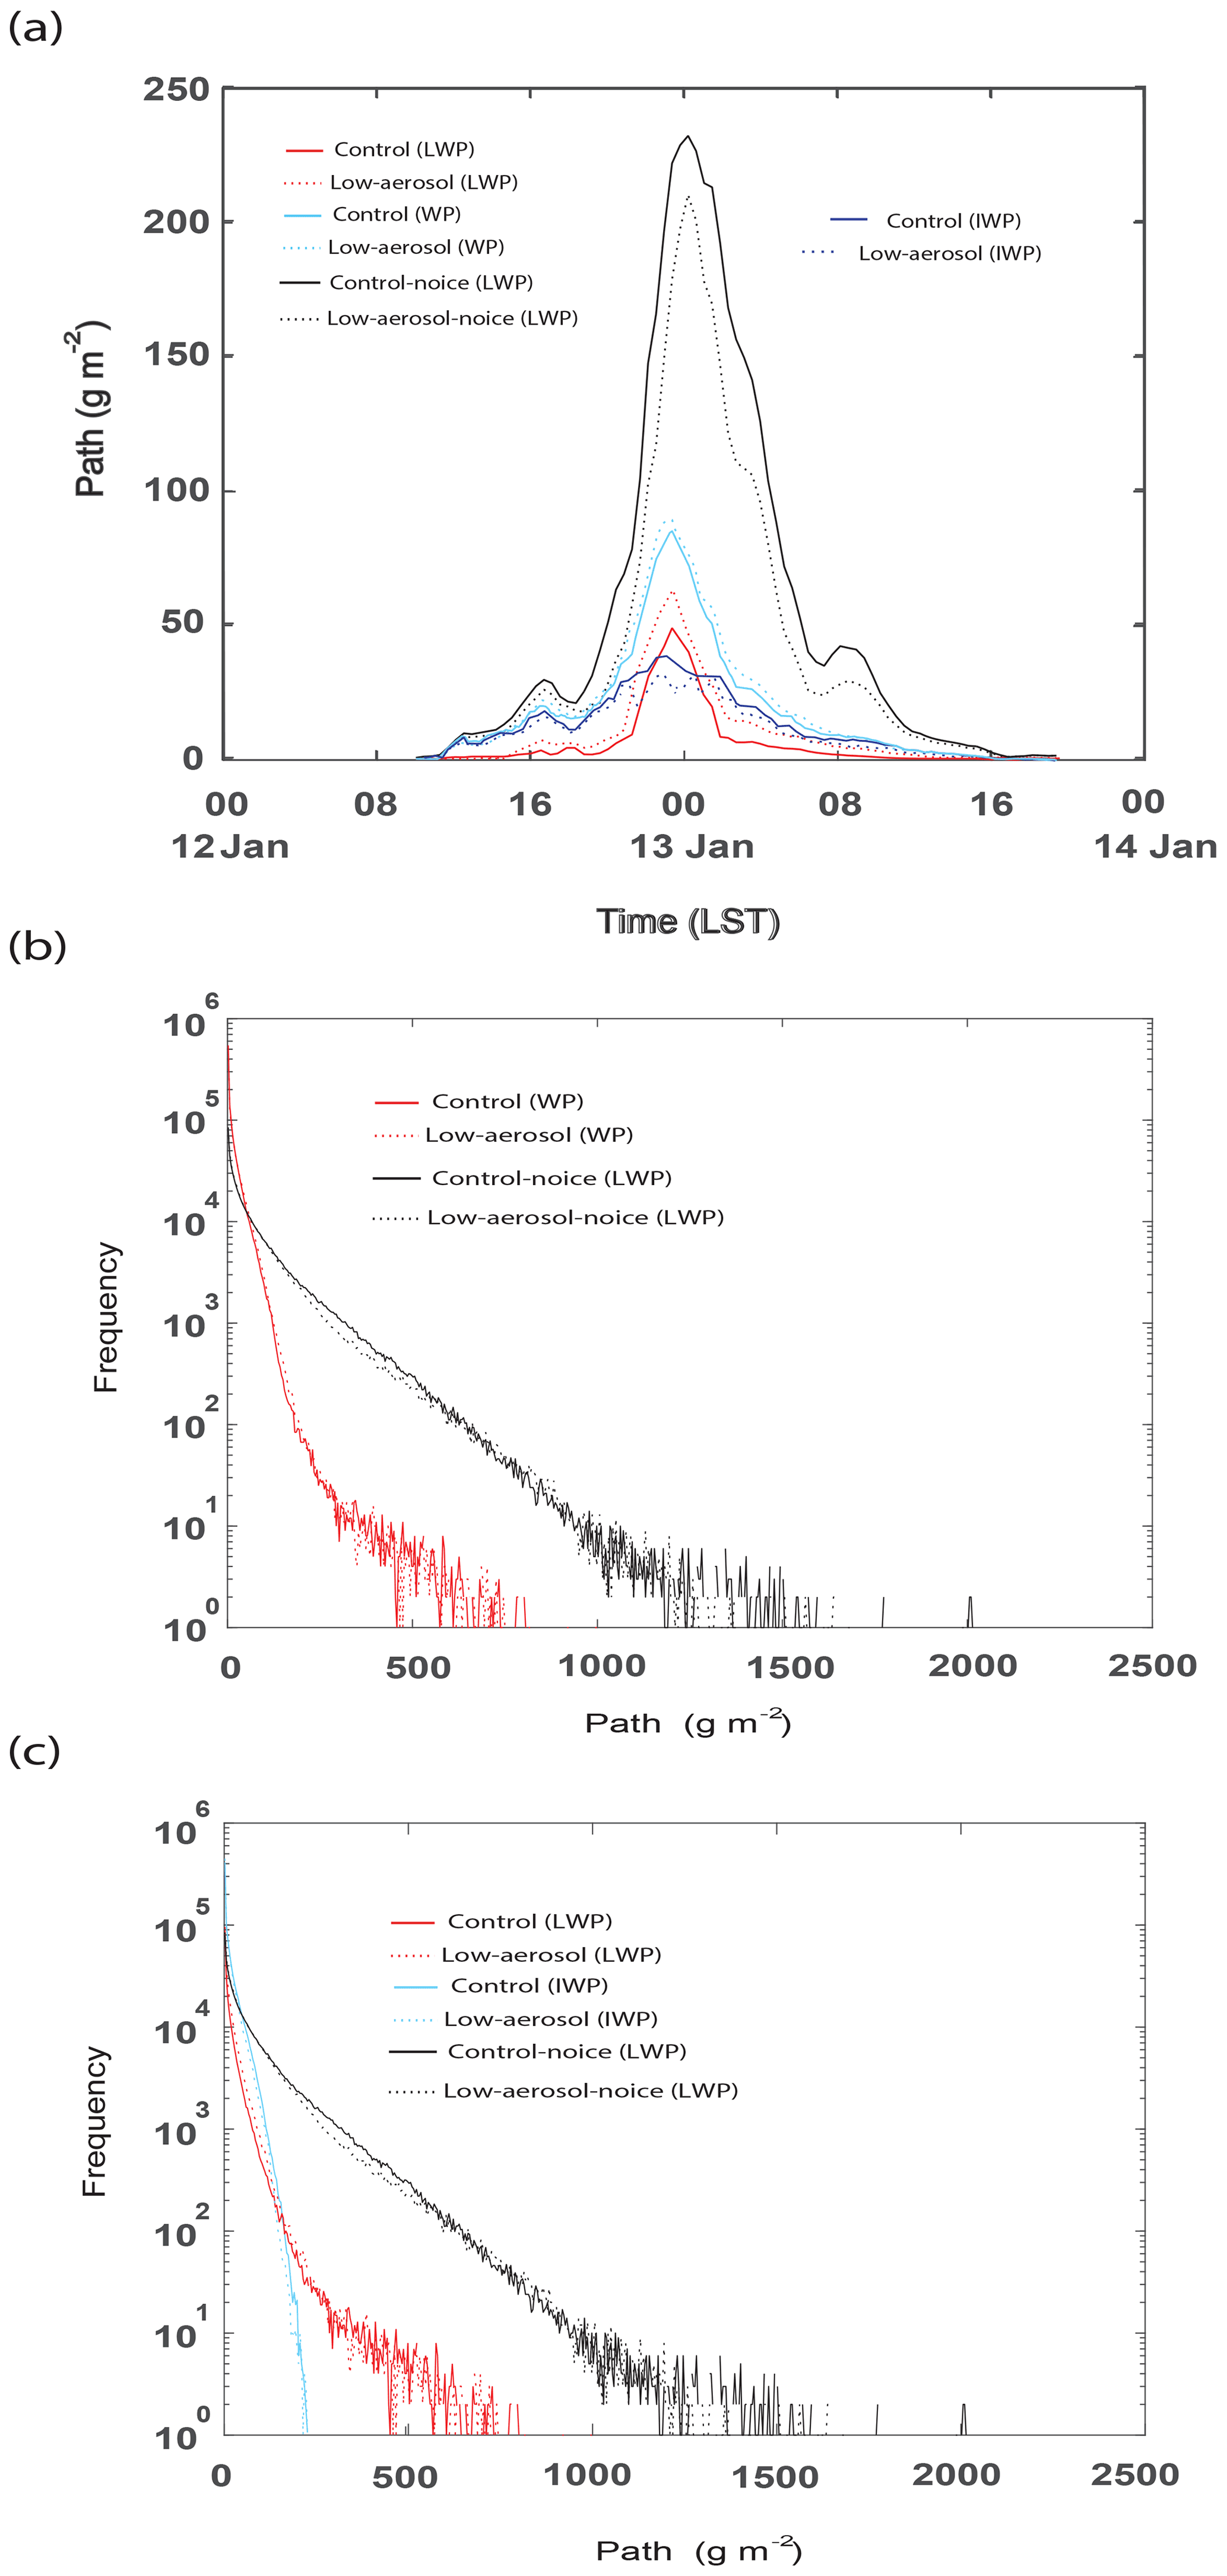
Figure 10(a) Time series of the domain-averaged LWP, IWP, and WP for the control and low-aerosol runs and LWP, which is also WP, for the control-noice and low-aerosol-noice runs. (b) Cumulative frequency of WP for the control, low-aerosol, control-noice, and low-aerosol-noice runs, and (c) LWP and IWP for the control and low-aerosol runs and LWP in the control-noice and low-aerosol-noice runs at the last time step.
Between the noice runs, there is an increase in LWP (i.e., WP), with the increasing concentration of aerosols acting as CCN (Fig. 10a). This involves aerosol-induced increases in the average cloud fraction over time steps with non-zero cloud fraction from 0.96 in the low-aerosol-noice run to 0.98 in the control-noice run. The greater LWP frequency, concentrated in the LWP range between ∼ 100 and ∼ 600 g m−2, leads to the greater average LWP or WP in the control-noice run than in the low-aerosol-noice run (Fig. 10b and c).
(a) Ice runs
(1) Condensation and evaporation
The qualitative nature of aerosol-induced differences in deposition, IWP,
condensation, and LWP over the whole simulation period between the ice runs
is initiated and established during the initial stage of cloud development
before 20:00 LST on 12 January (Fig. 10a). To understand mechanisms
that control aerosol-induced differences in deposition and condensation as a
way of understanding mechanisms that control those differences in IWP and
LWP, the time series of deposition rate, condensation rate, and associated
variables in each of the ice runs and differences in these variables between
the ice runs are obtained for the initial stage. Since this study focuses on
these differences in the variables as a representation of aerosol effects on
clouds, in the following, the description of the differences is given in
more detail by involving both figures and text compared to the
description of the variables in each of the ice runs, involving text only
for the sake of brevity.
(i) CDNC and its relation to condensation and evaporation
Evaporation and condensation rates are higher in the control run than in the low-aerosol run throughout the initial stage and up to ∼ 15:30 LST on 12 January, respectively (Fig. 11a). Increases in evaporation tend to make more droplets disappear, while increases in aerosol activation and resultant condensation counteract the disappearance more. The average CDNC over grid points and time steps with non-zero CDNC is larger in the control run than in the low-aerosol run not only over the initial stage but also over the whole simulation period (Figs. 11a and 12a). This means that on average, the evaporatively driven increases in the disappearance of droplets are outweighed by the activation-enhanced and/or condensationally enhanced counteraction, particularly during the initial stage with increasing aerosol concentrations between the ice runs. As marked by a green dashed box in Fig. 11a, there are steady and rapid temporal increases in the CDNC differences between the ice runs over a period from 12:50 to 13:20 LST on 12 January. This is due to steady and rapid temporal increases in CDNC, which are larger in the control run than in the low-aerosol run, over the period. More droplets or higher CDNC provide a larger integrated surface area of droplets where evaporation and condensation of droplets occur and thus act as more sources of evaporation and condensation. With steady and rapid temporal increases in CDNC as a source of evaporation and condensation, temporal increases in both evaporation and condensation show a jump (or a surge or a rapid increase) in them for the period between 12:50 and 13:20 LST on 12 January in each of the ice runs (Supplement Fig. S1). Here, evaporation occurs at grid points where the water-vapor pressure is lower than the water-vapor equilibrium saturation pressure for liquid particles and thus the WBF mechanism can occur, while condensation occurs at grid points where the water-vapor pressure is higher than the water-vapor equilibrium saturation pressure for liquid particles. This jump is higher associated with the larger temporal increase in CDNC in the control run than in the low-aerosol run (Supplement Fig. S1). This induces differences in evaporation and condensation between the ice runs to jump, as also marked by the green dashed box in Fig. 11a, during the time period.
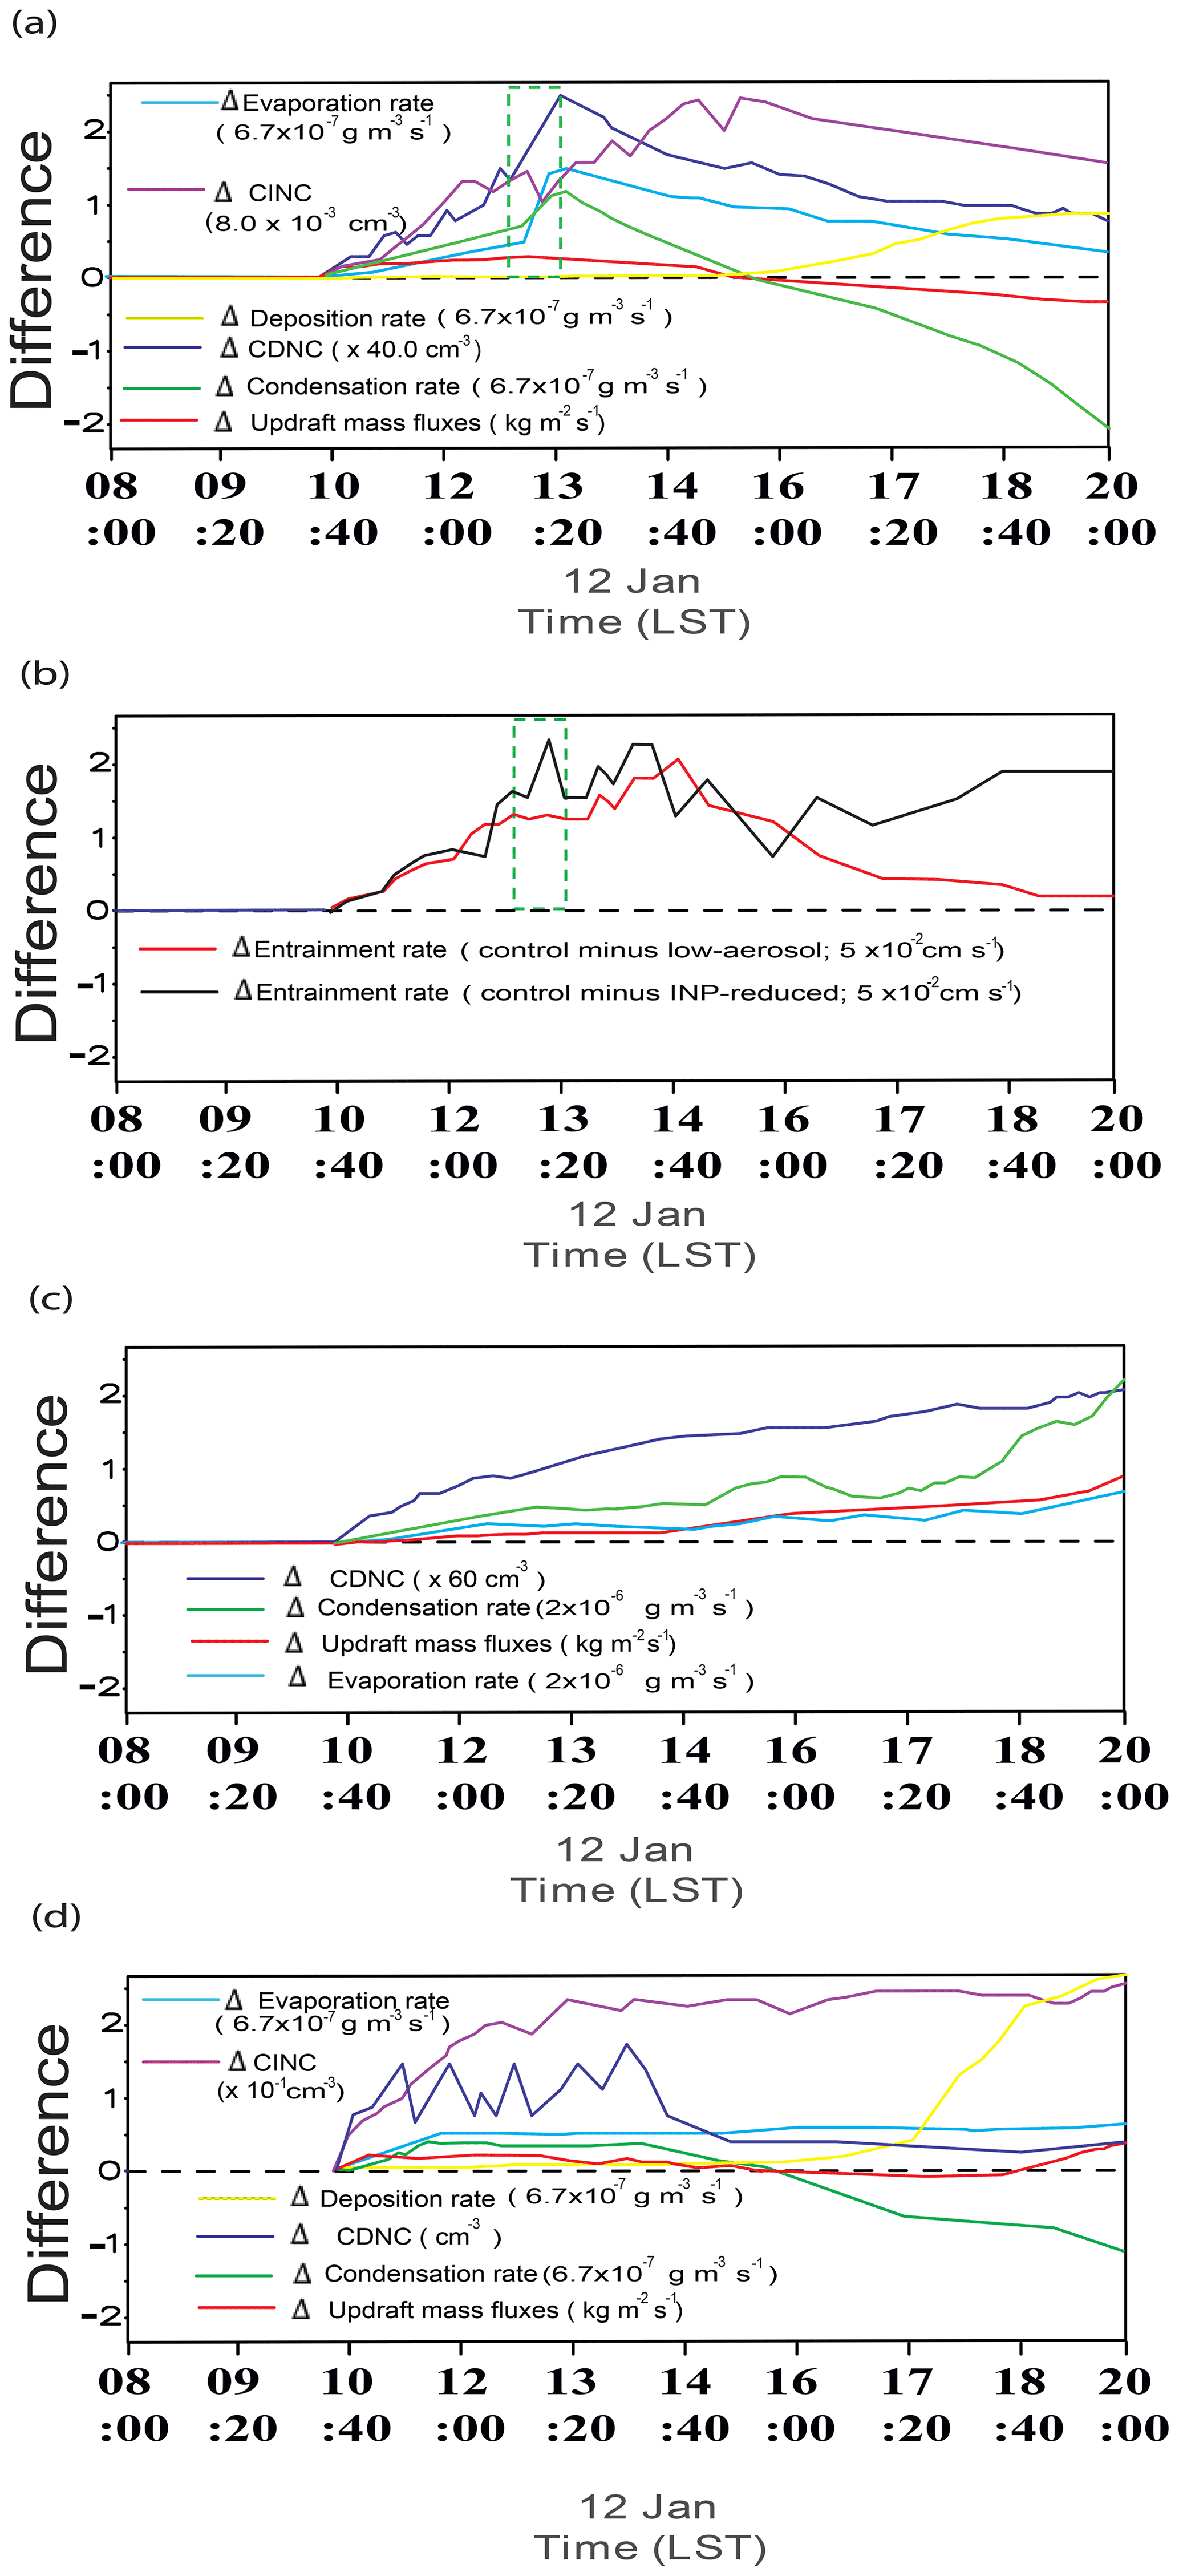
Figure 11(a) Time series of differences in the domain-averaged updraft mass fluxes, deposition, condensation, and evaporation rates, the average CDNC (CINC) over grid points with non-zero CDNC (CINC) between the control and low-aerosol runs (the control run minus the low-aerosol run). (b) Time series of differences in the average entrainment rate over all grid points at the PBL tops between the control and low-aerosol runs (the control run minus the low-aerosol run) and between the control and INP-reduced runs (the control run minus the INP-reduced run). (c) Same as (a) but between the control-noice and low-aerosol-noice runs (the control-noice run minus the low-aerosol-noice run) and (d) same as (a) but between the control and INP-reduced runs (the control run minus the INP-reduced run). Dashed lines in (a), (b), (c), and (d) represent zero differences. In (c), due to the absence of ice processes in the noice runs, differences in deposition rates and CINC are absent. A green dashed box in (a) and (b) marks a time period when steady and rapid temporal increases in the CDNC differences and a jump in differences in each of condensation and evaporation rates between the control and low-aerosol runs occur (see text for details).
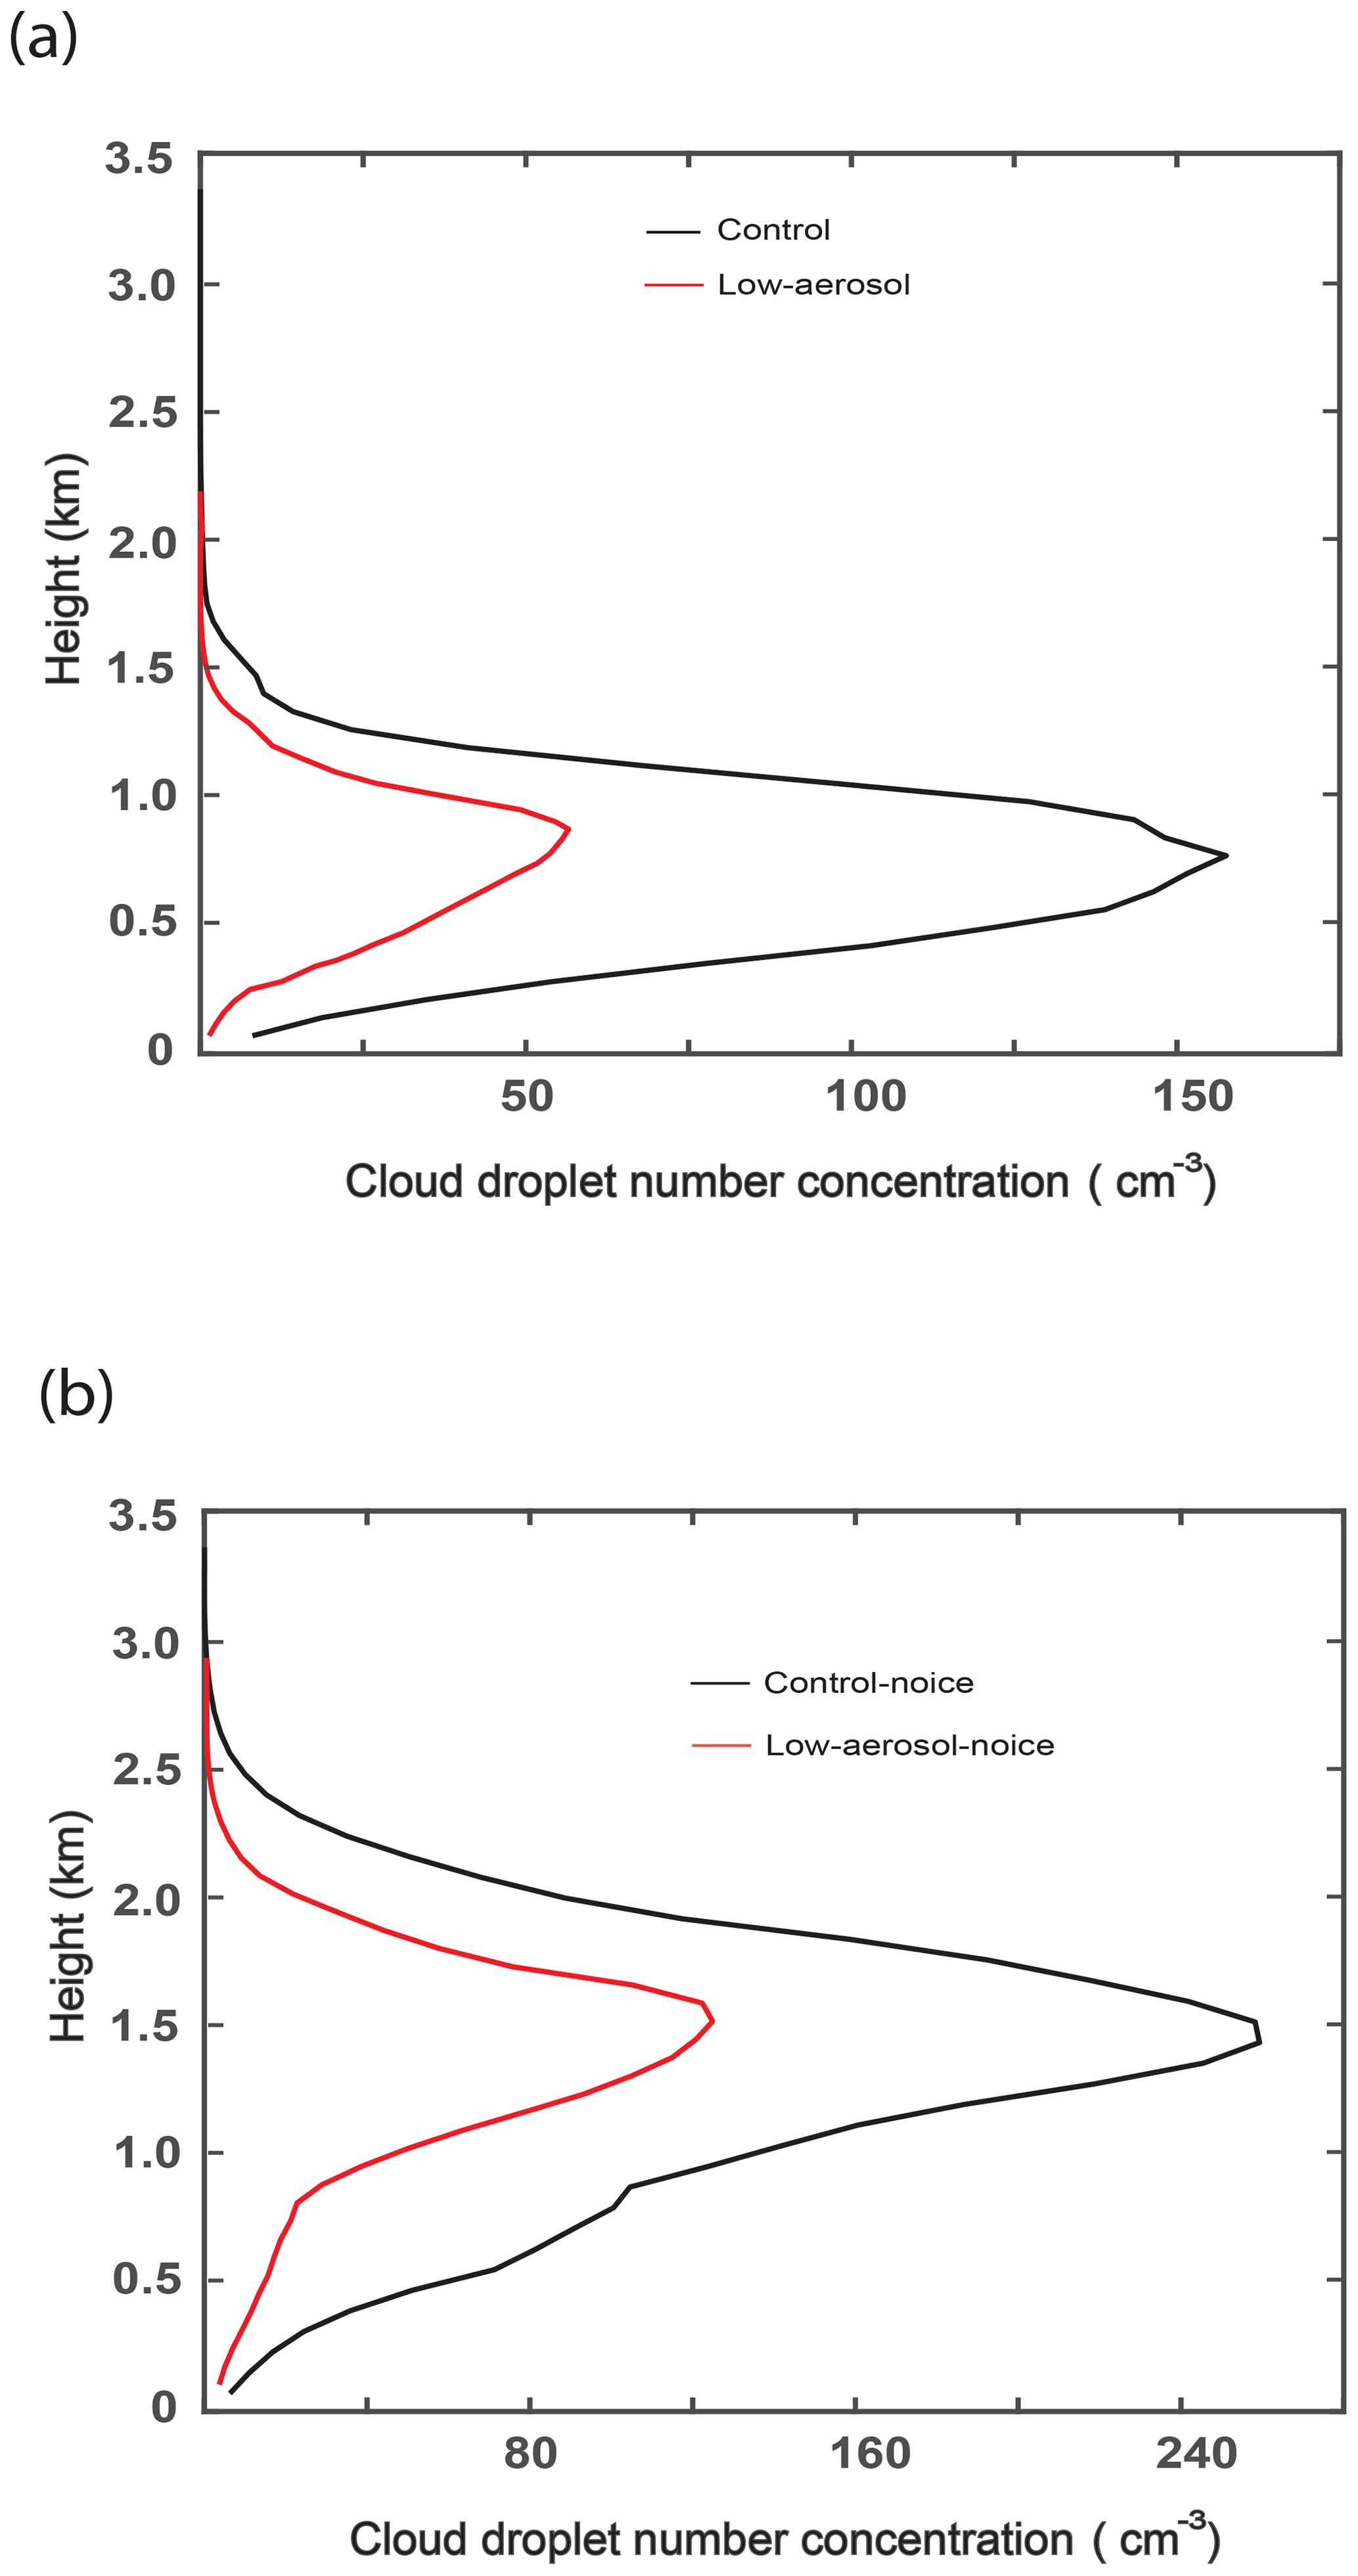
Figure 12Vertical distributions of the average CDNC over grid points and time steps with non-zero CDNC (for the whole domain and simulation period) (a) in the control and low-aerosol runs and (b) in the control-noice and low-aerosol-noice runs.
The jump in differences in condensation between the ice runs is not as high as that in differences in evaporation between the ice runs (Fig. 11a). This situation accompanies the fact that in each of the ice runs the jump in evaporation is higher than that in condensation (Supplement Fig. S1). This means that differences in the jump between evaporation and condensation are greater in the control run than in the low-aerosol run (Supplement Fig. S1). Hence, an evaporation-driven jump in the disappearance of droplets outweighs condensation-driven jump in counteraction against the disappearance in each of the ice runs. Due to this, the increasing temporal trend of CDNC turns to its decreasing trend in each of the ice runs around 13:30 LST on 12 January. If the rate of this decrease in CDNC with time is equal between the ice runs, there is no decreasing trend in differences in CDNC between the runs. However, remember that differences in the jump between evaporation and condensation are greater in the control run than in the low-aerosol run. Hence, when the jumps occur, evaporation-induced disappearance of droplets is counteracted by condensation “less” in the control run than in the low-aerosol run. This causes the rate of the CDNC decrease to be greater in the control run than in the low-aerosol run. This in turn turns the increasing temporal trend of the CDNC differences between the ice runs to their decreasing trend around 13:30 LST on 12 January (Fig. 11a).
The decreasing temporal trend of CDNC contributes to a decreasing temporal
trend of evaporation and condensation, starting around 13:30 LST on
12 January, by reducing the integrated surface area of droplets in
each of the ice runs. This decreasing trend of evaporation and
condensation is larger associated with the larger decreasing trend of CDNC
in the control run than in the low-aerosol run (Supplement Fig. S1).
This causes the increasing temporal trend of differences in
evaporation and condensation between the ice runs to change into their
decreasing temporal trend around 13:30 LST on 12 January (Fig. 11a). The decreasing trend of evaporation in each of the ice runs is smaller
than that in condensation (Supplement Fig. S1). Associated with this,
the decreasing trend of differences in evaporation between the ice runs is
smaller than that in condensation (Fig. 11a). Stated differently, the
temporal reduction in evaporation in each of the ice runs and its
differences between the runs from 13:30 LST on 12 January onwards
during the initial stage occurs to a lesser extent compared to that in
condensation and its differences.
(ii) Evaporation and condensation efficiency
For a given humidity, the increase in the surface-to-volume ratio of droplets increases the evaporation (condensation) efficiency by increasing the integrated surface area of droplets per unit volume or mass of droplets. Here, evaporation (condensation) efficiency is defined to be the mass of droplets that are evaporated (condensed) per unit volume or mass of droplets. Aerosol-induced increases in the surface-to-volume ratio and thus evaporation and condensation efficiency are caused by aerosol-induced increases in CDNC and associated decreases in the droplet size. Increasing CDNC, in turn, increases competition among droplets for given water vapor needed for their condensational growth, leading to decreases in the droplet size. The average droplet radius over grid points and time steps with non-zero CDNC is 7.3, 9.8, 8.7, and 10.5 µm in the control, low-aerosol, control-noice, and low-aerosol-noice runs, respectively. It is notable that the WBF-mechanism-induced evaporation per unit volume of droplets when the water-vapor pressure is lower than or equal to the water-vapor equilibrium saturation pressure for liquid particles but higher than the equilibrium pressure for ice particles is also strongly proportional to the surface-to-volume ratio of droplets (Pruppacher and Klett, 1978). Hence, between the ice runs, enhanced evaporation efficiency by aerosol-induced increases in the surface-to-volume ratio accompanies aerosol-enhanced WBF-mechanism-associated efficiency of evaporation in addition to aerosol-enhanced efficiency of evaporation when the water-vapor pressure is lower than the water-vapor equilibrium pressure for ice particles.
With the steady and rapid temporal increase in CDNC, there is a steady and rapid temporal enhancement of the surface-to-volume ratio of droplets and evaporation efficiency in each of the ice runs between 12:50 and 13:20 LST on 12 January. Remember that these increases in CDNC are larger in the control run than in the low-aerosol run. This induces the greater temporal enhancement of the ratio and evaporation efficiency in the control run than in the low-aerosol run. The temporal enhancement of the ratio and evaporation efficiency accompanies the temporally enhancing WBF-mechanism-related efficiency of evaporation. This accompaniment boosts evaporation and enables the jump in temporal increases in evaporation to be greater than that in condensation in each of the ice runs. In association with the larger steady and rapid temporal increase in CDNC in the control run than in the low-aerosol run, the temporally enhancing WBF-mechanism-related efficiency of evaporation and its boost on evaporation are enhanced with increasing aerosol concentrations. This, in turn, enables greater aerosol-induced increases in evaporation than in condensation or the greater jump in differences in evaporation between the ice runs than that in condensation over the period between 12:50 and 13:20 LST on 12 January (Fig. 11a). For the period between 12:50 and 13:20 LST, there is no steady and rapid temporal increase in differences in the entrainment rate at the PBL tops unlike the situation with CDNC differences between the ice runs (Fig. 11b). Hence, the greater jump in differences in evaporation between the ice runs is not likely to be induced by entrainment.
Even when both evaporation and condensation rates decrease with time in association with the decreasing temporal trend of CDNC and the surface-to-volume ratio of droplets over a period after 13:30 LST on 12 January during the initial stage in each of the ice runs, evaporation (condensation) rates are maintained higher throughout the initial stage (up to ∼ 15:30 LST) in association with the higher CDNC and surface-to-volume ratio of droplets in the control run than in the low-aerosol run (Fig. 11a). The presence of the WBF mechanism and entrainment facilitates evaporation and this acts against the temporal decrease in evaporation with time over the period in each of the ice runs. This counteraction by the WBF mechanism and entrainment reduces the temporal decrease in evaporation and enables evaporation to reduce temporally to a lesser extent compared to condensation in each of the ice runs for the period (Supplement Fig. S1). This accompanies the differences in the temporal reduction between evaporation and condensation that are larger in the control run than in the low-aerosol run (Supplement Fig. S1). This, in turn, enables differences in evaporation between the ice runs to reduce to a lesser extent compared to those in condensation over the period (Fig. 11a). Due to this, differences (or aerosol-induced increases) in evaporation and associated aerosol-induced increases in evaporation-driven negative buoyancy between the ice runs are higher than those in condensation and condensation-driven positive buoyancy, respectively, for the period (Fig. 11a). This induces the decreasing temporal trend of differences or aerosol-induced increases in updraft mass fluxes between the ice runs over the period (Fig. 11a). The decreasing temporal trend of aerosol-induced increases in updraft mass fluxes eventually leads to lower updraft mass fluxes in the control run than in the low-aerosol run, as represented by negative differences in updraft mass fluxes between the ice runs from ∼ 15:30 LST onwards during the initial stage (Fig. 11a). Associated with this, condensation becomes smaller in the control run, as represented by negative differences in condensation between the ice runs from ∼ 15:30 LST onwards during the initial stage (Fig. 11a).
The role of the WBF mechanism described in this section can be clearly seen
by comparing the ice runs in this section to the noice runs, with no WBF
mechanism, detailed in the following Sect. “Noice runs”.
(2) Deposition and condensation
The difference in deposition between the ice runs is negligible and does not vary much with time up to ∼ 15:30 LST on 12 January when the difference starts to show its significant increase (Fig. 11a). With the start of the decreasing temporal trend of condensation around 13:30 LST on 12 January, more water vapor, not used by condensation, becomes available for deposition compared to that before 13:30 LST on 12 January in each of the ice runs. Remember that this decreasing trend is greater in the control run than in the low-aerosol run. Hence, from 13:30 LST on 12 January onwards, more water vapor is available for deposition in the control run than in the low-aerosol run. This leads to the start of larger aerosol-induced increases in deposition between the ice runs around 13:30 LST on 12 January compared to those increases before ∼ 13:30 LST on 12 January (Fig. 11a). The decrease in condensation in the control run continues, and its differences between the runs grow even after the negative differences in condensation between the runs start to appear around 15:30 LST on 12 January. Hence, aerosol-induced increases in the amount of water vapor, which is not used by condensation and available for deposition, continue even after 15:30 LST on 12 January. This enables aerosol-induced increases in deposition between the ice runs to continue even after 15:30 LST on 12 January (Fig. 11a). This is despite the evaporation-driven lower updraft mass fluxes in the control run than in the low-aerosol run from ∼ 15:30 LST on 12 January onwards (Fig. 11a). This indicates that after ∼ 15:30 LST on 12 January, the microphysical process which is related to the competition between deposition and condensation and tends to increase deposition with increasing aerosol concentrations outweighs dynamic processes (i.e., updraft mass fluxes), which tend to reduce deposition with increasing aerosol concentrations.
The increasing temporal trend of aerosol-induced increases in deposition is not able to outweigh the increasing trend of aerosol-induced decreases in condensation between the ice runs after ∼ 15:30 LST on 12 January (Fig. 11a). Remember that there is no change in the background concentration of aerosols acting as INPs between the ice runs. Hence, as seen in Fig. 11a, there are negligible differences in CINC between the ice runs, although more water vapor starts to be available for deposition in the control run than in the low-aerosol run around 13:30 LST on 12 January. This indicates that CINC per unit water vapor available for deposition is lower in the control run. Hence, the available water vapor has more difficulty in finding the surface area of ice crystals for deposition in the control run. More difficulty in finding the surface area of ice crystals for deposition makes the deposition of the more available water vapor less efficient in the control run than in the low-aerosol run. This damps down the increase in deposition in particular after ∼ 13:30 LST on 12 January in the control run. Then, aerosol-induced increases in deposition are not large enough to overcome aerosol-induced decreases in condensation in the control run, particularly after ∼ 15:30 LST on 12 January (Fig. 11a). This in turn leads to the lower average WP in the control run than in the low-aerosol run over the whole simulation period.
(b) Noice runs
As between the ice runs, between the noice runs, the activation-enhanced and condensationally enhanced counteraction outweighs the evaporation-induced decreases in CDNC, leading to increases in CDNC with increasing aerosol concentrations (Figs. 11a, c and 12b). However, in the noice runs, ice processes, the associated WBF mechanism, and increase in the WBF-mechanism-associated efficiency of evaporation with increasing aerosol concentrations are absent, although aerosol-induced increases in entrainment at the PBL tops and surface-to-volume ratio of droplets are present. The average entrainment rate over all grid points at the PBL tops and over the whole simulation period is 0.71 and 0.60 cm s−1 in the control-noice and low-aerosol-noice runs, respectively. The average entrainment rate over all grid points at the PBL tops and over the whole simulation period is 0.13 and 0.15 cm s−1 in the control and low-aerosol runs. There are aerosol-induced decreases in the average entrainment over the whole simulation period between the ice runs. The boost of evaporation by the WBF mechanism in each of the ice runs leads to greater evaporation efficiency by outweighing the lower entrainment rate in the control run than in the control-noice run and in the low-aerosol run than in the low-aerosol-noice run. Aerosol-induced increases in the boost lead to greater aerosol-induced increases in evaporation efficiency between the ice runs than between the noice runs despite aerosol-induced decreases (increases) in the entrainment rate between the ice (noice) runs for the whole simulation period. Particularly for the initial stage, evaporation efficiency in the control, low-aerosol, control-noice, and low-aerosol-noice runs is 1.61 %, 0.90 %, 0.21 %, and 0.12 %, respectively. Here, to obtain evaporation efficiency, the cumulative values of evaporation and cloud-liquid mass at the last time step of the initial stage are calculated as follows:
Here, dV=dxdydz and t represents time. x, y, and z represent displacement in the east–west, north–south and vertical directions, respectively. Evaporation rate in a unit volume of air, which is in units of kg m−3 s−1, at each grid point and time step is put into Eq. (1) as “A” to obtain the cumulative value of evaporation. To obtain the cumulative value of cloud-liquid mass, cloud-liquid mass in a unit volume of air at each grid point and time step is first divided by the time step. This divided cloud-liquid mass, which is also in units of kg m−3 s−1, represents cloud-liquid mass per unit time and volume and is put into Eq. (1) as “A” to obtain the cumulative value of cloud-liquid mass. Then, the cumulative evaporation is divided by the cumulative cloud-liquid mass to obtain the evaporation efficiency for each of the runs.
With temporal increases in CDNC, which are larger in the control-noice run than in the low-aerosol-noice run, leading to those in CDNC differences between the noice runs, there are temporal increases in condensation and evaporation, which are larger in the control-noice run than in the low-aerosol-noice run, and thus in their differences between the noice runs (Fig. 11c). Associated with smaller aerosol-induced increases in evaporation efficiency between the noice runs, aerosol-induced increases in condensation are always greater than aerosol-induced increases in evaporation between the noice runs during the initial stage (Fig. 11c). This maintains aerosol-induced increases in updraft mass fluxes between the noice runs and leads to aerosol-induced increases in WP between the noice runs. Also, with higher CDNC and associated smaller sizes of droplets, there is suppressed autoconversion in the control-noice run compared to that in the low-aerosol-noice run. Here, autoconversion is the process of droplets colliding with and coalescing each other to grow into raindrops. Due to this, the average precipitation rate over all grid points at cloud bases and over the whole simulation period is lower in the control-noice run. The average cloud-base precipitation rate is 0.009 and 0.019 g m−2 s−1 in the control-noice and low-aerosol-noice runs, respectively. The difference in this average precipitation rate between the noice runs is ∼ 2 times smaller than that in the time- and column-averaged condensation rate. Hence, while aerosol-induced precipitation suppression contributes to higher WP in the control-noice run, this contribution is not as significant as that of aerosol-enhanced condensation.
In contrast to the situation in the noice runs, in the ice runs, after ∼ 12:50 LST on 12 January, aerosol-induced increases in condensation become lower than those in evaporation, leading to lower aerosol-induced updrafts and WP (Fig. 11a). This comparison between the ice and noice runs confirms that the presence of ice processes and the associated WBF mechanism plays a critical role in the lower aerosol-induced increases in condensation than in evaporation in the ice runs. Figure 13 schematically depicts the flow of processes that are described in Sect. 4.2.1.
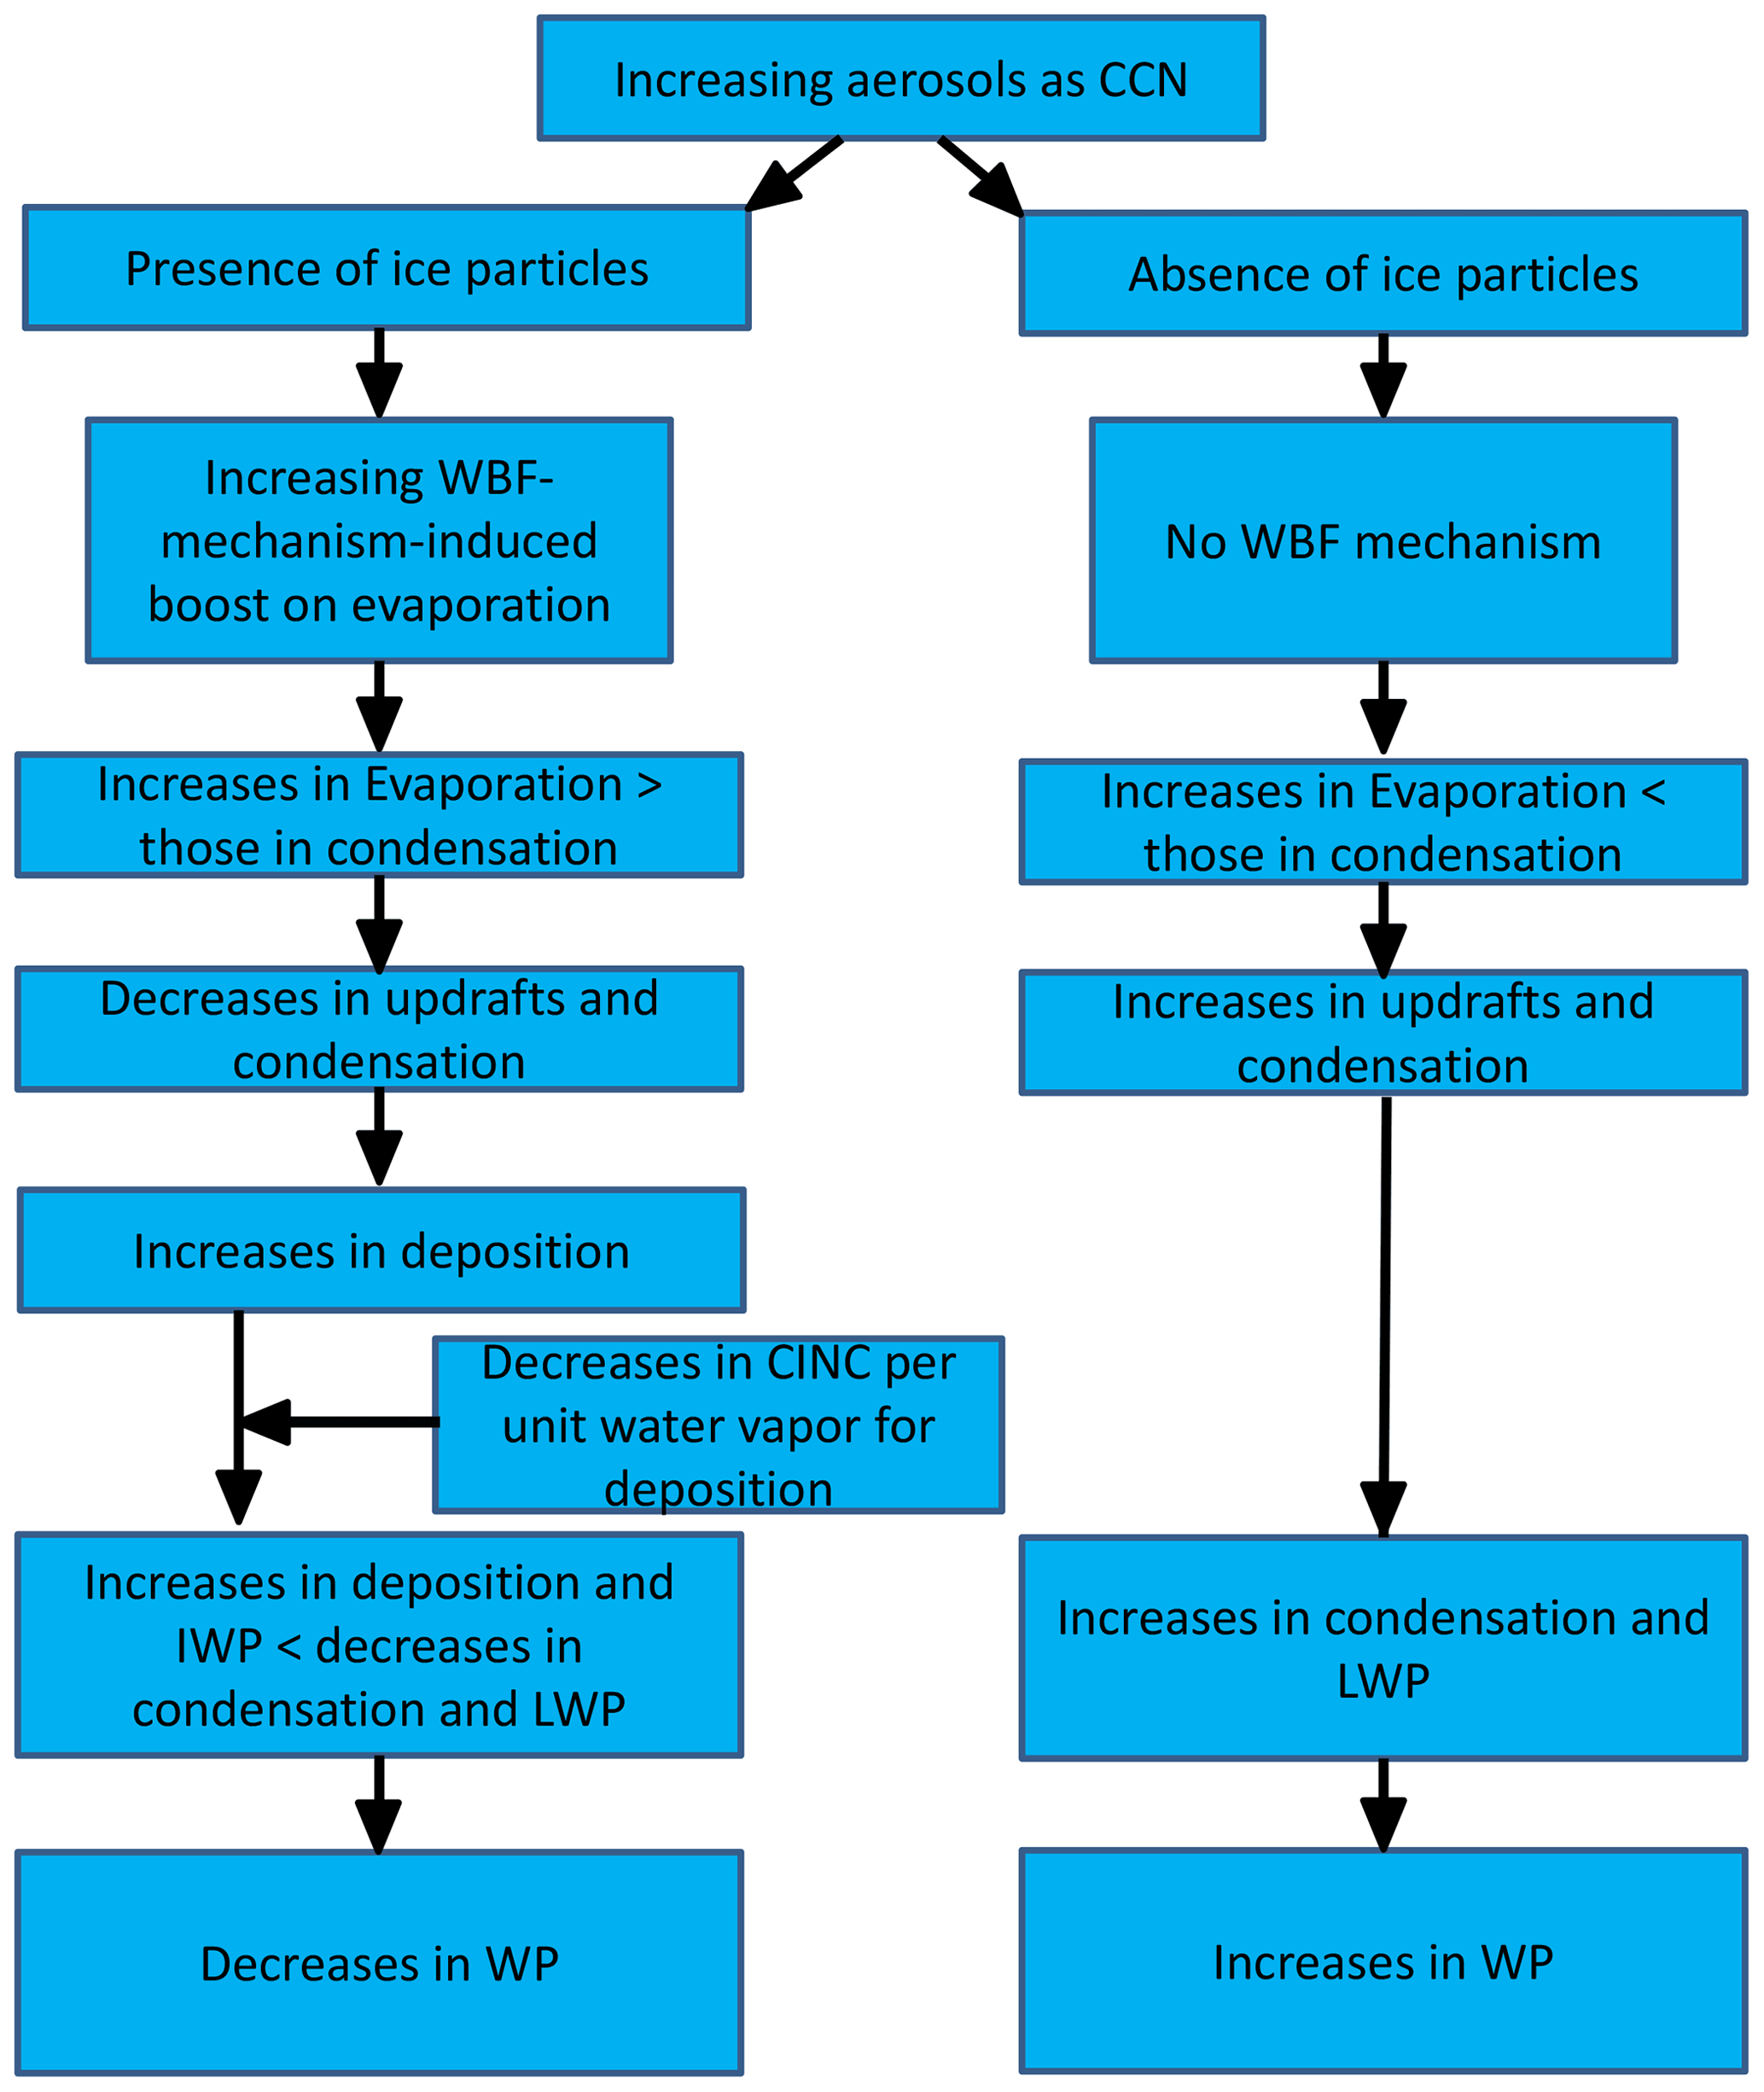
Figure 13A schematic diagram that depicts the flow of processes that are described in Sect. 4.2.1 and associated with responses of clouds to increasing aerosols acting as CCN.
4.2.2 INP
So far, we have examined effects of the increasing concentration of aerosols acting as CCN. However, unlike situations in warm stratocumulus clouds that have garnered the most attention in terms of aerosol–cloud interactions, not only aerosols acting as CCN but also those acting as INPs can affect mixed-phase stratocumulus clouds (Rangno and Hobbs, 2001; Lohmann, 2002; Borys et al., 2003). The above-described INP-10 and INP-100 runs compared to the control run identify how the increasing concentration of aerosols acting as INPs affects mixed-phase clouds. As seen in this comparison, the increasing concentration of aerosols acting as INPs causes WP to increase, contrary to effects of the increasing concentration of aerosols acting as CCN. However, at each time step and grid point, a factor by which the concentration of background aerosols acting as CCN varies between the control and low-aerosol runs is different from that by which the concentration of background aerosols acting as INPs varies among the control, INP-10, and INP-100 runs. For better comparisons between CCN and INP effects, it is better to make consistency in the factors between simulations for CCN effects and those for INP effects. For this consistency, the INP-reduced run is performed as the repeated control run by reducing the concentration of background aerosols acting as INPs (but not CCN) at each time step and grid point by the same factor as used for the reduction in the concentration of background aerosols acting as CCN in the low-aerosol run compared to that in the control run. The INP-reduced run is compared to the control run to examine the INP effects. The INP-reduced run is identical to the low-aerosol run except that the concentration of background aerosols acting as INPs but not CCN at every time step and grid point after 05:00 LST on 12 January is assumed to have the concentration at 05:00 LST on 12 January.
Figure 11d shows the time series of differences in deposition rate, condensation rate, and related variables between the control and INP-reduced runs. With the increasing concentration of background aerosols acting as INPs, there are more increases in CINC between those runs than between the control and low-aerosol runs (Fig. 11a and d). During the initial stage before 20:00 LST on 12 January, overall, there is an increasing temporal trend in differences in CINC between the control and INP-reduced runs due to the larger increasing temporal trend in CINC in the control run than in the INP-reduced run (Fig. 11d). Increasing CINC provides the increasing integrated surface area of ice crystals for deposition. This leads to the increasing temporal trend in deposition, which is larger in the control run, and in differences in deposition between the control and INP-reduced runs (Fig. 11d). However, due to no changes in the concentration of the background aerosols acting as CCN between the control and INP-reduced runs, there are negligible differences in CDNC between the control and INP-reduced runs compared to those between the control and low-aerosol runs (Fig. 11a and d). More evaporation occurs in the control run than in the INP-reduced run and this is contributed by more deposition and the associated WBF mechanism (Fig. 11d). Also, more entrainment contributes to more evaporation in the control run (Fig. 11b). Between the INP-reduced and control runs, with no increases in the concentration of background aerosols acting as CCN, increases in the surface-to-volume ratio of droplets and the associated enhancement in the WBF-mechanism-related efficiency of evaporation are negligible compared to those between the control and low-aerosol runs. Note that there are overall larger increases in entrainment and associated evaporation between the control and INP-reduced runs than between the control and low-aerosol runs (Fig. 11b). The negligible enhancement in the WBF-mechanism-related efficiency of evaporation overshadows the overall larger increases in entrainment and associated evaporation between the control and INP-reduced runs. This leads to overall smaller aerosol-induced increases in evaporation between the control and INP-reduced runs than between the control and low-aerosol runs (Fig. 11a and d).
Mainly due to the increase in evaporation, there is more negative buoyancy, and updraft mass fluxes start to reduce in the control run compared to those in the INP-reduced run around 12:50 LST on 12 January (Fig. 11d). Eventually, updraft mass fluxes in the control run become smaller than those in the INP-reduced run around 15:50 LST on 12 January (Fig. 11d). This decrease occurs to a lesser extent mainly due to overall smaller aerosol-induced increases in evaporation between the control and INP-reduced runs than between the control and low-aerosol runs (Fig. 11a and d). Associated with weaker updrafts in the control run, condensation in the control run becomes smaller than that in the INP-reduced run around 15:50 LST on 12 January but to a lesser degree compared to that between the control and low-aerosol runs (Fig. 11a and d).
When there is aerosol-induced reduction in condensation, there starts to be more available water vapor for deposition, and thus aerosol-induced increases in deposition between the control and INP-reduced runs jump around 15:50 LST on 12 January (Fig. 11d). This is similar to the situation between the control and low-aerosol runs. However, due to greater aerosol-induced increases in CINC and the associated integrated surface area of ice crystals, after ∼ 15:50 LST on 12 January, there are greater aerosol-induced increases in deposition between the control and INP-reduced runs than between the control and low-aerosol runs (Fig. 11a and d). Remember that the decrease in condensation, starting around 15:50 LST on 12 January, between the control and INP-reduced runs is smaller than that between the control and low-aerosol runs. This enables the increase in deposition to overcome the decrease in condensation between the control and INP-reduced runs. The larger increase in deposition than the decrease in condensation between the control and INP-reduced runs eventually makes updrafts in the control run greater than those in the INP-reduced run around 18:50 LST on 12 January (Fig. 11d).
Initiated by greater aerosol-induced increase in deposition during the initial stage, there is greater aerosol-induced increase in IWP between the control and INP-reduced runs than between the control and low-aerosol runs over the whole simulation period (Fig. 14). Initiated by a smaller aerosol-induced decrease in condensation during the initial stage, there is a smaller aerosol-induced decrease in LWP between the control and INP-reduced runs than between the control and low-aerosol runs over the whole simulation period (Fig. 14). This greater increase in IWP dominates over the smaller decrease in LWP between the control and INP-reduced runs, leading to an increase in WP in the control run compared to that in the INP-reduced run with an increase in the average cloud fraction over time steps with a non-zero cloud fraction from 0.89 in the INP-reduced run to 0.92 in the control run. This is in contrast to the situation between the control and low-aerosol runs. Hence, comparisons between the control, INP-reduced, and low-aerosol runs demonstrate that whether there is an increasing concentration of aerosols acting as INPs or CCN has substantial impacts on how WP responds to the increasing concentration of aerosols.

Figure 14Time series of the domain-averaged LWP, IWP, and WP for the control, low-aerosol, and INP-reduced runs and LWP, which is also WP, for the control-noice and low-aerosol-noice runs.
4.2.3 Sedimentation of ice particles
With increasing concentrations of aerosols acting as CCN between the control and low-aerosol runs, the size and fall velocity of ice crystals do not change significantly at the initial stage. The average ice-crystal radius over grid points and time steps with non-zero CINC for the initial stage is 54 and 52 µm in the control and low-aerosol runs, respectively. This means that aerosol-induced changes in the sedimentation of ice crystals do not affect CINC, the associated integrated surface area of ice crystals, and deposition significantly. Moreover, as described in Sect. 4.2.1, the CDNC evolution (but not the CINC evolution) plays a critical role in the different evolution of evaporation, condensation, and deposition at the initial stage between the runs. Hence, it is not likely that aerosol-induced changes in the sedimentation of ice crystals and associated ice particles such as snow and associated CINC have a significant impact on aerosol-induced changes in those phase-transition processes at the initial stage and subsequently at later stages. To check this out, the control and low-aerosol runs are repeated by setting the fall velocity of ice particles (including ice crystals) to zero. These repeated runs are the control-no-sedim and low-aerosol-no-sedim runs. Hence, in these repeated runs, there are no aerosol-induced changes in the sedimentation of ice particles. The time- and domain-averaged IWP, LWP, and WP are 14 (12), 5 (8), and 19 (20) g m−2, respectively, in the control-no-sedim (low-aerosol-no-sedim) run. The time- and domain-averaged IWP, LWP, and WP are 11 (10), 7 (9), 18 (19) g m−2, respectively, in the control (low-aerosol) run. The presence of the sedimentation decreases IWP and increases LWP compared to the situation with no sedimentation for each of the control and low-aerosol runs. The differences in IWP and LWP between the control-no-sedim and low-aerosol-no-sedim runs is slightly greater than that between the control and low-aerosol runs. Hence, the presence of impacts of aerosols acting as CCN on the sedimentation reduces aerosol impacts on IWP and LWP. However, results here show that the qualitative nature of impacts of aerosols acting as CCN on cloud mass does not vary, whether there are changes in the sedimentation of ice particles with increasing concentrations of aerosols acting as CCN or not. This indicates that the presence of the sedimentation and its aerosol-induced changes is not a factor that controls the qualitative nature of impacts of aerosols acting as CCN on cloud mass.
With increasing concentrations of aerosols acting as INPs between the control and INP-reduced runs, the size and fall velocity of ice crystals change at the initial stage. The average ice-crystal radius over grid points and time steps with non-zero CINC for the initial stage is 54 and 59 µm in the control and INP-reduced runs, respectively. To see the effect of these changes in the size and associated sedimentation of ice particles on the qualitative nature of results between the control and INP-reduced runs, the INP-reduced run is repeated by setting the fall velocity of ice particles to zero. This repeated run is referred to as the INP-reduced-no-sedim run. The time- and domain-averaged IWP, LWP, and WP are 14 (11), 5 (6), and 19 (17) g m−2, respectively, in the control-no-sedim (INP-reduced-no-sedim) run, while the time- and domain-averaged IWP, LWP, and WP are 11 (7), 7 (8), and 18 (15) g m−2, respectively, in the control (INP-reduced) run. The presence of the sedimentation decreases IWP and increases LWP compared to the situation with no sedimentation for each of the control and INP-reduced runs. The difference in IWP between the control-no-sedim and INP-reduced-no-sedim runs is smaller than that between the control and INP-reduced runs. The difference in LWP between the control-no-sedim and INP-reduced-no-sedim runs is not different from that between the control and INP-reduced runs. Hence, the presence of impacts of aerosols acting as INPs on the sedimentation enhances aerosol impacts on IWP, although the presence does not affect aerosol impacts on LWP. However, the qualitative nature of impacts of aerosols acting as INPs on cloud mass also does not vary, whether there are changes in the sedimentation of ice particles with increasing concentrations of aerosols acting as INPs or not. This indicates that the presence of the sedimentation and its aerosol-induced changes is not a factor that controls the qualitative nature of impacts of aerosols acting as INPs on cloud mass.
When it comes to stratocumulus clouds and their interactions with aerosols, warm clouds, which are composed of liquid particles only, have garnered most of the attention. However, in midlatitudes, particularly during the wintertime, there are frequent occurrences of mixed-phase stratocumulus clouds, which are composed of both liquid and solid particles. The level of understanding of mechanisms that control the development of these mixed-phase clouds and their interactions with aerosols has been low. Motivated by this, this study aims to improve our understanding of the development of these mixed-phase stratocumulus clouds and their interactions with aerosols by focusing on roles of ice particles and processes in the development and interactions.
Ice crystals (i.e., cloud ice) and their interactions with droplets (i.e., cloud liquid) in a selected system of mixed-phase stratocumulus clouds lower cloud mass substantially compared to that in warm stratocumulus clouds. This is due to insufficient compensation of the reduced condensation and LWP by deposition and IWP in the mixed-phase clouds. This insufficient compensation is related to low CINC and associated low integrated surface area of ice crystals in the mixed-phase clouds. As the concentration of aerosols acting as INPs, and CINC increase, deposition enhances and this enables cloud mass in the mixed-phase clouds to be similar to that in the warm clouds.
In the mixed-phase clouds, with the increasing concentration of aerosols acting as CCN, there are decreases in cloud mass. In the mixed-phase clouds, aerosol-induced increases in the evaporation of droplets, which involve the WBF mechanism, and their impacts on updrafts outweigh aerosol-intensified feedbacks between condensation and updrafts. This leads to aerosol-induced decreases in cloud mass. However, in the warm clouds, with the increasing concentration of aerosols acting as CCN, there are increases in cloud mass. Due to the absence of the WBF mechanism, in the warm clouds, aerosol-induced increases in the evaporation of droplets are not as efficient as in the mixed-phase clouds. This enables aerosol-intensified feedbacks between condensation and updrafts to induce aerosol-induced increases in cloud mass in the warm clouds. With the increases in the concentration of aerosols acting as INPs, there are greater aerosol-induced increases in CINC and deposition than with the increases in the concentration of aerosols acting as CCN. This enables the increasing concentration of aerosols acting as INPs to induce increases in cloud mass, which is in contrast to the situation with the increasing concentration of aerosols acting as CCN.
It is generally true that the conventional wisdom of stratiform clouds and aerosol effects on them has been established mostly by relying on warm clouds (Ramaswamy et al., 2001; Forster et al., 2007; Wood, 2012). For example, this wisdom generally indicates that increasing concentrations of aerosols acting as CCN increase cloud mass (Albrecht, 1989). However, in contrast to this, this study shows that in the mixed-phase stratiform clouds, the increasing concentration of aerosols acting as CCN can reduce cloud mass via CCN-induced changes in interactions between ice and liquid particles. It is also shown that the increasing concentration of aerosols acting as INPs enhances cloud mass via INP-induced changes in interactions between ice and liquid particles, in contrast to roles of the increasing concentration of aerosols acting as CCN in cloud mass. In addition, this study finds that the presence of ice particles and its interactions with liquid particles reduce cloud mass in the mixed-phase clouds compared to that in warm clouds. Midlatitude winter stratiform clouds and high-latitude clouds such as the Arctic stratiform clouds frequently involve ice particles as well as liquid particles. As discussed in Stevens and Feingold (2009), our lack of understanding of these clouds and their interactions with aerosols has made a significant contribution to the high uncertainty in the prediction of climate change. Hence, to reduce this uncertainty, especially by reducing the related uncertainty in climate models, we have to go beyond the traditional warm-cloud-based parameterizations of clouds and their interactions with aerosols in climate models. For this, this study indicates that it is imperative to develop new parameterizations that consider impacts of interactions between ice and liquid particles on clouds and the interplay of those impacts with varying concentrations of aerosols acting not only as CCN but also as INPs.
The average CINC in the control run in this study is on the order of magnitude of ∼ 0.1 cm−3, and this is an order of magnitude lower than that in the control run in Lohmann and Diehl (2006) for similar temperature and CDNC ranges between the runs. Remember that this study uses parameterizations by Lohmann and Diehl (2006) for the heterogeneous INP activation. In the control run in Lohmann and Diehl (2006), the INP concentrations, which are dependent only on temperature, are used for the INP activation. However, in the control run in this study, instead of obtaining the INP concentrations empirically using the temperature as in Lohmann and Diehl (2006), the observed spatiotemporal variation in the INP concentration is considered for the INP activation. Lohmann and Diehl (2006) have shown that using the INP concentrations, which are empirically obtained based only on temperature, for the INP activation can increase CINC by a factor of ∼ 10 compared to that when the spatiotemporal variation in the INP concentration, as a result of the abovementioned processes related to aerosols, is considered for the activation. It is believed that this explains the discrepancy in CINC between the control in this study and that in Lohmann and Diehl (2006).
Note that many of the previous studies of mixed-phase stratocumulus clouds (e.g., Ovchinnikov et al., 2011; Possner et al., 2017) have focused on roles of cloud-top radiative cooling, entrainment and sedimentation of ice particles in mixed-phase stratocumulus clouds, and their interactions with aerosols. However, there have not been many studies that focus on roles of microphysical interactions, which involve microphysical processes (e.g., evaporation, condensation, and deposition) and factors (e.g., cloud-particle concentrations and sizes), between ice and liquid particles in those clouds and their interplay with aerosols. Hence, we believe that this study contributes to the more general understanding of mixed-phase clouds and their interactions with aerosols.
The code/data used are currently private and stored in our private computer system. Opening the data to the public requires approval from funding sources. Since funding projects associated with this work are still going on, these sources do not allow the data to be open to the public; 2–3 years after these project ends, the data can be open to the public. However, if there is any inquiry about the data, contact the corresponding author Seoung Soo Lee (slee1247@umd.edu). The meteorological data that are used to perform this study can be obtained from National Climate Data Center archive at https://data.kma.go.kr (Korea Meteorological Administration, 2021).
The supplement related to this article is available online at: https://doi.org/10.5194/acp-21-16843-2021-supplement.
SSL, KJH, and BGK established essential initiative ideas to start this work. While SSL worked on the analysis of simulation data, KJH and MGM worked on the analysis of observation data. MK, HK, NU, and JG participated in the preliminary analysis of simulation and observation data and provided ideas to improve the presentation of results by reviewing the manuscript. YZ, KOC, and GUK provided ideas in response to reviewers' comments, while CHJ and JU performed additional simulations and associated analysis to address those comments.
The authors declare that they have no conflict of interest.
Publisher's note: Copernicus Publications remains neutral with regard to jurisdictional claims in published maps and institutional affiliations.
The authors thank Seung-Hee Eun at the National Institute of Environmental Research in South Korea for providing aerosol data.
This study is supported by the National Research Foundation of Korea (NRF) grant funded by the South Korean government (MSIT) (no. NRF2020R1A2C1003215), the “Construction of Ocean Research Stations and their Application Studies” project funded by the Ministry of Oceans and Fisheries, South Korea, and the FRIEND (Fine Particle Research Initiative in East Asia Considering National Differences) project through the National Research Foundation of Korea (NRF) funded by the Ministry of Science and ICT (2020M3G1A1114617).
This paper was edited by Martina Krämer and reviewed by two anonymous referees.
Ackerman, A. S., Kirkpatrick, M. P., Stevens, D. E., and Toon, O. B.: The impact of humidity above stratiform clouds on indirect aerosol climate forcing, Nature, 432, 1014–1017, 2004.
Albrecht, B. A.: Aerosols, cloud microphysics, and fractional cloudiness, Science, 245, 1227–1230, 1989.
Bergeron, T.: On the physics of clouds and precipitation. Proces Verbaux de l`Association de Meteorologie, International Union of Geodesy and Geophysics, 156–178, 1935.
Bodas-Salcedo, A., Hill, P. G., Furtado, K., Williams, K. D., Field, P. R., Manners, J. C., Hyder, P., and Kato, S.: Large contribution of supercooled liquid clouds to the solar radiation budget of the Southern Ocean, J. Climate, 29, 4213–4228, https://doi.org/10.1175/JCLI-D-15-0564.1, 2016.
Borys, R. D., Lowenthal, D. H., Cohn, S. A. and Brown, W. O. J.: Mountaintop and radar measurements of anthropogenic aerosol effects on snow growth and snowfall rate, Geophys. Res. Lett., 30, 1538, https://doi.org/10.1029/2002GL016855, 2003.
Brown, A., Milton, S., Cullen, M., Golding, B., Mitchell, J., and Shelly, A.: Unified modeling and prediction of weather and climate: A 25-year journey, B. Am Meteorol. Soc., 93, 1865–1877, 2012.
Chen, F. and Dudhia, J.: Coupling an advanced land-surface hydrology model with the Penn State-NCAR MM5 modeling system. Part I: Model description and implementation, Mon. Weather Rev., 129, 569–585, 2001.
Dong, X. and Mace, G. G.: Arctic stratus cloud properties and radiative forcing derived from ground-based data collected at Barrow, Alaska, J. Climate, 16, 445–461, https://doi.org/10.1175/1520-0442(2003)016<0445:ASCPAR>2.0.CO;2, 2003.
Eun, S.-H., Kim, B.-G., Lee, K.-M., and Park, J.-S.: Characteristics of recent severe haze events in Korea and possible inadvertent weather modification, SOLA, 12, 32–36, 2016.
Faller, K.: MTSAT-1R: A multifunctional satellite for Japan and the Asia-Pacific region, Proceedings of the 56th IAC 2005, Fukuoda, Japan, 17–21 October 2005, IAC-05-B3.2.04, 2005.
Fan, J., Yuan, T., Comstock, J. M., Ghan, S., Khain, A., Leung, L. R., Li, Z., Martins, V. J., and Ovchinnikov, M.: Dominant role by vertical wind shear in regulating aerosol effects on deep convective clouds, J. Geophys. Res., 114, D22206, https://doi.org/10.1029/2009JD012352, 2009.
Findeisen, W.: Kolloid-meteorologische Vorgange bei Neiderschlagsbildung, Meteorol. Z., 55, 121–133, 1938.
Forster, P., Ramaswamy, V., Artaxo, P., Berntsen, T., Betts, R., Fahey, D. W., Haywood, J., Lean, J., Lowe, D. C., Myhre, G., Nganga, J., Prinn, R., Raga, G., Schulz, M., and Van Dorland, R.: Changes in atmospheric constituents and in radiative forcing, in: Climate change 2007: the physical science basis, Contribution of working group I to the Fourth Assessment Report of the Intergovernmental Panel on Climate Change, edited by: SSolomon, S., Qin, D., Manning, M., Chen, Z., Marquis, M., Averyt, K. B., Tignor, M., and Miller, H. L., Cambridge Univ. Press, New York, 2007.
Fouquart, Y. and Bonnel, B.: Computation of solar heating of the Earth's atmosphere: a new parameterization, Beitr. Phys. Atmos., 53, 35–62, 1980.
Grell, G. A., Peckham, S. E., Schmitz, R., McKeen, S. A., Frost, G., Skamarock, W. C., and Eder, B.: Fully coupled online chemistry in the WRF model, Atmos. Environ., 39, 6957–6976, 2005.
Guo, J., Deng, M., Lee, S. S., Wang, F., Li, Z., Zhai, P., Liu, H., Lv, W., Yao, W., and Li, X.: Delaying precipitation and lightning by air pollution over the Pearl River Delta. Part I: Observational analyses, J. Geophys. Res.-Atmos., 121, 6472–6488, https://doi.org/10.1002/2015JD023257, 2016.
Ha, K.-J., Nam, S., Jeong, J.-Y, Moon, I.-J., Lee, M., Yun, J., Jang, C. J., Kim, Y. S., Byun, D.-S., Heo, K.-Y., and Shim, J.-S.: Observations utilizing Korean ocean research stations and their applications for process studies, B. Am. Meteorol. Soc., 100, 2061–2075, 2019.
Hahn, C. J. and Warren, S. G.: A gridded climatology of clouds over land (1971–96) and ocean (1954–97) from surface observations worldwide. Numeric Data Package NDP-026EORNL/CDIAC-153, CDIAC, Department of Energy, Oak Ridge, TN, 2007.
Hartmann, D. L., Ockert-Bell, M. E., and Michelsen, M. L.: The effect of cloud type on earth's energy balance – Global analysis, J. Climate, 5, 1281–1304, 1992.
Holben, B., Tanre, D., Smirnov, A., Eck, T., Slutsker, I., Abuhassen, N., Newcomb, W., Schafer, J., Chatenet, B., Lavenue, F., Kaufman, Y., Vande Castle, J., Setzer, A., Markham, B., Clark, D., Frouin, R., Halthore, R., Karnieli, A., O`Neill, N., Pietras, C., Pinker, R., Voss, K., and Zibordi, G.: An emerging ground-based aerosol climatology: Aerosol optical depth from AERONET, J. Geophys. Res., 106, 12067–12097, 2001.
Hu, Y., Rodier, S., Xu, K.-M., Sun, W., Huang, J., Lin, B., Zhai, P., and Josset, D.: Occurrence, liquid water content and fraction of supercooled water clouds from combined CALIOP/IIR/MODIS measurements, J. Geophys. Res., 115, D00H34, https://doi.org/10.1029/2009JD012384, 2010.
Huang, Y., Siems, S. T., Manton, M. J., Protat, A., and Delanöe, J.: A study on the low-altitude clouds over the Southern Ocean using the DARDAR-MASK, J. Geophys. Res., 117, D18204, https://doi.org/10.1029/2012JB009424, 2012.
Intrieri, J. M., Shupe, M. D., Uttal, T., and McCarty, B. J.: An annual cycle of Arctic cloud characteristics observed by radar and lidar at SHEBA, J. Geophys. Res., 107, 8030, https://doi.org/10.1029/2000jc000423, 2002.
Jackson, R. C., McFarquhar, G. M., Korolev, A. V., Earle, M. E., Liu, P. S. K., Lawson, R. P., Brooks, S., Wolde, M., Laskin, A., and Free, M.: The dependence of Arctic mixed-phase stratus ice cloud microphysics on aerosol concentration using observations acquired during ISDAC and M-PACE, J. Geophys. Res., 117, D15207, https://doi.org/10.1029/2012JD017668, 2012.
Kanitz, T., Seifert, P., Ansmann, A., Engelmann, R., Althausen, D., Casiccia, C. and Rohwer, E. G.: Contrasting the impact of aerosols at northern and southern midlatitudes on heterogeneous ice formation, Geophys. Res. Lett., 38, L17802, https://doi.org/10.1029/2011GL048532, 2011.
Khain, A., BenMoshe, N., and Pokrovsky, A.: Factors determining the impact of aerosols on surface precipitation from clouds: Attempt of classification, J. Atmos. Sci., 65, 1721–1748, 2008.
Khain, A., Pokrovsky, A., Rosenfeld, D., Blahak, U., and Ryzhkoy, A.: The role of CCN in precipitation and hail in a mid-latitude storm as seen in simulations using a spectral (bin) microphysics model in a 2D dynamic frame, Atmos. Res., 99, 129–146, 2011.
Klemp, J. B., Skamarock, W. C., and Dudhia, J.: Conservative split-explicit time integration methods for the compressible nonhydrostatic equations, Mon. Weather Rev., 135, 2897–2913, 2007.
Korea Meteorological Administration: Seoul, South Korea, National Climate Data Center [data set], available at: https://data.kma.go.kr, last access: 10 November 2021.
Korolev, A.: Limitations of the Wegener–Bergeron–Findeisen Mechanism in the Evolution of Mixed-Phase Clouds, J. Atmos. Sci., 64, 3372–3375, 2007.
Koop, T., Luo, B. P., Tsias, A., and Peter, T.: Water activity as the determinant for homogeneous ice nucleation in aqueous solutions, Nature, 406, 611–614, 2000.
Lance, S., Brock, C. A., Rogers, D., and Gordon, J. A.: Water droplet calibration of the Cloud Droplet Probe (CDP) and in-flight performance in liquid, ice and mixed-phase clouds during ARCPAC, Atmos. Meas. Tech., 3, 1683–1706, https://doi.org/10.5194/amt-3-1683-2010, 2010.
Lebo, Z. J. and Morrison, H.: Dynamical effects of aerosol perturbations on simulated idealized squall lines, Mon. Weather Rev., 142, 991–1009, 2014.
Lee, S., Ho, C.-H., Lee, Y. G., Choi, H.-J., and Song, C.-K.: Influence of transboundary air pollutants from China on the high-PM10 episode in Seoul, Korea for the period October 16–20, 2008, Atmos. Environ., 77, 430–439, 2013.
Lee, S. S., Donner, L. J., Phillips, V. T. J., and Ming, Y.: The dependence of aerosol effects on clouds and precipitation on cloud-system organization, shear and stability. J. Geophys. Res., 113, D16202, https://doi.org/10.1029/2007JD009224, 2008.
Lee, S. S., Kim, B.-G., Yum, S. S., Seo, K.-H., Jung, C.-H., Um, J., Li, Z., Hong, J., Chang, K.-H., and Jeong, J.-Y.: Effect of aerosol on evaporation, freezing and precipitation in a multiple cloud system, Clim. Dynam., 48, 1069–1087, 2016.
Lohmann, U.: Aglaciation indirect aerosol effect caused by soot aerosols, Geophys. Res. Lett., 29, 1052, https://doi.org/10.1029/2001GL014357, 2002.
Lohmann, U. and Diehl, K.: Sensitivity studies of the importance of dust ice nuclei for the indirect aerosol effect on stratiform mixed-phase clouds, J. Atmos. Sci., 63, 968–982, 2006.
Michalakes, J., Chen, S., Dudhia, J., Hart, L., Klemp, J., Middlecoff, J., and Skamarock, W.: Development of a next generation regional weather research and forecast model, in: Developments in Teracomputing: Proceedings of the Ninth ECMWF Workshop on the Use of High Performance Computing in Meteorology, edited by: Zwieflhofer, W. and Kreitz, N., World Sci., Singapore, 269–276, 2001.
Mlawer, E. J., Taubman, S. J., Brown, P. D., Iacono, M. J., and Clough, S. A.: RRTM, a validated correlated-k model for the longwave, J. Geophys. Res., 102, 1663–1668, 1997.
Morrison, A. E., Siems, S. T., and Manton, M. J.: A three year climatology of cloud-top phase over the Southern Ocean and North Pacific, J. Climate, 24, 2405–2418, https://doi.org/10.1175/2010JCLI3842.1, 2011.
Morrison, H. and Grabowski, W. W.: Cloud-system resolving model simulations of aerosol indirect effects on tropical deep convection and its thermodynamic environment, Atmos. Chem. Phys., 11, 10503–10523, https://doi.org/10.5194/acp-11-10503-2011, 2011.
Möhler, O., Field, P. R., Connolly, P., Benz, S., Saathoff, H., Schnaiter, M., Wagner, R., Cotton, R., Krämer, M., Mangold, A., and Heymsfield, A. J.: Efficiency of the deposition mode ice nucleation on mineral dust particles, Atmos. Chem. Phys., 6, 3007–3021, https://doi.org/10.5194/acp-6-3007-2006, 2006.
Naud, C., Booth, J. F., and Del Genio, A. D.: Evaluation of ERA-Interim andMERRA cloudiness in the Southern Ocean, J. Climate, 27, 2109–2124, https://doi.org/10.1175/JCLI-D-13-00432.1, 2014.
Oh, H.-R., Ho, C.-H., Kim, J., Chen, D., Lee, S., Choi, Y.-S., Chang, L.-S., and Song, C.-K.: Long-range transport of air pollutants originating in China: A possible major cause of multi-day high-PM10 episodes during cold season in Seoul, Korea, Atmos. Environ., 109, 23–30, 2015.
Ovchinnikov, M., Korolev, A., and Fan, J.: Effects of ice number concentration on dynamics of a shallow mixed-phase stratiform cloud, J. Geophys. Res., 116, D00T06, https://doi.org/10.1029/2011JD015888, 2011.
Possner, A., Ekman, A. M. L., and Lohmann, U.: Cloud response and feedback processes in stratiform mixed-phase clouds perturbed by ship exhaust, Geophys. Res. Lett., 44, 1964–1972, https://doi.org/10.1002/2016GL071358, 2017.
Pruppacher, H. R. and Klett, J. D.: Microphysics of clouds and precipitation, D. Reidel, 714 pp., 1978.
Ramaswamy, V., Boucher, O., Haigh, J., Hauglustaine, D., Haywood, J., Myhre, G., Nakajima, T., Shi, G. Y., and Solomon, S.: Radiative forcing of climate change, in: Climate Change 2001: The Scientific Basis, edited by: Houghton, J. T., Ding, Y., Griggs, D. J., Noguer, M., van der Linden, P. J., Dai, X., Maskell, K., and Johnson, C. A., Cambridge Univ. Press, New York, 349–416, 2001.
Rangno, A. L. and Hobbs, P. V.: Ice particles in stratiform clouds in the Arctic and possible mechanisms for the production of high ice concentrations, J. Geophys. Res., 106, 15065–15075, https://doi.org/10.1029/2000JD900286, 2001.
Shupe, M. D., Uttal, T., Matrosov, S. Y., and Rrisch, A. S.: Cloud water contents and hydrometeor sizes during the FIRE Arctic clouds experiment, J. Geophys. Res., 106, 15015–15028, https://doi.org/10.1029/2000JD900476, 2001.
Shupe, M. D., Uttal, T., and Matrosov, S. Y.: Arctic cloud microphysics retrievals from surface-based remote sensors at SHEBA, J. Appl. Meteorol., 44, 1544–1562, https://doi.org/10.1175/JAM2297.1, 2005.
Skamarock, W. C., Klemp, J. B., Dudhia, J., Gill, D. O., Barker, D. M., Duda, M. G., Wang, W., and Powers, J. G.: A description of the advanced research WRF version 3, NCAR Tech. Note NCAR/TN-475+STR, Boulder, Colo., 113 pp., 2008.
Stephens, G. L. and Greenwald, T. J.: Observations of the Earth's radiation budget in relation to atmospheric hydrology. Part II: Cloud effects and cloud feedback, J. Geophys. Res., 96, 15325–15340, 1991.
Stevens, B. and Feingold, G.: Untangling aerosol effects on clouds and precipitation in a buffered system, Nature, 461, 607–613, 2009.
Twomey, S.: Pollution and the Planetary Albedo, Atmos. Environ., 8, 1251–1256, 1974.
Twomey, S.: The influence of pollution on the shortwave albedo of clouds, J. Atmos. Sci., 34, 1149–1152, 1977.
Wang, H., Skamarock, W. C., and Feingold, G.: Evaluation of scalar advection schemes in the Advanced Research WRF model using large-eddy simulations of aerosol-cloud interactions, Mon. Weather Rev., 137, 2547–2558, 2009.
Warren, S. G., Hahn, C. J., London, J., Chervin, R. M., and Jenne, R. L.: Global distribution of total cloud cover and cloud types over land, NCAR Tech. Note NCAR/TN-273+STR, National Center for Atmospheric Research, Boulder, CO, 29 pp. + 200 maps, 1986.
Warren, S. G., Hahn, C. J., London, J., Chervin, R. M., and Jenne, R. L.: Global distribution of total cloud cover and cloud type amounts over the ocean, in NCAR/TN-317+STR, National Center for Atmospheric Research, Boulder, CO, 42 pp. +170 maps, 1988.
Wegener, A.: Thermodynamik der Atmosphäre, J. A. Barth, 311 pp., 1911.
Wood, R.: Stratocumulus clouds, Mon. Weather Rev., 140, 2373–2423, 2012.
Young, G., Connolly, P. J., Jones, H. M., and Choularton, T. W.: Microphysical sensitivity of coupled springtime Arctic stratocumulus to modelled primary ice over the ice pack, marginal ice, and ocean, Atmos. Chem. Phys., 17, 4209–4227, https://doi.org/10.5194/acp-17-4209-2017, 2017.
Zuidema, P., Westwater, E. R., Fairall, C., and Hazen, D.: Ship-based liquid water path estimates in marine stratocumulus, J. Geophys. Res., 110, D20206, https://doi.org/10.1029/2005JD005833, 2005.