the Creative Commons Attribution 4.0 License.
the Creative Commons Attribution 4.0 License.
 | 11 Nov 2021
15-year variability of desert dust optical depth on global and regional scales
Stavros-Andreas Logothetis
Vasileios Salamalikis
Antonis Gkikas
Stelios Kazadzis
Vassilis Amiridis
This study aims to investigate global, regional and seasonal temporal dust changes as well as the effect of dust particles on total aerosol loading using the ModIs Dust AeroSol (MIDAS) fine-resolution dataset. MIDAS delivers dust optical depth (DOD) at fine spatial resolution () spanning from 2003 to 2017. Within this study period, the dust burden increased across the central Sahara (up to 0.023 yr−1) and Arabian Peninsula (up to 0.024 yr−1). Both regions observed their highest seasonal trends in summer (up to 0.031 yr−1). On the other hand, declining DOD trends are encountered in the western (down to −0.015 yr−1) and eastern (down to −0.023 yr−1) Sahara, the Bodélé Depression (down to −0.021 yr−1), the Thar (down to −0.017 yr−1) and Gobi (down to −0.011 yr−1) deserts, and the Mediterranean Basin (down to −0.009 yr−1). In spring, the most negative seasonal trends are recorded in the Bodélé Depression (down to −0.038 yr−1) and Gobi Desert (down to −0.023 yr−1), whereas they are in the western (down to −0.028 yr−1) and the eastern Sahara (down to −0.020 yr−1) and the Thar Desert (down to −0.047 yr−1) in summer. Over the western and eastern sector of the Mediterranean Basin, the most negative seasonal trends are computed at summer (down to −0.010 yr−1) and spring (down to −0.006 yr−1), respectively. The effect of DOD on the total aerosol optical depth (AOD) change is determined by calculating the DOD-to-AOD trend ratio. Over the Sahara the median ratio values range from 0.83 to 0.95, whereas in other dust-affected areas (Arabian Peninsula, southern Mediterranean, Thar and Gobi deserts) the ratio value is approximately 0.6. In addition, a comprehensive analysis of the factors affecting the sign, the magnitude and the statistical significance of the calculated trends is conducted. Firstly, the implications of the implementation of the geometric mean instead of the arithmetic mean for trend calculations are discussed, revealing that the arithmetic-based trends tend to overestimate compared to the geometric-based trends over both land and ocean. Secondly, an analysis interpreting the differences in trend calculations under different spatial resolutions (fine and coarse) and time intervals is conducted.
- Article
(24231 KB) - Full-text XML
-
Supplement
(3600 KB) - BibTeX
- EndNote


Dust particles emitted from natural or anthropogenic sources are a major contributor to the atmospheric aerosol burden in terms of mass (Zender et al., 2004; Textor et al., 2006; Kok et al., 2017). Among aerosol properties, aerosol optical depth (AOD) adequately describes aerosol load, in optical terms, corresponding to the entire atmospheric column. The proportion of AOD attributed to dust particles consists of dust optical depth (DOD). The spatiotemporal patterns of mineral particles are determined by the dust life cycle components, characterized by a pronounced heterogeneity (Mahowald et al., 2014). The main natural dust sources are located in the Northern Hemisphere (Goudie and Middleton, 2006), with the Sahara region being the most dominant one (Prospero et al., 2002; Goudie and Middleton, 2006; Rajot et al., 2008; Alizadeh-Choobari et al., 2014a). Other active source areas of mineral particles are situated in the Middle East and the region stretching from Mesopotamia to the Oman coasts on the southern Arabian Peninsula (Prospero et al., 2002; Ginoux et al., 2012), in southwestern Asia and the Sistan Basin (Iran–Pakistan–Afghanistan) (Alizadeh-Choobari et al., 2014b; Rashki et al., 2015), in central Asia across the Karakum (Turkmenistan–Uzbekistan) and Kyzylkum deserts (southeast of the Aral Sea in Uzbekistan) (Elguindi et al., 2016), in East Asia with the Taklamakan (Tarim Basin in northwestern China) and Gobi (northern China–southern Mongolia) deserts (Ginoux et al., 2012), and in North America with the Black Rock and Smoke deserts, the Great Salt Lake Desert, and the Chihuahuan and Sononan deserts (Ginoux et al., 2012).
Mineral dust aerosols are uplifted, accumulated into the atmosphere and transported over enormous distances (up to some thousands of kilometers) from their sources (Goudie and Middleton, 2006) driven by the prevailing winds. Schepanski et al. (2018) reported that the transport distance of dust particles is strongly related to their residence time, which is analogous to the dust lifetime, dust layer altitude, atmospheric circulation pattern, buoyancy and gravitational forces. Van der Does et al. (2018) also determined that strong winds, turbulence, electrostatic forces developed by dust particle charging, and thunderstorms or tropical cyclones may potentially enhance the residence time of dust aerosols in the atmosphere. On a seasonal basis, dust particles can be transported from North Africa towards the Atlantic Ocean, reaching the Caribbean, Central America, the southern United States (in boreal summer) and South America (in spring and winter) (Griffin et al., 2002; Prospero and Lamb, 2003; Kalashnikova et al., 2008; Huang et al., 2010; Tsamalis et al., 2013; Prospero and Mayol-Bracero, 2013). Additionally, Saharan dust is advected towards the Mediterranean and Europe (Mona et al., 2006, 2012; Papayannis et al., 2008; Basart et al., 2009; Schepanski et al., 2018; Gkikas et al., 2015, 2016; Logothetis et al., 2020, 2021).
During the last decades, numerous studies have been conducted using observations from various satellite sensors. Prospero et al. (2002) and Ginoux et al. (2012) identified global dust sources by relying on the Total Ozone Mapping Spectrometer (TOMS; Torres et al., 2002) and Moderate Resolution Imaging Spectroradiometer (MODIS; Remer et al., 2008), respectively. More specifically, the studies of Prospero et al. (2002) and Ginoux et al. (2012) were based on the frequency of occurrence (FoO) of the TOMS absorbing aerosol index (AAI) and MODIS-based DOD, respectively, exceeding defined thresholds. In addition, Ginoux et al. (2012) associated the dust frequency with three clusters, such as hydrologic and non-hydrologic natural or anthropogenic, in order to distinguish the dust origin. Similarly, at a regional scale, Schepanski et al. (2012) implemented a comprehensive analysis o the potential differences of Saharan dust active sources within the intercomparison of aerosol property observations derived from MODIS, as well as the Meteosat Second Generation (MSG) and Ozone Monitoring Instrument (OMI). Voss and Evan (2020) presented a global DOD climatology over both land and ocean using MODIS (Aqua and Terra) from 2001 to 2018 and the Advanced Very High Resolution Radiometer (AVHRR) over ocean from 1981 to 2018. Similarly, Clarisse et al. (2019) derived a global seasonal DOD climatology relying on Infrared Atmospheric Sounding Interferometer (IASI) retrievals during 2008–2017. Yu et al. (2019) derived DOD using MODIS, IASI and the Multiangle Imaging Spectroradiometer (MISR); in conjunction with dust vertical profiles from the Cloud–Aerosol Lidar with Orthogonal Polarization (CALIOP) (Shikwambana and Sivakumar, 2018), they investigated the dust deposition and loss frequency across the tropical Atlantic Ocean on a seasonal basis.
The investigation of dust load variation at interannual timescales is quite critical for assessing the associated impacts on climate and the response of these tendencies to environmental factors. Since the majority of remote sensing instruments provide an AOD product, numerous studies on a global scale are focused on the estimation of AOD temporal trends, which are not always representative of DOD, being mixed with other aerosol types (Zhang and Reid, 2010; de Meij et al., 2012; Hsu et al., 2012; Yoon et al., 2014; Pozzer et al., 2015; Alfaro-Contreras et al., 2017; Zhao et al., 2017; Che et al., 2019) and on regional scales (Guo et al., 2011; Li, 2014; Klingmüller et al., 2016; Floutsi et al., 2016; Dahutia et al., 2017; Hu et al., 2018; Zhang et al., 2018). Limited satellite studies are dedicated to the estimation of DOD temporal trends due deficiencies in accurately quantifying the portion of AOD attributed to DOD. Prior studies have investigated the interannual patterns of DOD over the “dusty” regions of the planet. The dust load increased across the Sahara based on a MODIS/Aqua-derived DOD dataset during 2003–2018 (Voss and Evan, 2020). Notaro et al. (2015) detected a regime shift in dust activity between 1998–2005 (inactive dust period) and 2007–2013 (active dust period) across the Arabian Peninsula, which is attributed to the prolonged drought along the Fertile Crescent. Through the synergy of MISR DODs and back trajectories, they revealed that the positive DOD anomalies (increased dust burden) are strongly connected with dust advection from the Fertile Crescent towards the Arabian Peninsula. These findings are consistent with the strong positive AOD (Klingmüller et al., 2016) and DOD (Voss and Evan, 2020) trends reported in the area. Voss and Evan (2020) found a reduction of dust load across the northern African coasts over the period 2001–2018 based on a MODIS/Terra DOD dataset. Declining DOD trends have also been reported in central Asia by Xi and Sokolik (2015), who analyzed MODIS and the Sea-viewing Wide Field-of-view Sensor (SeaWiFS) DODs for a 15-year period (2000–2014). The DOD trend sign has also abruptly changed from positive (1999–2009) to negative (2010–2016) over East Asia and the North Pacific Ocean in springtime based on the Modern-Era Retrospective Analysis for Research and Applications Version 2 (MERRA-2) (Gelaro et al., 2017) measurements (Guo et al., 2019). Across South Asia, a negative shift in DOD interannual variation is recorded during the pre-monsoon season between 2008–2012 and 2013–2017 based on CALIOP observations (Lakshmi et al., 2019). In the southern sector of the Gobi Desert, declining DOD trends are observed from MODIS and CALIOP DOD datasets during 2007–2019 (Song et al., 2021).
This study's main objective is to investigate dust temporal variations at global, regional and seasonal scales using the new MIDAS DOD product from 2003–2017. A few aspects regarding the innovative points of this research are highlighted below to support the scientific contribution to the relevant research field. First, in contrast to the existing studies, this trend analysis relies on fine-spatial-resolution data, making it feasible to depict the spatial patterns of DOD variations in detail. Such information can be critical for interpreting perturbations of the radiation fields, environmental impacts and health effects attributed to dust particles. One more advantage of the high-resolution DOD analysis is the flexibility of the final grid size selection depending on data availability, which is a critical aspect when satellite observations are used. MIDAS data can be easily upscaled at coarser spatial resolutions in order to match spaceborne observations, which have been commonly used in other trend analyses available in the literature (Hsu et al., 2012; Yoon et al., 2014; Notaro et al., 2015; Pozzer et al., 2015; Klingmüller et al., 2016; Alfaro-Contreras et al., 2017; Che et al., 2019; Guo et al., 2019; Voss and Evan, 2020; Song et al., 2021). In addition, fine-spatial-resolution data ensure a more realistic collocation with ground-based measurements for validating the obtained DOD trends. Second, quite a few studies concentrate on pure DOD (Xi and Sokolik, 2015; Guo et al., 2019; Lakshmi et al., 2019; Voss and Evan, 2020; Song et al., 2021) rather than AOD to analyze the trends of mineral particle load. Even though the consideration of the latter parameter is quite reasonable across deserts, its representativeness over downwind areas is questionable due to the co-existence of other aerosol types. Such types can also affect the DOD trend uncertainty. In MIDAS, this issue is addressed by the adjustment of MODIS AOD to DOD in terms of the MERRA-2 dust fraction, while in other studies, aerosol size and natural optical properties, the quality of which above land is downgraded, are used in parallel. Third, taking advantage of MIDAS providing DOD and quality-assured AOD, their trends are discussed jointly for assessing the contribution of dust burden temporal variations to those of the total aerosol load. It should be mentioned that this is the first study assessing the effect of DOD on total AOD trends across the major desert dust areas of the planet, highlighting the potential role of desert dust particles in past, present and future AOD trend studies. Fourth, there is an investigation of the potential impact on trend magnitude, sign and statistical significance when different DOD aggregations (i.e., arithmetic mean vs. geometric mean) are considered among various spatial and temporal scales. Fifth, the DOD interannual variations are discussed for the entire study period on a seasonal basis and sub-periods for detecting alternations in DOD trends within the period of interest.
The current paper is organized as follows. Section 2 describes the (i) MIDAS (Sect. 2.1) and (ii) AERONET (Sect. 2.2) datasets as well as the trend detection methodology (Sect. 2.3). The Results section (Sect. 3) is divided into three sub-sections analyzing (i) the global AOD and DOD tendencies (Sect. 3.1), along with the sensitivity analyses between arithmetic and geometric means (Sect. 3.1.1), fine () and coarse () spatial resolutions (Sect. 3.1.2), MIDAS DOD and AERONET retrievals (Sect. 3.1.3), filtered and non-filtered data trend calculations (Sect. 3.1.4), (ii) global dust temporal trends on a seasonal basis (Sect. 3.2), and (iii) DOD temporal tendencies in specific regions (Sect. 3.3). Finally, a discussion focusing on the main findings of this study is presented in the “Summary and conclusions” section (Sect. 4). The current study represents a practical implementation of the MIDAS dataset and aims to demonstrate its feasibility for the estimation of dust load variation at various temporal and spatial scales.
2.1 ModIs Dust AeroSol (MIDAS) dataset
The MIDAS dataset (Gkikas et al., 2021a) provides columnar DOD at 550 nm on a daily basis over the 15-year period spanning from 2003 to 2017 at a global scale and fine spatial resolution (). Its development has relied on the synergistic implementation of quality-filtered AOD retrievals from MODIS/Aqua (Level 2; Collection 6.1) and MERRA-2 dust fraction (MDF), both reported at 550 nm. More specifically, the multiplication of MODIS/Aqua AOD with MDF provides the MIDAS DOD on the MODIS native grid, which is converted to an equidistant lat–long projection. In order to justify the reliability of MDF, it has been evaluated against the corresponding portion provided by the LIVAS database (Amiridis et al., 2013, 2015). Based on the aforementioned assessment analysis, an adequate representation of the MERRA-2 dust fraction, in optical terms, has been revealed over the main dust sources and the outflow regions, in contrast to areas where dust presence is weak. MIDAS implements the MODIS aerosol products in which AOD is derived using the Dark Target (DT) and Deep Blue (DB) algorithms. Globally, these products have been thoroughly validated against AERONET, providing very good agreement either over oceanic areas for DT (R=0.880; MAE =0.055; RMSE =0.083) or over land for DT (R=0.920; MAE =0.066; RMSE =0.107) and DB (R=0.904; MAE =0.062; RMSE =0.107) (Wei et al., 2019b). Therefore, the combination of highly accurate MODIS AODs (Wei et al., 2019b) and quite reliable MDF results in a trustworthy MIDAS DOD product, as has been justified via its evaluation against AERONET dust-like AOD and its intercomparison versus DOD derived by LIVAS and MERRA-2. For the former analysis, ground-based AODs have been treated appropriately in order to resemble DOD as much as possible, assuming that the contribution of fine mineral particles is negligible and trying to minimize the contribution of non-dust aerosol species to the columnar aerosol load. Under these assumptions, the evaluation metrics at both global and station level reveal quite a high level of agreement between the two datasets. At global scale, there is a high level of agreement between MIDAS and AERONET DODs as indicated by the high correlation (∼0.9) and the low positive bias (0.004 or 2.7 %). Across the “dust belt”, the correlation coefficients can reach up to 0.98 at station level, whereas positive biases (mostly lower than 0.06) are found. Outside this zone, the correlation reduces, and the biases of similar magnitude switch to negative. Likewise, considerable consistency is evident among MIDAS, LIVAS and MERRA-2 DODs at global and hemispherical scales, despite the different approaches applied for the DOD derivation, whereas the intercomparison results are regionally dependent. Summarizing, the reliability of the MIDAS DOD justified in Gkikas et al. (2021a) strengthens its applicability for investigating the temporal trends of dust aerosol burden over long time periods and at various spatial scales.
2.2 AERONET
On a regional basis, the reliability of MIDAS DOD trends has been evaluated using ground-based measurements from AERONET (Holben et al., 1998). AERONET provides information for the spectral columnar AOD using direct spectral solar irradiance. In addition, the physical and optical properties of aerosols can be derived by applying the Dubovik and King (2000) inversion algorithm. DOD ground-based measurements can be approached using AERONET retrievals; however, an aerosol classification scheme is mandatory. Through the MIDAS evaluation procedure, the discrimination of dust load from non-dust aerosol species has been performed in terms of the Ångström wavelength exponent at 440–870 nm (AE440−870 nm) and the difference between single-scattering albedo at 440 nm (SSA440 nm) and 675 nm (SSA675 nm). AE440−870 nm has been used as an indicator of particles size (coarse or fine aerosols) in numerous aerosol classification studies (Basart et al., 2009; Mielonen et al., 2009; Lee et al., 2010; Giles et al., 2012; Hamill et al., 2016; Zheng et al., 2017; Che et al., 2018; Logothetis et al., 2020). In addition, the aerosol origin can be acquired using either the difference between SSA at different wavelengths or specific spectral SSA thresholds. In Gkikas et al. (2021a), pure dust conditions were successfully produced using a very restricted threshold limit of AE440−870 nm (≤0.75) along with a positive difference of SSA675 nm − SSA440 nm. Despite the favorable dust conditions retrieved through the SSA retrievals, the data availability strongly decreases, causing difficulties in trend calculations. In the current study, the evaluation of MIDAS DOD trends is performed by using the AERONET coarse-mode AOD at 500 nm, derived from the spectral deconvolution algorithm (SDA) (O'Neill et al., 2001, 2003). The performance of the SDA algorithm, in terms of segregating the fine and coarse aerosol modes, has been justified against ground-based observations (Kaku et al., 2014). Only quality-assured data (cloud-screened), including pre-field and post-field calibrations (Level 2.0, L2) from AERONET version 3 (V3) (Giles et al., 2019), are used. It should be mentioned that cAOD does not profoundly represent the dust load due to the presence of sea-salt particles.
2.3 Temporal trend methodology
The spatiotemporal changes in dust particle burden over the period 2003–2017 are investigated by calculating the annual trends derived by the monthly MIDAS DODs. At each grid cell, the monthly DOD averages are calculated when 20 % (≥6 d) of daily data are available (Hsu et al., 2012). Subsequently, at the grid points with more than 60 months available (5 out of 15 complete years), linear trends are calculated by the implementation of the following equation:
where Yt represents the monthly averaged values, μ the offset term, St the seasonal term (i.e., long-term monthly value), ω the linear trend and Nt the residuals. The seasonality is removed by subtracting St from Yt. The statistical significance of ω is derived according to Weatherhead et al. (1998). Nt follows a first-order autoregressive process (significant lag-1 autocorrelation),
with εt as the white noise and φ the lag-1 autocorrelation coefficient. The standard deviation of the trend can be expressed as
where σN is the standard deviation of Nt and n is the number of complete years depending on the data availability at each grid cell without always considering the entire period (i.e., a constant value of 15 years). When , significant temporal trends are considered at a 95 % confidence level. The methodology of Weatherhead et al. (1998) is commonly applied in numerous studies concerning the detection of temporal trends in AOD (Hsu et al., 2012; Babu et al., 2013; Li et al., 2014; Kumar et al., 2015, 2018; Pozzer et al., 2015; Adesina et al., 2016; Alfaro-Contreras et al., 2017; Zhang et al., 2018; Ningombam et al., 2019). Additionally, for comparison purposes with previous studies, AOD and DOD linear trends are also calculated at 1∘ spatial resolution. The re-gridding procedure from fine to coarse spatial resolution is implemented following Levy et al. (2009) (upper branch in Fig. 5 of their publication). For the calculation of regional trends (Sect. 3.3), the same approach is adopted. First, daily spatial grids of 0.1∘ are temporally averaged to create monthly data. Then, monthly grids with 1∘ spatial resolutions are generated using a weighted aggregation of monthly fine grids. The weighting factors are defined in terms of latitude. More specifically, this weighting scheme considers the fraction between the area covered by each fine grid cell and the total available surface area within the coarse grid cell.
The appropriate selection of the statistical average metric (e.g., arithmetic or geometric mean) is reflected in the background probability distribution, which the raw data resemble. For instance, the vast majority of the studies focusing on AOD statistics have thoroughly considered AOD to follow a Gaussian distribution using the simple arithmetic mean for temporal and spatial aggregations. Nevertheless, the frequency distribution of AOD is more well fitted to the lognormal distribution (O'Neill et al., 2000). Sayer and Knobelspiesse (2019) determined that the calculation of the geometric instead of the arithmetic mean for obtaining temporal and spatial AOD trends may underestimate them compared to those reported in the literature. Here, in order to investigate the potential differences in AOD and DOD temporal trends, a sensitivity analysis using both the geometric and arithmetic mean is established. The MIDAS dataset includes negative DOD values introduced from the applied Dark Target algorithm of MODIS AOD retrievals. Since zero or negative arguments of logarithm cannot be defined, all these values are overwritten to 0.0001 as suggested by Sayer and Knobelspiesse (2019).
This section is divided into three main parts. Section 3.1 describes the geographical distribution of AOD and DOD trends at global scale by simultaneously performing a sensitivity analysis of (i) the aggregation metric (geometric vs. arithmetic mean), (ii) the spatial resolution (fine vs. coarse), (iii) MIDAS trend evaluation (DOD vs. cAOD trends) and (iv) the applied temporal criteria (filters vs. no filters). In Sect. 3.2, focus is given to the seasonal DOD trends, whereas in Sect 3.3 emphasis is given to DOD trends in 12 regions of interest.
3.1 Global trends
3.1.1 Geometric vs. arithmetic mean
The overwhelming majority of the published AOD DOD trend analysis studies have relied on the arithmetic mean in order to produce coarser spatial (e.g., ) and temporal (e.g., monthly values) resolutions. In this study, a sensitivity analysis of the aggregation method (i.e., arithmetic vs. geometric mean) has been performed by utilizing the daily coarse-spatial-resolution () MIDAS DODs. Figure 1 depicts the frequency histogram of MIDAS DODs in log scale using all the available data over the period 2003–2017. It is apparent that the shape of the DOD distribution is close to a lognormal distribution (Fig. 1). The latter considers extreme dust episodes, which force the distribution curve to be right-skewed. The arithmetic mean is about 4 times higher than the geometric mean, highlighting the importance of which metric is more representative of the population and how this can affect the results for specific applications (e.g., radiative forcing). When the geometric standard deviation is considered, 65.43 % of DOD values range between 0.002 and 0.027, while 81.04 % encompasses −0.033 to 0.099 for the arithmetic mean, indicating an overstating of the variability (Sayer and Knobelspiesse, 2019). The averages and the standard deviations are calculated using weighted aggregation expressions with the weighting factors in terms of latitude (see Sect. 2.3). An additional point, revealing that the selection of normal statistics can lead to a misrepresentation of the population for a positive-definite quantity (i.e., dust optical depth), is that the lower bound (−0.033) is negative, which does not have any physical meaning.
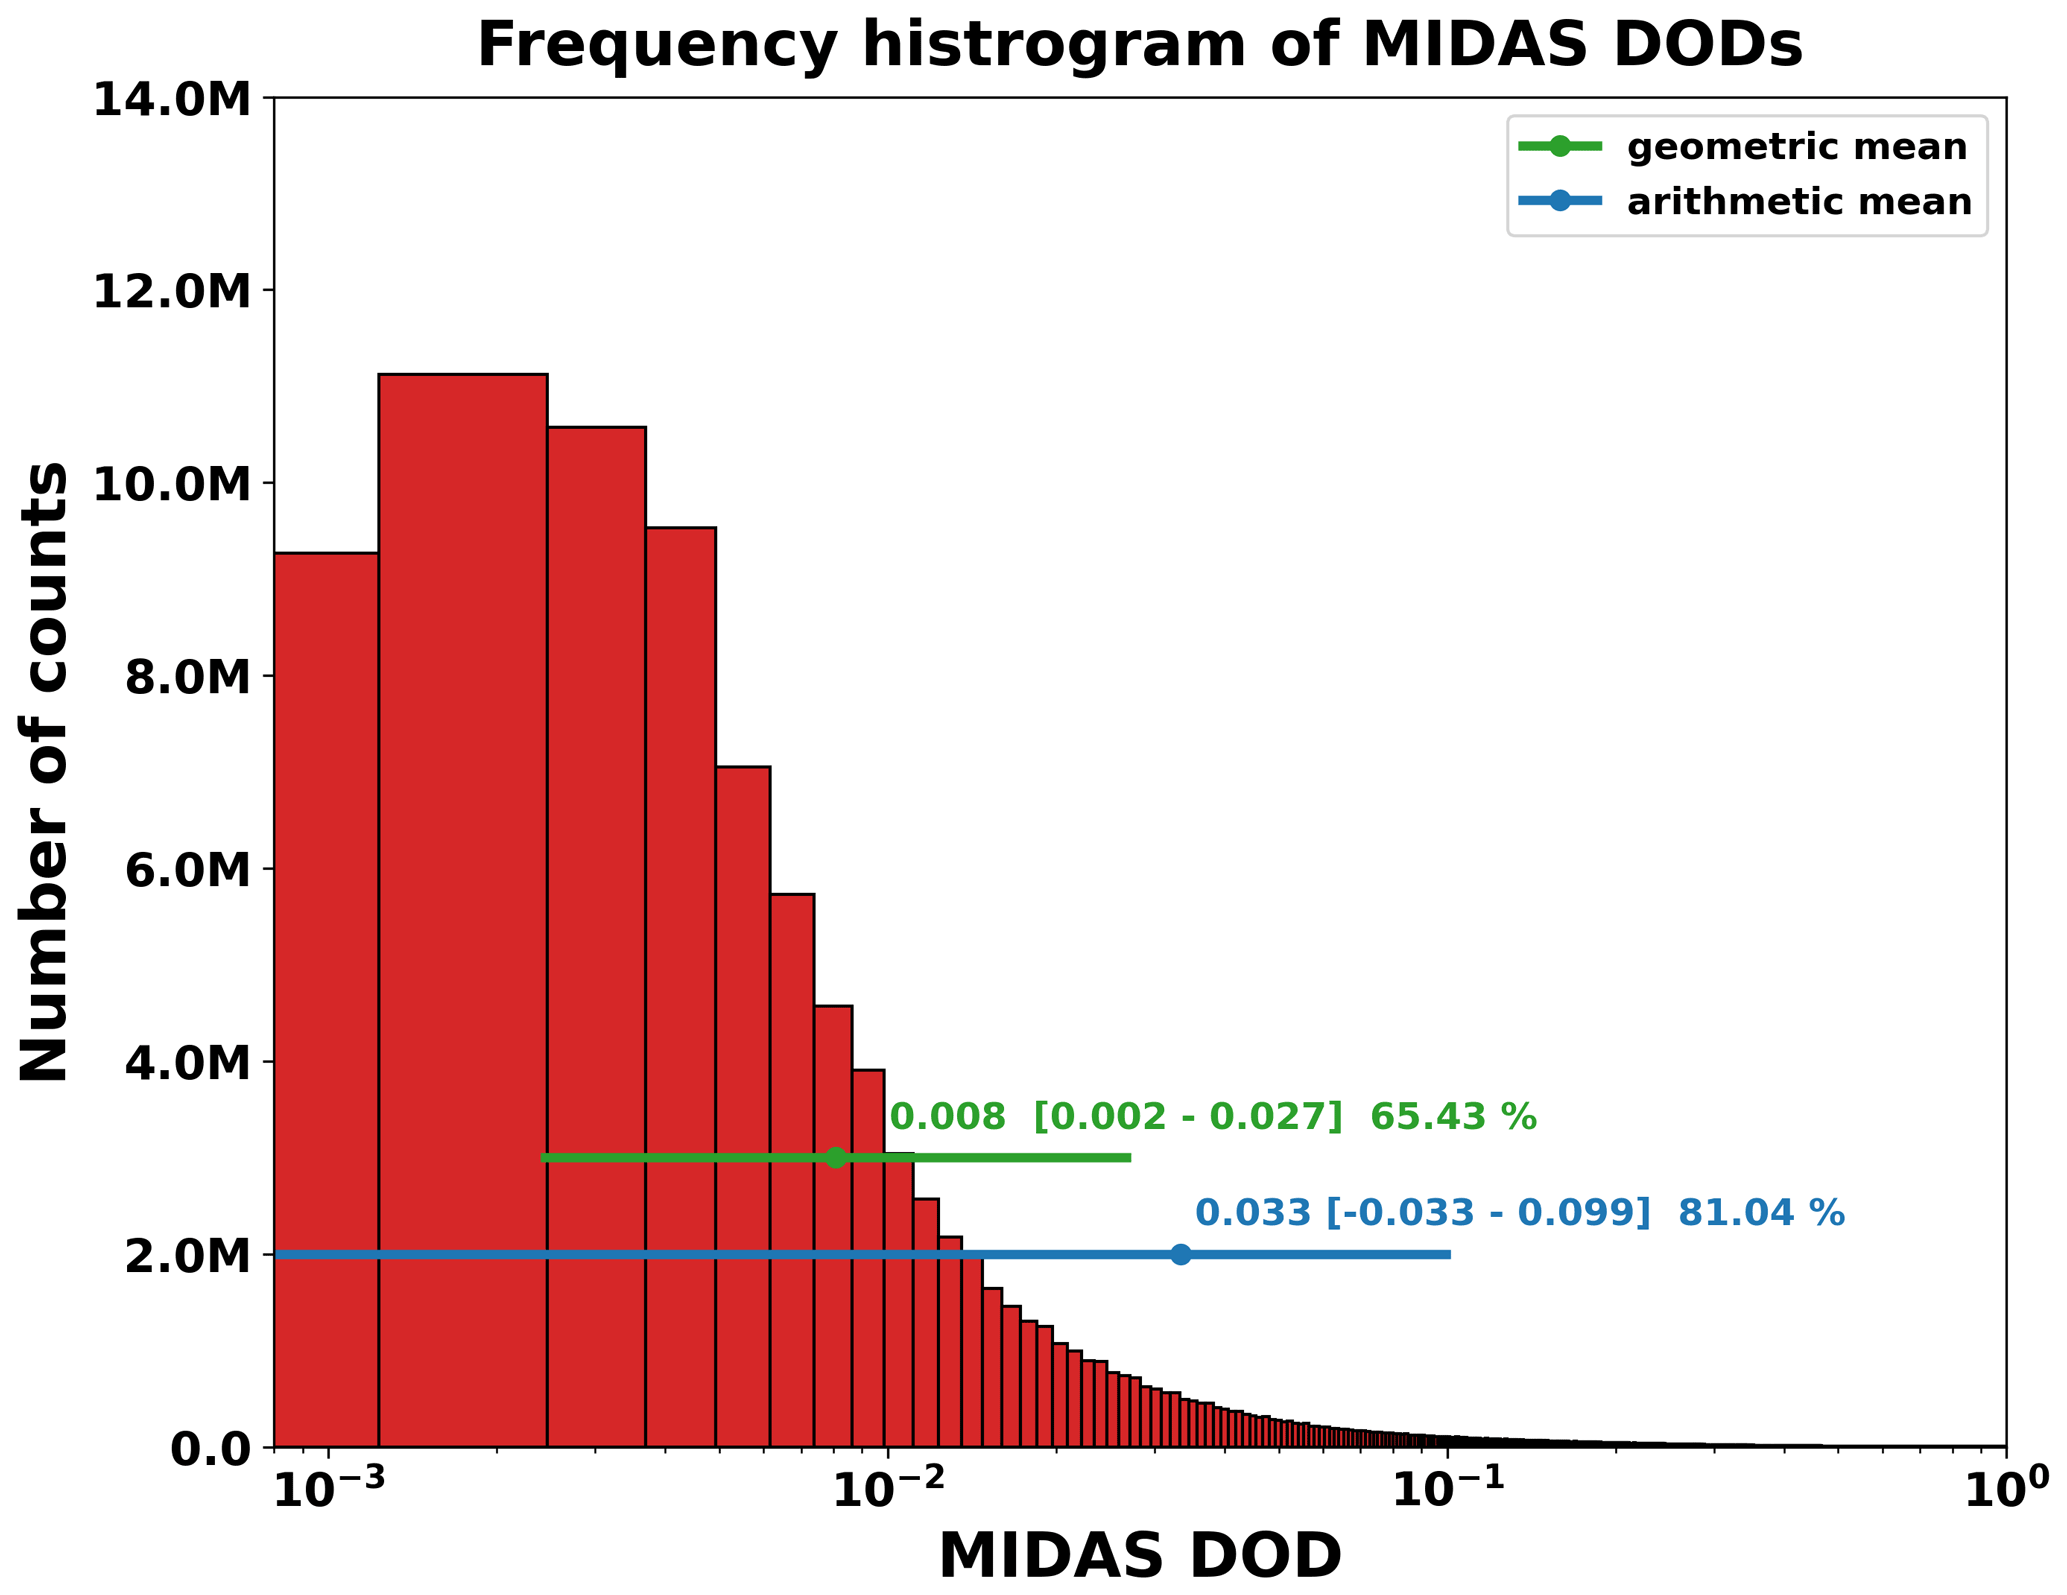
Figure 1Frequency histogram of MIDAS DODs reported at spatial resolution over the period 2003–2017. The computed geometric mean (green) and arithmetic mean (blue) are given along with ranges corresponding to the geometric mean geometric standard deviation and geometric mean × geometric standard deviation for the geometric mean and ± standard deviation for the arithmetic mean.
In agreement with Sayer and Knobelspiesse (2019), the calculated trends for AOD and DOD are consistent in terms of sign between fine-spatial-resolution (Fig. 2) and coarse-spatial-resolution (Fig. 3) data. However, in terms of magnitude this is not the case. Figures S1 and S2 depict the frequency histograms of the deviations between the arithmetic and geometric trends. When geometric AOD DOD averages are considered, the deseasonalized trends are suppressed by up to 91.77 % with respect to the corresponding levels obtained from the arithmetic means, regardless of the underlying surface type. The only exception is found for AOD at 1∘ spatial resolution and across oceanic territories (Fig. S2c) where geometric trends overestimate arithmetic trends by 71.63 %.
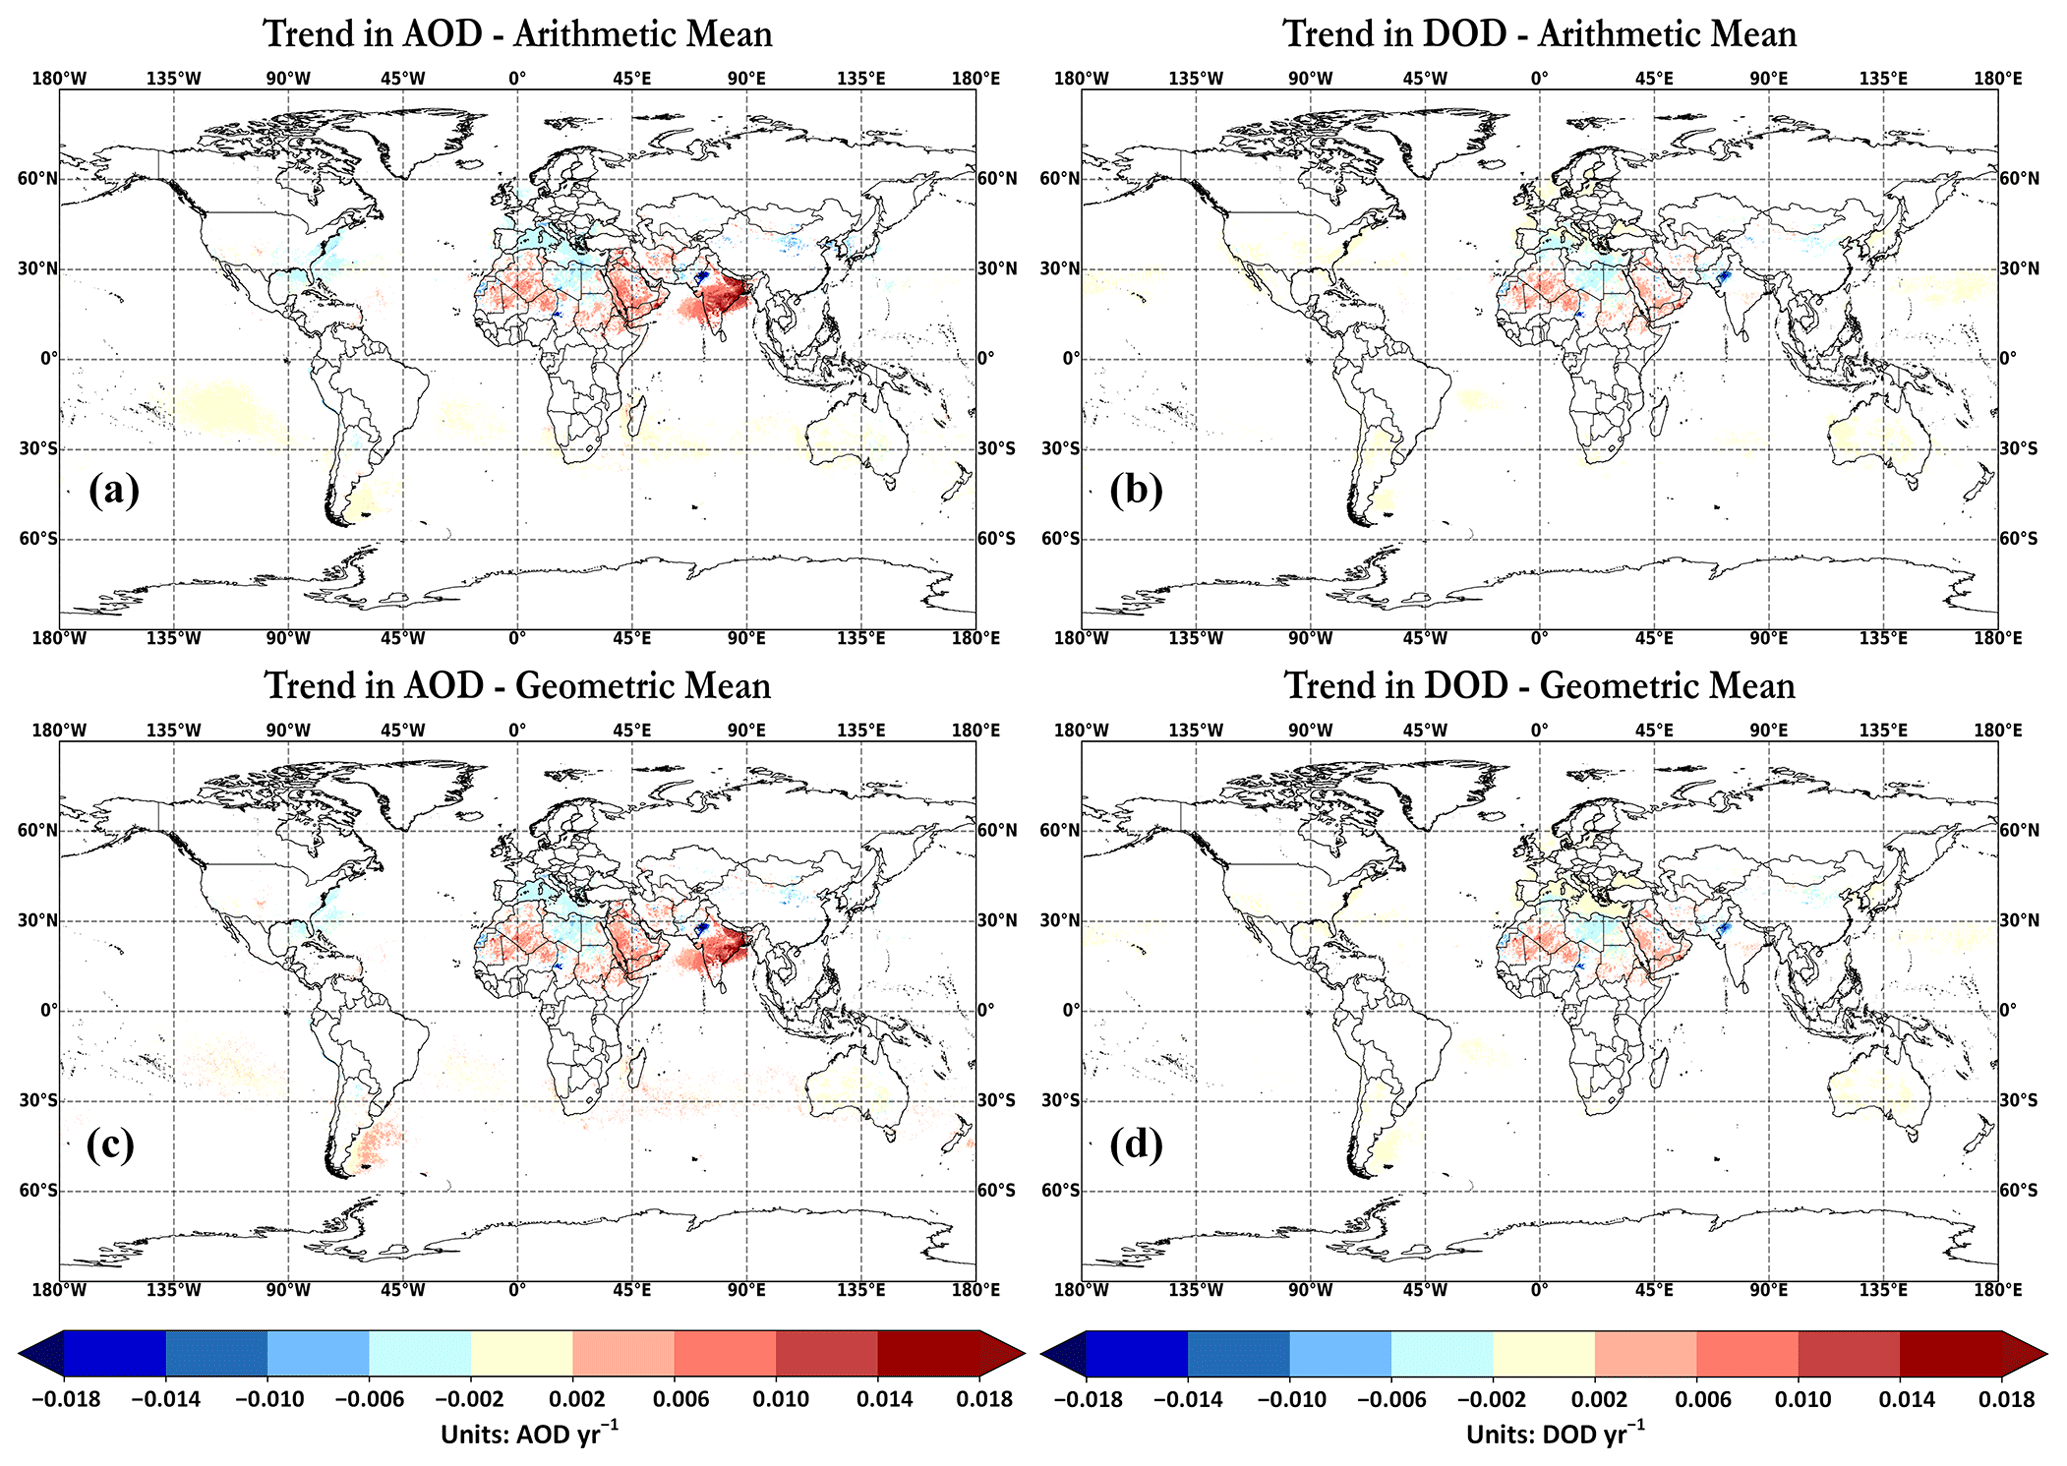
Figure 2Global maps of temporal trends (statistically significant at 95 % confidence level) at spatial resolution calculated from the deseasonalized AOD (a) and (c) and DOD (b) as well as (d) monthly values during 2003–2017. The upper panels, (a) and (b), show the arithmetic-based trends, while panels (c) and (d) indicate the geometric-based trends. For the pixels with (1) non-significant trends, (2) the temporal criteria are not met and (3) non-available data are colored white (blank) in each map of the trend analysis. Neutral trends, ranging between −0.002 and 0.002 DOD yr−1, are colored light yellow (or cream) (the central color of the color bar). Figure S3a, b and S4 present the differences between the aforementioned colors at fine and coarse spatial resolution as well as for the seasonal trends, respectively. Based on those figures, the pixels with no available data are colored gray, while those that fail to meet the availability criteria are colored greenish.
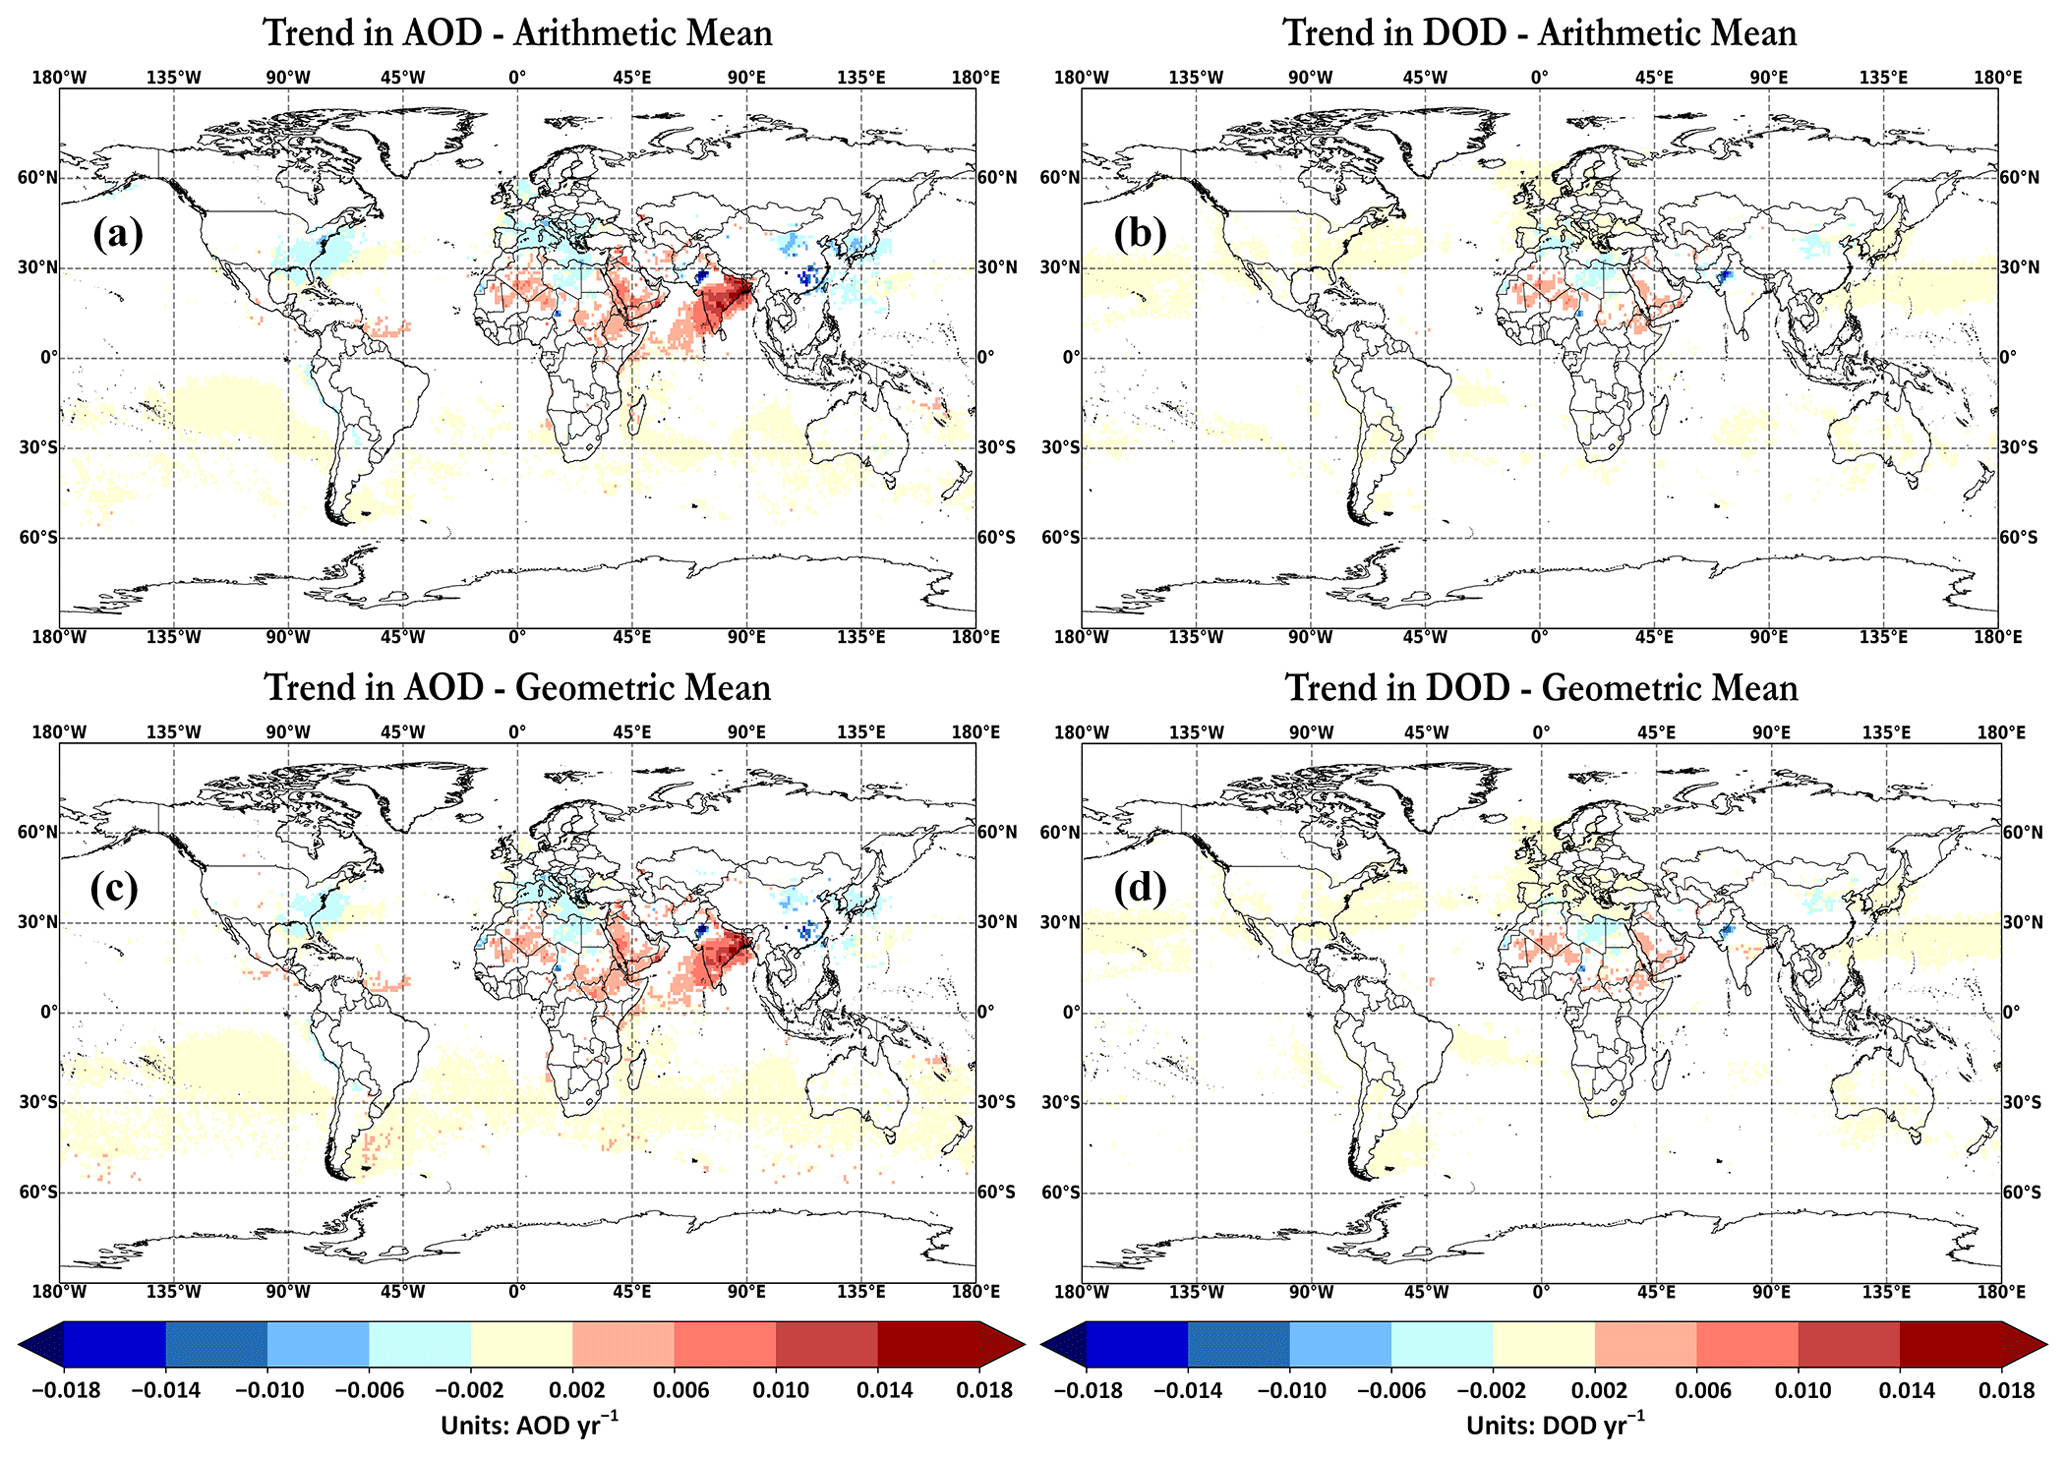
Figure 3Same as Fig. 2 at spatial resolution.
Across the dust-affected regions of the planet, the calculated AOD and DOD trends have revealed similar patterns. Over areas where the dust contribution to the total aerosol load is negligible, DOD trends are non-significant or neutral. For instance, strong positive AOD trends are depicted across India and the Bay of Bengal (Fig. 2a and c), whereas the recorded annual DOD tendencies are negligible (Fig. 2b and d). Similar findings are evident along the eastern coasts of the US and in the Gulf of Mexico. In the Mediterranean Basin, disparities are recorded between AOD and DOD trends. Negative AOD trends are shown in the entire region, with decreasing DOD trends confined to the southern areas near the North African coast (Fig. 2b and d). In addition, strong positive trends for AOD and DOD are revealed in the central Sahara (up to 0.026 yr−1), across Mauritania–Algeria–Mali–Niger and the Arabian Peninsula. The highest positive tendencies are shown along the Oman–Saudi Arabia borders (up to 0.031 yr−1). In contrast, decreasing AOD DOD tendencies are observed in the eastern (down to −0.017 yr−1) and western (down to −0.019 yr−1) Sahara, in the Bodélé Depression of the Chad Basin (north of Lake Chad), in the Gobi Desert (northern China–southern Mongolia), and in the Thar Desert (northwestern Indian subcontinent). Among the regions where declining tendencies are evident, the most negative ones are recorded in the Bodélé Depression (down to −0.025 yr−1) and in the Thar Desert (down to −0.029 yr−1). A comprehensive regional analysis including intercomparison with prior findings and the potential trend justification is discussed in Sect. 3.3.
3.1.2 Fine vs. coarse spatial resolution
The second sensitivity analysis aims to highlight differences of AOD DOD trends when the fine and coarse spatial resolutions of MIDAS data are contrasted. De Meij et al. (2012) have investigated the differences between the fine daily MODIS AOD (L2; at spatial resolution) and the coarse monthly MODIS AOD (L3; at spatial resolution) in trend calculations utilizing the Collection 5 (C005) retrievals. According to their study, good agreement was found between the L2 and L3 AOD trends over specific areas (i.e., central Mediterranean, northeastern America and East Asia). At first glance, the trend patterns reproduced by the fine (Fig. 2) and coarse (Fig. 3) MIDAS DODs are spatially consistent. Nevertheless, in terms of magnitude, the absolute values of DODs at coarser spatial resolution are lower in most areas with an evident signal (either positive or negative), such as the southern parts of the Arabian Peninsula (up to 0.014 yr−1), the Bodélé Depression (down to −0.015 yr−1) and the Thar Desert (down to −0.024 yr−1). Coarser grid cells, in contrast to the finer spatial resolution, meet the data availability threshold (≥60 months) (Fig. S3) defined for the calculation of temporal trends because of their more extensive spatial coverage. MIDAS adequately meets the temporal criteria (Sect. 2.2) at both fine (Fig. S3a) and coarse (Fig. S3b) spatial resolutions, providing grid cells of long-term AOD DOD time series along with significant AOD (Figs. 2a and c, 3a and c) and DOD (Figs. 2b and d, 3b and d) tendencies. Trend analysis for the coarse grids yields a higher number of significant AOD tendencies globally (Fig. 3a and b). For instance, new and significant declining coarser AOD trends are observed in East Asia, particularly across Southeast Asia, the Yellow Sea, the Sea of Japan and the North Pacific Ocean. Similarly, new increasing AOD trends are reported in the southern Arabian Sea and the North Atlantic Ocean near the coast of Venezuela.
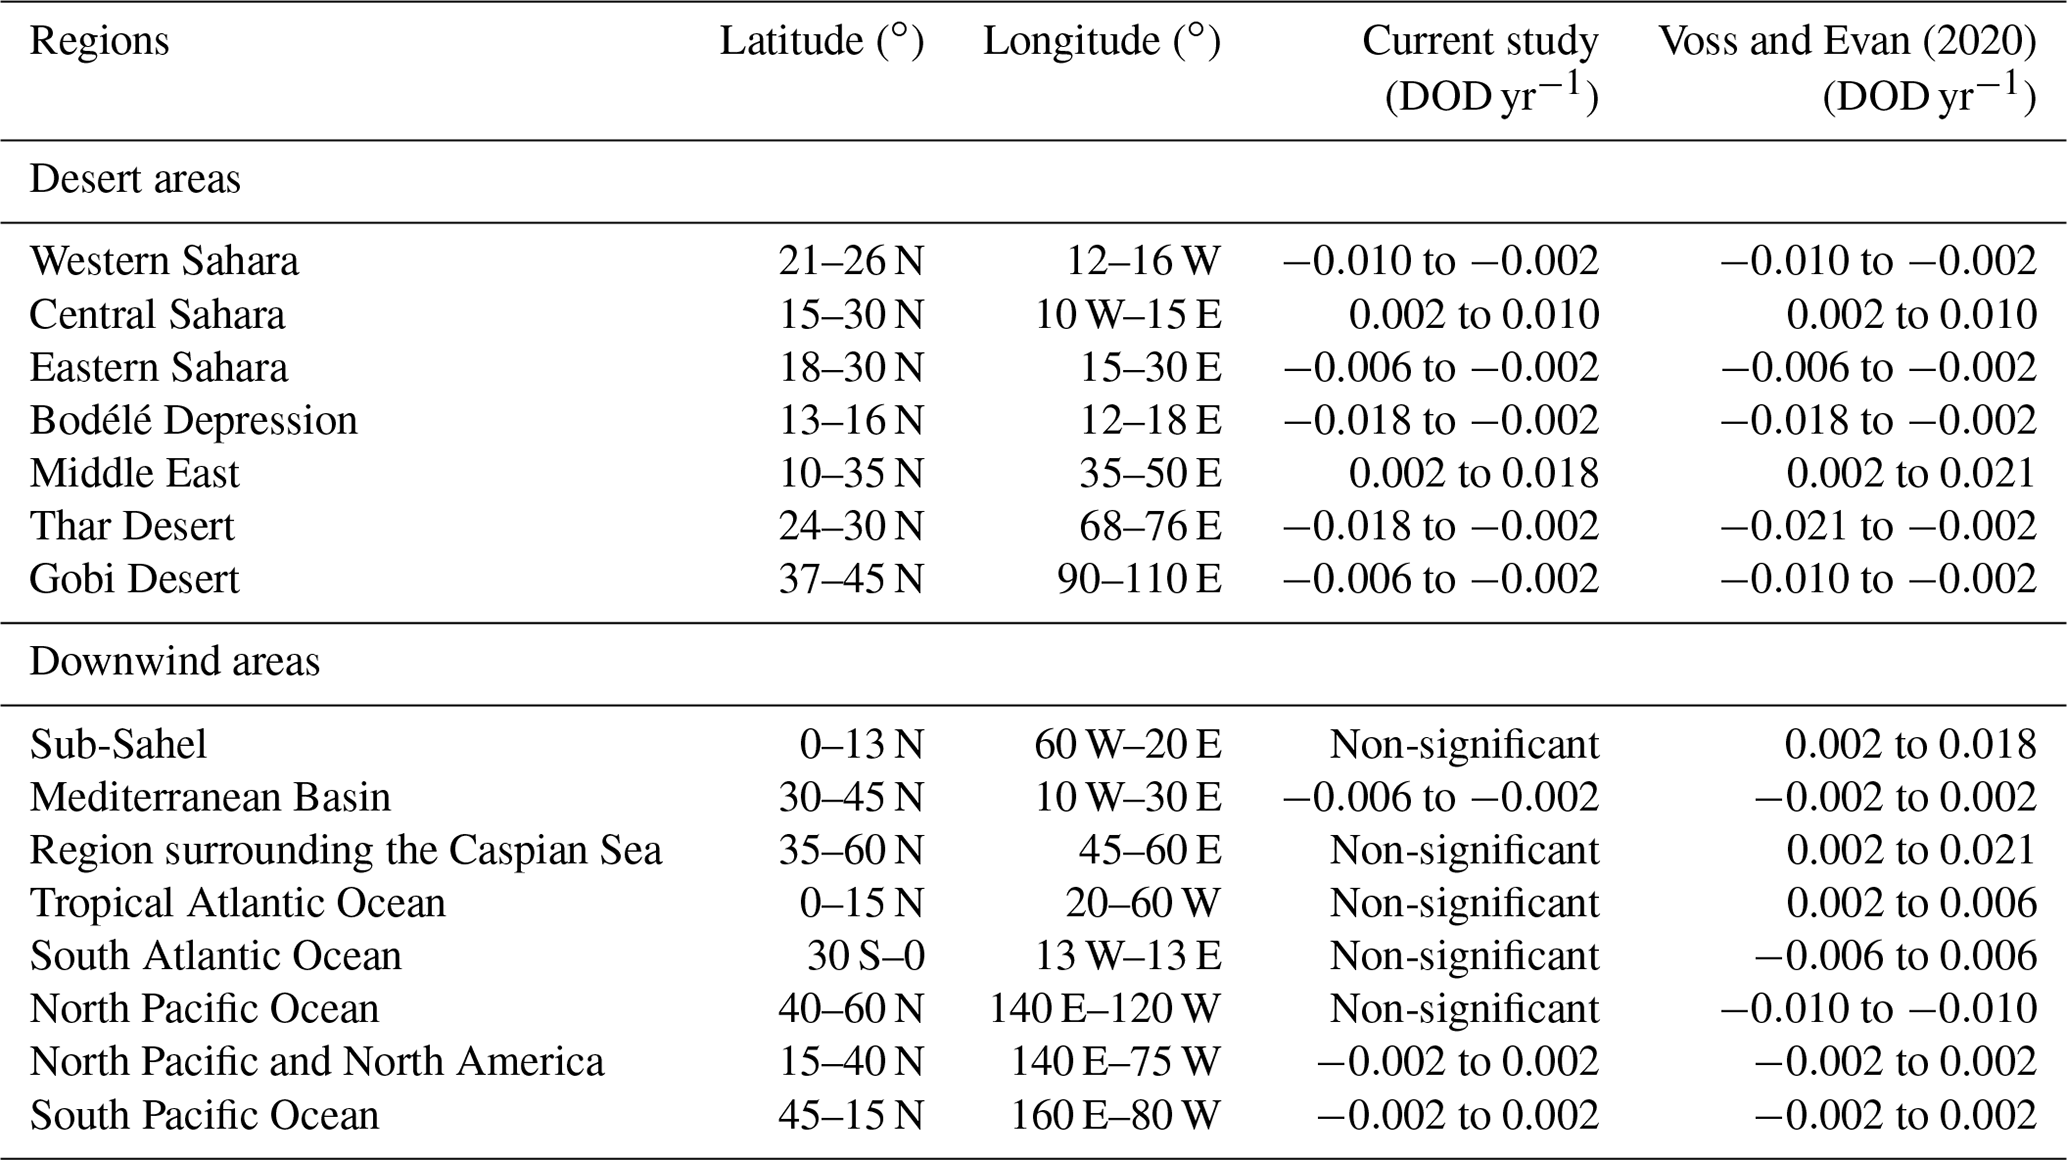
Voss and Evan (2020) generated two global DOD datasets using MODIS retrievals, combined with reanalysis data and AERONET inversion retrievals. They estimated the decadal DOD trends (see their Fig. 11a and b) based on MODIS/Terra (2001–2018) and MODIS/Aqua (2003–2018) data projected at an equal lat–long 1∘ spatial resolution. In order to compare the findings in this study against Voss and Evan (2000), only arithmetic DOD trends are used at the same grid cell spatial resolution (Fig. 3b). In addition, since the MIDAS dataset relies on MODIS/Aqua retrievals (Sect. 2.1), only their DOD MODIS/Aqua dataset is used for comparison. Table 1 displays the ranges of DOD trends between the two datasets over 15 desert and downwind areas of the globe. The selection of the above regions is accomplished based on the areas in which statistically significant DOD trends are revealed in the Voss and Evan (2020) study. Over the Sahara, the Bodélé Depression and the Thar desert, identical significant trends in terms of magnitude and sign are recorded in both studies. Over the Arabian Peninsula, the trends calculated here are common in terms of sign but lower in terms of magnitude. More specifically, the current study reports declining DOD trends along the Mediterranean Basin, while Voss and Evan (2020) did not find any significant trends. On the other hand, they reported strong positive trends over the tropical Atlantic Ocean, the sub-Sahel, the northeastern Middle East, and the northeastern Caspian and Aral Sea, which is not the case here. Trend inconsistencies are revealed because of (a) the derivation algorithm of DOD, (b) the trend detection methodology, (c) the different study periods and (d) the temporal filtering criteria.
Table 1Comparison of the computed DOD trends between the current study and Voss and Evan (2020) over 15 regions of interest.
3.1.3 Evaluation of MIDAS trends vs. AERONET
The validity of the computed MIDAS DOD trends is thoroughly analyzed in this section. For evaluation purposes, the coarse-mode AOD, hereafter referred as cAOD, retrieved through the AERONET SDA algorithm is applied. The two datasets are collocated by spatially averaging MIDAS DODs included in an area of 3×3 pixels around each AERONET site and also temporally combined using the same daily values. DOD and cAOD trends are calculated using the methodology described in Sect. 2.3. Figure 4a illustrates the geographical distribution of the AERONET stations (in total 41) satisfying the defined temporal criteria (see Sect. 2.3) and finally used in the assessment analysis. According to Fig. 4b, a good linear correlation (R=0.86) of the derived trends is observed accompanied by low bias (MBE ). In order to quantify the performance of MIDAS in capturing the cAOD trends, the total accuracy (TA) of the correct trends (identical sign) is calculated. More specifically, TA is defined as the percentage of the stations with correct trend signs (the sum of B1 and A2 quadrant numbers in Fig. 4c divided by the total number of stations). MIDAS trends can capture the correct cAOD trend signs with a TA of 80.5 % (Fig. 4c). In addition, the percentages of each quadrant in Fig. 4c show the number of correctly detected stations per sign. The overwhelming majority of the AERONET stations encompassed negative trends (30 out of 41 stations). MIDAS trends capture 26 out of those 30 (86.7 %) stations denoted with negative cAOD trends. Lastly, there are only 11 sites with positive cAOD trends, and MIDAS proved able to detect them at 7 out of 11 (63.6 %) stations.

Figure 4(a) Geographical location of the available AERONET stations for which the temporal trends of DOD and cAOD are calculated. Green and red dots refer to the stations with similar and different trend signs, respectively. (b) Scatter plot between MIDAS DOD and AERONET cAOD trends. The color bar indicates the total number of months. (c) Confusion matrix of possible trend signs among the two datasets.
Table S1 provides the point-to-point trend results for each collocated MIDAS–AERONET site. It should be mentioned that among the revealed stations, few indicate dust particles as the predominant aerosol type. Based on Logothetis et al. (2020), the station of Solar Village, Arabian Peninsula, is primarily a “dusty” site revealing significantly high percentages of coarse absorbing particles. Across this station, the trends between AERONET cAOD (0.0126 yr−1) and MIDAS DOD (0.0107 yr−1) are in good agreement in terms of magnitude, but both are non-significant at the 95 % confidence level. Similar findings are also observed in the “dusty” site of Tamanrasset, Algeria, showing increasing cAOD and DOD trends of 0.0062 yr−1 and 0.0044 yr−1, respectively. One of the advantages of MIDAS is that it provides dust aerosol burden information in downwind regions of the planet. For instance, most of the stations located in southern Europe receive dust particles transported towards the Mediterranean from the Saharan and Middle Eastern deserts, encompassing identical trend signs (Fig. 4a). Moreover, there are many downwind regions across different regions of the globe with similar trend magnitudes such as Ispra in Italy (cAOD yr−1, DOD yr−1), Kanpur in India (cAOD 0.0027 yr−1, DOD 0.0029 yr−1), SERC (cAOD yr−1, DOD yr−1) in the US, Shirahama in Japan (cAOD yr−1, DOD yr−1) and Xianghe in China (cAOD yr−1, DOD yr−1).
3.1.4 Filtering vs. non-filtering trends
The third sensitivity analysis in this section concerns the calculation of temporal trends using filtered (Fig. 2) and non-filtered (Fig. 5) data at fine spatial resolution. Here, the AOD DOD trends are calculated by applying two consecutive temporal filters (Sect. 2.3). More specifically, the two applied temporal filters include the (1) the calculation of the monthly averages when at least 6 d are available and (2) the trend calculation only in grid cells with more than 60 available months (5 years). The total number of grid points for trend calculation increases when the above two temporal filters are not applied. Overall, months with more than one daily measurement are retained for trend analysis, increasing the total data availability of the entire global grid from 36 % (filtered) to 83 % (non-filtered).

Figure 5Global maps of unfiltered temporal trends (statistically significant at 95 % confidence level) at spatial resolution calculated from the deseasonalized geometric (a) AOD and (b) DOD monthly values during 2003–2017.
According to Eq. (3), σω (Fig. S5) and the statistical significance (Fig. S6) of the trend are controlled by σN, φ (Fig. S7) and n (Fig. S3). The differences in data availability between the unfiltered and filtered trend analysis are depicted in Fig. S8. Across the desert areas, the number of filtered months is adequately high and very close to the non-filtered case (Fig. 8). Thus, no trend differences in magnitude and sign are recorded. Over maritime and continental dust-affected areas, new statistically significant AOD and DOD trends are represented when the unfiltered data are employed. Firstly, the number of pixels with statistically significant DOD trends has significantly increased (Fig. 5b), but the majority of the new trends are mainly neutral and located over oceanic territories (yellow pixels). New positive DOD tendencies are observed over the tropical Atlantic and India, while new negative trends are recorded across southeastern China (Fig. 5b). Secondly, the significant AOD trend grid points are also strongly increased. New decreasing AOD trends are observed over the USA, China and the Philippine Sea (Fig. 5a). Especially across the region of southeastern China, the number of significant AOD trends has increased profoundly. In addition, new AOD increasing trends are recorded over the tropical Atlantic, North Pacific (west of Mexico), Arabian Sea, and the oceanic area between 30.0 and 60.0∘ S. Despite the increase in monthly data availability, trend analysis without temporal filtering may lead to erroneous and non-representative results either for AOD or DOD. In order to investigate the last statement in detail, a sensitivity analysis is performed using a total of 76 AERONET stations (Fig. S9a). Through the evaluation analysis of MIDAS DOD trends (Sect. 3.1.3), the AERONET stations have been selected based on their data availability. More specifically, only the stations with at least 10 years of data have been retained for further analysis. The total number of sites decreased from 76 (here) to 41 due to temporal filtering (see Sect. 3.1.3). Based on Fig. S9b, the unfiltered temporal trends between MIDAS and AERONET document a profoundly lower linear correlation (R=0.51), while the data points are more sparse. When trends are calculated without any temporal filtering, the total accuracy of the correct trends decreases from 80.5 % (Fig. 4c) to 73.7 % (Fig. S9c).
In the following sections and considering all three implemented sensitivity analyses, only the geometric-based DOD and AOD trends (Sect. 3.1.1) at fine spatial resolution (Sect. 3.1.2) including the temporal filtering (Sect. 3.1.4) are discussed.
3.2 Seasonal trends
Dust aerosol burden is subjected to strong intra-annual and interannual variations with different cycles depending on the source or downwind region (Gkikas et al., 2021b). Here, the seasonal DOD tendencies at a global scale (Fig. 6) are calculated based on the methodology proposed by Hsu et al. (2012). The corresponding seasonal AOD trends are depicted in Fig. S10.

Figure 6Seasonal geographical distributions of DOD temporal trends in (a) December–January–February (DJF), (b) March–April–May (MAM), (c) June–July–August (JJA) and (d) September–October–November (SON).
The detection of the statistical significance of the calculated trends based on Weatherhead et al. (1998) cannot be applied here due to the 9-month gap among the seasons. Therefore, an alternative approach is followed by calculating the seasonal trends using a simple linear regression model on the DOD anomalies and identifying the statistically significant trends based on the two-sided Student's t test. The null hypothesis of the t test assumes a non-significant temporal trend under a defined confidence level (here is 95 %). The total number of months for each season is displayed in Fig. S4. Only the grid points with more than 13 available months (13 from 45 total months) are retained. The performed analysis at global scale and on a seasonal basis highlights many regions with significant DOD trends (Figs. 2 and 6), which are used to define regional domains (Fig. 7).

Figure 7Regions of interest for seasonal and regional analysis: northern Arabian Peninsula (NAP), southern Arabian Peninsula (SAP), central Sahara (CSA), Gobi Desert (GOB), western Sahara (WSA), Mediterranean (MED), eastern Sahara (ESA), Bodélé Depression (BOD), Thar Desert (THA), eastern tropical Atlantic (ETA), eastern Middle East (EME) and Taklamakan Desert (TAK). Solid rectangles indicate the regions included in the regional analysis (Sect. 3.3), while solid and dashed rectangles are for the seasonal analysis.
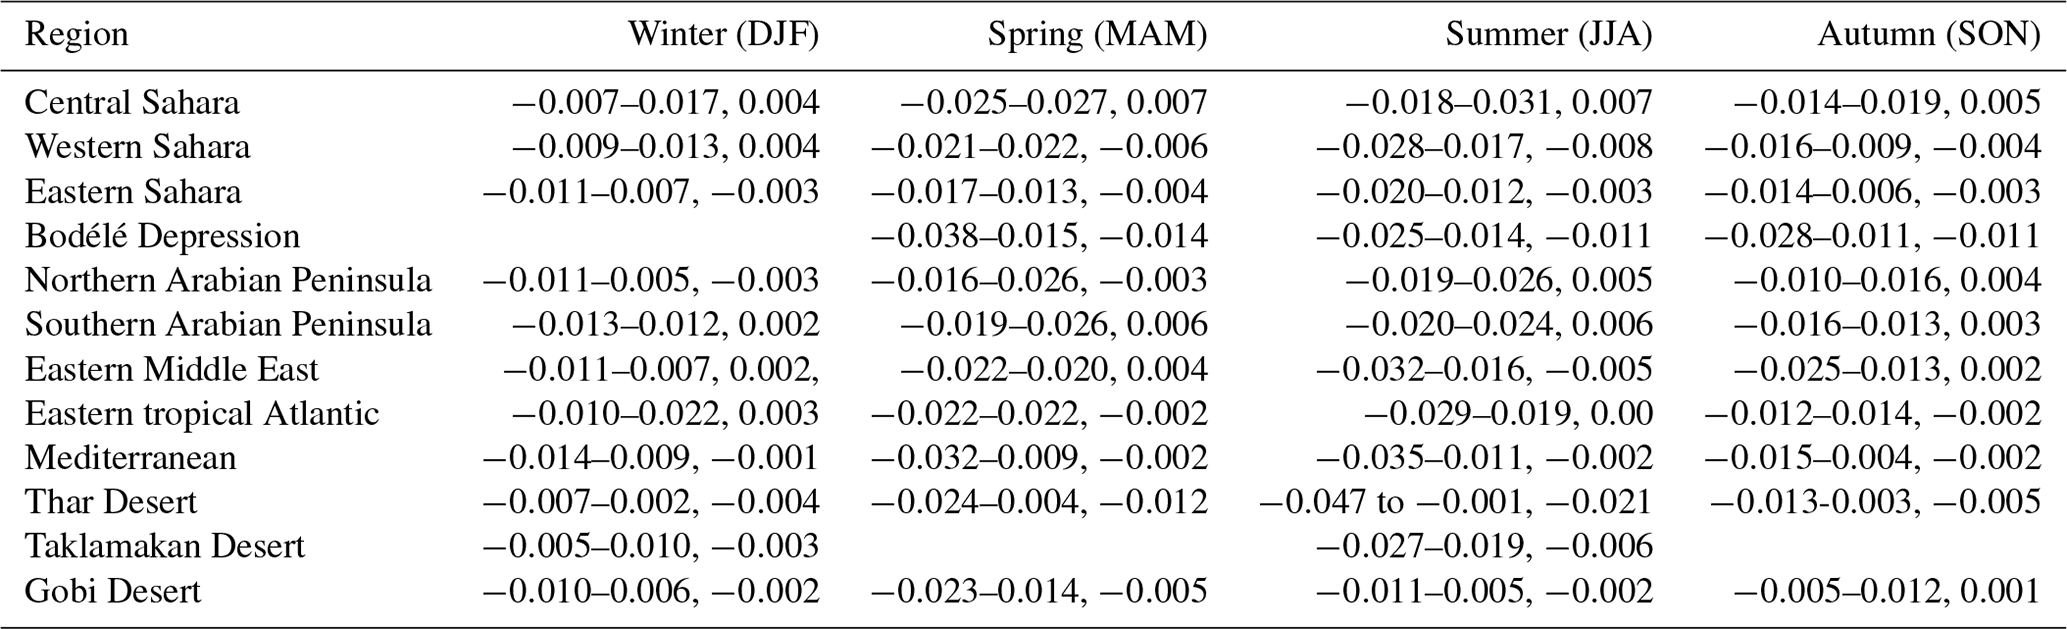
The Sahara, hosting some of the most active aeolian natural dust sources of the planet, is a region of great interest for investigating intra-seasonal DOD variations. In its central sector, increasing trends are recorded throughout the year (maximum positive value in JJA) (Table 2). In contrast, negative seasonal DOD trends appear in the majority of regions across North Africa (Fig. 6). The western and eastern parts of the Sahara present strong declining trends maximized during boreal summer (Table 2). From spring to autumn in the Bodélé Depression, substantial decreasing trends are recorded (Table 2). Over the period 2001–2012, dust emissions in the broader area of the Bodélé Depression were decreased in summertime, which was attributed to the increased rainfall caused by the positive trends of the Sahara heat lows (SHL), the warm phase of the Atlantic Multidecadal Oscillation (AMO), and the decreasing trends in terms of occurrence and intensity of nocturnal low-level jets (NLLJs) (Shi et al., 2021). Surface wind speed also affects dust emissions across North Africa (Evan et al., 2016). Surface wind speed and NLLJs are the principal drivers for the interannual variation of dust emissions across the western Sahara, while in summertime dust emissions decreased during 2001–2012 (Shi et al., 2021). The eastern sector of North Africa (northern Libya and Egypt) presents moderate negative trends maximized in winter (down to −0.014 yr−1) and spring (down to −0.011 yr−1). In the western sector (i.e., northern Algeria and Tunisia) strong significant declining trends are observed in summer (down to −0.035 yr−1) (Fig. 6c). The dust sources near the North African coasts are strongly influenced by the surface wind speed, NLLJs, Harmattan surge and the tracks of Mediterranean depressions (Shi et al., 2021).
Table 2Seasonal trends over 12 regions of interest. Each column includes the range of DOD trend (yr−1) and the median DOD trend. Non-available values are shown in blank cells. The domains of the regions are depicted in Fig. 7.
Numerous studies have highlighted Saharan transatlantic transport (Peyridieu et al., 2013; Alizadeh-Choobari et al., 2014c; Prospero et al., 2014; Gläser et al., 2015; Fréville et al., 2020; Gkikas et al., 2021b). Across the Gulf of Guinea and mid-Atlantic, relatively high DODs are documented in boreal winter, ranging from 0.1 to 0.2 (up to 0.6) (Gkikas et al., 2021b). According to Fig. 6a, strong positive DOD trends are shown over the Gulf of Guinea (up to 0.047 yr−1). In this season, strong northeasterly winds (Harmattan) transport intense loads of Saharan dust towards Nigeria and the Gulf of Guinea (Washington et al., 2006). However, the trend magnitude along the Gulf of Guinea and in the northern regions (from Ghana to Cameroon) seems to be unreliable due to the reduced performance of MDF, surface contamination in the received radiances by MODIS, and the co-existence of aerosols and clouds (Gkikas et al., 2021b). In order to investigate the reliability of MIDAS DOD in the above region, the seasonal trend analysis is implemented at the AERONET station of Ilorin, Nigeria. It is worth mentioning that this station has not been included in the evaluation analysis in Sect. 3.1.3 due to the low number of months (N=48<60). However, 32 out of 48 months are in boreal winter, enabling the application of the methodology during this season. Both datasets represented increasing and statistically significant cAOD (0.011 yr−1, ) and DOD trends (0.021 yr−1, ). As expected, MIDAS revealed higher-magnitude trends than cAOD (approximately 2 times higher). In the case of AOD (Fig. S10a), positive trends identical to DOD are shown in winter. Interestingly, substantial negative DOD trends (down to −0.045 yr−1) are recorded during springtime in an area encompassing parts of Guinea, Sierra Leone and the North Atlantic Ocean (Fig. 6b), while positive tendencies are documented over the tropical Atlantic Ocean in DJF (Table 2). Over the region extending from the North Atlantic Ocean to the eastern Caribbean Sea (lat: 10.0–18.0∘ N; long: 70.0–45.0∘ W), moderate positive trends are documented predominantly in MAM (up to 0.010 yr−1) and JJA (up to 0.008 yr−1). Dust transport from North Africa along the Atlantic Ocean reaches the Caribbean Sea, while summer DODs are intertwined with tropical Atlantic cyclone activity. More specifically, Caribbean DOD during summer is negatively correlated with Atlantic accumulated cyclone energy and the Atlantic Meridional Mode index (Xian et al., 2020). In addition, dust aerosol burden originating from the Sahara is directly related to tropical cyclones (TCs) over the tropical Atlantic Ocean, but their relationship is not unambiguously clarified (Evan et al., 2006). Based on model simulations, Pan et al. (2018) investigated the role of dust aerosols for the genesis of TCs over the tropical Atlantic basin by comparison of dust and non-dust model simulations. They revealed that dust amount is directly related to TCs, revealing a bimodal pattern. More specifically, favorable conditions for TC formation are documented by increasing the midlevel moisture and decreasing the vertical wind shear, while unfavorable conditions are documented by decreasing the low-level vorticity and potential intensity.
Increasing tendencies throughout the year appear in the Middle East (Table 2) with few exceptions, particularly in the northern Arabian Peninsula (Fig. 6). More specifically, the southwestern sector of Oman presents the highest increasing trends for all seasons (up to 0.026 yr−1). Similarly, high positive trends in MAM (up to 0.015 yr−1) and JJA (up to 0.018 yr−1) are documented over the western part of Saudi Arabia. Negative tendencies are observed for all seasons at the north of the Oroug Bani M'aradh Wildfire Sanctuary (southern Saudi Arabia) including strongly negative DOD trends in summer (down to −0.020 yr−1) and spring (down to −0.019 yr−1). In the northern part of the Arabian Peninsula, positive trends are detected predominantly in JJA and SON. Dust activity across the Arabian Peninsula is strongly influenced by the intensity of the northwesterly Shamal winds, favored by the low precipitation amounts during summer (Yu et al., 2015). The temporally extended drought (Notaro et al., 2015) along with the cooling of the tropical Indian Ocean and the Mediterranean Sea temperatures (Yu et al., 2015), leading to an enhancement of the Shamal winds, could regulate the summer DOD trends across the Arabian Peninsula. During springtime, La Niña events constitute the principal drivers for dust activity by reducing the rainfall amounts over the Rub' al Khali Desert, which is one of the most active dust sources across the Arabian Peninsula (Yu et al., 2015). Strong positive trends (up to 0.026 yr−1) are encountered in MAM and JJA over Iraq, while significant increasing trends are recorded for all seasons across eastern Iran, with the most evident ones in spring (up to 0.020 yr−1). However, a hotspot of strong declining trends exists in the southeastern area of Iran (34.5∘ N, 54.5∘ E), with the most negative values in JJA (down to −0.029 yr−1) and SON (down to −0.025 yr−1). Moderate negative DOD trends are documented during the summertime (down to −0.01 yr−1) across the Alboran Sea (western Mediterranean). The dust aerosol burden is also decreased in the eastern part of the Mediterranean Sea during spring (down to −0.006 yr−1, from the Libya and Egyptian coasts to the Aegean Sea) and autumn (down to −0.005 yr−1, across the Gulf of Sidra).
Statistically significant positive DOD trends are detected across the intersection of Kazakhstan, Uzbekistan and Turkmenistan at the northeastern Caspian Sea shore. In all seasons, the DOD trends exceed 0.011 yr−1, while the maximum trends are recorded in summer (up to 0.035 yr−1) and spring (up to 0.019 yr−1). These findings substantiate the positive decadal DOD trends (∼ 0.18 decade−1) of Voss and Evan (2020) and could be attributed to the amount of drawdown ( cm yr−1) in the Caspian Sea level during 1996–2015 (Chen et al., 2017). Central, South and East Asia constitute another regions of interest in which robust DOD trends are encountered (Fig. 6). The maximum negative values are depicted over the Thar Desert in JJA and MAM (Table 2). It must be highlighted that the maximum decreasing trends are detected during the high-dust season in the Thar Desert (Proestakis et al., 2018). The reduction of dust load during the pre-monsoon (MAM) could be attributed to the increase in rainfall and soil moisture levels, acting in favor of wet dust deposition and decreasing dust erosion (Pandey et al., 2017; Jin and Wang, 2018; Lakshmi et al., 2019). Moreover, reductions in dust emissions are recorded during summertime, which are strongly linked to soil moisture and wind speed (Shi et al., 2021). In northwestern China (central Asia) lies the Taklamakan Desert, where non-significant annual trends are documented (Fig. 2). However, significant seasonally negative DOD trends are observed (Fig. 6), particularly in summertime (Table 2). Additionally, over the Gobi Desert and East Asia, strongly negative DOD tendencies are documented mainly in spring (Fig. 6b), when the dust activity peaks (Proestakis et al., 2018). The negative DOD trends across the Gobi Desert could be attributed to reduced dust emissions caused by the decrease in surface wind speed recorded between 2010 and 2016 (Guo et al., 2019).
3.3 Regional trends
The regional DOD and AOD trends are calculated for nine specific regions of interest (Table 3 and Fig. 7, solid rectangles) as well as for the whole globe (GLB) and separately over land (GLB-L) and ocean (GLB-O) (Sect. 3.3.1). The full names of each region as well as the calculated regional DOD trends and their uncertainties are included in Table 3. The comparisons among the geometric vs. arithmetic aggregation method and coarse vs. fine spatial resolution are also investigated for the regional DOD (Fig. 8a) and AOD (Fig. 8b) trends. On a regional basis, the temporal trends between the two spatial resolutions are in very good agreement, corroborating de Meij et al. (2012). Since the statistical significance of the trends is strongly influenced by the number of years and the study period, the regional DOD trends are also computed for different time periods considering the systematic change in time period (number of years) and initial year (Fig. 9).
Table 3Global and regional temporal DOD trends based on the MIDAS dataset. The trends with the ratio higher than 2.0 are statistically significant at the 95 % confidence level. The star symbol corresponds to statistically significant regions under the 95 % confidence level. The domains of the regions are represented in Fig. 7.
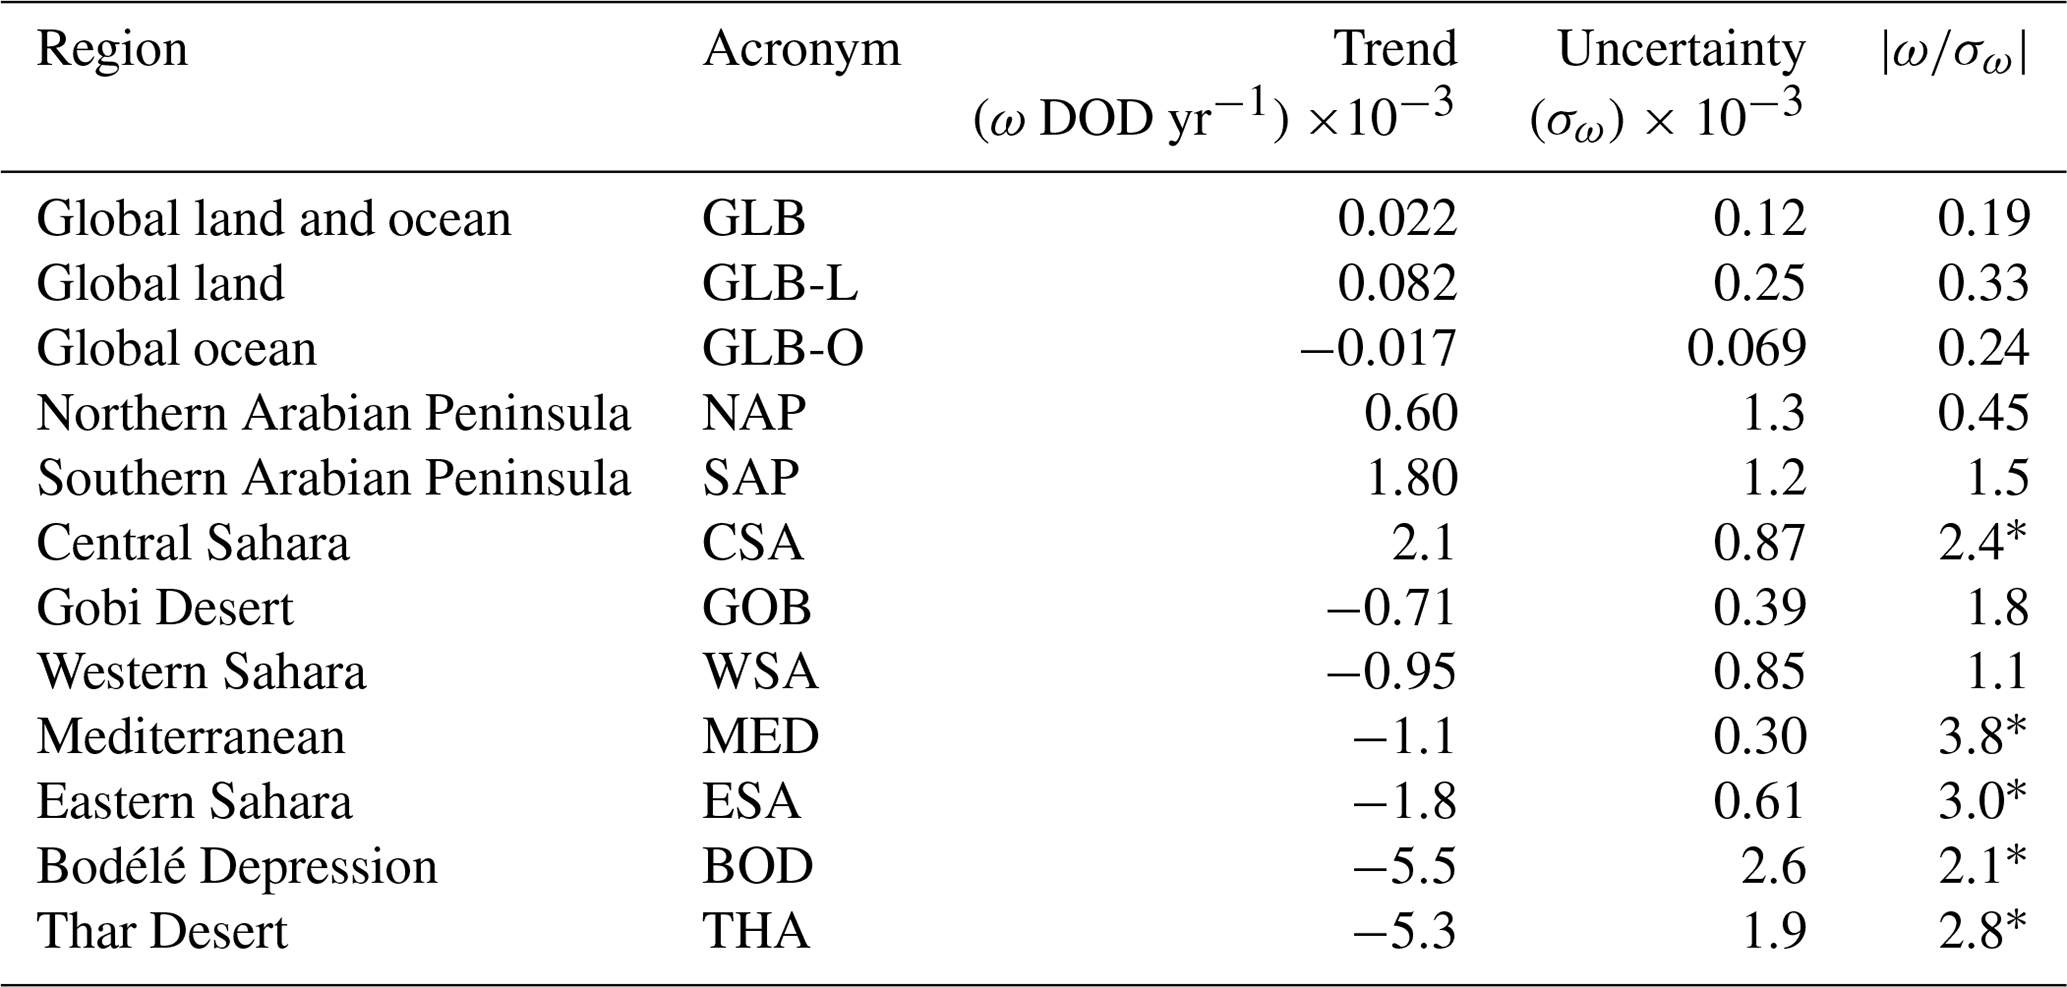
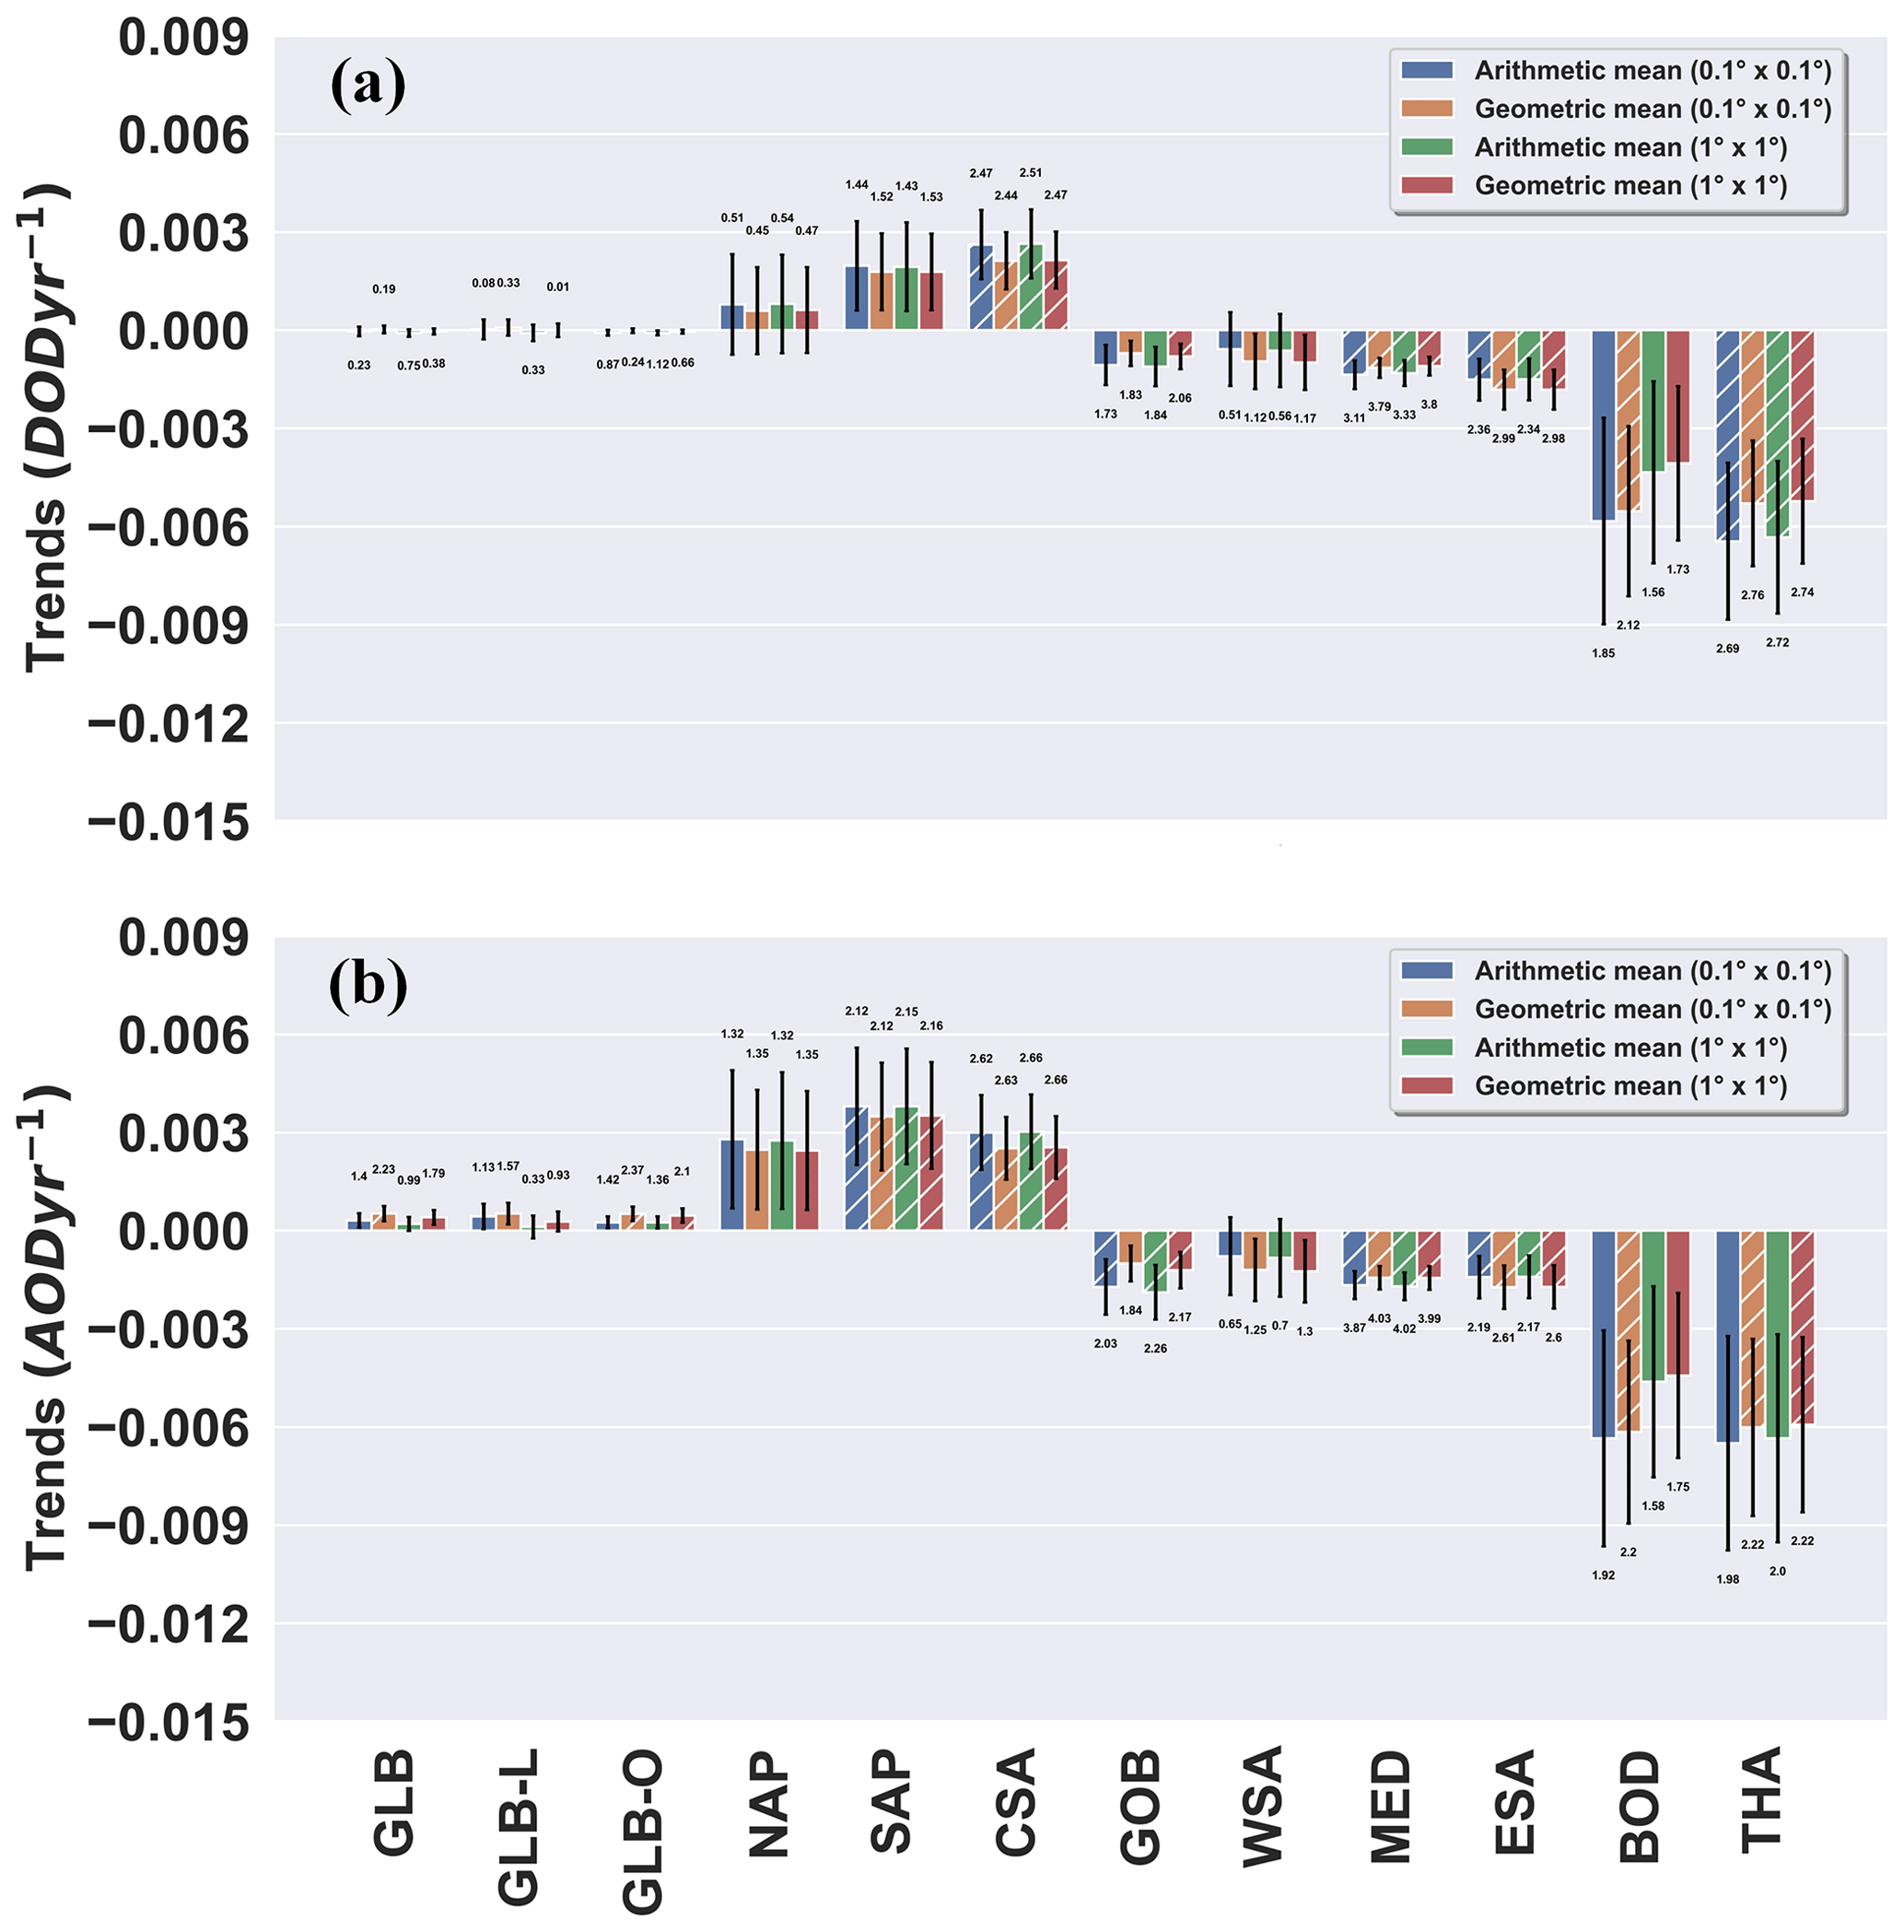
Figure 8Bar plots indicating the (a) DOD and (b) AOD regional temporal trends. The hatched bars represent regions with significant trends (). The error bars denote the uncertainty of the trends based on Eq.(3) (Sect. 2.3).
The explanation of the temporal evolution of calculated trends shown in Fig. 9 is presented in the next section for individual regions.
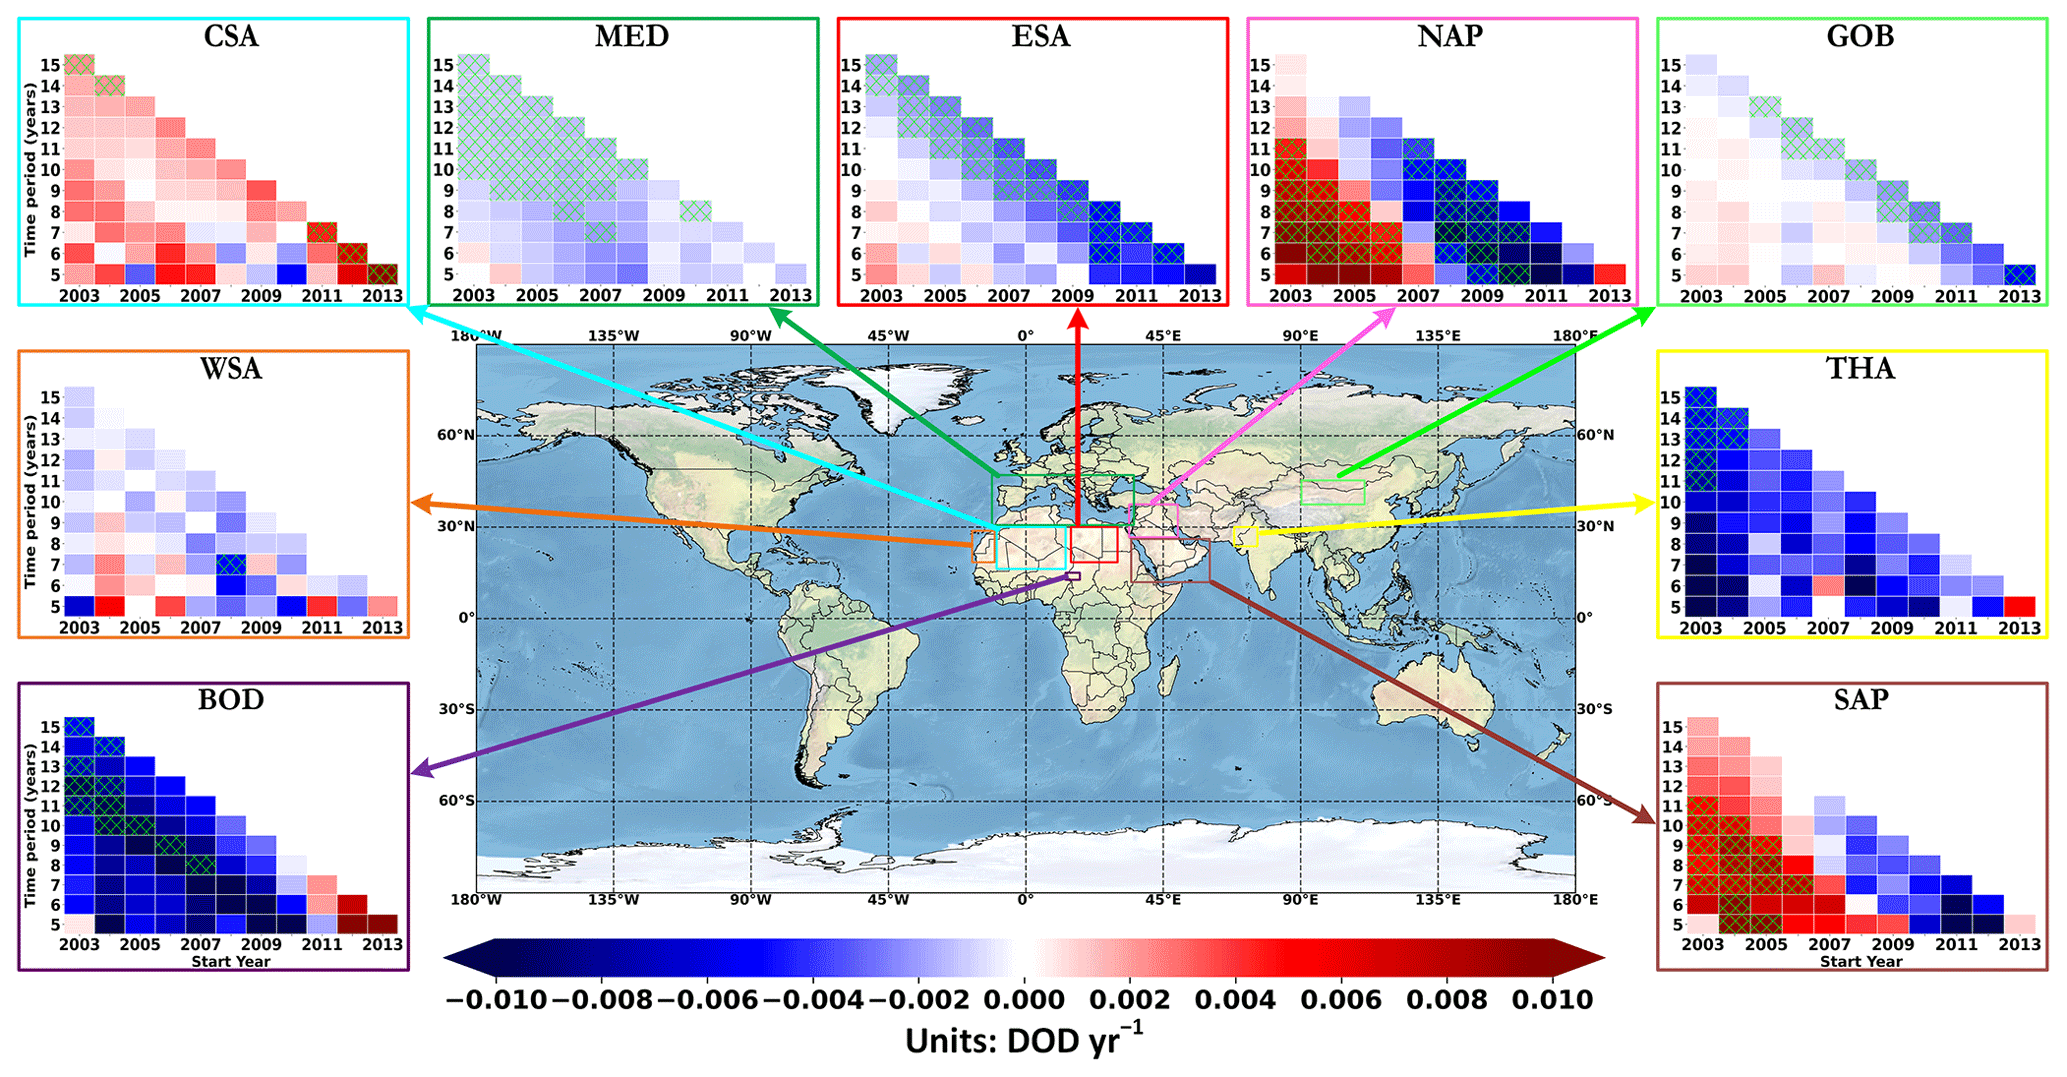
Figure 9Regional DOD trends at different time intervals, with at least a 5-year time series. The acronym full names are documented in Table 3. The YY' axis shows the number of trends included in the analysis, while XX' is the starting year. The hatched pixels represent regions with significant trends ().
3.3.1 Global land and ocean
Small global DOD trends are recorded during the study period both over land and ocean (Table 3). However, distinguishable DOD trends are detected in specific regions. Prior studies have focused on satellite-based measurements detecting statistically significant AOD trends at global scale. Over oceanic areas, AOD trends based on MODIS Collection 6.0 are reported to be equal to 0.0050 decade−1 and 0.0020 decade−1 during 2000–2009 and 2000–2015, respectively (Alfaro-Contreras et al., 2017). SeaWiFS AOD retrievals recorded higher annual positive significant trends over ocean (0.00080 yr−1) for a 13-year period (1998–2010) (Hsu et al., 2012). Recently, significant positive tendencies have been documented for GLB (0.00066 yr−1) using L3 Collection 6.1 MODIS/Terra measurements spanning from 2001 to 2016 (Che et al., 2019). In this study, significant AOD trends of 0.00052 and 0.00051 yr−1 are revealed over GLB-O and GLB, respectively (Fig. 8b), using geometric means at fine spatial resolution. The differences in trend magnitude among the studies are attributed to the different datasets, aggregation methods and temporal availability.
3.3.2 North Africa
Across North Africa, four sectors have been defined based on the sign of the DOD trends (see Fig. 7). The first one consists of the central Sahara (CSA) where increasing DOD trends are mainly recorded (up to 0.023 yr−1) (Fig. 10c). Voss and Evan (2020) also reported similar DOD trends, in terms of sign and magnitude, based on a MODIS/Aqua dataset over the period 2003–2018. At regional scale, positive significant DOD trends of 0.0021 yr−1 determine those of AOD as expected (regional DOD-to-AOD trend ratio: 0.84) due to the predominance of mineral particles in the area among other aerosol species (Fig. 10d). During different time frames, the sign of DOD trends remains mainly positive (Fig. 9), with intense (from 0.0044 to 0.0095 yr−1) and significant results from 2011 onward. Nevertheless, the time window is very short to infer the amplitude of the calculated trends.

Figure 10(a) Geographical boundaries, (b) annual DOD, (c) DOD geometric trends and (d) DOD-to-AOD trend ratios for the central Sahara.
In the westernmost section of the Sahara (WSA), in the majority of grid cells (∼ 73 %) decreasing DOD tendencies are recorded (down to −0.015 yr−1), whereas positive trends (up to 0.009 yr−1) are evident at scattered pixels (∼ 27 %) within the domain (Fig. 11c). Overall, the total load (Fig. 8a) and the dust burden (Fig. 8b) decreased during the study period, but the magnitude of this reduction is relatively low and not statistically significant. This behavior is consistent regardless of the spatial resolution or the approach for the calculation of regional values (i.e., arithmetic or geometric mean) (Fig. 8a and b). The same DOD trend pattern is also reflected using different time periods (Fig. 9).
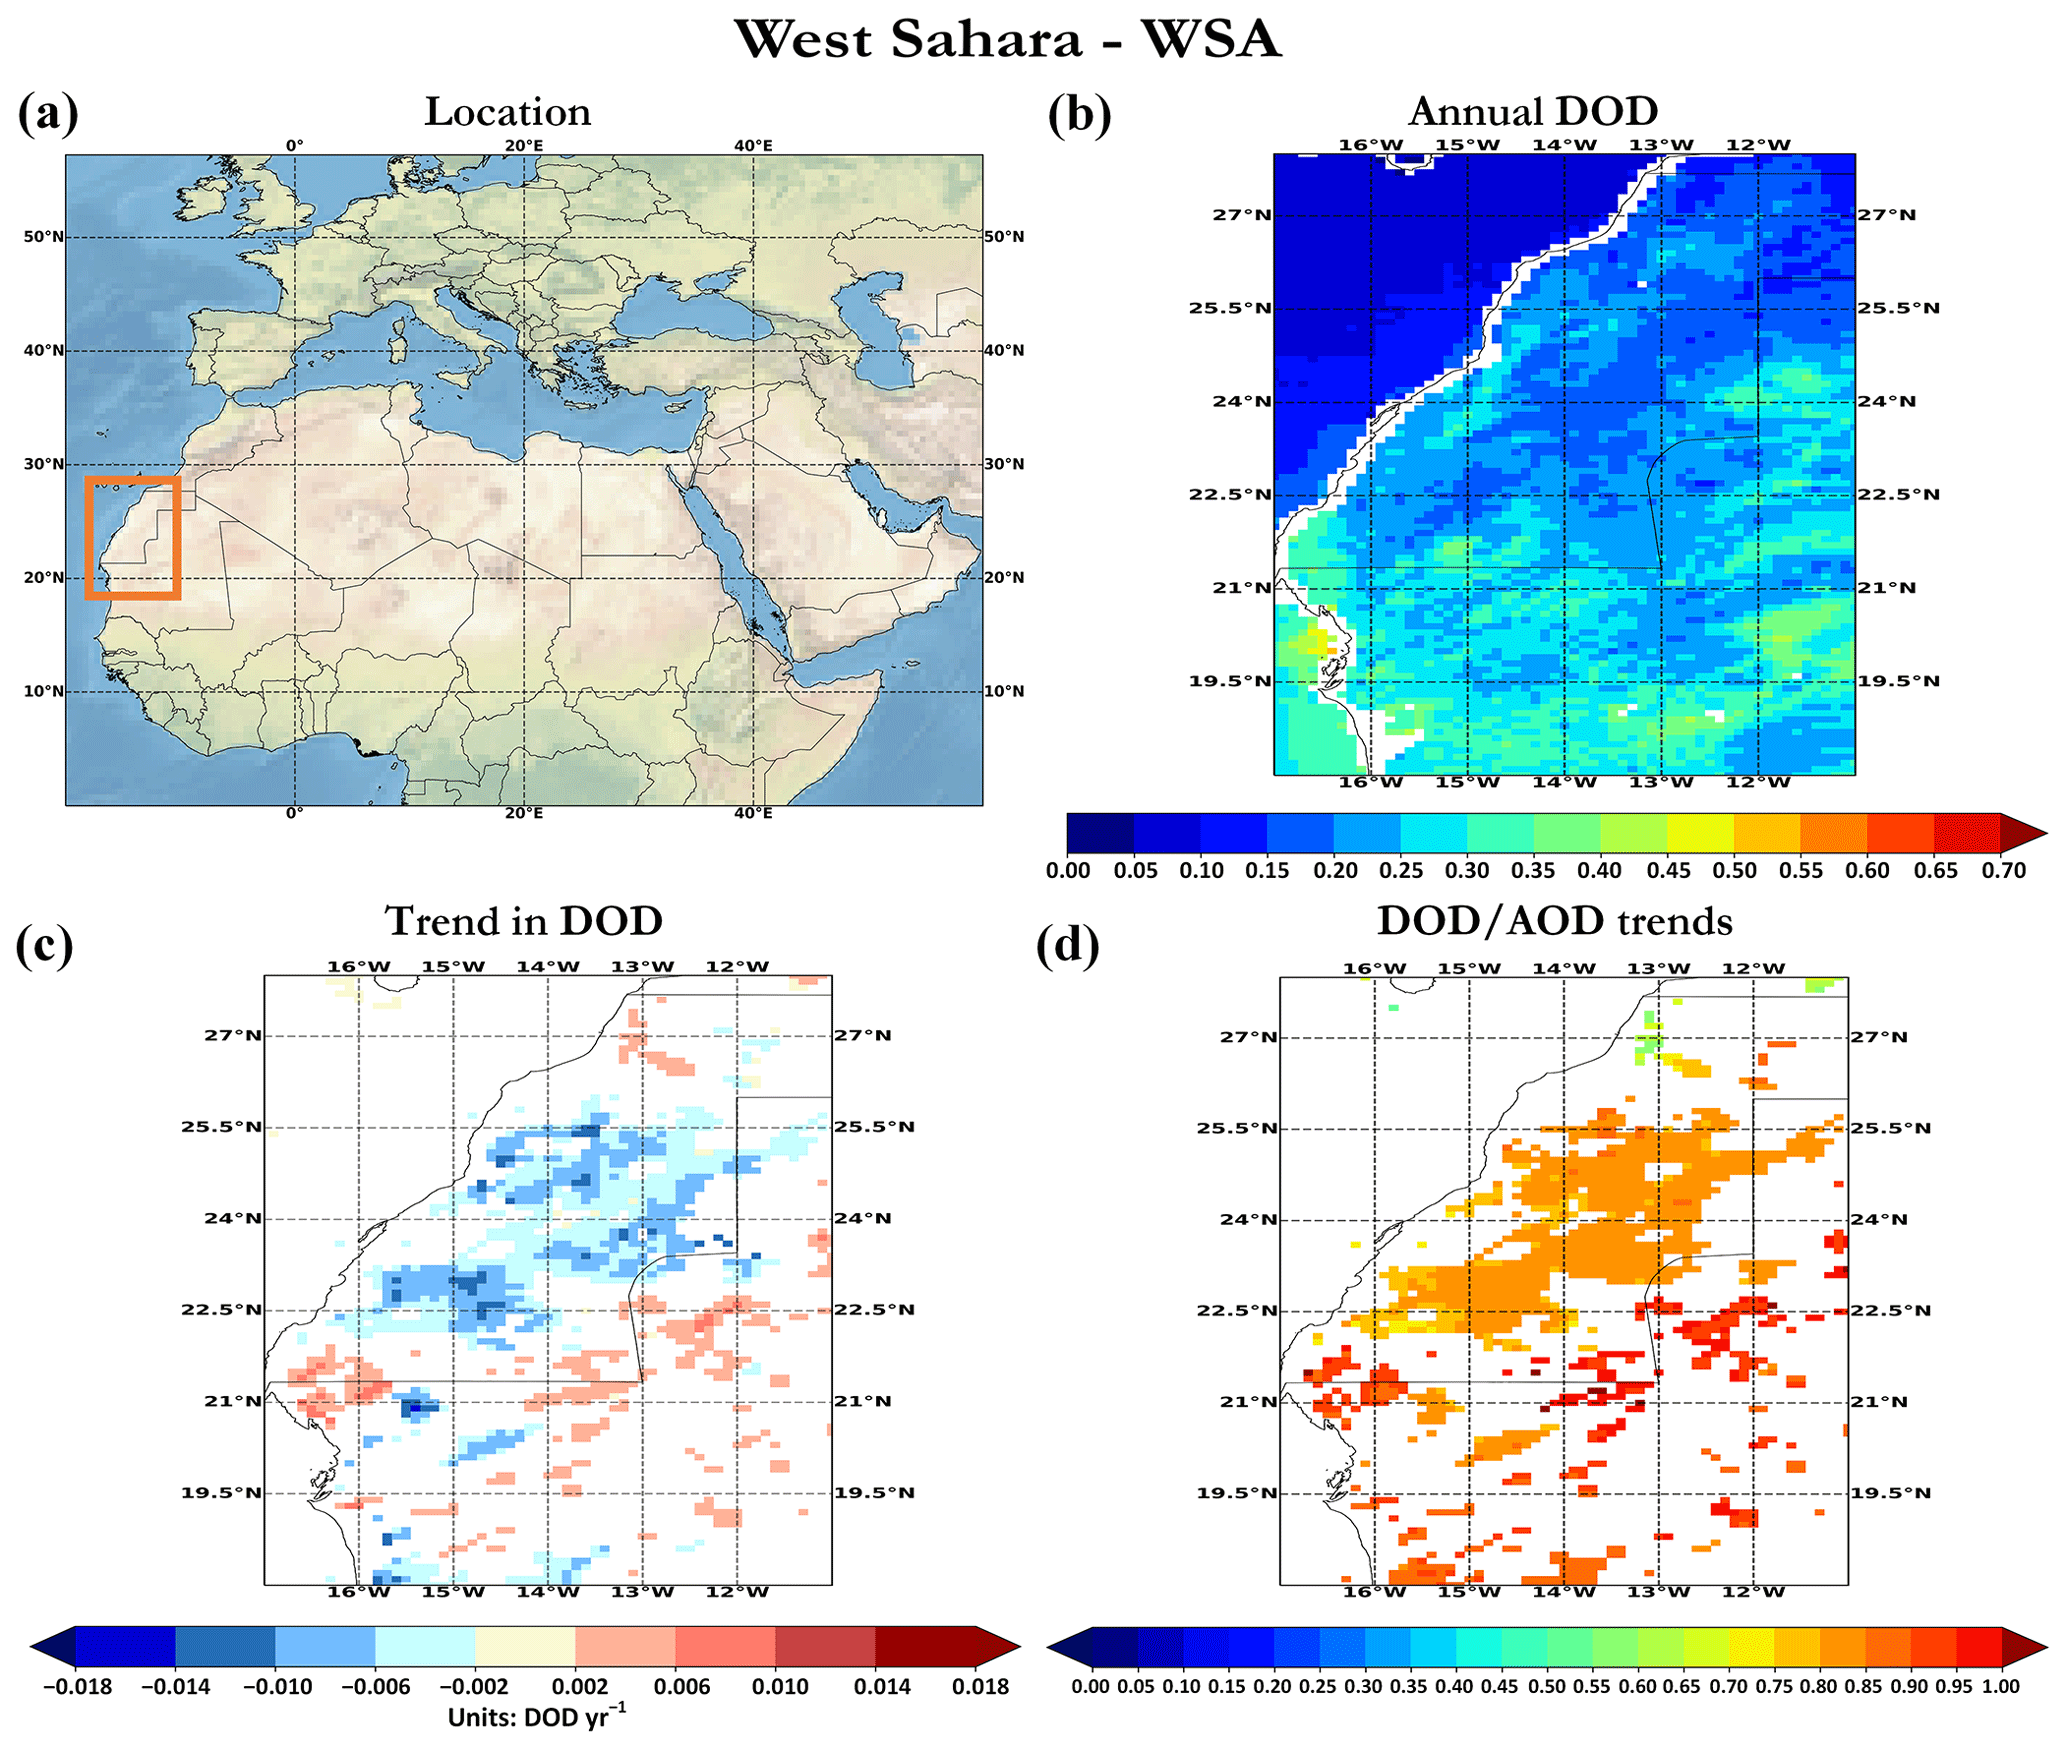
Figure 11Same as Fig. 10, but for the western Sahara.
In the eastern sector of the Sahara (ESA), statistically significant negative DOD trends (down to −0.023 yr−1) (Fig. 12c) are revealed as are both regional DOD (Fig. 8a) and AOD (Fig. 8b) trends, thus indicating the predominant contribution of mineral particles to the total aerosol load. Reduction of the dust burden has also been recorded from a MODIS/Terra dataset according to Voss and Evan (2020). Dust particles potentially affect total AOD across ESA, indicating a regional DOD-to-AOD trend ratio of 1.06. Over the dust-affected areas of the planet, the DOD-to-AOD trend ratios range from negative (different trend sign) to values higher than unity. Since the dust burden modulates the total AOD over “dusty” regions, the ratio between DOD and AOD is expected to be around unity. Ratios higher than unity are expected as the non-dust AOD signal decreases or increases and the DOD signal shows a reciprocal pattern. According to Fig. 9, two significant outcomes can be extracted in ESA. The magnitude, in absolute terms, of the decreasing DOD trends increases (down to −0.0054 yr−1; 2012–2017) and statistical significance is achieved for shorter time periods for increasing starting years.
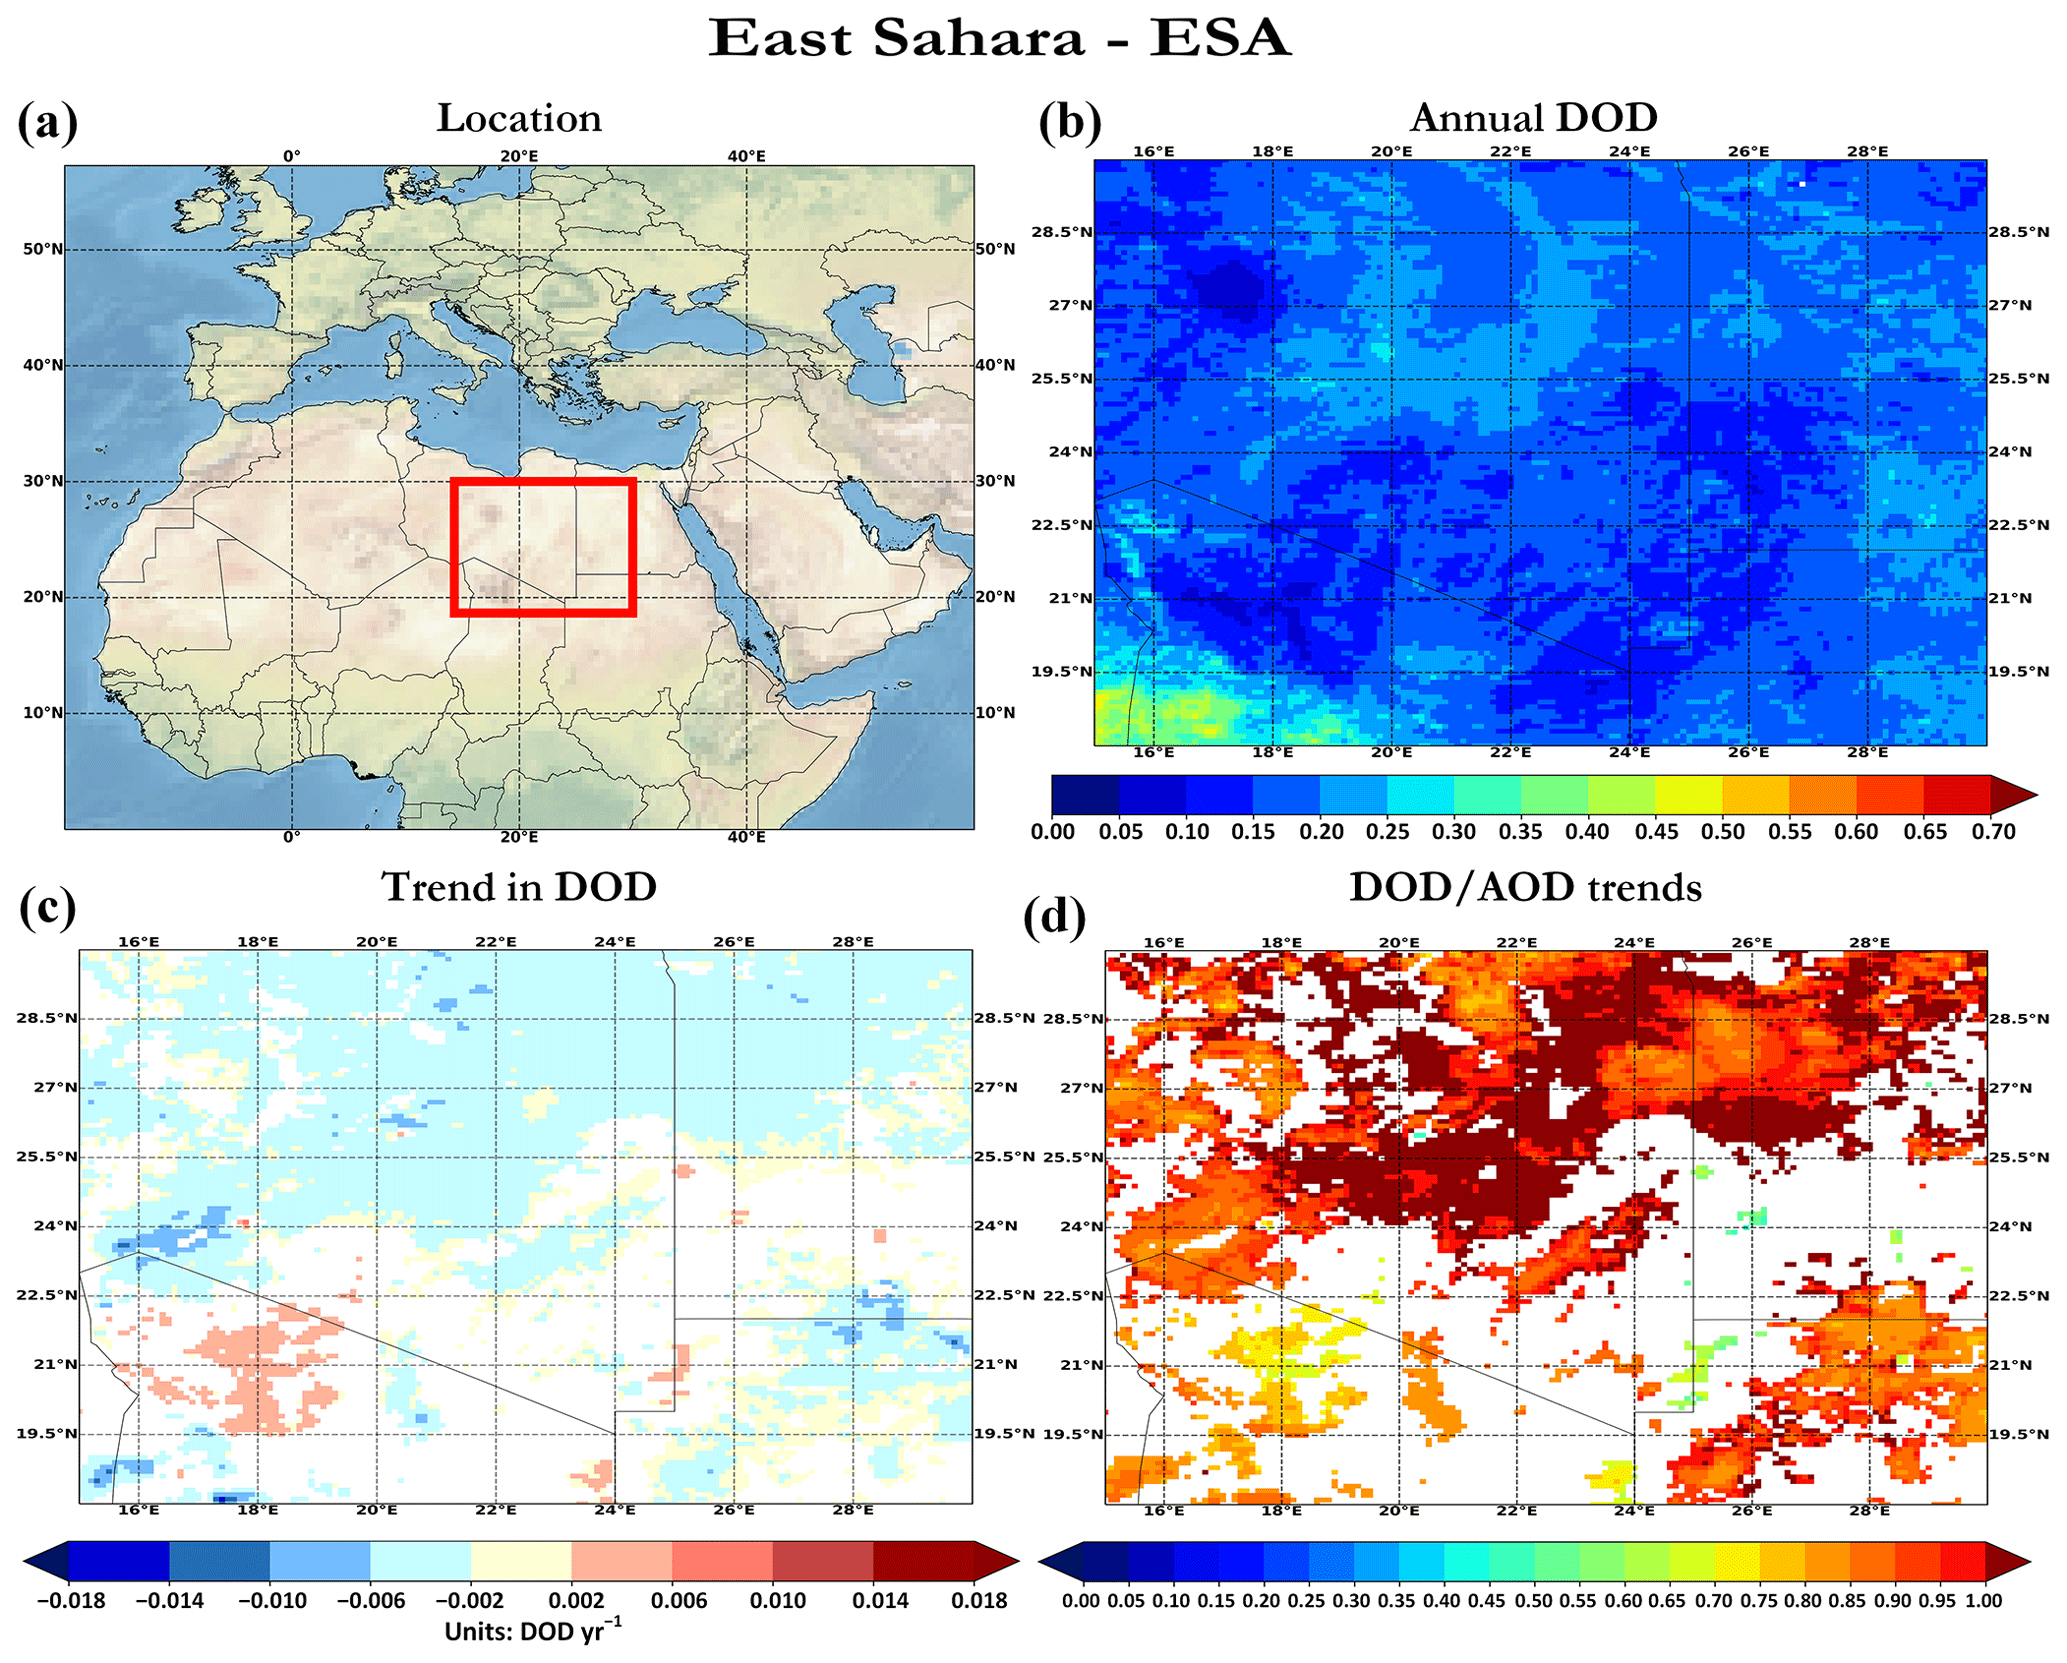
Figure 12Same as Fig. 10, but for the eastern Sahara.
Within the study period, the regional dust load decreased (−0.0055 yr−1) in the Bodélé Depression (BOD), which is the most active aeolian dust source of the planet (Prospero et al., 2002; Washington et al., 2006; Todd et al., 2007; Gkikas et al., 2021b). DOD trends range from −0.021 to −0.003 yr−1 (Fig. 13c), corroborating the findings of Voss and Evan (2020). For starting years between 2003 and 2010 the dust aerosol burden decreases (Fig. 9), with the most negative trend found during 2007–2014 (−0.015 yr−1). As the starting year increases and the time length decreases, the magnitude of DOD trends becomes weaker. More specifically, the sign of DOD trends is shifted using 2011–2013 as starting years, but the results are not statistically significant. The latter indicates that DOD over the most active dust source of the planet has become more intense during the last years. In order to better understand the reasons for the decreasing DOD trends across BOD, we investigated the correlation between the monthly MIDAS DODs and two meteorological variables, such as the wind speed (WS) at 10 m and the accumulated precipitation (STP), along with the volumetric soil water (layer: 0–7 cm) (VSM), retrieved from ERA5 reanalysis products (Hersbach et al., 2018, 2020). Figure S11 displays the trend analysis of the aforementioned parameters over the area of BOD. The solid black box depicted in Fig. S11a refers to the area that is presented in Fig. 13. Based on Fig. S11a, except for the small area where strong negative trends are documented, there are also many scattered pixels of negative trends in the surrounding area (16–19∘ N–15–20∘ E). According to Fig. 11b–d, it is evident that DOD values are related to temporal variability of applied parameters. Through time, dust amounts are strongly related to meteorology and geophysical factors. For instance, the increase in STP and VSM levels increases wet dust deposition and decreases dust erosion, causing a reduction of the dust load. On the other hand, the increase in WS acting in favor of dust erosion thus increases the dust amount. Across this region, increasing STP and VSM trends are documented, showing that the reduction of DOD levels is strongly related to the increase in STP and VSM. It should be mentioned that across this area the levels of WS and VSM provide a seasonal pattern, recording relatively low levels through the seasons of the year. During summer, the Intertropical Convergence Zone (ITCZ) location moves to higher latitudes and rapidly affects the amounts of WS and VSM across BOD. The revealed summertime STP and VSM trends are higher in terms of magnitude. In addition, positive trends have also been documented for WS. Generally, the increase in WS acting in favor of dust erosion thus increases the dust amount. However, the level of increased WS is revealed to be relatively small and may not lead to changes in dust amount across BOD. To our knowledge, there are no observed changes in the surface reflectance that could influence the true level of MODIS AOD and provide suspicious tendencies, like those of Klingmüller et al. (2016) study in the area of the Aral Sea, where the substantial trends in terms of magnitude are revealed and proved to be related to the land cover changes caused by the drying of the Aral Sea.
The aerosol burden over the Sahara is modulated by meteorological parameters affecting dust emissions such as precipitation (Pozzer et al., 2015) and wind speed (Che et al., 2019). Based on model simulations, Pozzer et al. (2015) confirmed that positive AOD trends across the Sahara are linked to negative precipitation trends during 2001–2010. Decreasing precipitation levels reduces dust deposition and favors dust transport, leading to an increase in dust amounts. In addition, Che et al. (2019) reported that wind speed is the most critical feature for explaining the variance of AOD (by 29.8 %). During high-dust seasons, the interannual variation of dust emissions is affected by wind speed and NLLJs (in the southern Sahara dust sources) as well as by the Harmattan surge and Mediterranean depressions (in the northern Saharan dust sources) (Shi et al., 2021).
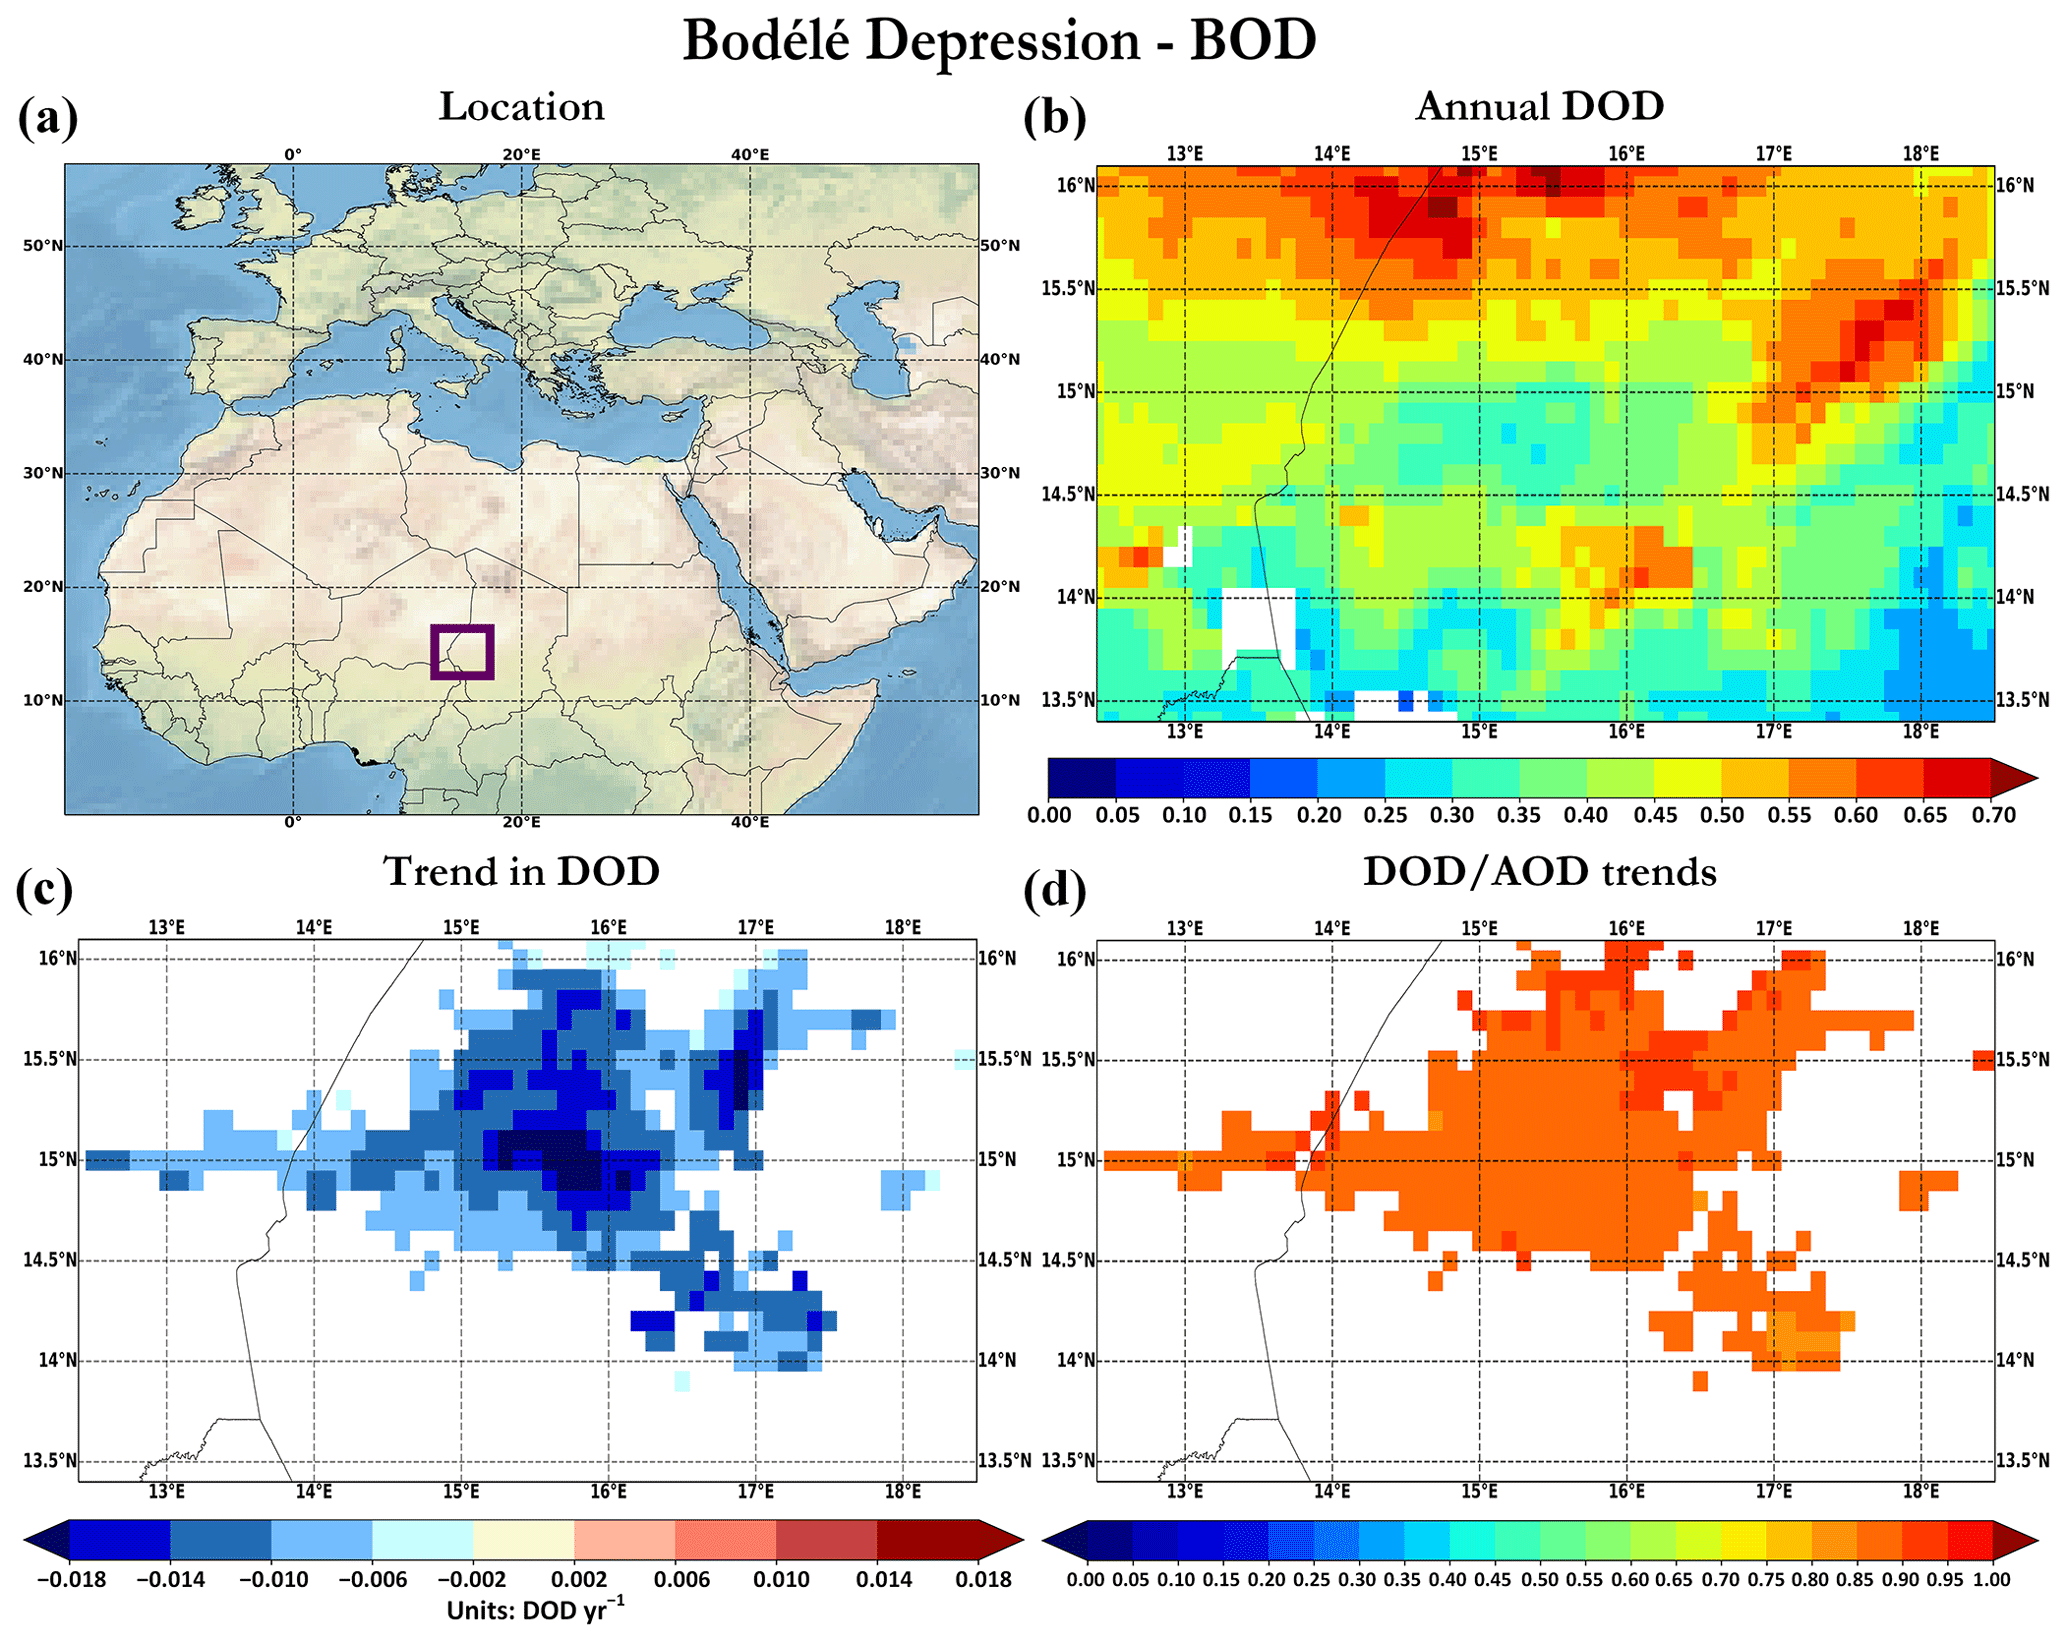
Figure 13Same as Fig. 10, but for the Bodélé Depression.
3.3.3 Arabian Peninsula
The DOD tendencies over the Arabian Peninsula are presented separately for the northern (NAP) and southern (SAP; including Jordan, Iraq and Syria) sectors. In both regions, positive trends (non-significant, Fig. 8a) are computed, which are stronger in the southern parts of the Arabian Peninsula.
Across the Arabian Peninsula, the sign of the trend provides a bimodal pattern, revealing strong positive trends for time frames up to 2013 followed by negative trends onwards (Fig. 9). Our findings are consistent with the revealed regime shift regarding dust activity on the Arabian Peninsula, as discussed in Notaro et al. (2015). The increased dust activity is also reflected in MIDAS DODs between 2008 and 2012, recording increased and stable annual DOD values (∼0.2) compared to DOD values for the previous 2003–2007 period (∼0.15). Due to these sudden changes in dust amount tendencies (from positive to negative), the regional DOD trends are revealed to be non-significant within the entire study period (Fig. 8a). Klingmüller et al. (2016) documented increasing AOD trends during 2001–2012 followed by declining tendencies onwards, in agreement with our findings (Fig. 9). The predominant role of mineral particles in the total aerosol load across the Arabian Peninsula is also reflected by the moderate to high DOD AOD trend ratios (up to 0.65; Figs. 14d and 15d). Increases in both DOD and non-dust AOD explain the moderate-magnitude trend ratios.
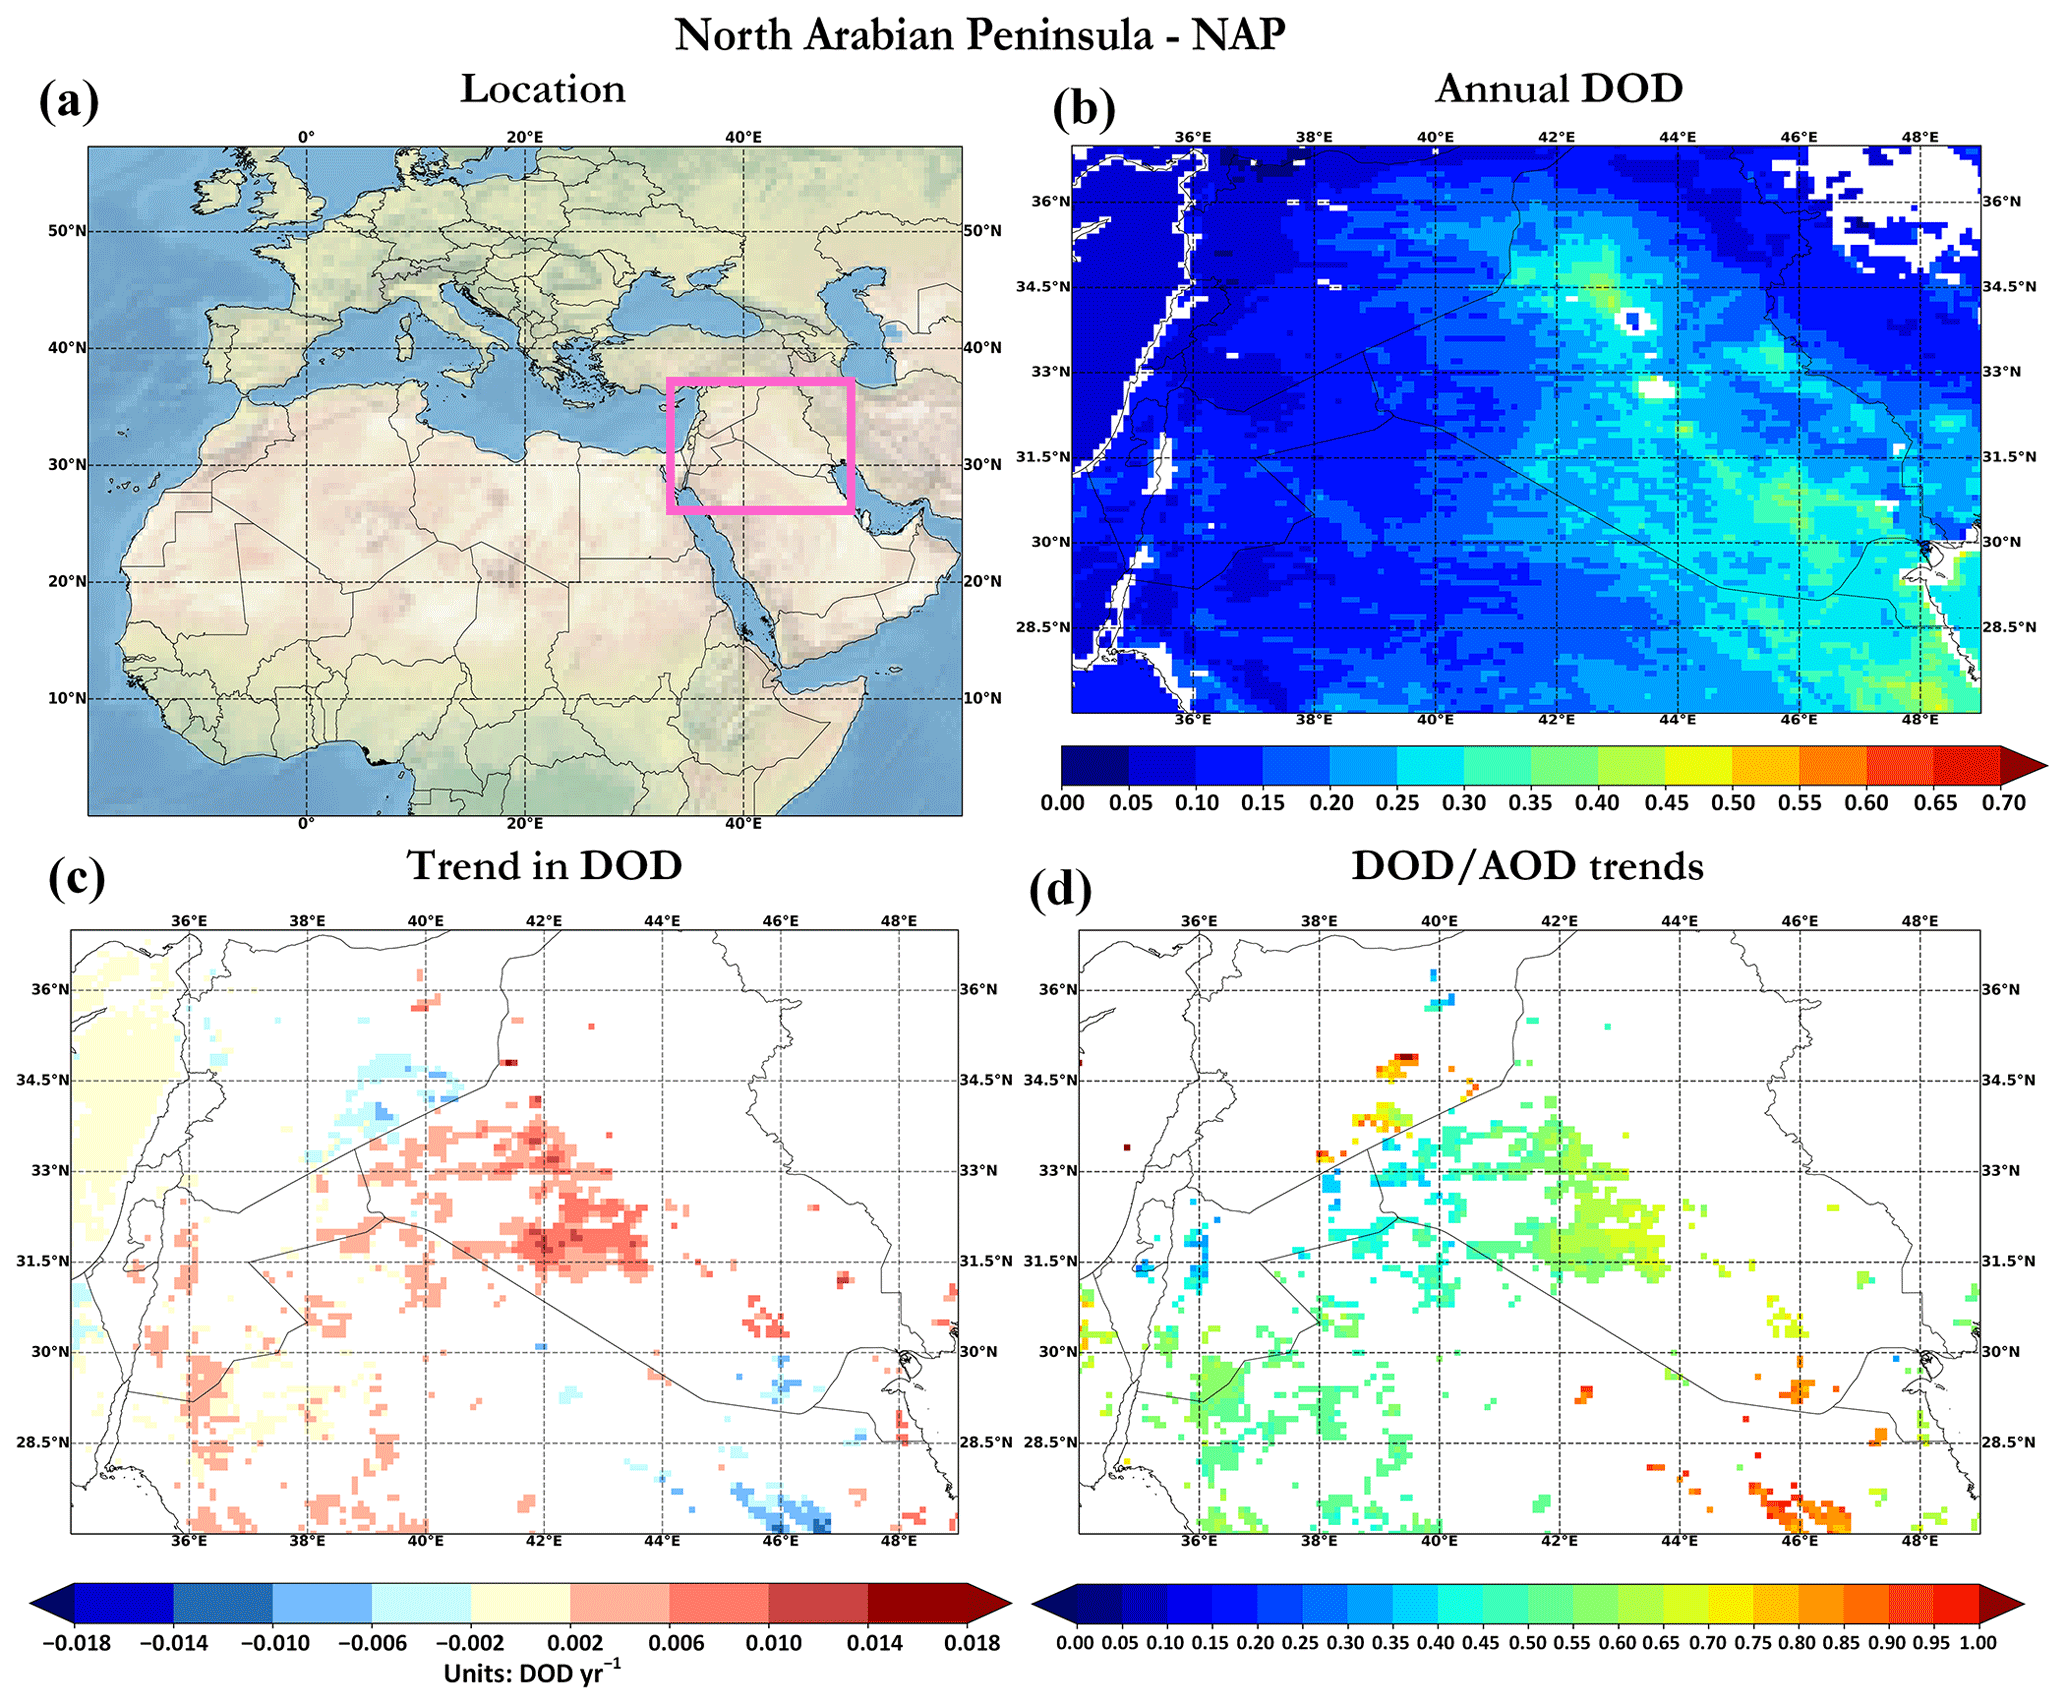
Figure 14Same as Fig. 10, but for the northern Arabian Peninsula.
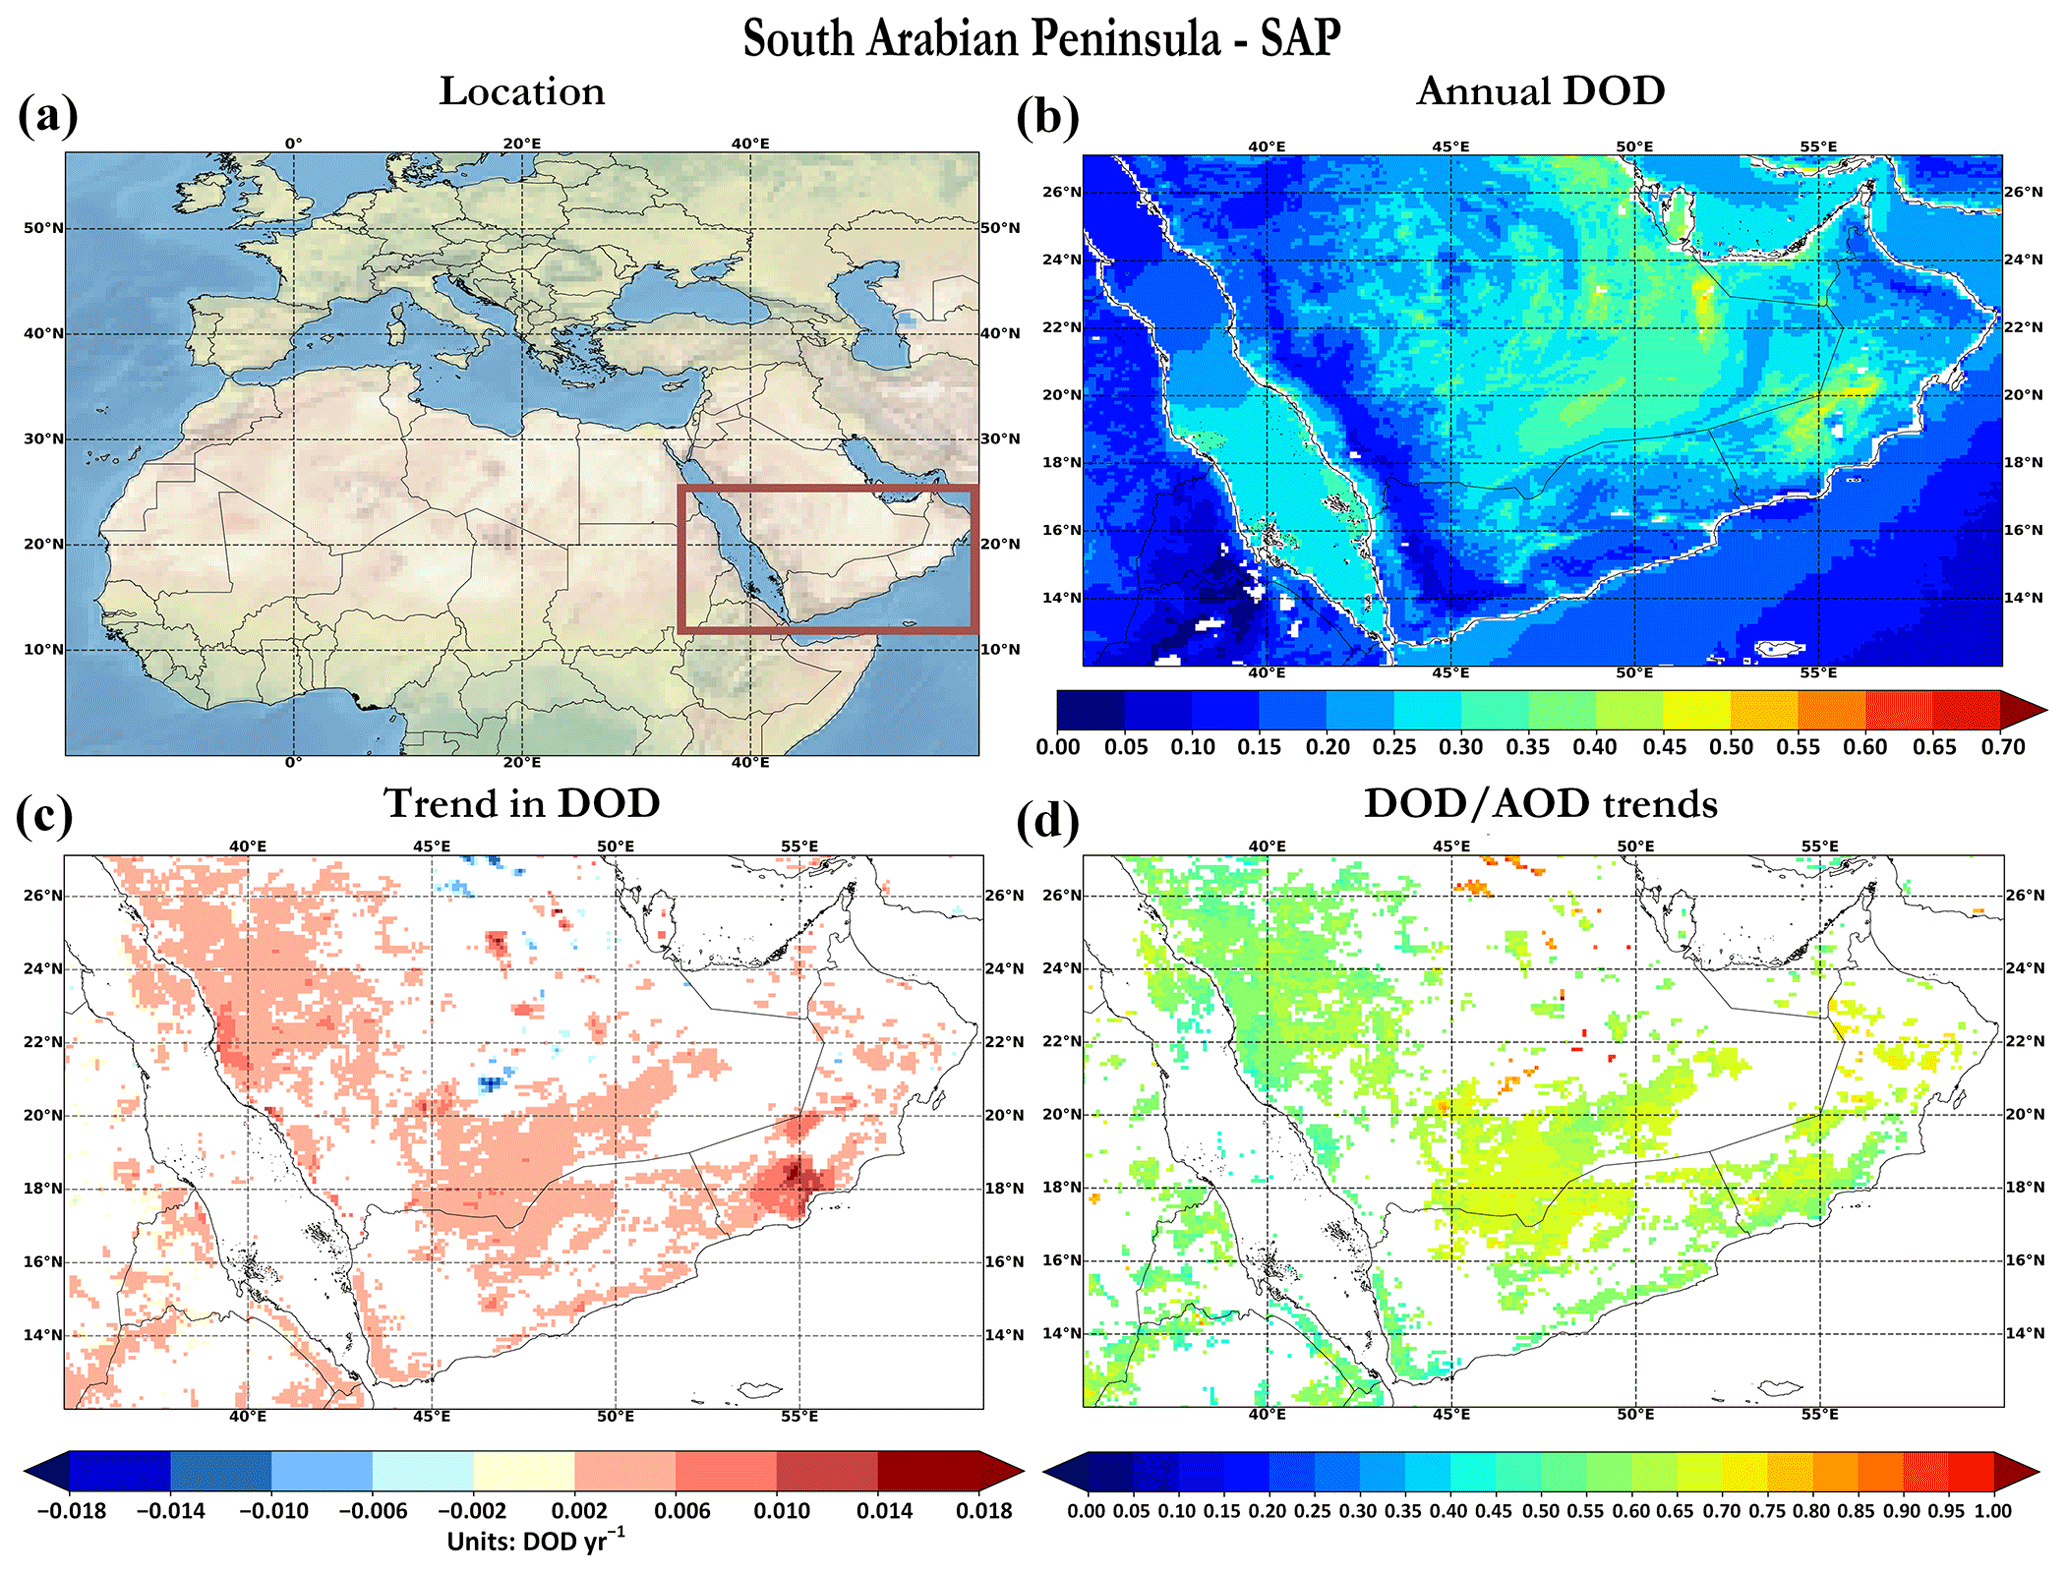
Figure 15Same as Fig. 10, but for the southern Arabian Peninsula.
In the last few decades, compelling interannual dust activity has been documented for the Arabian Peninsula (Notaro et al., 2015). Numerous studies examined the temporal variability of aerosol loads in the Middle East, showing strong ascending tendencies (de Meij et al., 2012; Hsu et al., 2012; Yoon et al., 2014; Pozzer et al., 2015; Klingmüller et al., 2016; Che et al., 2019; Wei et al., 2019a). Klingmüller et al. (2016) revealed that the positive AOD trends in the Middle East are associated with decreasing trends of the Ångström exponent (AE) and fine-mode fraction (FMF), indicating a shift towards a regime with a stronger presence of coarse particles. These findings are in agreement with the increasing DOD trends documented in this study during the same study period (Fig. 9). Moreover, Klingmüller et al. (2016) implemented a multivariate linear model for annual AOD in order to identify the linkage of AOD trends with critical parameters such as precipitation, surface soil moisture and surface wind speed. Soil moisture is the major controlling parameter in Saudi Arabia and Iraq, whereas precipitation dominates in Iran. For all regions, the addition of surface wind speed as an independent parameter upgraded the model performance. Moreover, Che et al. (2019) also used a multiple linear regression model to investigate the relationship of AOD with specific meteorological parameters. The most appropriate ones, in terms of statistical significance, are chosen to enhance the model performance. Across the Middle East, the major controlling meteorological parameters for AOD variance are sea level pressure (60.9 % of total AOD explained variation) and wind speed, highlighting the large impact of synoptic systems on dust burden over the area.
3.3.4 Mediterranean
The Mediterranean (MED) Basin is a region of great concern due to high interannual variability of aerosol loadings and types (Floutsi et al., 2016). In this study, MED presents significant DOD trends ranging from −0.009 to 0.006 yr−1 (Fig. 16c). The regional analysis documents strong declining significant DOD (Fig. 8a) and AOD (Fig. 8b) tendencies across the MED Basin. Negative DOD trends are also revealed during different sub-periods (Fig. 9). The DOD-to-AOD trend ratio shows a latitudinal reduction moving from northern African coasts to the northern parts of the Mediterranean (Fig. 16d). Higher ratio values are documented in the southern Mediterranean–North African coast region (0.3–1.94, median 0.71) (lat: 30.0–38.0∘ N; long: 6.0∘ W–30.0∘ E) compared to the northern Mediterranean (0.21–0.91, median 0.45) (lat: 38.0–45.0∘ N; long: 1.0∘ W–27.0∘ E). Dust particles originating from North African and Middle Eastern deserts driven by low-pressure systems (cyclones) can be transported towards MED (Gkikas et al., 2015), providing relatively high AOD values in the southern parts. Mineral particles are recorded mainly in summer, spring and winter in the western, central and eastern MED, respectively (Floutsi et al., 2016; Gkikas et al., 2013, 2016, 2021b). Across the north sector of MED, lower AOD values are associated with higher FMF values due to the prevailing anthropogenic fine aerosols (Floutsi et al., 2016). The latter could also be observed from the negligible DOD trends there (Fig. 16c).
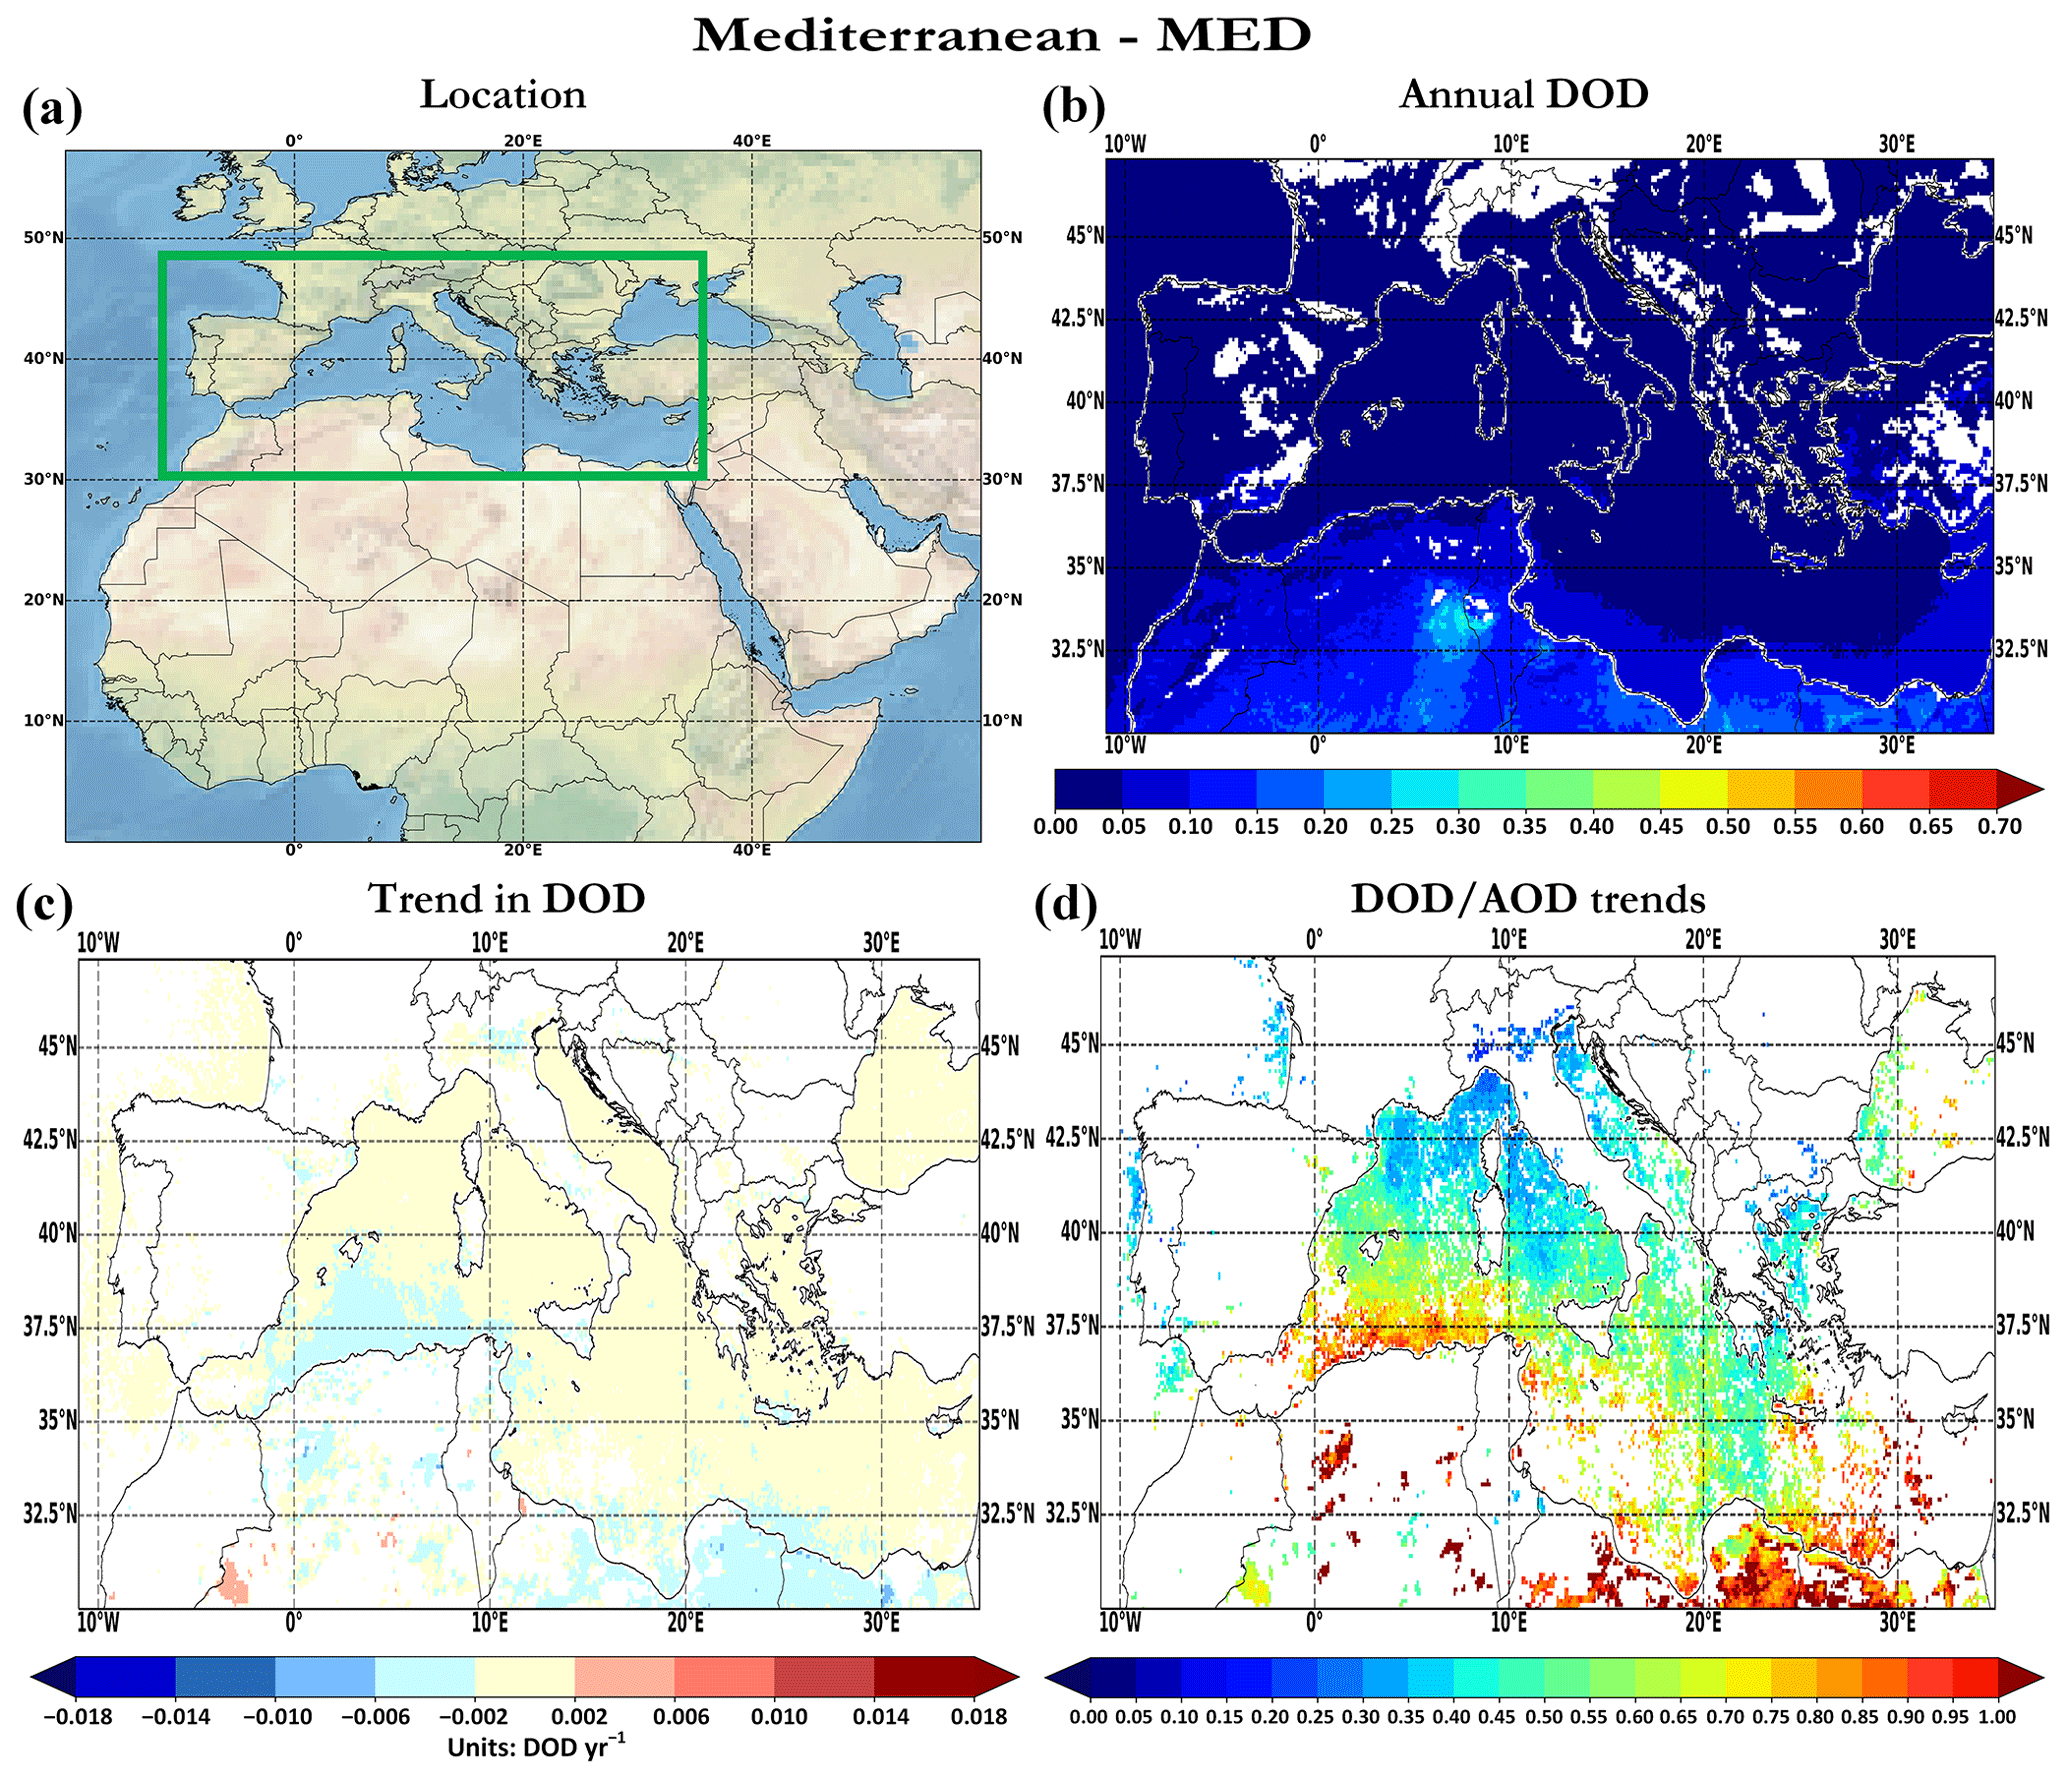
Figure 16Same as Fig. 10, but for the Mediterranean Basin.
Earlier studies investigated the temporal AOD variability in the broader Mediterranean Basin, reporting declining tendencies for the last 2 decades (Papadimas et al., 2008; de Meij et al., 2012; Hsu et al., 2012; Yoon et al., 2014; Pozzer et al., 2015; Floutsi et al., 2016; Che et al., 2019). Across this region, Floutsi et al. (2016) reported significant decreasing AOD trends of −0.0030 yr−1 over the period 2002–2014. Additionally, Nabat et al. (2013) reported decreasing DOD trends (−0.0045 yr−1) across northern Africa. Both studies corroborate the findings of this study: the overwhelming majority of DOD trends are primarily slightly negative (Fig. 16c).
3.3.5 Thar and Gobi deserts
Across the western part of the Indo-Gangetic Plain in the northwest area of the Indian subcontinent, the Thar Desert (THA) is situated. The THA region depicts significant decreasing DOD trends (down to −0.017 yr−1) (Fig. 17c) modulating the corresponding declining AOD tendencies, as indicated by the relatively high DOD AOD trend ratio (0.67; Fig. 17d). The statistical significance of DOD trends, which are always negative regardless of the sub-period, is strongly affected by the starting year and the length of the time interval in which the tendencies are computed (Fig. 9). More specifically, negative and non-statistically significant DOD trends are observed for all time periods beginning from 2005. During the last 2 decades, strong negative temporal trends have been recorded for the OMI ultraviolet aerosol index (Hammer et al., 2018) along with AOD (Che et al., 2019) and DOD (Voss and Evan, 2020) across THA. The reduction of dust abundance over THA is mainly attributed to the increase in rainfall and soil moisture enhancing wet dust deposition and reducing dust erosion during the pre-monsoon (Pandey et al., 2017; Jin and Wang, 2018).
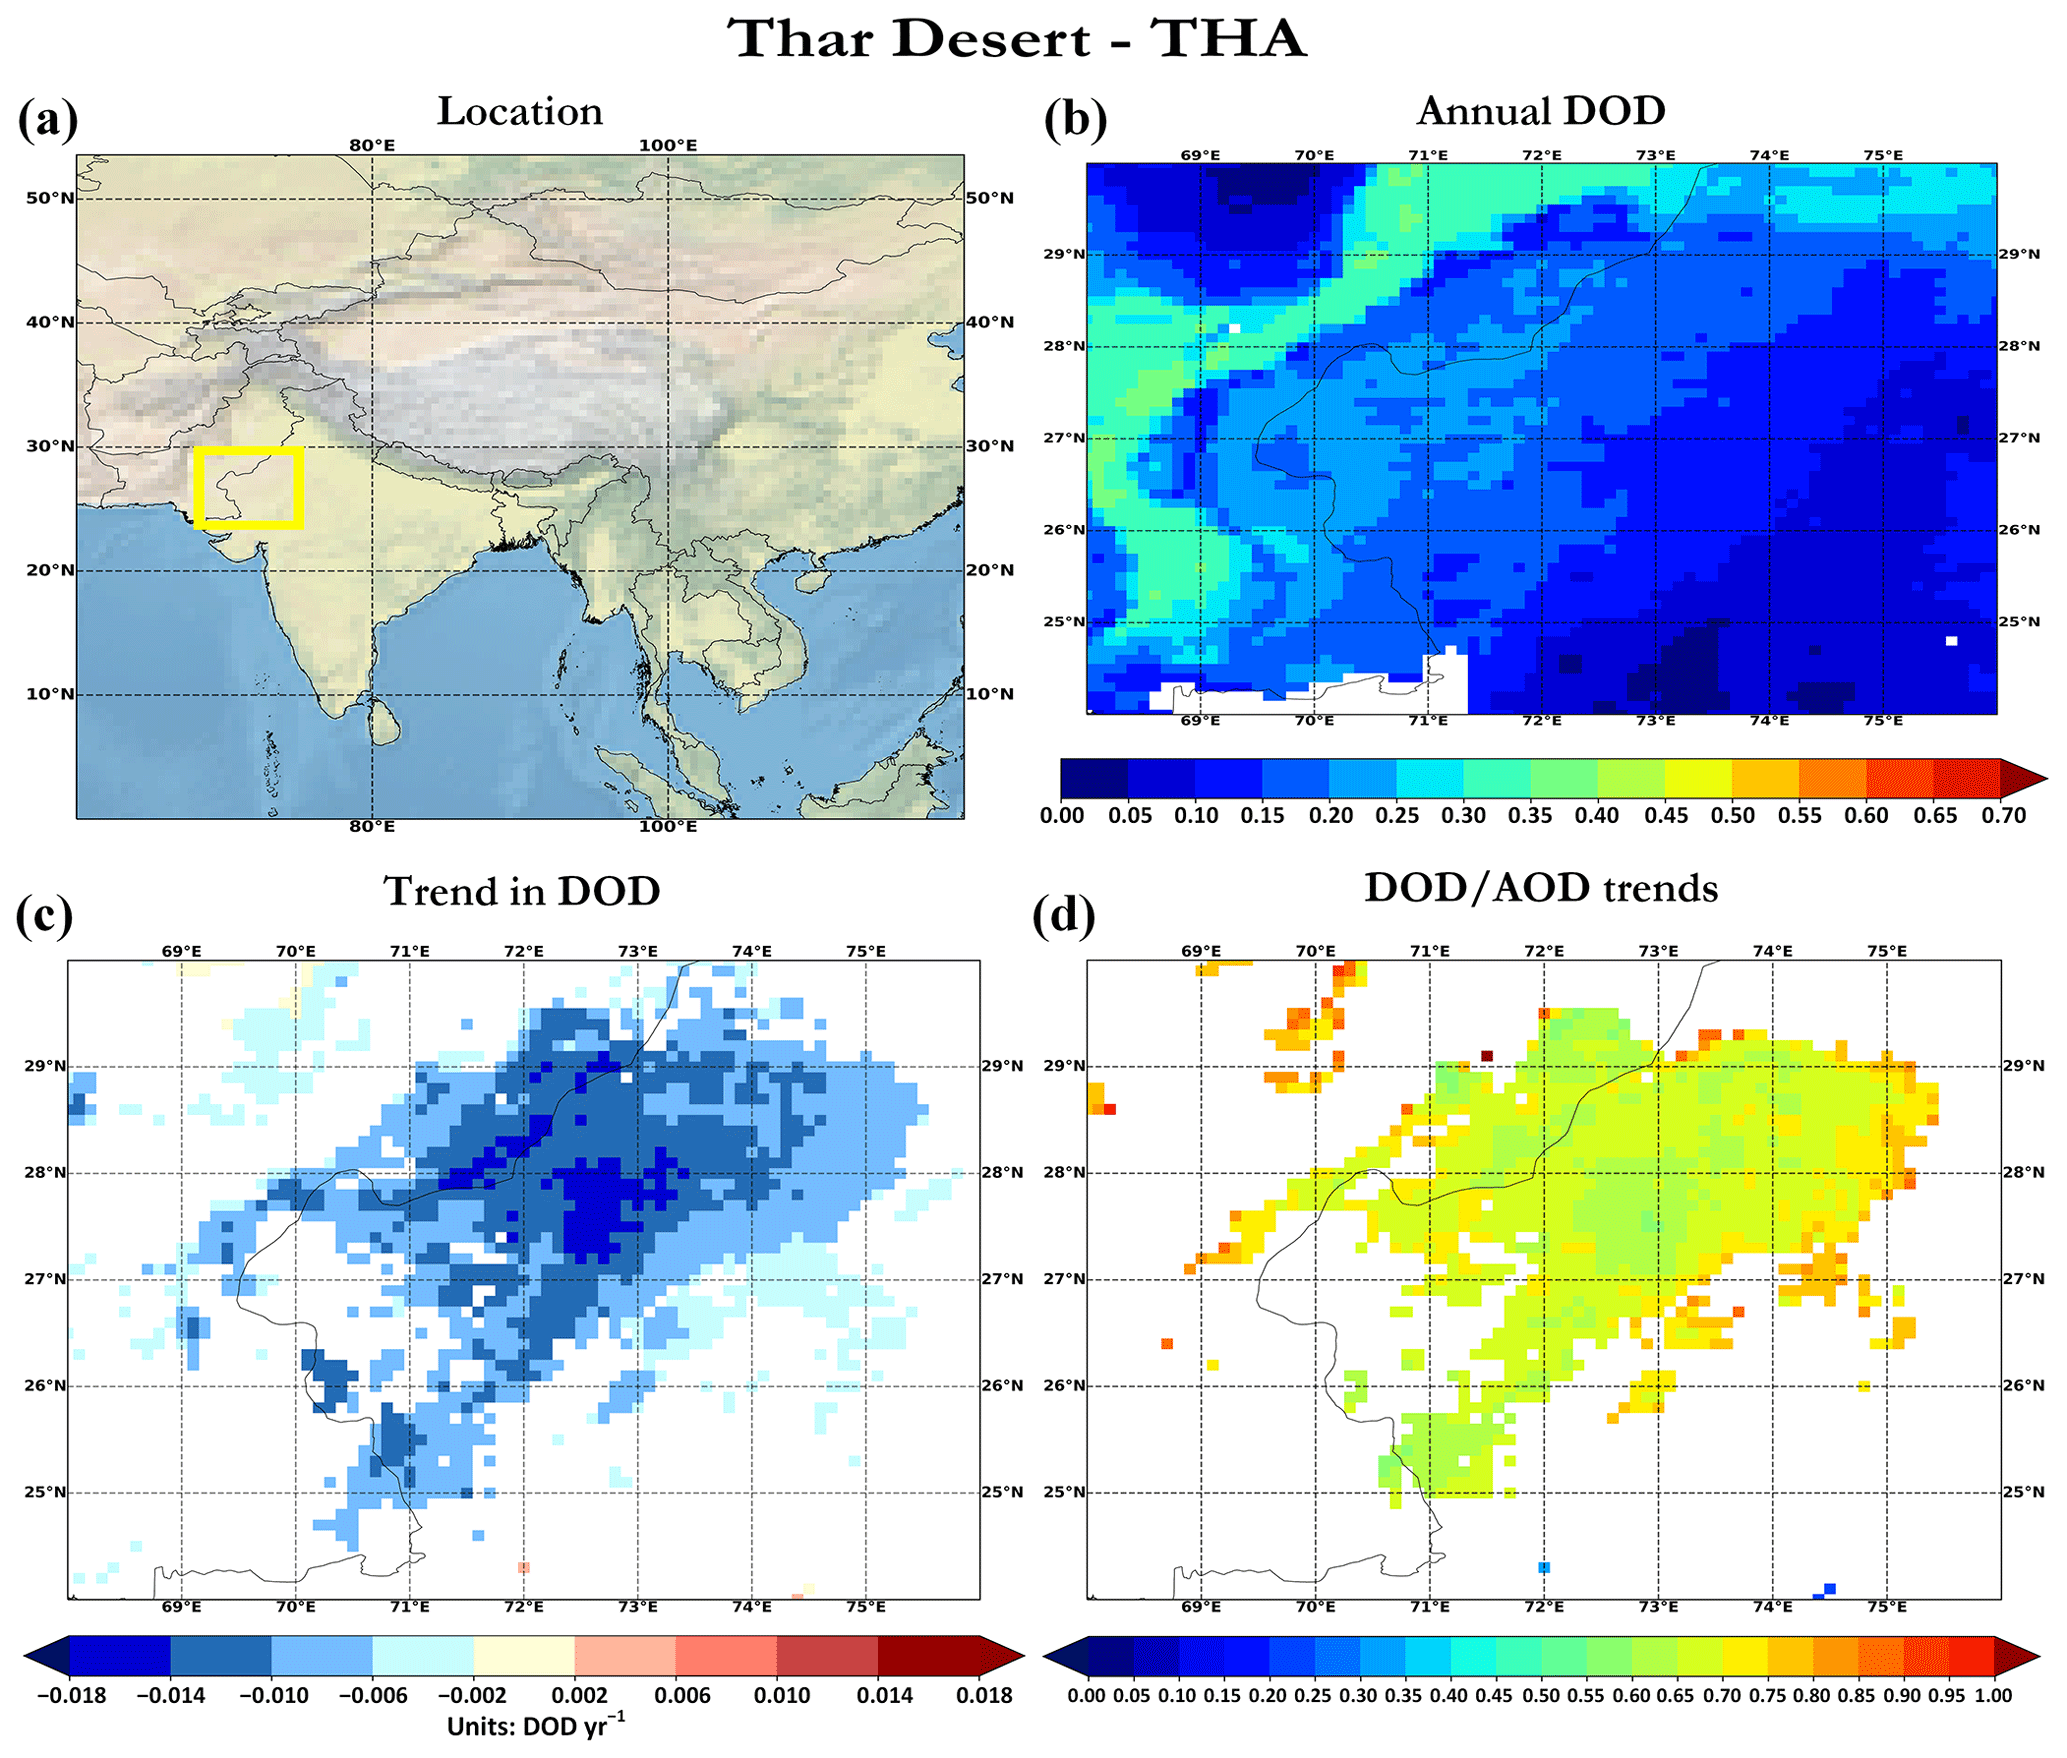
Figure 17Same as Fig. 10, but for the Thar Desert.
The Gobi Desert (GOB) resides between the northern part of China and the southern sector of Mongolia (East Asia). In this region, statistically significant DOD trends ranging from −0.011 to 0.004 yr−1 are reported (Fig. 18c), in agreement (both in sign and magnitude) with those reported by Che et al. (2019) and Voss and Evan (2020) for AOD and DOD, respectively. At a regional level, slightly negative DOD (−0.00071 yr−1) and AOD (−0.0010 yr−1) trends statistically significant at the 90 % confidence level () are computed (Fig. 8). Nevertheless, for the time period from 2005 onwards, the DOD trends are statistically significant at the 95 % confidence level (Fig. 9). These temporal DOD trends corroborate the results of Filonchyk et al. (2019), who computed AOD trends equal to −0.004 and −0.002 decade−1 for MODIS/Terra and MISR measurements, respectively, over the period 2000–2017. In addition, GOB AOD trends are strongly influenced by the presence of dust particles, recording a moderate median DOD-to-AOD trend ratio value of 0.62 (Fig. 18d).
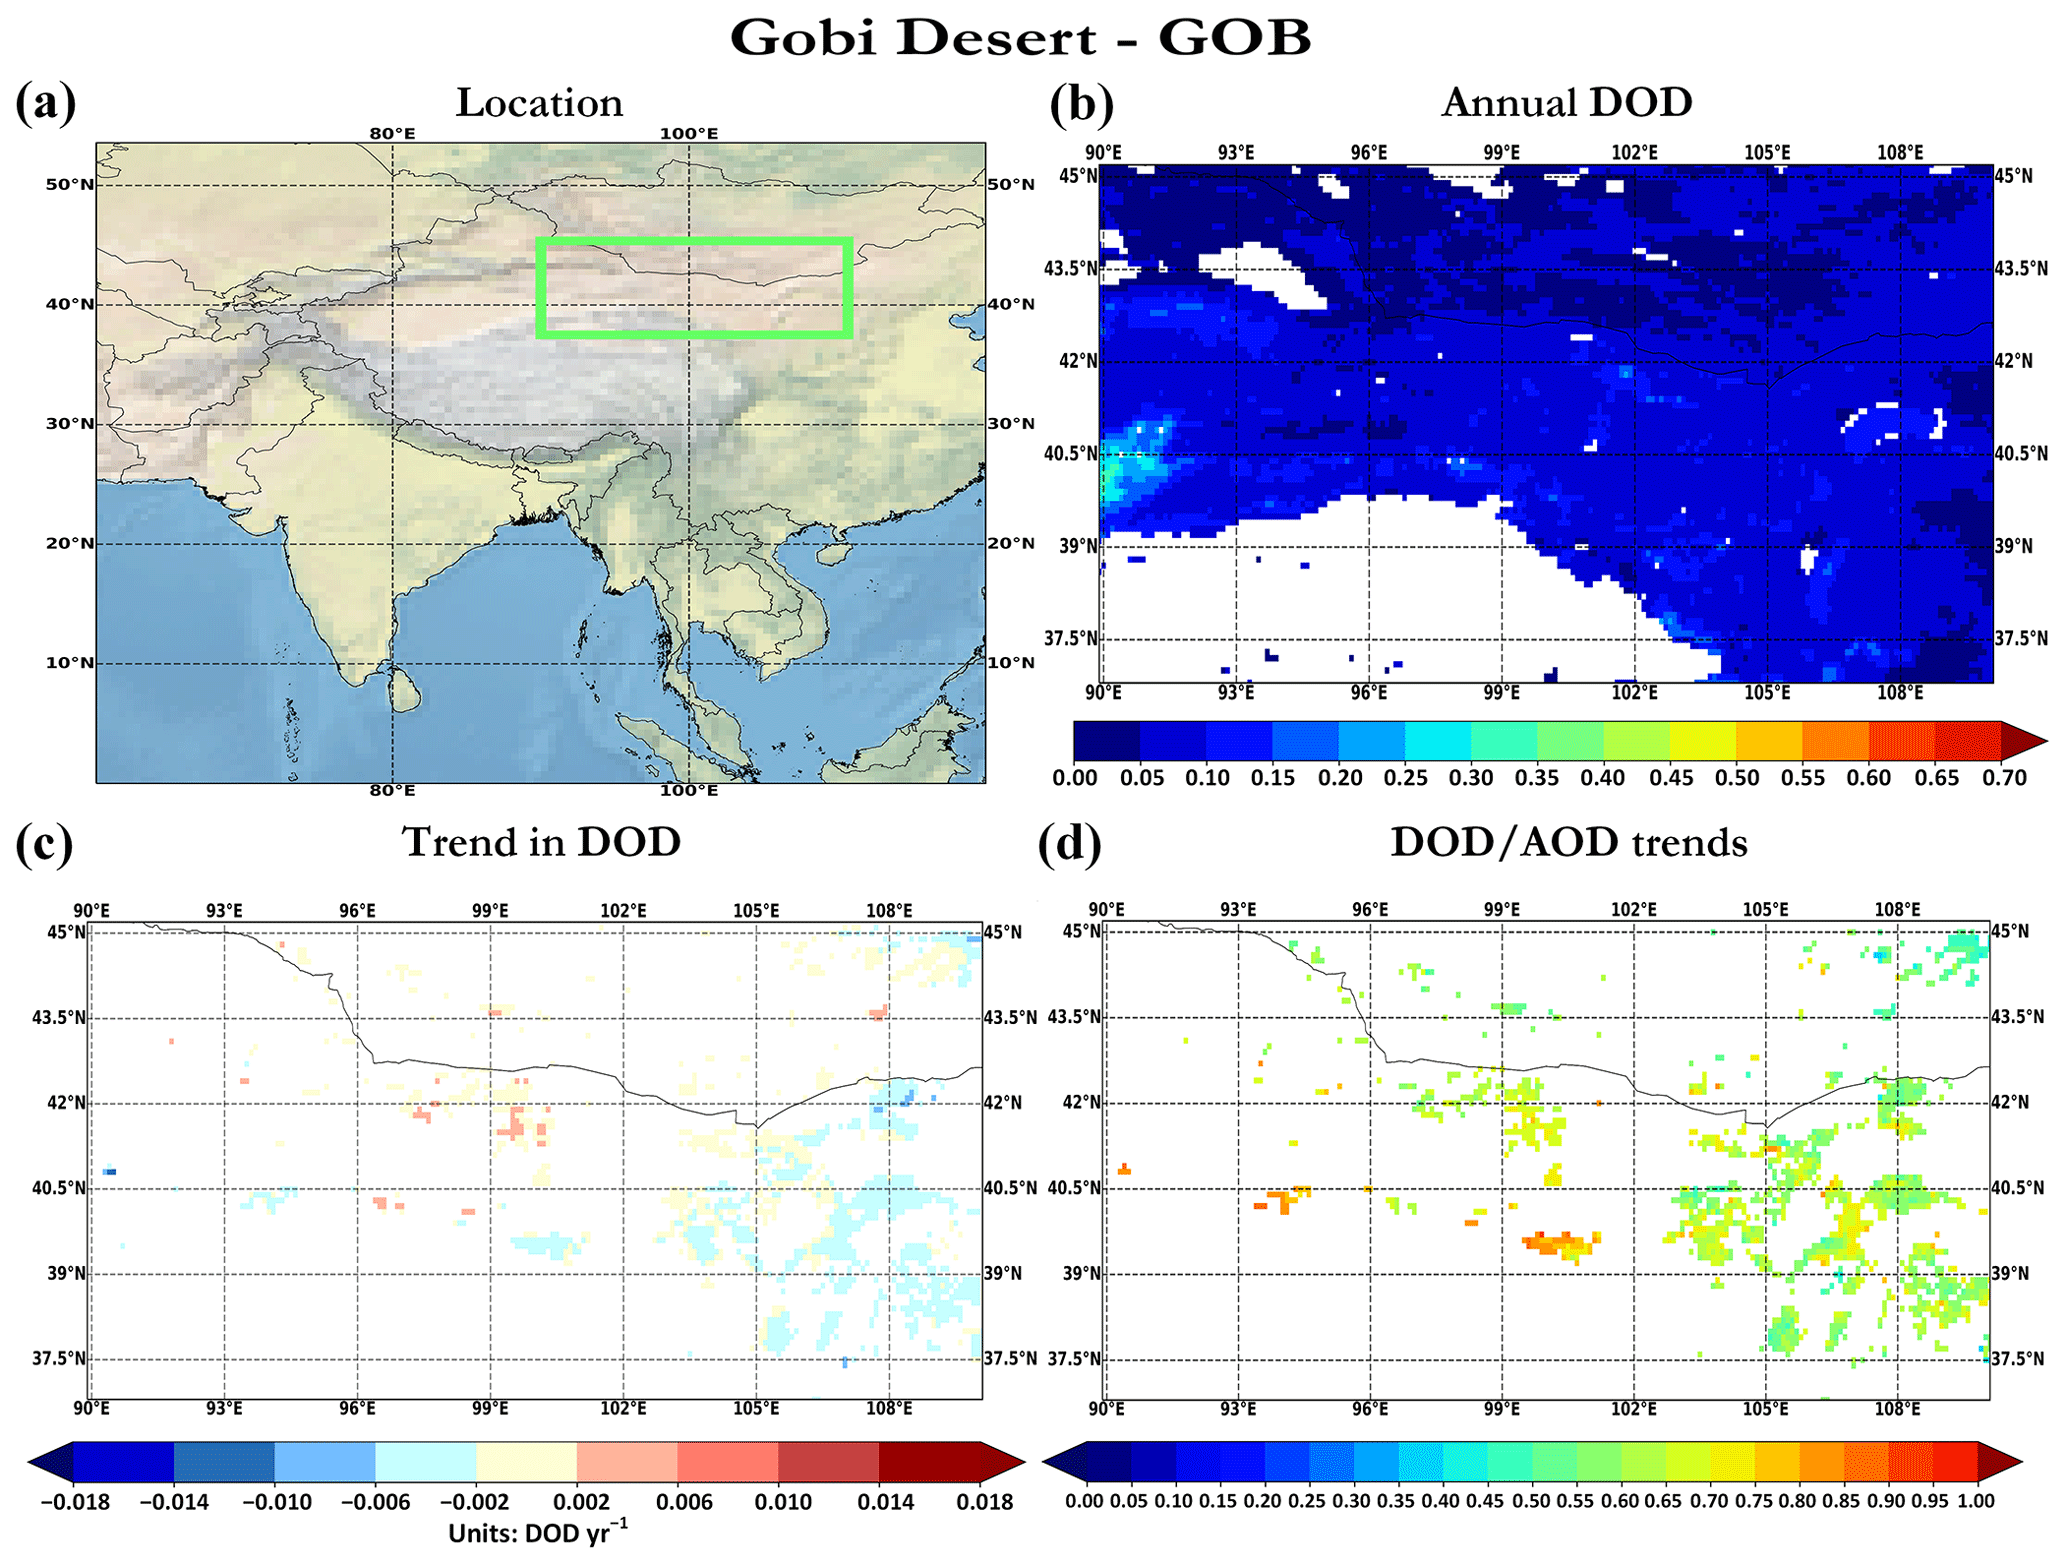
Figure 18Same as Fig. 10, but for the Gobi Desert.
An et al. (2018) conducted a comprehensive analysis to investigate the potential factors driving the reduction of sand and dust storms, taking place mainly in springtime in East Asia between 2006 and 2017. In the aforementioned study, across GOB, the mean surface dust concentration declined by −31.71 µg m−3 yr−1 (−12.24 %). These declining trends are regulated by changes in the surface conditions (e.g., vegetation coverage), which are strongly linked to precipitation, soil moisture, ambient temperature and human activities. The increasing trends in vegetation coverage are observed using the normalized difference vegetation index (NDVI) (0.0006 yr−1) from MODIS and are linked with the ascending tendencies of precipitation (0.002 mm d −1 yr−1) and volumetric soil moisture at 0–0.1 m of depth (0.316 yr−1). All these factors converge towards the reduction of emitted amounts of dust aerosols. Over East Asia, the frequency and intensity of dust outbreaks have decreased during the springtime (An et al., 2018). Dust particles are primarily uplifted into the surrounding air across this region due to massive winds accompanied by cold air from northern latitudes. The decreasing frequency and intensity of dust outbreaks can be explained by the declining tendencies of the northern wind components documented during 2007–2016. The latter is associated with the decline of (1) polar vortex intensity, (2) north-to-south mean surface level pressure gradient and (3) meridional wind component magnitude.
Airborne dust affects the global and regional climate via induced perturbation of the solar and terrestrial radiation fields. Therefore, the investigation of DOD temporal variations is crucial to assess its climatic role and the multifarious impacts within the Earth–atmosphere system as well as human health. The present study deals with the investigation of the annual and seasonal trends of AOD and DOD at both global and regional scales over the period 2003–2017, relying on the MIDAS fine-resolution dataset. Taking advantage of the MIDAS strong capabilities, the DOD trends have been analyzed (i) by considering different aggregation approaches (i.e., arithmetic and geometric means), (ii) at fine and coarse spatial resolutions, (iii) applying and not applying temporal filters (iv) at annual, seasonal and sub-period timescales (i.e., sliding window), and (v) in terms of their contribution to the corresponding tendencies of the total aerosol optical depth. Based on this holistic approach, a complete overview of the temporal variability of dust loads is provided, jointly addressing all the factors determining the sign, magnitude and statistical significance of the calculated trends.
The validity of the MIDAS DOD trends has been investigated with respect to AERONET cAOD data. This analysis considered MIDAS tendencies to be capable of following those of AERONET either for increasing (at 26 out of 30 stations, 86.7 %) or decreasing (at 7 out of 11 stations, 63.6 %) trends. Point-to-point investigation of the DOD–cAOD trends highlighted the accurate, in terms of magnitude and statistical significance, MIDAS DOD trends either across “dusty” sites or downwind areas.
The sensitivity analysis between coarse and fine spatial resolution revealed that the magnitude of AOD and DOD trends is lower for the coarse-spatial-resolution data. On a regional basis, the calculated AOD DOD trends revealed very good agreement in terms of trend magnitude for both spatial scales. In general, coarse-resolution data provide better spatial coverage; however, detailed information, in spatial terms, is provided when fine-resolution data are utilized. In addition, the sensitivity analysis of the different aggregation approaches revealed that the arithmetic-based trends are larger than those of the geometric-based ones (from 52.87 % to 91.77 %) all over the globe. The only exception was found only for AOD at coarse spatial resolution. Lastly, the sensitivity analysis of the temporal filtering in trend calculations indicated new regions (e.g., across oceanic territories) with unphysical unfiltered AOD trends. In addition, unfiltered trends led to poorer performance of MIDAS DOD trends against AERONET retrievals.
Based on our analysis, increasing DOD trends are obtained across the central Sahara and the Arabian Peninsula, whereas opposite tendencies are recorded over the eastern and western Sahara, the Thar and Gobi deserts, in the Bodélé Depression, and in the southern Mediterranean. On a seasonal basis, the maximum positive DOD trends are displayed in the central Sahara and Middle East during summertime. During spring, the strongest reductions of the dust burden have been revealed at the Bodélé Depression, whereas reverse tendencies have been recorded in the western and eastern Sahara and in the Thar and Taklamakan deserts during summer. Similarly, the most negative trends were observed in spring over the Gobi Desert. Positive trends across the area extending from the North Atlantic Ocean to the eastern Caribbean Sea are observed in spring.
At global scale and separately over continents and oceans, negligible and non-significant DOD trends are found. A similar analysis for nine specific regions of the planet has been performed, revealing evident trends that are not all statistically significant. More specifically, strong DOD trends were documented in the central (0.0021 yr−1) and eastern (−0.0018 yr−1) Sahara, the Bodélé Depression (−0.0055 yr−1), the Mediterranean (−0.0011 yr−1), and the Thar Desert (−0.0053 yr−1). In contrast, non-significant regional DOD trends were depicted for the Arabian Peninsula and the Gobi Desert. At a regional scale, the calculated trends vary in terms of sign, magnitude and statistical significance depending on the sub-period, thus indicating a strong interannual variation of dust aerosol load within the period 2003–2017. In the majority of the regions of interest, also including downwind areas, the variations of the total aerosol load are driven by those of mineral particles.
The obtained findings from the current study highlight the applicability of the MIDAS dataset for detecting dust temporal variability across various spatial scales. The high spatiotemporal resolution of MIDAS provides the opportunity to complement and further expand the existing knowledge of this critical aspect that is not yet well covered in the field of dust research. Likewise, by comparing AOD and DOD tendencies, it is feasible to assess the role of mineral particles in variations of the total aerosol load. Our results could be incorporated into chemical models, either for assessing the various impacts of dust and non-dust particles or for evaluating trends based on numerical simulations, to further improve their calibration and forecast performance. Moreover, the findings obtained here can be used for the interpretation of the trends of radiation fluxes at the surface and at the top of the atmosphere obtained by observations or atmosphere–aerosol models (Saidou Chaibou et al., 2020). The recently published Sixth Assessment Report (AR6) of the Intergovernmental Panel on Climate Change (IPCC) states that the increase in the global dust load causes a reduction of the effective radiative forcing (ERF) by −0.25 Wm−2 (Andrews et al., 2017; Forster et al., 2021). Therefore, fluctuations of the dust atmospheric load provide valuable information in order to understand the associated impacts on past, current and future climate. Finally, the current study focused mainly on the description of dust optical depth trends, also providing a preliminary interpretation of the obtained findings. Nevertheless, an in-depth analysis (a follow-up study) is ongoing to investigate the role of critical meteorological variables (e.g., wind) and of other determinant geophysical factors (e.g., soil moisture, vegetation, land coverage) in the configuration of DOD trends.
The MIDAS dataset (Gkikas et al., 2020) is available online at https://doi.org/10.5281/zenodo.4244106.
The supplement related to this article is available online at: https://doi.org/10.5194/acp-21-16499-2021-supplement.
SAL was responsible for the whole analysis and the preparation of the initial paper with support from VS. AG processed the MIDAS dataset and had an advisory role in the relevant parts of the study. AK and SK conceptualized the main objective of the paper and supervised the progress. VA provided feedback on the scientific discussions. All authors contributed to the revision and the final editing of the initial paper.
Some authors are members of the editorial board of Atmospheric Chemistry and Physics. The peer-review process was guided by an independent editor, and the authors also have no other competing interests to declare.
Publisher's note: Copernicus Publications remains neutral with regard to jurisdictional claims in published maps and institutional affiliations.
This article is part of the special issue “Dust aerosol measurements, modeling and multidisciplinary effects (AMT/ACP inter-journal SI)”. It is not associated with a conference.
We acknowledge support of this work by the project “PANhellenic infrastructure for Atmospheric Composition and climatE change” (MIS 5021516), which is implemented under the action “Reinforcement of the Research and Innovation Infrastructure”, funded by the operational program “Competitiveness, Entrepreneurship and Innovation” (NSRF 2014-2020) and co-financed by Greece and the European Union (European Regional Development Fund). The MIDAS dataset has been developed in the framework of the DUST-GLASS project (grant no. 749461; European Union's Horizon 2020 Research and Innovation program under the Marie Skłodowska-Curie Actions. Antonis Gkikas acknowledges support by the Hellenic Foundation for Research and Innovation (H. F. R. I.) under the “2nd Call for H. F. R. I. Research Projects to support Post-Doctoral Researchers” (project acronym: ATLANTAS, project number: 544). Vassilis Amiridis acknowledges support from the European Research Council (grant no. 725698; D-TECT). Stelios Kazadzis acknowledges the International Network to Encourage the Use of Monitoring and Forecasting Dust Products (inDust) COST Action CA16202. We gratefully acknowledge the data provided by AERONET, and we wish to express our appreciation to the operators of stations for their efforts in running the instruments. The publication of this article has been financed by the Research Committee of the University of Patras.
The publication of this article has been financed by the Research Committee of the University of Patras. This research has been supported by the project “PANhellenic infrastructure for Atmospheric Composition and climatE change” (grant no. MIS 5021516), which is implemented under the action “Reinforcement of the Research and Innovation Infrastructure”, funded by the operational program “Competitiveness, Entrepreneurship, and Innovation” (NSRF 2014–2020) and co-financed by Greece and the European Union (under the European Regional Development Fund).
This paper was edited by Thomas Wagner and reviewed by two anonymous referees.
Adesina, A. J., Kumar, K. R., Sivakumar, V., and Piketh, S. J.: Intercomparison and assessment of long-term (2004–2013) multiple satellite aerosol products over two contrasting sites in South Africa, J. Atmos. Sol.-Terr. Phy., 148, 82–95, https://doi.org/10.1016/j.jastp.2016.09.001, 2016.
Alfaro-Contreras, R., Zhang, J., Reid, J. S., and Christopher, S.: A study of 15-year aerosol optical thickness and direct shortwave aerosol radiative effect trends using MODIS, MISR, CALIOP and CERES, Atmos. Chem. Phys., 17, 13849–13868, https://doi.org/10.5194/acp-17-13849-2017, 2017.
Alizadeh-Choobari, O., Zawar-Reza, P., and Sturman, A.: The global distribution of mineral dust and its impacts on the climate system: A review, Atmos. Res., 138, 152–165, https://doi.org/10.1016/j.atmosres.2013.11.007, 2014a.
Alizadeh-Choobari, O., Zawar-Reza, P., and Sturman, A.: The “wind of 120 days” and dust storm activity over the Sistan Basin, Atmos. Res., 143, 328–341, https://doi.org/10.1016/j.atmosres.2014.02.001, 2014b.
Alizadeh-Choobari, O., Sturman, A., and Zawar-Reza, P.: A global satellite view of the seasonal distribution of mineral dust and its correlation with atmospheric circulation, Dyn. Atmos. Ocean., 68, 20–34, https://doi.org/10.1016/j.dynatmoce.2014.07.002, 2014c.
Amiridis, V., Wandinger, U., Marinou, E., Giannakaki, E., Tsekeri, A., Basart, S., Kazadzis, S., Gkikas, A., Taylor, M., Baldasano, J., and Ansmann, A.: Optimizing CALIPSO Saharan dust retrievals, Atmos. Chem. Phys., 13, 12089–12106, https://doi.org/10.5194/acp-13-12089-2013, 2013.
Amiridis, V., Marinou, E., Tsekeri, A., Wandinger, U., Schwarz, A., Giannakaki, E., Mamouri, R., Kokkalis, P., Binietoglou, I., Solomos, S., Herekakis, T., Kazadzis, S., Gerasopoulos, E., Proestakis, E., Kottas, M., Balis, D., Papayannis, A., Kontoes, C., Kourtidis, K., Papagiannopoulos, N., Mona, L., Pappalardo, G., Le Rille, O., and Ansmann, A.: LIVAS: a 3-D multi-wavelength aerosol/cloud database based on CALIPSO and EARLINET, Atmos. Chem. Phys., 15, 7127–7153, https://doi.org/10.5194/acp-15-7127-2015, 2015.
An, L., Che, H., Xue, M., Zhang, T., Wang, H., Wang, Y., Zhou, C., Zhao, H., Gui, K., Zheng, Y., Sun, T., Liang, Y., Sun, E., Zhang, H., and Zhang, X.: Temporal and spatial variations in sand and dust storm events in East Asia from 2007 to 2016: Relationships with surface conditions and climate change, Sci. Total Environ., 633, 452–462, https://doi.org/10.1016/j.scitotenv.2018.03.068, 2018.
Andrews, T., Betts, R. A., Booth, B. B. B., Jones, C. D., and Jones, G. S.: Effective radiative forcing from historical land use change, Clim. Dynam., 48, 3489–3505, https://doi.org/10.1007/s00382-016-3280-7, 2017.
Babu, S. S., Manoj, M. R., Moorthy, K. K., Gogoi, M. M., Nair, V. S., Kompalli, S. K., Satheesh, S. K., Niranjan, K., Ramagopal, K., Bhuyan, P. K., and Singh, D.: Trends in aerosol optical depth over Indian region: Potential causes and impact indicators, J. Geophys. Res.-Atmos., 118, 11, 794–11, 806, https://doi.org/10.1002/2013JD020507, 2013.
Basart, S., Pérez, C., Cuevas, E., Baldasano, J. M., and Gobbi, G. P.: Aerosol characterization in Northern Africa, Northeastern Atlantic, Mediterranean Basin and Middle East from direct-sun AERONET observations, Atmos. Chem. Phys., 9, 8265–8282, https://doi.org/10.5194/acp-9-8265-2009, 2009.
Che, H., Qi, B., Zhao, H., Xia, X., Eck, T. F., Goloub, P., Dubovik, O., Estelles, V., Cuevas-Agulló, E., Blarel, L., Wu, Y., Zhu, J., Du, R., Wang, Y., Wang, H., Gui, K., Yu, J., Zheng, Y., Sun, T., Chen, Q., Shi, G., and Zhang, X.: Aerosol optical properties and direct radiative forcing based on measurements from the China Aerosol Remote Sensing Network (CARSNET) in eastern China, Atmos. Chem. Phys., 18, 405–425, https://doi.org/10.5194/acp-18-405-2018, 2018.
Che, H., Gui, K., Xia, X., Wang, Y., Holben, B. N., Goloub, P., Cuevas-Agulló, E., Wang, H., Zheng, Y., Zhao, H., and Zhang, X.: Large contribution of meteorological factors to inter-decadal changes in regional aerosol optical depth, Atmos. Chem. Phys., 19, 10497–10523, https://doi.org/10.5194/acp-19-10497-2019, 2019.
Chen, J. L., Pekker, T., Wilson, C. R., Tapley, B. D., Kostianoy, A. G., Cretaux, J. F., and Safarov, E. S.: Long-term Caspian Sea level change, Geophys. Res. Lett., 44, 6993–7001, https://doi.org/10.1002/2017GL073958, 2017.
Clarisse, L., Clerbaux, C., Franco, B., Hadji-Lazaro, J., Whitburn, S., Kopp, A. K., Hurtmans, D., and Coheur, P.-F.: A Decadal Data Set of Global Atmospheric Dust Retrieved From IASI Satellite Measurements, J. Geophys. Res.-Atmos., 124, 1618–1647, https://doi.org/10.1029/2018JD029701, 2019.
Dahutia, P., Pathak, B., and Bhuyan, P. K.: Aerosols characteristics, trends and their climatic implications over Northeast India and adjoining South Asia, Int. J. Climatol., 38, 1234–1256, https://doi.org/10.1002/joc.5240, 2017.
de Meij, A., Pozzer, A. and Lelieveld, J.: Trend analysis in aerosol optical depths and pollutant emission estimates between 2000 and 2009, Atmos. Environ., 51, 75–85, https://doi.org/10.1016/j.atmosenv.2012.01.059, 2012.
Dubovik, O. and King, M. D.: A flexible inversion algorithm for retrieval of aerosol optical properties from Sun and sky radiance measurements, J. Geophys. Res., 105, 20673–20696, https://doi.org/10.1029/2000JD900282, 2000.
Elguindi, N., Solmon, F., and Turuncoglu, U.: Quantifying some of the impacts of dust and other aerosol on the Caspian Sea region using a regional climate model. Clim. Dyn., 46, 41–55, https://doi.org/10.1007/s00382-015-2566-5, 2016.
Evan, A. T., Dunion, J., Foley, J. A., Heidinger, A. K., and Velden, C. S.: New evidence for a relationship between Atlantic tropical cyclone activity and African dust outbreaks, Geophys. Res. Lett., 33, L19813, https://doi.org/10.1029/2006GL026408, 2006.
Evan, A. T., Flamant, C., Gaetani, M., and Guichard, F.: The past, present and future of African dust, Nature, 531, 493–495, https://doi.org/10.1038/nature17149, 2016.
Fréville, H., Chami, M., and Mallet, M.: Analysis of the Transport of Aerosols over the North Tropical Atlantic Ocean Using Time Series of POLDER/PARASOL Satellite Data, Remote Sens., 12, 757, https://doi.org/10.3390/rs12050757, 2020.
Filonchyk, M., Yan, H., Zhang, Z., Yang, S., Li, W., and Li, Y.: Combined use of satellite and surface observations to study aerosol optical depth in different regions of China, Sci. Rep., 9, 1–15, https://doi.org/10.1038/s41598-019-42466-6, 2019.
Floutsi, A. A., Korras-Carraca, M. B., Matsoukas, C., Hatzianastassiou, N., and Biskos, G.: Climatology and trends of aerosol optical depth over the Mediterranean basin during the last 12 years (2002–2014) based on Collection 006 MODIS-Aqua data, Sci. Total Environ., 551–552, 292–303, https://doi.org/10.1016/j.scitotenv.2016.01.192, 2016.
Forster, P., Storelvmo, T., Armour, K., Collins, W., Dufresne, J. L., Frame, D., Lunt, D. J., Mauritsen, T., Palmer, M. D., Watanabe, M., Wild, M., and Zhang H.: The Earth's Energy Budget, Climate Feedbacks, and Climate Sensitivity, in: Climate Change 2021: The Physical Science Basis, Contribution of Working Group I to the Sixth Assessment Report of the Intergovernmental Panel on Climate Change, edited by: Masson-Delmotte, V., Zhai, P., Pirani, A., Connors, S. L., Péan, C., Berger, S., Caud, N., Chen, Y., Goldfarb, L., Gomis, M. I., Huang, M., Leitzell, K., Lonnoy, E., Matthews, J. B. R., Maycock, T. K., Waterfield, T., Yelekçi, O., Yu, R., and Zhou, B., Cambridge University Press, in Press: https://www.ipcc.ch/report/ar6/wg1/downloads/report/IPCC_AR6_WGI_Citation.pdf, 2021.
Gelaro, R, McCarty, W., Suárez, M. J., Todling, R., Molod, A., Takacs, L., Randles, C. A., Darmenov, A., Bosilovich, M. G., Reichle, R., Wargan, K., Coy, L., Cullather, R., Draper, C., Akella, S., Buchard, V., Conaty, A., da Silva, A. M., Gu, W., Kim, G., Koster, R., Lucchesi, R., Merkova, D., Nielsen, J. E., Partyka, G., Pawson, S., Putman, W., Rienecker, M., Schubert, S. D., Sienkiewicz, M., and Zhao, B.: The Modern-Era Retrospective Analysis for Research and Applications, Version 2 (MERRA-2), J. Climate, 30, 5419–5454, https://doi.org/10.1175/JCLI-D-16-0758.1, 2017.
Giles, D. M., Holben, B. N., Eck, T. F., Sinyuk, A., Smirnov, A., Slutsker, I., Dickerson, R. R., and Thompson, A. M., and Schafer, J. S.: An analysis of AERONET aerosol absorption properties and classifications representative of aerosol source regions, J. Geophys. Res., 117, D17203, https://doi.org/10.1029/2012JD018127, 2012.
Giles, D. M., Sinyuk, A., Sorokin, M. G., Schafer, J. S., Smirnov, A., Slutsker, I., Eck, T. F., Holben, B. N., Lewis, J. R., Campbell, J. R., Welton, E. J., Korkin, S. V., and Lyapustin, A. I.: Advancements in the Aerosol Robotic Network (AERONET) Version 3 database – automated near-real-time quality control algorithm with improved cloud screening for Sun photometer aerosol optical depth (AOD) measurements, Atmos. Meas. Tech., 12, 169–209, https://doi.org/10.5194/amt-12-169-2019, 2019.
Ginoux, P., Prospero, J. M., Gill, T. E., Hsu, N. C., and Zhao, M.: Global-scale attribution of anthropogenic and natural dust sources and their emission rates based on MODIS Deep Blue aerosol products, Rev. Geophys., 50, RG3005, https://doi.org/10.1029/2012RG000388, 2012.
Gkikas, A., Hatzianastassiou, N., Mihalopoulos, N., Katsoulis, V., Kazadzis, S., Pey, J., Querol, X., and Torres, O.: The regime of intense desert dust episodes in the Mediterranean based on contemporary satellite observations and ground measurements, Atmos. Chem. Phys., 13, 12135–12154, https://doi.org/10.5194/acp-13-12135-2013, 2013.
Gkikas, A., Houssos, E. E., Lolis, C. J., Bartzokas, A., Mihalopoulos, N., and Hatzianastassiou, N.: Atmospheric circulation evolution related to desert-dust episodes over the Mediterranean, Q. J. Roy. Meteor. Soc., 141, 1634–1645, https://doi.org/10.1002/qj.2466, 2015.
Gkikas, A., Basart, S., Hatzianastassiou, N., Marinou, E., Amiridis, V., Kazadzis, S., Pey, J., Querol, X., Jorba, O., Gassó, S., and Baldasano, J. M.: Mediterranean intense desert dust outbreaks and their vertical structure based on remote sensing data, Atmos. Chem. Phys., 16, 8609–8642, https://doi.org/10.5194/acp-16-8609-2016, 2016.
Gkikas, A., Proestakis, E., Amiridis, V., Kazadzis, S., Di Tomaso, E., Tsekeri, A., Marinou, E., Hatzianastassiou, N., and Pérez García-Pando, C.: ModIs Dust AeroSol (MIDAS): A global fine resolution dust optical depth dataset, Zenodo [data set], https://doi.org/10.5281/zenodo.4244106, 2020.
Gkikas, A., Proestakis, E., Amiridis, V., Kazadzis, S., Di Tomaso, E., Tsekeri, A., Marinou, E., Hatzianastassiou, N., and Pérez García-Pando, C.: ModIs Dust AeroSol (MIDAS): a global fine-resolution dust optical depth data set, Atmos. Meas. Tech., 14, 309–334, https://doi.org/10.5194/amt-14-309-2021, 2021a.
Gkikas, A., Proestakis, E., Amiridis, V., Kazadzis, S., Di Tomaso, E., Marinou, E., Hatzianastassiou, N., Kok, J. F., and García-Pando, C. P.: Quantification of the dust optical depth across spatiotemporal scales with the MIDAS global dataset (2003–2017), Atmos. Chem. Phys. Discuss. [preprint], https://doi.org/10.5194/acp-2021-572, in review, 2021b.
Gläser, G., Wernli, H., Kerkweg, A., and Teubler, F.: The transatlantic dust transport from North Africa to the Americas-Its characteristics and source regions, J. Geophys. Res.-Atmos., 120, 11231–11252, https://doi.org/10.1002/2015JD023792, 2015.
Goudie, A. and Middleton, N. J.: Desert Dust in the Global System, Springer, Berlin, Heidelberg, https://doi.org/10.1007/3-540-32355-4, 2006.
Griffin, D. W., Kellogg, C. A., Garrison, V. H., and Shinn, E. A.: The global transport of dust. An intercontinental river of dust, microorganisms and toxic chemicals flows through the Earth's atmosphere, Am. Sci., 90, 228–235, 2002.
Guo, J. P., Zhang, X. Y., Wu, Y. R., Zhaxi, Y., Che, H. Z., La, B., Wang, W., and Li, X. W.: Spatio-temporal variation trends of satellite-based aerosol optical depth in China during 1980–2008, Atmos. Environ., 45, 6802–6811, https://doi.org/10.1016/j.atmosenv.2011.03.068, 2011.
Guo, J., Xu, H., Liu, L., Chen, D., Peng, Y., Yim, S. H. L., Yang, Y., Li, J., Zhao, C., and Zhai, P.: The trend reversal of dust aerosol over East Asia and the North Pacific Ocean attributed to large-scale meteorology, deposition and soil moisture, J. Geophys. Res.-Atmos., 124, 10450–10466, https://doi.org/10.1029/2019JD030654, 2019
Hamill, P., Giordano, M., Ward, C., Giles, D., and Holben, B.: An AERONET-based aerosol classification using the Mahalanobis distance, Atmos. Environ., 140, 213–233, https://doi.org/10.1016/j.atmosenv.2016.06.002, 2016.
Hammer, M. S., Martin, R. V., Li, C., Torres, O., Manning, M., and Boys, B. L.: Insight into global trends in aerosol composition from 2005 to 2015 inferred from the OMI Ultraviolet Aerosol Index, Atmos. Chem. Phys., 18, 8097–8112, https://doi.org/10.5194/acp-18-8097-2018, 2018.
Hersbach, H., Bell, B., Berrisford, P., Biavati, G., Horányi, A., Muñoz Sabater, J., Nicolas, J., Peubey, C., Radu, R., Rozum, I., Schepers, D., Simmons, A., Soci, C., Dee, D., and Thépaut, J.-N.: ERA5-Land hourly data from 1981 to present, Copernicus Climate Change Service (C3S) Climate Data Store (CDS) [data set], https://doi.org/10.24381/cds.adbb2d47, 2018.
Hersbach, H., Bell, B., Berrisford, P., Hirahara, S., Horányi, A., Muñoz-Sabater, J., Nicolas, J., Peubey, C., Radu, R., Schepers, D., Simmons, A., Soci, C., Abdalla, S., Abellan, X., Balsamo, G., Bechtold, P., Biavati, G., Bidlot, J., Bonavita, M., De Chiara, G., Dahlgren, P., Dee, D., Diamantakis, M., Dragani, R., Flemming, J., Forbes, R., Fuentes, M., Geer, A., Haimberger, L., Healy, S., Hogan, R. J., Hólm, E., Janisková, M., Keeley, S., Laloyaux, P., Lopez, P., Lupu, C., Radnoti, G., de Rosnay, P., Rozum, I., Vamborg, F., Villaume, S., and Thépaut, J.-N.: The ERA5 global reanalysis, Q. J. Roy. Meteor. Soc., 146, 1999–2049, https://doi.org/10.1002/qj.3803, 2020.
Holben, B. N., Eck, T. F., Slutsker, I., Tanre, D., Buis, J. P., Setzer, A., Vermote, E., Reagan, J. A., Kaufman, Y., Nakajima, T., Lavenue, F., Jankowiak, I., and Smirnov, A.: AERONET – A federated instrument network and data archive for aerosol characterization, Remote Sens. Environ., 66, 1–16, https://doi.org/10.1016/S0034-4257(98)00031-5, 1998.
Hsu, N. C., Gautam, R., Sayer, A. M., Bettenhausen, C., Li, C., Jeong, M. J., Tsay, S.-C., and Holben, B. N.: Global and regional trends of aerosol optical depth over land and ocean using SeaWiFS measurements from 1997 to 2010, Atmos. Chem. Phys., 12, 8037–8053, https://doi.org/10.5194/acp-12-8037-2012, 2012.
Hu, K., Kumar, K. R., Kang, N., Boiyo, R., and Wu, J.: Spatiotemporal characteristics of aerosols and their trends over mainland China with the recent Collection 6 MODIS and OMI satellite datasets, Environ. Sci. Pollut. Res., 25, 6909–6927, https://doi.org/10.1007/s11356-017-0715-6, 2018.
Huang, J., Zhang, C., and Prospero, J. M.: African dust outbreaks: a satellite perspective of temporal and spatial variability over the tropical Atlantic Ocean, J. Geophys. Res., 115, D05202, https://doi.org/10.1029/2009JD012516, 2010.
Jin, Q. and Wang, C.: The greening of Northwest Indian subcontinent and reduction of dust abundance resulting from Indian summer monsoon revival, Sci. Rep., 8, 1–9, https://doi.org/10.1038/s41598-018-23055-5, 2018.
Kaku, K. C., Reid, J. S., O'Neill, N. T., Quinn, P. K., Coffman, D. J., and Eck, T. F.: Verification and application of the extended spectral deconvolution algorithm (SDA+) methodology to estimate aerosol fine and coarse mode extinction coefficients in the marine boundary layer, Atmos. Meas. Tech., 7, 3399–3412, https://doi.org/10.5194/amt-7-3399-2014, 2014.
Kalashnikova, O. V. and Kahn, R. A.: Mineral dust plume evolution over the Atlantic from MISR and MODIS aerosol retrievals, J. Geophys. Res., 113, D24204, https://doi.org/10.1029/2008JD010083, 2008.
Klingmüller, K., Pozzer, A., Metzger, S., Stenchikov, G. L., and Lelieveld, J.: Aerosol optical depth trend over the Middle East, Atmos. Chem. Phys., 16, 5063–5073, https://doi.org/10.5194/acp-16-5063-2016, 2016.
Kok, J. F., Ridley, D. A., Zhou, Q., Miller, R. L., Zhao, C., Heald, C. L., Ward, D. S., Albani, S., and Haustein, K.: Smaller desert dust cooling effect estimated from analysis of dust size and abundance, Nat. Geosci., 10, 274–278, https://doi.org/10.1038/ngeo2912, 2017.
Kumar, K. R., Yin, Y., Sivakumar, V., Kang, N., Yu, X., Diao, Y., Adesina, A. J., and Reddy, R. R.: Aerosol climatology and discrimination of aerosol types retrieved from MODIS, MISR and OMI over Durban (29.88∘ S, 31.02∘ E), South Africa, Atmos. Environ., 117, 9–18, https://doi.org/10.1016/j.atmosenv.2015.06.058, 2015.
Kumar, K. R., Boiyo, R., Madina, A. and Kang, N.: A 13-year climatological study on the variations of aerosol and cloud properties over Kazakhstan from remotely sensed satellite observations, J. Atmos. Sol.-Terr. Phy., 179, 55–68, https://doi.org/10.1016/j.jastp.2018.06.014, 2018.
Lakshmi, N. B., Babu, S. S., and Nair, V. S.: Recent Regime Shifts in Mineral Dust Trends over South Asia from Long-Term CALIPSO Observations, IEEE Trans. Geosci. Remote Sens., 57, 4485–4489, https://doi.org/10.1109/TGRS.2019.2891338, 2019.
Lee, J., Kim, J., Song, C. H., Chun, Y., Sohn, B. J., and Holben, B. N.: Characteristics of aerosol types from AERONET sunphotometer measurements, Atmos. Environ., 44, 3110–3117, 2010.
Levy, R. C., Leptoukh, G. G., Kahn, R., Zubko, V., Gopalan, A., and Remer, L. A.: A critical look at deriving monthly aerosol optical depth from satellite data, IEEE T. Geosci. Remote, 47, 2942–2956, https://doi.org/10.1109/TGRS.2009.2013842, 25, 2009.
Li, J., Carlson, B. E., Dubovik, O., and Lacis, A. A.: Recent trends in aerosol optical properties derived from AERONET measurements, Atmos. Chem. Phys., 14, 12271–12289, https://doi.org/10.5194/acp-14-12271-2014, 2014.
Logothetis, S.-A., Salamalikis, V., and Kazantzidis, A.: Aerosol classification in Europe, Middle East, North Africa and Arabian Peninsula based on AERONET Version 3, Atmos. Res., 239, 104893, https://doi.org/10.1016/j.atmosres.2020.104893, 2020.
Logothetis, S.-A., Salamalikis, V., and Kazantzidis, A.: The impact of different aerosol properties and types on direct aerosol radiative forcing and efficiency using AERONET version 3, Atmos. Res., 250, 105343, https://doi.org/10.1016/j.atmosres.2020.105343, 2021.
Mahowald, N., Albani, S., Kok, J. F., Engelstaeder, S., Scanza, R., Ward, D. S., and Flanner, M. G.: The size distribution of desert dust aerosols and its impact on the Earth system, Aeolian Res., 15, 53–71, https://doi.org/10.1016/j.aeolia.2013.09.002, 2014.
Mielonen, T., Arola, A., Komppula, M., Kukkonen, J., Koskinen, J., de Leeuw, G., and Lehtinen, K.: Comparison of CALIOP level 2 aerosol subtypes to aerosol types derived from AERONET inversion data, Geophys. Res. Lett., 36, L18804, https://doi.org/10.1029/2009gl039609, 2009.
Mona, L., Amodeo, A., Pandolfi, M., and Pappalardo, G.: Saharan dust intrusions in the Mediterranean area: Three years of Raman lidar measurements, J. Geophys. Res., 111, D16203, https://doi.org/10.1029/2005JD006569, 2006.
Mona, L., Liu, Z., Müller, D., Omar, A., Papayannis, A., Pappalardo, G., Sugimoto, N., and Vaughan, M.: Lidar Measurements for Desert Dust Characterization: An Overview, Adv. Meteorol., 2012, 356265, https://doi.org/10.1155/2012/356265, 2012.
Nabat, P., Somot, S., Mallet, M., Chiapello, I., Morcrette, J. J., Solmon, F., Szopa, S., Dulac, F., Collins, W., Ghan, S., Horowitz, L. W., Lamarque, J. F., Lee, Y. H., Naik, V., Nagashima, T., Shindell, D., and Skeie, R.: A 4-D climatology (1979–2009) of the monthly tropospheric aerosol optical depth distribution over the Mediterranean region from a comparative evaluation and blending of remote sensing and model products, Atmos. Meas. Tech., 6, 1287–1314, https://doi.org/10.5194/amt-6-1287-2013, 2013.
Ningombam, S. S., Larson, E. J. L., Dumka, U. C., Estellés, V., Campanelli, M., and Steve, C.: Long-term (1995–2018) aerosol optical depth derived using ground based AERONET and SKYNET measurements from aerosol aged-background sites, Atmos. Pollut. Res., 1, 608–620, https://doi.org/10.1016/j.apr.2018.10.008, 2019.
Notaro, M., Yu, Y., and Kalashnikova, O. V.: Regime shift in Arabian dust activity, triggered by persistent Fertile Crescent drought, J. Geophys. Res.-Atmos., 120, 10229–10249, https://doi.org/10.1002/2015JD023855, 2015.
O'Neill, N. T., Ignatov, A., Holben, B. N., and Eck, T. F.: The lognormal distribution as a reference for reporting aerosol optical depth statistics; Empirical tests using multi-year, multi-site AERONET Sunphotometer data, Geophys. Res. Lett., 27, 3333–3336, https://doi.org/10.1029/2000GL011581, 2000.
O'Neill, N. T., Dubovik, O., and Eck, T. F.: Modified Ångström coefficient for the characterization of sub-micrometer aerosols, Appl. Optics, 40, 2368–2375, https://doi.org/10.1364/AO.40.002368, 2001.
O'Neill, N. T., Eck, T. F., Smirnov, A., Holben, B. N., and Thulasiraman, S.: Spectral discrimination of coarse and fine mode optical depth, J. Geophys. Res., 108, 4559–4573, https://doi.org/10.1029/2002JD002975, 2003.
Pan, B., Wang, Y., Hu, J., Lin, Y., Hsieh, J.-S., Logan, T., Feng, X., Jiang, J. H., Yung, Y. L., and Zhang, R.: Impacts of Saharan Dust on Atlantic Regional Climate and Implications for Tropical Cyclones, J. Climate, 31, 7621–7644, https://doi.org/10.1175/jcli-d-16-0776.1, 2018.
Pandey, S. K., Vinoj, V., Landu, K., and Babu, S. S.: Declining pre-monsoon dust loading over South Asia: Signature of a changing regional climate, Sci. Rep., 7, 1–10, https://doi.org/10.1038/s41598-017-16338-w, 2017.
Papadimas, C. D., Hatzianastassiou, N., Mihalopoulos, N., Querol, X., and Vardavas, I.: Spatial and temporal variability in aerosol properties over the Mediterranean basin based on 6-year (2000–2006) MODIS data, J. Geophys. Res., 113, D11205, https://doi.org/10.1029/2007JD009189, 2008.
Papayannis, A., Amiridis, V., Mona, L., Tsaknakis, G., Balis, D., Bösenberg, J., Chaikovski, A., De Tomasi, F., Grigorov, I., Mattis,I., Mitev, V., Muller, D., Nickovic, S., Pérez, C., Pietruczuk, A., Pisani, G., Ravetta, F., Rizi, V., Sicard, M., Trickl, T., Wiegner, M., Gerding, M., Mamouri, R. E., D'Amico, G., and Pappalardo, G.: Systematic lidar observations of Saharan dust over Europe in the frame of EARLINET (2000–2002), J. Geophys. Res., 113, D10204, https://doi.org/10.1029/2007JD009028, 2008.
Peyridieu, S., Chédin, A., Capelle, V., Tsamalis, C., Pierangelo, C., Armante, R., Crevoisier, C., Crépeau, L., Siméon, M., Ducos, F., and Scott, N. A.: Characterisation of dust aerosols in the infrared from IASI and comparison with PARASOL, MODIS, MISR, CALIOP, and AERONET observations, Atmos. Chem. Phys., 13, 6065–6082, https://doi.org/10.5194/acp-13-6065-2013, 2013.
Pozzer, A., de Meij, A., Yoon, J., Tost, H., Georgoulias, A. K., and Astitha, M.: AOD trends during 2001–2010 from observations and model simulations, Atmos. Chem. Phys., 15, 5521–5535, https://doi.org/10.5194/acp-15-5521-2015, 2015.
Proestakis, E., Amiridis, V., Marinou, E., Georgoulias, A. K., Solomos, S., Kazadzis, S., Chimot, J., Che, H., Alexandri, G., Binietoglou, I., Daskalopoulou, V., Kourtidis, K. A., de Leeuw, G., and van der A, R. J.: Nine-year spatial and temporal evolution of desert dust aerosols over South and East Asia as revealed by CALIOP, Atmos. Chem. Phys., 18, 1337–1362, https://doi.org/10.5194/acp-18-1337-2018, 2018.
Prospero, J. M., Ginoux, P., Torres, O., Nicholson, S. E., and Gill, T. E.: Environmental characterization of global sources of atmospheric soil dust identified with the Nimbus 7 Total Ozone Mapping Spectrometer (TOMS) absorbing aerosol product, Rev. Geophys., 40, 2-1–2-31, https://doi.org/10.1029/2000RG000095, 2002.
Prospero, J. M. and Lamb, P. J.: African Droughts and Dust Transport to the Caribbean: Climate Change Implications, Science, 302, 1024–1027, https://doi.org/10.1126/science.1089915, 2003.
Prospero, J. M. and Mayol-Bracero, O. L.: Understanding the transport and impact of African dust on the Caribbean Basin, Bull. Am. Meteorol. Soc., 94, 1329–1337, https://doi.org/10.1175/BAMS-D-12-00142.1, 2013.
Prospero, J. M., Collard, F. X., Molinie, J., and Jeannot, A.: Characterizing the annual cycle of African dust transport to the Caribbean Basin and South America and its impact on the environment and air quality, Global Biogeochem. Cy., 28, 757–773, https://doi.org/10.1002/2013gb004802, 2014.
Rajot, J. L., Formenti, P., Alfaro, S., Desboeufs, K., Chevaillier, S., Chatenet, B., Gaudichet, A., Journet, E., Marticorena, B., Triquet, S., Maman, A., Mouget, N., and Zakou, A.: AMMA dust experiment: An overview of measurements performed during the dry season special observation period (SOP0) at the Banizoumbou (Niger) supersite, J. Geophys. Res.-Atmos., 113, D00C14, https://doi.org/10.1029/2008JD009906, 2008.
Rashki, A., Kaskaoutis, D. G., Francois, P., Kosmopoulos, P. G., and Legrand, M.: Dust-storm dynamics over Sistan region, Iran: Seasonality, transport characteristics and affected areas, Aeolian Res., 16, 35–48, https://doi.org/10.1016/j.aeolia.2014.10.003, 2015.
Remer, L. A., Kleidman, R. G., Levy, R. C., Kaufman, Y. J., Tanré, D., Mattoo, S., Martins, J. V., Ichoku, C., Koren, I., Yu, H., and Holben, B. N.: Global aerosol climatology from the MODIS satellite sensors, J. Geophys. Res.-Atmos., 113, d14S07, https://doi.org/10.1029/2007JD009661, 2008.
Saidou Chaibou, A. A., Ma, X., and Sha, T.: Dust radiative forcing and its impact on surface energy budget over West Africa, Sci. Rep., 10, 1–18, https://doi.org/10.1038/s41598-020-69223-4, 2020.
Sayer, A. M. and Knobelspiesse, K. D.: How should we aggregate data? Methods accounting for the numerical distributions, with an assessment of aerosol optical depth, Atmos. Chem. Phys., 19, 15023–15048, https://doi.org/10.5194/acp-19-15023-2019, 2019.
Schepanski, K., Tegen, I., and Macke, A.: Comparison of satellite based observations of Saharan dust source areas, Remote Sens. Environ., 123, 90–97, 2012.
Schepanski, K.: Transport of mineral dust and its impact on climate, Geosciences, 8, 151, https://doi.org/10.3390/geosciences8050151, 2018.
Shi, L., Zhang, J., Yao, F., Zhang, D., and Guo, H.: Drivers to dust emissions over dust belt from 1980 to 2018 and their variation in two global warming phases, Sci. Total Environ., 767, 144860, https://doi.org/10.1016/j.scitotenv.2020.144860, 2021.
Shikwambana, L. and Sivakumar, V.: Global distribution of aerosol optical depth in 2015 using CALIPSO level 3 data, J. Atmos. Sol.-Terr. Phy., 173, 150–159, https://doi.org/10.1016/j.jastp.2018.04.003, 2018.
Song, Q., Zhang, Z., Yu, H., Ginoux, P., and Shen, J.: Global dust optical depth climatology derived from CALIOP and MODIS aerosol retrievals on decadal timescales: regional and interannual variability, Atmos. Chem. Phys., 21, 13369–13395, https://doi.org/10.5194/acp-21-13369-2021, 2021
Textor, C., Schulz, M., Guibert, S., Kinne, S., Balkanski, Y., Bauer, S., Berntsen, T., Berglen, T., Boucher, O., Chin, M., Dentener, F., Diehl, T., Easter, R., Feichter, H., Fillmore, D., Ghan, S., Ginoux, P., Gong, S., Grini, A., Hendricks, J., Horowitz, L., Huang, P., Isaksen, I., Iversen, I., Kloster, S., Koch, D., Kirkevåg, A., Kristjansson, J. E., Krol, M., Lauer, A., Lamarque, J. F., Liu, X., Montanaro, V., Myhre, G., Penner, J., Pitari, G., Reddy, S., Seland, Ø., Stier, P., Takemura, T., and Tie, X.: Analysis and quantification of the diversities of aerosol life cycles within AeroCom, Atmos. Chem. Phys., 6, 1777–1813, https://doi.org/10.5194/acp-6-1777-2006, 2006.
Todd, M. C., Washington, R., Martins, J. V., Dubovik, O., Lizcano, G., M'Bainayel, S., and Engelstaedter, S.: Mineral dust emission from the Bodélé Depression nothern Chad, during BoDEx 2005, J. Geophys. Res.-Atmos., 112, 1–12, https://doi.org/10.1029/2006JD007170, 2007.
Torres, O., Bhartia, P. K., Herman, J. R., Sinyuk, A., Ginoux, P., and Holben, B.: A long-term record of aerosol optical depth from TOMS observations and comparison to AERONET measurements, J. Atmos. Sci., 59, 398–413, https://doi.org/10.1175/1520-0469(2002)059<0398:ALTROA>2.0.CO;2, 2002.
Tsamalis, C., Chédin, A., Pelon, J., and Capelle, V.: The seasonal vertical distribution of the Saharan Air Layer and its modulation by the wind, Atmos. Chem. Phys., 13, 11235–11257, https://doi.org/10.5194/acp-13-11235-2013, 2013.
van der Does, M., Knippertz, P., Zschenderlein, P., Harrison, R. G., and Stuut, J. B. W.: The mysterious long-range transport of giant mineral dust particles, Sci. Adv., 4, eaau2768, https://doi.org/10.1126/sciadv.aau2768, 2018.
Voss, K. K. and Evan, A. T.: A new satellite-based global climatology of dust aerosol optical depth, J. Appl. Meteorol. Climatol., 59, 83–120, https://doi.org/10.1175/jamc-d-19-0194.1, 2020.
Washington, R., Todd, M.C., Engelstaedter, S., Mbainayel, S., and Mitchell, F.: Dust and the low-level circulation over the Bodélé Depression, Chad: Observations from BoDEx 2005, J. Geophys. Res.-Atmos., 111, 1–15, https://doi.org/10.1029/2005JD006502, 2006.
Weatherhead, E. C., Reinsel, G. C., Tiao, G. C., Meng, X.-L., Choi, D., Cheang, W.-K., Keller, T., DeLuisi, J., Wuebbles, D. J., Kerr, J. B., Miller, A. J., Oltmans, S. J., and Frederick, J. E.: Factors affecting the detection of trends: Statistical considerations and applications to environmental data, J. Geophys. Res., 103, 17149–17161, https://doi.org/10.1029/98JD00995,1998.
Wei, J., Peng, Y., Mahmood, R., Sun, L., and Guo, J.: Intercomparison in spatial distributions and temporal trends derived from multi-source satellite aerosol products, Atmos. Chem. Phys., 19, 7183–7207, https://doi.org/10.5194/acp-19-7183-2019, 2019.
Wei, J., Li, Z., Peng, Y., and Sun, L.: MODIS Collection 6.1 aerosol optical depth products over land and ocean: validation and comparison, Atmos. Environ., 201, 428–440, 2019b.
Xi, X. and Sokolik, I. N.: Dust interannual variability and trend in Central Asia from 2000 to 2014 and their climatic linkages, J. Geophys. Res., 120, 12175–12197, https://doi.org/10.1002/2015JD024092, 2015.
Xian, P., Klotzbach, P. J., Dunion, J. P., Janiga, M. A., Reid, J. S., Colarco, P. R., and Kipling, Z.: Revisiting the relationship between Atlantic dust and tropical cyclone activity using aerosol optical depth reanalyses: 2003–2018, Atmos. Chem. Phys., 20, 15357–15378, https://doi.org/10.5194/acp-20-15357-2020, 2020.
Yoon, J., Burrows, J. P., Vountas, M., von Hoyningen-Huene, W., Chang, D. Y., Richter, A., and Hilboll, A.: Changes in atmospheric aerosol loading retrieved from space-based measurements during the past decade, Atmos. Chem. Phys., 14, 6881–6902, https://doi.org/10.5194/acp-14-6881-2014, 2014.
Yu, Y., Notaro, M., Liu, Z., Wang, F., Alkolibi, F., Fadda, E., and Bakhrjy, F.: Climatic controls on the interannual to decadal variability in Saudi Arabian dust activity: Toward the development of a seasonal dust prediction model, J. Geophys. Res.-Atmos., 120, 1739–1758, https://doi.org/10.1002/2014JD022611, 2015.
Yu, H., Tan, Q., Chin, M., Remer, L. A., Kahn, R. A., Bian, H., Kim, D., Zhang, Z., Yuan, T., Omar, A. H., Winker, D. M., Levy, R. C., Kalashnikova, O., Crepeau, L., Capelle, V., and Chedin, A.: Estimates of African dust deposition along the trans-Atlantic transit using the decade-long record of aerosol measurements from CALIOP, MODIS, MISR, and IASI, J. Geophys. Res.-Atmos., 124, 7975–7996, https://doi.org/10.1029/2019JD030574, 2019.
Zender, C. S., Miller, R., and Tegen, I.: Quantifying mineral dust mass budgets: Terminology, constraints, and current estimates, Eos Trans. Amer. Geophys. Union, 85, 509–512, https://doi.org/10.1029/2004EO480002, 2004.
Zhang, J. and Reid, J. S.: A decadal regional and global trend analysis of the aerosol optical depth using a data-assimilation grade over-water MODIS and Level 2 MISR aerosol products, Atmos. Chem. Phys., 10, 10949–10963, https://doi.org/10.5194/acp-10-10949-2010, 2010.
Zhang, M., Wang, Y., Ma, Y., Wang, L., Gong, W., and Liu, B.: Spatial distribution and temporal variation of aerosol optical depth and radiative effect in South China and its adjacent area, Atmos. Environ., 188, 120–128, https://doi.org/10.1016/j.atmosenv.2018.06.028, 2018.
Zheng, C., Zhao, C., Zhu, Y., Wang, Y., Shi, X., Wu, X., Chen, T., Wu, F., and Qiu, Y.: Analysis of influential factors for the relationship between PM2.5 and AOD in Beijing, Atmos. Chem. Phys., 17, 13473–13489, https://doi.org/10.5194/acp-17-13473-2017, 2017.
Zhao, B., Jiang, J. H., Gu, Y., Diner, D., Worden, J., Liou, K. N., Su, H., Xing, J., Garay, M., and Huang, L.: Decadal-scale trends in regional aerosol particle properties and their linkage to emission changes, Environ. Res. Lett, 12, 054021, https://doi.org/10.1088/1748-9326/aa6cb2, 2017.