the Creative Commons Attribution 4.0 License.
the Creative Commons Attribution 4.0 License.
 | 08 Nov 2021
Disentangling different moisture transport pathways over the eastern subtropical North Atlantic using multi-platform isotope observations and high-resolution numerical modelling
Fabienne Dahinden
Franziska Aemisegger
Heini Wernli
Matthias Schneider
Christopher J. Diekmann
Benjamin Ertl
Peter Knippertz
Martin Werner
Stephan Pfahl
Due to its dryness, the subtropical free troposphere plays a critical role in the radiative balance of the Earth's climate system. But the complex interactions of the dynamical and physical processes controlling the variability in the moisture budget of this sensitive region of the subtropical atmosphere are still not fully understood. Stable water isotopes can provide important information about several of the latter processes, namely subsidence drying, turbulent mixing, and dry and moist convective moistening. In this study, we use high-resolution simulations of the isotope-enabled version of the regional weather and climate prediction model of the Consortium for Small-Scale Modelling (COSMOiso) to investigate predominant moisture transport pathways in the Canary Islands region in the eastern subtropical North Atlantic. Comparison of the simulated isotope signals with multi-platform isotope observations (aircraft, ground- and space-based remote sensing) from a field campaign in summer 2013 shows that COSMOiso can reproduce the observed variability of stable water vapour isotopes on timescales of hours to days, thus allowing us to study the mechanisms that control the subtropical free-tropospheric humidity. Changes in isotopic signals along backward trajectories from the Canary Islands region reveal the physical processes behind the synoptic-scale isotope variability. We identify four predominant moisture transport pathways of mid-tropospheric air, each with distinct isotopic signatures:
-
air parcels originating from the convective boundary layer of the Saharan heat low (SHL) – these are characterised by a homogeneous isotopic composition with a particularly high δD (median mid-tropospheric ), which results from dry convective mixing of low-level moisture of diverse origin advected into the SHL;
-
air parcels originating from the free troposphere above the SHL – although experiencing the largest changes in humidity and δD during their subsidence over West Africa, these air parcels typically have lower δD values (median ) than air parcels originating from the boundary layer of the SHL;
-
air parcels originating from outside the SHL region, typically descending from tropical upper levels south of the SHL, which are often affected by moist convective injections from mesoscale convective systems in the Sahel – their isotopic composition is much less enriched in heavy isotopes (median ) than those from the SHL region;
-
air parcels subsiding from the upper-level extratropical North Atlantic – this pathway leads to the driest and most depleted conditions (median ) in the middle troposphere near the Canary Islands.
The alternation of these transport pathways explains the observed high variability in humidity and δD on synoptic timescales to a large degree. We further show that the four different transport pathways are related to specific large-scale flow conditions. In particular, distinct differences in the location of the North African mid-level anticyclone and of extratropical Rossby wave patterns occur between the four transport pathways. Overall, this study demonstrates that the adopted Lagrangian isotope perspective enhances our understanding of air mass transport and mixing and offers a sound interpretation of the free-tropospheric variability of specific humidity and isotope composition on timescales of hours to days in contrasting atmospheric conditions over the eastern subtropical North Atlantic.
- Article
(11355 KB) - Full-text XML
- BibTeX
- EndNote


Understanding the subtropical atmospheric water cycle is of particular importance, since the free-tropospheric humidity and low-level cloud cover over the subtropical oceans strongly affect the global radiative balance via the greenhouse (Held and Soden, 2000; Schmidt et al., 2010) and albedo (Bony and Dufresne, 2005; Stephens, 2005) effects. The dryness of the free troposphere is primarily linked to the adiabatic descent of dehydrated air from the outflow of the Hadley circulation (Sun and Lindzen, 1993; Frankenberg et al., 2009) and the isentropic transport of very dry air by midlatitude eddies (Galewsky et al., 2005; Cau et al., 2007). Moistening of the subtropical free-tropospheric air results from several processes including large-scale transport from the tropics (Pierrehumbert and Roca, 1998; Couhert et al., 2010; Knippertz et al., 2013), detrainment of condensate from convective clouds and its subsequent evaporation (Sun and Lindzen, 1993; Risi et al., 2008, 2010a), and vertical mixing associated with convection (Yang and Pierrehumbert, 1994; Lee et al., 2011; Brown et al., 2013). In addition, moisture export from the African continent over the subtropical North Atlantic has been observed in summer (González et al., 2016; Lacour et al., 2017).
In summer, a near-surface thermal low-pressure system establishes itself over the Sahara, referred to as the Saharan heat low (SHL). The SHL is an important synoptic-scale weather system over West Africa (Lavaysse et al., 2010a, b) and notably a key element of the West African Monsoon system (Sultan and Janicot, 2003; Messager et al., 2010; Fink et al., 2017). Moreover, the SHL strongly influences the transport of air from north-western Africa over the adjacent subtropical North Atlantic (Lacour et al., 2017). The low-level cyclonic circulation of the SHL strengthens the south-westerly monsoon flow and the north-easterly Harmattan flow, which results in an enhanced near-surface convergence along the so-called Intertropical Discontinuity. The Intertropical Discontinuity describes a sharp air mass boundary at about 20∘ N that is characterised by large contrasts in humidity, temperature, and vertical stability (Fink et al., 2017). Dry convective mixing north of the Intertropical Discontinuity leads to the formation of a deep well-mixed boundary layer during the day and an anticyclonic circulation aloft (from about 700 hPa), which plays an essential role in the maintenance of the African easterly jet south of the SHL (Thorncroft and Blackburn, 1999) and in the transport of continental mid-tropospheric air over the eastern subtropical North Atlantic. In this study, we aim to further disentangle the complex interplay between dehydrating and moistening processes that control the subtropical free-tropospheric moisture budget in the Canary Islands region, which is considered to be representative of the eastern subtropical North Atlantic. In particular, we seek to assess the importance of the SHL dynamics for moistening the free troposphere. To this end we use multi-platform observations and regional simulations of stable water isotopes in atmospheric water vapour.
Stable water isotopes have proven to be highly useful to investigate the physical mechanisms involved in the atmospheric water cycle (Dansgaard, 1964; Gat, 1996; Galewsky et al., 2016). These natural tracers of water phase changes capture the moist diabatic history experienced by air parcels. Additionally, due to the distinct fingerprints of air masses with different origin, the isotopic composition of water vapour can provide information about atmospheric processes that do not involve phase changes, for instance, turbulent mixing or large-scale water vapour transport. The stable water isotope composition of a water sample is usually quantified by the δ notation (Craig, 1961): ), where R is the molecular ratio of the concentration of HD16O to the concentration of H216O and a stochastic isotope distribution across individual isotopologues is assumed. The δ notation expresses the relative deviation of R from the internationally accepted primary water isotope standard, that is, the Vienna standard mean ocean water (VSMOW2; IAEA, 2017).
With recent technical advances in measuring water vapour isotope compositions in situ and with remote sensing, new possibilities emerged for investigating governing processes of the atmospheric water cycle. Near-surface in situ measurements offer continuous records of the isotopic composition of the near-surface water vapour at high temporal resolution, thereby allowing, for instance, detailed analyses of surface evaporation processes (e.g. Aemisegger et al., 2014; Thurnherr et al., 2020). Airborne laser spectrometric measurements provide highly resolved in situ profiles of the water vapour isotopic composition during field campaigns and are particularly beneficial to study small-scale processes such as cloud formation or air mass mixing (e.g. Dyroff et al., 2015; Sodemann et al., 2017). In addition, ground-based (Schneider et al., 2012) and satellite-based (Worden et al., 2006; Frankenberg et al., 2009; Schneider and Hase, 2011; Lacour et al., 2012; Diekmann et al., 2021b) remote sensing systems enable observations of water vapour isotopes in the free troposphere on a quasi-global scale, which may document the influence of large-scale water vapour transport (e.g. Schneider et al., 2016; Lacour et al., 2017). As the various isotope measurement methods have complementary characteristics, e.g. in terms of temporal and spatial resolution, a combination of several observational datasets provides an excellent opportunity to enhance our understanding of the mechanisms controlling tropospheric humidity.
Previous studies have demonstrated the potential of water vapour isotope observations to identify governing processes that affect the moisture budget in the subtropical troposphere such as evaporation from oceans (Steen-Larsen et al., 2014; Benetti et al., 2014; Bonne et al., 2019), local mixing between the marine boundary layer and the free troposphere (Noone et al., 2011; Noone, 2012; Bailey et al., 2013; Benetti et al., 2015, 2018; Galewsky, 2018a, b), and large-scale dynamics (Galewsky and Hurley, 2010; Risi et al., 2010b; González et al., 2016; Schneider et al., 2016; Lacour et al., 2017; Aemisegger et al., 2021). Detrainment of moisture from the marine boundary layer to the subtropical free troposphere has been attributed to turbulent mixing and shallow convection (Bailey et al., 2013). But moisture detrainment from the marine boundary layer is strongly limited by the temperature inversion and primarily affects the moisture budget in the lower troposphere at the local scale (Galewsky, 2018a, b). Therefore, mid-tropospheric moisture is mainly influenced by large-scale transport of different air masses that experience isentropic and cross-isentropic mixing (Galewsky et al., 2007; Noone et al., 2011; González et al., 2016; Schneider et al., 2016; Lacour et al., 2017). Based on isotope observations, it could be shown that variations in the mid-tropospheric moisture and isotope composition over the eastern subtropical North Atlantic are linked to the alternating transport of dry, low-δD air from the upper-level extratropical North Atlantic and moist, high-δD air from North Africa (González et al., 2016; Schneider et al., 2016; Lacour et al., 2017). In addition, it was found that the transport from Africa has a strong seasonal cycle with a clear maximum in summer, which is closely related to the activity of the SHL (Lacour et al., 2017). Even though different components of the subtropical free-tropospheric water cycle could be identified so far with the help of isotope observations, the attribution of observed isotope signals to individual meteorological processes remains challenging. Due to the complex nature of the involved dynamical and physical processes, numerical models are essential for a more detailed interpretation of the isotope observations and to fully exploit their potential.
Stable water isotope physics has been implemented in several global (e.g. Risi et al., 2010c; Werner et al., 2011) and regional atmosphere circulation models (e.g. Pfahl et al., 2012). These Eulerian models include a detailed representation of relevant processes of the atmospheric moisture cycle and provide the full four-dimensional isotope fields. Isotope-enabled global circulation models have a relatively coarse spatial resolution and are thus suited for investigating long-term isotopic signals, e.g. in paleoclimate archives. For more detailed, process-related studies of synoptic-scale variability, isotope-enabled regional circulation models are better suited (e.g. Sturm et al., 2005; Yoshimura et al., 2010; Pfahl et al., 2012). Pfahl et al. (2012) incorporated isotopes into the regional weather and climate prediction model COSMO (Steppeler et al., 2003; Baldauf et al., 2011) with an advanced microphysical scheme and non-hydrostatic dynamics. Several case studies have demonstrated that COSMOiso simulates isotope variability at high spatial and temporal resolution well and is thus suitable for investigating the governing mechanisms of the atmospheric water cycle ranging from small-scale microphysical processes to synoptic-scale weather (Pfahl et al., 2012; Aemisegger et al., 2015; Dütsch et al., 2016, 2018; Christner et al., 2018; Diekmann et al., 2021a).
In this study, we use dedicated high-resolution COSMOiso simulations in order to assess the dynamical and physical processes behind the hourly to daily variations in the mid-tropospheric isotope composition in the Canary Islands region and to determine the connection of this isotope variability to moisture transport from different regions. The isotope simulation is complemented by kinematic backward trajectories computed from three-dimensional COSMOiso wind fields. Using trajectories allows us to assess whether the observed contrasting isotope signals are related to transport from the North Atlantic vs. North Africa and more specifically from the SHL. The combination of the isotope-enabled model COSMOiso with the Lagrangian diagnostics and the multi-platform water vapour isotope observations provides a solid framework to analyse and explain the observed atmospheric isotope signals. In turn, the high-resolution isotope observations allow a robust evaluation of physical processes in the model, which are difficult to constrain by measurements of specific humidity alone. This study aims to (1) validate a COSMOiso simulation with explicit moist convection against multi-platform observations of stable isotopes in water vapour, (2) identify predominant moisture transport pathways in the free troposphere in the Canary Islands region and investigate the associated synoptic-scale flow patterns and the physical processes that shape the observed isotope signals, and (3) quantify the climatological importance of the identified transport pathways. The paper is structured as follows: an overview of different water vapour isotope observations used in this study as well as a description of the COSMOiso model is given in Sect. 2. The results are presented and discussed in Sects. 3 (COSMOiso validation) and 4 (analysis of transport pathways). Finally, a concluding summary of the main results is provided in Sect. 5.
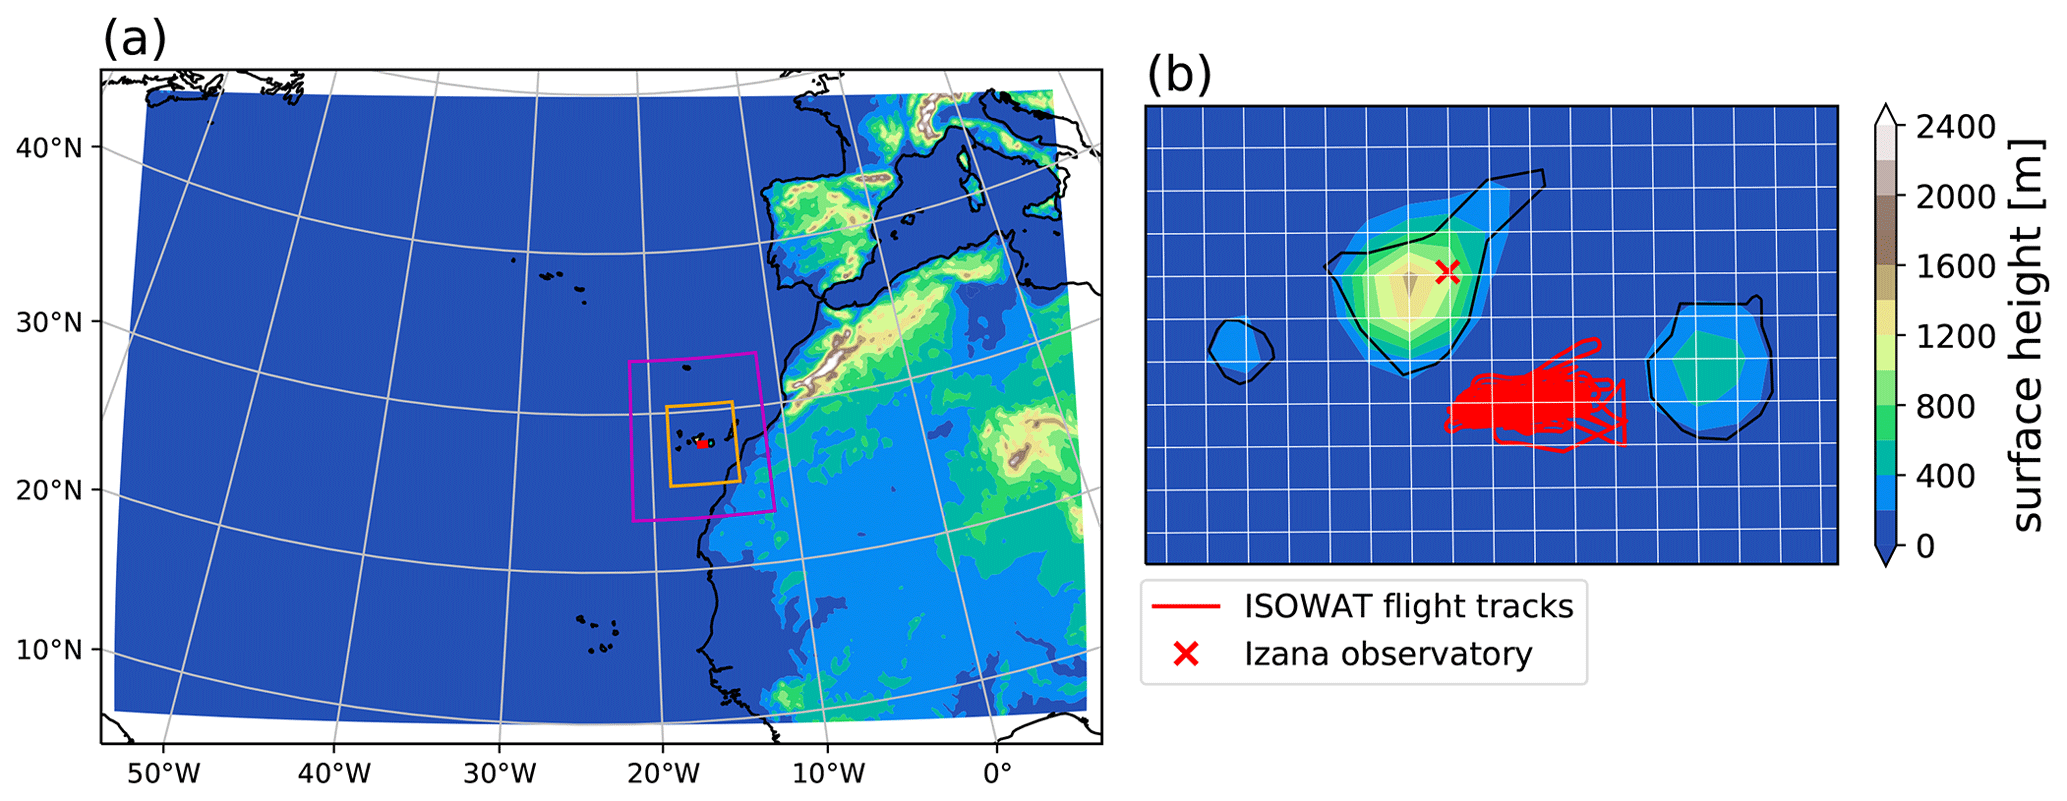
Figure 1(a) COSMOiso model domain and topography. The orange box indicates the sampling area for the uncertainty estimation used for the comparison between COSMOiso and airborne in situ water vapour isotope data. The magenta box represents the sampling area of the satellite-based IASI remote sensing observations of stable isotopes in water vapour. (b) Enlarged view of the Canary Islands. The red lines depict the flight tracks of the summer 2013 MUSICA aircraft campaign and the red cross shows the location of the Izaña observatory on Tenerife, where the Fourier transform infrared (FTIR) spectrometer is installed for the ground-based remote sensing. The white lines represent the COSMOiso grid with a horizontal resolution of 0.125∘ (∼14 km).
2.1 Observations of water vapour isotopes
We use airborne in situ measurements as well as ground- and space-based remote sensing observations of tropospheric water vapour isotopes from the project MUSICA (MUlti-platform remote Sensing of Isotopologues for investigating the Cycle of Atmospheric water). This combination of multi-platform observations allows a comprehensive model validation, since the different isotope measurement methods are sensitive to different vertical, horizontal, and temporal scales. Dyroff et al. (2015) and Schneider et al. (2016) gave a detailed overview of the campaign and the measurements.
2.1.1 Airborne in situ measurements
The airborne in situ measurements are performed with the ISOWAT II tuneable diode laser spectrometer (Dyroff et al., 2015) during the 7 d MUSICA aircraft campaign in July and August 2013. The instrument has been specifically designed for measuring specific humidity qv and δD in water vapour by means of laser absorption spectroscopy aboard research aircraft. Vertical profiles of qv and δD in water vapour are measured between sea level and around 7 km altitude in the Canary Islands region (Fig. 1). The temporal resolution of the measurements is 1 s, corresponding to a horizontal resolution of about 80 m and a vertical resolution of about 3 m. For the comparison with COSMOiso, we average the ISOWAT measurements every minute, which results in a horizontal and vertical resolution of about 5 km and 180 m, respectively. The high temporal and spatial resolution of the laser spectroscopic measurements enables an accurate sampling of the isotopic composition in water vapour and is thus suitable for the validation and investigation of small-scale processes. However, since the data are only available for a few flight days in a limited area, it is less appropriate to study large-scale water vapour transport pathways.
The uncertainty of the ISOWAT δD measurements depends on the absolute humidity and is around 10 ‰ for most conditions during the campaign. For very dry conditions, as encountered in the arid upper troposphere, the uncertainty is higher and can exceed 34 ‰ for water vapour mixing ratios below 500 ppmv (corresponding to a specific humidity of 0.31 g kg−1). The uncertainty estimates are based on calibration measurements performed before and after each flight and additionally validated by in-flight calibrations at varying altitudes. More details about the calibration methods and the campaign in general can be found in Dyroff et al. (2015).
In order to compare the COSMOiso simulation with the airborne in situ measurements, hourly COSMOiso fields of qv and δD in water vapour are temporally and spatially interpolated along the flight track. In addition, we sample minimum and maximum values in a horizontal box around each point along the flight tracks, which reflects the synoptic-scale variability (Fig. 1). This uncertainty measure accounts for the heterogeneous meteorological conditions and large gradients that often occurred during the flights (see Dyroff et al., 2015, for details) and indicates whether discrepancies between measurements and COSMOiso can be partially explained by small shifts of the simulated gradients.
2.1.2 Ground-based remote sensing observations
Ground-based remote sensing observations can deliver continuous observations of the isotopic composition of the free-tropospheric water vapour at a specific location. The observational data used in this study are generated from the Fourier transform infrared (FTIR) system located at the Izaña observatory (2370 m a.s.l.) on Tenerife (Fig. 1b), which is part of the Network for the Detection of Atmospheric Composition Change (NDACC). The FTIR spectrometer records high-resolution solar absorption spectra allowing the retrieval of volume mixing ratios of H216O, H218O and HD16O by using the NDACC MUSICA retrieval processor (Barthlott et al., 2017). The MUSICA NDACC FTIR retrievals (for brevity denoted as FTIR retrievals in the following) are empirically validated against in situ measurements made by the aircraft ISOWAT instrument and by two commercial Picarro laser spectrometers installed at two different sites on Tenerife (Izaña, 2370 m a.s.l. and Teide, 3550 m a.s.l.; Schneider et al., 2015). This quality assessment guarantees a robust estimate of random and systematic errors, which for qv amount to 2 % and 10 %, respectively, and for δD to 25 ‰ and 150 ‰. While random errors are dominated by uncertainties in the atmospheric temperature profiles and artefacts in the spectral baseline, systematic errors are attributed to uncertainties in the spectroscopic parameters. A comprehensive description of the MUSICA NDACC FTIR remote sensing retrieval method and error estimation was presented in Schneider et al. (2012) and Barthlott et al. (2017).
Two different data types of FTIR observations are available (Barthlott et al., 2017). The first type, the so-called type 1 product, is the direct retrieval output and offers best estimates of qv in the lower, middle, and upper troposphere. These data are used for validating qv simulated in COSMOiso. The second type, the type 2 product, is the a posteriori processed retrieval output. It reports the best estimation of {qv,δD} pairs and provides profiles of the isotopic composition of water vapour for the lower and middle troposphere. The a posteriori correction ensures that the qv and δD products represent the same atmospheric air mass by adjusting the much finer vertical resolution of the derived qv profile to the vertical resolution of the δD profile. In addition, the correction minimises cross-dependencies of retrieved δD concentrations on actual atmospheric qv concentrations. We use this data product for the comparison of either δD values or {qv,δD}-pair distributions from COSMOiso with FTIR data.
The remote sensing water vapour isotope concentrations are not representative of a single altitude but rather reflect the atmospheric situation averaged over a vertical layer. The smoothing of the real atmospheric profile by the remote sensing measurement process is described by the averaging kernel. Figure 2 shows a typical averaging kernel of an a posteriori corrected δD retrieval at 4.9 km a.s.l., which indicates that the retrieved δD value at 4.9 km mostly reflects atmospheric δD concentrations between 3 and 7 km. The averaging kernel matrix A is an important output of the retrieval and specifies the response of the retrieved concentration profile to variations in the real atmospheric concentration profile x:
where xa is an a priori atmospheric concentration profile towards which the retrieval is constrained. The atmospheric concentration profiles are vectors with 3×23 entries specifying the three isotope species concentrations at 23 altitude levels between the surface altitude at the Izaña Observatory (2.37 km a.s.l.) and 55.3 km a.s.l. (what is used as top of the atmosphere in the FTIR retrieval).
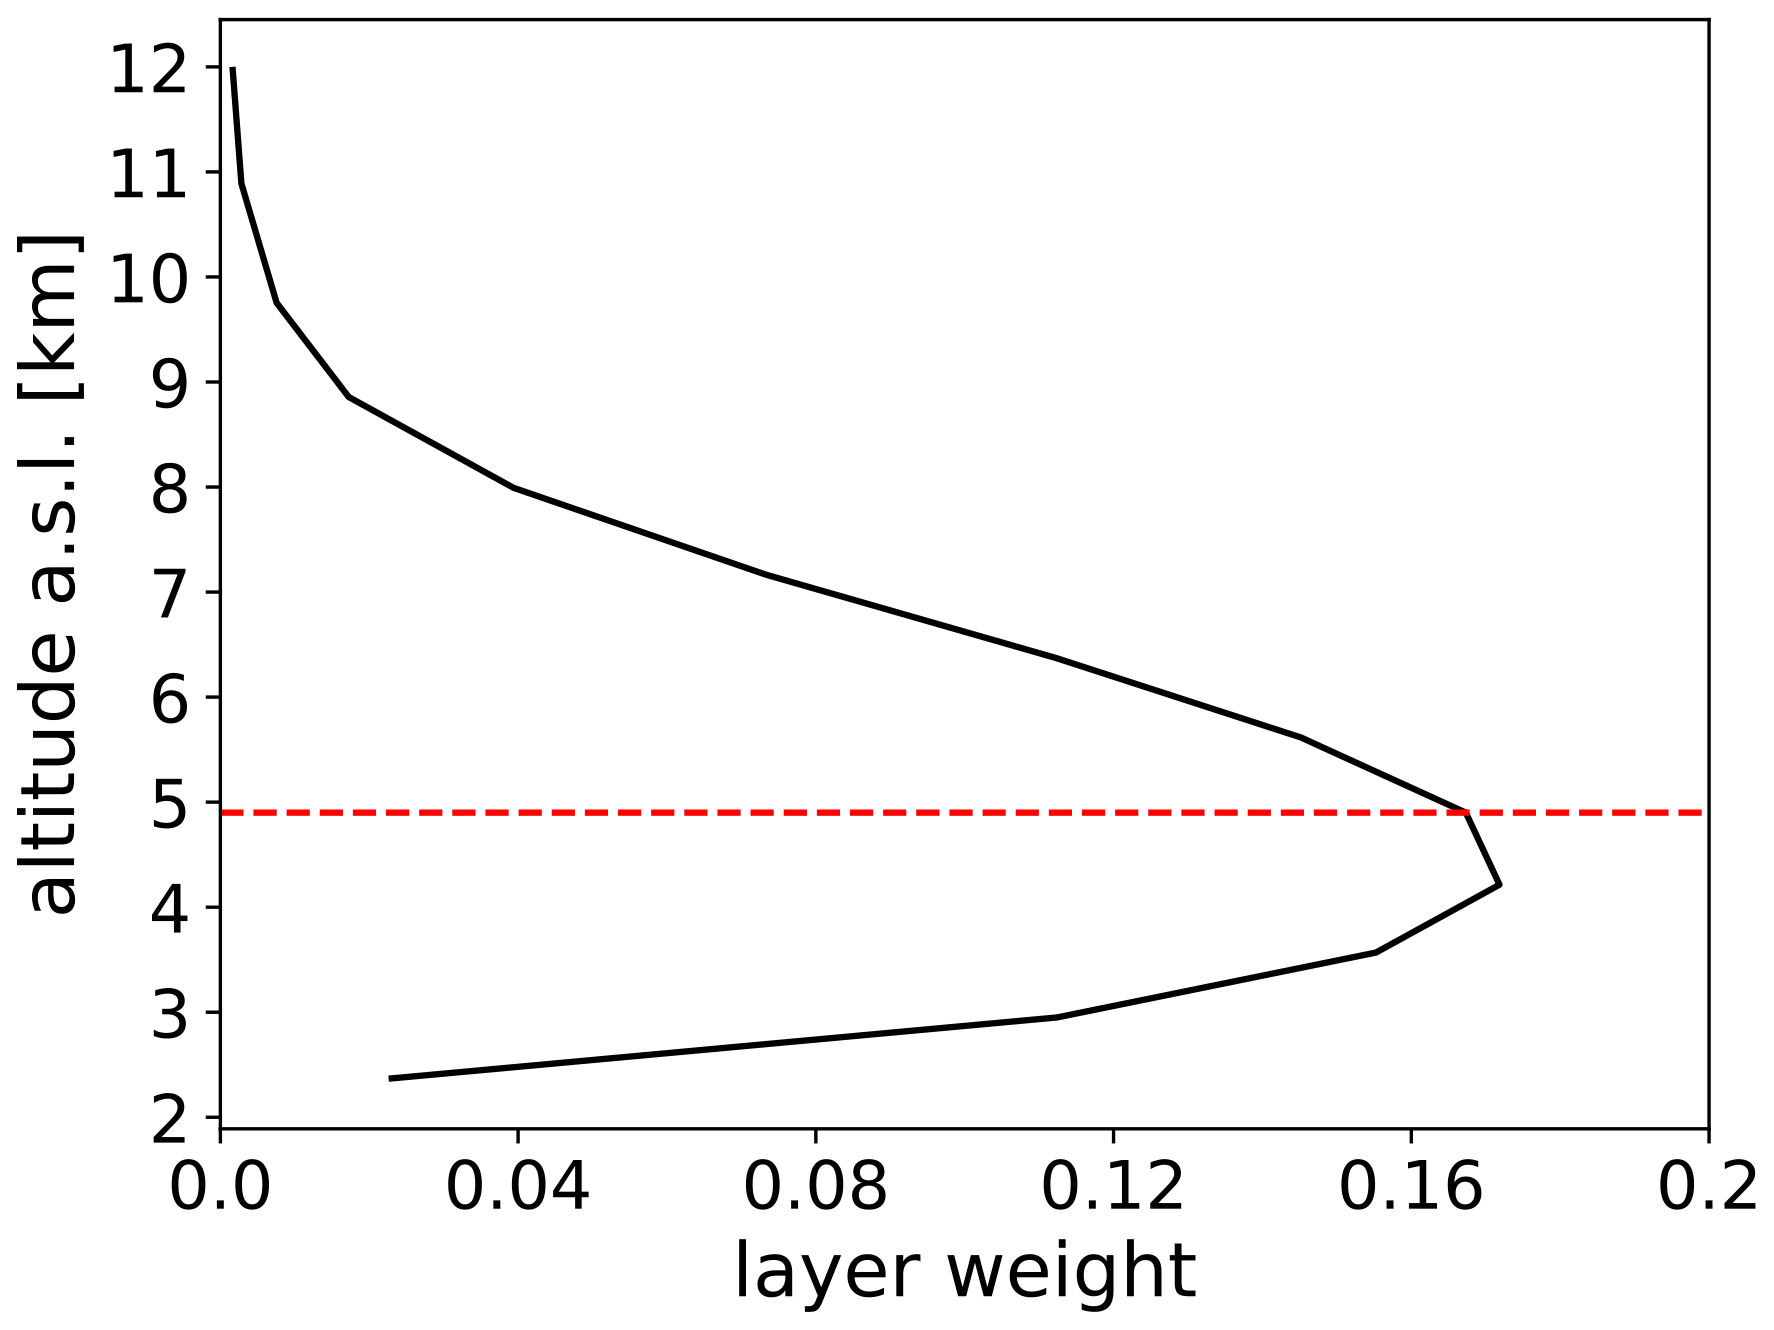
Figure 2Averaging kernel of the a posteriori corrected δD proxy state retrieved at 12:06 UTC 26 July 2013 from the ground-based Fourier transform infrared (FTIR) spectra at Izaña for the 4.9 km retrieval level (red line).
In order to quantitatively compare COSMOiso data with FTIR observations, the hourly COSMOiso output needs to be processed such that it has the same characteristics as the remote sensing products. Convolving the modelled water vapour isotope concentration profile at a specific grid point xCOSMO with the averaging kernel matrix from the FTIR retrieval yields a water vapour isotope concentration profile as would have been observed by an FTIR system in the atmosphere simulated by COSMOiso:
where , xCOSMO, and xa are vectors with the three isotope species concentrations specified at the 17 lowest FTIR levels. Vertical levels above the model top at 23.6 km are truncated.
In this study, we compare water vapour isotope concentrations retrieved at 4.9 km altitude, which corresponds to the FTIR retrieval level with the highest sensitivity. Moreover, we consider only observations retrieved around midday with solar zenith angles smaller than 30∘. Morning and evening retrievals have much broader averaging kernels; i.e. the vertical sensitivity is reduced. The small zenith angles of the considered retrievals further imply that the distance between the FTIR measurement site and the point of atmospheric observation at 4.9 km is much smaller than the horizontal grid spacing in COSMOiso. We therefore take the COSMOiso water vapour isotope profile at the grid point closest to the FTIR station for the comparison with the remote sensing observations (Fig. 1b). The eight neighbouring grid points are used to estimate the spatial variability of COSMOiso, which is defined by the minimum and maximum δD and qv values of the post-processed COSMOiso water vapour isotope profiles. Finally, since the remote sensing retrieval processes only spectra measured in 100 % cloud-free conditions, we checked the cloud area fraction output from the model at all times when FTIR observations were available and found full consistency between the model and the observations.
2.1.3 Space-based remote sensing observations
In addition to the ground-based FTIR observations, isotope observations are retrieved by the MUSICA IASI processor using the spectral radiances measured by the Infrared Atmospheric Sounding Interferometer (IASI) onboard the polar orbiting satellites Metop-A and Metop-B. The IASI sensor measures the thermal infrared emission of the Earth's surface and the emission and absorption in the atmosphere with a high horizontal resolution of 12 km at nadir with a global coverage twice per day. The high-quality IASI spectra allow a simultaneous and combined optimal estimation of the volume mixing ratios of H216O and HD16O as well as of the ratio product δD in the free troposphere by considering the MUSICA IASI retrieval procedure of Schneider and Hase (2011) and including the retrieval updates as described in Schneider et al. (2021). Analogous to the ground-based data, an additional post-processing step creates the optimal estimation {qv,δD}-pair product (type 2 product, see Sect. 2.1.2). This product has its maximum sensitivity at a height of approximately 4.2 km. The typical uncertainties are around 5 %–10 % for qv and 10‰–30‰ for δD (Diekmann et al., 2021b). The MUSICA IASI retrieval product is only available for cloud-free conditions.
Similar to the ground-based FTIR observations, an averaging kernel is applied to COSMOiso output for the comparison of simulated data with IASI observations. The original IASI retrieval simulator by Schneider at al. (2017) uses a very simple radiative transfer model. Recently, the retrieval simulator has been improved and now uses the full radiative transfer code from the MUSICA IASI retrieval processor. Since the MUSICA IASI retrievals provide results only for cloud-free scenes, a statistical cross-comparison of the MUSICA IASI dataset to COSMOiso simulations requires an analogous cloud filtering for the model data. For this purpose, we only consider model data where the vertically integrated cloud water content qc and cloud ice content qi are zero. As these two conditions refer to grid-scale clouds, we remove sub-grid cloud fractions using the total cloud cover diagnostic (). Afterwards, we multiply the COSMOiso water vapour isotope concentration profile with the simulated kernels, create the {qv,δD}-pair product, and obtain a water vapour isotope concentration profile as would have been observed by IASI in the atmosphere simulated by COSMOiso. These steps include an additional quality filtering according to the properties of the simulated averaging kernels, similar to the quality filtering of the MUSICA IASI {qv,δD}-pair data (discussed in Diekmann et al., 2021b). In its most recent version, the retrieval simulator achieves a correlation of more than 95 % between simulated and actual MUSICA IASI averaging kernels (compare this to Fig. 5 in Schneider et al., 2017). The MUSICA IASI retrieval simulator is described in more detail in Diekmann (2021).
The processed COSMOiso water vapour isotope profiles are directly compared to the IASI observations. Specifically, we evaluate COSMOiso isotope concentrations retrieved at 4.2 km altitude in a box (corresponding to approximately 106 km2) centred around Tenerife against IASI observations from the same retrieval altitude and sampling region. The statistical comparison of this large number of independent observations (18 063 IASI retrievals) enables a robust model validation and, in turn, a detailed interpretation of space-based remote sensing observations of stable isotopes in water vapour.
2.2 COSMOiso
The limited-area model COSMOiso (Pfahl et al., 2012) is an isotope-enabled version of the non-hydrostatic numerical weather and climate prediction model COSMO (Steppeler et al., 2003). The isotope implementation incorporates two parallel, purely diagnostic water cycles for the heavy water isotopes H218O and HD16O, which experience exactly the same physical processes as H216O except for fractionation during phase changes. The prognostic isotope multilayer soil model TERRAiso couples the isotope content of the soil to COSMOiso (Dütsch, 2016; Christner et al., 2018), thereby accounting for fractionation during soil evaporation. Plant transpiration is treated as non-fractionating and transmits the isotope signals of the contributing soil layers according to the vegetation's rooting depths.
The COSMOiso simulation used in this study extends from 1 July to 31 August 2013. This time period includes the summer 2013 MUSICA campaign (see Sect. 2.1). The model domain was chosen such that it covers large parts of the North Atlantic, West Africa, and parts of the Mediterranean (Fig. 1a). With this large domain we intend to encompass all relevant source regions of moisture for the SHL, which can be convectively lifted into the Saharan air layer. The simulation is performed with explicit convection at a horizontal grid spacing of 0.125∘ (in rotated coordinates, corresponding to approximately 14 km) and with 60 hybrid levels in the vertical. Marsham et al. (2013b), Pearson et al. (2014), and Pante and Knippertz (2019) showed that explicit convection leads to a more realistic representation of the West African Monsoon already with a relatively coarse model resolution on the order of 10 km. Initial and lateral boundary conditions are provided every 6 h by the isotope-enabled global climate model ECHAM5-wiso (Werner et al., 2011) at a spectral resolution of T106 (corresponding to a horizontal grid spacing of approximately 1∘) and on 31 vertical levels. In order to keep the long simulation close to reality, horizontal winds in COSMOiso at 850 hPa and above are spectrally nudged towards ECHAM5-wiso. The nudging is performed at every time step (60 s) and operates at zonal and meridional wavenumbers of five and less. All other COSMOiso fields run freely in the model domain. The spectral nudging technique at small wavenumbers forces the large-scale flow in the limited-area model towards the large-scale flow in the global climate model without directly affecting small-scale weather features (von Storch et al., 2000; Schubert-Frisius et al., 2017). The ECHAM5-wiso, in turn, was nudged towards the ERA-Interim reanalysis dataset from the European Centre for Medium Range Weather Forecasts (Dee et al., 2011). The ECHAM5-wiso nudging also includes temperature and surface pressure.
2.3 Identification of the Saharan heat low
To identify the SHL location from the COSMOiso simulation output, we use the methodology proposed by Lavaysse et al. (2009). The heat low detection criterion relies on the cumulative probability distribution of low-level atmospheric thickness between 700 and 925 hPa at 06:00 UTC over West Africa. A high percentile of this variable is used as a threshold to define the area of the SHL. Unlike Lavaysse et al. (2009), we always average the thickness values over 2 d before computing the cumulative probability distribution in order to have a smoother transition of the SHL location between 2 consecutive days. Moreover, in contrast to Lavaysse et al. (2009), we use the 80th percentile instead of the 90th percentile since the COSMOiso domain is smaller than the area used by Lavaysse et al. (2009), which extends about 20∘ further east and 5∘ further south. Comparing the identified SHLs in COSMOiso and ERA-Interim, the latter calculated from the 90th percentile in the larger domain, confirms that our chosen threshold leads to a realistic identification in terms of location and spatial extent. The SHL masks used in this study only contain grid points over continental Africa; i.e. points over the adjacent subtropical North Atlantic are not considered. Finally, only SHL features with a circumference larger than 1000 km are considered in order to avoid a fragmented structure of the SHL, which could occur due to the high spatial resolution of COSMOiso. The top of the SHL is defined by the planetary boundary layer height as diagnosed in COSMOiso with a bulk Richardson number criterion.
2.4 Lagrangian methods
For the interpretation of observed and simulated water vapour isotope signals, we use kinematic backward trajectories computed from three-dimensional hourly COSMOiso wind fields with the Lagrangian analysis tool LAGRANTO (Wernli and Davies, 1997; Sprenger and Wernli, 2015). The trajectories start every hour and from every 20 hPa between 300 and 900 hPa above Tenerife (28.30∘ N, 16.48∘ W). They are calculated 10 d backward in time or until they leave the model domain. Different COSMOiso variables such as δD, qv, qi, qc, rain water qr, snow water qs, surface precipitation, and boundary layer height are interpolated along each trajectory and stored together with the trajectory position every hour. In addition, we attribute each trajectory to one of four predominant transport pathways, which we define as follows for this study: (1) North African air originating from the convective boundary layer of the SHL (hereafter referred to as SHL BL); (2) North African air coming from the free troposphere above the SHL (SHL FT); (3) North African air from outside the SHL region (typically descending from tropical upper levels south of the SHL; TRP AFR); and (4) North Atlantic air (typically subsiding from the upper-level extratropical North Atlantic; NA). We attribute a trajectory to the SHL BL regime if the air parcel was at least at one time step in the convective boundary layer of the SHL during its travel; to the SHL FT regime if the air parcel was at least at one time step above but never in the boundary layer of the SHL during its travel over the SHL; to the TRP AFR regime if the air parcel was at least once above continental Africa but never in or above the SHL; and to the NA transport pathway if the air parcel was never above continental Africa. We will investigate whether these four transport pathways have a distinct isotopic signature and lead to contrasting atmospheric conditions on timescales of hours to days in the Canary Islands region.
We validate the different transport pathways in COSMOiso by comparing trajectories calculated with winds from COSMOiso and 6-hourly ERA-Interim fields. The ERA-Interim trajectories start every hour from the same starting positions as the COSMOiso trajectories and run 10 d backward in time. The validation criterion is based on comparing the origin of the COSMOiso trajectories with the origin of the ERA-Interim trajectories, which are regarded as “truth”. We distinguish between trajectories from continental Africa and trajectories from the North Atlantic. For each arrival time and vertical level of the trajectory starting profile, trajectories arriving within a 6 h interval centred at the considered arrival time are compared. A 6 h time window for the comparison is chosen to achieve a more robust validation. If at least four of the seven COSMOiso trajectories in the considered time window and at the specific vertical level agree with the corresponding ERA-Interim trajectories about the origin (continental Africa vs. North Atlantic), the transport in COSMOiso is considered “reliable” at the respective trajectory arrival time and vertical level.
For the comparison between COSMOiso and ground-based FTIR remote sensing observations, we regard a specific observation time as reliable if at least 75 % of the levels between 400–700 hPa (representative of the 4.9 km FTIR retrieval level) are associated with a reliable transport according to the aforementioned evaluation criterion.
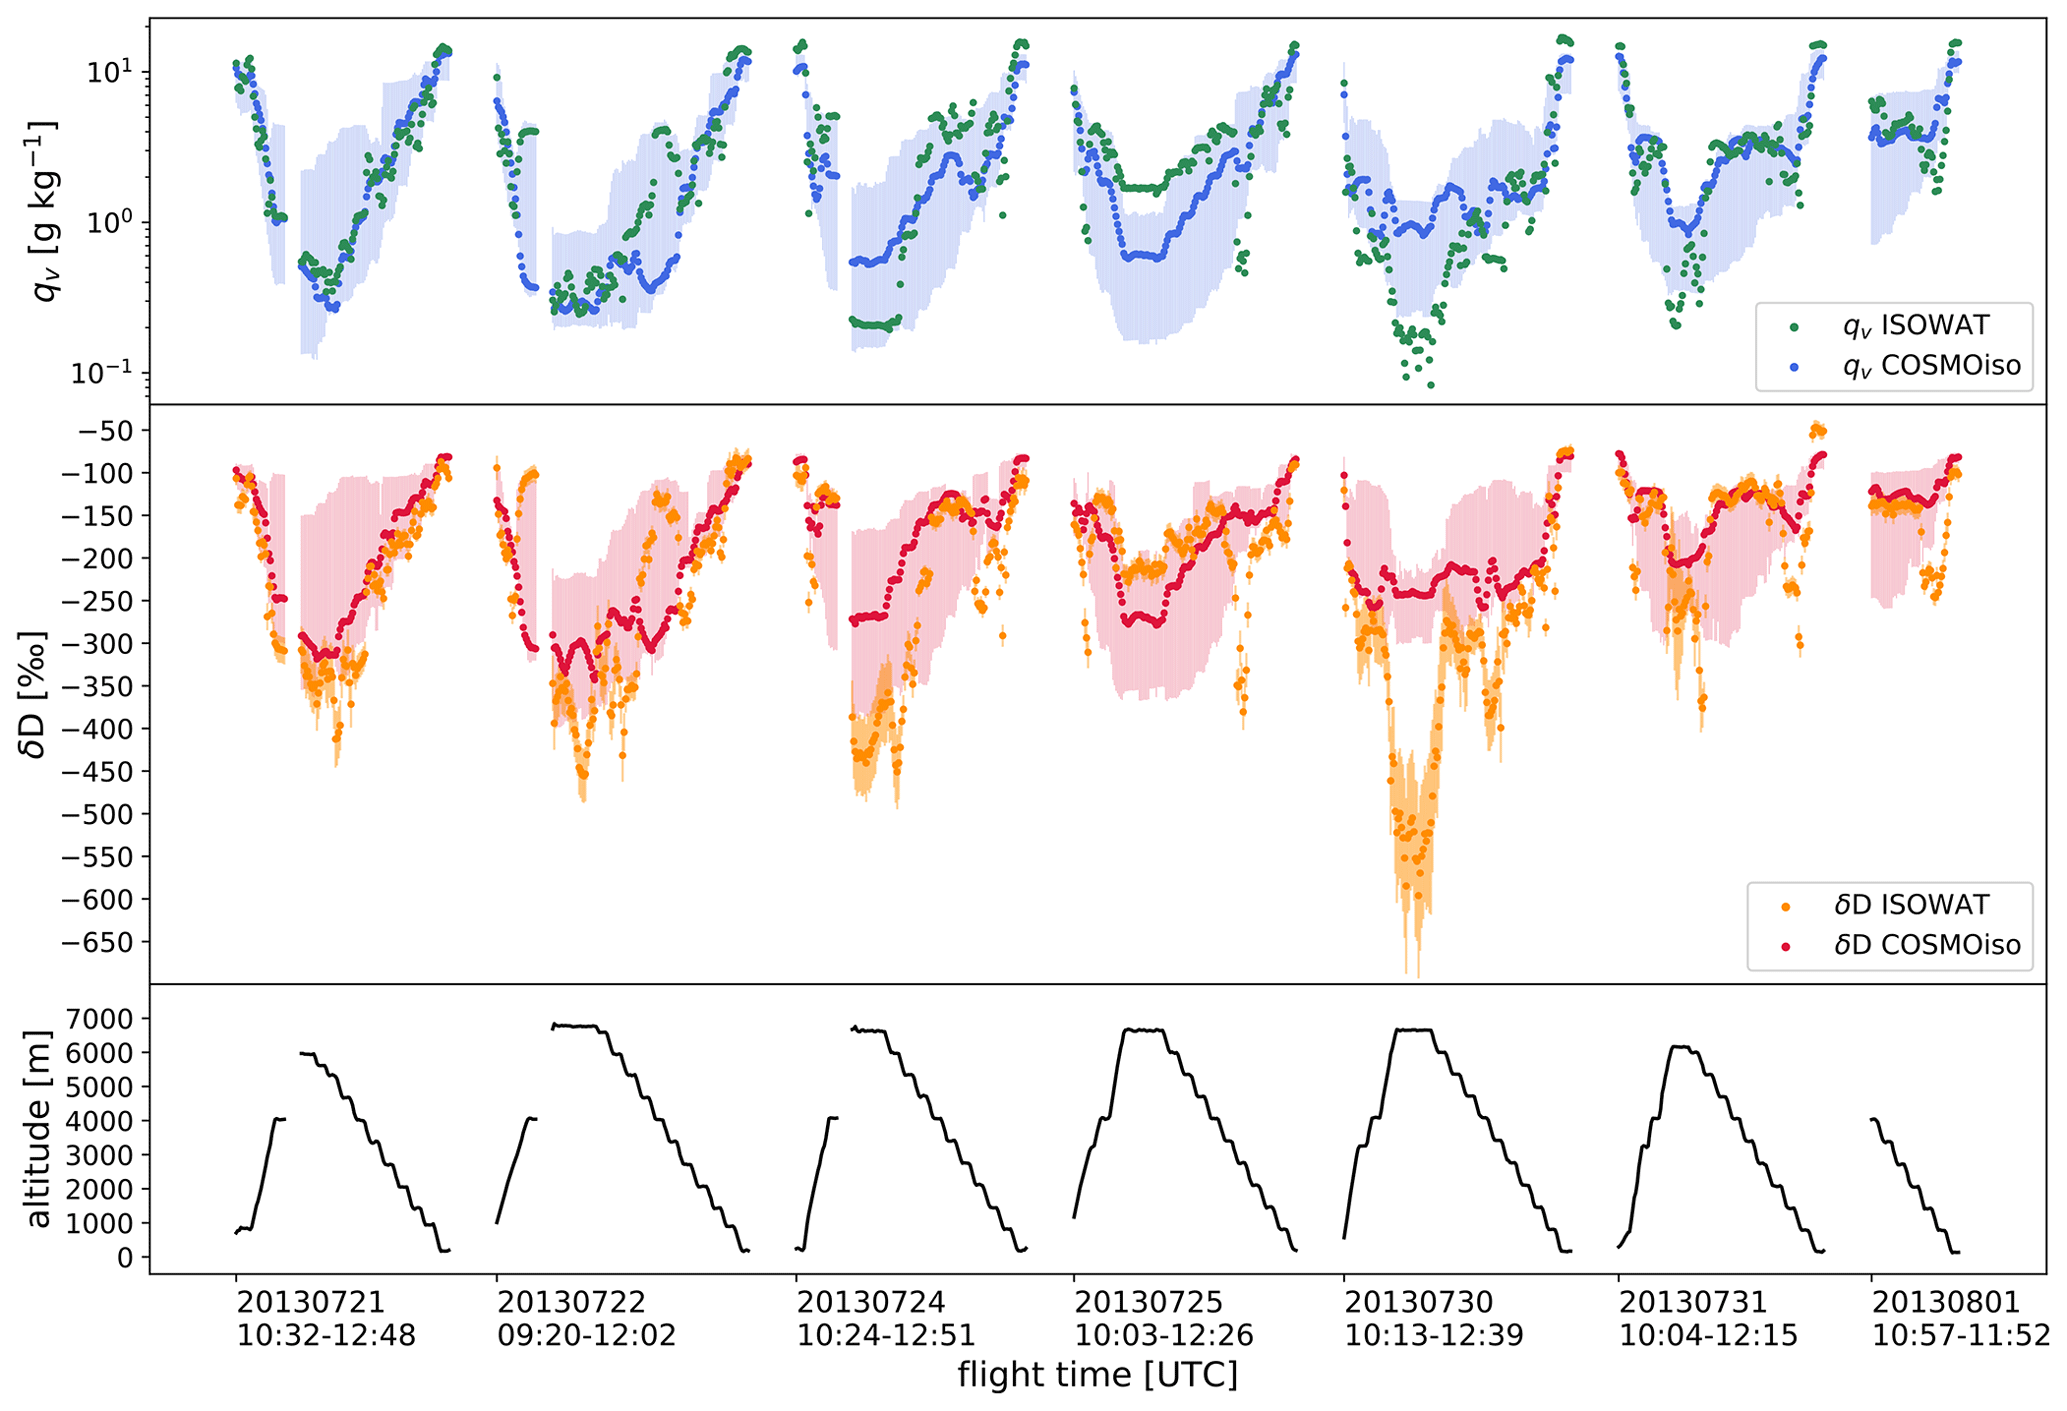
Figure 3Comparison of COSMOiso and airborne in situ measurements (ISOWAT) of qv and δD in water vapour from the MUSICA campaign in July and August 2013. The blue and red shadings represent the synoptic-scale variability of qv and δD in COSMOiso by quantifying the minimum and maximum values sampled in a box around each data point on the flight path (see Sect. 2.1.1). The orange shading indicates the ISOWAT measurement uncertainty of δD.
In this section, we compare the 2-month COSMOiso simulation of July and August 2013 (Sect. 2.2) to multi-platform water vapour isotope observations (Sect. 2.1) in order to quantitatively evaluate the performance of COSMOiso in modelling the free-tropospheric variability of humidity and isotopic composition on timescales of hours to days in contrasting atmospheric conditions over the eastern subtropical North Atlantic. To this end, we first compare COSMOiso qv and δD in water vapour against airborne in situ observations (Sect. 2.1.1). Given its high temporal and spatial resolution, this dataset is beneficial to accurately evaluate the vertical distribution of water vapour isotopes in COSMOiso. The availability of the data, however, is restricted to a few flights. Therefore, we further compare mid-tropospheric qv and δD signals in COSMOiso with ground- and space-based remote sensing observations (Sects. 2.1.2 and 2.1.3) over the entire 2-month period. The continuous availability of remote sensing observations enables a statistically robust validation of the free-tropospheric isotope composition in COSMOiso.
3.1 Airborne in situ measurements
Figure 3 shows the comparison of COSMOiso qv and δD in water vapour with the aircraft observations. The flights were characterised by a fast ascent up to 7 km altitude followed by a slow step-wise descent. They covered an area of about 50 km in the zonal and 25 km in the meridional direction over the ocean south of Tenerife (Fig. 1b). Each of the seven flights was performed in the morning during 1 to 2.5 h, yielding a total flight time of about 14 h. The vertical airborne profiles reveal large variability in humidity and isotopic composition. Specifically, the measured qv and δD values range from 0.08 to 17 g kg−1 and from −590 ‰ to −50 ‰ along the flight paths with fast variations. COSMOiso reasonably captures this observed variability that is mostly associated with the vertical gradient in qv and δD. While modelled and observed qv and δD values agree well in the lower troposphere (mean absolute differences at 0–2 km a.s.l.: , ΔδD (0–2 km)=38 ‰), differences occur for both variables in the middle and upper troposphere (, ΔδD (2–7 km)=71 ‰) and are largest around 6 km a.s.l. (, ). At this altitude, qv and δD tend to be too high in COSMOiso compared to the measurements. These differences can be partly explained by synoptic-scale uncertainties in COSMOiso associated with the very heterogeneous meteorological conditions that occurred during the flights (see Dyroff et al., 2015). Considering the synoptic-scale variability of qv and δD in COSMOiso in the Canary Islands region by sampling minimum and maximum values in a horizontal box around each data point along the flight path (red and blue shading in Fig. 3) reveals that the differences are mostly not significant, except for 30 July. On this day, aircraft measurements show very strong spatial gradients in qv and δD around 5.5 km altitude, which are not represented in COSMOiso in the considered box. In general, however, COSMOiso is able to capture the observed vertical humidity and isotope profiles in the middle to upper troposphere, albeit with some horizontal displacements.
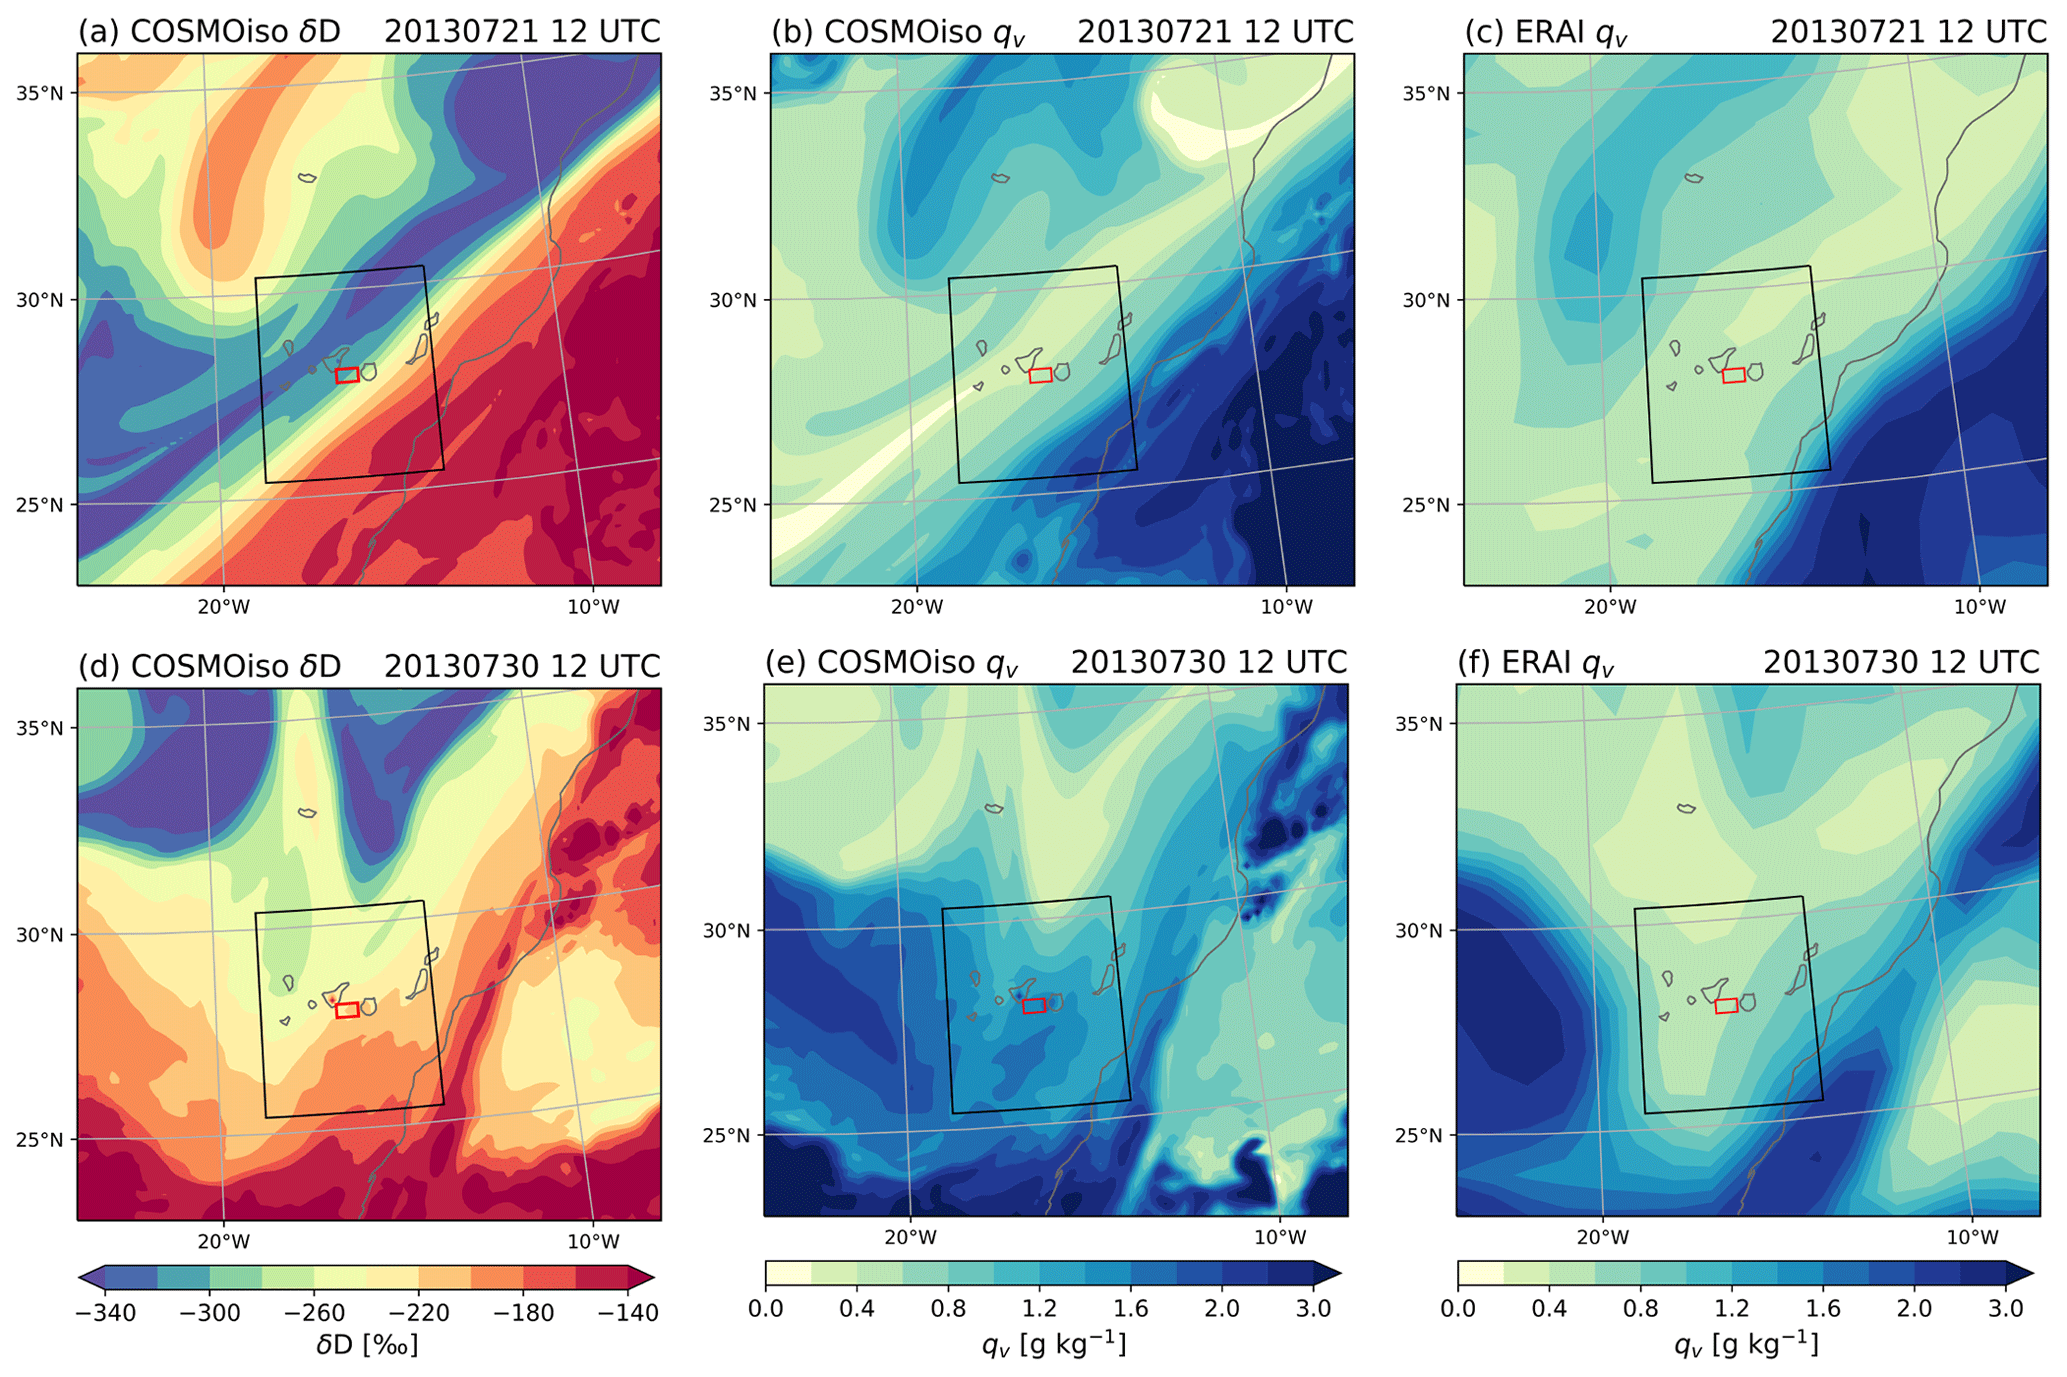
Figure 4COSMOiso and ERA-Interim moisture fields at 500 hPa at 12:00 UTC 21 July (a–c) and at 12:00 UTC 30 July (d–f) 2013. Panels (a, d) show COSMOiso δD in water vapour, (b, e) show COSMOiso qv, and (c, f) show ERA-Interim qv. The red box represents the flight area during the aircraft campaign and the black box the sampling area to estimate the COSMOiso synoptic-scale variability (see Sect. 2.1.1).
The strong horizontal gradients in qv and δD at 500 hPa (Fig. 4a and b) highlight the very heterogenous conditions in the Canary Islands region (black box in Fig. 4) at 12:00 UTC 21 July 2013, which is representative of all flight days apart from 30 July. Slight spatial shifts of these gradients can lead to a rather different isotope and humidity signal in the area of the flight tracks (red box in Fig. 4). The comparison of qv at 500 hPa between COSMOiso and ERA-Interim (Fig. 4c) confirms that COSMOiso overall correctly simulates the large-scale distribution of the free-tropospheric moisture. Still, we can observe a north-westward shift of the frontal zone towards the Canaries in COSMOiso compared to ERA-Interim, where the front is located farther to the south-east along the African west coast. Due to the low spatial resolution of ERA-Interim, however, it is not clear how accurately ERA-Interim represents this frontal situation. Figure 4e and f reveal why the quantified synoptic uncertainty in COSMOiso does not reduce the differences between the modelled and observed qv and δD values on 30 July 2013. On this day, COSMOiso is far too moist in the Canary Islands region compared to ERA-Interim and consequently also too enriched in heavy isotopes. (In the following, for reasons of readability, we will only use the term “enriched” when referring to “enriched in heavy isotopes” and will proceed analogously for “depleted”.) Analysis of backward trajectories calculated from COSMOiso and ERA-Interim fields (see Fig. A1) reveal that the overestimated qv and δD values in the model most likely result from a moistening of the air parcels by deep convection over tropical West Africa about 5 d prior to arrival over the Canaries and again near the African coast 2 d prior to arrival. In addition, we have to consider that the very sharp vertical humidity gradients measured by the ISOWAT spectrometer (Fig. 9 in Dyroff et al., 2015) cannot be fully resolved by COSMOiso with a vertical resolution of about 400 m in the middle troposphere. The lower spatial and temporal resolution of the COSMOiso output fields compared to the airborne in situ measurements in general constitutes a source of uncertainty for the validation of modelled qv and δD.

Figure 5Comparison of COSMOiso qv and δD in water vapour with multi-platform observations over the subtropical North Atlantic near Tenerife: (a–c) comparison with airborne in situ ISOWAT measurements performed between sea level and 7 km altitude during 7 flight days in July and August 2013, (d–f) comparison with satellite-based IASI remote sensing observations retrieved for 4.2 km in a box centred around Tenerife during 32 d July and August 2013, and (g–i) comparison with ground-based FTIR remote sensing observations retrieved for 4.9 km during 25 d in July and August 2013. Solid and dashed contours in (d–f) show the 50 % and 90 % frequency isolines of normalised two-dimensional histograms. Empty circles in (g–i) indicate a less reliable air parcel transport (see Sect. 2.4). The black box in (b) represents the δD space of (e, h).
Figure 5a displays the aircraft observations and the corresponding COSMOiso data in the {qv,δD} space. Both distributions have a very similar slope but the COSMOiso distribution covers a much narrower δD range and tends to be too enriched compared to the airborne data. Positive δD differences are present throughout the atmospheric column but most pronounced at low qv and δD values (Fig. 5a and b). The qv range covered by COSMOiso is comparable to the aircraft data and there is no clear tendency towards positive or negative differences from aircraft observations, except for the humid bias in COSMOiso at low qv (Fig. 5c). The representativeness of this model–aircraft comparison, however, is limited, since the data are not fully independent but comprise correlated observations from vertical qv and δD profiles that were performed on 7 specific campaign days.
3.2 Space-based and ground-based remote sensing observations
In this section, we first compare satellite-based IASI observations with post-processed COSMOiso data that have the same vertical characteristics as the IASI water vapour isotope product (Sect. 2.1.3). The datasets consist of 18 063 IASI and 141 703 COSMOiso samples that were retrieved at 4.2 km altitude in a box centred around Tenerife (Fig. 1a) in July and August 2013. This large number of observational and model data enables a statistically robust model validation. Figure 5d shows the {qv,δD}-pair distributions of COSMOiso and IASI. The distributions overlap to a great extent and cover ranges of qv from 0.4 g kg−1 to 5 g kg−1 and of δD from −360 ‰ to −130 ‰. The slope of the COSMOiso {qv,δD} distribution is somewhat less steep than the slope of the IASI distribution, yielding a positive qv model bias for high δD values () and a negative qv model bias for low δD values () compared to IASI. Comparing the COSMOiso and IASI δD distributions confirms the high consistency between the model and observations (Fig. 5e). Only a slightly negative model bias can be observed for higher δD values (). Similarly, the comparison of the COSMOiso and IASI qv distributions underlines the good agreement in the middle troposphere in spite of small differences in the range of the highest and lowest qv values. Attributing the source of the qv and δD differences in COSMOiso is difficult owing to the complex characteristic of the remote sensing retrievals and the post-processed COSMOiso data. Synoptic-scale uncertainties in the model, as discussed in the context of the aircraft observations in Sect. 3.1, constitute a minor source of the observed qv and δD differences due to the large data sampling area.
The {qv,δD}-pair distributions of the ground-based FTIR remote sensing observations (Fig. 5g; type 2 product; see Sect. 2.1.2) and the corresponding COSMOiso data multiplied with the FTIR kernels (see Sect. 2.1.2) are similar to the distributions shown for the COSMOiso–IASI comparison (Fig. 5d). They cover a similar {qv,δD} range and in addition, the COSMOiso distribution also shows a slightly tilted slope compared to FTIR towards higher qv values for high-δD air and lower qv values for low-δD air. Likewise, the comparison of the FTIR (type 2 product) and COSMOiso δD distributions indicates a tendency towards δD values that are too low in the model compared to the observations (Fig. 5h). These differences, however, mainly occur on days with a less reliable air parcel transport in the model (see Sect. 2.4). Uncertainties in the transport of air parcels are often found during transitions from the North Atlantic flow regime to an African flow regime and vice versa and are related to heterogeneous atmospheric conditions (as discussed in Sect. 3.1), which imply that subtle changes in the initialisation of the trajectories (time, pressure) can lead to a completely different transport pathway. Finally, comparing modelled and observed (type 1 product; see Sect. 2.1.2) qv does not show a clear shift in COSMOiso (Fig. 5i), but in contrast to the comparison against space-based IASI data, the statistical representativeness of the ground-based remote sensing observations is limited. The 383 FTIR observations contain only a few independent samples since there are multiple observations per day in general (varying between 1 and 25 data points). Still, the high consistency between the comparisons with two different remote sensing datasets is encouraging and forms a sound basis for evaluating variations in qv and δD in COSMOiso vs. FTIR observations on short timescales. As a side note we mention that the inconsistency of the model comparison with aircraft in situ data vs. with remote sensing data might point to a positive δD bias of the remote sensing observations. However, we use the final MUSICA NDACC (FTIR) data product in this study, which is calibrated to the in situ aircraft profiles and therefore bias corrected (Schneider et al., 2016). In addition, comparing the different observational datasets is difficult since the in situ and remote sensing techniques sample the atmosphere differently in terms of spatial and temporal resolution.
We briefly come back to the setup of our COSMOiso simulation with explicitly resolved convection. Figure B1 in the appendix shows an alternative simulation with parameterised convection, which leads to larger and mostly positive model biases in comparison with airborne, ground-, and space-based observations. This is in agreement with previous studies, which have already reported positive mid-tropospheric δD biases in model simulations with parameterised convection due to an overestimated vertical moisture transport (e.g. Werner et al., 2011; Risi et al., 2012a, b; Christner et al., 2018).
Figure 6 shows the time series of the COSMOiso and FTIR qv (type 1 product) and δD (type 2 product) data. There is a pronounced day-to-day variability with qv ranging from 0.45 to 4.3 g kg−1 and δD from −318 ‰ to −128 ‰. Conditions that are moist and enriched in heavy isotopes change with dry and depleted conditions on a remarkably short timescale (e.g. from 18 to 19 July or from 29 to 30 July). Comparing COSMOiso to the FTIR data demonstrates that our simulation accurately reproduces these observed temporal variations in mid-tropospheric qv and δD despite occasional deviations. These differences can occur due to various factors. In the first place, we observe that the deviations are largest on days with a less reliable air parcel transport (see Sect. 2.4 and discussion below in the context of Fig. 7). Synoptic-scale uncertainties in COSMOiso, as already mentioned in Sect. 3.1, may thus partly explain the observed differences. Moreover, model uncertainties in the representation of complex, sub-grid-scale processes in the vicinity of the mountain slopes of Tenerife could also contribute to differences between the model and observations. Finally, there are also uncertainties associated with the remote sensing retrievals and the COSMOiso post-processing. Overall, however, we can conclude that COSMOiso realistically represents the variability in mid-tropospheric qv and δD including fast day-to-day variations.
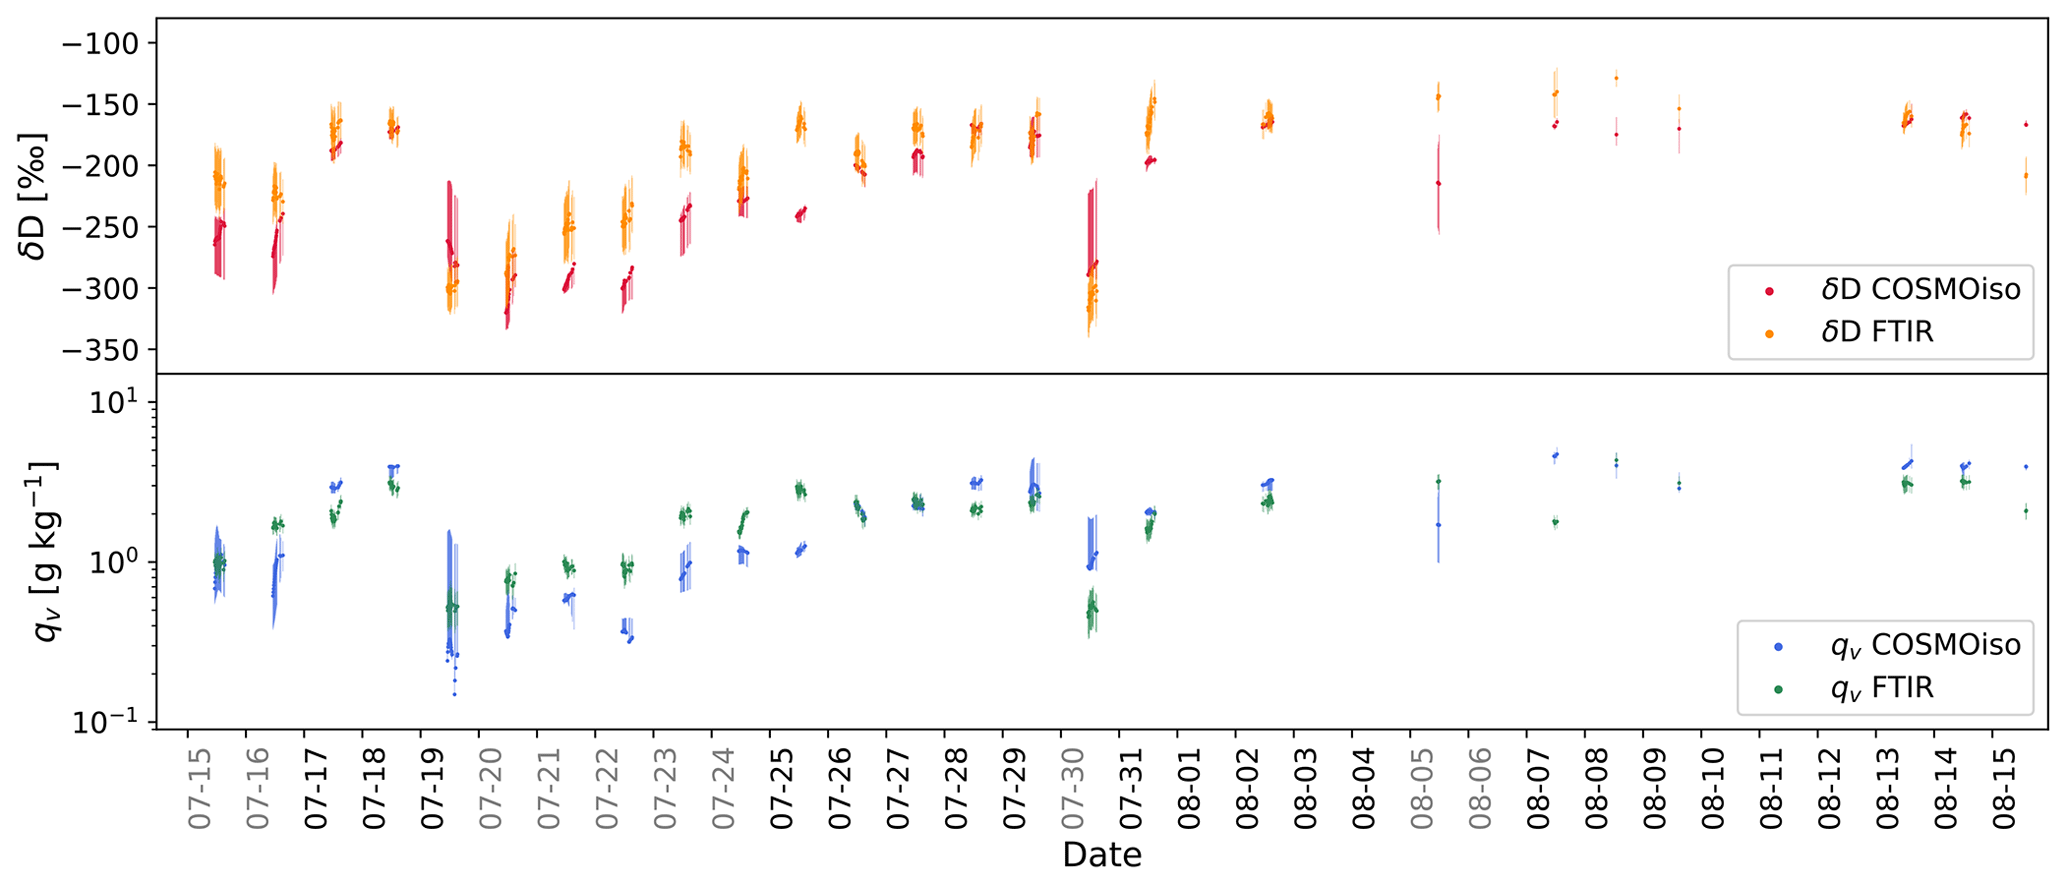
Figure 6Time series of COSMOiso and ground-based FTIR remote sensing qv and δD obtained for the 4.9 km retrieval level (representative of 3–7 km) above Tenerife around midday. The shadings represent the estimated COSMOiso uncertainties (based on the minimum and maximum δD and qv values of the eight neighbouring grid points) and the FTIR random errors. Grey dates on the x axis indicate days with a less reliable air parcel transport (see Sect. 2.4).

Figure 7COSMOiso qv (a) and δD in water vapour (b) 300–900 hPa above Tenerife as well as the Lagrangian origin of the air parcels (c). The black horizontal lines confine the horizontal air layer between 500–700 hPa used for further analyses in this study. Black dots in (a, b) indicate a less reliable air parcel transport (see Sect. 2.4). Black dots in (c) represent transport pathways with surface precipitation equal or larger than 1 mm h−1 at least once over continental Africa for the African air parcels and over the North Atlantic for the North Atlantic air parcels.
In this part, we investigate the governing processes behind the free-tropospheric isotope variability in the Canary Islands region observed in Sect. 3. First, the influence of different transport pathways on the free-tropospheric humidity and isotopic variability in summer 2013 is evaluated. Secondly, the processes that occur along the four predominant transport pathways are investigated based on a detailed analysis of isotope signals along COSMOiso trajectories. Subsequently, large-scale circulation anomalies in the mid-troposphere associated with the four contrasting transport pathways are analysed. Finally, their relevance is assessed climatologically.
4.1 Linking contrasting isotope conditions to different transport pathways
In Fig. 7, we present the qv and δD composition in the vertical column between 300 and 900 hPa above Tenerife as simulated by COSMOiso for the period of July–August 2013. Substantial variability appears in the qv and δD signals (Fig. 7a and b). In the middle troposphere, short intervals (1–5 d) of dry, low-δD air () alternate with longer periods (3–11 d) of humid, high-δD air (). Transitions between episodes often occur within a few hours and are characterised by sharp qv and δD gradients (e.g. on 19 July and 17 August 2013; see also Fig. 4a–c). The enriched periods themselves also show fast, albeit less pronounced, variations in δD on timescales of hours to days. These contrasting humidity and isotope conditions are closely linked to the four predominant transport pathways (see Sect. 2.4). While the dry and low-δD air primarily comes from the North Atlantic (NA, blue shading in Fig. 7c), the humid and high-δD air mainly originates from West Africa, where we distinguish between air originating from the convective boundary layer of the SHL (SHL BL, red shading in Fig. 7c), the free troposphere above the SHL (SHL FT, purple shading in Fig. 7c), and tropical Africa south of the SHL (TRP AFR, green shading in Fig. 7c). Most pronounced temporal variations in δD occur during transitions from an African transport regime to the NA regime and vice versa. For example, on 19 July and 17 August a strong depletion in heavy isotopes in mid-tropospheric water vapour from about −160 ‰ to −320 ‰ occurs within a few hours, simultaneously with a transition from an African to the NA transport regime. The fast δD variations during enriched periods can be partly explained by changes in the African transport pathways, where higher δD signals tend to appear during the SHL BL transport regime compared to lower δD signals during the TRP AFR regime (e.g. 20–23 August). Not surprisingly, air parcels from tropical Africa (TRP AFR) are more often affected by surface precipitation (black dots in Fig. 7c) and hydrometeors (not shown) than air parcels from the SHL region (SHL BL/FT). The formation of cloud water and precipitation directly influences the water vapour isotopic composition of an air parcel, since heavy isotopes preferentially condense, whereby the remaining ambient water vapour becomes depleted in heavy isotopes. As a result, air parcels from TRP AFR are associated with lower δD values due to condensation in moist convective systems in the Sahel compared to air parcels from the SHL region, where dry convection dominates. For the further analysis of physical and dynamical processes associated with the four contrasting transport pathways, we consider the air layer between 500 and 700 hPa (indicated by the black horizontal lines in Fig. 7). This layer is particularly interesting from a dynamical viewpoint as the large-scale circulation dominates the humidity and isotope composition at these altitudes, whereas local mixing processes between the boundary layer and the free troposphere are less relevant than at lower levels. In addition, the remote sensing observations, against which we validated COSMOiso, have their highest sensitivity around 600 hPa.
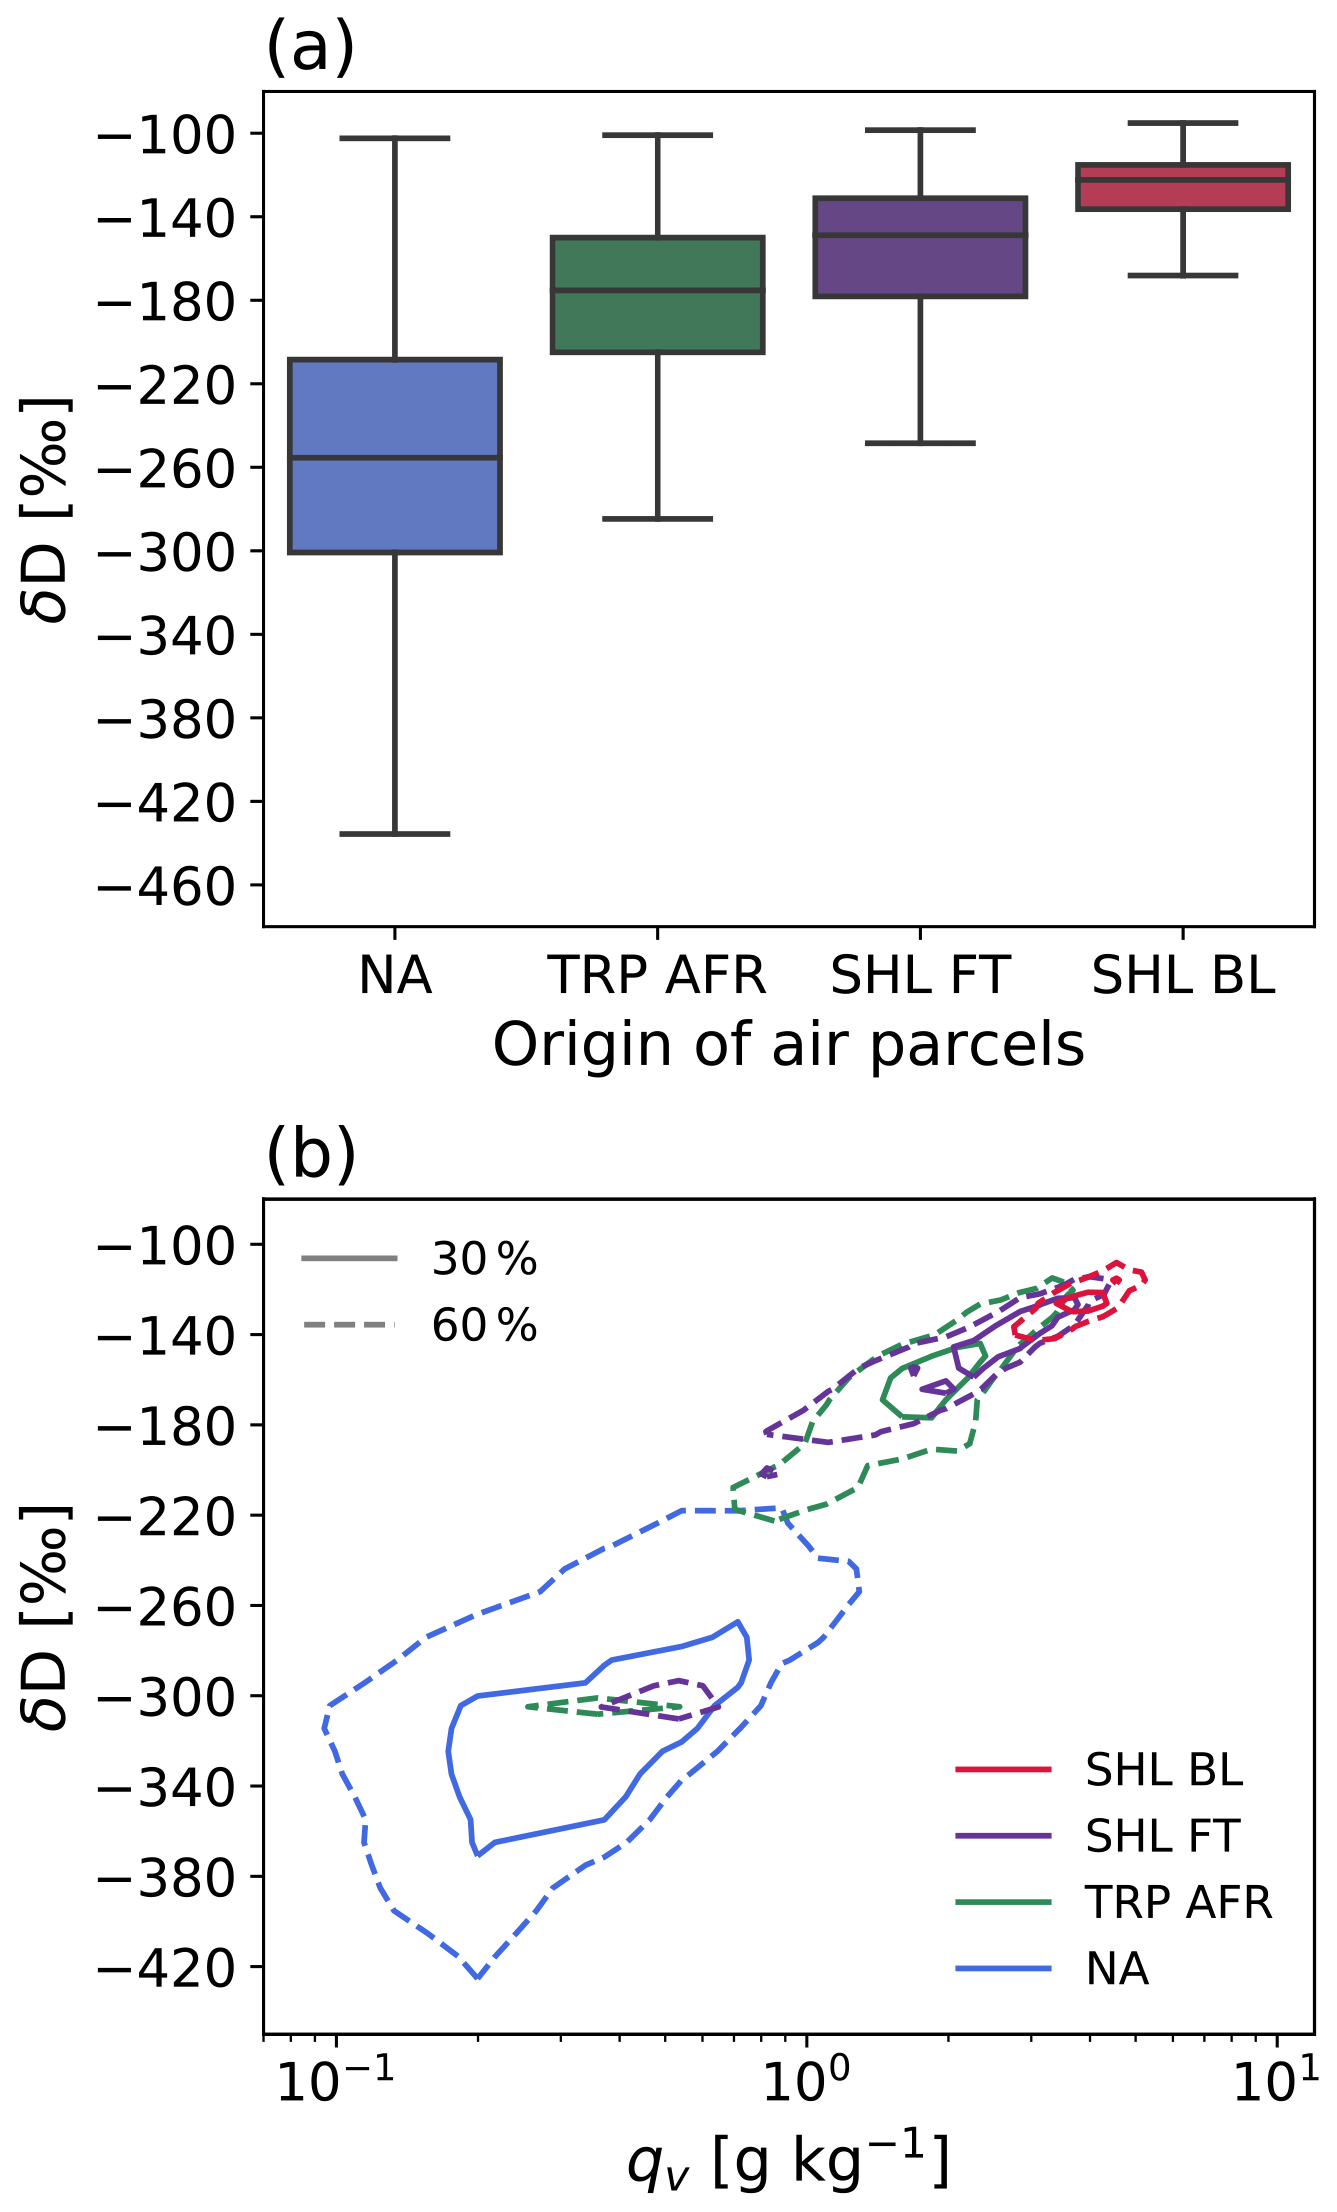
Figure 8Isotopic signature of COSMOiso air parcels arriving at 500–700 hPa above Tenerife and originating from the upper-level extratropical North Atlantic (NA, 26 % occurrence frequency), from tropical Africa (TRP AFR, 16 %), from the upper levels above the Saharan heat low (SHL FT, 26 %), and from the convective boundary layer of the Saharan heat low (SHL BL, 32 %). (a) Boxplots of the δD signal separated by air parcel origin. The boxplots show the interquartile range by the extent of the box and the median by the black line in the box. The whiskers correspond to 1.5 times the proportion of the interquartile range past the lower and upper quartiles. (b) Relation between δD in water vapour and qv. Solid and dashed contours show the 30 % and 60 % frequency isolines of normalised two-dimensional histograms of respective transport regimes.
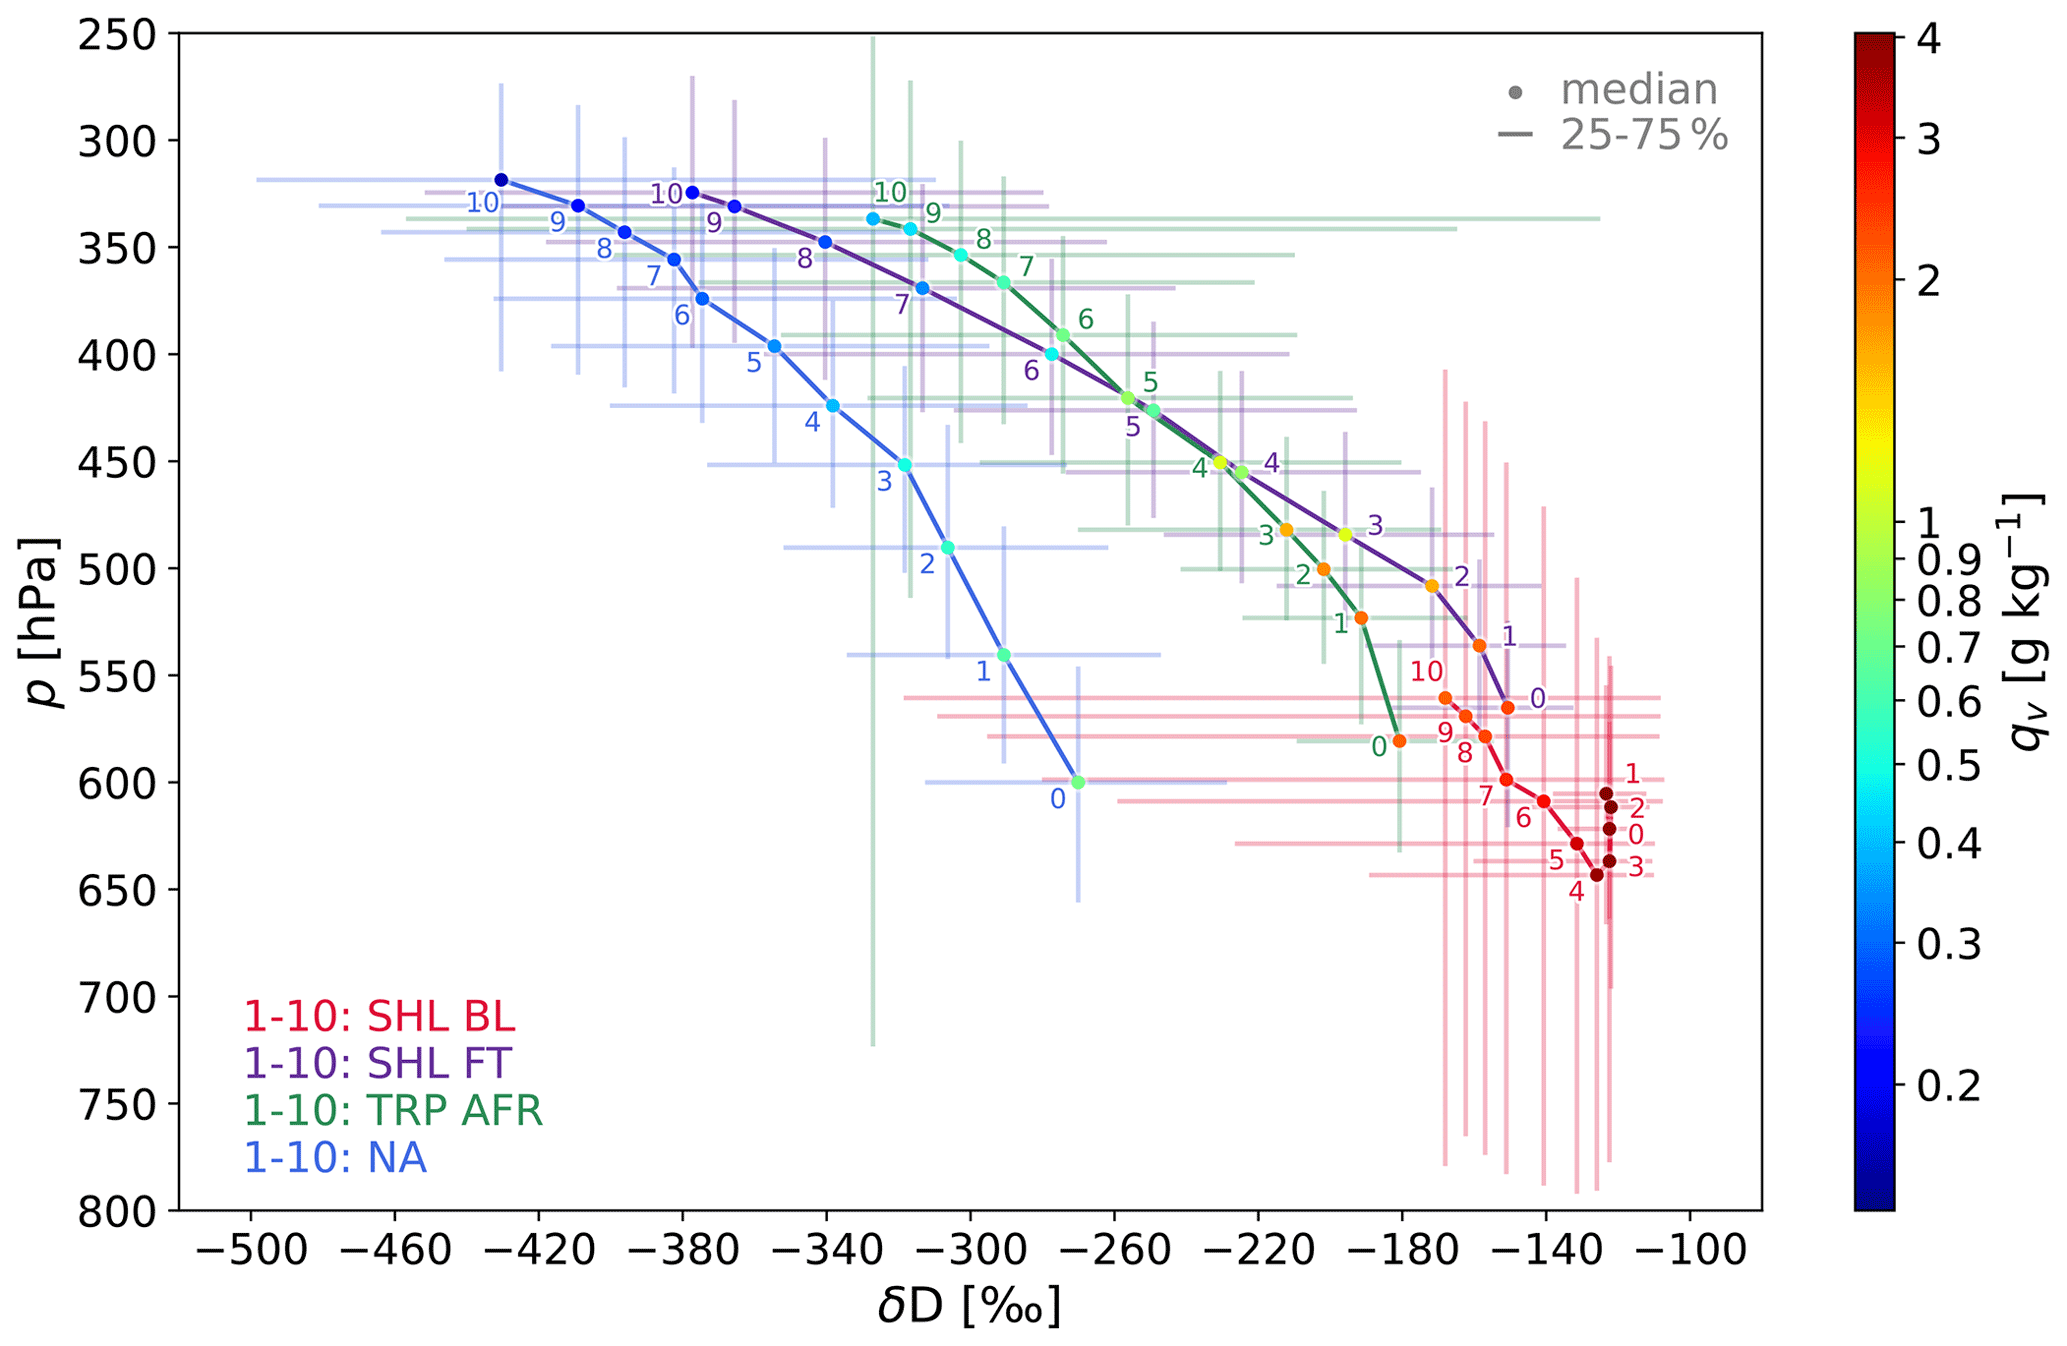
Figure 9p–δD plot summarising the 10 d Lagrangian history of COSMOiso air parcels arriving at 500–700 hPa above Tenerife. The plot shows the median p and δD of the air parcels by the filled circles and the median qv by the colours of the filled circles. The numbers indicate the days before the air parcels arrive over Tenerife, where red numbers represent air parcels from the boundary layer of the Saharan heat low (SHL BL), purple numbers air parcels from the free troposphere above the Saharan heat low (SHL FT), green numbers air parcels from tropical Africa (TRP AFR), and blue numbers air parcels from the North Atlantic (NA). The interquartile range of p and δD is shown by the coloured vertical and horizontal lines.
The statistical analysis of the mid-tropospheric δD signal highlights that each of the four transport pathways has a distinct isotopic signature (Fig. 8). The NA transport pathway is the most depleted (median ) and most variable (interquartile range IQR=92 ‰) regime, whereas the SHL BL pathway represents the most enriched (median ) and most homogeneous (IQR=21 ‰) category (Fig. 8a). Air parcels of the SHL FT (median , IQR=47 ‰) and TRP AFR (median , IQR=55 ‰) transport regimes are less enriched in heavy isotopes than air parcels of the SHL BL regime but more enriched than NA (Fig. 8a). In general, the three African transport pathways distinctly differ from the NA pathway with respect to δD as IQRs of the distributions do not overlap (Fig. 8a). The {qv,δD}-pair distributions of the African and NA regimes differ in a similar manner (Fig. 8b). The three African transport pathways also show some differences between their {qv,δD}-pair distributions. There is a clear contrast in the δD range of the SHL FT and TRP AFR distributions for the 60 % contour, whereas the qv ranges largely overlap (Fig. 8b). Hence, these two transport pathways have a similar qv that apparently results from different physical processes. While the SHL FT pathway is primarily influenced by dry convective mixing without fractionation, the TRP AFR pathway is mainly affected by moist convection and thus by microphysical processes in addition to mixing. Thanks to the characteristic isotopic signature, a discrimination between these two fundamentally different transport pathways is possible. This emphasises the added value of water vapour isotopes for investigating physical processes and transport pathways that affect the subtropical tropospheric humidity. Figure 8b further highlights the homogeneous character of the SHL BL category as well as its particularly high δD and qv values. By contrast, the {qv, δD}-pair distribution of the NA category reflects the dryness and depletion in heavy isotopes of this transport pathway.
This analysis confirms the current state of knowledge about the contrasting moisture transport conditions over the eastern subtropical North Atlantic, resulting from an alternation of humid, isotopically enriched air primarily coming from Africa and of dry, depleted air mainly originating from the upper-level extratropical North Atlantic (González et al., 2016; Lacour et al., 2017). In addition, our work shows that North African air masses affected by the SHL (pathways SHL BL and SHL FT) and air masses originating from the Sahel region further south (pathway TRP AFR) are associated with a distinct isotope signature. The combination of high-resolution numerical isotope modelling with multi-platform isotope observations, which represents an expansion of the previous observation-oriented studies by González et al. (2016) and Lacour et al. (2017), offered the possibility to directly link the observed synoptic timescale variability of specific humidity and isotope composition to the origin of moisture. In particular, it allows for studying the isotopic composition along backward trajectories from the Canary Islands region and thereby disentangling the governing physical processes that affect the subtropical free-tropospheric moisture budget (see Sect. 4.2).
4.2 Characterisation of predominant transport pathways in the Canary Islands region
Detailed analysis of isotopic signals along backward trajectories provides valuable insights into the process history of air parcels. Figure 9 summarises the median 10 d Lagrangian evolution of pressure p, δD, and qv of the four different transport pathways identified in this study. The median SHL BL pathway involves weak subsidence from about 550 to 640 hPa () 4–10 d before arrival, followed by a lifting to 600 hPa () 1–4 d prior to arrival and a subsequent descent to 620 hPa () during the last 2 d before arrival over the Canary Islands. The initial subsidence goes along with an increase in δD () and qv (). The subsequent lifting occurs without changes in the median δD and qv. The SHL BL pathway is further characterised by substantial variability in p and δD 4–10 d before arrival, which considerably reduces in the last 3 d before arrival. Both are related to SHL dynamics. Convective mixing in the SHL of dry, low-δD air from the upper-level extratropics with moist, high-δD air from low levels effectively homogenises the isotopic composition, producing a well-mixed and relatively homogeneous air mass that subsequently travels towards the Canary Islands. The homogeneous, enriched composition of the SHL BL air is a unique characteristic of this transport pathway (Fig. 8a) and a clear imprint of the dry convective mixing in the SHL. Figure 10a and b show a representative example of the SHL BL pathway. Air parcels with a low δD descend from the upper-level extratropical North Atlantic around the Atlas Mountains into the SHL (red squares in Fig. 10a), where they experience considerable enrichment in heavy isotopes and moistening due to dry convective mixing with high-δD air from lower levels. The moisture of these low-level air parcels presumably originates from evaporation over the eastern Mediterranean and the Black Sea, as identified with extended ERA-Interim backward trajectories (Fig. 11). Two principal moisture transport pathways dominate the low-level SHL inflow at the time when the air parcels in Fig. 10a and b are located in the SHL (Fig. 11). The first pathway, the so-called south-westerly monsoon flow, brings very humid air from the tropical Atlantic into the southern part of the SHL. The second pathway, the so-called north-easterly Harmattan flow, transports air from north-eastern Europe into the central and northern part of the SHL. These low-level air parcels experience a considerable moisture uptake during their transport across the eastern Mediterranean, with minor contributions from the Black Sea, before they mix with upper-level extratropical air in the SHL. The well-mixed, isotopically homogeneous air then rapidly moves as a coherent air mass over the adjacent North Atlantic directly towards Tenerife (Fig. 10a and b). This direct and fast transport of air towards the Canary Islands is typical for the SHL BL pathway. It essentially conserves the isotopic imprint of the dry convective mixing in the SHL, which is reflected by the constant δD signal along the trajectories during the last 3 d before arrival (Fig. 9).
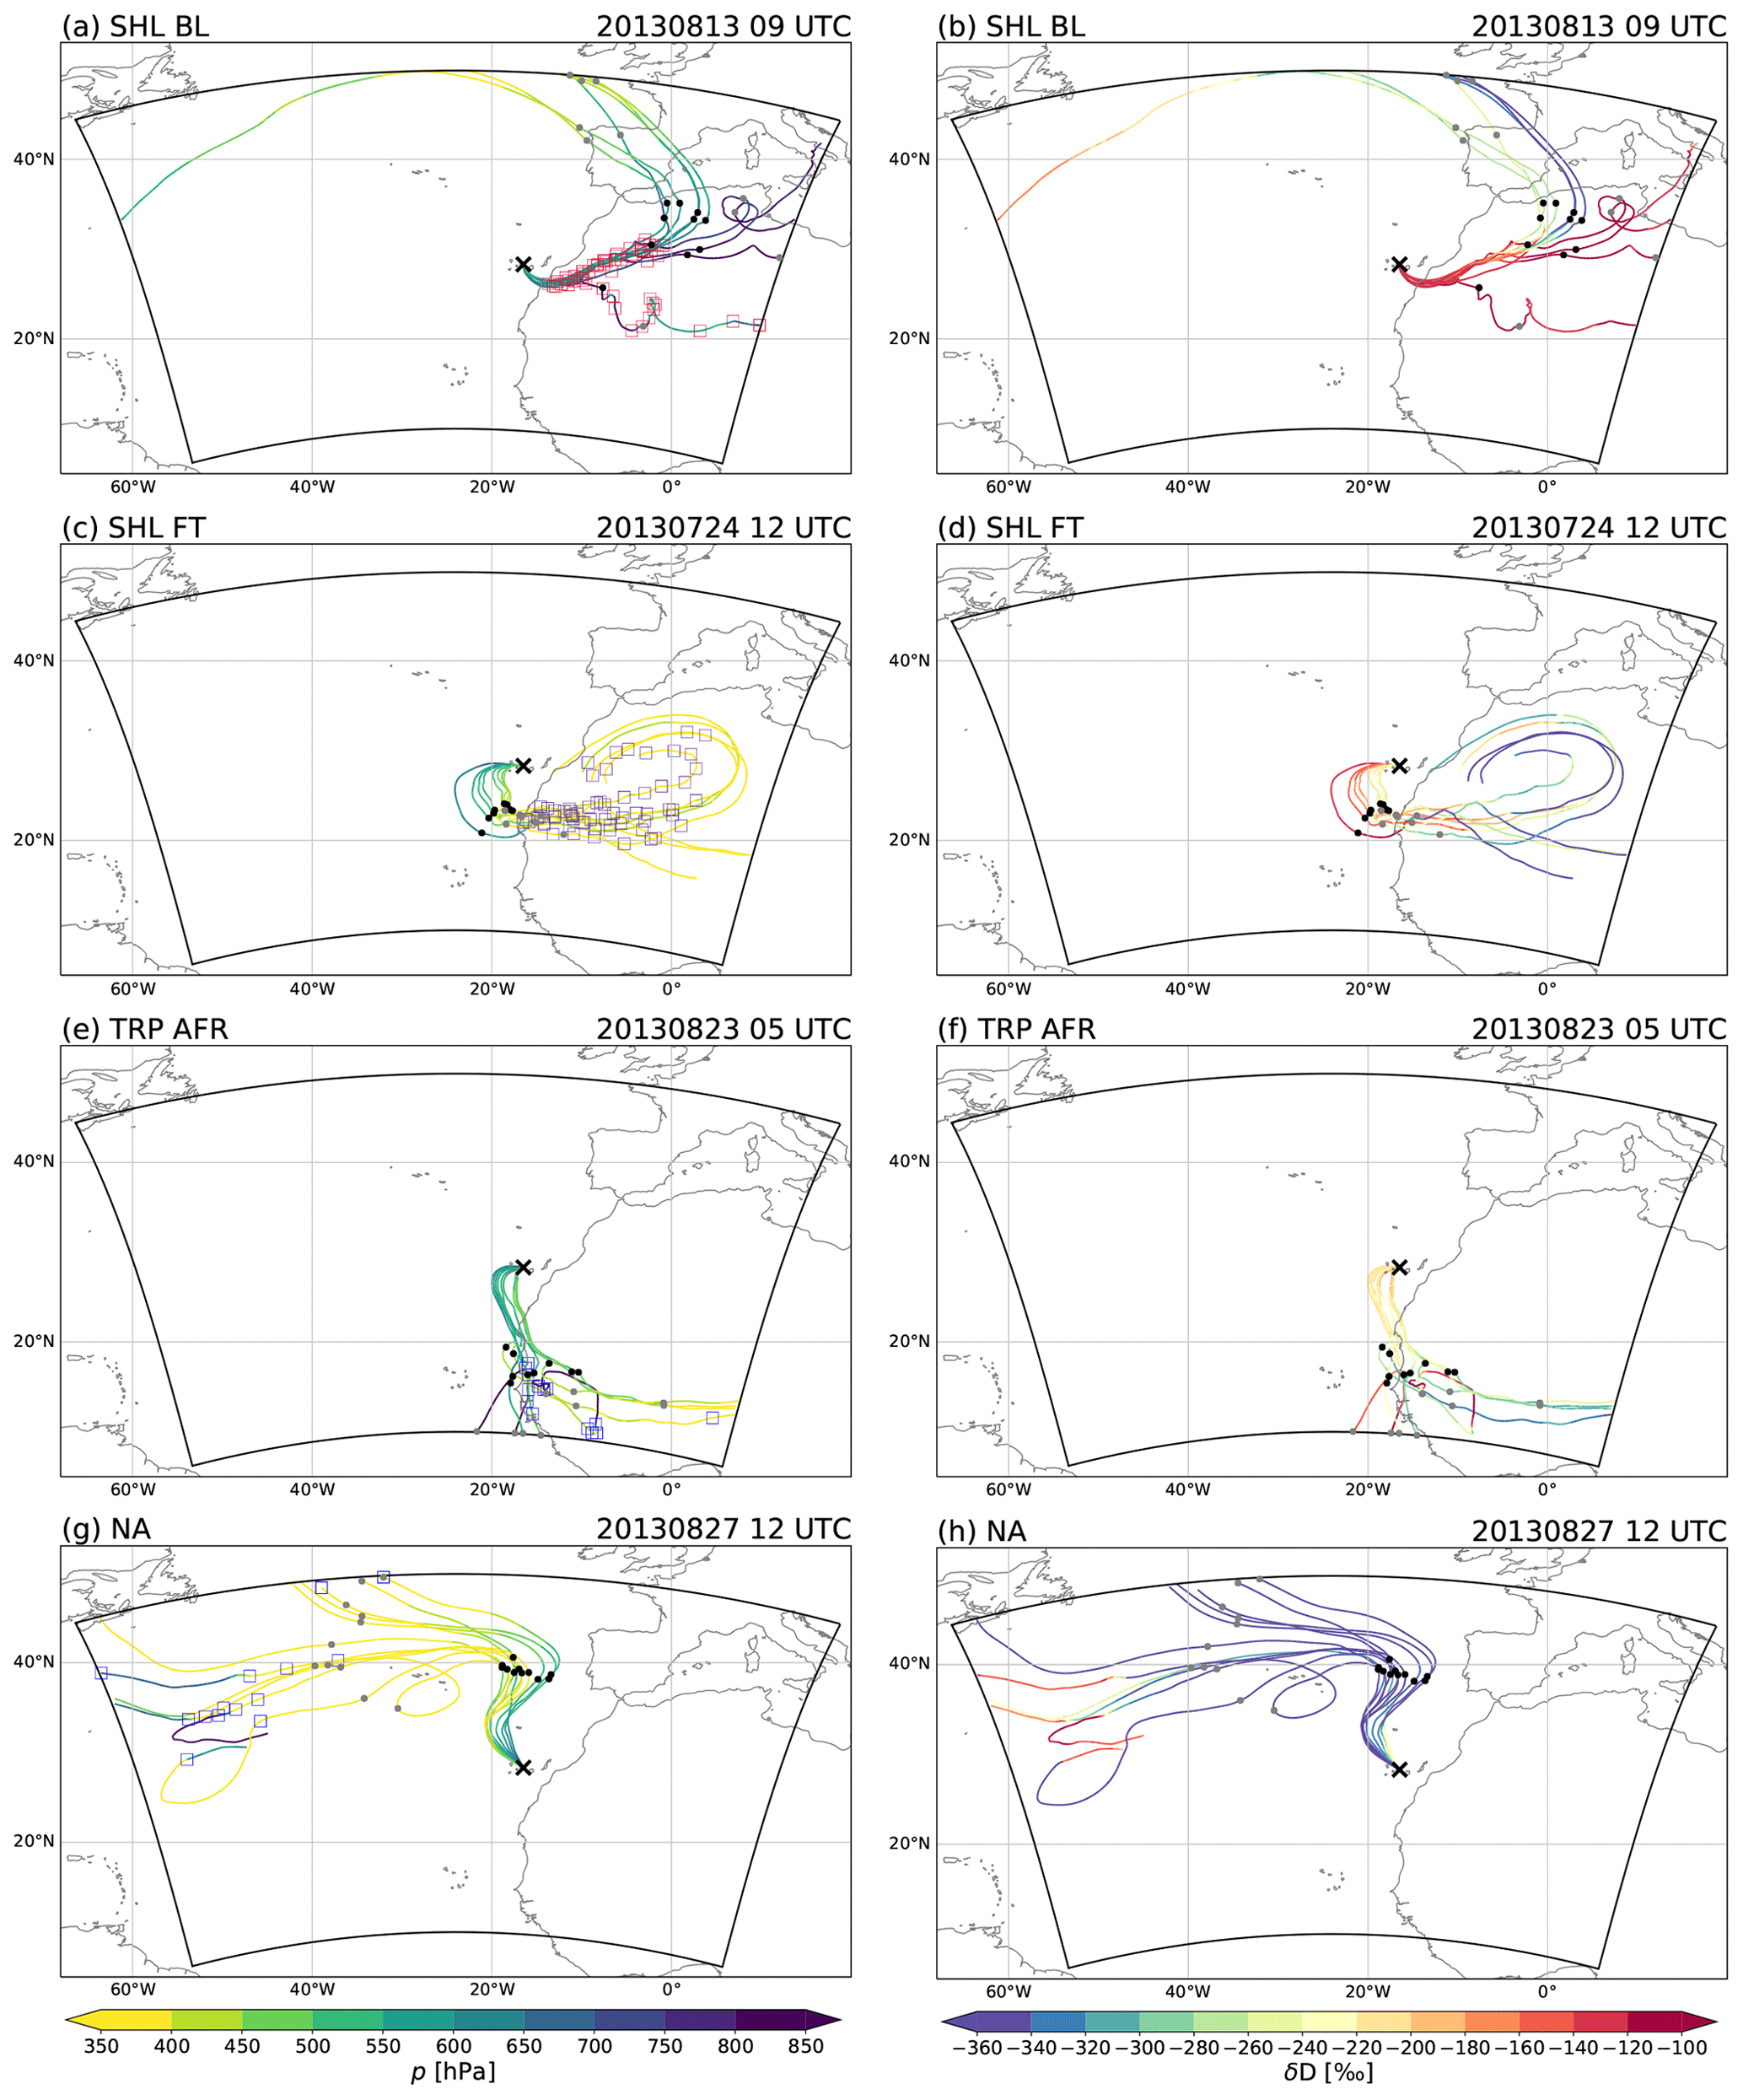
Figure 10COSMOiso 10 d backward trajectories showing typical transport pathways of (a, b) air parcels originating from the boundary layer of the Saharan heat low (SHL BL), (c, d) air parcels coming from the free troposphere above the Saharan heat low (SHL FT), (e, f) air parcels originating from tropical Africa (TRP AFR), and (g, h) air parcels coming from the North Atlantic (NA). The trajectories are coloured according to their pressure p (left column) and δD signal (right column). The black cross depicts the starting position above Tenerife and the black and grey dots the trajectory positions 3 and 5 d backward in time. Red squares in (a) indicate that a trajectory was in the boundary layer of the Saharan heat low at the respective time and location, purple squares in (c) show that a trajectory was in the free troposphere above the Saharan heat low, and blue squares in (e, g) mark the occurrence of surface precipitation. The time expression in the title indicates the starting time of the backward trajectories.
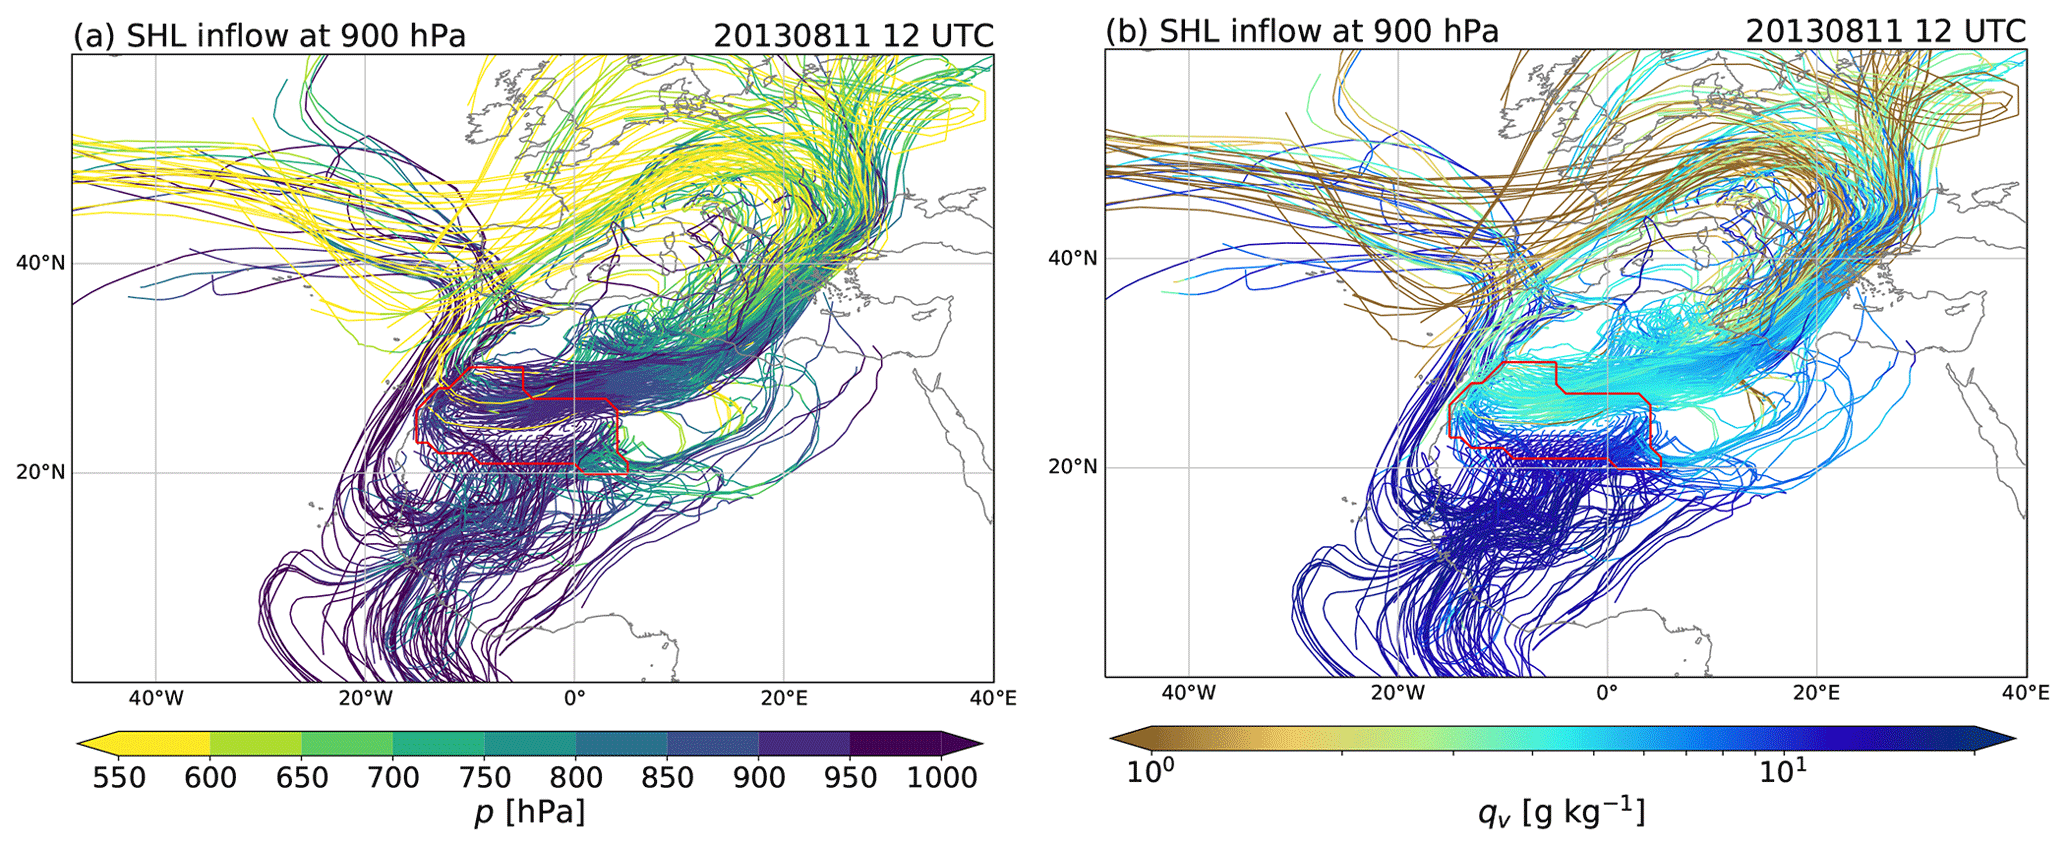
Figure 11Exemplary inflow into the Saharan heat low at 900 hPa. The ERA-Interim trajectories were started every 100 km from the 900 hPa level in the heat low (red contours) at 12:00 UTC 11 August 2013 and are run 10 d back in time. The starting time corresponds to the time at which air parcels in Fig. 10a and b are located in the Saharan heat low (approximately 3 d before arrival). The Lagrangian evolution of the air parcels' pressure p is shown in (a) and of the specific humidity qv in (b).
Although originating from a similar region, air parcels of the SHL FT category follow a different pathway (Fig. 9). Typically, air parcels with a very low initial δD (median ) from the upper troposphere experience a dramatic median increase in δD () and a strong moistening () along with a strong subsidence () on their 10 d travel towards the Canary Islands. This indicates that at least in our simulation, there is vigorous exchange across the inversion on top of the SHL. This transport pathway exhibits the largest median changes in humidity and isotopic composition among the four identified transport pathways. The pronounced enrichment in heavy isotopes usually occurs in the free troposphere above the SHL due to mixing in of high-δD air that is injected from the boundary layer of the SHL into the free troposphere. Figure 10c and d illustrate how upper-level air parcels get enriched while anticyclonically rotating above the SHL (purple squares in Fig. 10c) before they move off the African coast and slowly approach the Canary Islands from the south. Note that these trajectories move slower than the ones in the SHL BL category and that they therefore reside over West Africa for most of the 10 d period.
The TRP AFR pathway reflects the typical transport of air parcels that descend from upper-level tropical Africa towards the Canary Islands (Fig. 9). The strong median subsidence () over the Sahel and tropical West Africa goes along with a moderate increase in δD () and qv (). In summer, during the West African Monsoon, the Sahel, and therefore air parcels of the TRP AFR pathway, are frequently affected by mesoscale convective systems. This implies that moist convective mixing regularly influences air parcels of the TRP AFR pathway, in contrast to the SHL BL and SHL FT pathways where dry convective mixing is dominant. The exemplary trajectories presented in Fig. 10e and f show the interplay between subsiding air parcels from the upper-level Sahel and ascending air parcels from the low-level tropical Atlantic and Africa. The low-level air parcels are lifted to higher altitudes thereby experiencing rainout (blue squares in Fig. 10e) and depletion in heavy isotopes. The subsiding air parcels, in turn, get enriched during their subsidence over the Sahel due to mixing with air from lower altitudes. However, the increase in δD due to this effect is only minor, since the rising lower-level air experiences depletion in heavy isotopes due to condensation in the convective system. The moist convective mixing over the Sahel leads to a homogenisation of the different airstreams, which subsequently travel over the adjacent tropical Atlantic towards the Canary Islands (Fig. 10e and f). Because of the strong variability in the occurrence of mesoscale convective systems over West Africa, the TRP AFR pathway shows high variability (Fig. 9).
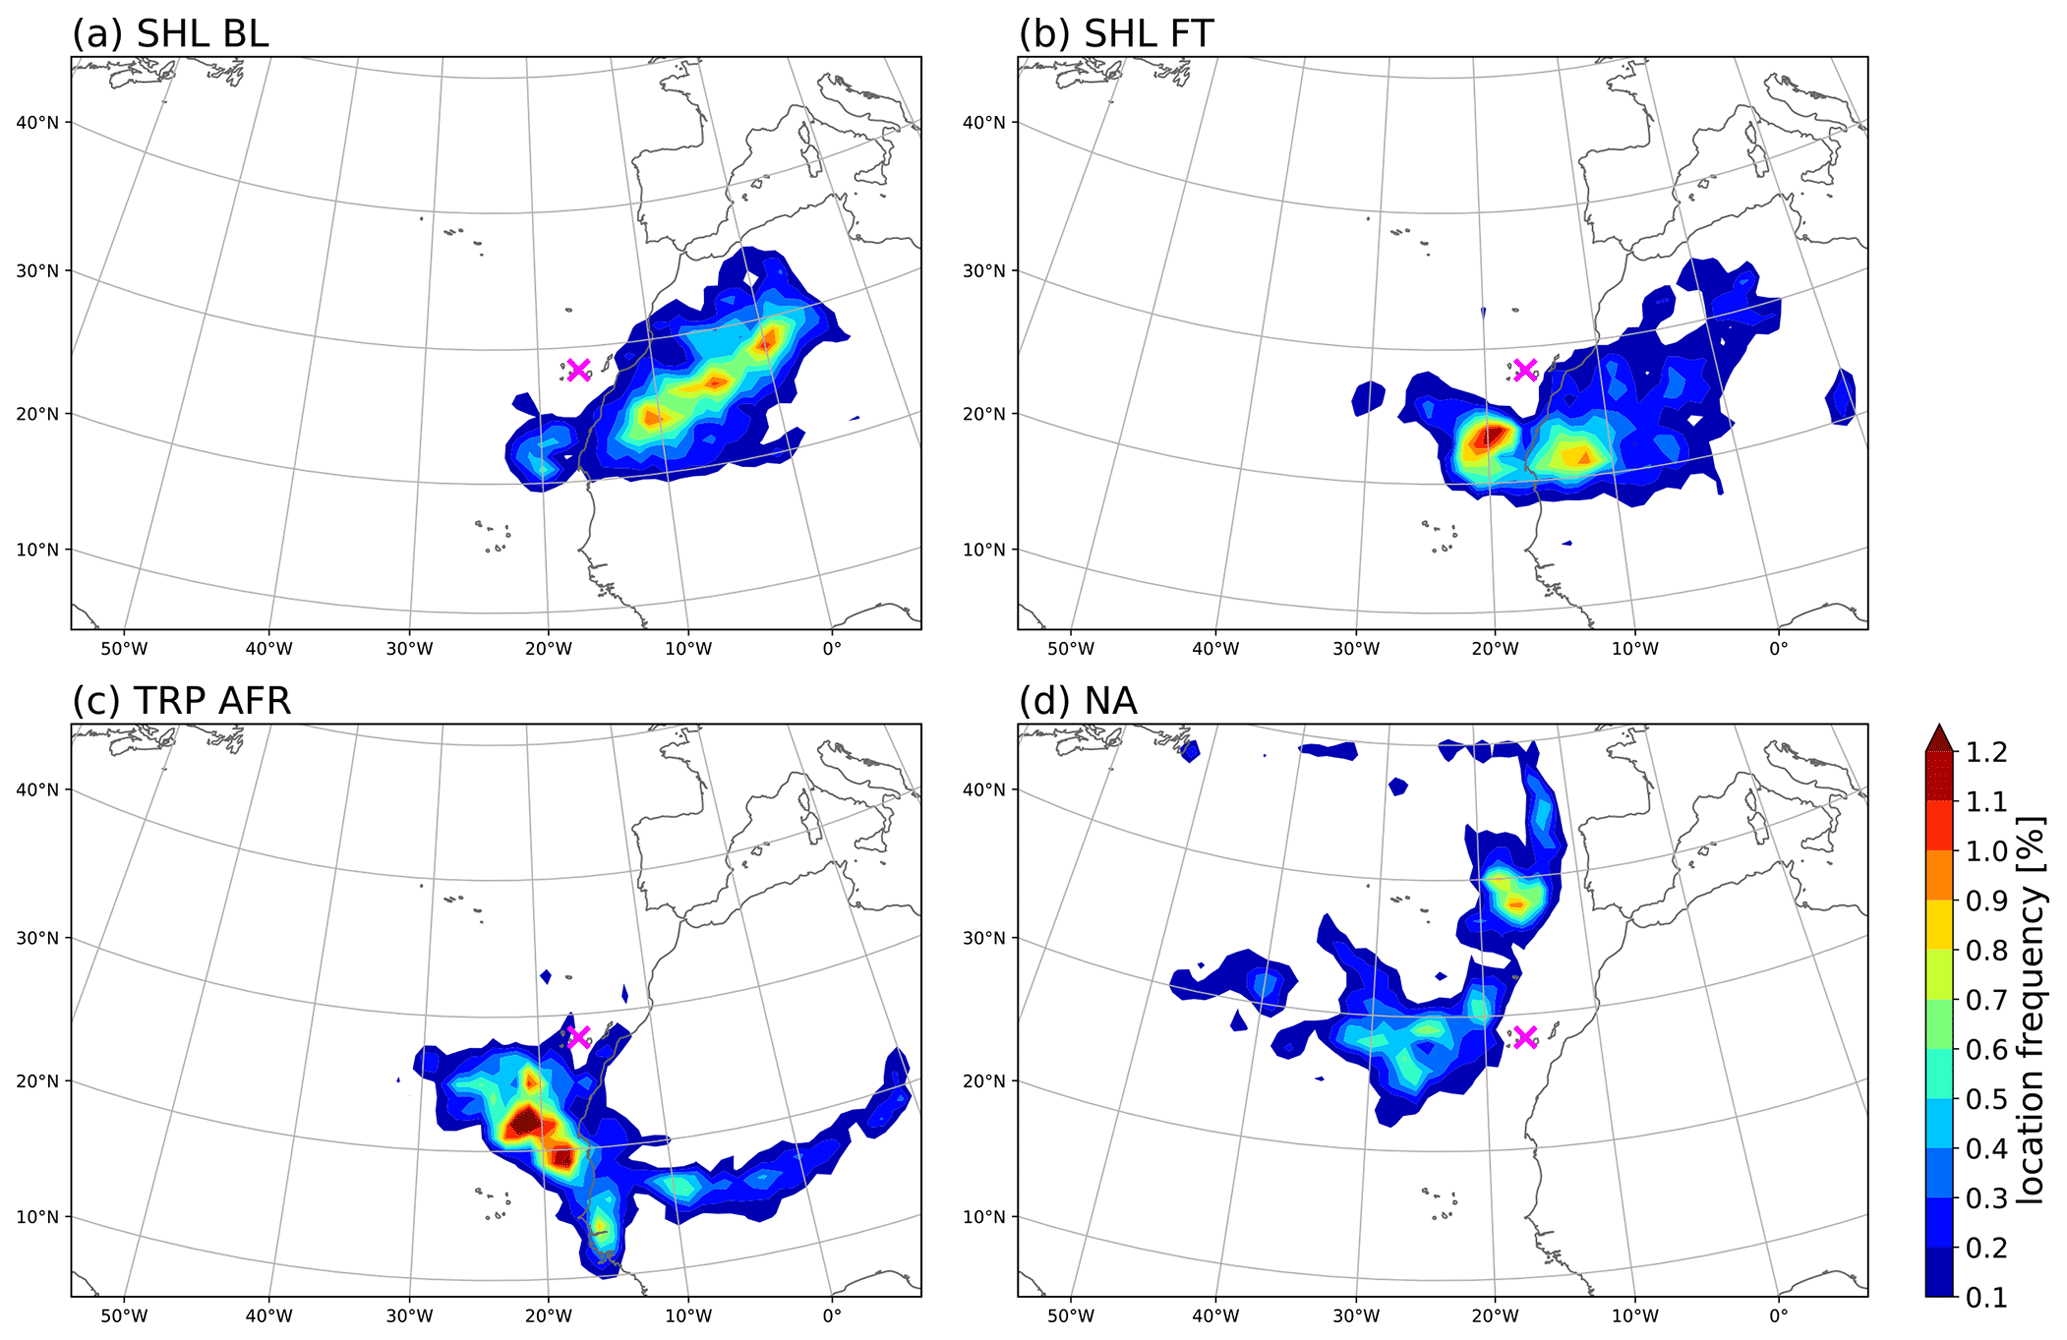
Figure 12Gridded location frequency of COSMOiso backward trajectories 3 d prior to arrival at 500–700 hPa above Tenerife (magenta cross) classified into groups with different transport pathways. (a) Air parcels originating from the boundary layer of the Saharan heat low (SHL BL, 32 % occurrence frequency), (b) air parcels originating from the free troposphere above the Saharan heat low (SHL FT, 26 %), (c) air parcels coming from tropical Africa (TRP AFR, 16 %), and (d) air parcels originating from the North Atlantic (NA, 26 %).
Finally, the NA pathway presented in Fig. 9 summarises the history of dry air parcels strongly depleted in heavy isotopes that originate from the upper-level extratropical North Atlantic. This transport pathway leads to the lowest δD and qv values observed in the Canary Islands region. The humidity and isotopic composition show a slight to moderate change (, ) during the comparatively fast descent () of the air parcels with low initial δD values (median ) in an environment with regular precipitation events but without deep convective systems. A representative example of the NA pathway is given in Fig. 10g and h. The descending air parcels with a very low δD are either directly advected from the upper-level extratropical North Atlantic towards the Canary Islands or, in a few cases, first lifted from the lower-level extratropical North Atlantic to higher altitudes thereby experiencing rainout (blue squares in Fig. 10g) and depletion in heavy isotopes.
Figure 12 summarises the four different transport pathways by showing the spatial distribution of the air parcels' location 3 d before arrival over Tenerife. Air parcels of the SHL BL pathway are almost exclusively located over the Sahara (Mauretania, Mali, Algeria) before they rapidly move over the adjacent subtropical North Atlantic towards the Canary Islands (Fig. 12a). The direct transport of air parcels from the West African coast towards the Canaries is unique for the SHL BL pathway and effectively conserves the isotopic imprint of the dry convective mixing of low-level moisture of diverse origin advected into the SHL. The SHL FT pathway, in contrast, has the highest air parcel location frequency over the subtropical North Atlantic south of the Canary Islands and over Mauretania (Fig. 12b). These air parcels typically reside several days over the subtropical North Atlantic before reaching the Canary Islands from the south. They potentially experience mixing with enriched air over the North Atlantic, which is reflected by the increase in δD in water vapour during the last 3 d before arrival in Fig. 9. Air parcels of the TRP AFR pathway are predominantly located over the (sub)tropical North Atlantic 3 d prior to arrival in the Canary Islands region (Fig. 12c). In addition, they are also found along the West African west coast and over the Sahel. The broad spread in the air parcels' location underlines the large variability of the TRP AFR regime in terms of pathways of individual trajectories and processes that occur along them. The NA pathway also exhibits substantial variability in the air parcels' location over the North Atlantic (Fig. 12d). This variability is presumably closely related to the synoptic variability in the extratropical North Atlantic storm track region and explains the broad δD distribution of this category (Fig. 8). The peaks in Fig. 12d imply that air parcels either subside directly from the upper-level extratropical North Atlantic towards the Canary Islands or first travel across the North Atlantic, which often goes along with precipitation, before descending into the subtropics to the west of the Canary Islands region.
4.3 Associated large-scale flow conditions
This section focuses on investigating the large-scale flow conditions associated with the four transport pathways. Previous work has shown that even during the warm season the investigation region is frequently affected by positively tilted upper-level intrusions of high potential vorticity (PV) from higher latitudes, usually associated with Rossby wave breaking over the North Atlantic (Fröhlich and Knippertz, 2008; Papin et al., 2020). Ahead of these troughs, moist mid-level air can be transported northwards around the western flank of the anticyclone overlaying the low-level SHL and lead to precipitation in north-western Africa (Knippertz et al., 2003; Knippertz, 2003). Upper-level troughs and ridges together with African easterly waves determine synoptic-scale fluctuations of the SHL and its associated mid- to upper-level anticyclone (Lavaysse et al., 2010a) as well as of dust export from Africa to the Atlantic (Cuevas et al., 2017).
For each of the four transport pathways, we compute ERA-Interim composites of the geopotential height z at 600 hPa and anomalies from the July and August climatological mean in the period 1979–2018. The 6-hourly geopotential height fields in July and August 2013 are assigned to a transport pathway according to the origin of air parcels arriving at 600 hPa above Tenerife in COSMOiso at the corresponding time step. The composites depict the synoptic-scale conditions 3 d prior to the arrival of the respective air parcels. For reasons of consistency, we only consider time steps when COSMOiso and ERA-Interim trajectories both originate either from Africa or from the North Atlantic.
The analysis reveals distinct geopotential height anomaly patterns in the extratropical storm track region for the SHL BL, TRP AFR, and NA pathways (Fig. 13). The most frequent (32 %) SHL BL transport regime shows a large-scale wave over the North Atlantic with positive z anomalies east of the Canadian east coast and over Europe (Fig. 13a). The latter has a north-east–south-west tilt and expands to the Canary Islands region. In combination with negative anomalies over most of the Sahara, the centre of the North African mid-level anticyclone shifts north-westward to the Moroccan Atlas Mountains such that Saharan air can reach the Canary Islands flowing along its southern flank. Cuevas et al. (2017) referred to this as a high NAFDI (North African Dipole Intensity) index situation.

Figure 13Anomalies of geopotential height z at 600 hPa from the climatological mean of July and August in the period 1979–2018 for three different transport regimes: (a) air parcels originating from the boundary layer of the Saharan heat low (SHL BL), (b) air parcels coming from tropical Africa (TRP AFR), and (c) air parcels originating from the North Atlantic (NA). The classification of the transport pathways relies on the origin of air parcels arriving at 600 hPa above Tenerife. The composites depict the synoptic-scale conditions 3 d prior to the arrival of the respective air parcels. Coloured shadings show significant anomalies (p<5 %) from the climatological mean. Contour lines represent the mean state of the respective transport regime in July and August 2013. The percentages in brackets in the title indicate the occurrence frequency of the transport pathways in July and August 2013.
The relatively rare (16 %) TRP AFR regime also shows a large-scale wave over the North Atlantic with positive z anomalies over the Canadian east coast and over Europe (Fig. 13b). In contrast to the SHL BL pathway, however, the eastern anomaly is confined to continental Europe. Instead, a negative z anomaly with two centres prevails over the eastern extratropical North Atlantic: one associated with an upper-level trough near 45∘ N and one south-west of the Canary Islands region, indicative of an upper-level cutoff and PV intrusion. The North African mid-level anticyclone is centred over north-western Algeria, close to its climatological mean position but with a slightly enhanced amplitude. This dynamical environment enables a direct transport of air parcels from tropical West Africa along the south-western flank of the mid-level anticyclone similar to the situation described in Knippertz et al. (2003) and Knippertz (2003). The enhanced zonal gradient of z south of the Canary Islands then favours intensified northward transport towards the islands. Cuevas et al. (2017) referred to this as a low NAFDI index situation. For the SHL FT pathway, the geopotential height anomaly pattern (not shown) is similar to that of TRP AFR, albeit with less pronounced anomalies in the extratropical storm track region and a weaker trough over the central North Atlantic.
By contrast, the NA transport regime (26 %) is characterised by a pronounced positive z anomaly over the extratropical North Atlantic near the British Isles associated with a ridge to the west and north-west of the Iberian Peninsula as well as a negative anomaly over the Mediterranean Sea (Fig. 13c). These anomalies go along with a clear south-westward shift of the North African mid-level anticyclone over the adjacent subtropical North Atlantic, leading to overall more zonal flow. As a result, African air parcels that are transported westward with the African easterly jet are prevented from reaching the Canary Islands region. The ridge over the extratropical North Atlantic induces subsidence of upper-level air parcels southwards to the Canary Islands.
In summary, this analysis is in agreement with previous work that extratropical Rossby wave dynamics strongly influences the mid-tropospheric transport in the study region and thereby the moisture and isotope variability. Specifically for the Canary Islands, the position and zonal extent of the anticyclone above the SHL determines the influx of air from tropical Africa, the Sahara, or the North Atlantic.
4.4 Climatological perspective
We complete this study by analysing the relevance of the four predominant transport pathways from a climatological perspective. To this end, we compute 10 d ERA-Interim backward trajectories for the period 1979–2018 started every 6 h and from every 20 hPa between 500 and 700 hPa above Tenerife. The trajectories are then grouped into the four different transport pathways (see Sect. 2.4).
The monthly occurrence frequencies of the different transport pathways emphasise the dominant role of the SHL BL and SHL FT categories in July and August (summarised as SHL in Fig. 14). With a median occurrence frequency of about 50 % in these 2 months, SHL pathway clearly exceeds the frequencies of the TRP AFR (∼15 %) and NA (∼33 %) pathways. The rapid increase in the median occurrence frequency of the SHL pathway from 13 % in June to 50 % in July and the gradual decrease in September and October to 6 % are closely related to the SHL onset at the end of June (20 June±9 d in the climatological mean; Lavaysse et al., 2009) and its decay in September (17 September±7 d). This is in agreement with Lacour et al. (2017), who showed that the seasonality in the transport of air from the SHL region is linked to the SHL activity. The enhanced transport of mid-tropospheric air from the SHL region in summer develops at the expense of the NA transport regime, which clearly dominates during the rest of the year. With the onset of the SHL at the end of June, the median occurrence frequency of the NA pathway drops from 78 % in June to 36 % and 30 % in July and August, respectively, before reaching again values of around 80 % in October. The occurrence frequency of the TRP AFR pathway is less affected by the seasonal evolution of the SHL and varies less in the course of the year (monthly values between 5 % and 22 %).
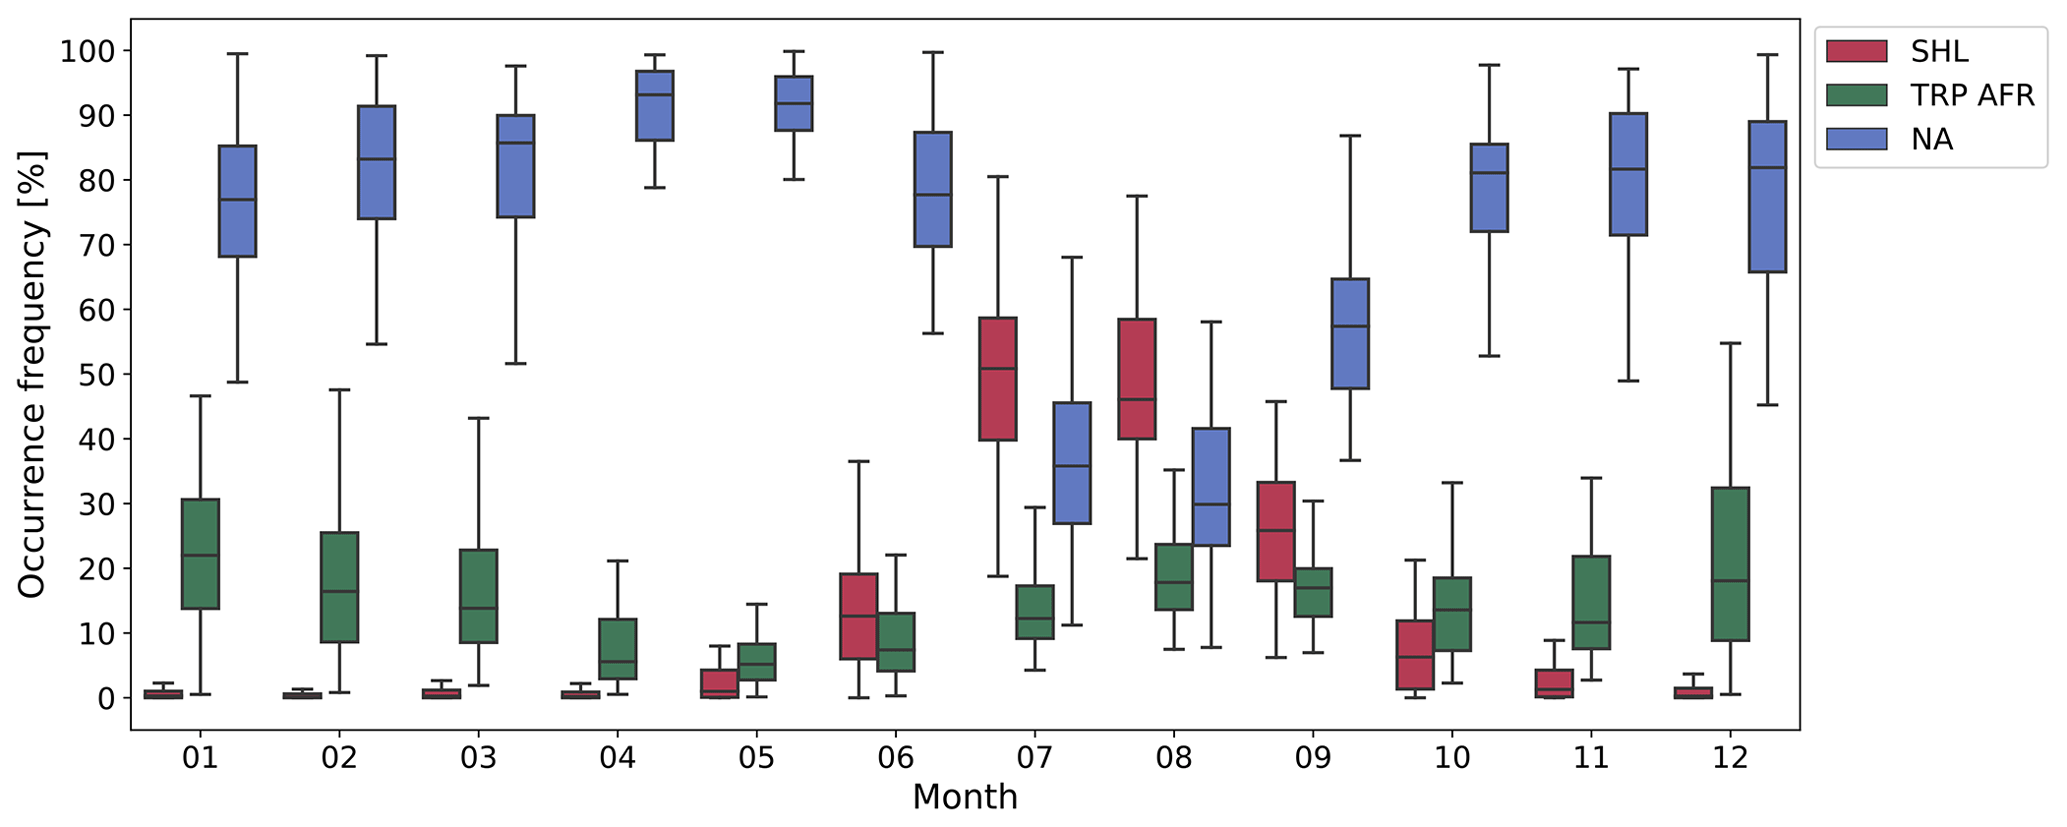
Figure 14Monthly climatology of the occurrence frequency of air parcels originating from the convective boundary layer of the Saharan heat low and from the free troposphere above the Saharan heat low (SHL, red boxplots), air parcels coming from tropical Africa (TRP AFR, green boxplots), and air parcels originating from the North Atlantic (NA, blue boxplots). The classification is based on backward trajectories started every 6 h and from every 20 hPa between 500 and 700 hPa above Tenerife using ERA-Interim data from 1979–2018. The boxplots show the interquartile range by the extent of the box and the median by the black line in the box. The whiskers correspond to 1.5 times the proportion of the interquartile range past the lower and upper quartiles.
From October to May, the NA transport regime clearly dominates (85 % occurrence frequency on average) and alternates with the less frequent TRP AFR regime (13 % on average). Note that the TRP AFR pathway comprises by definition North African air from outside the SHL (see Sect. 2.4). This implies that in the absence of the SHL, the TRP AFR pathway also includes air that originates from the Sahara, unlike in summer, when the SHL is fully established and the TRP AFR transport typically represents air from tropical upper levels south of the SHL (see Sect. 4.2).
Table 1Occurrence frequency of the four transport pathways defined in this study based on a classification of backward trajectories started every 6 h and from every 20 hPa between 500 and 700 hPa above Tenerife. Values correspond to averages and interquartile ranges (in brackets).
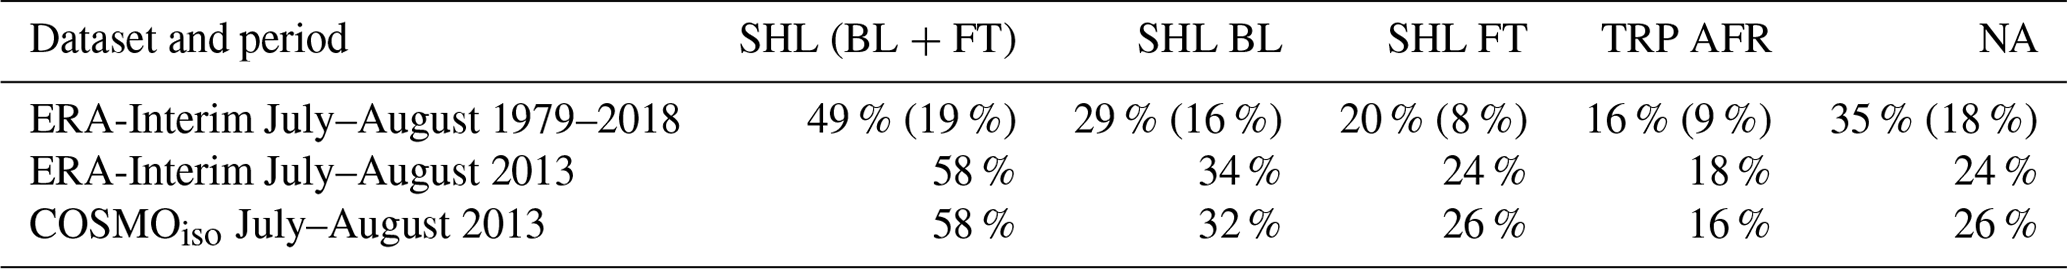
The interannual variability of the monthly occurrence frequencies of the SHL, TRP AFR, and NA transport pathways is moderate (interquartile ranges in Fig. 14) and amounts to 19 %, 9 %, and 18 %, respectively, in July and August (Table 1). In July and August 2013 (studied in detail in this paper), the transport of mid-tropospheric air from the SHL region is more frequent (58 %) compared to the 1979–2018 climatology (49 %). Specifically, the SHL BL and SHL FT pathways both occur about 5 % more often (34 % and 24 %) than in the climatological mean (29 % and 20 %). The NA pathway, by contrast, is underrepresented in July and August 2013 (24 %) compared to the climatology (35 %). The occurrence of the TRP AFR pathway (18 %) roughly corresponds to the climatological mean (16 %), see also Table 1. We analysed the relationship between teleconnection indices1 and the occurrence frequency of the transport pathways for July and August in the period 1979–2018. The North Atlantic Oscillation (NAO) index is weakly correlated with the occurrence frequency of the SHL and NA pathways (Pearson correlation coefficients r=0.13 and −0.14, respectively). The Multi-variate ENSO Index (MEI) shows a moderate correlation with the occurrence frequency of the SHL and NA regimes (r=0.34 and −0.37, respectively). The frequency of the TRP AFR transport does not correlate with NAO nor with MEI. These correlations indicate that the anomalously frequent transport of air from the SHL region in July and August 2013 is most likely linked to the anomalies in the NAO (2.52 in July and 2.16 in August) and MEI (−0.5 in both months). This is in qualitative agreement with Rodríguez et al. (2015), who found a negative correlation between the MEI and Saharan dust concentrations at the Izaña observatory on Tenerife, which in turn is a measure for the transport of air masses from the SHL (González et al., 2016).
The occurrence frequencies of the four transport pathways in COSMOiso are approximately equal to ERA-Interim in July and August 2013, with differences not exceeding 2 % (Table 1). Accordingly, the SHL BL and SHL FT pathways appear more often in the time period considered in this study than climatologically, while the NA transport occurs less frequently. However, as the frequencies of the four transport pathways lie within the climatological interquartile ranges, the results of this study are representative of the contrasting atmospheric conditions that prevail in the Canary Islands region in summer.
In this study, we performed a COSMOiso simulation with explicit convection to investigate predominant moisture transport pathways and governing physical processes that affect the free-tropospheric humidity and isotopic variability in the Canary Islands region in July and August 2013. In addition, we conducted a thorough isotope modelling validation with aircraft and remote sensing observations. The combination of multi-platform isotope observations is an ideal approach to robustly evaluate physical processes in COSMOiso because of the complementary characteristics of the different observations. From the comparison with airborne in situ measurements we learned that COSMOiso reasonably captures the observed variability in the vertical profiles of specific humidity qv and δD in water vapour, although there is a tendency towards overly moist and enriched values in the middle and upper troposphere. The main reasons are that strong horizontal humidity gradients are not fully resolved by COSMOiso and that local mixing processes due to convection are overestimated by the model. Comparing COSMOiso to ground-based remote sensing observations from the NDACC FTIR site in Tenerife showed a good agreement of the day-to-day variability of mid-tropospheric qv and δD, where daily values vary from 0.45 to 4.3 g kg−1 for qv and from −318 ‰ to −128 ‰ for δD. The statistical validation against satellite-based remote sensing from the IASI sensor observations confirmed the good agreement between the modelled and observed qv and δD values in the middle troposphere, apart from a slightly negative δD bias of COSMOiso compared to the satellite data. However, due to the complex characteristics of the remote sensing observations and the simulated averaging kernels that are applied to the model data, it is challenging to identify the reasons behind these biases. Overall, the comparison of COSMOiso with multi-platform isotope observations highlighted that COSMOiso is able to reproduce the observed variations in qv and δD in the middle troposphere and can thus be used to thoroughly study the isotopic variability that occurs on timescales of hours to days over the eastern subtropical North Atlantic in the layer between 500 and 700 hPa.
Based on an analysis of isotope signals along COSMOiso 10 d backward trajectories, we showed that this variability can be linked to four different transport pathways, each associated with a distinct isotope signature:
- i.
Most humid and enriched (median ) conditions in the Canary Islands region appear during the transport of North African air from the convective boundary layer of the Saharan heat low (SHL; referred to as SHL BL pathway, with 32 % occurrence frequency in July and August 2013). Two airstreams typically contribute to this pathway: subsiding air from the upper-level extratropical North Atlantic and low-level air with a high δD from eastern North Africa. Both airstreams converge in the SHL, where dry convective mixing effectively homogenises the contrasting isotopic compositions, and then travel towards the Canary Islands. The exceptionally homogeneous and enriched isotopic composition is a unique characteristic of the SHL BL transport pathway and a clear imprint of the dry convective mixing in the SHL.
- ii.
The transport of North African air that originates from the free troposphere above the SHL (SHL FT, 26 % occurrence frequency) also leads to high δD values (median ) in the Canary Islands region. However, the isotopic composition of these air parcels is a bit less enriched in heavy isotopes and more variable compared to the SHL BL air. This pathway typically represents initially very dry air with a very low δD that experiences a strong increase in qv and δD over the SHL region during subsidence from the upper troposphere. This enrichment in heavy isotopes in the free troposphere over the SHL presumably results from injections of high-δD air from the SHL boundary layer and notably represents the largest change in humidity and isotopic composition among the four transport pathways.
- iii.
With a median δD signal of −175 ‰, North African air originating from outside the SHL region is more depleted in heavy isotopes than air of the two SHL pathways. This category (TRP AFR, 16 % occurrence frequency) reflects the transport of air subsiding from upper-level tropical Africa towards the Canary Islands. During their transport over Sahelian and tropical West Africa, where mesoscale convective systems often occur in summer, these air parcels experience only a moderate moistening and enrichment by moist convective mixing since frequent condensation and rainout deplete the vapour in heavy isotopes.
- iv.
The driest and most depleted (median ) conditions in the Canary Islands region appear during transport of air from the North Atlantic (NA, 26 % occurrence frequency). This pathway is characterised by strong subsidence of initially very dry air with a very low δD from the upper-level extratropical North Atlantic, which goes along with a moderate enrichment in heavy isotopes and slight moistening due to mixing with lower-level air. There is, however, substantial variability in NA trajectories and their isotopic composition, which is likely related to the high variability of the synoptic-scale flow in the North Atlantic storm track region.
We further demonstrated that each of the four transport pathways is associated with specific large-scale flow anomalies. Specifically, distinct geopotential height anomalies appear in the extratropical storm track region for each pathway. For the SHL BL pathway this results in a strong shift of the North African mid-level anticyclone to the north-west, which promotes the subsidence of upper-level extratropical air into the convective boundary layer of the SHL. By contrast, the TRP AFR pathway is associated with an upper-level trough over the eastern extratropical and subtropical North Atlantic, favouring the transport of air from tropical West Africa towards the Canary Islands region. The SHL FT pathway shows similar geopotential height anomalies as TRP AFR. Finally, in the NA transport regime, a strong upper-level ridge prevails over the extratropical North Atlantic and there is a strong westward shift of the North African mid-level anticyclone over the adjacent subtropical North Atlantic. This dynamical environment induces subsidence of extratropical air towards the Canary Islands and prevents North African air from reaching the islands. Overall, the results emphasise that the extratropical large-scale circulation notably influences the transport pathways over the subtropical eastern North Atlantic.
A climatological analysis of the transport pathways in the period of 1979–2018 highlights the importance of the two SHL pathways in summer and their complete absence in the extended cold season. With the climatological onset of the SHL in June, the SHL pathways become increasingly important and dominate in July and August (29 % and 20 % occurrence frequency of SHL BL and SHL FT, respectively) over the TRP AFR (16 %) and NA (35 %) pathways. In July and August 2013 (studied in detail in this paper), the occurrence frequencies of the four transport pathways are within the climatological interquartile ranges. The interannual variability in these occurrence frequencies in summer appears to be related to teleconnections (NAO and MEI; see Sect. 4.4) and to the interannual variability in the intensity of the SHL and the West African Monsoon. Given the distinct differences in the isotopic composition of the four transport pathways, water vapour isotopes might thus be regarded as an integral measure of West African dynamics.
In this study, we focused on the vertical layer between 500 and 700 hPa, where the remote sensing observations, against which we evaluated our COSMOiso simulation, have the highest sensitivity. The humidity and isotopic composition in this layer are predominantly influenced by the large-scale circulation. However, local mixing processes between the marine boundary layer and the free troposphere are still potentially important for the subtropical free-tropospheric moisture budget, in particular in the vicinity of islands where thermally driven upslope flows weaken the strong inversion at the boundary layer top (e.g. Bailey et al., 2013; González et al., 2016) and represent an interesting aspect for future studies.
Another potential limitation of this study represents the sensitivity of the SHL pathway definitions to the boundary layer height, which is difficult to diagnose and thus subject to uncertainties (e.g. Marsham et al., 2013a; Engelstaedter et al., 2015; Garcia-Carreras et al., 2015). Yet since the occurrence frequencies of the SHL BL and SHL FT transport pathways in July and August 2013 only differ by 2 % between COSMOiso and ERA-Interim, we are confident that the uncertainty in the boundary layer height is of minor importance.
Furthermore, also with explicitly resolved convection, simulations of the West African Monsoon still have substantial biases (Marsham et al., 2013b; Pante and Knippertz, 2019), for instance due to challenges associated with the correct representation of mesoscale convective systems. Hence, uncertainties in the representation of these systems might be reflected in the transport of North African air and consequently in the simulated isotopic composition in the free troposphere above the Canary Islands region. Finally, we acknowledge the limited ability of the adopted trajectory approach to represent mixing processes. Since the temporal and spatial resolution of the backward trajectories is beyond the spatiotemporal scales of convective and turbulent mixing processes, they can be only indirectly deduced from the trajectories. A future study on the relative importance of different moisture sources for the free-tropospheric humidity and isotopic composition over the (sub)tropical North Atlantic and West Africa is planned, using passive tracers that follow water evaporating from specific source regions throughout the simulation (the so-called tagging technique; Koster et al., 1986; Winschall et al., 2014).
In summary, this paper presents a comprehensive isotope modelling validation on hourly to weekly timescales with aircraft and remote sensing observations, provides new insights into the process history of the prevailing moisture transport pathways in the free troposphere over the eastern subtropical North Atlantic, and constitutes a sound framework for the interpretation of observed synoptic-scale variations in humidity and water vapour isotopes in this region.
In Sect. 3.1, we argue that the overestimated qv and δD values in COSMOiso on 30 July 2013 in the Canary Islands region most likely result from a moistening of the air by deep convection over tropical West Africa about 5 d prior to and again near the African coast 2 d prior to arrival. Figure A1 below demonstrates that COSMOiso correctly captures the transport of air from tropical West Africa but strongly overestimates the specific humidity of the air arriving at 500 hPa in the area of the MUSICA aircraft campaign. In contrast to the ERA-Interim trajectories, relatively strong moistening occurs along the COSMOiso trajectories about 2 and 5 d prior to arrival (Fig. A1b) at the positions marked in Fig. A1a.
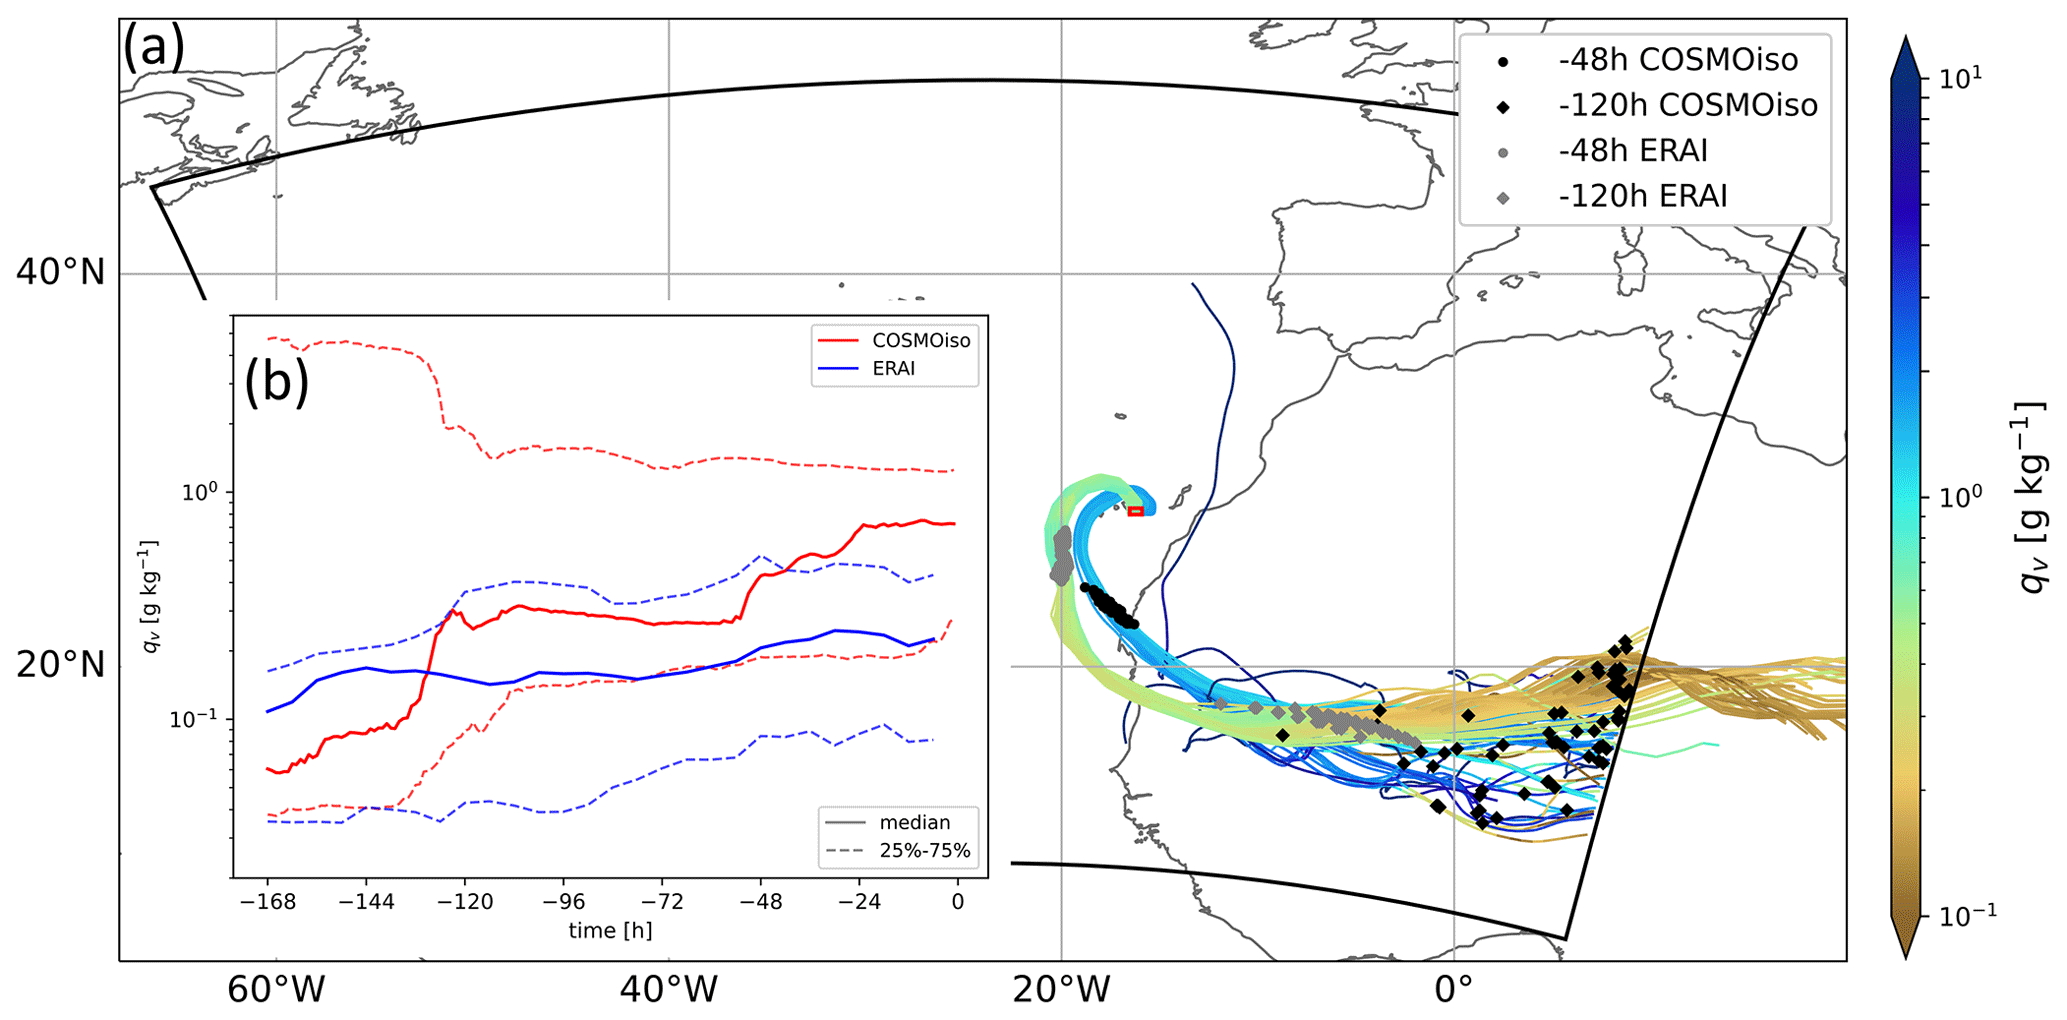
Figure A1(a) COSMOiso and ERA-Interim backward trajectories started every hour between 10:00–13:00 UTC on 30 July 2013 (corresponding to the observation period of airborne in situ measurements) from the 500 hPa level in the area of the MUSICA aircraft campaign (small red box). The trajectories are coloured according to their specific humidity qv. The skewed black box depicts the COSMOiso model domain in rotated coordinates. Dots and diamonds show the COSMOiso (black) and ERA-Interim (grey) trajectory positions 2 and 5 d before arrival. (b) Temporal evolution of qv along the COSMOiso and ERA-Interim backward trajectories displayed in (a). The red and blue solid lines represent the median of the 90 COSMOiso and ERA-Interim trajectories and the red and blue dashed lines the corresponding interquartile ranges.
In the paper, we compare a 2-month COSMOiso simulation with explicit convection of July and August 2013 to multi-platform water vapour isotope observations in order to quantitatively evaluate the performance of COSMOiso in modelling the free-tropospheric variability of humidity and isotopic composition on timescales of hours to days in contrasting atmospheric conditions over the eastern subtropical North Atlantic. We also performed a simulation with the same horizontal resolution (0.125∘) and with parameterised convection, which however led to larger model biases in comparison with airborne, ground-, and space-based observations (Fig. B1).
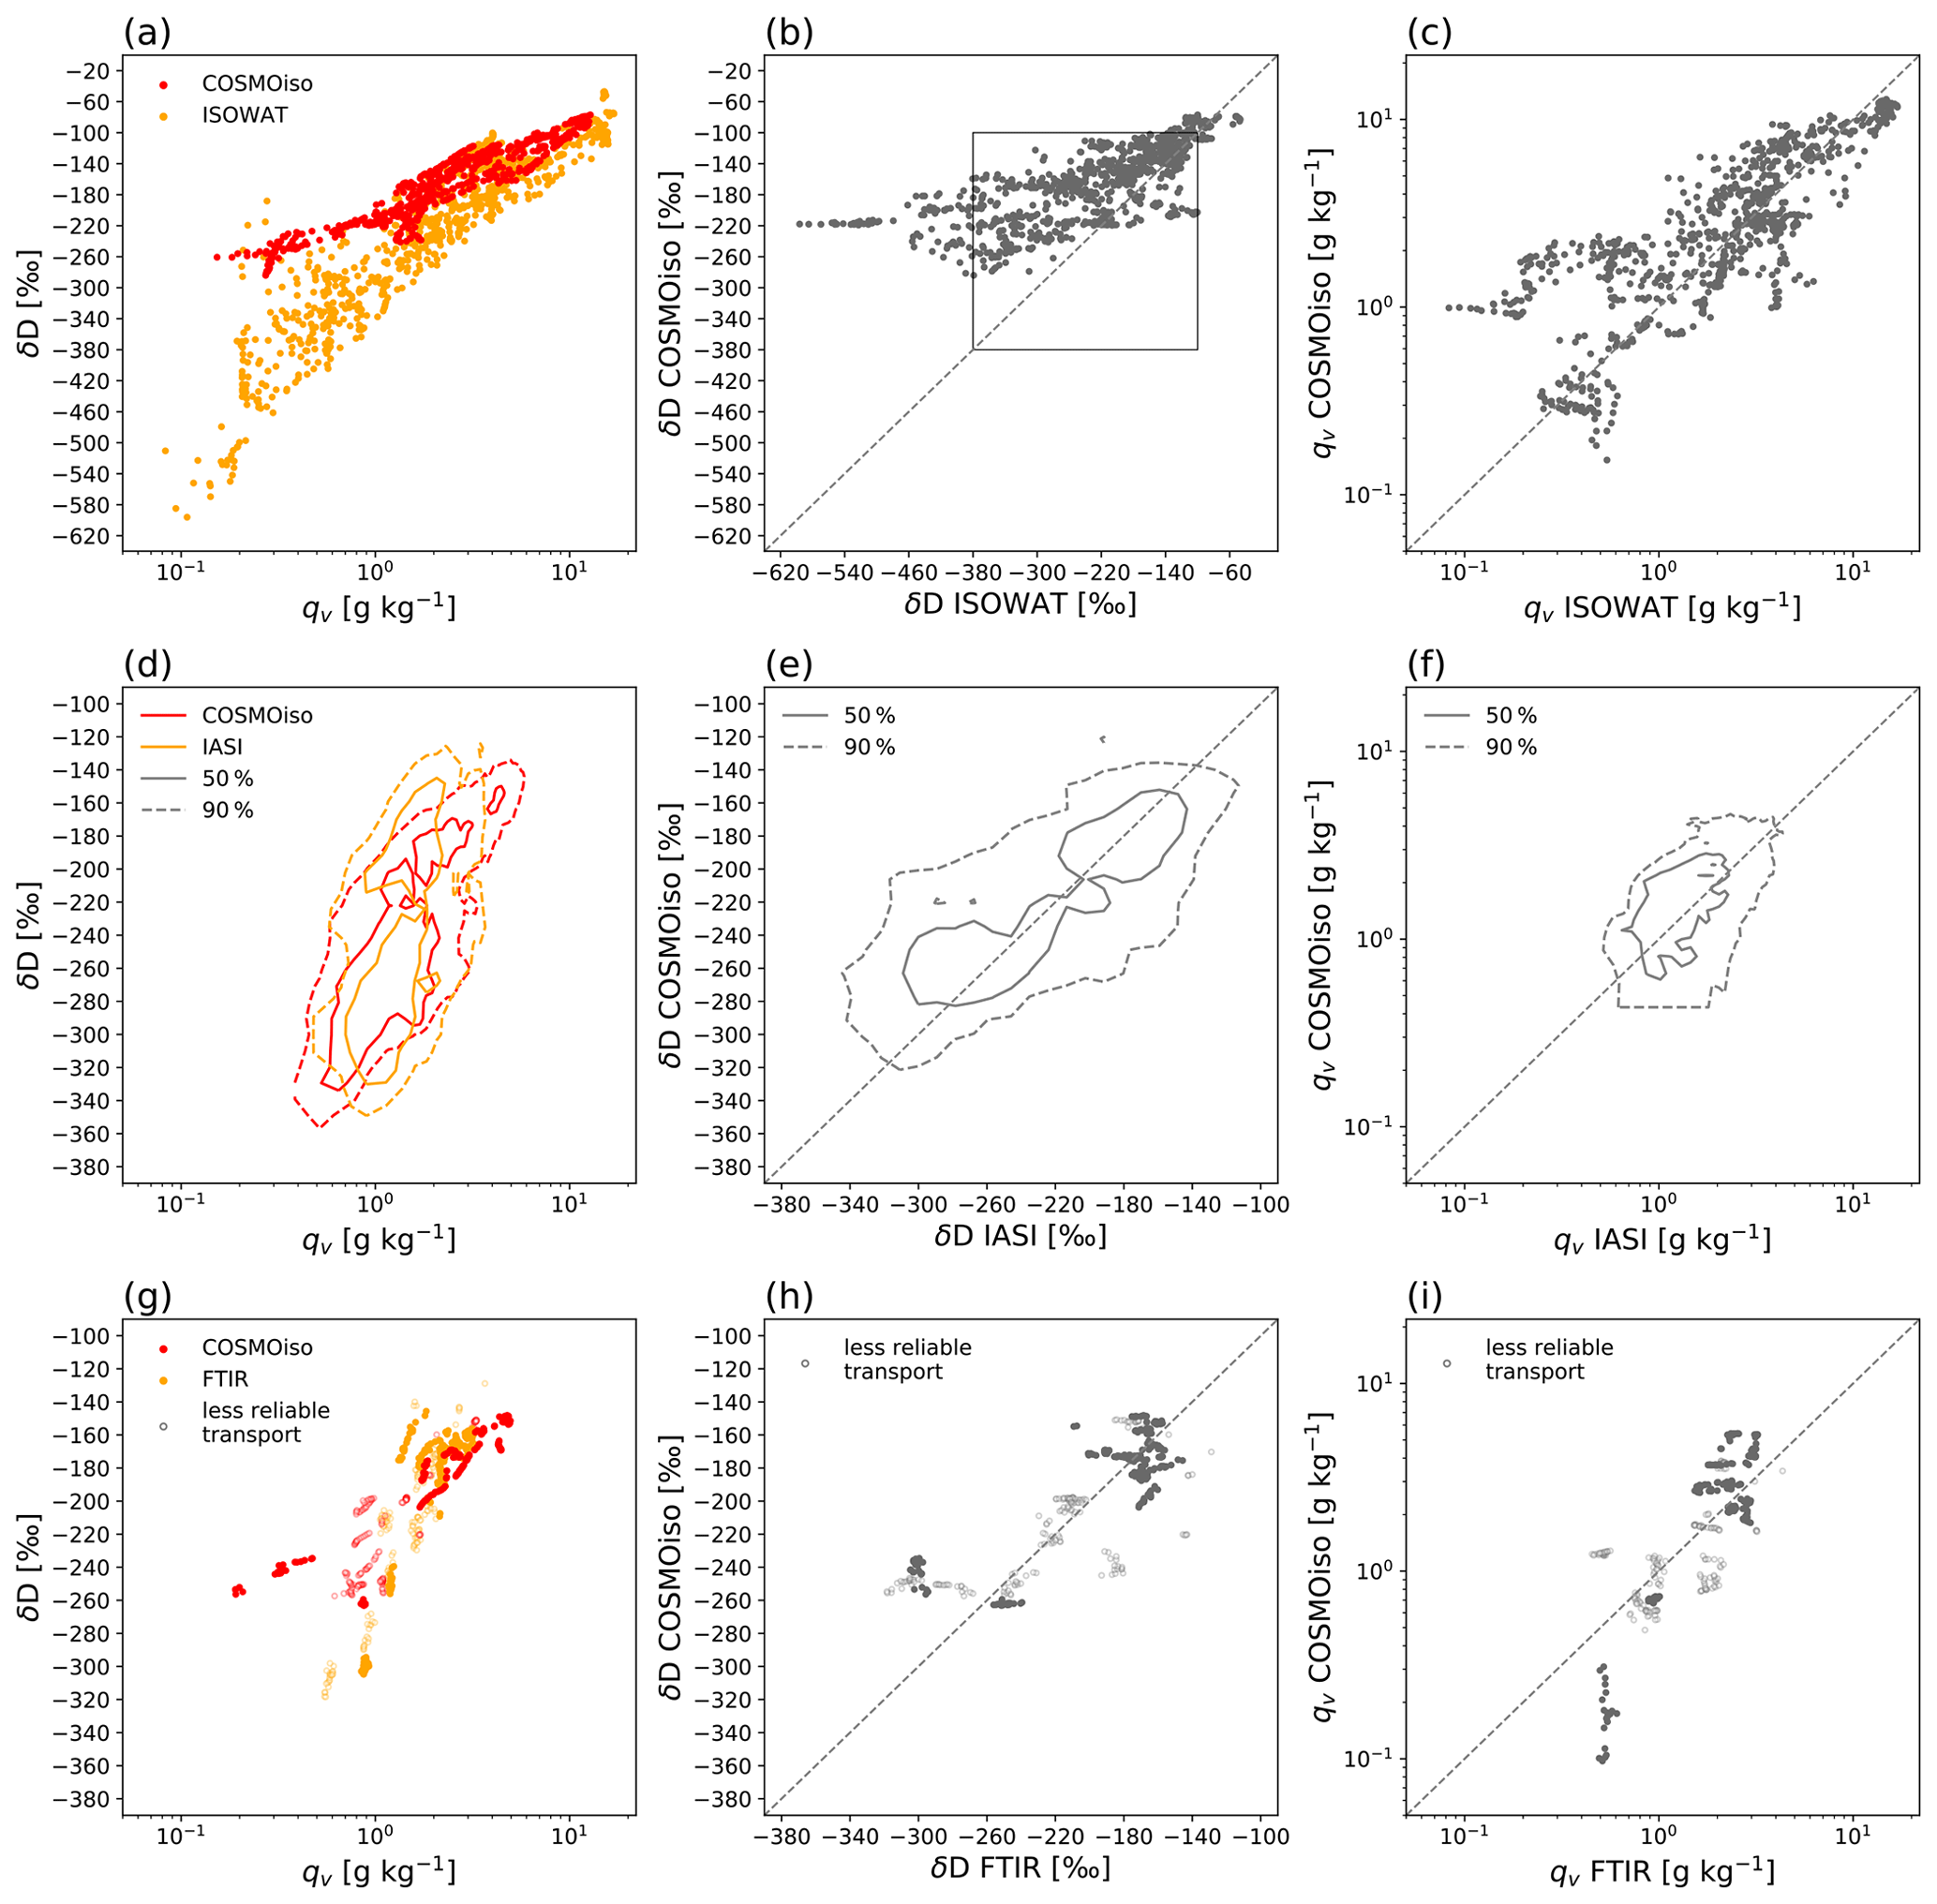
The COSMOiso simulation output is published on the ETH research collection with the DOI https://doi.org/10.3929/ethz-b-000506055 (Dahinden et al., 2021). Airborne in situ measurements can be accessed via the https://doi.org/10.35097/505 (Dyroff et al., 2021). Ground-based FTIR remote sensing observations are available under https://doi.org/10.5281/zenodo.48902 (Barthlott et al., 2016). Space-based IASI observations for July and August 2013 are published at https://doi.org/10.35097/492 (Diekmann et al., 2021c). The particular version of the COSMO model used in this study is based on the official version 4.18 with additionally implemented stable water isotope physics and is available under license (see http://www.cosmo-model.org/content/consortium/licencing.htm for more information; COSMO, 2021). COSMO may be used for operational and for research applications by the members of COSMO. Moreover, within a license agreement, the COSMO model may be used for operational and research applications by other national (hydro-)meteorological services, universities, and research institutes. The Fortran code for the trajectory calculations is available under http://iacweb.ethz.ch/staff/sprenger/lagranto/download.html (ETH Zurich, 2021).
MS provided the stable water isotope data measured during the MUSICA ISOWAT campaign and the ground-based remote sensing data (MUSICA NDACC FTIR). MS, CD, and BE provided the satellite-based remote sensing observations (MUSICA IASI) and performed the post-processing of the COSMOiso data used for the comparison with MUSICA IASI. MW provided the ECHAM5-wiso boundary data that was used for the COSMOiso simulations. FD performed the COSMOiso simulations, the model evaluation against observations, and the trajectory-based analysis. FD wrote the paper, with regular input from HW, FA, and SP. All co-authors contributed to the interpretation of the results and commented on the paper.
The authors declare that they have no conflict of interest.
Publisher's note: Copernicus Publications remains neutral with regard to jurisdictional claims in published maps and institutional affiliations.
The COSMOiso simulations were performed at the Swiss National Supercomputing Centre (CSCS) with the small production projects sm08 and sm32. Further post-processing of the COSMOiso simulations and the MUSICA IASI retrievals were performed at the supercomputer ForHLR funded by the Ministry of Science, Research and the Arts Baden-Wuerttemberg and by the German Federal Ministry of Education and Research. The authors acknowledge MeteoSwiss and ECMWF for the access to the ERA-Interim reanalyses. We thank two anonymous reviewers for their constructive and interesting comments that helped to strengthen the presentation of our results.
This paper was edited by Jan Kaiser and reviewed by two anonymous referees.
We acknowledge funding from the German–Swiss project “MOisture Transport pathways and Isotopologues in water Vapour (MOTIV)” supported by the Swiss National Science Foundation (grant no. 164721) and the Deutsche Forschungsgemeinschaft under project ID 290612604. This work strongly benefits from the project MUSICA (funded by the European Research Council under the European Community's Seventh Framework Programme (FP7/2007- 2013)/ERC grant agreement no. 256961).
Aemisegger, F., Pfahl, S., Sodemann, H., Lehner, I., Seneviratne, S. I., and Wernli, H.: Deuterium excess as a proxy for continental moisture recycling and plant transpiration, Atmos. Chem. Phys., 14, 4029–4054, https://doi.org/10.5194/acp-14-4029-2014, 2014.
Aemisegger, F., Spiegel, J. K., Pfahl, S., Sodemann, H., Eugster, W., and Wernli, H.: Isotope meteorology of cold front passages: A case study combining observations and modeling, Geophys. Res. Lett., 42, 2015GL063988, https://doi.org/10.1002/2015GL063988, 2015.
Aemisegger, F., Vogel, R., Graf, P., Dahinden, F., Villiger, L., Jansen, F., Bony, S., Stevens, B., and Wernli, H.: How Rossby wave breaking modulates the water cycle in the North Atlantic trade wind region, Weather Clim. Dynam., 2, 281–309, https://doi.org/10.5194/wcd-2-281-2021, 2021.
Bailey, A., Toohey, D., and Noone, D.: Characterizing moisture exchange between the Hawaiian convective boundary layer and free troposphere using stable isotopes in water, J. Geophys. Res.-Atmos., 118, 8208–8221, https://doi.org/10.1002/jgrd.50639, 2013.
Baldauf, M., Seifert, A., Förstner, J., Majewski, D., Raschendorfer, M., and Reinhardt, T.: Operational convective-scale numerical weather prediction with the COSMO Model: Description and sensitivities, Mon. Weather Rev., 139, 3887–3905, https://doi.org/10.1175/MWR-D-10-05013.1, 2011.
Barthlott, S., Schneider, M., Hase, F., Blumenstock, T., Mengistu Tsidu, G., Grutter de la Mora, M., Strong, K., Notholt, J., Mahieu, E., Jones, N., and Smale, D.: The ground-based MUSICA dataset: Tropospheric water vapour isotopologues (H216O, H218O and HD16O) as obtained from NDACC/FTIR solar absorption spectra, Zenodo [data set], https://doi.org/10.5281/zenodo.48902, 2016.
Barthlott, S., Schneider, M., Hase, F., Blumenstock, T., Kiel, M., Dubravica, D., García, O. E., Sepúlveda, E., Mengistu Tsidu, G., Takele Kenea, S., Grutter, M., Plaza-Medina, E. F., Stremme, W., Strong, K., Weaver, D., Palm, M., Warneke, T., Notholt, J., Mahieu, E., Servais, C., Jones, N., Griffith, D. W. T., Smale, D., and Robinson, J.: Tropospheric water vapour isotopologue data (H216O, H218O, and HD16O) as obtained from NDACC/FTIR solar absorption spectra, Earth Syst. Sci. Data, 9, 15–29, https://doi.org/10.5194/essd-9-15-2017, 2017.
Benetti, M., Reverdin, G., Pierre, C., Merlivat, L., Risi, C., Steen-Larsen, H. C., and Vimeux, F.: Deuterium excess in marine water vapor: Dependency on relative humidity and surface wind speed during evaporation, J. Geophys. Res.-Atmos., 119, 2013JD020535, https://doi.org/10.1002/2013JD020535, 2014.
Benetti, M., Aloisi, G., Reverdin, G., Risi, C., and Sèze, G.: Importance of boundary layer mixing for the isotopic composition of surface vapor over the subtropical North Atlantic Ocean, J. Geophys. Res.-Atmos., 120, 2014JD021947, https://doi.org/10.1002/2014JD021947, 2015.
Benetti, M., Lacour, J.-L., Sveinbjörnsdóttir, A. E., Aloisi, G., Reverdin, G., Risi, C., Peters, A. J., and Steen-Larsen, H. C.: A framework to study mixing processes in the marine boundary layer using water vapor isotope measurements, Geophys. Res. Lett., 45, 2524–2532, https://doi.org/10.1002/2018GL077167, 2018.
Bonne, J.-L., Behrens, M., Meyer, H., Kipfstuhl, S., Rabe, B., Schönicke, L., Steen-Larsen, H. C., and Werner, M.: Resolving the controls of water vapour isotopes in the Atlantic sector, Nat. Commun., 10, 1632, https://doi.org/10.1038/s41467-019-09242-6, 2019.
Bony, S. and Dufresne, J.-L.: Marine boundary layer clouds at the heart of tropical cloud feedback uncertainties in climate models, Geophys. Res. Lett., 32, L20806, https://doi.org/10.1029/2005GL023851, 2005.
Brown, D., Worden, J., and Noone, D.: Characteristics of tropical and subtropical atmospheric moistening derived from Lagrangian mass balance constrained by measurements of HDO and H2O, J. Geophys. Res.-Atmos., 118, 54–72, https://doi.org/10.1029/2012JD018507, 2013.
Cau, P., Methven, J., and Hoskins, B.: Origins of dry air in the tropics and subtropics, J. Climate, 20, 2745–2759, https://doi.org/10.1175/JCLI4176.1, 2007.
Christner, E., Aemisegger, F., Pfahl, S., Werner, M., Cauquoin, A., Schneider, M., Hase, F., Barthlott, S., and Schädler, G.: The climatological impacts of continental surface evaporation, rainout, and subcloud processes on δD of water vapor and precipitation in Europe, J. Geophys. Res.-Atmos., 123, 4390–4409, https://doi.org/10.1002/2017JD027260, 2018.
COSMO: COSMO model code, COSMO [code], http://www.cosmo-model.org/content/consortium/licencing.htm, last access: 20 September 2021.
Couhert, A., Schneider, T., Li, J., Waliser, D. E., and Tompkins, A. M.: The maintenance of the relative humidity of the subtropical tree troposphere, J. Climate, 23, 390–403, https://doi.org/10.1175/2009JCLI2952.1, 2010.
Craig, H.: Isotopic variations in meteoric waters, Science, 133, 1702–1703, https://doi.org/10.1126/science.133.3465.1702, 1961.
Cuevas, E., Gómez-Peláez, A. J., Rodríguez, S., Terradellas, E., Basart, S., García, R. D., García, O. E., and Alonso-Pérez, S.: The pulsating nature of large-scale Saharan dust transport as a result of interplays between mid-latitude Rossby waves and the North African dipole intensity, Atmos. Environ., 167, 586–602, https://doi.org/10.1016/j.atmosenv.2017.08.059, 2017.
Dahinden, F., Aemisegger, F., Pfahl, S., and Wernli, H.: Numerical weather simulation using COSMOiso over the eastern subtropical North Atlantic in July and August 2013, Research Collection, ETH Zurich [data set], https://doi.org/10.3929/ethz-b-000506055, 2021.
Dansgaard, W.: Stable isotopes in precipitation, Tellus, 16, 436–468, https://doi.org/10.3402/tellusa.v16i4.8993, 1964.
Dee, D. P., Uppala, S. M., Simmons, A. J., Berrisford, P., Poli, P., Kobayashi, S., Andrae, U., Balmaseda, M. A., Balsamo, G., Bauer, P., Bechtold, P., Beljaars, A. C. M., van de Berg, L., Bidlot, J., Bormann, N., Delsol, C., Dragani, R., Fuentes, M., Geer, A. J., Haimberger, L., Healy, S. B., Hersbach, H., Hólm, E. V., Isaksen, L., Kållberg, P., Köhler, M., Matricardi, M., McNally, A. P., Monge-Sanz, B. M., Morcrette, J.-J., Park, B.-K., Peubey, C., de Rosnay, P., Tavolato, C., Thépaut, J.-N., and Vitart, F.: The ERA-Interim reanalysis: Configuration and performance of the data assimilation system, Q. J. Roy. Meteor. Soc., 137, 553–597, https://doi.org/10.1002/qj.828, 2011.
Diekmann, C. J.: Analysis of stable water isotopes in tropospheric moisture during the West African monsoon, PhD thesis, Karlsruher Institut für Technologie (KIT), https://doi.org/10.5445/IR/1000134744, 2021.
Diekmann, C. J., Schneider, M., Knippertz, P., de Vries, A. J., Pfahl, S., Aemisegger, F., Dahinden, F., Ertl, B., Khosrawi, F., Wernli, H., and Braesicke, P.: A Lagrangian perspective on stable water isotopes during the West African monsoon, J. Geophys. Res.-Atmos., https://doi.org/10.1029/2021JD034895, 2021a.
Diekmann, C. J., Schneider, M., Ertl, B., Hase, F., García, O., Khosrawi, F., Sepúlveda, E., Knippertz, P., and Braesicke, P.: The MUSICA IASI {H2O,δD} pair product, Earth Syst. Sci. Data Discuss. [preprint], https://doi.org/10.5194/essd-2021-87, in review, 2021b.
Diekmann, C. J., Schneider, M., and Ertl, B.: Data for “Disentangling different moisture transport pathways over the eastern subtropical North Atlantic using multi-platform isotope observations and high-resolution numerical modelling”, Institute of Meteorology and Climate Research, Atmospheric Trace Gases and Remote Sensing (IMK-ASF), Karlsruhe Institute of Technology (KIT) [data set], https://doi.org/10.35097/492, 2021c.
Dütsch, M., Pfahl, S., and Wernli, H.: Drivers of δ2H variations in an idealized extratropical cyclone, Geophys. Res. Lett., 43, 2016GL068600, https://doi.org/10.1002/2016GL068600, 2016.
Dütsch, M., Pfahl, S., Meyer, M., and Wernli, H.: Lagrangian process attribution of isotopic variations in near-surface water vapour in a 30 year regional climate simulation over Europe, Atmos. Chem. Phys., 18, 1653–1669, https://doi.org/10.5194/acp-18-1653-2018, 2018.
Dütsch, M. L.: Stable water isotope fractionation processes in weather systems and their influence on isotopic variability on different time scales, PhD thesis, ETH Zurich, https://doi.org/10.3929/ethz-b-000000058, 2016.
Dyroff, C., Sanati, S., Christner, E., Zahn, A., Balzer, M., Bouquet, H., McManus, J. B., González-Ramos, Y., and Schneider, M.: Airborne in situ vertical profiling of in the subtropical troposphere during the MUSICA remote sensing validation campaign, Atmos. Meas. Tech., 8, 2037–2049, https://doi.org/10.5194/amt-8-2037-2015, 2015.
Engelstaedter, S., Washington, R., Flamant, C., Parker, D. J., Allen, C. J. T., and Todd, M. C.: The Saharan heat low and moisture transport pathways in the central Sahara-Multiaircraft observations and Africa-LAM evaluation, J. Geophys. Res.-Atmos., 120, 4417–4442, https://doi.org/10.1002/2015JD023123, 2015.
ETH Zurich: LAGRANTO model code, ETH Zurich [code], http://iacweb.ethz.ch/staff/sprenger/lagranto/download.html, last access: 20 September 2021.
Dyroff, C., Christner, E., and Schneider, M.: MUSICA ISOWAT-II water isotopologue data. Institute of Meteorology and Climate Research, Atmospheric Trace Gases and Remote Sensing (IMK-ASF), Karlsruhe Institute of Technology (KIT) [data set], https://doi.org/10.35097/505, 2021.
Fink, A. H., Engel, T., Ermert, V., van der Linden, R., Schneidewind, M., Redl, R., Afiesimama, E., Thiaw, W. M., Yorke, C., Evans, M., and Janicot, S.: Mean climate and seasonal cycle, in: Meteorology of tropical West Africa, edited by: Parker, D. J. and Diop-Kane, M., John Wiley & Sons, Ltd, Chichester, UK, 1–39, https://doi.org/10.1002/9781118391297.ch1, 2017.
Frankenberg, C., Yoshimura, K., Warneke, T., Aben, I., Butz, A., Deutscher, N., Griffith, D., Hase, F., Notholt, J., Schneider, M., Schrijver, H., and Rockmann, T.: Dynamic processes governing lower-tropospheric ratios as observed from space and ground, Science, 325, 1374–1377, https://doi.org/10.1126/science.1173791, 2009.
Fröhlich, L. and Knippertz, P.: Identification and global climatology of upper-level troughs at low latitudes, Meteorol. Z., 17, 565–573, https://doi.org/10.1127/0941-2948/2008/0320, 2008.
Galewsky, J.: Relationships between inversion strength, lower-tropospheric moistening, and low-cloud fraction in the subtropical southeast Pacific derived from stable isotopologues of water vapor, Geophys. Res. Lett., 45, 7701–7710, https://doi.org/10.1029/2018GL078953, 2018a.
Galewsky, J.: Using stable isotopes in water vapor to diagnose relationships between lower-tropospheric stability, mixing, and low-cloud cover near the island of Hawaii, Geophys. Res. Lett., 45, 297–305, https://doi.org/10.1002/2017GL075770, 2018b.
Galewsky, J. and Hurley, J. V.: An advection-condensation model for subtropical water vapor isotopic ratios, J. Geophys. Res., 115, D16116, https://doi.org/10.1029/2009JD013651, 2010.
Galewsky, J., Sobel, A., and Held, I.: Diagnosis of subtropical humidity dynamics using tracers of last saturation, J. Atmos. Sci., 62, 3353–3367, https://doi.org/10.1175/JAS3533.1, 2005.
Galewsky, J., Strong, M., and Sharp, Z. D.: Measurements of water vapor D/H ratios from Mauna Kea, Hawaii, and implications for subtropical humidity dynamics, Geophys. Res. Lett., 34, L22808, https://doi.org/10.1029/2007GL031330, 2007.
Galewsky, J., Steen-Larsen, H. C., Field, R. D., Worden, J., Risi, C., and Schneider, M.: Stable isotopes in atmospheric water vapor and applications to the hydrologic cycle, Rev. Geophys., 54, 2015RG000512, https://doi.org/10.1002/2015RG000512, 2016.
Garcia-Carreras, L., Parker, D. J., Marsham, J. H., Rosenberg, P. D., Brooks, I. M., Lock, A. P., Marenco, F., McQuaid, J. B., and Hobby, M.: The turbulent structure and diurnal growth of the Saharan atmospheric boundary layer, J. Atmos. Sci., 72, 693–713, https://doi.org/10.1175/JAS-D-13-0384.1, 2015.
Gat, J. R.: Oxygen and hydrogen isotopes in the hydrologic cycle, Annu. Rev. Earth Pl. Sc., 24, 225–262, https://doi.org/10.1146/annurev.earth.24.1.225, 1996.
González, Y., Schneider, M., Dyroff, C., Rodríguez, S., Christner, E., García, O. E., Cuevas, E., Bustos, J. J., Ramos, R., Guirado-Fuentes, C., Barthlott, S., Wiegele, A., and Sepúlveda, E.: Detecting moisture transport pathways to the subtropical North Atlantic free troposphere using paired H2O-δD in situ measurements, Atmos. Chem. Phys., 16, 4251–4269, https://doi.org/10.5194/acp-16-4251-2016, 2016.
Held, I. M. and Soden, B. J.: Water vapor feedback and global warming, Annu. Rev. Energ. Env., 25, 441–475, https://doi.org/10.1146/annurev.energy.25.1.441, 2000.
IAEA: International Atomic Energy Agency: Reference sheet for VSMOW2 and SLAP2 international measurement standards, IAEA, Vienna, 2017.
Knippertz, P.: Tropical–extratropical interactions causing precipitation in Northwest Africa: Statistical analysis and seasonal variations, Mon. Weather Rev., 131, 3069–3076, https://doi.org/10.1175/1520-0493(2003)131<3069:TICPIN>2.0.CO;2, 2003.
Knippertz, P., Fink, A. H., Reiner, A., and Speth, P.: Three late summer/early autumn cases of tropical–extratropical interactions causing precipitation in Northwest Africa, Mon. Weather Rev., 131, 116–135, https://doi.org/10.1175/1520-0493(2003)131<0116:TLSEAC>2.0.CO;2, 2003.
Knippertz, P., Wernli, H., and Gläser, G.: A global climatology of tropical moisture exports, J. Climate, 26, 3031–3045, https://doi.org/10.1175/JCLI-D-12-00401.1, 2013.
Koster, R., Jouzel, J., Suozzo, R., Russell, G., Broecker, W., Rind, D., and Eagleson, P.: Global sources of local precipitation as determined by the NASA/GISS GCM, Geophys. Res. Lett., 13, 121–124, https://doi.org/10.1029/GL013i002p00121, 1986.
Lacour, J.-L., Risi, C., Clarisse, L., Bony, S., Hurtmans, D., Clerbaux, C., and Coheur, P.-F.: Mid-tropospheric δD observations from IASI/MetOp at high spatial and temporal resolution, Atmos. Chem. Phys., 12, 10817–10832, https://doi.org/10.5194/acp-12-10817-2012, 2012.
Lacour, J.-L., Flamant, C., Risi, C., Clerbaux, C., and Coheur, P.-F.: Importance of the Saharan heat low in controlling the North Atlantic free tropospheric humidity budget deduced from IASI δD observations, Atmos. Chem. Phys., 17, 9645–9663, https://doi.org/10.5194/acp-17-9645-2017, 2017.
Lavaysse, C., Flamant, C., Janicot, S., Parker, D. J., Lafore, J.-P., Sultan, B., and Pelon, J.: Seasonal evolution of the West African heat low: A climatological perspective, Clim. Dynam., 33, 313–330, https://doi.org/10.1007/s00382-009-0553-4, 2009.
Lavaysse, C., Flamant, C., Janicot, S., and Knippertz, P.: Links between African easterly waves, midlatitude circulation and intraseasonal pulsations of the West African heat low, Q. J. Roy. Meteor. Soc., 136, 141–158, https://doi.org/10.1002/qj.555, 2010a.
Lavaysse, C., Flamant, C., and Janicot, S.: Regional-scale convection patterns during strong and weak phases of the Saharan heat low, Atmos. Sci. Lett., 11, 255–264, https://doi.org/10.1002/asl.284, 2010b.
Lee, J., Worden, J., Noone, D., Bowman, K., Eldering, A., LeGrande, A., Li, J.-L. F., Schmidt, G., and Sodemann, H.: Relating tropical ocean clouds to moist processes using water vapor isotope measurements, Atmos. Chem. Phys., 11, 741–752, https://doi.org/10.5194/acp-11-741-2011, 2011.
Marsham, J. H., Hobby, M., Allen, C. J. T., Banks, J. R., Bart, M., Brooks, B. J., Cavazos-Guerra, C., Engelstaedter, S., Gascoyne, M., Lima, A. R., Martins, J. V., McQuaid, J. B., O'Leary, A., Ouchene, B., Ouladichir, A., Parker, D. J., Saci, A., Salah-Ferroudj, M., Todd, M. C., and Washington, R.: Meteorology and dust in the central Sahara: Observations from Fennec supersite-1 during the June 2011 intensive observation period, J. Geophys. Res.-Atmos., 118, 4069–4089, https://doi.org/10.1002/jgrd.50211, 2013a.
Marsham, J. H., Dixon, N. S., Garcia-Carreras, L., Lister, G. M. S., Parker, D. J., Knippertz, P., and Birch, C. E.: The role of moist convection in the West African monsoon system: Insights from continental-scale convection-permitting simulations, Geophys. Res. Lett., 40, 1843–1849, https://doi.org/10.1002/grl.50347, 2013b.
Messager, C., Parker, D. J., Reitebuch, O., Agusti-Panareda, A., Taylor, C. M., and Cuesta, J.: Structure and dynamics of the Saharan atmospheric boundary layer during the West African monsoon onset: Observations and analyses from the research flights of 14 and 17 July 2006, Q. J. Roy. Meteor. Soc., 136, 107–124, https://doi.org/10.1002/qj.469, 2010.
Noone, D.: Pairing measurements of the water vapor isotope ratio with humidity to deduce atmospheric moistening and dehydration in the tropical midtroposphere, J. Climate, 25, 4476–4494, https://doi.org/10.1175/JCLI-D-11-00582.1, 2012.
Noone, D., Galewsky, J., Sharp, Z. D., Worden, J., Barnes, J., Baer, D., Bailey, A., Brown, D. P., Christensen, L., Crosson, E., Dong, F., Hurley, J. V., Johnson, L. R., Strong, M., Toohey, D., Van Pelt, A., and Wright, J. S.: Properties of air mass mixing and humidity in the subtropics from measurements of the isotope ratio of water vapor at the Mauna Loa observatory, J. Geophys. Res., 116, D22113, https://doi.org/10.1029/2011JD015773, 2011.
Pante, G. and Knippertz, P.: Resolving Sahelian thunderstorms improves mid-latitude weather forecasts, Nat. Commun., 10, 3487, https://doi.org/10.1038/s41467-019-11081-4, 2019.
Papin, P. P., Bosart, L. F., and Torn, R. D.: A feature-based approach to classifying summertime potential vorticity streamers linked to Rossby wave breaking in the North Atlantic basin, J. Climate, 33, 5953–5969, https://doi.org/10.1175/JCLI-D-19-0812.1, 2020.
Pearson, K. J., Lister, G. M. S., Birch, C. E., Allan, R. P., Hogan, R. J., and Woolnough, S. J.: Modelling the diurnal cycle of tropical convection across the “grey zone”: Modelling the diurnal cycle of tropical convection, Q. J. Roy. Meteor. Soc., 140, 491–499, https://doi.org/10.1002/qj.2145, 2014.
Pfahl, S., Wernli, H., and Yoshimura, K.: The isotopic composition of precipitation from a winter storm – a case study with the limited-area model COSMOiso, Atmos. Chem. Phys., 12, 1629–1648, https://doi.org/10.5194/acp-12-1629-2012, 2012.
Pierrehumbert, R. T. and Roca, R.: Evidence for control of Atlantic subtropical humidity by large scale advection, Geophys. Res. Lett., 25, 4537–4540, https://doi.org/10.1029/1998GL900203, 1998.
Risi, C., Bony, S., and Vimeux, F.: Influence of convective processes on the isotopic composition (δ18O and δD) of precipitation and water vapor in the tropics: 2. Physical interpretation of the amount effect, J. Geophys. Res., 113, D19306, https://doi.org/10.1029/2008JD009943, 2008.
Risi, C., Bony, S., Vimeux, F., Chong, M., and Descroix, L.: Evolution of the stable water isotopic composition of the rain sampled along Sahelian squall lines, Q. J. Roy. Meteor. Soc., 136, 227–242, https://doi.org/10.1002/qj.485, 2010a.
Risi, C., Bony, S., Vimeux, F., Frankenberg, C., Noone, D., and Worden, J.: Understanding the Sahelian water budget through the isotopic composition of water vapor and precipitation, J. Geophys. Res., 115, D24110, https://doi.org/10.1029/2010JD014690, 2010b.
Risi, C., Bony, S., Vimeux, F., and Jouzel, J.: Water-stable isotopes in the LMDZ4 general circulation model: Model evaluation for present-day and past climates and applications to climatic interpretations of tropical isotopic records, J. Geophys. Res., 115, D12118, https://doi.org/10.1029/2009JD013255, 2010c.
Risi, C., Noone, D., Worden, J., Frankenberg, C., Stiller, G., Kiefer, M., Funke, B., Walker, K., Bernath, P., Schneider, M., Bony, S., Lee, J., Brown, D., and Sturm, C.: Process-evaluation of tropospheric humidity simulated by general circulation models using water vapor isotopic observations: 2. Using isotopic diagnostics to understand the mid and upper tropospheric moist bias in the tropics and subtropics, J. Geophys. Res., 117, D05304, https://doi.org/10.1029/2011JD016623, 2012a.
Risi, C., Noone, D., Worden, J., Frankenberg, C., Stiller, G., Kiefer, M., Funke, B., Walker, K., Bernath, P., Schneider, M., Wunch, D., Sherlock, V., Deutscher, N., Griffith, D., Wennberg, P. O., Strong, K., Smale, D., Mahieu, E., Barthlott, S., Hase, F., García, O., Notholt, J., Warneke, T., Toon, G., Sayres, D., Bony, S., Lee, J., Brown, D., Uemura, R., and Sturm, C.: Process-evaluation of tropospheric humidity simulated by general circulation models using water vapor isotopologues: 1. Comparison between models and observations, J. Geophys. Res., 117, D05303, https://doi.org/10.1029/2011JD016621, 2012b.
Rodríguez, S., Cuevas, E., Prospero, J. M., Alastuey, A., Querol, X., López-Solano, J., García, M. I., and Alonso-Pérez, S.: Modulation of Saharan dust export by the North African dipole, Atmos. Chem. Phys., 15, 7471–7486, https://doi.org/10.5194/acp-15-7471-2015, 2015.
Schmidt, G. A., Ruedy, R. A., Miller, R. L., and Lacis, A. A.: Attribution of the present-day total greenhouse effect, J. Geophys. Res., 115, D20106, https://doi.org/10.1029/2010JD014287, 2010.
Schneider, M. and Hase, F.: Optimal estimation of tropospheric H2O and δD with IASI/METOP, Atmos. Chem. Phys., 11, 11207–11220, https://doi.org/10.5194/acp-11-11207-2011, 2011.
Schneider, M., Barthlott, S., Hase, F., González, Y., Yoshimura, K., García, O. E., Sepúlveda, E., Gomez-Pelaez, A., Gisi, M., Kohlhepp, R., Dohe, S., Blumenstock, T., Wiegele, A., Christner, E., Strong, K., Weaver, D., Palm, M., Deutscher, N. M., Warneke, T., Notholt, J., Lejeune, B., Demoulin, P., Jones, N., Griffith, D. W. T., Smale, D., and Robinson, J.: Ground-based remote sensing of tropospheric water vapour isotopologues within the project MUSICA, Atmos. Meas. Tech., 5, 3007–3027, https://doi.org/10.5194/amt-5-3007-2012, 2012.
Schneider, M., González, Y., Dyroff, C., Christner, E., Wiegele, A., Barthlott, S., García, O. E., Sepúlveda, E., Hase, F., Andrey, J., Blumenstock, T., Guirado, C., Ramos, R., and Rodríguez, S.: Empirical validation and proof of added value of MUSICA's tropospheric δD remote sensing products, Atmos. Meas. Tech., 8, 483–503, https://doi.org/10.5194/amt-8-483-2015, 2015.
Schneider, M., Wiegele, A., Barthlott, S., González, Y., Christner, E., Dyroff, C., García, O. E., Hase, F., Blumenstock, T., Sepúlveda, E., Mengistu Tsidu, G., Takele Kenea, S., Rodríguez, S., and Andrey, J.: Accomplishments of the MUSICA project to provide accurate, long-term, global and high-resolution observations of tropospheric {H2O, δD} pairs – a review, Atmos. Meas. Tech., 9, 2845–2875, https://doi.org/10.5194/amt-9-2845-2016, 2016.
Schneider, M., Borger, C., Wiegele, A., Hase, F., García, O. E., Sepúlveda, E., and Werner, M.: MUSICA MetOp/IASI {H2O, δD} pair retrieval simulations for validating tropospheric moisture pathways in atmospheric models, Atmos. Meas. Tech., 10, 507–525, https://doi.org/10.5194/amt-10-507-2017, 2017.
Schneider, M., Ertl, B., Diekmann, C. J., Khosrawi, F., Weber, A., Hase, F., Höpfner, M., García, O. E., Sepúlveda, E., and Kinnison, D.: Design and description of the MUSICA IASI full retrieval product, Earth Syst. Sci. Data Discuss. [preprint], https://doi.org/10.5194/essd-2021-75, in review, 2021.
Schubert-Frisius, M., Feser, F., von Storch, H., and Rast, S.: Optimal spectral nudging for global dynamic downscaling, Mon. Weather Rev., 145, 909–927, https://doi.org/10.1175/MWR-D-16-0036.1, 2017.
Sodemann, H., Aemisegger, F., Pfahl, S., Bitter, M., Corsmeier, U., Feuerle, T., Graf, P., Hankers, R., Hsiao, G., Schulz, H., Wieser, A., and Wernli, H.: The stable isotopic composition of water vapour above Corsica during the HyMeX SOP1 campaign: Insight into vertical mixing processes from lower-tropospheric survey flights, Atmos. Chem. Phys., 17, 6125–6151, https://doi.org/10.5194/acp-17-6125-2017, 2017.
Sprenger, M. and Wernli, H.: The LAGRANTO Lagrangian analysis tool – version 2.0, Geosci. Model Dev., 8, 2569–2586, https://doi.org/10.5194/gmd-8-2569-2015, 2015.
Steen-Larsen, H. C., Sveinbjörnsdottir, A. E., Peters, A. J., Masson-Delmotte, V., Guishard, M. P., Hsiao, G., Jouzel, J., Noone, D., Warren, J. K., and White, J. W. C.: Climatic controls on water vapor deuterium excess in the marine boundary layer of the North Atlantic based on 500 days of in situ, continuous measurements, Atmos. Chem. Phys., 14, 7741–7756, https://doi.org/10.5194/acp-14-7741-2014, 2014.
Stephens, G. L.: Cloud feedbacks in the climate system: A critical review, J. Climate, 18, 237–273, https://doi.org/10.1175/JCLI-3243.1, 2005.
Steppeler, J., Doms, G., Schättler, U., Bitzer, H. W., Gassmann, A., Damrath, U., and Gregoric, G.: Meso-gamma scale forecasts using the nonhydrostatic model LM, Meteorol. Atmos. Phys., 82, 75–96, https://doi.org/10.1007/s00703-001-0592-9, 2003.
Sturm, K., Hoffmann, G., Langmann, B., and Stichler, W.: Simulation of δ18O in precipitation by the regional circulation model REMOiso, Hydrol. Process., 19, 3425–3444, https://doi.org/10.1002/hyp.5979, 2005.
Sultan, B. and Janicot, S.: The West African monsoon dynamics. Part II: The “preonset” and “onset” of the summer monsoon, J. Climate, 16, 3407–3427, https://doi.org/10.1175/1520-0442(2003)016<3407:TWAMDP>2.0.CO;2, 2003.
Sun, D.-Z. and Lindzen, R. S.: Distribution of tropical tropospheric water vapor, J. Atmos. Sci., 50, 1643–1660, https://doi.org/10.1175/1520-0469(1993)050<1643:DOTTWV>2.0.CO;2, 1993.
Thorncroft, C. D. and Blackburn, M.: Maintenance of the African easterly jet, Q. J. Roy. Meteor. Soc., 125, 763–786, https://doi.org/10.1002/qj.49712555502, 1999.
Thurnherr, I., Kozachek, A., Graf, P., Weng, Y., Bolshiyanov, D., Landwehr, S., Pfahl, S., Schmale, J., Sodemann, H., Steen-Larsen, H. C., Toffoli, A., Wernli, H., and Aemisegger, F.: Meridional and vertical variations of the water vapour isotopic composition in the marine boundary layer over the Atlantic and Southern Ocean, Atmos. Chem. Phys., 20, 5811–5835, https://doi.org/10.5194/acp-20-5811-2020, 2020.
von Storch, H., Langenberg, H., and Feser, F.: A spectral nudging technique for dynamical downscaling purposes, Mon. Weather Rev., 128, 3664–3673, https://doi.org/10.1175/1520-0493(2000)128<3664:ASNTFD>2.0.CO;2, 2000.
Werner, M., Langebroek, P. M., Carlsen, T., Herold, M., and Lohmann, G.: Stable water isotopes in the ECHAM5 general circulation model: Toward high-resolution isotope modeling on a global scale, J. Geophys. Res., 116, D15109, https://doi.org/10.1029/2011JD015681, 2011.
Wernli, H. and Davies, H. C.: A Lagrangian-based analysis of extratropical cyclones. I: The method and some applications, Q. J. Roy. Meteor. Soc., 123, 467–489, https://doi.org/10.1002/qj.49712353811, 1997.
Winschall, A., Pfahl, S., Sodemann, H., and Wernli, H.: Comparison of Eulerian and Lagrangian moisture source diagnostics – the flood event in eastern Europe in May 2010, Atmos. Chem. Phys., 14, 6605–6619, https://doi.org/10.5194/acp-14-6605-2014, 2014.
Worden, J., Bowman, K., Noone, D., Beer, R., Clough, S., Eldering, A., Fisher, B., Goldman, A., Gunson, M., Herman, R., Kulawik, S. S., Lampel, M., Luo, M., Osterman, G., Rinsland, C., Rodgers, C., Sander, S., Shephard, M., and Worden, H.: Tropospheric emission spectrometer observations of the tropospheric ratio: Estimation approach and characterization, J. Geophys. Res., 111, D16309, https://doi.org/10.1029/2005JD006606, 2006.
Yang, H. and Pierrehumbert, R. T.: Production of dry air by isentropic mixing, J. Atmos. Sci., 51, 3437–3454, https://doi.org/10.1175/1520-0469(1994)051<3437:PODABI>2.0.CO;2, 1994.
Yoshimura, K., Kanamitsu, M., and Dettinger, M.: Regional downscaling for stable water isotopes: A case study of an atmospheric river event, J. Geophys. Res., 115, D18114, https://doi.org/10.1029/2010JD014032, 2010.
Data downloaded from the NOAA Physical Sciences Laboratory: https://psl.noaa.gov/data/climateindices/list/ (last access: 20 August 2021).
- Abstract
- Introduction
- Data and methods
- Comparison of the COSMOiso simulation with multi-platform isotope observations
- Free-tropospheric moisture transport pathways over the eastern subtropical North Atlantic
- Summary and conclusions
- Appendix A: COSMOiso and ERA-Interim backward trajectories for 30 July 2013
- Appendix B: Comparison of a COSMOiso simulation with parameterised convection to multi-platform isotope observations
- Code and data availability
- Author contributions
- Competing interests
- Disclaimer
- Acknowledgements
- Review statement
- Financial support
- References