the Creative Commons Attribution 4.0 License.
the Creative Commons Attribution 4.0 License.
 | 02 Nov 2021
Impact of hygroscopic seeding on the initiation of precipitation formation: results of a hybrid bin microphysics parcel model
Istvan Geresdi
Sisi Chen
Youssef Wehbe
Roelof Bruintjes
Jared A. Lee
Roy M. Rasmussen
Wojciech W. Grabowski
Noemi Sarkadi
Sarah A. Tessendorf
A hybrid bin microphysical scheme is developed in a parcel model framework to study how natural aerosol particles and different types of hygroscopic seeding materials affect the precipitation formation. A novel parameter is introduced to describe the impact of different seeding particles on the evolution of the drop size distribution. The results of more than 100 numerical experiments using the hybrid bin parcel model show that (a) the Ostwald-ripening effect has a substantial contribution to the broadening of the drop size distribution near the cloud base. The efficiency of this effect increases as the updraft velocity decreases. (b) The efficiency of hygroscopic seeding is significant only if the size of the seeding particles is in the coarse particle size range. The presence of the water-soluble background coarse particles reduces the efficiency of the seeding, (c) The efficient broadening of the size distribution due to the seeding depends on the width of the size distribution of water drops in the control cases, but the relation is not as straightforward as in the case of the glaciogenic seeding.
- Article
(1522 KB) - Full-text XML
- BibTeX
- EndNote


The concept of hygroscopic seeding is based on the hypothesis that the hygroscopic seeding accelerates precipitation formation by suppressing the activation of the natural less hygroscopic particles, and/or by promoting the formation of larger water drops directly (Mather et al., 1997; Cooper et al., 1997). The seeding particles become activated at lower supersaturation due to their higher hygroscopicity and larger size compared to background cloud condensation nuclei (CCN). The drops formed on the seeding particles grow quickly even under the cloud base. Some seeding particles such as the core–shell NaCl–TiO2 particles engineered by nanotechnology deliquesce at a relative humidity of 50 % (Tai et al., 2017), while particles with low hygroscopicity deliquesce at significantly higher relative humidity (Brooks et al., 2002).
Because in the subsaturated and near-saturated environment the integration of the diffusional growth equation of aerosols is rather time-consuming in most of the numerical models, even in the relatively simple parcel model (e.g., Cooper et al., 1997), the nucleation process is often parameterized. Different techniques are available to estimate the droplet spectra just after the activation. In most bin microphysical models, only the number of the activated CCN particles is calculated. All activated droplets are put into one bin (e.g., Rasmussen et al., 2002), or distributed over multiple bins using a prescribed function (Reisin et al., 1996). Kogan (1991) presented a method for evaluating the droplet spectra at the cloud base by using prescribed growth factors. This method was used by Yin et al. (2000) and Xue et al. (2010, 2012).
A general finding about hygroscopic seeding is that the seeding efficiency is proportional to the size of the seeding particles (Cooper et al., 1997; Yin et al., 2000; Kuba and Murakami, 2010). These numerical studies found negligible effects if the radius of seeding particles is less than 1 µm and strong effects if the size is around 10 µm. In these models, the seeding particles are assumed to be some types of salts with a hygroscopicity parameter (κ) from 0.6 to 1.2. Tessendorf et al. (2021) ran a parcel model to study the impact of the hygroscopic flare seeding in the Queensland Cloud Seeding Research Program (QCSRP; Tessendorf et al., 2012). They found pronounced seeding effects in continentally influenced cloud conditions. Tai et al. (2017) introduced a novel hygroscopic material (NaCl–TiO2) engineered and produced by nanotechnology. These particles are henceforth referred to as “nanoparticles”. They consist of a shell of TiO2 around a NaCl core so that the water vapor is channeled through TiO2 to the NaCl, and droplets are formed in a very low relative humidity environment (≈ 50 %). The hygroscopicity parameter is very high at the onset of the deliquescence. Theoretically, the κ value of such material depends on the growth factor of the particles, defined as the ratio of the particle's wet and dry radii. However, no laboratory experimental data are available to verify this dependency.
The large-scale impact of cloud seeding on the complex dynamical and microphysical system has been studied via 3D simulations and field experiments. However, the small-scale phenomena (in both time and space) cannot be easily resolved by these models. Parcel model simulations can fill the gap between the laboratory and field observations and/or 3D simulations. The parcel models with detailed microphysical schemes reduce the uncertainty caused by microphysics–dynamics interactions. They have been proven a useful tool to study microphysical or other physical processes (e.g., Klinger et al., 2019). In this study, we focus on the warm microphysical processes near the cloud base. The Lagrangian nature of the parcel model allows for an accurate representation of the sharp change of supersaturation near the cloud base, which determines the aerosol activation and the evolution of droplet size distribution (DSD) near the cloud base.
The recent field campaign conducted by the Stratton Park Engineering Company (SPEC Inc.) in the United Arab Emirates (SPEC UAE hereafter), under the UAE Research Program for Rain Enhancement Science (Mazroui and Farrah, 2017), recommended using numerical models (1) to unravel the role of coarse background particles in precipitation formation in natural clouds and (2) to understand how the efficiency of seeding depends on the size distribution and hygroscopicity of the background aerosol particles and that of the seeding materials (Wehbe et al., 2021). To better understand the hygroscopic seeding impacts on clouds and precipitation in a different environment, the variability of the background aerosol should be considered (Bruintjes, 1999; Tessendorf et al., 2012; Flossman et al., 2019). The purpose of this research is twofold.
- i.
One goal is to understand the mechanisms of the spectral broadening induced by characteristics of both background aerosols and hygroscopic seeding materials. A large number of numerical experiments are performed to examine the dependence of seeding efficiency on the type of seeding materials, on the cloud dynamics and on the characteristics of background aerosols. The assessment of the broadening of drop spectra at different CCN concentrations and different characteristics of the coarse particles may advance the designation of the optimal environmental conditions for the hygroscopic seeding. We hypothesize that the competition for the available vapor near the cloud base between the drops formed on fine-mode (r< 0.1µm) and coarse-mode particles (r> 1µm) impacts the precipitation formation.
- ii.
The second goal is to address the impacts of different seeding materials on DSD and exploring the efficiency of hygroscopic seeding.
The structure of the paper is as follows. Section 2 introduces the parcel model with a novel hybrid bin microphysics scheme. The observational data used in this numerical study are described in Sect. 3. Analysis of the evolution of the DSDs for both control and seeded cases are given in Sect. 4. The results are summarized, and the conclusions are provided in Sect. 5.
A hybrid numerical microphysics scheme combining moving and fixed bins is used to simulate the evolution of drop spectrum in an ascending air parcel. A bin scheme with moving boundaries is applied in the region where the diffusional growth of water drops is the dominant microphysical process. This region extends from a few hundred meters below the cloud base to the level where the air parcel reaches the altitude of 100 m above the cloud base (Fig. 1). The advantage of the moving-bin method is that it inherently conserves the number concentration of particles and allows the tracking of aerosol mass inside of drops without numerical diffusion in mass and spatial dimensions. Different types of aerosol particles are considered in the initial aerosol spectrum for a realistic representation of solute effect. Equation (1) is integrated numerically at each bin boundary, and the amount of condensed vapor was calculated by assuming linear size distribution within the bins (Geresdi and Rasmussen, 2005):
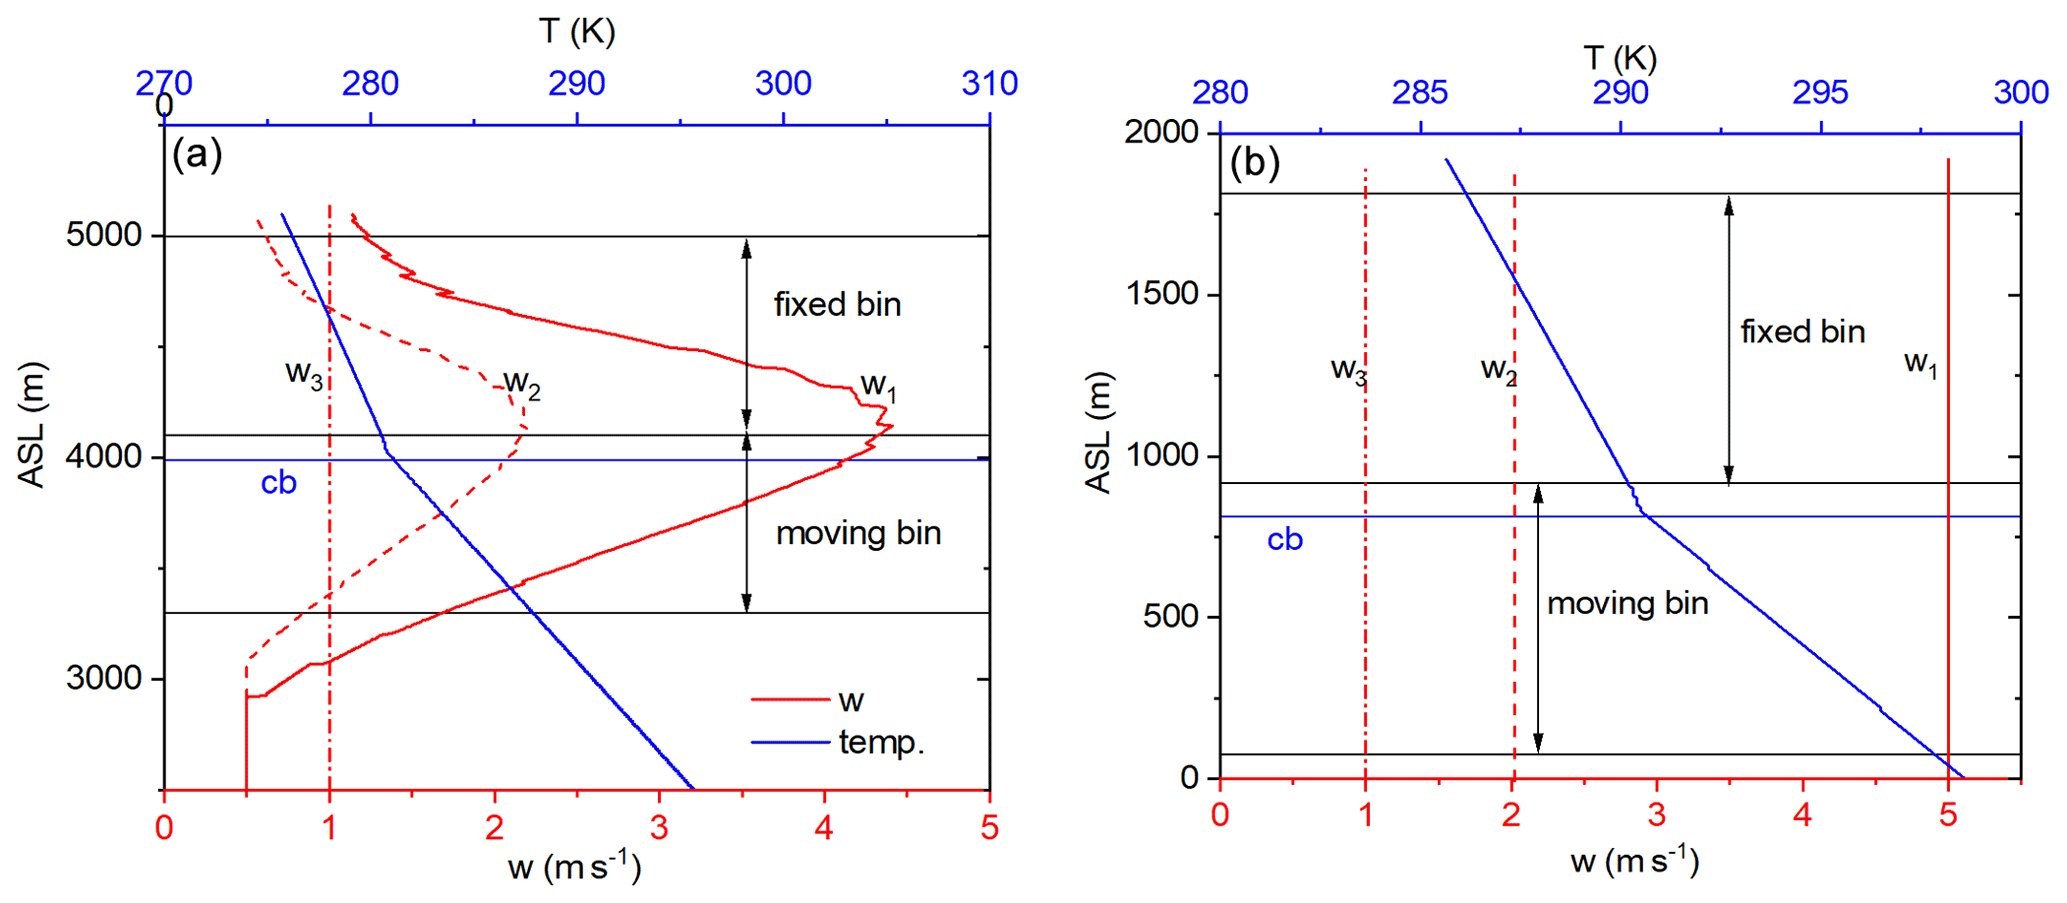
Figure 1The simulated temperature profiles and the prescribed updraft profiles in the numerical simulation for (a) the SPEC UAE cases and (b) the QCSRP cases. The background aerosol particles are BGUAE_1 and BGQNC_1, and seeding materials are ICE70_2 and ICE70_4 in (a) and (b), respectively. The plotted temperature profiles are calculated at the updraft profile of w3 for each panel. The horizontal blue lines denote the altitude of the cloud base. The three horizontal black lines from bottom to top denote the level where the calculation of the diffusional growth starts (RH = 70 %), the levels 100 and 1000 m above the cloud base.
where and are two-dimensional variables of the mass and the diameter of the water drop, respectively. The index i represents the bin boundary for the mass or size of the particles. The index k represents the type of the aerosol particles on which drops formed. The size distributions of the different types of aerosol particles are given with the same mass bin intervals; the map,i is the mass of the aerosol particles at the ith bin boundary. The κk hygroscopicity parameter depends on the chemical composition of aerosol particles of type k (Petters and Kreidenweis, 2007). ρw and ρap,k are the density of water and that of dry aerosol particles, respectively. The impact of the ventilation effect (fv) and the gas kinetic effect ( and is also taken into consideration. Both the curvature and solution terms (see Petters and Kreidenweis, 2007) are approximated by the first-order Taylor series in Eq. (1). The error caused by this approximation steeply decreases with the increase in the drop size. It is less than 20 % if the drop diameter is equal to 1.5 times the aerosol diameter and less than 2 % if the ratio of the drop diameter and the aerosol diameter is greater than 2, even in the case of an aerosol diameter of 5 µm. To avoid the division by zero at the evaluation of the solution term in Eq. (1) at the beginning of the calculation of the condensational growth, the diameter of the haze particle is assumed to be 1.5 times that of the dry aerosol particle. The diffusional growth was calculated by integrating Eq. (1) using a time step of 10−4 s. The advantage of such a small time step is the elimination of the potential error that was caused by overestimating the impact of the solution and Kelvin effect. Furthermore, it allows a more realistic simulation of the competition for the available vapor among the water drops containing different chemical compounds and of different sizes. Because the diffusional growth of wet aerosol particles is calculated before the drops surpass the critical size, no arbitrary assumption for the number concentration of the activated aerosol particles or the size of drops formed on the activated aerosol particles is needed.
At 100 m above the cloud base, the size of drops is large enough to neglect both the curvature and the solution terms, so the aerosol mass inside of the drops is not tracked, and Eq. (1) can be simplified to Eq. (2):
where md,i and Dd,i are the mass and the diameter of the water drop at the ith bin boundary, respectively.
Collision–coalescence can start to play a role in the evolution of the DSD at this stage. Therefore, the fixed-bin scheme is more appropriate, in which the size distributions of drops formed on different types of aerosol particles are merged and redistributed into fixed bins. In the case of the fixed-bin scheme, growth by condensation and by collision–coalescence is calculated as in Geresdi and Rasmussen (2005). Equation (2) is integrated using a time step of 0.1 s. Accretion of drops due to collision–coalescence is calculated with a time step of 1.0 s.
The initial size distributions of the aerosol particles in different categories are divided into 70 mass bins ranging from a radius of 0.016 to 46.6 µm with a bin mass increment factor of the square root of 2. In the case of the fixed-bin scheme, 48 mass doubling bins are defined over the radius range from 0.1 µm to 5.0 mm.
The role of coarse particles in the precipitation formation has been studied in much research (e.g., Jensen and Lee, 2008; Witte et al., 2017). In the numerical models, it is generally assumed that coarse particles could form large drops at the cloud base and accelerate the collision–coalescence. However, field observations show that the presence of the hygroscopic coarse particles does not necessarily initiate the efficient accretion of water drops (e.g., Wehbe et al., 2021). We proposed a parameter to describe the impact of coarse particles on the evolution of the DSD using the following formula:
where κc and nc are the hygroscopicity parameter and the number concentration of coarse particles, respectively. nact is the number concentration of all activated particles. This idea is based on the earlier findings that increasing the concentration of the CCN would suppress the impact of the coarse particles: Cooper et al. (1997) and Segal et al. (2004) found that warm rain formation can be enhanced by coarse-mode seeding particles, with the seeding efficiency depending on the concentration of the activated background aerosol particles. Flossmann and Wobrock (2010) confirmed via numerical simulations that an increase in CCN concentration reduced the efficiency of precipitation formation, and the role of giant aerosol particles was less evident. However, the mechanism responsible for broadening the DSD was not clarified in these studies. We hypothesize that diffusional growth near the cloud base is determined by the competition for the available vapor among the fine and coarse particles, which directly impacts the width of the DSD. The efficiency of the subsequent collision–coalescence depends on the resultant DSD affected by this broadening mechanism.
A typical way to evaluate seeding efficiency is to calculate the change of surface precipitation. However, it is not feasible in parcel model simulations. Generally, the DSDs from numerical experiments are compared to draw conclusions (Cooper et al., 1997; Tessendorf et al., 2021). Analyzing a large number of numerical experiments requires applying parameters that are both easy to calculate and sensitive to the broadening of the DSD. Grabowski and Wang (2009) used the reflectivity parameter (sixth moment of the DSD) to describe the broadening of the tail of the DSD. In this study we follow Grabowski and Wang (2009) and use the difference in the reflectivity values between the control (Zcntrl) and seeded (Zseed) cases to measure the impact of seeding:
The data used in this study are obtained from two weather modification field campaigns. The first project is the aforementioned QCSRP, which was carried out in southeastern Queensland, Australia (Tessendorf et al., 2012). The second project (SPEC UAE) was carried out close to the Al Hajar Mountains in the UAE (Wehbe et al., 2021). The purpose of both research projects was to study the effect of hygroscopic seeding on the precipitation from convective clouds. The characteristics of aerosol particles, both background and seeding particles, and of liquid drops were measured by different instruments. The wide variety of environmental conditions, different size distributions and chemical compositions for both background aerosol particles and seeding materials related to these two projects allows for detailed sensitivity studies on the processes that impact the evolution of DSD in the updraft core of convective clouds. The data used in this study represent the typical conditions in these field projects.
The characteristics of background aerosol particles and seeding materials are summarized in Tables 1 to 4 and in Fig. 2 (see more details in Wehbe et al., 2021, and Tessendorf et al., 2021). In the case of the SPEC UAE campaign the hygroscopicity parameter of natural aerosol particles for the intermediate (0.1µm ≤ra< 1 µm) and coarse (ra≥1 µm) modes is available from earlier studies (Wise et al., 2007; Semeniuk et al., 2014). Unfortunately, reliable data on the hygroscopicity and concentration of the fine aerosol particles (ra<0.1 µm) are not available. The size distribution of the soluble fine aerosol particles was modified to fit the observed number concentration of water drops (Fig. 2a). To address the uncertainty in the hygroscopicity of the aerosols, sensitivity tests on the hygroscopicity parameter were conducted (Table 1). In SPEC UAE cases, the aerosol particles in the coarse and intermediate modes were supposed to be more hygroscopic than the particles in the fine mode. The concentration of the coarse particles was about 1.0 cm−3 (Wehbe et al., 2021). In the QCSRP, the background aerosol particles were divided into two categories, continental and maritime ones, which differ in the size distribution and hygroscopicity (Fig. 2a). In the continental air mass the concentration of coarse particles was small (0.5 cm−3) and less soluble; in the maritime air mass the concentration of coarse particles was significantly larger (5.0 cm−3), and their hygroscopicity was higher as well.
Table 1Number concentration (cm−3) and chemical composition of the background aerosol particles observed in SPEC UAE and QCSRP. The hygroscopicity parameters for intermediate and coarse modes in the BGUAE cases were estimated based on the chemical composition observed by Semeniuk et al. (2014). The number concentrations are taken from the SF4 case in Wehbe et al. (2021). BGUAE means background aerosol observed in the SPEC UAE campaign. BGQNC and BGQNM mean background aerosol in continental and maritime air masses, respectively, in QCSRP. ∗ indicates that the observed size distributions are modified for the sensitivity test.
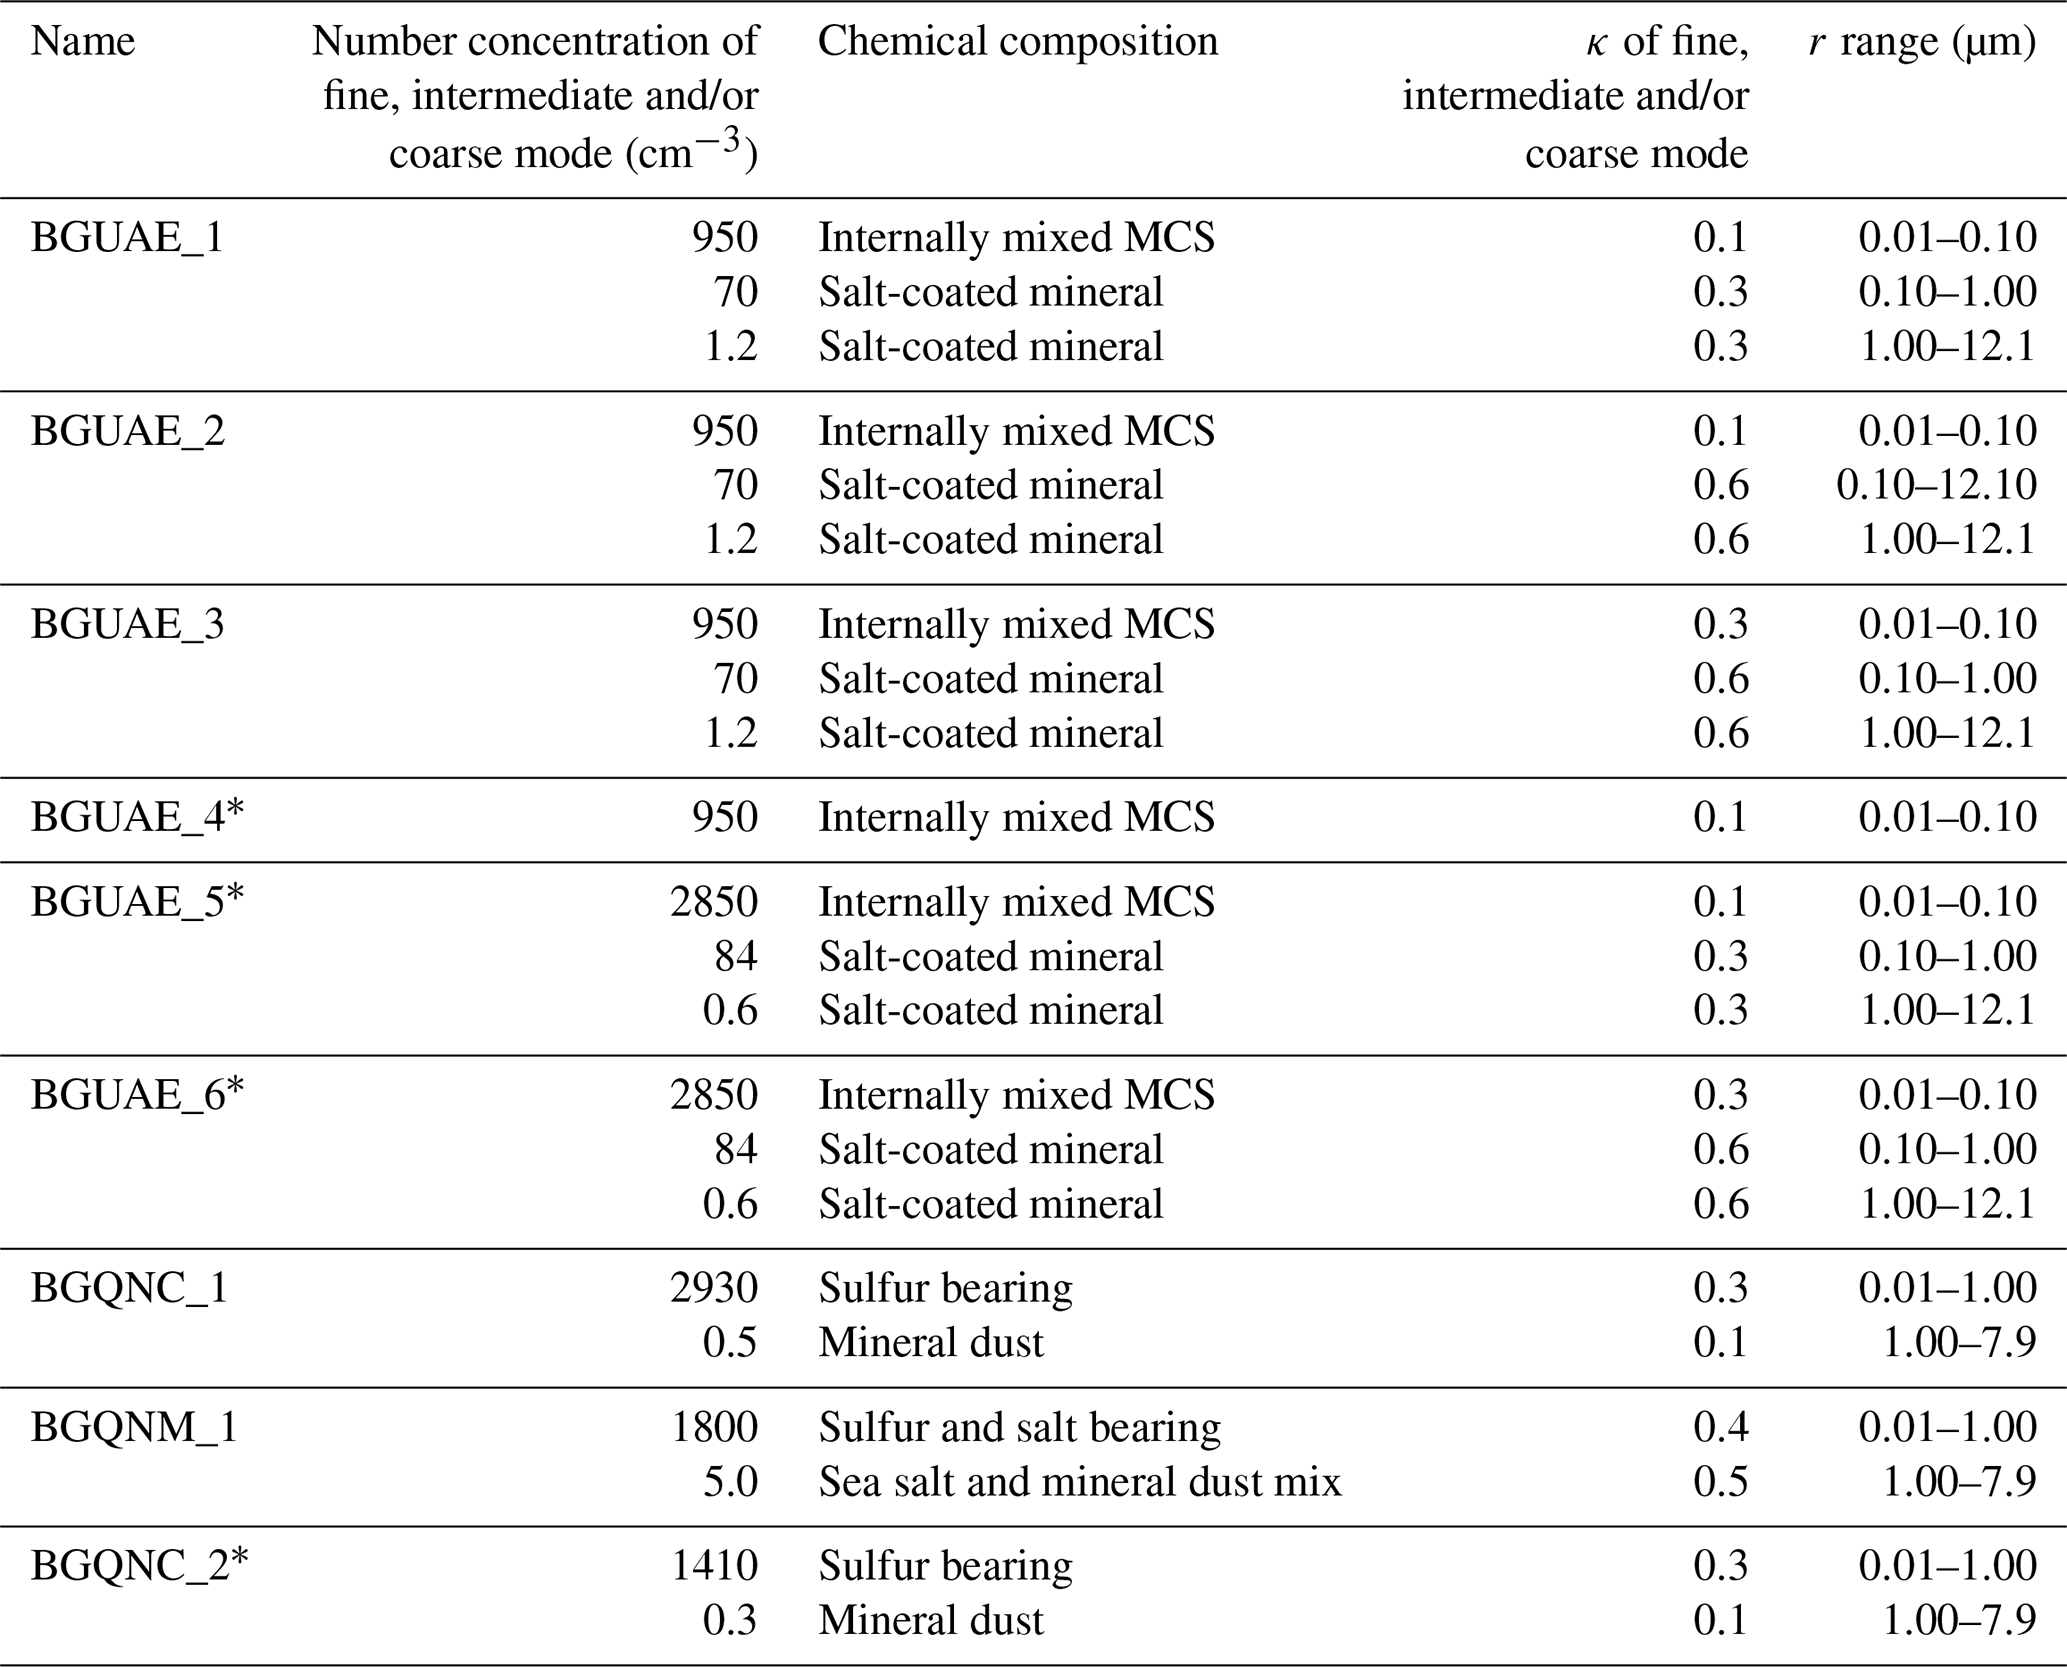
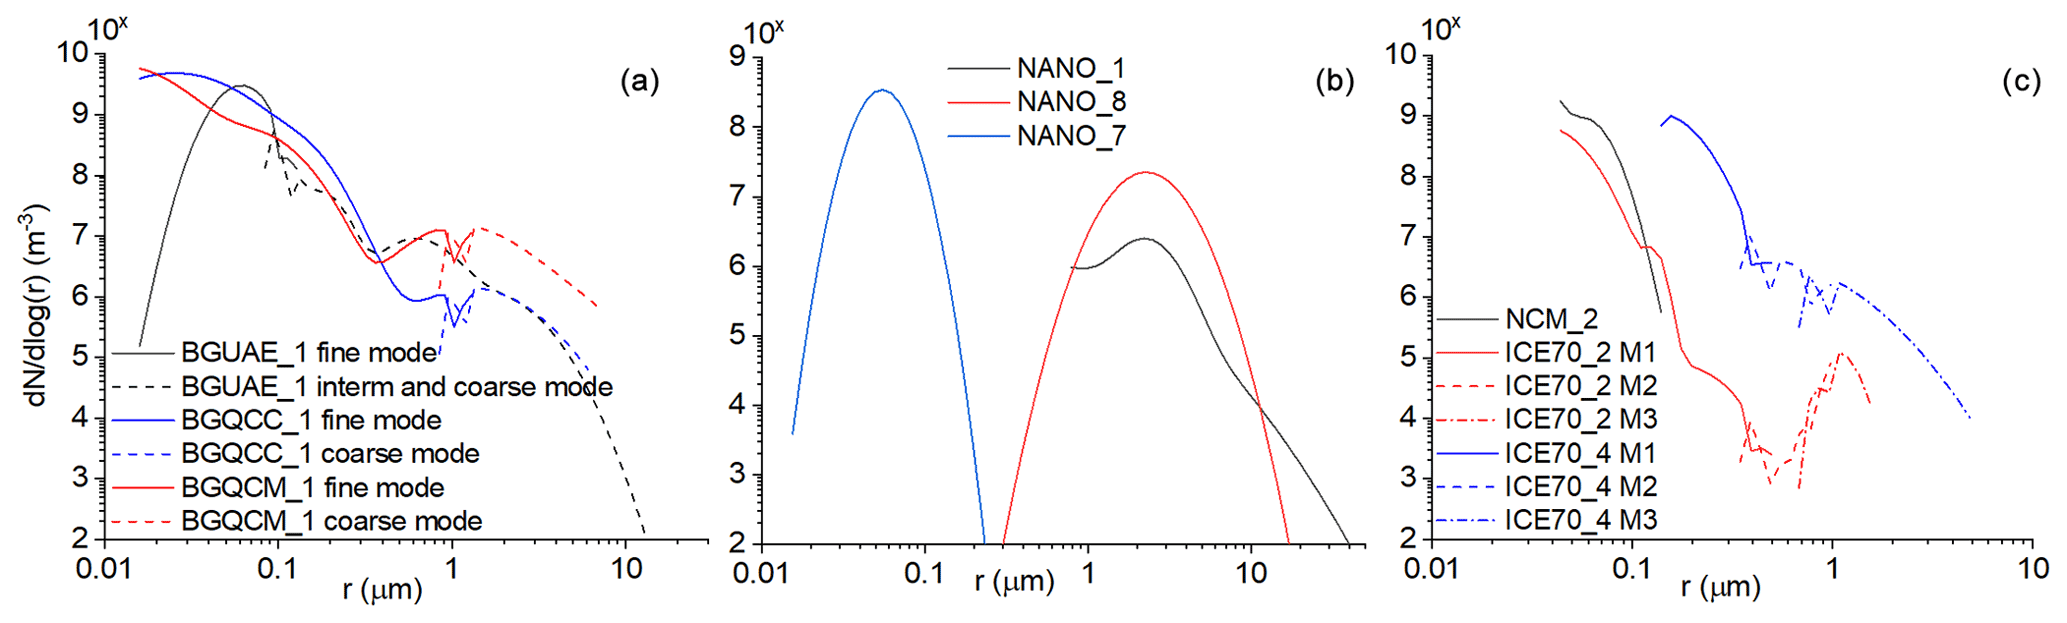
Figure 2Initial size distributions of (a) the background aerosols, (b) seeding nanoparticles and (c) seeding flares. The parameters of the size distributions are given in Tables 1 to 4.
Tables 2 to 4 and Fig. 2b and c summarize the characteristics of three different types of seeding material (nanoparticles, ICE70 and National Center of Meteorology in UAE (NCM)) used in these field projects. The different concentrations of seeding particles under different case names in these tables reflect the dilution effect due to dispersion and diffusion of seeding particles from the releasing source up to the cloud base. Laboratory observations show that the nanoparticles start to deliquesce at a low relative humidity due to their large hygroscopicity (Tai et al., 2017). However, the hygroscopicity of this material is not constant and decreases rapidly as the outer TiO2 shell dissolves and the growth factor increases. Unfortunately, quantification of this hygroscopicity–vapor relationship is unknown. To take this uncertainty into consideration, the following formula is used to represent the dependence of the hygroscopicity parameter on the size of drops formed on the nanoparticles:
where κ0=20.0 is the hygroscopicity of dry nanoparticles and κ1=1.12 is the hygroscopicity of salt particles, and GF is X=∞; the formula represents the growth factor. Different X values were tested to examine the sensitivity to the decreasing rate (Table 2). When X=∞, the formula represents salt particles while X=0 indicates ideal nanoparticles. There are no available observation data to calibrate the value of κ0. In the numerical studies, arbitrary values as high as 20 (e.g., Lompar et al., 2018) were used for the hygroscopicity of the nanoparticles. Contrary to the above-cited research, the dependence of hygroscopicity on the GF is considered in this study. If X is set to 0.1 (NANO_2) and 1.0 (NANO_1), the nanoparticles uptake about 5 and 2 times, respectively, more vapor than the salt particles (NANO_5) during the air parcel ascent from the levels of RH = 70 % to the cloud base. This enhancement of the vapor uptake agrees well with the laboratory observation data, which shows that about 5 to 10 times more mass of vapor is taken up by the nanoparticles in the sub-saturated environment within a reasonable time (Bermeo et al., 2020).
Table 2Characteristics of the nanoparticles. Because the shape of the size distribution function is the same in the NANO_1–NANO_6 cases, only the NANO_1 is plotted in Fig. 2b. The mode radius is 2.0 µm in these cases. The meaning of X can be found in Eq. (5). NANO_7 and NANO_8 are hypothetical particles for the sensitivity study with the mode radius of 0.05 µm and 2.5 µm, respectively (blue and red curves in Fig. 2b).
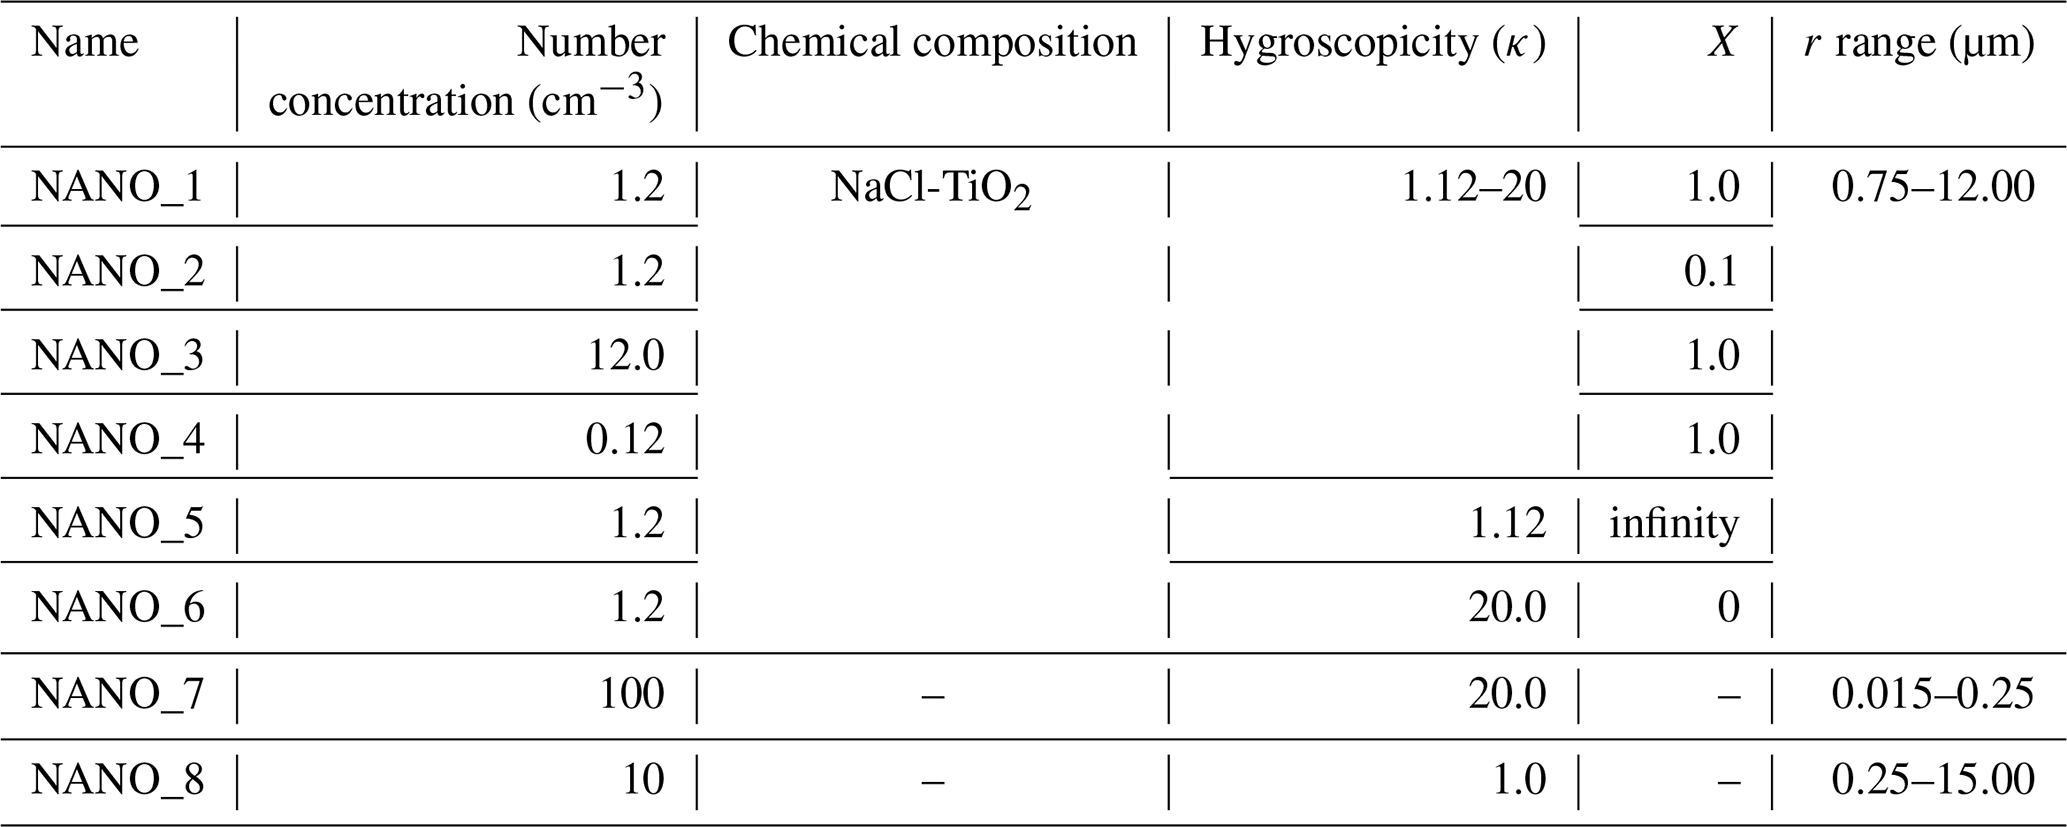
Table 3 lists four cases of the hygroscopic flares of ICE70. This type of burning flare produces both fine- and coarse-mode hygroscopic particles, but the concentration of the fine particles is about 2 orders of magnitude higher than that of the coarse particles (Bruintjes et al., 2012). We include dilution factors of 10 and 100 to test the impact of dispersion and diffusion. We adopt two size distributions taken from the above two campaigns to include the measurement uncertainty of this seeding material (see also Fig. 2c). The discrepancies between the size distributions are the consequence of the different observation techniques applied in the two field projects (Bruintjes et al., 2012; Wehbe et al., 2021).
Table 3Characteristics of the ICE70 aerosol particles. The unit of concentrations is cm−3. Cases without an asterisk use aerosol size distributions (ASDs) from the SPEC UAE project (Wehbe et al. 2021); cases marked with an asterisk use ASDs from Tessendort et al. (2021). The size ranges for M1, M2 and M3 are indicated in Fig. 2c using different line patterns. The hygroscopicity parameters and size ranges are related to modes M1, M2 and M3, respectively.

The NCM seeding material (Table 4 and Fig. 2c) is released from hygroscopic flares and was recently developed by the National Center of Meteorology in UAE. Comparing to the ICE70 particles, the size distributions of the NCM particles are narrower, and they consist of only fine particles. The number concentrations are given at dilution factors of 10 and 100.
Figure 1 shows the temperature and vertical velocity profiles of the ascending air parcel for the two ICE70 cases with different size distributions (ICE70_2 and ICE70_4). The temperature changes dry and wet adiabatically under and above the cloud base, respectively. Different updraft vertical profiles (red curves in Fig. 1) were generated to represent the possible cloud dynamics suitable for convective clouds. From bottom to top, the horizontal lines show (1) the level of RH = 70 %, where the calculation of the diffusional growth starts; (2) the level of the cloud base (blue lines); (3) the level at 100 m above the cloud base; and (4) the level at 1 km above the cloud base. The updraft profile denoted by w1 in Fig. 1a was adapted from a high-resolution WRF simulation for the SPEC UAE case (Lee et al., 2021). w2 is half of w1. For QCSRP cases in Fig. 1b, constant vertical profiles with values of 1, 2 and 5 m s−1 are used in this study.
Table 4Characteristics of the NCM aerosol particles. The unit of concentration is cm−3.

4.1 Control cases
Using nine different background aerosol conditions (Table 1) and three different updraft profiles for both field programs (Fig. 1), 27 control cases are simulated. Figure 3a shows the relation between the Hc parameter (Eq. 3) and reflectivity at 100 m above the cloud base. This panel reveals how coarse particles impact the drop size distribution when only the diffusional growth is taken into consideration. In real cases, the diffusional growth can be considered dominant under this level; the role of the collision–coalescence is negligible. If the value of Hc is small, the impact of the coarse particles comparing to all CCN particles is small in the precipitation formation. This can be interpreted as – in such a case – coarse particles contributing insignificantly to the evolution of the DSD when compared to the fine particles. If Hc is above a threshold of about 10−4, the logarithm of the reflectivity is approximately a linear function of the Hc parameter logarithm.
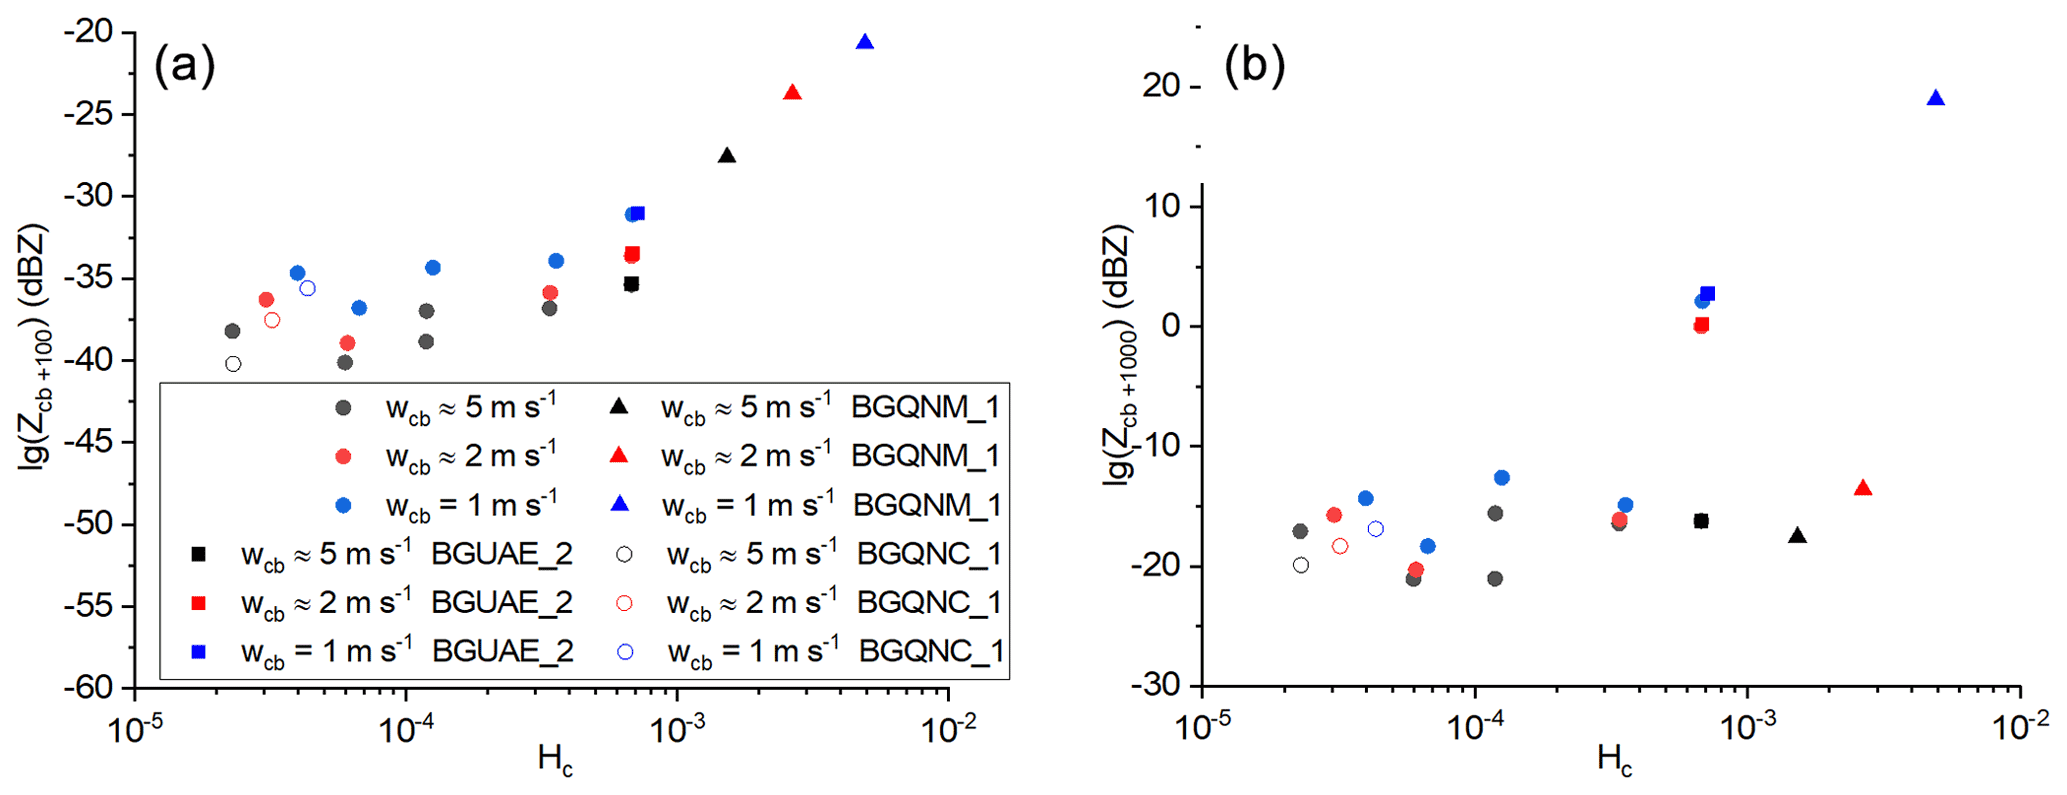
Figure 3Reflectivity calculated from the modeled DSD (a) 100 m and (b) 1000 m above the cloud base for non-seeded control cases. Symbols with different colors represent different updraft velocities at the cloud base as indicated by the key. Three different background aerosol size distributions are presented by solid triangles, squares and open circles (see the legend in panel a). The solid circles represent all six other background conditions (BGUEA_1, BGUAE_3, BGUAE_5, BGUAE_6 and BGQNC_2 with three corresponding updraft profiles except for the BGUAE_4 case where Hc is zero).
Figure 3a also reveals that the reflectivity is negatively correlated with the updraft velocity near the cloud base (see the symbols with different forms and colors). To avoid overcrowding, only three cases (BGUAE_2, BGQNC_1 and BGQNM_1) are highlighted by using different symbols in Fig. 3 (all the other background cases are not distinguished from each other by using different symbols, and they are denoted by closed circles). The relation between the reflectivity and updraft velocity is similar in other cases. This implies that the larger updraft velocity may suppress the broadening of the DSD tail. Tessendorf et al. (2021) found a similar correlation between the updraft velocity and the DSD broadening near the cloud base. They argued that the broadening is the consequence of a longer time period of condensation growth in a weaker updraft (i.e., residence time effect). Our results suggest that the broader DSD is instead dominated by the Ostwald-ripening effect (e.g., Yang et al., 2018).
In this study, the Ostwald-ripening effect is subtly different from Yang et al. (2018). In Yang et al. (2018), the spectral broadening is a result of the shrinking of the smaller drops and growth of larger drops in an oscillating vertical velocity condition. In our study, the vertical velocity is always positive and all droplets larger than the critical size can growth throughout the ascent, but the larger drops grow faster than the smaller drops, resulting in broadening of the size distribution. A numerical experiment is conducted to demonstrate this. In this experiment, the initial concentration of aerosol particles is the same as in the BGUAE_2 case. Collision and coalescence were not considered in this calculation, and the moving-bin scheme was used to calculate diffusional growth of the drops (Eq. 1) during the whole simulation up to 1 km above the cloud base. The temperature profile and vertical velocity profiles of w1 and w3 (with cloud base updraft speed of about 5 and 1 m s−1, respectively) in Fig. 1a are used for the simulation. Figure 4a shows the DSDs at 100 m and 1 km above the cloud base. Note that the critical droplet radii for both updrafts (0.13 and 0.06 µm for the updrafts of 1 and 5 m s−1, respectively) are smaller than the minimum droplet size plotted in the figure; the concentration of the drops larger than the critical size actually remain constant during the ascent of the parcel. At 100 m above the cloud base the DSD under the weaker updraft is significantly wider, but this difference decreases at 1 km above the cloud base, which demonstrates that the residence time has no significant effect on the evolution of the DSD if a deeper region is considered. Tessendorf et al. (2021) studied the evolution of DSD within only 400 m above the cloud base. Figure 4c shows the evolution of drop sizes with different initial dry radii. These discrete initial radii are chosen to represent the diffusional growth of drops formed on aerosol particles with different sizes and hygroscopicities. In weak updraft (vertical velocity profile denoted by w3), drops formed on coarse particles become significantly larger, and the growth of drops formed on fine particles is less affected by the change of updraft velocity. In addition, the drops formed on aerosol particles with an initial radius of 0.05 µm become slightly smaller if the updraft is weaker.
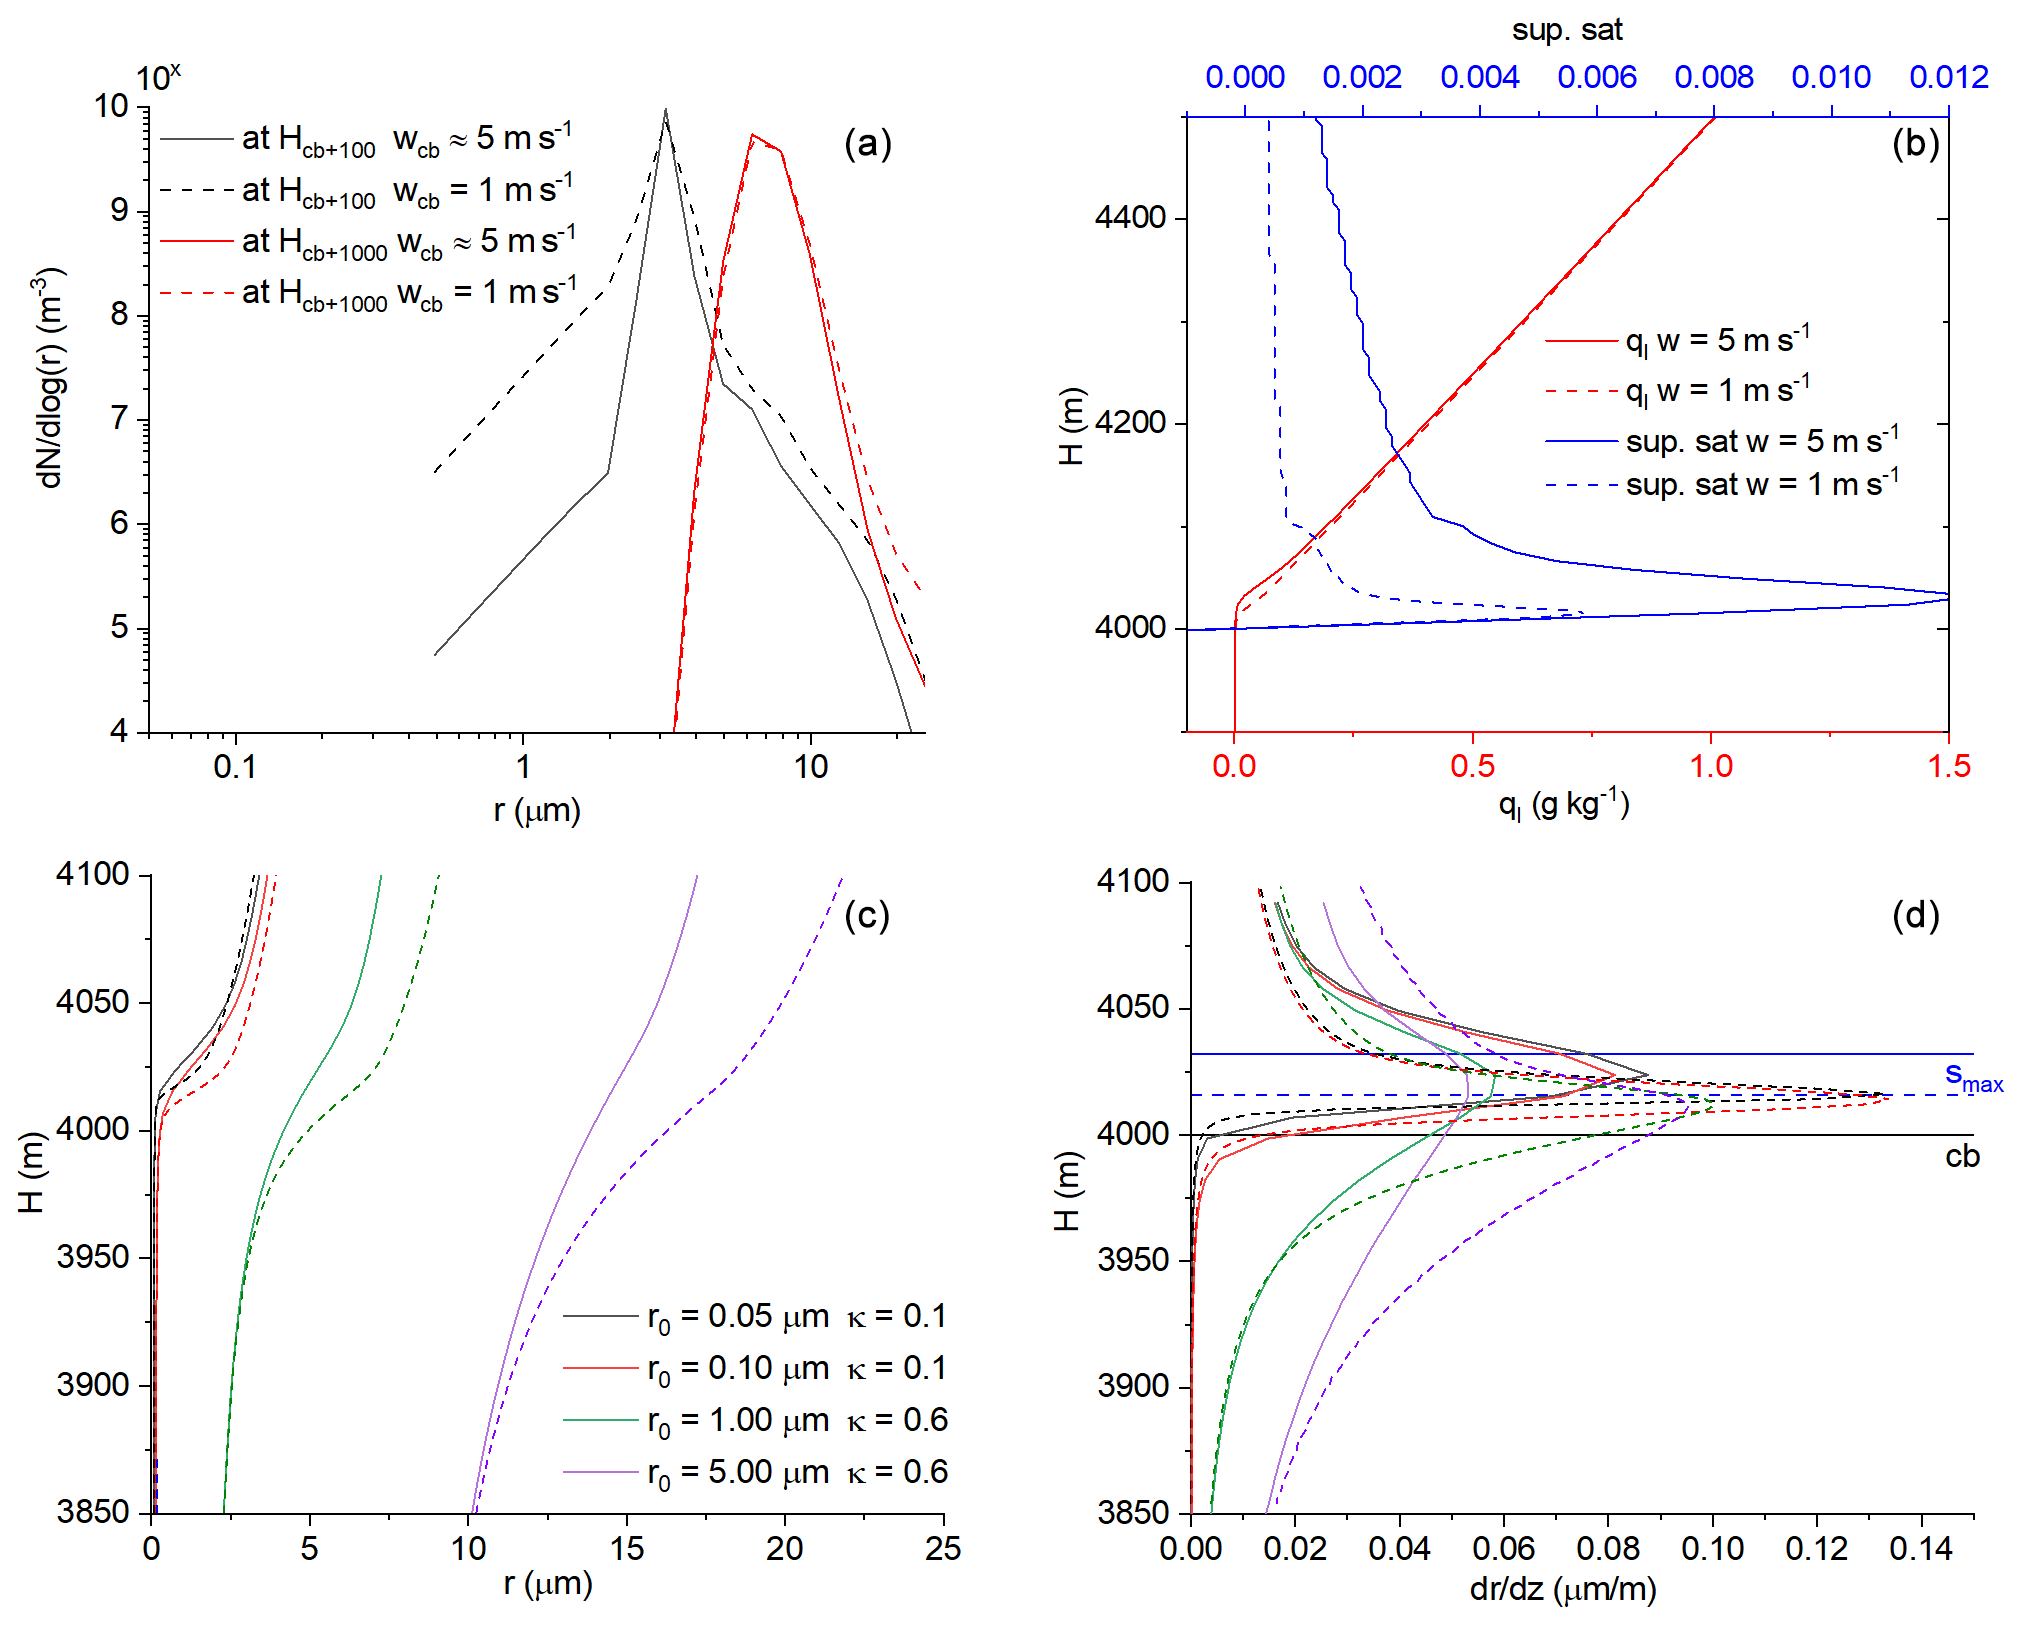
Figure 4Evolution of (a) DSD, (b) vertical profiles of liquid water content and supersaturation, (c) vertical profiles of the drop radius, and (d) vertical profiles of the vertical gradients of the drop radius. In panels (c) and (d), the lines with different colors denote different initial aerosol radius and hygroscopicity (see legend in panel c). The solid and dashed lines denote the cases related to the updraft profiles of strong (w1) and weak updrafts (w3), respectively. The horizontal lines in panel (d) denote the location of the cloud base (black solid line) and that of the maximum of the supersaturation in the case of updraft profiles w1 (solid blue line) and w3 (dashed blue line). Note the plots in Fig. 4c start at the altitude of 3800 m, and the calculation of the diffusional growth of the water drops starts at 3300 m (see Fig. 1c).
The profiles of the liquid water content (LWC) and supersaturation in Fig. 4b further support our argument. In the case of weak updrafts, the LWC approaches the adiabatic LWC immediately above the cloud base. (The LWC profile simulated with the weakest vertical velocity is closest to the adiabatic LWC profile. This difference is not discernible in Fig. 4b.) In the strong updraft (updraft profile of w1) the vapor surplus due to the updraft exceeds the vapor depletion due to the condensation. Therefore, LWC approaches the adiabatic value only at a higher elevation, at about 100 m above the cloud base. Adiabatic LWC is defined as equal to zero before the parcel reaches saturation, and the supersaturation is zero above the cloud base. In the case of the strong updraft, the actual LWC at 50 m above the cloud base was about 15 % smaller than the adiabatic value. This deviation from the adiabatic liquid water content can be explained by the shorter residence time as asserted by Tessendorf et al. (2021). The stronger updraft yields a larger supersaturation, which reduces the role of both the curvature and solution effects on the diffusional growth. In contrast, in the case of weak updraft, due to the smaller supersaturation, the diffusional growth of drops formed on larger and/or more soluble particles can grow faster against the drops formed on the fine particles (Ostwald-ripening effect). Similar conclusions were reported by Yum and Hudson (2005). They numerically simulated the diffusional growth of water drops formed on aerosol particles with homogenous chemical composition (salt), and they also found that the curvature and solution terms could significantly impact the broadening of the DSD near the cloud base if the updraft velocity was small.
The plots in Fig. 4d demonstrate the ripening effect. The vertical regions where the ripening works can be assigned by the condition where drops formed on larger and/or more hygroscopic aerosol particles grow faster than drops formed on the smaller and/or less hygroscopic aerosol particles. In the case of the weak updraft (w3) drops formed on the coarse particles faster than the drops formed on the fine particles in the whole plotted range both under and above the cloud base except for a narrow interval above the cloud base. If the updraft is stronger (solid lines in Fig. 4d), the drops formed on the coarse particles grow faster only under the cloud base; above the cloud base only the drops formed on giant CCN (r0=5 µm) grow faster than the drops formed on the smaller particles. At about 100 m above the cloud base the drops are large enough to neglect both the solution and curvature effects, and the rate of diffusional growth is proportional to supersaturation. Because in the adiabatically ascending air parcel the supersaturation is positively correlated with the updraft velocity (e.g., Rogers and Yau, 1996), the longer residence time is balanced by the smaller supersaturation.
To examine the effect of coarse particles on DSD broadening, we investigate the relation between Hc and reflectivity at 1 km above cloud base (Fig. 3b). Collision–coalescence are considered after 100 m above the cloud base, as the drops are large enough to initiate the process. The relation is not as straightforward as in Fig. 3a. In the strong updraft, the reflectivity is between −20 and −10 dBZ, and they do not depend on the value of Hc. This means that in the case of intense updraft, the droplet size distributions only slightly depend on the presence of the coarse particles even if the impacts of collision–coalescence are also taken into consideration. The tail effect of coarse particles is weak, and the DSD broadening depends only on the number concentration of activated aerosol particles. This is found even in the maritime case (BGQNM_1), where a relatively high concentration of hygroscopic coarse particles (N=5 cm−3, Hc is present. This result agrees with the finding in SPEC UAE (Hc is between and (Wehbe et al., 2021). They found that DSDs remained narrow, although the concentration of the coarse particles was around 1 cm−3. The sensitivity to the presence of coarse particles was found to be important only if the updraft was weak (w3 in Fig. 1). The broader DSD formed due to the Ostwald-ripening effect promotes the collision–coalescence process. The fact that even in the case of weak updrafts the DSD remains narrow if the value of Hc is small suggests that the diffusional growth remains dominant, and the impact of collision–coalescence is small or negligible. This scenario is represented by the BGUAE_4 case (there are no coarse particles in the aerosol spectrum). The reflectivity 1 km above the cloud base remains small ( dBZ), independently of the updraft profile.
4.2 Effect of seeding
In this section, the results of the impact of different seeding materials on the evolution of DSD near the cloud base are presented. Because the characteristics of seeding materials of ICE70 and NCM are rather similar (see Tables 3 to 4, furthermore Fig. 2c), the results about these materials will be discussed together.
In the seeded cases the impact of coarse particles is described by the modified version of Eq. (3):
where κ and n are the hygroscopicity parameter and the number concentration of coarse particles. nact refers to the number concentration of activated particles. The subscripts bg and seed indicate the background aerosol and seeding materials, respectively.
4.2.1 Effect of nanoparticles
The nanoparticles have a core–shell structure of NaCl–TiO2, which can adsorb water vapor and deliquesce at a lower environmental RH than the pure NaCl (Tai et al., 2017). The size of the nanoparticles is comparable with that of background coarse particles. Figure 5a to c show how seeding nanoparticles impacts the DSD at 1 km above the cloud base in three different background aerosol conditions. Seeding results in a broader DSD in all cases, independent of the background aerosol size distributions applied in this study. However, the broadening effect is found to be negatively associated with the concentration of the background coarse particles. The increase in the concentration of drizzle size drops (r>25 µm) is highest in the seeded BGQNC_1 case and lowest in the seeded BGQNM_1 case (Fig. 5b and c). In these cases, the concentration of the background coarse particles is 0.5 and 5.0 cm−3, respectively. The seeding has no significant effect on the growth rate of the drops formed on background aerosol particles in either the seeded BGUAE_1 or BGQNM_1 (Fig. 6a and c). Seeding by nanoparticles, due to their small concentration, hardly impacts the supersaturation above the cloud base and the amount of water vapor uptake by the background aerosol particles (see smax,ctrl and smax,seed as well as Qbg,ctrl and Qbg,seed in Fig. 6). In line with the small impact of seeding on the supersaturation and LWC, the results of the numerical simulation show that the number concentration of the drops formed on background CCN does not change due to the seeding. However, the growth surplus for the nanoparticles due to the ripening effect is significant in the seeded BGUAE_1 case (Fig. 6a and b). In the seeded BGQNM_1 case, the growth rate of the nanoparticles reduces by half compared to the seeded BGUAE_1 case, and the growth rate surplus is significantly smaller compared to the growth rate of background aerosol particles (Fig. 6c and d). Note that the neglect of the curvature and solution effect for the natural giant CCN and the nanoparticles beyond 100 m above the cloud base may result in an underestimation of the Ostwald-ripening effect (Fig. 6b and c).
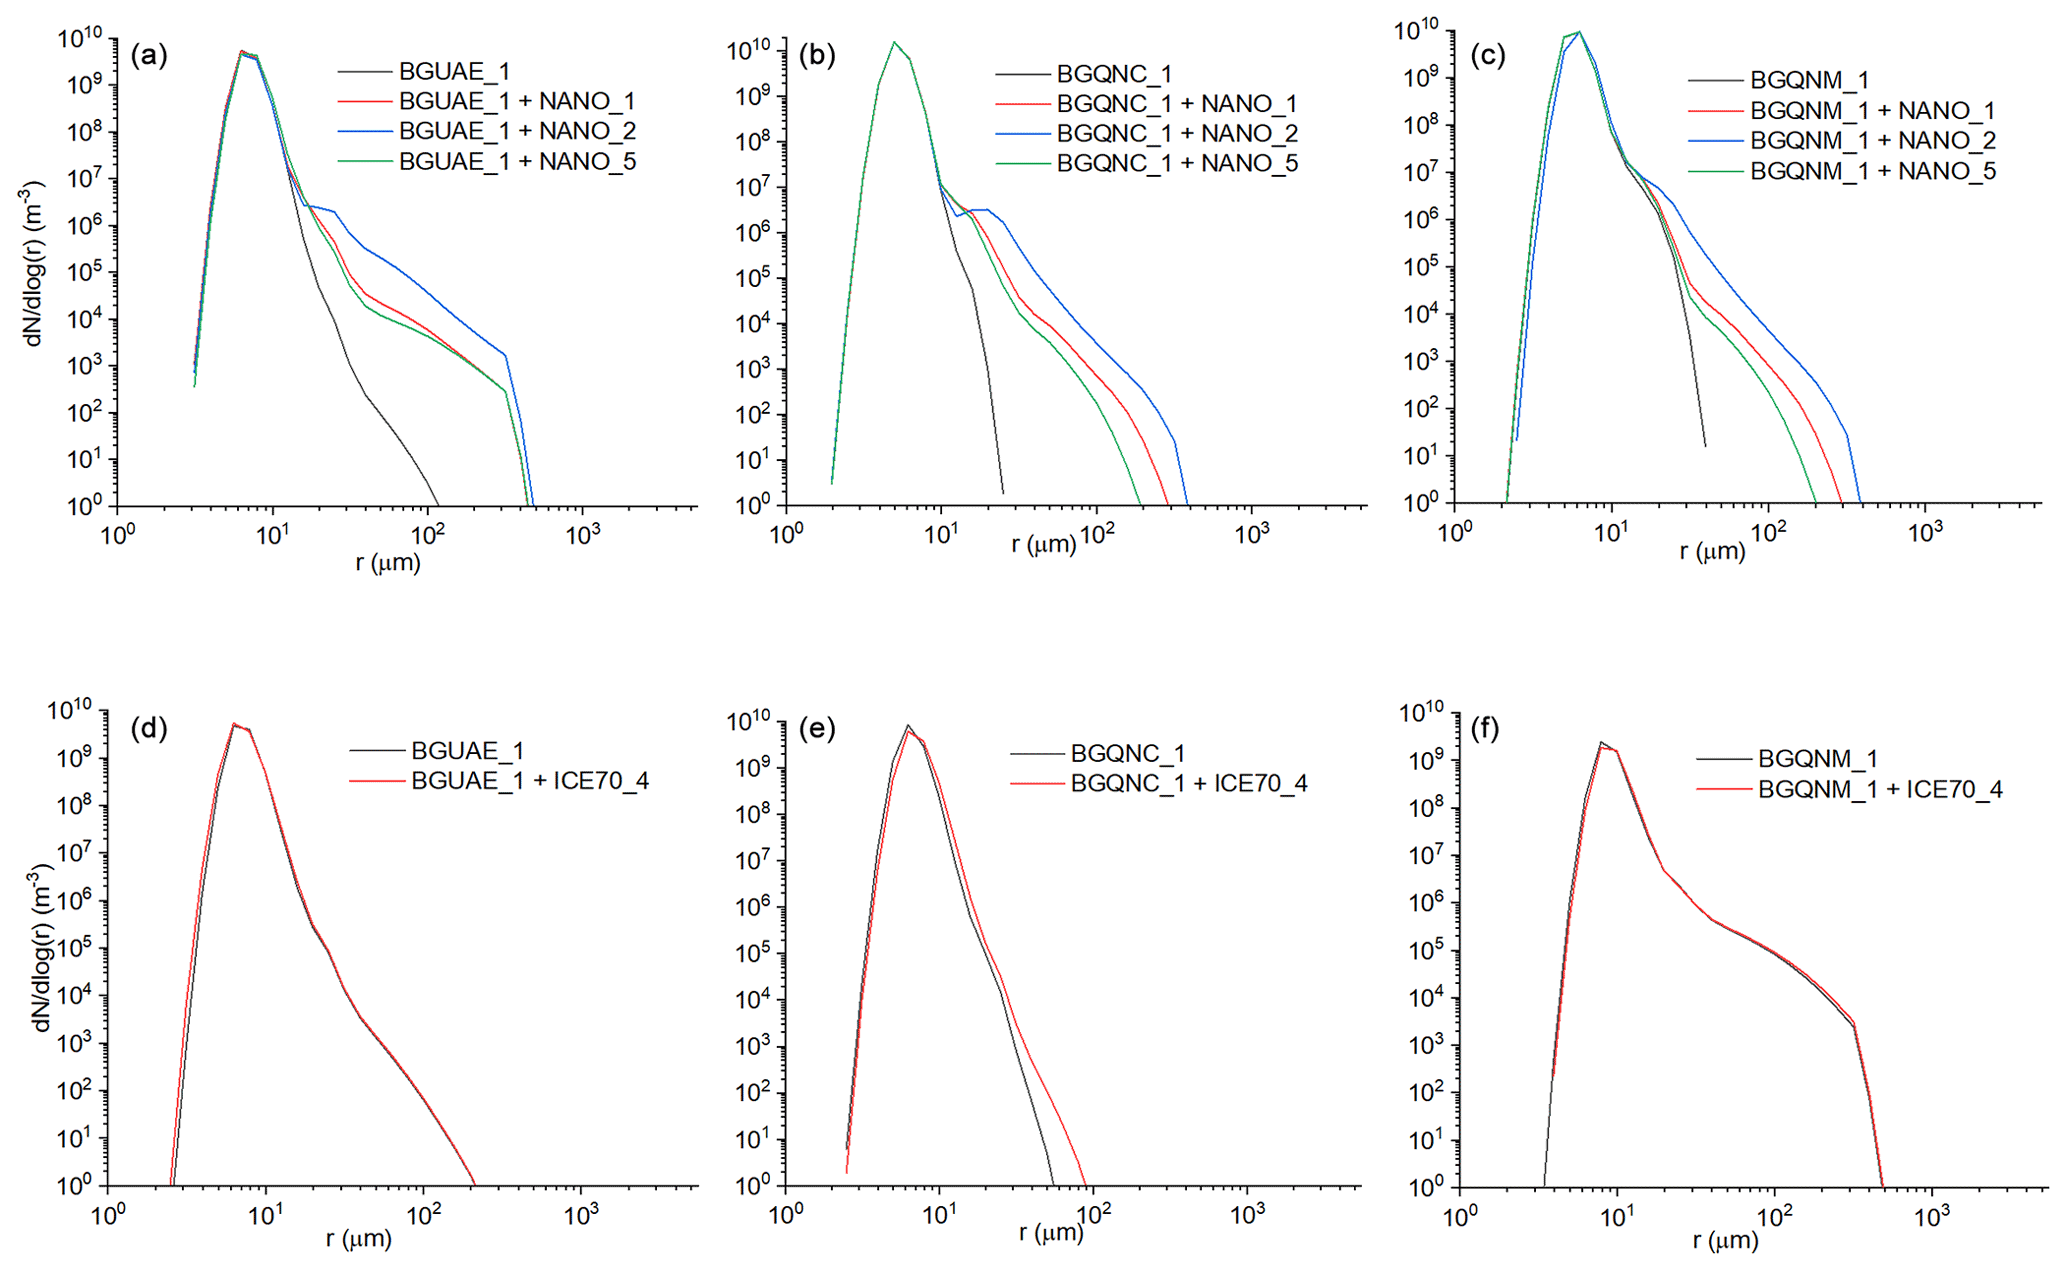
Figure 5Impact of hygroscopic seeding at different background aerosol size distributions and in the case of different seeding materials. The black lines denote the DSD for the control cases 1 km above the cloud base. The color lines denote the DSD formed due to the different seeding materials. The impact of the seeding of the nanoparticles (a, b and c) is presented when the updraft profile w1 was used. In the case of ICE70 seeding material, the DSDs are calculated at updraft profile w3.
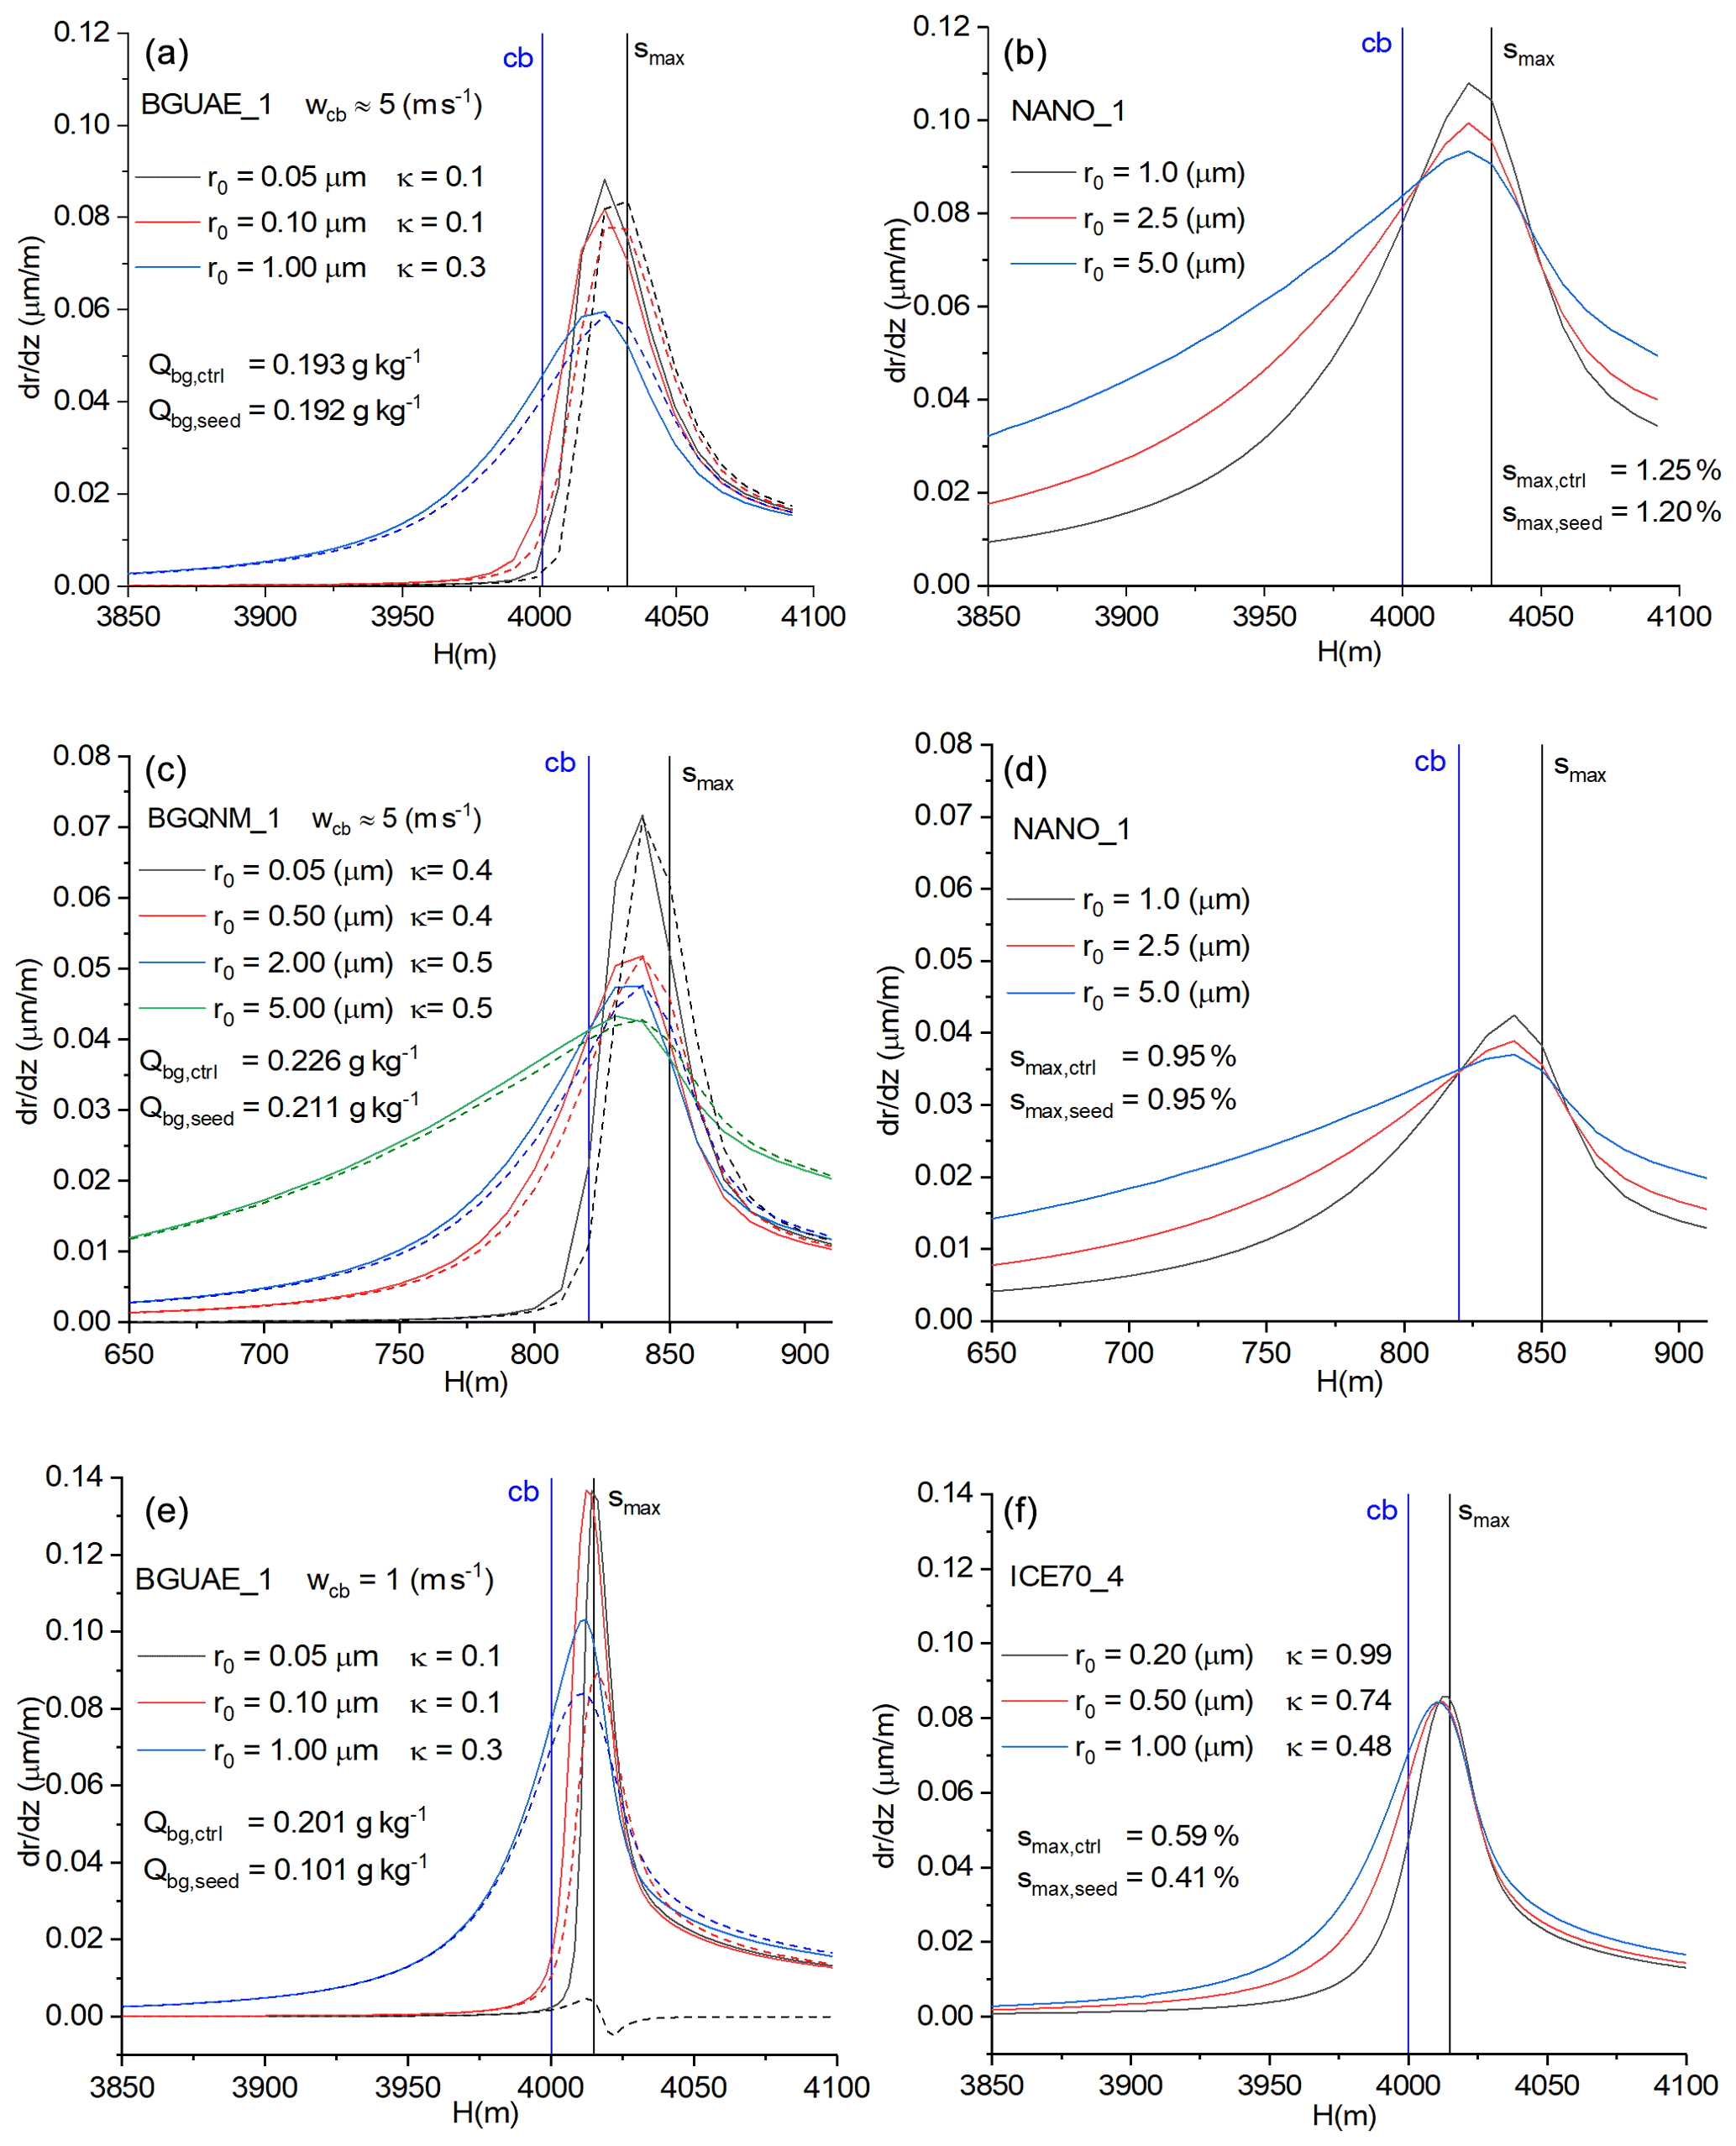
Figure 6The vertical profiles of the growth rate of drops formed on background aerosol particles with different sizes and hygroscopicities (a, c, e) and those formed on different types of seeding materials with different sizes and hygroscopicities (b, d, f). In the left panels, the solid lines denote control cases, and the dashed lines denote seeded cases. Blue and black vertical lines denote the location of the cloud base and that of the maximum supersaturation. The smax,ctrl and smax,seed mean the calculated maximum supersaturation belongs to the unseeded and seeded cases, respectively. The Qbg,ctrl and Qbg,seed mean the amount of the condensed water on the background aerosol particles in the control and seeded cases at 100 m above the cloud base, respectively.
We also examined the impact of the hygroscopicity of the nano seeding material by changing the value of X in Eq. (5). It is found that the difference between NANO_1 and NANO_5 (hygroscopicity decreases quickly with the increasing wet size) is small (Fig. 5a to c). The impact of NANO_2 (hygroscopicity decreases slowly with the wet size) is substantial even in the BGQNM_1 case (Fig. 5a to c). Note, using X=0.1 in NANO_2 may overestimate the hygroscopicity of the real nanoparticles. The test also shows that if the concentration of the seeding particles was very small (0.12 cm−3 in NANO_4), the seeding effect was significant in both BGUAE and BGQNC cases, but it was small in BGQNM cases. The reflectivity values of seeded (control) cases with updraft profile of w1 at 1000 m above the cloud base are as follows: −1.37 (−16.42), −9.43 (−19.88) and −15.47 (−17.56) dBZ in BGUAE_1, BGQNC_1 and BGQNM_1, respectively. This finding suggests that the concentration of the nanoparticles should be comparable to or larger than that of the background coarse particles to have a significantly positive seeding effect, in agreement with the recommendations in Wehbe et al. (2021) based on the aircraft observations.
The seeding by nanoparticles can have a significant seeding effect in all cases, and the effect becomes stronger as the updraft is weaker. This agrees with the results in the previous section, because the injection of the nanoparticles increases the concentration of highly hygroscopic coarse particles. The variation in seeding efficiency due to change in X (Eq. 5) significantly decreases as the updraft decreases. For example, with the aerosol size distribution of BGUAE_1, the efficiency of seeding (Eq. 4) increases from 18.8 to 35.1 dBZ as the X changed from infinity (salt particle) to zero (ideal nanoparticle) for the case with an updraft around 5 m s−1 at the cloud base. This efficiency changes to 34.1 (X=∞) and 41.5 dBZ (X=0) when the updraft at the cloud base was about 2 m s−1. This means that in the case of strong convective clouds the nanoparticles with large hygroscopicity can be more favorable than the pure salt particles, and in weaker updrafts this benefit decreases significantly.
4.2.2 Effect of flare particles (ICE70 and NCM)
Figures 5d to f show how the ICE70_4 reagent affects the DSD at 1 km above the cloud base. The impact of NCM, with a similar seeding particle concentration to ICE70, is also similar. The differences in the seeding efficiency between the two seeding materials are less than 1 dBZ. In the plotted cases the updraft velocity is 1 m s−1 (w3 profiles in Fig. 1a and b), and the dilution factor is 100. For a stronger updraft or a dilution factor of 10 (i.e., a higher concentration), the seeding effect is smaller or even negative.
It is also found that the seeding efficiency of the flare particles is significantly smaller than that of the nanoparticles. The difference between the hygroscopicity cannot explain this difference, because even the effect of salt particles, whose hygroscopicity is nearly the same as that of the flare particles, is positive (see Fig. 5a to c). However, the average size of these two types of seeding materials was different (Fig. 2). Figure 7a shows how the equilibrium size of water drops depends on κ and the size of the aerosol particles. The drop size and hygroscopicity curves at 1 and 5 s after the diffusional growth are also plotted. While the presence of aerosol particles with a size of 0.1 µm cannot contribute to the drop formation larger than 5 µm near the cloud base, the drops formed on the aerosol particles with a size of 2.5 µm can reach 10 µm within 1 s if κ is near 1. The equilibrium size is almost independent of κ if the aerosol size is submicron, and it is more sensitive to the hygroscopicity in the case of the coarse particles. The importance of the size of seeding materials over the hygroscopicity is shown in Fig. 7b. The background aerosol concentration is BGUAE_3 (Table 1). The seeded cases with NANO_7 (with extremely high hygroscopicity but a very small mean radius) and NANO_8 (with a smaller hygroscopicity but a large mean radius) are compared (Table 2). Although the hygroscopicity in the NANO_7 case is extremely high, the seeding effect is negligible. When the size of the seeding material is increased, despite that the hygroscopicity is significantly reduced, the seeding effect is evidently larger. The weaker seeding effect by flare particles is also well demonstrated in Fig. 6e and f. The doubling of the aerosol concentration due to seeding reduces the maximum supersaturation by 20 % and halves the amount of the condensed water on the background aerosol particles (see smax,ctrl and smax,seed as well as Qbg,ctrl and Qbg,seed in Fig. 6e). Flare particles suppress the growth of drops formed on the background aerosols; they mainly suppress the growth of drops formed on the fine-mode background aerosol particles and only slightly suppress the growth of the drops formed on the coarse-mode aerosols. However, their growth rate does not significantly exceed the growth rate of the background aerosol particles having the same size.

Figure 7The impact of the size (ra) and hygroscopicity (κ) of the seeding material. Panel (a) shows the equilibrium drop sizes formed on the aerosol particles with a different radius and different hygroscopicity (solid lines). Dotted and dashed lines denote the drop radius calculated by Eq. (1) after 1 and 5 s, respectively. Panel (b) shows how the small particles with large hygroscopicity (NANO_7) and large particles with smaller hygroscopicity (NANO_8) impact the evolution of the DSD. The black line denotes the DSD for the control case 1 km above the cloud base.
In this study, the impact of background aerosol and seeding particles on the evolution of DSD was studied by using a parcel model with a novel hybrid bin microphysics scheme. The applied moving-bin approach is able to avoid the numerical diffusion problems that an Eulerian bin scheme produced (Grabowski et al., 2019; Morrison et al., 2020). A large number of numerical simulations were performed to investigate how hygroscopic seeding can affect the DSD of convective clouds in various environmental conditions. The results are valid only if the fallout of the hydrometeors formed in the ascending air parcel is negligible, so the sensitivity test was not extended to updraft speeds less than 1 m s−1.
To describe the impact of the coarse particles on the evolution of the drop spectrum, a new parameter dependent on both the hygroscopicity of coarse particles and their concentration relative to that of all activated aerosol particles was introduced. Evidence from observation and numerical model simulation indicates that the presence of large, highly soluble aerosol particles (coarse particles) can form big drops and initiate the collision–coalescence process efficiently (e.g., Witte et al., 2017), i.e., the tail effect. Our results about the control cases show that the impact of the coarse particle on the evolution of the DSD depends on the updraft velocity. When the updraft is about 1 m s−1, the early broadening of the drop size distribution is more sensitive to the presence of the coarse particles. In this case the smaller supersaturation and the presence of coarse particles (depending on their hygroscopicity) enhance the Ostwald-ripening effect, which can significantly impact the evolution of the DSD near the cloud base. When the updraft at the cloud base is strong (, background coarse particles do not play an important role in broadening of the DSD even with a relatively high concentration (. In the case of strong updraft (, the supersaturation is large, which reduces the impact of the Ostwald-ripening effect and leads to a low sensitivity of DSD to the coarse particle concentration.
Figure 8a shows how the change of the Hc parameter (Hc,seed (Eq. 6) minus Hc (Eq. 3)) impacts the water vapor uptake near the cloud base. The vertical scale gives the ratio of LWC between the seeded and control cases at 100 m above the cloud base. The strong correlation reveals that the enhancement of the Hc parameter due to the injection of highly soluble coarse particles (in this case, the number concentration of activated particles only slightly increased) can significantly increase the water vapor uptake under the cloud base (see the intense growth rate of the drops formed on nanoparticles in Fig. 6b and d). If the ratio of is larger than 1, the LWC is superadiabatic, because in the control cases, the LWC is close to the adiabatic value at 100 m above the cloud base. The uptake of vapor by highly hygroscopic particles under the cloud base, especially in the case with a weak updraft, increases the LWC to above the adiabatic value. The amount of the surplus is small, so the effect is significant only when the adiabatic LWC is small (e.g., near the cloud base) and becomes negligible at a higher level above the cloud base. We hypothesize that the efficient vapor uptake by the coarse-mode hygroscopic particles can partly explain the observed superadiabatic LWC near the cloud base with weak updrafts in some field campaigns (Blyth and Latham, 1985; Yum and Hudson, 2001). If the seeding materials contain a large concentration of fine particles, the water vapor uptake reduces. In this case, the number concentration of coarse particles does not change, and the number concentration of the activated particles remains the same or increases. Our results do not support the frequently cited hypothesis that the hygroscopic seeding significantly reduces drop formation on natural CCN (e.g., Segal et al., 2007). It was found that the increase in the CCN concentration due to the seeding was never compensated by the decrease in activation of natural aerosol particles. A notable decrease in the number concentration of activated drops from background CCN was only found in the case of a weak updraft (.
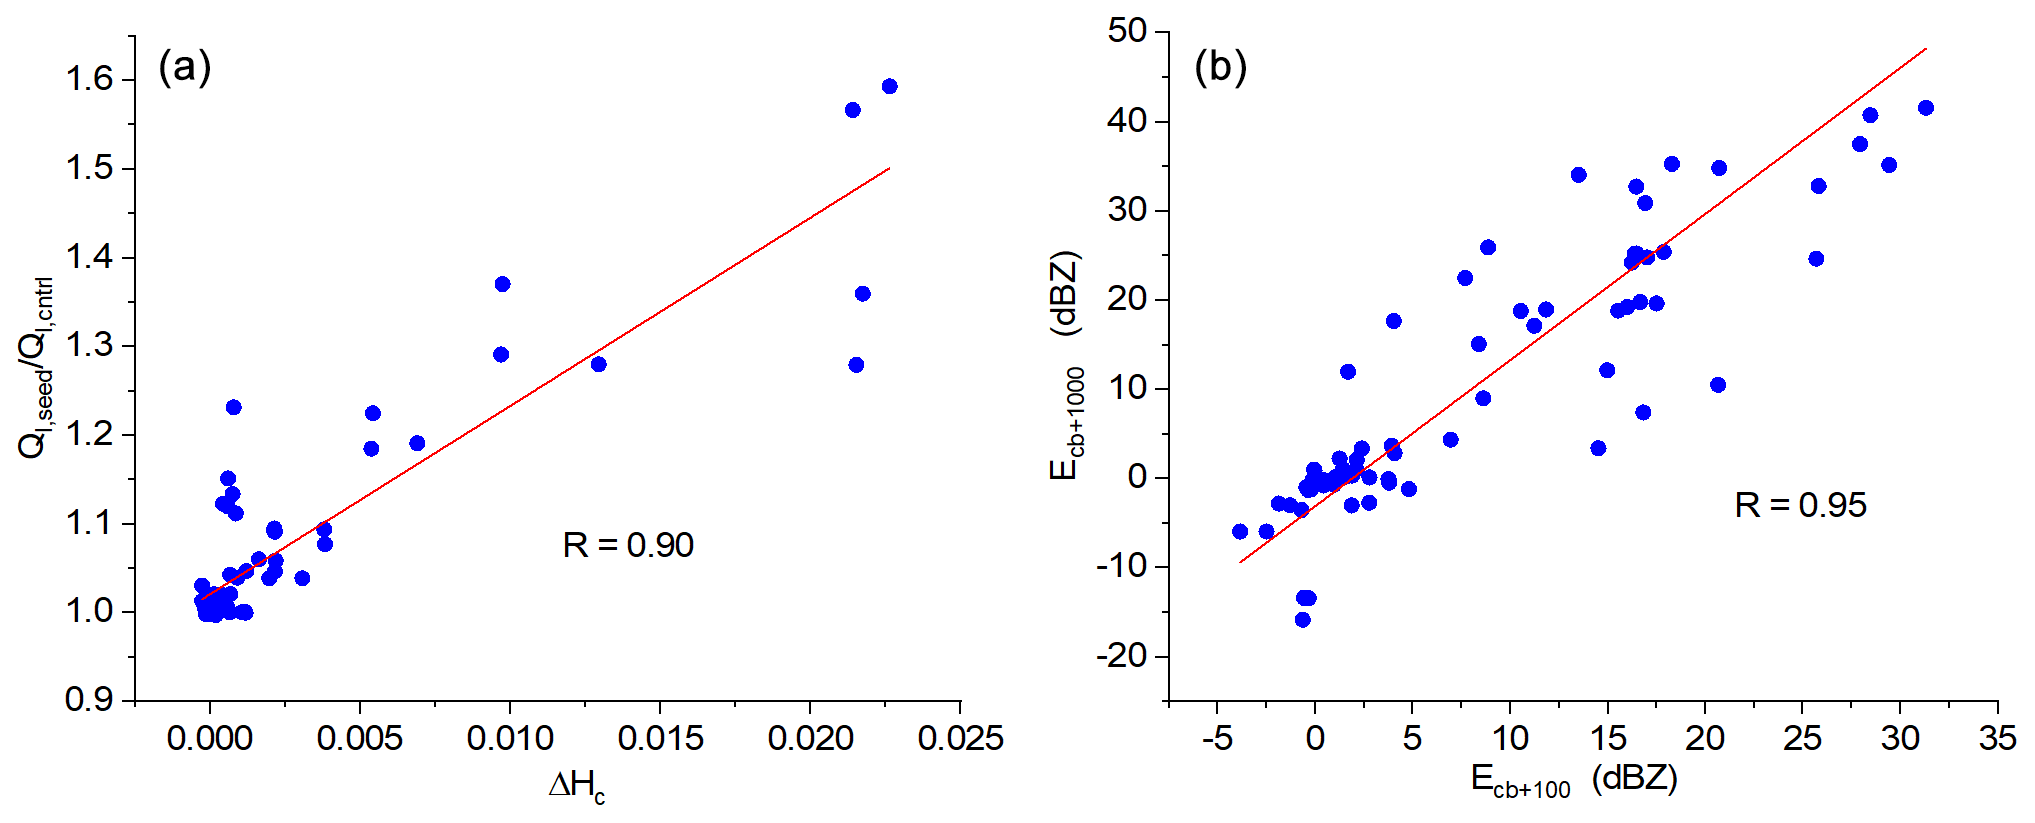
Figure 8(a) The impact of the change of the Hc parameter on the vapor uptake. The vertical coordinate represents the ratio of liquid water contents belonging to the seeded and associated control cases. (b) This panel shows how the broader size distribution generated by the Ostwald-ripening effect close to the cloud base (Ecb+100) can result in broadening of the size distribution comparing to the control case 1000 m above the cloud base (Ecb+1000). Ecb+100 and Ecb+1000 mean the calculated change of reflectivity due to seeding (Eq. 4) at 100 and 1000 m above the cloud base, respectively.
The broadening of the size distribution near the cloud base affects the subsequent evolutions of the DSDs. Figure 8 reveals that the larger the increase in the reflectivity due to the seeding at 100 m above the cloud base, the larger the increase in it at 1000 m above the cloud base. Broadening of the spectra due to the ripening effect promotes the collision–coalescence.
In a numerical study on the AgI seeding in winter orographic clouds by Geresdi et al. (2017), it was concluded that the efficiency of seeding is negatively correlated with the efficiency of precipitation formation in the control case. Furthermore, the chance of overseeding is not negligible. Figure 9 shows this relation in the studied hygroscopic seeding cases. Similar to the previously mentioned AgI seeding cases, the largest positive effect occurs if the reflectivity (1 km above the cloud base) in the related control case is small. However, a small negative effect can occur even in the case of a low reflectivity in the control case, if the concentration of the seeding particles was significantly larger than the concentration of the background aerosol particles. If the efficiency of the precipitation formation in the control case was large (BGQNM_1, Z≈ 20 dBZ), the seeding effect was small even if nanoparticles were injected. However, in this case, no negative seeding effect was found even if the concentration of the seeding materials was large. Reflectivity values around zero occurred in BGUAE_2 and BGUAE_3 control cases if the updraft velocity was 2 or 1 m s−1. In these cases, the impact of the background coarse particles was weaker than in the case of the maritime air mass (BGQNM_1) but larger than in other cases. We found the largest negative seeding effect in these conditions. Seeding nanoparticles resulted in a positive seeding effect, and seeding flare particles, independently of the dilution factor, resulted in a narrower DSD than in the control cases.

Figure 9The relation between the seeding efficiency (Ecb+1000) and the reflectivities for the control cases 1 km above the cloud base.
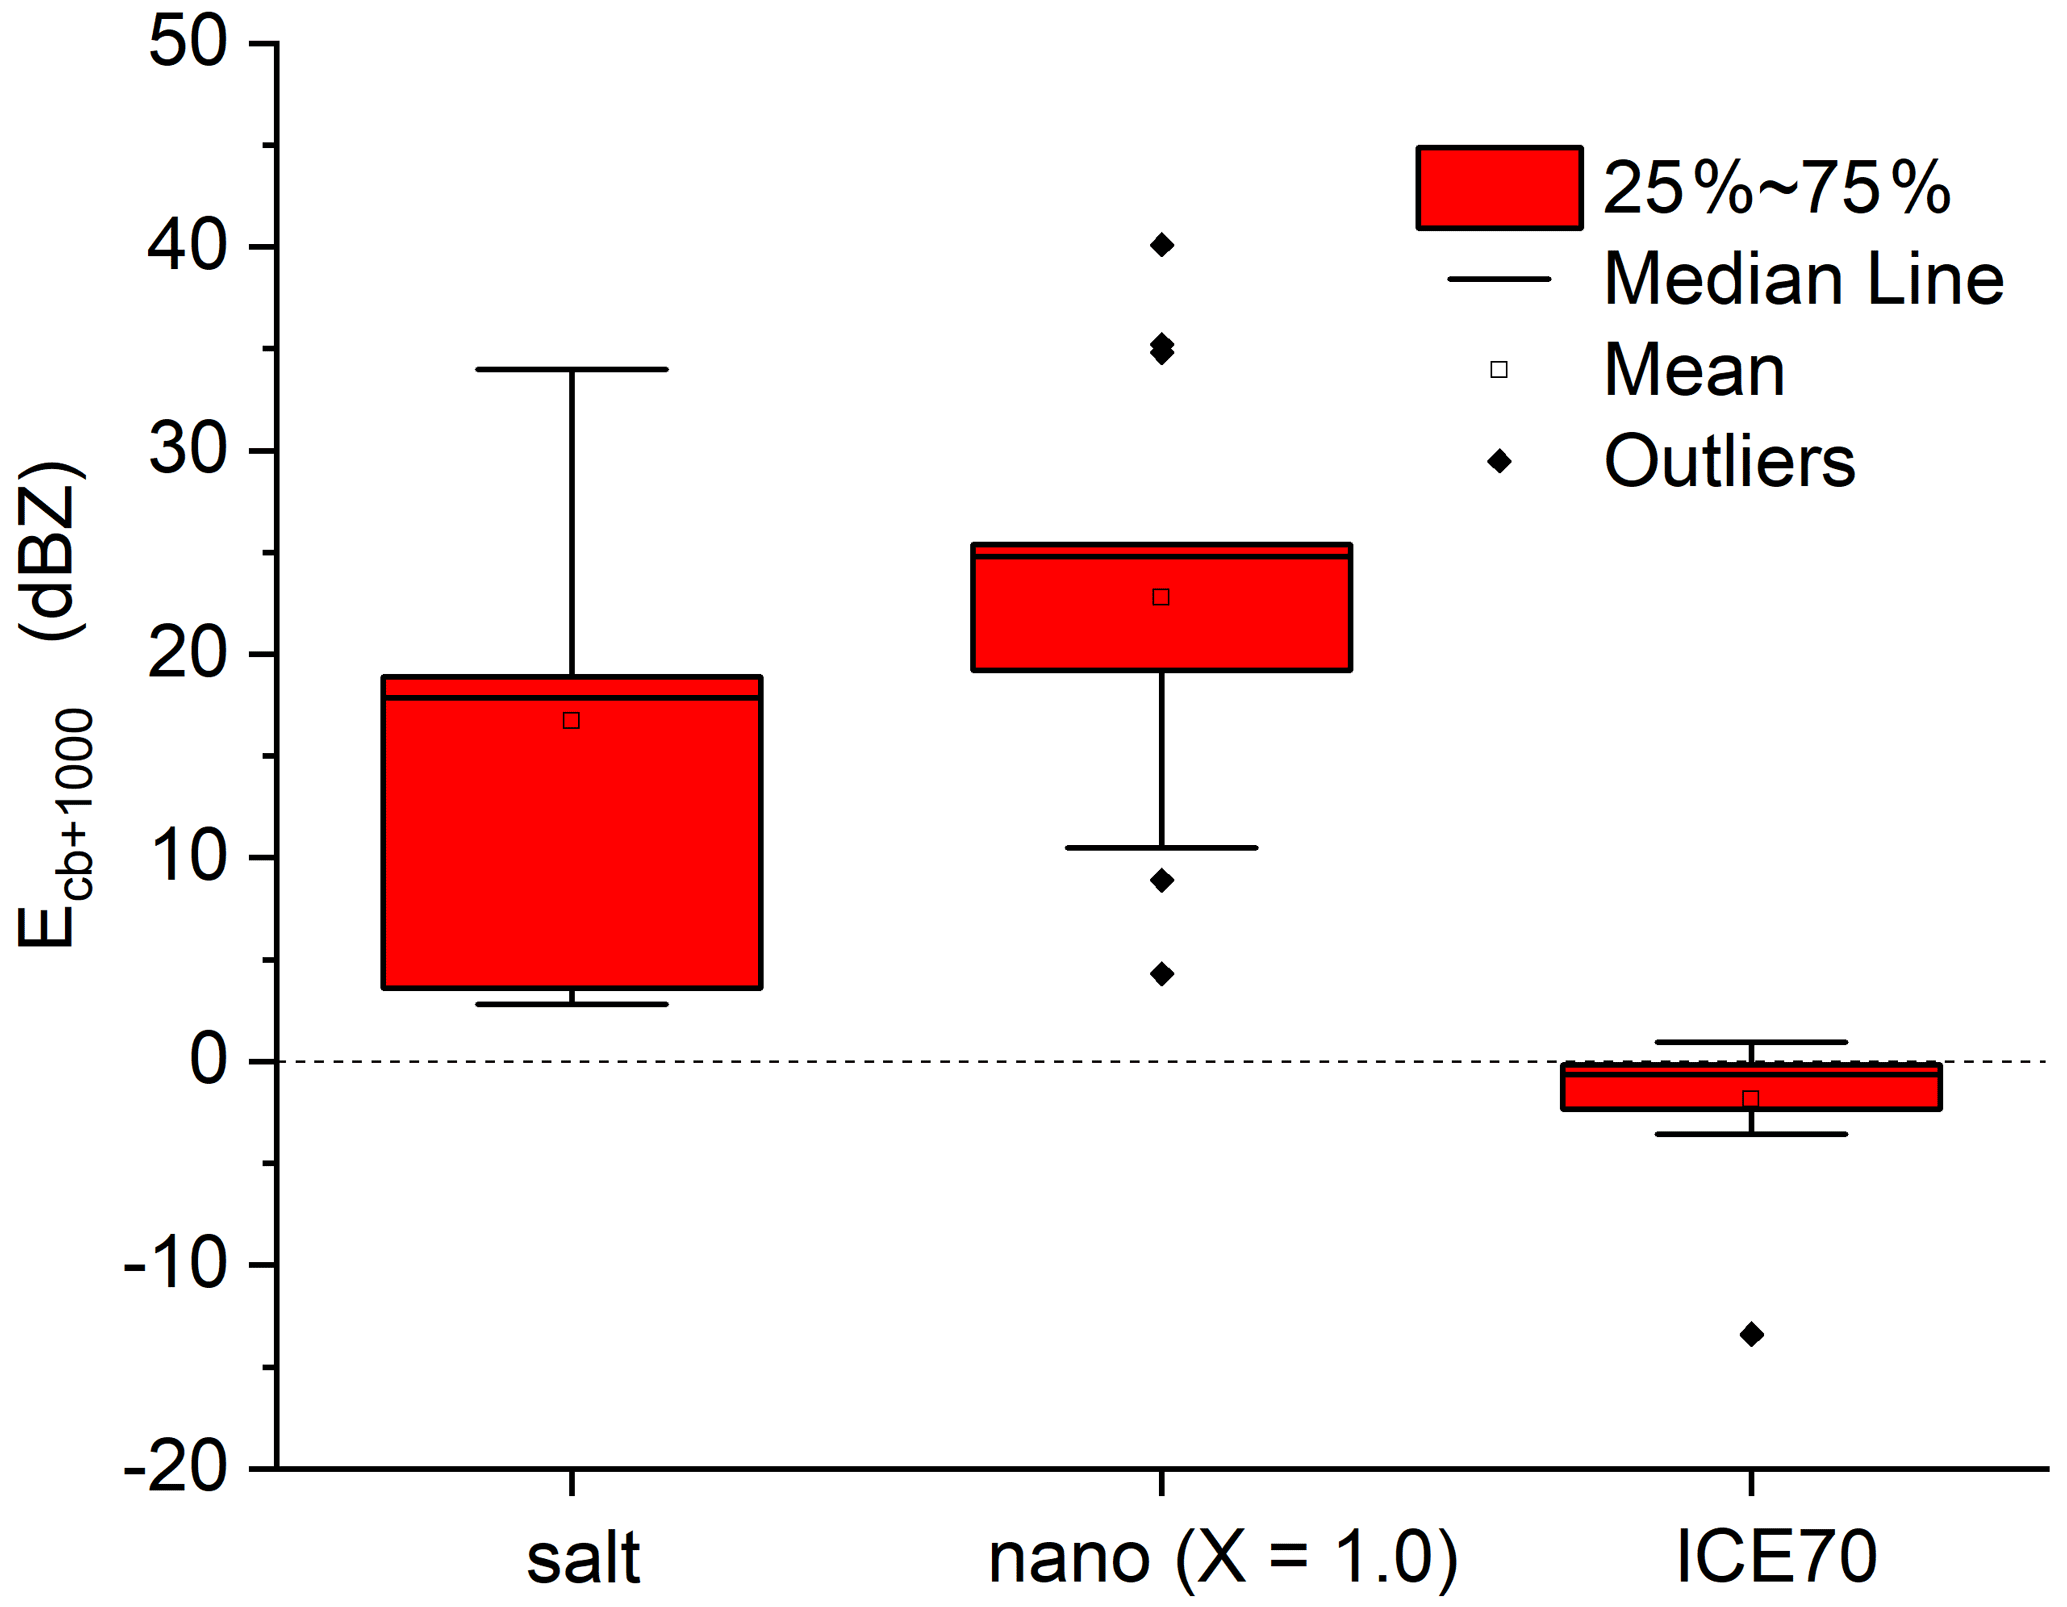
Figure 10The box-and-whisker plots presenting the efficiency range of three different seeding materials. The box plots are evaluated from data representing different background aerosol types and different updraft velocities.
The box-and-whisker plots in Fig. 10 show the range of seeding efficiency (Eq. 4) in the case of nanoparticles with X=1.0 (this value seems to be reasonable for real nanoparticles), X= infinity (this means salt particles) and ICE70 flare particles. Results show that the nanoparticles have no negative seeding effect, regardless of X values. If their concentration is large enough, they can result in a positive seeding effect even in the case of the maritime air mass. The impact of flare particles (ICE70 and NCM) is more ambiguous. The range of the seeding efficiency is from −13 to +3 dBZ. The large negative values occur if the concentration of the flare particles was significantly larger than the concentration of the background aerosols. A small positive effect was found in BGQNC cases if the updraft was moderate or small (w2 and w3 profiles in Fig. 1b) at the cloud base. Because the median of the seeding efficiency is close to zero, and the difference between the first and third quartiles is small, the impact of this type of seeding material was found to be insignificant in most of the cases.
In this research, it was found that broadening of the size distribution due to the Ostwald-ripening effect can have a significant effect on the evolution of the DSD. However, this effect can only be demonstrated if the vertical resolution resolves the sharp change of the supersaturation near the cloud base (Fig. 4b). This high resolution (about 10 m grid spacing or finer) is quite difficult to accomplish in an Eulerian model. A parameterization of this effect is to be developed in the next phase of this research. Furthermore, the implementation of the current microphysical scheme into the Lagrangian particle framework allows us to have a more realistic simulation of the early phase of precipitation formation by taking into consideration of the Ostwald-ripening effect in the full cloud volume and fallout of the hydrometeors. The other deficiency of the current simulation is that the model does not involve entrainment and mixing. These processes may have a significant effect on the evolution of the DSD (e.g., Lasher-Trapp et al., 2005; Tölle and Krueger, 2014; Grabowski and Abade, 2017; Abade et al., 2018). The implementation of these processes may also contribute to better understanding of the broadening mechanism of DSD near the cloud base.
The aircraft observations are archived at the UAE National Center of Meteorology. Readers can request the data set by contacting research@ncms.ae. The model codes and results are available upon request.
IG, LX, SC and YW conceptualized the study. YW, RB and SAT supported data collection and analysis. JL, WWG and RMR helped provide the model initial conditions. IG and NS performed the model simulations and analysis. IG, LX and SC wrote the manuscript. All co-authors were involved in the manuscript editing and discussion.
The contact author has declared that neither they nor their co-authors have any competing interests.
Publisher’s note: Copernicus Publications remains neutral with regard to jurisdictional claims in published maps and institutional affiliations.
This work was supported by the National Center of Meteorology, Abu Dhabi, UAE (UAE Research Program for Rain Enhancement Science). This material is based upon work supported by the National Center for Atmospheric Research, which is a major facility sponsored by the National Science Foundation under cooperative agreement no. 1852977. The contribution to this research by Istvan Geresdi and Noemi Sarkadi was also supported by the Hungarian Scientific Research Fund (Development and application of novel numerical model to investigate the precipitation formation in mixed phase clouds).
This research has been supported by the National Center of Meteorology, Abu Dhabi, UAE (UAE Research Program for Rain Enhancement Science); the National Science Foundation (grant no. 1852977); and the Hungarian Scientific Research Fund (Development and application of novel numerical model to investigate the precipitation formation in mixed phase clouds).
This paper was edited by Hailong Wang and reviewed by two anonymous referees.
Abade, G. C., Grabowski, W. W., and Pawlowska, H.: Broadening of cloud droplet spectra through eddy hopping: turbulent entraining parcel simulations, J. Atmos. Sci., 74, 1485–1493, https://doi.org/10.1175/JAS-D-18-0078.1, 2018.
Bermeo, M., Hadri, N. E., Ravaux, F., Zaki, A., Zou, L., and Jouiad, M.: Adsorption Capacities of Hygroscopic Materials Based on NaCl−TiO2 and NaCl−SiO2 Core/Shell Particles, Journal of Nanotechnology, 2020, 1–16, https://doi.org/10.1155/2020/3683629, 2020.
Blyth, A. M. and Latham, J.: An airborne study of vertical structure and microphysical variability within a small cumulus, Q. J. R. Meteorol. Soc., 111, 773-–792, https://doi.org/10.1002/qj.49711146907, 1985.
Brooks, S., Wise, M., Cushing, M., and Tolbert, M. A.: Deliquescence behavior of organic/ammonium sulfate aerosol, Geophys. Res. Lett., 29, 23-1–23-4, https://doi.org/10.1029/2002GL014733, 2002.
Bruintjes, R. T.: A Review of Cloud Seeding Experiments to Enhance Precipitation and Some New Prospects, Bull. Am. Meteorol. Soc., 80, 805–820, https://doi.org/10.1175/1520-0477(1999)080<0805:AROCSE>2.0.CO;2, 1999.
Bruintjes, R. T., Salazar, V., Semeniuk, T. A., Buseck, P., Breed, D. W., and Gunkelman, J.: Evaluation of Hygroscopic Cloud Seeding Flares, Journal of Weather Modification, 44, 69–94, 2012.
Cooper, W. A., Bruintjes, R. T., and Mather, G. K.: Some calculations pertaining to hygroscopic seeding with flares, J. Appl. Meteor., 36, 1449–1469, https://doi.org/10.1175/1520-0450(1997)036<1449:CPTHSW>2.0.CO;2, 1997.
Flossmann, A. I. and Wobrock, W.: A review of our understanding of the aerosol–cloud interaction from the perspective of a bin resolved cloud scale modelling, Atmos. Res., 97, 478–497, https://doi.org/10.1016/j.atmosres.2010.05.008, 2010.
Flossmann, A. I., Manton, M., Abshaev, A., Bruintjes, R., Murakami, M., Prabhakaran, T., and Yao, Z.: Review of Advances in Precipitation Enhancement Research, Bull. Am. Meteor. Soc., 100, 1465–1480, https://doi.org/10.1175/BAMS-D-18-0160.1, 2019.
Geresdi, I. and Rasmussen, R.: Freezing drizzle formation in stably stratified layer clouds, Part II: The role of giant nuclei and aerosol particle size distribution, J. Atmos. Sci., 62, 2037–2057, https://doi.org/10.1175/JAS3452.1, 2005.
Geresdi, I., Xue, L., and Rasmussen, R.: Evaluation of Orographic Cloud Seeding Using Bin Microphysics Scheme: Two-dimensional approach, J. Appl. Met. Clim., 56, 1443–1462, https://doi.org/10.1175/JAMC-D-16-0045.1, 2017.
Grabowski, W. W. and Abade, G. C.: Broadening of cloud droplet spectra through eddy hopping: Turbulent adiabatic parcel simulations, J. Atmos. Sci., 74, 1485–1493, https://doi.org/10.1175/JAS-D-17-0043.1, 2017.
Grabowski, W. W. and Wang, L.-P.: Diffusional and accretional growth of water drops in a rising adiabatic parcel: effects of the turbulent collision kernel, Atmos. Chem. Phys., 9, 2335–2353, https://doi.org/10.5194/acp-9-2335-2009, 2009.
Grabowski, W. W., Morrison, H., Shima, S. I., Abade, G. C., Dziekan, P., and Pawlowska, H.: Modeling of Cloud Microphysics: Can We Do Better?, Bull. Am. Meteor. Soc., 100, 655–672, https://doi.org/10.1175/BAMS-D-18-0005.1, 2019.
Jensen, J. B. and Lee, S.: Giant sea-salt aerosols and warm rain formation in marine stratocumulus, J. Atmos. Sci. 65, 3678–3694, https://doi.org/10.1175/2008JAS2617.1, 2008.
Klinger, C., Feingold, G., and Yamaguchi, T.: Cloud droplet growth in shallow cumulus clouds considering 1-D and 3-D thermal radiative effects, Atmos. Chem. Phys., 19, 6295–6313, https://doi.org/10.5194/acp-19-6295-2019, 2019.
Kogan, Y. L.: The simulation of a convective cloud in a 3D model with explicit microphysics. Part I: Model description and sensitivity experiments, J. Atmos. Sci., 48, 1160–1189, https://doi.org/10.1175/1520-0469(1991)048<1160:TSOACC>2.0.CO;2, 1991.
Kuba, N. and Murakami, M.: Effect of hygroscopic seeding on warm rain clouds – numerical study using a hybrid cloud microphysical model, Atmos. Chem. Phys., 10, 3335–3351, https://doi.org/10.5194/acp-10-3335-2010, 2010.
Lasher-Trapp, S. G., Cooper, W. A., and Blyth, A. M.: Broadening of droplet size distributions from entrainment and mixing in a cumulus cloud, Q. J. Roy. Meteorol. Soc., 131, 195–220, https://doi.org/10.1256/qj.03.199, 2005.
Lee, J. A., Wehbe, Y., Liu, C., Tessendorf, S. A., Weeks, C., Chen, S., Bruintjes, R., Rasmussen, R. M., and Xue, L.: Sensitivity study of 1 km WRF configurations and aerosol loading on convective initiation over the Al Hajar Mountains, 13th Symp. on Aerosol-Cloud-Climate Interactions, Amer. Meteor. Soc. [Virtual Meeting], 6.9, available at: https://ams.confex.com/ams/101ANNUAL/meetingapp.cgi/Paper/383772 (last access: 19 October 2021), 2021.
Lompar, M., Ćurić, M., Romanic, D., Zou, L., and Liang, H.: Precipitation enhancement by cloud seeding using the shell structured aerosol as revealed by new model for cloud seeding experiments, Atmos. Res., 212, 202–212, https://doi.org/10.1016/j.atmosres.2018.05.021, 2018.
Mather, G. K., Terblanche, D. E., Steffens, F. E., and Fletcher, L.: Results of the South African cloud-seeding experiments using hygroscopic flares, J. Appl. Meteor., 36, 1433–1447, 1997.
Mazroui, A. A. and Farrah, S.: The UAE seeks leading position in global rain enhancement research, Journal of Weather Modification, 49, 54–59, 2017.
Morrison, H., van Lier-Walqui, M., Fridlind, A. M., Grabowski, W. W., Harrington, J. Y., Hoose, C., Korolev, A., Kumjian, M. R., Milbrandt, J. A., Pawlowska, H., Posselt, D. J., Prat, O. P., Reimel, K. J., Shima, S., van Diedenhoven, B., and Xue, L.: Confronting the challenge of modeling cloud and precipitation microphysics, J. Adv. Model. Earth Sy., 12, 1–68, https://doi.org/10.1029/2019MS001689, 2020.
Petters, M. D. and Kreidenweis, S. M.: A single parameter representation of hygroscopic growth and cloud condensation nucleus activity, Atmos. Chem. Phys., 7, 1961–1971, https://doi.org/10.5194/acp-7-1961-2007, 2007.
Rasmussen, R., Geresdi, I., Thompson, G., Manning, K., and Karplus, E.: Freezing drizzle formation in stably stratified layer clouds, Part I: The role of radiative cooling of cloud droplets, cloud condensation nuclei, and ice initiation, J. Atmos. Sci., 59, 837–860, https://doi.org/10.1175/1520-0469(2002)059<0837:FDFISS>2.0.CO;2, 2002.
Reisin, T., Levin, Z., and Tzivion, S.: Rain production in convective clouds as simulated in an axisymmetric model with detailed microphysics, Part I: description of the model, J. Atmos. Sci. 53, 497–519, https://doi.org/10.1175/1520-0469(1996)053<0497:RPICCA>2.0.CO;2, 1996.
Rogers, R. R. and Yau, M. K.: A short course in cloud physics, 3rd edition, Elsevier, Oxford, UK, ISBN 0-7506-3215-1, 1996.
Segal, Y., Khain, A., Pinsky, M., and Rosenfeld, D.: Effects of hygroscopic seeding on raindrop formation as seen from simulations using a 2000-bin spectral cloud parcel model, Atmos. Res., 71, 3–34, https://doi.org/10.1016/j.atmosres.2004.03.003, 2004.
Segal, Y., Pinsky, M., and Khain, A.: The role of competition effect in the raindrop formation, Atmos. Res., 83, 106–118, https://doi.org/10.1016/j.atmosres.2006.03.007, 2007.
Semeniuk, T. A., Bruintjes, R. T., Salazar, V., Breed, D. W., Jensen, T. L., and Buseck, P. R.: Individual aerosol particles in ambient and updraft conditions below convective cloud bases in the Oman mountain region, J. Geophys. Res.-Atmos., 119, 2511–2528, https://doi.org/10.1002/2013JD021165, 2014.
Tai, Y., Liang, H., Zaki, A., El Hadri, N., Abshaev, A. M., Huchunaev, B. M., Griffiths, S., Jouiad, M., and Zou, L.: Core/shell microstructure induced synergistic effect for efficient water-droplet formation and cloud-seeding application, ACS Nano, 11, 12318–12325, https://doi.org/10.1021/acsnano.7b06114, 2017.
Tessendorf, S. A., Bruintjes, R. T., Weeks, C., Wilson, J. W., Knight, C. A., Roberts, R. D., Peter, J. R., Collis, S., Buseck, P. R., Freney, E., Dixon, M., Pocernich, M., Ikeda, K., Axisa, D., Nelson, E., May, P. T., Richter, H., Piketh, S., Burger, R. P., Wilson, L., Siems, S. T., Manton, M., Stone, R. C., Pepler, A., Collins, D. R., Bringi, V. N., Thurai, M., Turner, L., and McRae, D.: The Queensland Cloud Seeding Research Program, B. Am. Meteorol. Soc., 93, 75–90, https://doi.org/10.1175/BAMS-D-11-00060.1, 2012.
Tessendorf, S. A., Chen, S., Weeks, C., Bruintjes, R., Rasmussen, R. M., and Xue, L.: The influence of hygroscopic flare seeding on drop size distribution over southeast Queensland, J. Geophys. Res.-Atmos., 126, 1–15, https://doi.org/10.1029/2020JD033771, 2021.
Tölle, M. H. and Krueger, S. K.: Effects of entrainment and mixing on droplet size distributions in warm cumulus clouds, J. Adv. Model. Earth Sys., 6, 281–299, https://doi.org/10.1002/2012MS000209, 2014
Wehbe, Y., Tessendorf, S. A., Weeks, C., Bruintjes, R., Xue, L., Rasmussen, R., Lawson, P., Woods, S., and Temimi, M.: Analysis of aerosol–cloud interactions and their implications for precipitation formation using aircraft observations over the United Arab Emirates, Atmos. Chem. Phys., 21, 12543–12560, https://doi.org/10.5194/acp-21-12543-2021, 2021.
Wise, M. E., Semeniuk, T. A., Bruintjes, R., Martin, S. T., Russell, L. M., and Buseck, P. R.: Hygroscopic behavior of NaCl-bearing natural aerosol particles using environmental transmission electron microscopy, J. Geophys. Res., 112, D10224, https://doi.org/10.1029/2006JD007678, 2007.
Witte, M. K., Ayala, O., Wang, L.-P., Bott, A., and Chuang, P. Y.: Estimating collision-coalescence rates from in situ observations of marine stratocumulus, Q. J. Roy. Meteor. Soc., 143, 2755–2763, https://doi.org/10.1002/qj.3124, 2017.
Xue, L., Teller, A., Rasmussen, R., Geresdi, I., and Pan, Z.: Effects of solubility and regenerated aerosols on warm-phase orographic clouds and precipitation simulated by a detailed bin microphysical scheme coupled with WRF, J. Atmos. Sci., 67, 3336–3354, https://doi.org/10.1175/2010JAS3511.1, 2010.
Xue, L., Teller, A., Rasmussen, R., Geresdi, I., Pan, Z., and Xiaodong, L.: Effects of solubility and regenerated aerosols on mixed-phase orographic clouds and precipitation simulated by a detailed bin microphysical scheme coupled with WRF, J. Atmos. Sci., 69, 1994–2010, https://doi.org/10.1175/JAS-D-11-098.1, 2012.
Yang, F., Kollias, P., Shaw, R. A., and Vogelmann, A. M.: Cloud droplet size distribution broadening during diffusional growth: ripening amplified by deactivation and reactivation, Atmos. Chem. Phys., 18, 7313–7328, https://doi.org/10.5194/acp-18-7313-2018, 2018.
Yin, Y., Levin, Z., Reisin, T. G., and Tzivion, S.: The effects of giant cloud condensation nuclei on the development of precipitation in convective clouds–A numerical study, Atmos. Res., 53, 93–116, https://doi.org/10.1016/S0169-8095(99)00046-0, 2000.
Yum, S. S. and Hudson, J. G.: Cloud microphysical relationships in warm clouds, Atmos. Res., 57, 81–104, 2001.
Yum, S. S. and Hudson, J. G.: Adiabatic predictions and observations of cloud droplet spectral broadness, Atmos. Res., 73, 203–223, 2005.