the Creative Commons Attribution 4.0 License.
the Creative Commons Attribution 4.0 License.
 | 26 Oct 2021
Aerosol absorption in global models from AeroCom phase III
Bjørn H. Samset
Gunnar Myhre
Jonas Gliß
Susanne E. Bauer
Huisheng Bian
Mian Chin
Ramiro Checa-Garcia
Paul Ginoux
Zak Kipling
Alf Kirkevåg
Harri Kokkola
Philippe Le Sager
Marianne T. Lund
Hitoshi Matsui
Twan van Noije
Dirk J. L. Olivié
Samuel Remy
Michael Schulz
Philip Stier
Camilla W. Stjern
Toshihiko Takemura
Kostas Tsigaridis
Svetlana G. Tsyro
Duncan Watson-Parris
Aerosol-induced absorption of shortwave radiation can modify the climate through local atmospheric heating, which affects lapse rates, precipitation, and cloud formation. Presently, the total amount of aerosol absorption is poorly constrained, and the main absorbing aerosol species (black carbon (BC), organic aerosols (OA), and mineral dust) are diversely quantified in global climate models. As part of the third phase of the Aerosol Comparisons between Observations and Models (AeroCom) intercomparison initiative (AeroCom phase III), we here document the distribution and magnitude of aerosol absorption in current global aerosol models and quantify the sources of intermodel spread, highlighting the difficulties of attributing absorption to different species. In total, 15 models have provided total present-day absorption at 550 nm (using year 2010 emissions), 11 of which have provided absorption per absorbing species. The multi-model global annual mean total absorption aerosol optical depth (AAOD) is 0.0054 (0.0020 to 0.0098; 550 nm), with the range given as the minimum and maximum model values. This is 28 % higher compared to the 0.0042 (0.0021 to 0.0076) multi-model mean in AeroCom phase II (using year 2000 emissions), but the difference is within 1 standard deviation, which, in this study, is 0.0023 (0.0019 in Phase II). Of the summed component AAOD, 60 % (range 36 %–84 %) is estimated to be due to BC, 31 % (12 %–49 %) is due to dust, and 11 % (0 %–24 %) is due to OA; however, the components are not independent in terms of their absorbing efficiency. In models with internal mixtures of absorbing aerosols, a major challenge is the lack of a common and simple method to attribute absorption to the different absorbing species. Therefore, when possible, the models with internally mixed aerosols in the present study have performed simulations using the same method for estimating absorption due to BC, OA, and dust, namely by removing it and comparing runs with and without the absorbing species. We discuss the challenges of attributing absorption to different species; we compare burden, refractive indices, and density; and we contrast models with internal mixing to models with external mixing. The model mean BC mass absorption coefficient (MAC) value is 10.1 (3.1 to 17.7) m2 g−1 (550 nm), and the model mean BC AAOD is 0.0030 (0.0007 to 0.0077). The difference in lifetime (and burden) in the models explains as much of the BC AAOD spread as the difference in BC MAC values. The difference in the spectral dependency between the models is striking. Several models have an absorption Ångstrøm exponent (AAE) close to 1, which likely is too low given current knowledge of spectral aerosol optical properties. Most models do not account for brown carbon and underestimate the spectral dependency for OA.
- Article
(2492 KB) - Full-text XML
-
Supplement
(447 KB) - BibTeX
- EndNote


Aerosols directly affect the energy budget of the atmosphere by interacting with solar radiation. While all aerosols scatter shortwave radiation, some also absorb it, which in turn modifies the thermal structure of the surrounding air masses (McCormick and Ludwig, 1967). This localised atmospheric heating can lead to rapid changes in dynamics, clouds, and precipitation (Hansen et al., 1997; Ackerman et al., 2000). The concentrations of (absorbing) aerosols vary greatly, temporally and spatially, due to their diverse and intermittent emission sources (e.g. forest fires) and short atmospheric lifetimes (days to 1–2 weeks). The ability of an aerosol to absorb solar radiation depends on its composition, mixing state, component refractive indices, size, and shape, which can also change during its lifetime. The dominant absorbing aerosol is black carbon (BC), followed by mineral dust and organic-carbon-based aerosols (OAs) or brown carbon (BrC). The three absorbing species are rarely observed as single species (Fierce et al., 2016), while many models are not able to fully mix the aerosols and, therefore, treat them as separate species in an idealised way with their own life cycles and optical properties.
BC, emitted from incomplete combustion processes, is a particularly strong absorber of solar radiation and absorbs across the entire solar spectrum (Bond et al., 2013). BC quickly mixes with other aerosols and often becomes coated. This process enhances the effective absorptivity of BC over time and is often referred to as ageing (Cappa et al., 2012). Some climate models use a constant enhancement factor of 1.5 to define the absorption of aged BC relative to freshly emitted BC (Bond and Bergstrom, 2006). Internally mixed BC has greater absorption than externally mixed BC (Haywood and Shine, 1995; Fuller et al., 1999; Bauer et al., 2010). This is because the internal mixtures have larger geometrical cross-sectional areas than the BC inclusions within the mixtures (Stier et al., 2006).
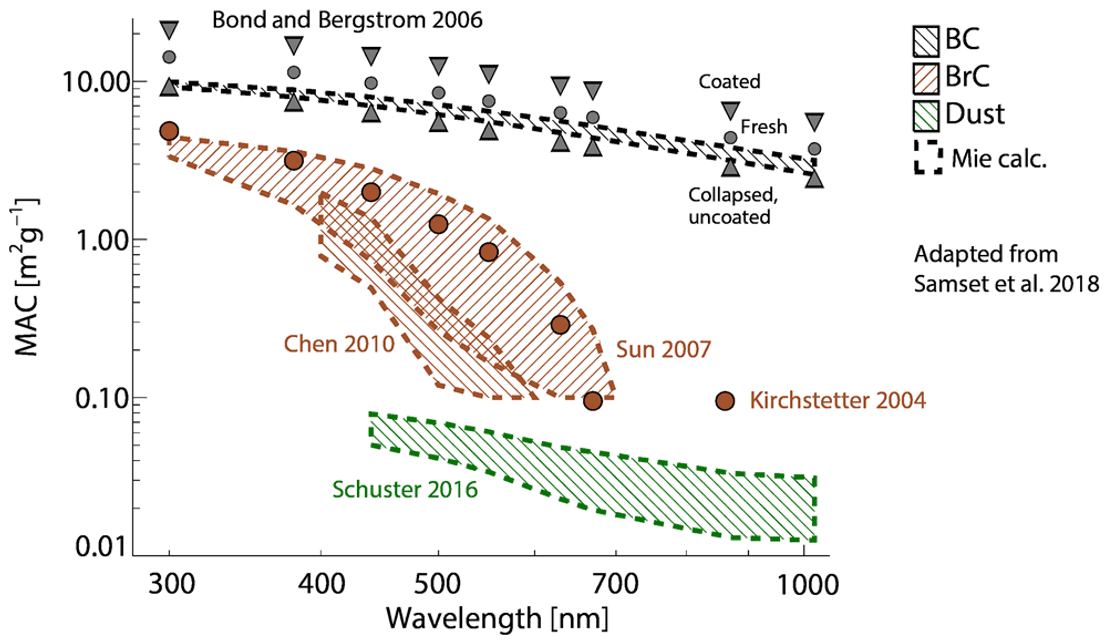
Figure 1Per-species mass absorption coefficient (MAC) as a function of wavelength from observations and radiative transfer calculations. BC, BrC, and dust can be seen to have separable properties, which underlie the usage of these species as emitted, transported, and radiatively active particle types in most global climate models. Size distributions for BC and BrC had a radius and sigma of 0.04 µm and 1.5 for BC and 0.05 µm and 2.0 for BrC, while, for mineral dust, they used observed sizes from the DABEX aerosol campaign (Osborne et al., 2008). Aerosol densities were 1.2, 1.8, and 2.6 g cm−3, for BrC, BC, and dust, respectively. Grey circles (triangles) illustrate MAC values for fresh (coated and uncoated) BC, where the Mie calculations have been scaled to achieve the recommended MAC of 7.5 m2 g−1 at 550 nm (Bond and Bergstrom, 2006). Adapted from Samset et al. (2018).
Mineral dust is one of the most abundant aerosols by mass, which is close to 60 %–70 % of the dry mass from the multi-model estimates in the internationally coordinated Aerosol Comparisons between Observations and Models (AeroCom) phases I and III study (Textor et al., 2007; Gliß et al., 2021). However, dust has a much lower imaginary part of the refractive index compared to BC and absorbs less per mass (Sokolik and Toon, 1999). Absorption also depends on particle size distribution. While fine dust particles mostly scatter solar radiation, coarse dust also absorbs moderately in the visible and near-infrared spectrum (Ryder et al., 2013, 2018). Models tend to substantially underestimate (or even neglect) the amount of coarse dust particles (with diameter ≥ 5 µm) in the atmosphere, and very large particles are rarely represented in models (Adebiyi and Kok, 2020; Kok et al., 2017). This bias may imply that models underestimate the absorption by mineral dust, at least in the longwave spectrum (Lacagnina et al., 2015). However, the constraints in the current dust emissions schemes make the models reproduce dust optical depth reasonably well (Ridley et al. 2016), with a consistent regional seasonal cycle when compared with satellite observations, and AERONET local measurements tend to be well reproduced over dusty stations (Pu and Ginoux, 2018; Checa-Garcia et al., 2021). Absorption also varies strongly with dust mineralogical composition, which depends on the parent soil – specific deserts typically have different fractions of mineral types. Iron oxides (hematite and goethite) are minerals that enhance the absorption, while other minerals have weaker absorption. Dust absorption also has a distinct wavelength dependence – something that is missing in most climate models (e.g. Perlwitz et al., 2015).
Organic aerosols (OAs) are complex mixtures of directly emitted particulate organic matter containing carbon–carbon bonds from anthropogenic, biomass burning, and biogenic sources, as well as chemically produced secondary OA. OA is highly reflective, but it can also include weakly absorbing organic compounds (Andreae and Gelencsér, 2006). The absorptivity of organic aerosols decreases rapidly from UV to visible wavelengths (Kirchstetter et al., 2004). The ratio of OA to organic carbon (OC) varies in the models, and it is usually between 1.4 up to 2.2 (Tsigaridis et al., 2014). BC is often coated with OA, and a strict separation between the two aerosol types is difficult to make (Jacobson et al., 2000).
Figure 1 illustrates how the dependence of the mass absorption coefficient (MAC) on wavelength differs between these three major species of absorbing aerosols (Samset et al., 2018). It shows both observations (shaded bands) and Mie calculations made using parameters from the recent literature. Here, the rapid decrease in absorption with wavelength for OA compared to BC and dust is apparent. The brown shaded areas correspond to organic aerosols that are washed with solvents to extract the absorbing organic aerosols from the non-absorbing organic aerosols and are often referred to as brown carbon (BrC). For BC, the figure also shows additional MAC values (grey circles), where the Mie calculations have been scaled to achieve the value of 7.5 m2 g−1 at 550 nm recommended in Bond and Bergstrom (2006), and the range of values found in the literature for coated BC and collapsed, uncoated BC. For further details, see Samset et al. (2018).
The AeroCom assesses state-of-the-art aerosol modelling to better understand global aerosols and their impact on climate (https://aerocom.met.no, last access: 4 October 2021; Schulz et al., 2006; Kinne et al., 2006; Textor et al., 2007; Koch et al., 2009). The models use a common protocol and are encouraged to use identical emission inventories for prescribed emissions. In the previous AeroCom phase II experiment, the total direct radiative forcing was estimated at −0.27 W m−2 from 16 models (Myhre et al., 2013). The present-day absorption aerosol optical depth (AAOD) at 550 nm was estimated at 0.0042, with a range of [0.0021, 0.0076] (Samset et al., 2018). Table S1 in the Supplement provides numbers for the individual models used in AeroCom phase II. In this study, we use the term absorption aerosol optical depth (AAOD) to describe aerosol absorption and not atmospheric absorption, which is the difference between radiative fluxes between the top of the atmosphere (TOA) and the surface (in watts per square metre; hereafter W m−2). The latter depends on clouds and surface albedo in the models (Stier et al., 2013).
Gliß et al. (2021) made an overall evaluation of the optical properties in AeroCom phase III with a comparison of a wide range of remote sensing and in situ observations. They found that most models underestimate total column AOD and dry (i.e. below RH < 40 %) surface scattering and absorption coefficients, suggesting that aerosol loadings might be underestimated. A comparison with AERONET measurements of the Ångström exponent (AE) suggested that models overestimate size or underestimate the fine mode fraction, but the separation into fine (< 1 µm diameter) and coarse mode (> 1 µm) AOD indicated that the same behaviour does not apply for this specific size segregation.
Since the total aerosol absorption depends on the composition, size, and shape of aerosols, all of which vary greatly with space and time, the magnitude of aerosol absorption is highly uncertain, both from a measurement perspective and in general circulation models (Haywood and Shine, 1995; Cooke and Wilson, 1996; Moosmüller et al., 2009). Models that assume internal mixing of aerosols can calculate the absorption enhancement based on the mixing state, but these calculations are approximate (using mixing rules or the assumptions of a concentric core/shell structure; Stier et al., 2007). These calculations rely on reliable representations of the aerosol mixing state as well as on underlying assumptions in the calculation of the optical properties, such as the use of effective medium approximations or core/shell models (see Stier et al., 2007).
To further investigate these issues, we here present aerosol absorption simulated with 15 state-of-the-art aerosol models from AeroCom phase III. We aim to better quantify the sources of the model spread by separating absorption per species (BC, OA, and dust) and to investigate regional and seasonal differences. For models with internally mixed aerosols, it is conceptually difficult to report on separate absorption by species. In this study, the models with internally mixed aerosols have estimated the absorption by individual species using the same method when possible and by removing an absorbing species and comparing the absorption in simulations with and without that species.
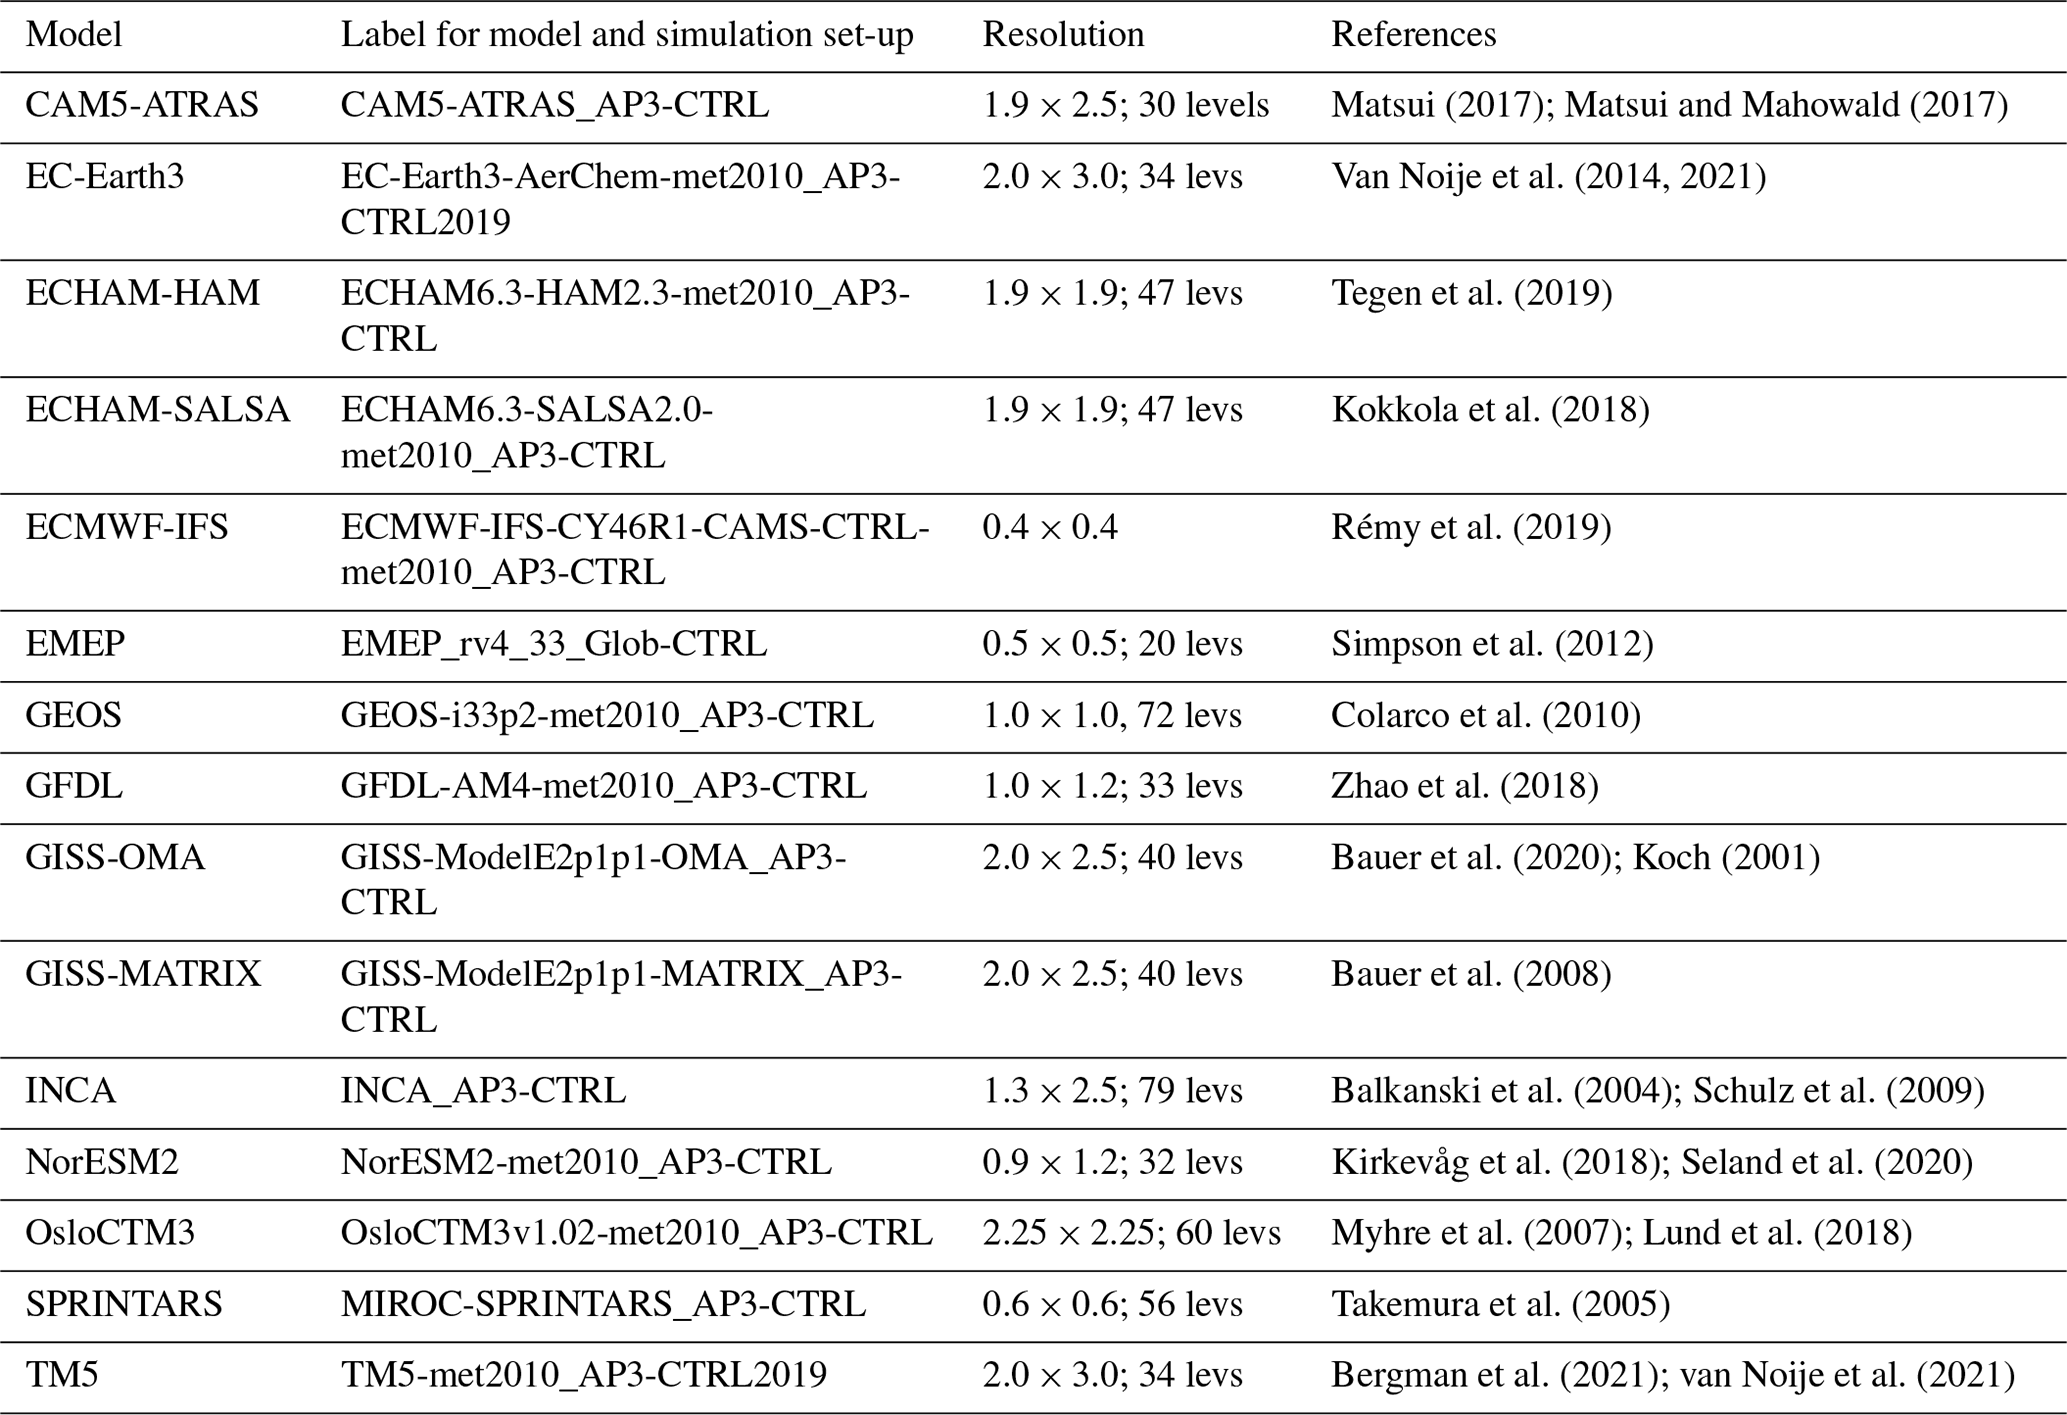
2.1 AeroCom models
Tables 1 and 2 summarises the models used in this paper. The models have provided monthly mean values for 2010 using the same prescribed anthropogenic and biomass burning emission data sets when possible and with fixed sea surface temperatures. Some models also applied atmospheric nudging to the 2010 meteorology. Anthropogenic fossil fuel, biofuel, and biomass burning emissions are from the Community Emission Data System (CEDS; Hoesly et al., 2018) and from the historical global biomass burning emissions for CMIP6 (van Marle et al., 2017). EMEP used ECLIPSE emissions, which for BC is somewhat lower compared to CMIP6. It is only BC emissions among the absorbing species that are consistent among the models. BC emissions range from 8.4 Tg yr−1 to 9.8 Tg yr−1, while dust emissions, which in most models are calculated online and based on modelled climate and land surface properties, range (globally averaged) from 848 to 5646 Tg yr−1, and OA emissions vary from 48 to 246 Tg yr−1. Note that these emission numbers include all production terms of OA, as the models have reported this differently. Differences in emissions occur because the models have different OA/OC ratios, and not all models include marine emissions, for example (for more information, see Gliß et al., 2021). A total of 15 models have provided total absorption at 550 nm, and 11 models have provided absorption split into BC, dust, and OA.
As shown in Table 2, there are differences in mixing assumptions. A few models assume fully externally mixed aerosols, while most models assume partly internal mixing, using different mixing rules for calculating the refractive indices. For models with external mixing, it is straightforward to estimate species–specific absorption. The mass absorption coefficient (MAC) for any species is estimated using Mie theory and is a function of density, size distribution, and the imaginary component of the complex refractive index at a given wavelength. For models with internal mixing, the estimated absorption per species is more conceptually difficult because the sum of the absorption for each species does not always equal to the total absorption by the internal mixture. For this study, the models with internal mixing, when possible, have used the same method for estimated species–specific absorption by removing the target species and estimating the total absorption between the control run and the run with the species removed. This is an appropriate and accurate approach for particles that have a single absorbing species since the absorbing compound causes all the absorption. However, for particles having two or more absorbing species, this method causes changes the size distribution of the other absorbing aerosols and, thus, may yield an inaccurate result for absorption of an individual aerosol. For instance, for ECHAM-SALSA, removing OA reduced the size of BC, since it is internally mixed with OC. The volume absorption cross section then increased, and the same amount of BC became more absorptive, resulting in a negative OA absorption. Therefore, for some models the individual aerosol absorption is not reported or is calculated offline.
All models have reported all-sky AAOD. A comprehensive description of the AeroCom phase III models is given in Gliß et al. (2021). Note that the same AeroCom control model experiment was used in the present study as by Gliß et al. (2021), and that the aerosol life cycle properties (emissions, lifetime, and burden) and optical properties are consistent between the two studies (although there are a few exceptions for model versions of ECMWF-IFS, Oslo-CTM3, and new runs described below for the models with internal mixing, as well as ECHAM-HAM, GFDL, and NorESM2, but with the same model version).

In this section, we first present model results of the total AAOD at 550 nm and the AAOD contributions from BC, OA, and dust, with a comparison of MAC, mass density, column load, and refractive index, followed by a discussion about the absorption Ångström exponent.
3.1 Total AAOD in AeroCom phase III
Figure 2 shows the total AAOD at 550 nm for the 15 AeroCom phase III models. AAOD values for all the models are given in Table S2 in the Supplement. The multi-model global annual mean is 0.0054, with a standard deviation of 0.0023. The multi-model mean is 28 % higher than the previous multi-model mean in AeroCom phase II (using emissions for year 2000; Samset et al., 2018). In AeroCom phase II, the multi-model mean (using 14 models) is 0.0042, with a range from 0.0021 to 0.0076 and a standard deviation of 0.0019. The model range in total AAOD in AeroCom phase III (0.0078) is larger than in phase II (0.0055), but the spread (here defined as range/mean) is similar (1.5 and 1.3). The global mean AAOD for the different models in AeroCom phase II is given in Table S1 in Supplement. The global mean values range from 0.0020 (SPRINTARS) to 0.0098 (GISS-MATRIX). The two models differ substantially in their treatment of aerosol absorption. In SPRINTARS, the aerosols are externally mixed. In GISS-MATRIX, all aerosols are internally mixed, and populations are tracked by mixing state. Also, the imaginary part of the refractive index of BC differs considerably (1.75 + 0.44i for SPRINTARS and 1.85 + 0.71i for GISS-MATRIX), as discussed further in Sect. 3.2.
The spread in total AAOD is particularly large at NH midlatitudes. The seasonal cycle has maximum values during August and September, which is linked to biomass burning in South America and Southern Africa, along with dust plumes from the Saharan desert. The annual mean geographical distribution shows strong absorption over central Africa, linked to biomass burning, and maxima in China and India, which are linked to anthropogenic emissions.

Figure 2Total AAOD at λ= 550 nm from the models, with annual global mean, annual zonal mean, the global seasonal cycle, and annual mean spatial distributions. The models with grey shading have externally mixed BC. Values for global mean AAOD are given in the Supplement (Table S2).
3.2 Absorption of BC, OA, and dust
The relative contribution of the total absorption (in terms of AAOD) from BC, OA, and dust varies from model to model. Absorption of BC accounts for, on average, 60 % of total absorption (with a range 36 %–84 %). The absorption of OA accounts for 11 % (0 %–24 %). Dust absorption accounts for 31 % (12 %–49 %).
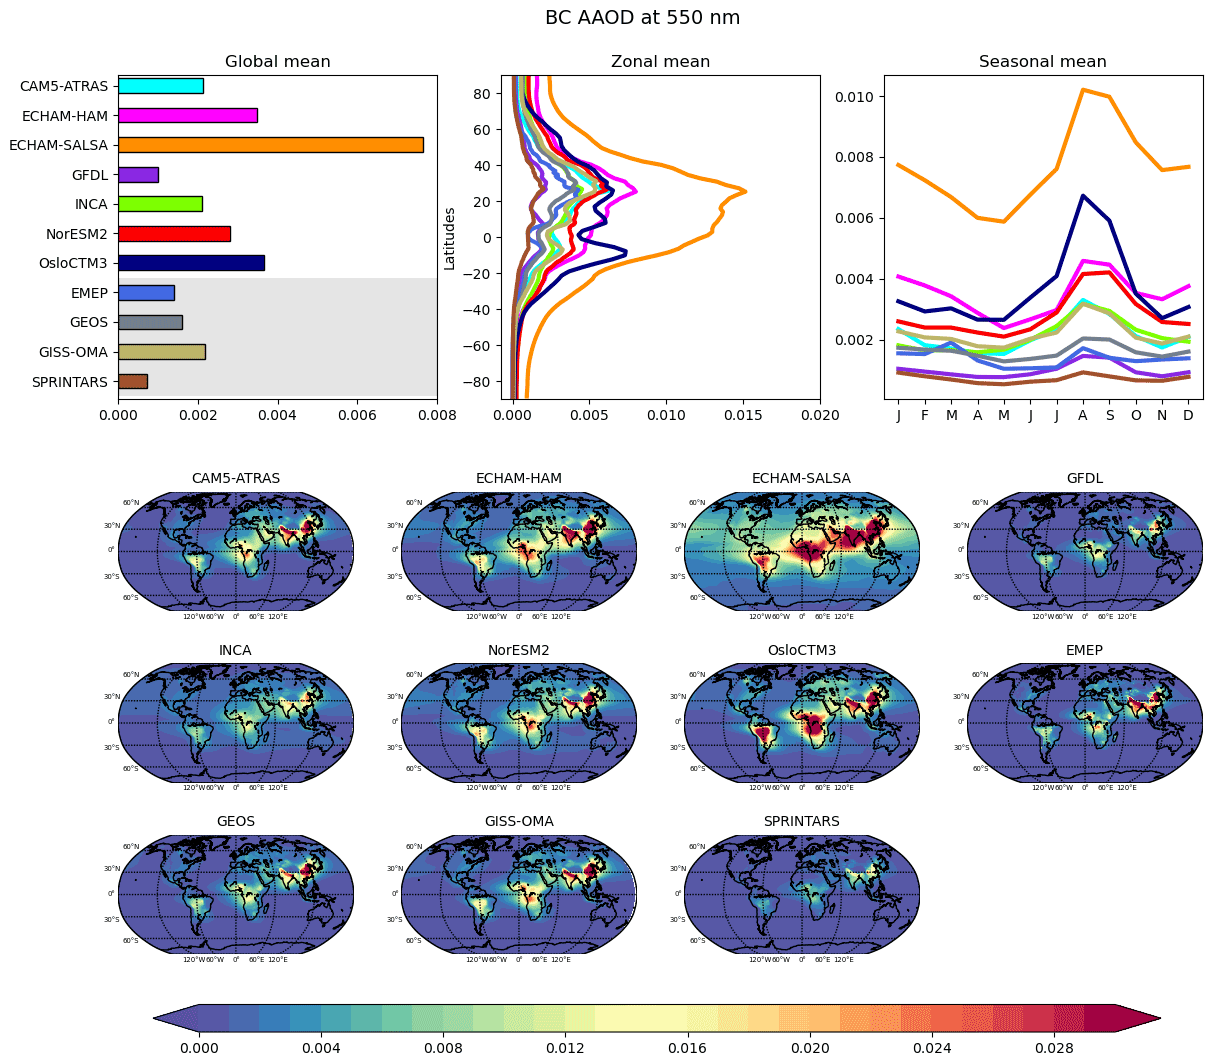
Figure 3BC AAOD at λ= 550 nm from the individual models, with annual global mean, annual zonal mean, the global seasonal cycle, and annual mean spatial distributions.
Figure 3 shows the AAOD for BC at λ= 550 nm for 11 models. Most models yield a maximum in absorption during August and September. This is linked to the biomass burning season in Southern Africa and South America. The anthropogenic signal in China and India is apparent all year round. The multi-model global mean is 0.0030. Here, the AeroCom models show a large range in values, from 0.0007 (SPRINTARS) to 0.0077 (ECHAM-SALSA), and the spread (range/mean) is 2.3.
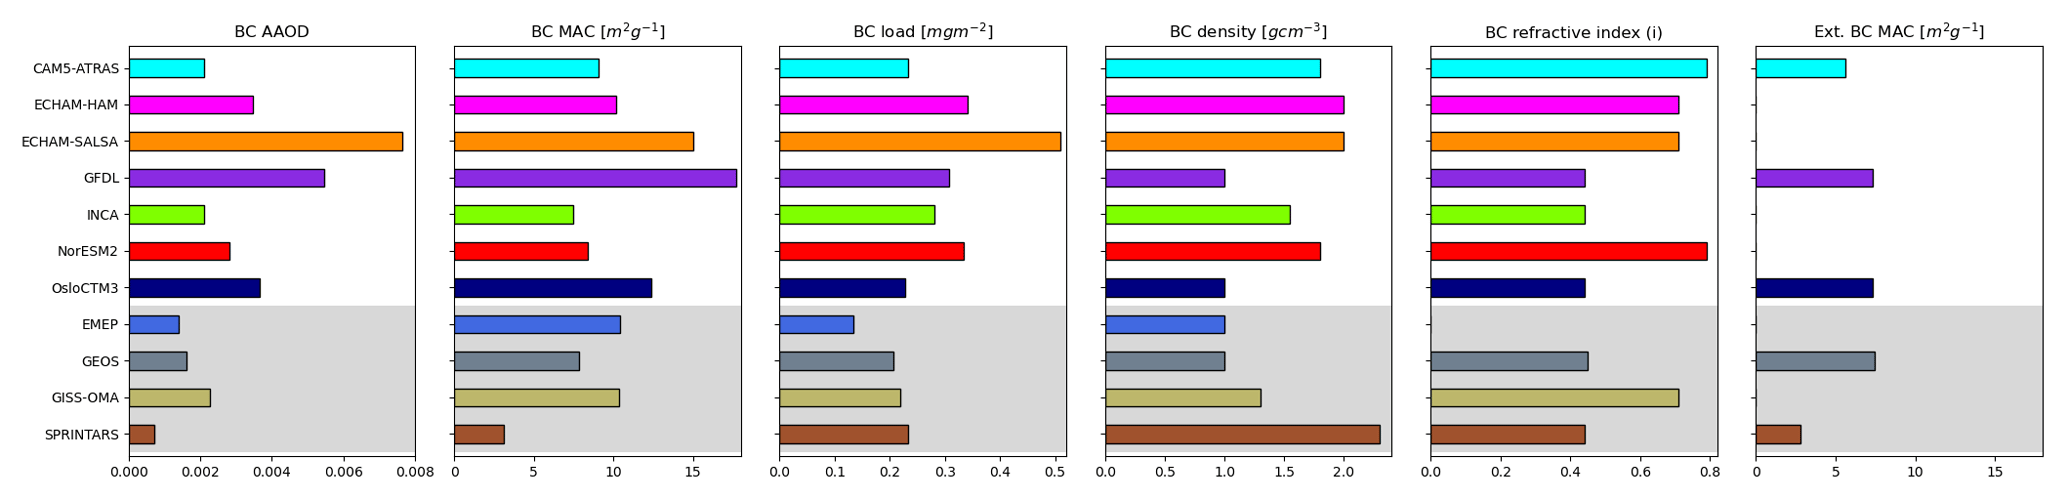
Figure 4Global mean BC AAOD, BC MAC (square metres per gram; hereafter m2 g−1), BC mass load (milligrams per square metre; hereafter mg m−2), BC mass density (grams per cubic centimetre; hereafter g cm−3), BC refractive index (imaginary), and external mixing BC MAC (estimated with Mie theory). The models with grey shading have externally mixed BC. Values for each of the bars are given in the Supplement (Table S3).
Figure 4 shows the global mean BC AAOD, BC MAC, BC mass load, BC density, and BC refractive index for the same models. The models with grey background shading have externally mixed BC. ECHAM-SALSA has the highest BC burden (0.51 mg m−2) and longest lifetime (9.6 d; see Gliß et al., 2021) among the models. For ECHAM-SALSA, the BC burden and lifetime has been shown to be very sensitive to wet deposition and assumptions on the mixing of BC with other compounds (Holopainen et al., 2020). The models with the longest lifetime of BC also place more BC aloft, where there is less wet deposition, compared to the other models (Fig. S1). Despite using similar emissions, the BC burden varies from 0.13–0.51 mg m−2, and the spread is 1.4. The models that assume external mixing (EMEP, GEOS, GISS-OMA, and SPRINTARS) generally yield the lowest BC AAOD (mean 0.0015 vs. 0.0043 for the models with internal mixing). This is as expected because internally mixed BC has greater geometrical cross-sectional areas than the actual BC inclusions within the mixture.
We define BC MAC here as the global mean BC AAOD divided by the global mean column load of BC. The BC MAC values range from 3.1 m2 g−1 (SPRINTARS) to 17.7 m2 g−1 (GFDL). The model-mean BC MAC value is 10.1 m2 g−1. Earlier proposed BC MAC values vary between 7.5 m2 g−1 (550 nm), for freshly generated BC, and 11 m2 g−1, for aged BC (Bond and Bergstrom, 2006). Zanatta et al. (2016) reported near-surface values for Europe between 9.1 and 20 m2 g−1 (converted to 550 nm). Lower BC MAC values (550 nm), down to 5.7, are found in the Arctic (Yttri et al., 2014). We have gathered all available observations/estimates of BC MAC in the literature and converted them to their respective values at λ= 550 nm, by assuming that the absorption Ångstrøm exponent (AAE) equals 1 (see Table S6 for values and references). The average of all observed values in this study is 10.9 m2 g−1, and the standard deviation is 3.1 m2 g−1. Although the models show column-integrated global mean values, which are not co-located with the locations and time of the observations, the BC MAC from SPRINTARS is lower than the lowest value in the observed BC MAC range, resulting in the lowest BC AAOD among all models.
The real part and imaginary part of the refractive index indicates scattering and absorption, respectively, with higher values corresponding to stronger scattering or absorption. In total, five models (GFDL, INCA, OsloCTM3, GEOS, and SPRINTARS) use an imaginary refractive index of 0.44 at 550 nm for BC, stemmed from the database of the Optical Properties of Aerosols and Clouds (OPAC; Hess et al., 1998). However, Bond and Bergstrom (2006) suggested avoiding using this value because it was originally drawn from incomplete graphitised carbon; it is too low and represents none of the possible refractive indices.
BC density varies from 1 to 2.3 g cm−3 and is used in the models. Most models that use the OPAC values for imaginary index also use the OPAC value for density, which is 1 g cm−3, except SPRINTARS which has the highest density among the models (2.3 g cm−3). Although Bond and Bergstrom (2006) recommend a value of 1.8 g cm−3 for BC density based on observations, apparently only two models (CAMS-ATRAS and NorESM2) adopted that value, despite the fact that freshly emitted BC is often nonspherical (Bond et al., 2013). However, to apply Mie theory in the calculation of BC MAC, spherical BC particles must be assumed. The actual choice of refractive indexes and density plays a minor role, since it should be constrained by BC MAC recommended value of 7.5 m2 g−1. In models with a BC MAC for external mixed BC much lower than 7.5 m2 g−1, the aerosol optical properties should be updated based on current knowledge.
We have estimated externally mixed BC MAC using Mie theory (size distribution, density, and refractive index) for the models where this was possible. This is shown in the rightmost panel in Fig. 4. For the two models with external mixing, the MAC value defined by the model (BC AAOD/BC load) is slightly higher (4 %–10 %) compared to MAC estimated by Mie theory. For the models with internal mixing, the model-calculated MAC value is much higher compared to the one using Mie theory (40 %–60 %). This illustrates the additional absorption due to the internal mixing.
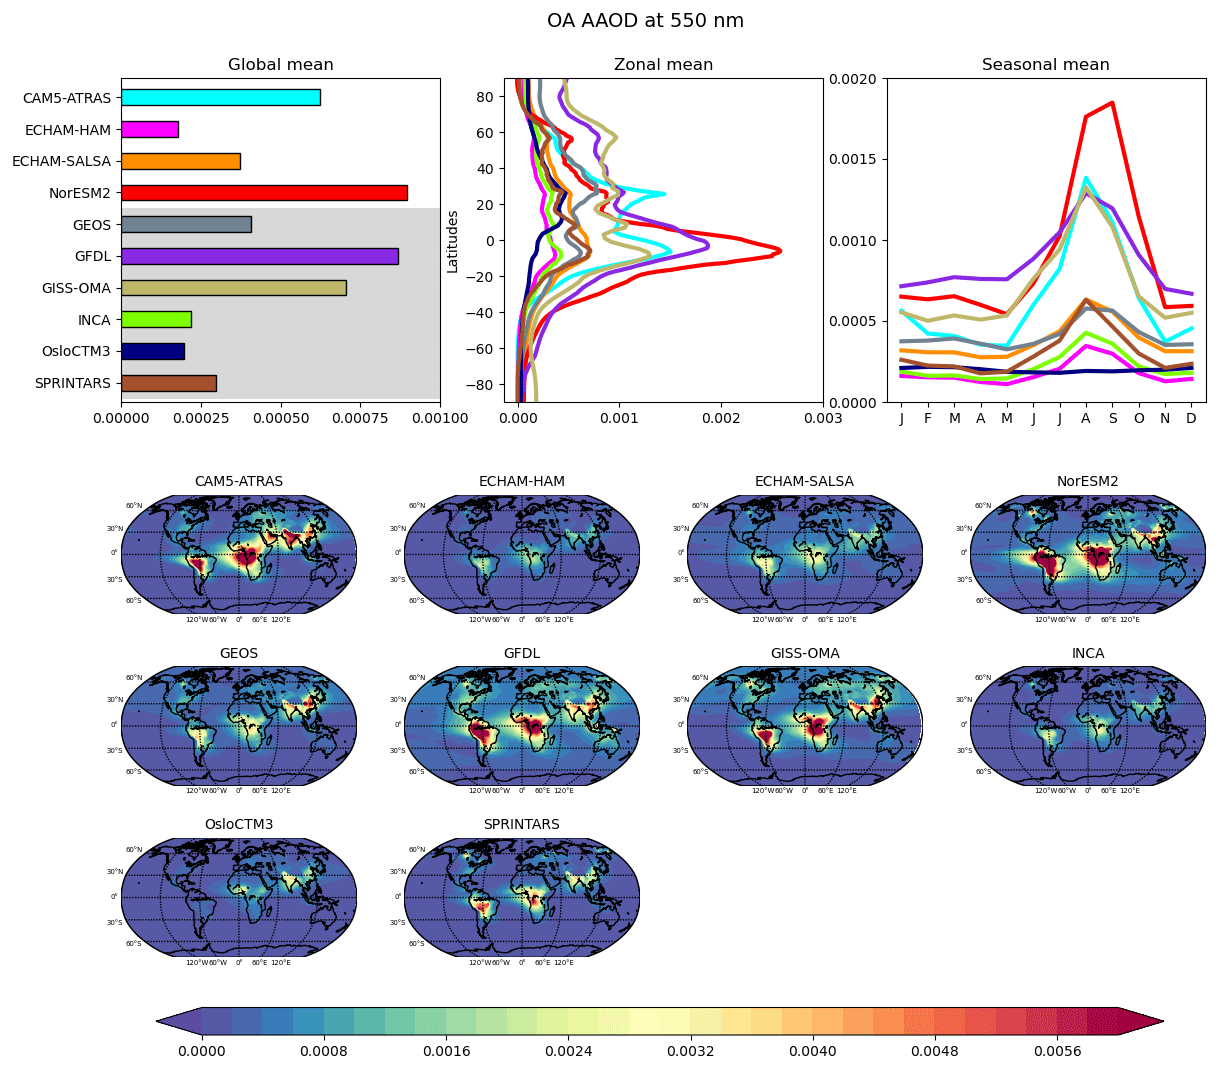
Figure 5OA AAOD at λ= 550 nm from the models, with the annual global mean, annual zonal mean, the global seasonal cycle, and annual mean spatial distributions. The models with grey shading have externally mixed OA.
Figure 5 shows the absorption of OA at 550 nm for 10 models. The global model-mean OA AAOD is 0.00053 with a range from 0.00020 to 0.00090 and a spread of 1.3. The maximum values of OA absorption are linked to the biomass burning season in the southern hemisphere in July, August, and September. Unlike for BC, part of the spread of OA absorption can be linked to a high diversity in OA emissions (48–177 Tg), since the models have different parameterisations applied to ratio of OA to organic carbon (OC), secondary organic aerosol formation, and marine OA emissions (see also Fig. 9 and the discussion below).
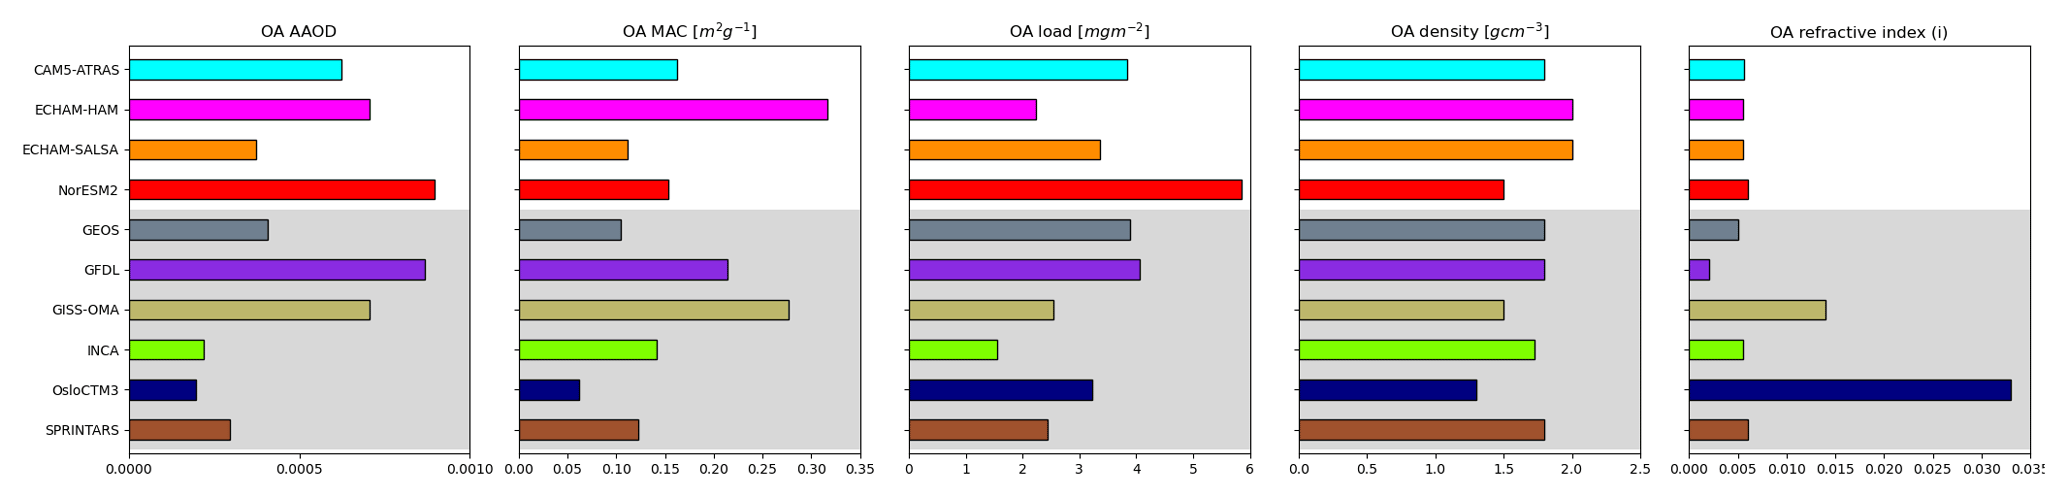
Figure 6Global mean OA AAOD, OA MAC (m2 g−1), OA mass load (mg m−2), OA density (g cm−3), and OA refractive index (imaginary) 550 nm. The models with grey shading have externally mixed OA. Values for each bar are given in the Supplement (Table S4).
Figure 6 shows the global mean OA AAOD, OA MAC, OA mass load, OA density, and dry OA refractive index at 550 nm for the 10 AeroCom III models. The models with grey shading have externally mixed OA. Again, the OA AAOD in the models with internal mixing is higher than the models with external mixing (mean 0.00065 vs. 0.00045); however, GFDL and GISS-OMA have the second- and third-highest AAOD, respectively. OA load varies from 1.55 to 5.85 mg m−2, and the spread is large (1.3).
OsloCTM3 divides OA into a mix of absorbing and non-absorbing species, which is why the imaginary part of the refractive index is large compared to the other models. GISS-OMA has the second-highest imaginary parts in the OA refractive index to implicitly account for some brownness in OA (Tsigaridis and Kanakidou, 2018). The rest of the models use the value 0.0055i.
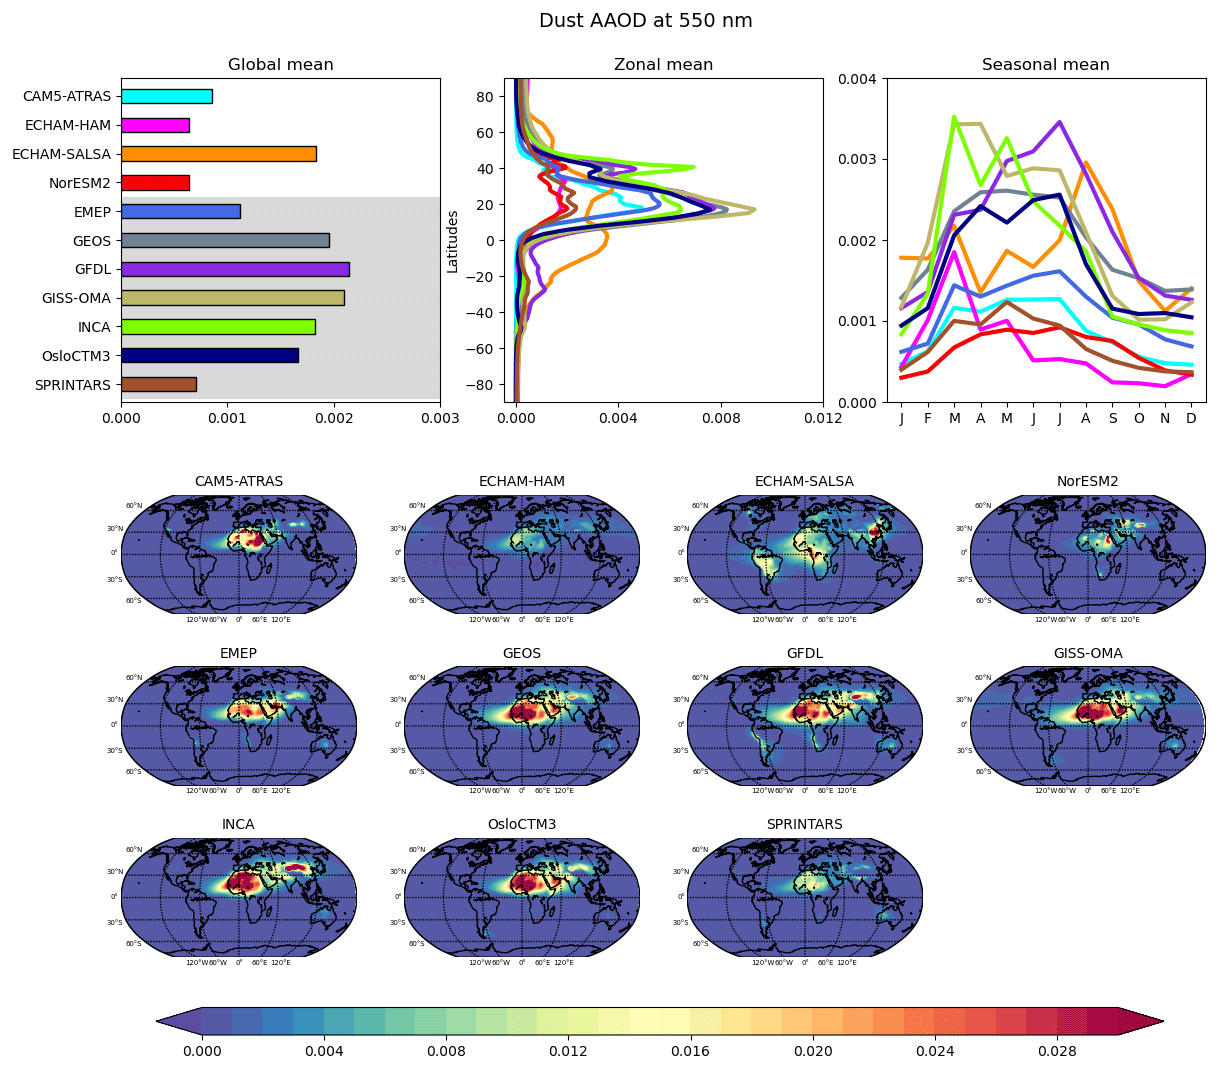
Figure 7Dust AAOD at λ= 550 nm from the models, with annual global mean, annual zonal mean, the global seasonal cycle, and annual mean spatial distributions. The models with grey shading have externally mixed dust.
Figure 7 shows the absorption (in terms of AAOD) by mineral dust for 11 models. The global model mean dust AAOD is 0.0013 (550 nm) which is approximately half of the BC AAOD. The values range from 0.0006 to 0.0021, and the spread is lower compared to BC and OA (1.0). Dust emissions in the models are a function of wind speed and soil wetness/humidity and the surface bareness (for these models dust emissions vary from 1090 to 2147 Tg yr−1). Current models do not implement explicit mineralogy and, thus, do not account for the dependence of aerosol optical properties on soil properties with different mineral fractions. The models show a maximum in dust absorption over the largest sources in the Sahara and deserts in East Asia, peaking during April, May, and June. The three models with the lowest dust AAOD (ECHAM-HAM, SPRINTARS and NorESM2) simulate much lower light absorption by dust over the Sahara desert and Atlantic outflow region (not shown).
Figure 8 shows the global mean dust AAOD, dust MAC, dust mass load, dust density, and dust imaginary refractive index for the same models. The models with grey shading have externally mixed dust. SPRINTARS and NorESM2 have the lowest dust mass column burden compared to the other models, which, in combination with relatively small MAC values, yield rather low AAOD, while in ECHAM-HAM the simulated dust load is among the largest, but very low MAC were applied in the model. The low dust loadings for NorESM and SPRINTARS are due to both their short lifetime of dust (1.9 and 2.3 d compared to model mean 4.3 d) and lower dust emissions compared to the other models.

Figure 8Global mean dust AAOD, dust MAC (m2 g−1), dust mass load (mg m−2), dust density (g cm−3), and dust refractive index (imaginary). The models with grey shading have externally mixed dust. Values for each bar are given in the Supplement (Table S5).
The spread in AAOD for BC, OA, and dust is large amongst the AeroCom models. Even though the models have used similar emissions, the range in BC mass load is substantial (0.13–0.51) mg m−2. To look more into how the variability in emissions, lifetime, and MAC values explain the variability in AAOD, we have calculated partial sensitivities, as shown in Fig. 9. The partial sensitivities are calculated by dividing the variable (emissions, lifetime, or MAC) in each model by the AeroCom model mean, multiplied with the AAOD AeroCom model-mean for each species. For BC, the variability in emissions is small and does not explain much of the variability in BC AAOD. The difference in lifetime (and burden) in the models, on the other hand, explains as much of the BC AAOD spread as the difference in BC MAC values. For OA and dust, the variability in emissions can explain part of the spread in AAOD, together with the variability in lifetime (for OA, lifetime variability also includes variability in SOA). The spread in MAC values can explain most of the spread in AAOD for OA and dust.

Figure 9Partial sensitivity of AAOD to variation in emission, lifetime, and MAC for BC, OA, and dust for each model. The sensitivities are calculated by dividing the variable in each model by the AeroCom model mean multiplied with the AAOD AeroCom model mean.
3.3 Absorption at λ= 440 and λ= 870 nm
Figure 10 shows the contribution from BC, OA, and dust to aerosol absorption at λ= 440, 550, and 870 nm for the five models providing results per species at these wavelengths (CAM5-ATRAS, ECHAM-HAM, GFDL, INCA, and OsloCTM3). The absorption is higher for 440 nm, compared to 870 nm for all the species, which is in accordance with observations (Dubovik et al., 2002), even though the spectral dependence of OA is notably low. The relative contribution from dust is higher for 440 nm compared to 870 nm. The relative contribution from OA is slightly larger for 870 nm, while for BC it is slightly lower for 440 nm compared to 870 nm.
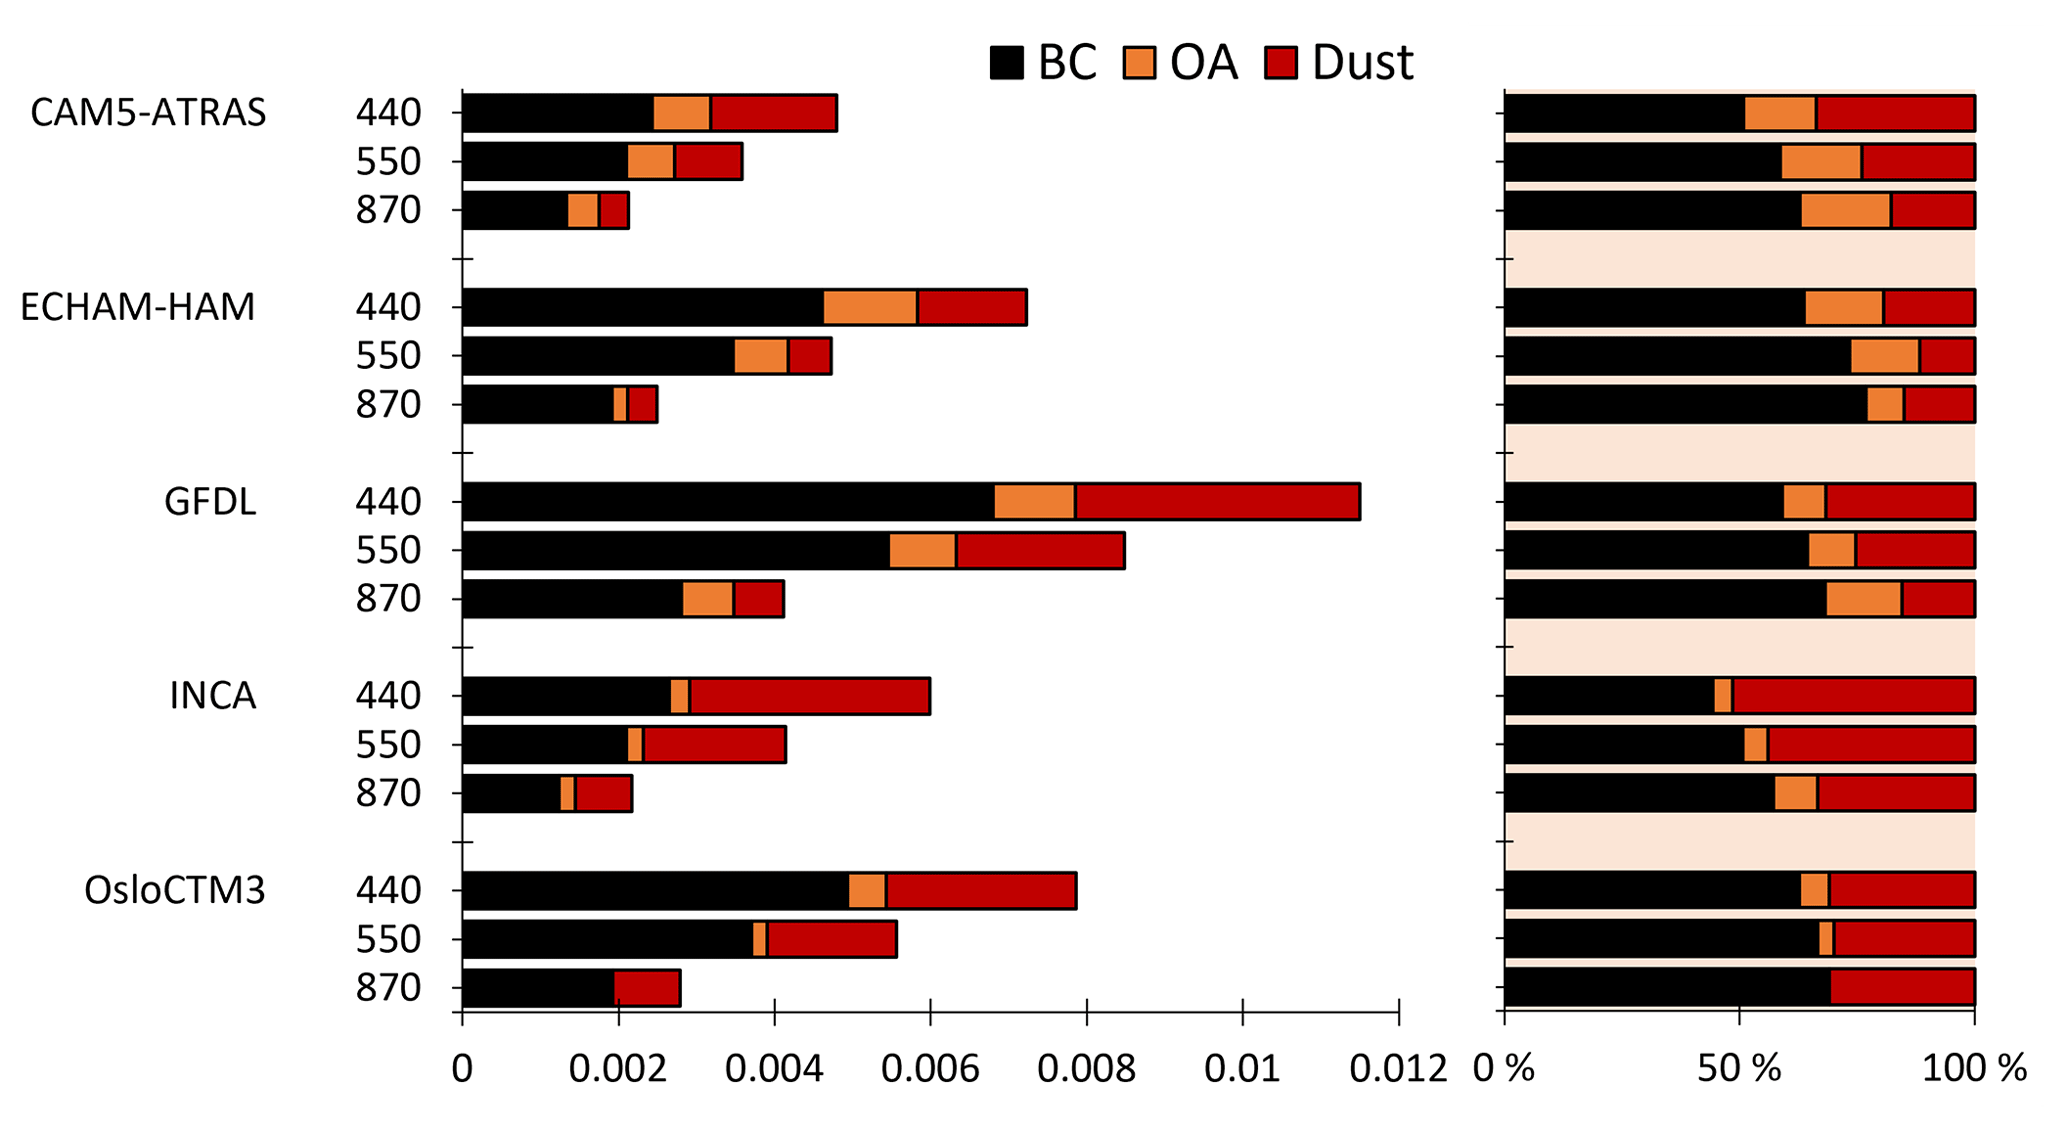
Figure 10Global mean AAOD at λ= 440, 550, and 870 nm for each model split into BC (black), OA (orange), and dust (red), with absolute values on the left and relative values on the right.
Figure 11 shows the AAE split into BC, OA, and dust for the five models (CAM5-ATRAS, ECHAM-HAM, GFDL, INCA, and OsloCTM3), with absorption per species at λ= 440 and λ= 870 nm. Since most BC particles are in the fine mode with the wavelength-independent index of refraction over the visible spectrum, AAE is expected to be 1 for externally mixed BC, but this may not be true for internally mixed, aged BC (Bergstrom et al., 2002; Schuster et al., 2016). In the five models, BC AAE is around 1 (0.9–1.3). OA, on the other hand, has much stronger spectral dependence compared to BC, as can be seen in Fig. 1, which enhances the absorption at shorter wavelengths. As OA's MAC decreases sharply with wavelength, the AAE is shown to be much larger than 1 (Olson et al., 2015; Russel et al., 2010; Török et al., 2018). Given equal particle sizes, AAE for OA will, therefore, be larger than for BC. However, modelled AAE for OA is much lower than 1 (0.3–1.0), except for one model (OsloCTM3) which has an AAE for OA of 16.1. This is because the absorption for OA near 870 nm is close to 0 in this model (Fig. 10). Figure 11 shows that the spectral dependence for OA in the models (except OsloCTM3) is weak. This strongly contrasts with observations, both from laboratory studies and over observational sites, which find stronger spectral dependence for OA than BC (e.g. Bond, 2001; Kirchstetter et al., 2004; Schnaiter et al., 2006). Most AeroCom models (except OsloCTM3 and GISS-OMA) have not updated their OA refractive indices according to current understanding based on measurements.
Modelled AAE for dust is around 2 (2.0–2.2). For dust particles, AAE is suggested to be larger than 1, but the uncertainties are larger compared to BC (Samset et al., 2018; Linke et al., 2006). Schuster et al. (2016) argue that it is difficult to separate AAE of dust and BC OA because AAE is also affected by size and published values of AAE of pure dust vary from less than 0 to larger than 3, depending on the relative fractions of hematite and goethite.
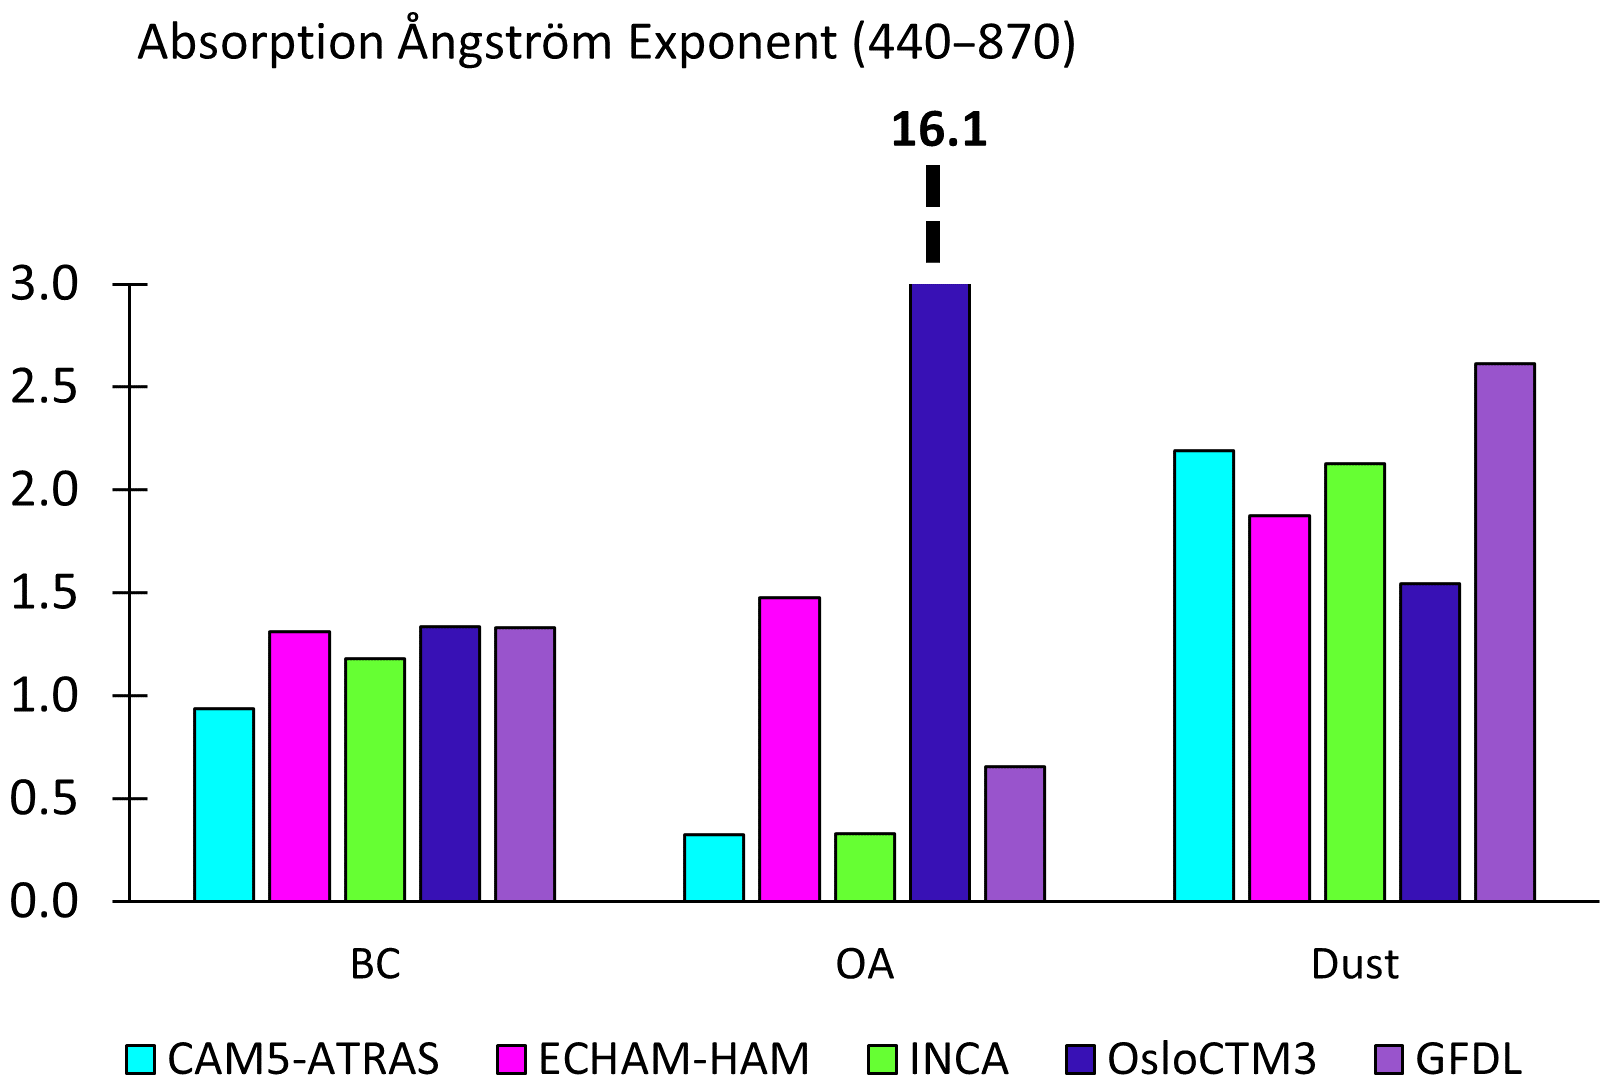
Figure 11Global mean aerosol absorption Ångström exponent, based on total AAOD at λ= 440 and λ= 870 nm, split into BC, OA, and dust.
In total, 15 different aerosol models that participated in AeroCom phase III have reported total aerosol absorption optical depth (AAOD), and for the first time, 11 of these models have reported in a consistent experiment the contributions to AAOD from BC, dust, and OA. In summary, we have documented the following:
-
The global multi-model mean total AAOD is 0.0054, which is 28 % higher than in AeroCom phase II but still within 1 standard deviation. The models show a maximum in areas with biomass burning, over large industrial areas, and over the Sahara desert.
-
The models that report absorption per species yield AAOD contributions of 60 % due to BC (range of 36 % to 84 %), 31 % (12 %–49 %) due to dust and 11 % (0 %–24 %) due to OA (average contribution) at 550 nm. The total AAOD is less variable between the models (spread 1.5) than BC AAOD (2.3).
-
The global multi-model mean BC AAOD is 0.0030 (range 0.0007–0.0077). The seasonal cycle follows the biomass burning season in Southern Africa and South America. The multi-model annual mean BC MAC value is 10.1 m2 g−1 (3.1–17.7) m2 g−1. Near-surface observations of BC MAC values of 550 nm from various locations vary between 5.7 up to 20.0, with an average of 10.9 m2 g−1 and a standard deviation of 3.1 m2 g−1.
-
Globally averaged dust AAOD at 550 nm is approximately half that of BC (dust AAOD peaks for lower wavelengths). The global multi-model mean dust AAOD is 0.0013 (range 0.0006 to 0.0021).
-
The global multi-model mean OA AAOD is 0.0005 (range 0.0002 to 0.0009). Of the five models which reported OA absorption for 440 and 870 nm, four show very weak spectral dependence, which is in contrast with observations. We recommend the AeroCom models to update their OA refractive indices based on available measurements which include BrC.
The substantial spread in BC absorption (2.3) is due to differences in mass load (0.13–0.51) mg m−2 (note that emissions were similar, BC densities (1.0–2.3), and refractive indices. The difference in lifetime (and burden) in the models explains as much of the BC AAOD spread as the difference in BC MAC values. There is a relatively large variability in BC lifetime (ranging from 3 to 9 d in the AeroCom models; see Gliß et al., 2021). The lifetime and mixing state are coupled, as enhanced mixing reduces lifetime (Stier et al., 2006). Different aerosol mixing assumptions and the associated optical calculations in the models add to the uncertainties in absorption. Some models use Maxwell–Garnett mixing rules (INCA, NorESM2, and TM5), some use volume averaging (ECHAM-HAM and ECHAM-SALSA), while others use a core shell mixing (CAM5-ATRAS). Still, Stier et al. (2007) compared different mixing rules using a consistent set-up in one single model (ECHAM5-HAM) and found a moderate influence of the mixing rules (10 %). This was found to be weaker than the uncertainties in the imaginary index. We also find low correlation (0.2) between the imaginary refractive index and mass absorption coefficients in the models with internal mixing. In total, five models still use the OPAC value of 0.44i for the imaginary component of the refractive index for BC, a value that has been suggested to be avoided as it has been found to be lower than indicated by more recent observations (Bond and Bergstrom, 2006).
A key question raised in this paper, and elsewhere in the literature, is how the total aerosol absorption optical depth simulated by a global climate model can be subdivided into species or sources. We have presented results using analysis techniques and methodologies in common use by the aerosol community today but acknowledge that there is no unique way to do this. As documented above, the main technique is to compare simulations with all species included to one with emissions of one particular species (e.g. BC) excluded. However, in modern climate models, the results obtained by doing this for all species cannot be expected to sum up to the total AAOD. First, a simulation without absorbing aerosols alters the dynamics and mean properties of climate simulated by the model in nonlinear ways. Even when nudging the climate to a specific meteorology, as done by many models, the two climate representations will not be the same. This is particularly true for dust, which is a major component of the global climate system. Second, the approach alters the size distributions represented in the model, which in turn alters the overall aerosol refractive index and scattering properties as well and, thus, the regional pattern of climate forcing. Finally, as discussed above, many recent models use internal mixing of aerosols, which leads to nonlinear responses to the removal of a single species. For instance, for ECHAM-SALSA, removing OA reduces the size of BC, since it is internally mixed with OC. The volume absorption cross section then increased, and the same amount of BC became more absorptive, resulting in a negative OA absorption. These are all known limitations of present global climate modelling, made more marked by the evolution of ever more complex aerosol representation. It does not invalidate the approaches taken in this publication, or in other, related analyses in the recent literature, but it must be kept in mind when interpreting the results. We encourage further discussions among the global aerosol modelling community on how to best diagnose per-species properties, such as AAOD, using the latest generation of climate models.
The model diversity in AeroCom III is as large as in AeroCom I and II. We have shown that the removal rates and MAC are causing the large spread of AAOD for all three absorbing species. The removal rates depend on the model parameterisation of wet and dry depositions, and the MAC values depend on the imaginary refractive index, particle density, size distributions, and microphysical properties, such as mixing state and hygroscopic growth. We suggest future AeroCom model experiments thoroughly diagnose the reasons for diversity, such as using the more updated, observation-based particle density, effective size, and refractive indices and performing sensitivity experiments. We suggest that the optical calculations need more testing, for example, in a box model or by exchanging optical calculations among models. A first step towards improved climate simulations of the effect of absorbing aerosols is to update the aerosol optical property scheme where externally mixed BC MAC is lower than 7.5 m2 g−1 and AAE of OA is around 1 or lower. On the other hand, the observational constraints for models, coming from diverse sources of measurements, need to be formulated in a more consistent way. Values reported from measurements (e.g. MAC, AAOD, and absorption coefficient) need to be associated with remarks on spatial and temporal representativity, variability on timescales relevant for models (days to seasons), and other aerosol characteristics deemed necessary (size, composition, and mixing state).
All data used in this study are stored on the servers of the Norwegian Meteorological Institute and can be provided upon request. All analysis scripts (using IDL and Python) are stored on CICERO servers and can be provided upon request.
The supplement related to this article is available online at: https://doi.org/10.5194/acp-21-15929-2021-supplement.
MaS and BHS designed the study. MaS did most of the analysis and wrote most of the paper. GM and BHS helped to analyze and interpret the results. JG provided data and gave input on the analysis. CWS provided the measurement values of BC MAC. SEB, HB, MC, RCG, PG, ZK, AK, HK, PLS, MTL, HM, TVN, DJLO, SR, MiS, PS, TT, KT, SGT, and SWP provided model data and helped interpret the results. All co-authors provided feedback on the paper.
The authors declare that they have no conflict of interest.
Publisher’s note: Copernicus Publications remains neutral with regard to jurisdictional claims in published maps and institutional affiliations.
We would like to thank Gregory L. Schuster, for the highly constructive comments and helpful feedback to the paper. High-performance computing and storage resources were provided by the Norwegian Infrastructure for Computational Science (grant nos. NN2345K, NN9560K, NS2345K, and NS9560K). Susanne E. Bauer and Kostas Tsigaridis acknowledge resources from the NASA High-End Computing (HEC) Program through the NASA Center for Climate Simulation (NCCS) at the Goddard Space Flight Center. Philip Stier acknowledges support from the European Research Council (ERC) project RECAP under the European Union's Horizon 2020 research and innovation programme (grant no. 724602). Duncan Watson-Parris and Philippe Le Sager acknowledge support from the UK Natural Environment Research Council (grant nos. NE/P013406/1 (A-CURE) and NE/S005390/1 (ACRUISE)), and from the European Union's Horizon 2020 research and innovation programme iMIRACLI under the Marie Skłodowska-Curie (grant no. 860100). Michael Schulz, Alf Kirkevåg, and Dirk J. L. Olivié acknowledge funding from the European Union's Horizon 2020 Research and Innovation programme, project FORCeS (grant no. 821205), by the Research Council of Norway INES (grant no. 270061), and KeyClim (grant no. 295046). The AeroCom database is maintained by the computing infrastructure efforts provided by the Norwegian Meteorological Institute.
Maria Sand, Bjørn H. Samset, Gunnar Myhre Camilla W. Stjern, and Marianne T. Lund have been supported by the Research Council of Norway (grant nos. 244141 (NetBC), 315195 (ACCEPT), 250573 (SUPER), and 248834 (QUISARC)). Ramiro Checa-Garcia, Alf Kirkevåg, and Michael Schulz were supported by the European Union Horizon 2020 grant (grant no. 641816; CRESCENDO). Hitoshi Matsui was supported by the Ministry of Education, Culture, Sports, Science and Technology of Japan and the Japan Society for the Promotion of Science (MEXT/JSPS), KAKENHI (grant nos. JP17H04709, JP19H05699, and JP20H00638), the MEXT Arctic Challenge for Sustainability II (ArCS-II) project (grant no. JPMXD1420318865), and the Environment Research and Technology Development Fund 2–2003 (grant no. JPMEERF20202003) of the Environmental Restoration and Conservation Agency. Toshihiko Takemura was supported by the NEC SX supercomputer system of the National Institute for Environmental Studies, Japan, the Environment Research and Technology Development Fund (grant no. JPMEERF20202F01) of the Environmental Restoration and Conservation Agency, Japan, and the Japan Society for the Promotion of Science (JSPS) KAKENHI (grant no. JP19H05669).
This paper was edited by Pedro Jimenez-Guerrero and reviewed by Gregory L. Schuster and one anonymous referee.
Ackerman, A. S., Toon, O. B., Stevens, D. E., Heymsfield, A. J., Ramanathan, V., and Welton, E. J.: Reduction of Tropical Cloudiness by Soot, Science, 288, 1042–1047, https://doi.org/10.1126/science.288.5468.1042, 2000.
Adebiyi, A. A. and Kok, J. F.: Climate models miss most of the coarse dust in the atmosphere, Science Advances, 6, eaaz9507, https://doi.org/10.1126/sciadv.aaz9507, 2020.
Andreae, M. O. and Gelencsér, A.: Black carbon or brown carbon? The nature of light-absorbing carbonaceous aerosols, Atmos. Chem. Phys., 6, 3131–3148, https://doi.org/10.5194/acp-6-3131-2006, 2006.
Balkanski, Y., Schulz, M., Claquin, T., Moulin, C., and Ginoux, P.: Global Emissions of Mineral Aerosol: Formulation and Validation using Satellite Imagery, in: Emissions of Atmospheric Trace Compounds, edited by: Granier, C., Artaxo, P., and Reeves, C. E., Springer, Dordrecht, 18, 239–267, https://doi.org/10.1007/978-1-4020-2167-1_6, 2004.
Bauer, S. E., Wright, D. L., Koch, D., Lewis, E. R., McGraw, R., Chang, L.-S., Schwartz, S. E., and Ruedy, R.: MATRIX (Multiconfiguration Aerosol TRacker of mIXing state): an aerosol microphysical module for global atmospheric models, Atmos. Chem. Phys., 8, 6003–6035, https://doi.org/10.5194/acp-8-6003-2008, 2008.
Bauer, S. E., Menon, S., Koch, D., Bond, T. C., and Tsigaridis, K.: A global modeling study on carbonaceous aerosol microphysical characteristics and radiative effects, Atmos. Chem. Phys., 10, 7439–7456, https://doi.org/10.5194/acp-10-7439-2010, 2010.
Bauer, S. E., Tsigaridis, K., Faluvegi, G., Kelley, M., Lo, K. K., Miller, R. L., Nazarenko, L., Schmidt, G. A., and Wu, J.: Historical (1850–2014) Aerosol Evolution and Role on Climate Forcing Using the GISS ModelE2.1 Contribution to CMIP6, J. Adv. Model. Earth Sy., 12, e2019MS001978, https://doi.org/10.1029/2019MS001978, 2020.
Bergman, T., Makkonen, R., Schrödner, R., Swietlicki, E., Phillips, V. T. J., Le Sager, P., and van Noije, T.: Description and Evaluation of a Secondary Organic Aerosol and New Particle Formation Scheme within TM5-MP v1.1, Geosci. Model Dev. Discuss. [preprint], https://doi.org/10.5194/gmd-2021-49, in review, 2021.
Bergstrom, R. W., Russell, P. B., and Hignett, P.: Wavelength Dependence of the Absorption of Black Carbon Particles: Predictions and Results from the TARFOX Experiment and Implications for the Aerosol Single Scattering Albedo, J. Atmos. Sci., 59, 567–577, https://doi.org/10.1175/1520-0469(2002)059<0567:Wdotao>2.0.Co;2, 2002.
Bond, T. C.: Spectral dependence of visible light absorption by carbonaceous particles emitted from coal combustion, Geophys. Res. Lett., 28, 4075–4078, https://doi.org/10.1029/2001GL013652, 2001.
Bond, T. C. and Bergstrom, R. W.: Light Absorption by Carbonaceous Particles: An Investigative Review, Aerosol Sci. Tech., 40, 27–67, https://doi.org/10.1080/02786820500421521, 2006.
Bond, T. C., Doherty, S. J., Fahey, D. W., Forster, P. M., Berntsen, T., DeAngelo, B. J., Flanner, M. G., Ghan, S., Kärcher, B., Koch, D., Kinne, S., Kondo, Y., Quinn, P. K., Sarofim, M. C., Schultz, M. G., Schulz, M., Venkataraman, C., Zhang, H., Zhang, S., Bellouin, N., Guttikunda, S. K., Hopke, P. K., Jacobson, M. Z., Kaiser, J. W., Klimont, Z., Lohmann, U., Schwarz, J. P., Shindell, D., Storelvmo, T., Warren, S. G., and Zender, C. S.: Bounding the role of black carbon in the climate system: A scientific assessment, J. Geophys. Res., 118, 5380–5552, https://doi.org/10.1002/jgrd.50171, 2013.
Cappa, C. D., Onasch, T. B., Massoli, P., Worsnop, D. R., Bates, T. S., Cross, E. S., Davidovits, P., Hakala, J., Hayden, K. L., Jobson, B. T., Kolesar, K. R., Lack, D. A., Lerner, B. M., Li, S.-M., Mellon, D., Nuaaman, I., Olfert, J. S., Petäjä, T., Quinn, P. K., Song, C., Subramanian, R., Williams, E. J., and Zaveri, R. A.: Radiative Absorption Enhancements Due to the Mixing State of Atmospheric Black Carbon, Science, 337, 1078–1081, https://doi.org/10.1126/science.1223447, 2012.
Colarco, P., da Silva, A., Chin, M., and Diehl, T.: Online simulations of global aerosol distributions in the NASA GEOS-4 model and comparisons to satellite and ground-based aerosol optical depth, J. Geophys. Res., 115, D14207, https://doi.org/10.1029/2009jd012820, 2010.
Cooke, W. F. and Wilson, J. J. N.: A global black carbon aerosol model, J. Geophys. Res., 101, 19395–19409, https://doi.org/10.1029/96jd00671, 1996.
Checa-Garcia, R., Balkanski, Y., Albani, S., Bergman, T., Carslaw, K., Cozic, A., Dearden, C., Marticorena, B., Michou, M., van Noije, T., Nabat, P., O'Connor, F. M., Olivié, D., Prospero, J. M., Le Sager, P., Schulz, M., and Scott, C.: Evaluation of natural aerosols in CRESCENDO Earth system models (ESMs): mineral dust, Atmos. Chem. Phys., 21, 10295–10335, https://doi.org/10.5194/acp-21-10295-2021, 2021.
Dubovik, O., Holben, B., Eck, T. F., Smirnov, A., Kaufman, Y. J., King, M. D., Tanré, D., and Slutsker, I.: Variability of Absorption and Optical Properties of Key Aerosol Types Observed in Worldwide Locations, J. Atmos. Sci., 59, 590–608, https://doi.org/10.1175/1520-0469(2002)059<0590:Voaaop>2.0.Co;2, 2002.
Fierce, L., Bond, T. C., Bauer, S. E., Mena, F., and Riemer, N.: Black carbon absorption at the global scale is affected by particle-scale diversity in composition, Nat. Commun., 7, 12361, https://doi.org/10.1038/ncomms12361, 2016.
Fuller, K. A., Malm, W. C., and Kreidenweis, S. M.: Effects of mixing on extinction by carbonaceous particles, J. Geophys. Res., 104, 15941–15954, https://doi.org/10.1029/1998JD100069, 1999.
Gliß, J., Mortier, A., Schulz, M., Andrews, E., Balkanski, Y., Bauer, S. E., Benedictow, A. M. K., Bian, H., Checa-Garcia, R., Chin, M., Ginoux, P., Griesfeller, J. J., Heckel, A., Kipling, Z., Kirkevåg, A., Kokkola, H., Laj, P., Le Sager, P., Lund, M. T., Lund Myhre, C., Matsui, H., Myhre, G., Neubauer, D., van Noije, T., North, P., Olivié, D. J. L., Rémy, S., Sogacheva, L., Takemura, T., Tsigaridis, K., and Tsyro, S. G.: AeroCom phase III multi-model evaluation of the aerosol life cycle and optical properties using ground- and space-based remote sensing as well as surface in situ observations, Atmos. Chem. Phys., 21, 87–128, https://doi.org/10.5194/acp-21-87-2021, 2021.
Hansen, J., Sato, M., and Ruedy, R.: Radiative forcing and climate response, J. Geophys. Res, 102, 6831–6864, 1997.
Haywood, J. M. and Shine, K. P.: The effect of anthropogenic sulfate and soot aerosol on the clear sky planetary radiation budget, Geophys. Res. Lett., 22, 603–606, https://doi.org/10.1029/95GL00075, 1995.
Hess, M., Koepke, P., and Schult, I.: Optical Properties of Aerosols and Clouds: The Software Package OPAC, B. Am. Meteorol. Soc., 79, 831–844, 1998.
Hoesly, R. M., Smith, S. J., Feng, L., Klimont, Z., Janssens-Maenhout, G., Pitkanen, T., Seibert, J. J., Vu, L., Andres, R. J., Bolt, R. M., Bond, T. C., Dawidowski, L., Kholod, N., Kurokawa, J.-I., Li, M., Liu, L., Lu, Z., Moura, M. C. P., O'Rourke, P. R., and Zhang, Q.: Historical (1750–2014) anthropogenic emissions of reactive gases and aerosols from the Community Emissions Data System (CEDS), Geosci. Model Dev., 11, 369–408, https://doi.org/10.5194/gmd-11-369-2018, 2018.
Holopainen, E., Kokkola, H., Laakso, A., and Kühn, T.: In-cloud scavenging scheme for sectional aerosol modules – implementation in the framework of the Sectional Aerosol module for Large Scale Applications version 2.0 (SALSA2.0) global aerosol module, Geosci. Model Dev., 13, 6215–6235, https://doi.org/10.5194/gmd-13-6215-2020, 2020.
Jacobson, M., Hansson, H.-C., Noone, K., and Charlson, R.: Organic atmospheric aerosols: Review and state of the science, Rev. Geophys., 38, 267–294, https://doi.org/10.1029/1998RG000045, 2000.
Kinne, S., Schulz, M., Textor, C., Guibert, S., Balkanski, Y., Bauer, S. E., Berntsen, T., Berglen, T. F., Boucher, O., Chin, M., Collins, W., Dentener, F., Diehl, T., Easter, R., Feichter, J., Fillmore, D., Ghan, S., Ginoux, P., Gong, S., Grini, A., Hendricks, J., Herzog, M., Horowitz, L., Isaksen, I., Iversen, T., Kirkevåg, A., Kloster, S., Koch, D., Kristjansson, J. E., Krol, M., Lauer, A., Lamarque, J. F., Lesins, G., Liu, X., Lohmann, U., Montanaro, V., Myhre, G., Penner, J., Pitari, G., Reddy, S., Seland, O., Stier, P., Takemura, T., and Tie, X.: An AeroCom initial assessment – optical properties in aerosol component modules of global models, Atmos. Chem. Phys., 6, 1815–1834, https://doi.org/10.5194/acp-6-1815-2006, 2006.
Kirchstetter, T. W., Novakov, T., and Hobbs, P. V.: Evidence that the spectral dependence of light absorption by aerosols is affected by organic carbon, J. Geophys. Res., 109, D21208, https://doi.org/10.1029/2004jd004999, 2004.
Kirkevåg, A., Grini, A., Olivié, D., Seland, Ø., Alterskjær, K., Hummel, M., Karset, I. H. H., Lewinschal, A., Liu, X., Makkonen, R., Bethke, I., Griesfeller, J., Schulz, M., and Iversen, T.: A production-tagged aerosol module for Earth system models, OsloAero5.3 – extensions and updates for CAM5.3-Oslo, Geosci. Model Dev., 11, 3945–3982, https://doi.org/10.5194/gmd-11-3945-2018, 2018.
Koch, D.: Transport and direct radiative forcing of carbonaceous and sulfate aerosols in the GISS GCM, J. Geophys. Res., 106, 20311–20332, https://doi.org/10.1029/2001jd900038, 2001.
Koch, D., Schulz, M., Kinne, S., McNaughton, C., Spackman, J. R., Balkanski, Y., Bauer, S., Berntsen, T., Bond, T. C., Boucher, O., Chin, M., Clarke, A., De Luca, N., Dentener, F., Diehl, T., Dubovik, O., Easter, R., Fahey, D. W., Feichter, J., Fillmore, D., Freitag, S., Ghan, S., Ginoux, P., Gong, S., Horowitz, L., Iversen, T., Kirkevåg, A., Klimont, Z., Kondo, Y., Krol, M., Liu, X., Miller, R., Montanaro, V., Moteki, N., Myhre, G., Penner, J. E., Perlwitz, J., Pitari, G., Reddy, S., Sahu, L., Sakamoto, H., Schuster, G., Schwarz, J. P., Seland, Ø., Stier, P., Takegawa, N., Takemura, T., Textor, C., van Aardenne, J. A., and Zhao, Y.: Evaluation of black carbon estimations in global aerosol models, Atmos. Chem. Phys., 9, 9001–9026, https://doi.org/10.5194/acp-9-9001-2009, 2009.
Kok, J. F., Ridley, D. A., Zhou, Q., Miller, R. L., Zhao, C., Heald, C. L., Ward, D. S., Albani, S., and Haustein, K.: Smaller desert dust cooling effect estimated from analysis of dust size and abundance, Nat. Geosci., 10, 274–278, https://doi.org/10.1038/ngeo2912, 2017.
Kokkola, H., Kühn, T., Laakso, A., Bergman, T., Lehtinen, K. E. J., Mielonen, T., Arola, A., Stadtler, S., Korhonen, H., Ferrachat, S., Lohmann, U., Neubauer, D., Tegen, I., Siegenthaler-Le Drian, C., Schultz, M. G., Bey, I., Stier, P., Daskalakis, N., Heald, C. L., and Romakkaniemi, S.: SALSA2.0: The sectional aerosol module of the aerosol–chemistry–climate model ECHAM6.3.0-HAM2.3-MOZ1.0, Geosci. Model Dev., 11, 3833–3863, https://doi.org/10.5194/gmd-11-3833-2018, 2018.
Lacagnina, C., Hasekamp, O. P., Bian, H., Curci, G., Myhre, G., van Noije, T., Schulz, M., Skeie, R. B., Takemura, T., and Zhang, K.: Aerosol single-scattering albedo over the global oceans: Comparing PARASOL retrievals with AERONET, OMI, and AeroCom models estimates, J. Geophys. Res., 120, 9814–9836, https://doi.org/10.1002/2015jd023501, 2015.
Linke, C., Möhler, O., Veres, A., Mohácsi, Á., Bozóki, Z., Szabó, G., and Schnaiter, M.: Optical properties and mineralogical composition of different Saharan mineral dust samples: a laboratory study, Atmos. Chem. Phys., 6, 3315–3323, https://doi.org/10.5194/acp-6-3315-2006, 2006.
Lund, M. T., Myhre, G., Haslerud, A. S., Skeie, R. B., Griesfeller, J., Platt, S. M., Kumar, R., Myhre, C. L., and Schulz, M.: Concentrations and radiative forcing of anthropogenic aerosols from 1750 to 2014 simulated with the Oslo CTM3 and CEDS emission inventory, Geosci. Model Dev., 11, 4909–4931, https://doi.org/10.5194/gmd-11-4909-2018, 2018.
Matsui, H.: Development of a global aerosol model using a two-dimensional sectional method: 1. Model design, J. Adv. Model. Earth Sy., 9, 1921–1947, https://doi.org/10.1002/2017ms000936, 2017.
Matsui, H. and Mahowald, N.: Development of a global aerosol model using a two-dimensional sectional method: 2. Evaluation and sensitivity simulations, J. Adv. Model. Earth Sy., 9, 1887–1920, https://doi.org/10.1002/2017ms000937, 2017.
McCormick, R. A. and Ludwig, J. H.: Climate Modification by Atmospheric Aerosols, Science, 156, 1358–1359, https://doi.org/10.1126/science.156.3780.1358, 1967.
Moosmüller, H., Chakrabarty, R. K., and Arnott, W. P.: Aerosol light absorption and its measurement: A review, J. Quant. Spectrosc. Ra., 110, 844–878, https://doi.org/10.1016/j.jqsrt.2009.02.035, 2009.
Myhre, G., Bellouin, N., Berglen, T. F., Berntsen, T. K., Boucher, O., Grini, A., Isaksen, I. S. A., Johnsrud, M., Mishchenko, M. I., Stordal, F., and Tandre, D.: Comparison of the radiative properties and direct radiative effect of aerosols from a global aerosol model and remote sensing data over ocean, Tellus B, 59, 115–129, https://doi.org/10.1111/j.1600-0889.2006.00226.x, 2007.
Myhre, G., Samset, B. H., Schulz, M., Balkanski, Y., Bauer, S., Berntsen, T. K., Bian, H., Bellouin, N., Chin, M., Diehl, T., Easter, R. C., Feichter, J., Ghan, S. J., Hauglustaine, D., Iversen, T., Kinne, S., Kirkevåg, A., Lamarque, J.-F., Lin, G., Liu, X., Lund, M. T., Luo, G., Ma, X., van Noije, T., Penner, J. E., Rasch, P. J., Ruiz, A., Seland, Ø., Skeie, R. B., Stier, P., Takemura, T., Tsigaridis, K., Wang, P., Wang, Z., Xu, L., Yu, H., Yu, F., Yoon, J.-H., Zhang, K., Zhang, H., and Zhou, C.: Radiative forcing of the direct aerosol effect from AeroCom Phase II simulations, Atmos. Chem. Phys., 13, 1853–1877, https://doi.org/10.5194/acp-13-1853-2013, 2013.
Olson, M. R., Victoria Garcia, M., Robinson, M. A., Van Rooy, P., Dietenberger, M. A., Bergin, M., and Schauer, J. J.: Investigation of black and brown carbon multiple-wavelength-dependent light absorption from biomass and fossil fuel combustion source emissions, J. Geophys. Res., 120, 6682–6697, https://doi.org/10.1002/2014jd022970, 2015.
Osborne, S. R., Johnson, B. T., Haywood, J. M., Baran, A. J., Harrison, M. A. J., and McConnell, C. L.: Physical and optical properties of mineral dust aerosol during the Dust and Biomass-burning Experiment, J. Geophys. Res., 113, D00C03, https://doi.org/10.1029/2007JD009551, 2008.
Perlwitz, J. P., Pérez García-Pando, C., and Miller, R. L.: Predicting the mineral composition of dust aerosols – Part 1: Representing key processes, Atmos. Chem. Phys., 15, 11593–11627, https://doi.org/10.5194/acp-15-11593-2015, 2015.
Pu, B. and Ginoux, P.: How reliable are CMIP5 models in simulating dust optical depth?, Atmos. Chem. Phys., 18, 12491–12510, https://doi.org/10.5194/acp-18-12491-2018, 2018.
Rémy, S., Kipling, Z., Flemming, J., Boucher, O., Nabat, P., Michou, M., Bozzo, A., Ades, M., Huijnen, V., Benedetti, A., Engelen, R., Peuch, V.-H., and Morcrette, J.-J.: Description and evaluation of the tropospheric aerosol scheme in the European Centre for Medium-Range Weather Forecasts (ECMWF) Integrated Forecasting System (IFS-AER, cycle 45R1), Geosci. Model Dev., 12, 4627–4659, https://doi.org/10.5194/gmd-12-4627-2019, 2019.
Ridley, D. A., Heald, C. L., Kok, J. F., and Zhao, C.: An observationally constrained estimate of global dust aerosol optical depth, Atmos. Chem. Phys., 16, 15097–15117, https://doi.org/10.5194/acp-16-15097-2016, 2016.
Russell, P. B., Bergstrom, R. W., Shinozuka, Y., Clarke, A. D., DeCarlo, P. F., Jimenez, J. L., Livingston, J. M., Redemann, J., Dubovik, O., and Strawa, A.: Absorption Angstrom Exponent in AERONET and related data as an indicator of aerosol composition, Atmos. Chem. Phys., 10, 1155–1169, https://doi.org/10.5194/acp-10-1155-2010, 2010.
Ryder, C. L., Highwood, E. J., Rosenberg, P. D., Trembath, J., Brooke, J. K., Bart, M., Dean, A., Crosier, J., Dorsey, J., Brindley, H., Banks, J., Marsham, J. H., McQuaid, J. B., Sodemann, H., and Washington, R.: Optical properties of Saharan dust aerosol and contribution from the coarse mode as measured during the Fennec 2011 aircraft campaign, Atmos. Chem. Phys., 13, 303–325, https://doi.org/10.5194/acp-13-303-2013, 2013.
Ryder, C. L., Marenco, F., Brooke, J. K., Estelles, V., Cotton, R., Formenti, P., McQuaid, J. B., Price, H. C., Liu, D., Ausset, P., Rosenberg, P. D., Taylor, J. W., Choularton, T., Bower, K., Coe, H., Gallagher, M., Crosier, J., Lloyd, G., Highwood, E. J., and Murray, B. J.: Coarse-mode mineral dust size distributions, composition and optical properties from AER-D aircraft measurements over the tropical eastern Atlantic, Atmos. Chem. Phys., 18, 17225–17257, https://doi.org/10.5194/acp-18-17225-2018, 2018.
Samset, B. H., Stjern, C. W., Andrews, E., Kahn, R. A., Myhre, G., Schulz, M., and Schuster, G. L.: Aerosol Absorption: Progress Towards Global and Regional Constraints, Current Climate Change Reports, 4, 65–83, https://doi.org/10.1007/s40641-018-0091-4, 2018.
Schnaiter, M., Gimmler, M., Llamas, I., Linke, C., Jäger, C., and Mutschke, H.: Strong spectral dependence of light absorption by organic carbon particles formed by propane combustion, Atmos. Chem. Phys., 6, 2981–2990, https://doi.org/10.5194/acp-6-2981-2006, 2006.
Schulz, M., Textor, C., Kinne, S., Balkanski, Y., Bauer, S., Berntsen, T., Berglen, T., Boucher, O., Dentener, F., Guibert, S., Isaksen, I. S. A., Iversen, T., Koch, D., Kirkevåg, A., Liu, X., Montanaro, V., Myhre, G., Penner, J. E., Pitari, G., Reddy, S., Seland, Ø., Stier, P., and Takemura, T.: Radiative forcing by aerosols as derived from the AeroCom present-day and pre-industrial simulations, Atmos. Chem. Phys., 6, 5225–5246, https://doi.org/10.5194/acp-6-5225-2006, 2006.
Schulz, M., Cozic, A., and Szopa, S.: LMDzT-INCA dust forecast model developments and associated validation efforts, IOP Conference Series, Earth Environ. Sci., 7, 012014, https://doi.org/10.1088/1755-1307/7/1/012014, 2009.
Schuster, G. L., Dubovik, O., Arola, A., Eck, T. F., and Holben, B. N.: Remote sensing of soot carbon – Part 2: Understanding the absorption Ångström exponent, Atmos. Chem. Phys., 16, 1587–1602, https://doi.org/10.5194/acp-16-1587-2016, 2016.
Seland, Ø., Bentsen, M., Olivié, D., Toniazzo, T., Gjermundsen, A., Graff, L. S., Debernard, J. B., Gupta, A. K., He, Y.-C., Kirkevåg, A., Schwinger, J., Tjiputra, J., Aas, K. S., Bethke, I., Fan, Y., Griesfeller, J., Grini, A., Guo, C., Ilicak, M., Karset, I. H. H., Landgren, O., Liakka, J., Moseid, K. O., Nummelin, A., Spensberger, C., Tang, H., Zhang, Z., Heinze, C., Iversen, T., and Schulz, M.: Overview of the Norwegian Earth System Model (NorESM2) and key climate response of CMIP6 DECK, historical, and scenario simulations, Geosci. Model Dev., 13, 6165–6200, https://doi.org/10.5194/gmd-13-6165-2020, 2020.
Simpson, D., Benedictow, A., Berge, H., Bergström, R., Emberson, L. D., Fagerli, H., Flechard, C. R., Hayman, G. D., Gauss, M., Jonson, J. E., Jenkin, M. E., Nyíri, A., Richter, C., Semeena, V. S., Tsyro, S., Tuovinen, J.-P., Valdebenito, Á., and Wind, P.: The EMEP MSC-W chemical transport model – technical description, Atmos. Chem. Phys., 12, 7825–7865, https://doi.org/10.5194/acp-12-7825-2012, 2012.
Sokolik, I. N. and Toon, O. B.: Incorporation of mineralogical composition into models of the radiative properties of mineral aerosol from UV to IR wavelengths, J. Geophys. Res., 104, 9423–9444, https://doi.org/10.1029/1998jd200048, 1999.
Stier, P., Seinfeld, J. H., Kinne, S., Feichter, J., and Boucher, O.: Impact of non-absorbing anthropogenic aerosols on clear-sky atmospheric absorption, J. Geophys. Res., 111, D18201, https://doi.org/10.1029/2006JD007147, 2006.
Stier, P., Seinfeld, J. H., Kinne, S., and Boucher, O.: Aerosol absorption and radiative forcing, Atmos. Chem. Phys., 7, 5237–5261, https://doi.org/10.5194/acp-7-5237-2007, 2007.
Stier, P., Schutgens, N. A. J., Bellouin, N., Bian, H., Boucher, O., Chin, M., Ghan, S., Huneeus, N., Kinne, S., Lin, G., Ma, X., Myhre, G., Penner, J. E., Randles, C. A., Samset, B., Schulz, M., Takemura, T., Yu, F., Yu, H., and Zhou, C.: Host model uncertainties in aerosol radiative forcing estimates: results from the AeroCom Prescribed intercomparison study, Atmos. Chem. Phys., 13, 3245–3270, https://doi.org/10.5194/acp-13-3245-2013, 2013.
Takemura, T., Nozawa, T., Emori, S., Nakajima, T. Y., and Nakajima, T.: Simulation of climate response to aerosol direct and indirect effects with aerosol transport-radiation model, J. Geophys. Res., 110, D02202, https://doi.org/10.1029/2004jd005029, 2005.
Tegen, I., Neubauer, D., Ferrachat, S., Siegenthaler-Le Drian, C., Bey, I., Schutgens, N., Stier, P., Watson-Parris, D., Stanelle, T., Schmidt, H., Rast, S., Kokkola, H., Schultz, M., Schroeder, S., Daskalakis, N., Barthel, S., Heinold, B., and Lohmann, U.: The global aerosol–climate model ECHAM6.3–HAM2.3 – Part 1: Aerosol evaluation, Geosci. Model Dev., 12, 1643–1677, https://doi.org/10.5194/gmd-12-1643-2019, 2019.
Textor, C., Schulz, M., Guibert, S., Kinne, S., Balkanski, Y., Bauer, S., Berntsen, T., Berglen, T., Boucher, O., Chin, M., Dentener, F., Diehl, T., Feichter, J., Fillmore, D., Ginoux, P., Gong, S., Grini, A., Hendricks, J., Horowitz, L., Huang, P., Isaksen, I. S. A., Iversen, T., Kloster, S., Koch, D., Kirkevåg, A., Kristjansson, J. E., Krol, M., Lauer, A., Lamarque, J. F., Liu, X., Montanaro, V., Myhre, G., Penner, J. E., Pitari, G., Reddy, M. S., Seland, Ø., Stier, P., Takemura, T., and Tie, X.: The effect of harmonized emissions on aerosol properties in global models – an AeroCom experiment, Atmos. Chem. Phys., 7, 4489–4501, https://doi.org/10.5194/acp-7-4489-2007, 2007.
Török, S., Malmborg, V. B., Simonsson, J., Eriksson, A., Martinsson, J., Mannazhi, M., Pagels, J., and Bengtsson, P.-E.: Investigation of the absorption Ångström exponent and its relation to physicochemical properties for mini-CAST soot, Aerosol Sci. Tech., 52, 757–767, https://doi.org/10.1080/02786826.2018.1457767, 2018.
Tsigaridis, K., Daskalakis, N., Kanakidou, M., Adams, P. J., Artaxo, P., Bahadur, R., Balkanski, Y., Bauer, S. E., Bellouin, N., Benedetti, A., Bergman, T., Berntsen, T. K., Beukes, J. P., Bian, H., Carslaw, K. S., Chin, M., Curci, G., Diehl, T., Easter, R. C., Ghan, S. J., Gong, S. L., Hodzic, A., Hoyle, C. R., Iversen, T., Jathar, S., Jimenez, J. L., Kaiser, J. W., Kirkevåg, A., Koch, D., Kokkola, H., Lee, Y. H., Lin, G., Liu, X., Luo, G., Ma, X., Mann, G. W., Mihalopoulos, N., Morcrette, J.-J., Müller, J.-F., Myhre, G., Myriokefalitakis, S., Ng, N. L., O'Donnell, D., Penner, J. E., Pozzoli, L., Pringle, K. J., Russell, L. M., Schulz, M., Sciare, J., Seland, Ø., Shindell, D. T., Sillman, S., Skeie, R. B., Spracklen, D., Stavrakou, T., Steenrod, S. D., Takemura, T., Tiitta, P., Tilmes, S., Tost, H., van Noije, T., van Zyl, P. G., von Salzen, K., Yu, F., Wang, Z., Wang, Z., Zaveri, R. A., Zhang, H., Zhang, K., Zhang, Q., and Zhang, X.: The AeroCom evaluation and intercomparison of organic aerosol in global models, Atmos. Chem. Phys., 14, 10845–10895, https://doi.org/10.5194/acp-14-10845-2014, 2014.
Tsigaridis, K. and Kanakidou, M.: The Present and Future of Secondary Organic Aerosol Direct Forcing on Climate, Current Climate Change Reports, 4, 84–98, https://doi.org/10.1007/s40641-018-0092-3, 2018.
van Marle, M. J. E., Kloster, S., Magi, B. I., Marlon, J. R., Daniau, A.-L., Field, R. D., Arneth, A., Forrest, M., Hantson, S., Kehrwald, N. M., Knorr, W., Lasslop, G., Li, F., Mangeon, S., Yue, C., Kaiser, J. W., and van der Werf, G. R.: Historic global biomass burning emissions for CMIP6 (BB4CMIP) based on merging satellite observations with proxies and fire models (1750–2015), Geosci. Model Dev., 10, 3329–3357, https://doi.org/10.5194/gmd-10-3329-2017, 2017.
van Noije, T. P. C., Le Sager, P., Segers, A. J., van Velthoven, P. F. J., Krol, M. C., Hazeleger, W., Williams, A. G., and Chambers, S. D.: Simulation of tropospheric chemistry and aerosols with the climate model EC-Earth, Geosci. Model Dev., 7, 2435–2475, https://doi.org/10.5194/gmd-7-2435-2014, 2014.
van Noije, T., Bergman, T., Le Sager, P., O'Donnell, D., Makkonen, R., Gonçalves-Ageitos, M., Döscher, R., Fladrich, U., von Hardenberg, J., Keskinen, J.-P., Korhonen, H., Laakso, A., Myriokefalitakis, S., Ollinaho, P., Pérez García-Pando, C., Reerink, T., Schrödner, R., Wyser, K., and Yang, S.: EC-Earth3-AerChem: a global climate model with interactive aerosols and atmospheric chemistry participating in CMIP6, Geosci. Model Dev., 14, 5637–5668, https://doi.org/10.5194/gmd-14-5637-2021, 2021.
Wang, R., Balkanski, Y., Boucher, O. Ciais, P., Schuster, G. L., Chevallier, F., Bjørn, H., Samset, Liu, J., Piao, S., Valari, M., and Tao, S.: Estimation of global black carbon direct radiative forcing and its uncertainty constrained by observations, J. Geophys. Res.-Atmos., 121, 5948–5971, https://doi.org/10.1002/2015JD024326, 2016.
Yttri, K. E., Lund Myhre, C., Eckhardt, S., Fiebig, M., Dye, C., Hirdman, D., Ström, J., Klimont, Z., and Stohl, A.: Quantifying black carbon from biomass burning by means of levoglucosan – a one-year time series at the Arctic observatory Zeppelin, Atmos. Chem. Phys., 14, 6427–6442, https://doi.org/10.5194/acp-14-6427-2014, 2014.
Zanatta, M., Gysel, M., Bukowiecki, N., Müller, T., Weingartner, E., Areskoug, H., Fiebig, M., Yttri, K. E., Mihalopoulos, N., Kouvarakis, G., Beddows, D., Harrison, R. M., Cavalli, F., Putaud, J. P., Spindler, G., Wiedensohler, A., Alastuey, A., Pandolfi, M., Sellegri, K., Swietlicki, E., Jaffrezo, J. L., Baltensperger, U., and Laj, P.: A European aerosol phenomenology-5: Climatology of black carbon optical properties at 9 regional background sites across Europe, Atmos. Environ., 145, 346–364, https://doi.org/10.1016/j.atmosenv.2016.09.035, 2016.
Zhao, M., Golaz, J.-C., Held, I. M., Guo, H., Balaji, V., Benson, R., Chen, J.-H., Chen, X., Donner, L. J., Dunne, J. P., Dunne, K., Durachta, J., Fan, S.-M., Freidenreich, S. M., Garner, S. T., Ginoux, P., Harris, L. M., Horowitz, L. W., Krasting, J. P., Langenhorst, A. R., Liang, Z., Lin, P., Lin, S.-J., Malyshev, S. L., Mason, E., Milly, P. C. D., Ming, Y., Naik, V., Paulot, F., Paynter, D., Phillipps, P., Radhakrishnan, A., Ramaswamy, V., Robinson, T., Schwarzkopf, D., Seman, C. J., Shevliakova, E., Shen, Z., Shin, H., Silvers, L. G., Wilson, J. R., Winton, M., Wittenberg, A. T., Wyman, B., and Xiang, B.: The GFDL Global Atmosphere and Land Model AM4.0/LM4.0: 2. Model Description, Sensitivity Studies, and Tuning Strategies, J. Adv. Model. Earth Sy., 10, 735–769, https://doi.org/10.1002/2017ms001209, 2018.