the Creative Commons Attribution 4.0 License.
the Creative Commons Attribution 4.0 License.
 | 04 Feb 2021
Evident PM2.5 drops in the east of China due to the COVID-19 quarantine measures in February
Zhicong Yin
Yijia Zhang
Huijun Wang
Yuyan Li
The top-level emergency response to the COVID-19 pandemic involved exhaustive quarantine measures in China. The impacts of the COVID-19 quarantine on the decline in fine particulate matter (PM2.5) were quantitatively assessed based on numerical simulations and observations in February. Relative to both February 2017 and the climate mean, anomalous southerlies and moister air occurred in the east of China in February 2020, which caused considerable PM2.5 anomalies. Thus, it is a must to disentangle the contributions of stable meteorology from the effects of the COVID-19 lockdown. The contributions of routine emission reductions were also quantitatively extrapolated. The top-level emergency response substantially alleviated the level of haze pollution in the east of China. Although climate variability elevated the PM2.5 by 29 % (relative to 2020 observations), a 59 % decline related to the COVID-19 pandemic and a 20 % decline from the expected pollution regulation dramatically exceeded the former in North China. The COVID-19 quarantine measures decreased the PM2.5 in the Yangtze River Delta by 72 %. In Hubei Province where most pneumonia cases were confirmed, the impact of total emission reduction (72 %) evidently exceeded the rising percentage of PM2.5 driven by meteorology (13 %).
- Article
(5301 KB) - Full-text XML
-
Supplement
(534 KB) - BibTeX
- EndNote


The COVID-19 pandemic devastatingly swept through China at the beginning of 2020 (Luo, 2020; Xia and Feng, 2020; Cao et al., 2020). By April 2020, more than 84 000 confirmed cases had been reported by the National Health Commission of China, approximately 75 % of which were confirmed in February (Fig. 1a). To effectively control the large spread of COVID-19 pneumonia, stringent quarantine measures were implemented by the Chinese government and people themselves, including prohibiting social activities, shuttering industries and stopping transportation (S. Chen et al., 2020). The abovementioned emergency response measures were first carried out in Wuhan on 23 January, which resulted in the delayed arrival of COVID-19 in other cities by 2.91 d, and these response measures were in effect in all cities across China, thus limiting the spread of the COVID-19 epidemic in China (Tian et al., 2020). Since 7 March, the number of newly confirmed cases in China has been nearly below 100. On the other hand, the COVID-19 quarantine measures greatly reduced anthropogenic emissions, and therefore, the air quality in China was considerably improved (Wang et al., 2020). K. Chen et al. (2020) simply compared observations of atmospheric components before and during the quarantine period and found that the concentration of fine particulate matter (PM2.5) in Wuhan decreased by 1.4 µg m−3, but it decreased by 18.9 µg m−3 in 367 cities across China. Shi and Brasseur (2020) quantified a 35 % reduction in PM2.5 on average during the COVID-19 outbreak compared to the pre-COVID-19 period. Huang et al. (2020) used comprehensive measurements and modeling to show that the haze during the COVID-19 lockdown was driven by enhancements of secondary pollution, which offset reduction in primary emissions during this period in China. However, the impacts of meteorology on the air quality were neglected in many previous studies.
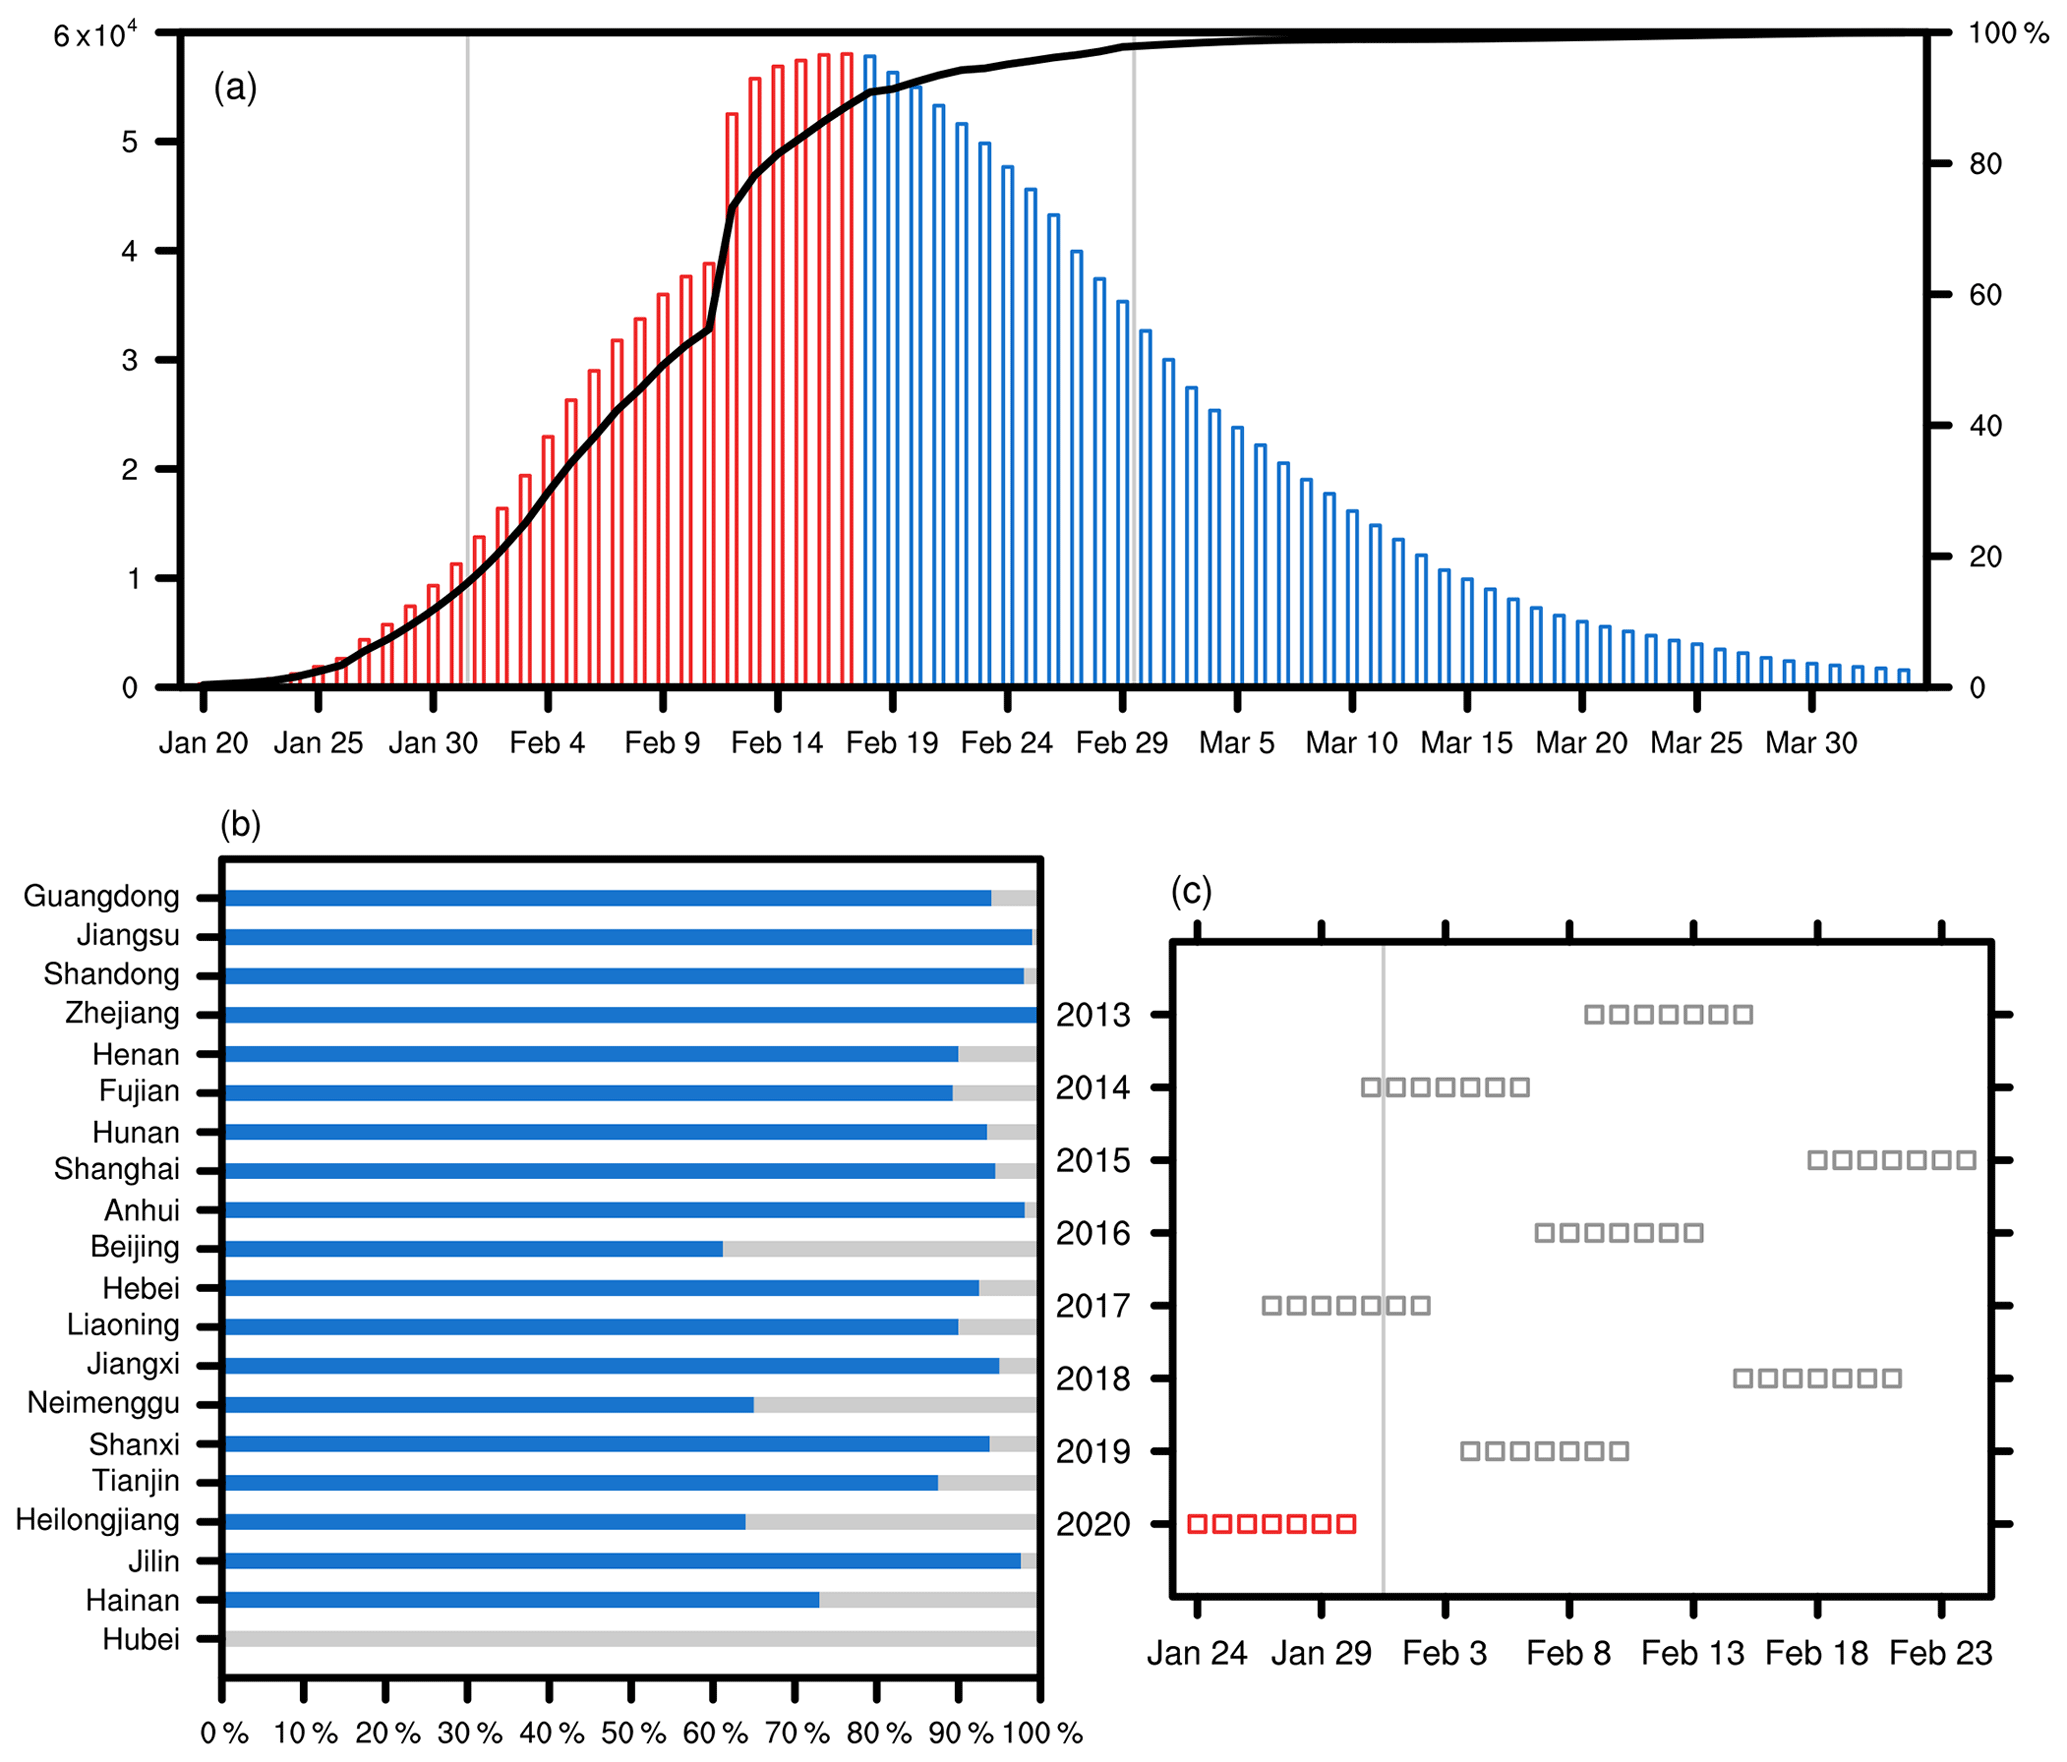
Figure 1(a) Variation in existing confirmed cases (bar; red: increase, blue: decrease) and the ratio of accumulated confirmed cases to total confirmed cases (black line) in China. (b) The ratio of work resumption in large industrial enterprises in the east of China. (c) Time of the official 7 d holiday of the Chinese New Year from 2013 to 2020.
Climate variability notably influences the formation and intensity of haze pollution in China (Yin and Wang, 2016; Xiao et al., 2015; Zou et al., 2017), and the impacts are embodied by variations in surface wind, boundary layer height and moisture conditions (Shi et al., 2019; Niu et al., 2010; Ding and Liu, 2014). During 16–21 December 2016, although the most aggressive control measures for anthropogenic emissions were implemented, severe haze pollution with PM2.5 concentrations ≈ 1100 µg m−3 still occurred and covered 710 000 km2. The continuous low surface wind speed of less than 2 m s−1, high humidity above 80 % and strong temperature inversion lasting for 132 h caused the serious haze event in 2016 (Yin and Wang, 2017). In winter 2017, the air quality in North China largely improved; however, the stagnant atmosphere in 2018 resulted in a major PM2.5 rebound comparing to 2017 by weakening transport dispersion and enhancing the chemical production of secondary aerosols (Yin and Zhang 2020). Wang et al. (2020) applied the Community Multiscale Air Quality model to emphasize that the role of adverse meteorological conditions cannot be neglected even during the COVID-19 outbreak. From 8 to 13 February 2020, North China suffered severe pollution, with maximum daily PM2.5 exceeding 200 µg m−3. During this period, weak southerly surface winds lasted for nearly 5 d, relative humidity was close to 100 % and atmospheric inversion reached more than 10∘. Although pollution emissions from basic social activities had been reduced, heavy pollution still occurred when adverse meteorological conditions characterized by stable air masses appeared (Wang et al., 2020).
After the severe haze events of 2013, routine emission reductions resulted in an approximately 42 % decrease in the annual mean PM2.5 concentration between 2013 and 2018 in China (Cleaner air for China, 2019). In November 2019, the Ministry of Ecology and Environment issued a series of autumn–winter air pollution prevention and management plans indicating that the routine emission reductions would be conventionally implemented in the following winter (Ministry of Ecology and Environment, 2019). As reported by the government, the mean ratio of work resumption in large industrial enterprises was approximately 90 % in the east of China by the end of February (Fig. 1b). In this study, we attempted to quantify the impacts of the COVID-19 pandemic on the observed PM2.5 concentration in February 2020 when the quarantine measures were the strictest. The official 7 d Chinese New Year holiday occurs in January and February and commonly accounts for approximately 25 % of a month. From 2013–2020, there were only two years (2017 and 2020) when the official 7 d holiday occurred in January (Fig. 1c). Thus, to avoid the impacts of the Spring Festival, the observed PM2.5 concentration in February 2017 (Fig. 1a) was adopted to calculate the PM2.5 difference, which was decomposed into the results due to expected routine emission reductions, changing meteorology climate variability and COVID-19 quarantine measures.
2.1 Data description
Monthly mean meteorological data from 2015 to 2020 were obtained from NCEP/NCAR Reanalysis datasets, with a horizontal resolution of 2.5∘ × 2.5∘, including the geopotential height at 500 hPa (H500), zonal and meridional winds at 850 hPa, vertical wind from the surface to 150 hPa, and relative humidity at the surface (Kalnay et al., 1996). PM2.5 concentration data from 2015 to 2020 were acquired from the China National Environmental Monitoring Centre (https://quotsoft.net/air/, last access: 2 February 2021). The monitoring network expanded from 1500 sites in 2015 to 1640 sites in 2020, covering approximately 370 cities nationwide. The PM2.5 data were monitored every 5 min using two methods: a tapered element oscillating microbalance and β rays, which were operated under the General Administration of Quality Supervision, Inspection and Quarantine.
2.2 GEOS-Chem description, evaluation and experimental design
We used the GEOS-Chem model (http://acmg.seas.harvard.edu/geos/, last access: 2 February 2021) to simulate the PM2.5 concentration, driven by MERRA-2-assimilated meteorological data (Gelaro et al., 2017). The nested grid over China (15–55∘ N, 75–135∘ E) had a horizontal resolution of 0.5∘ latitude by 0.625∘ longitude and consisted of 47 vertical layers up to 0.01 hPa. The GEOS-Chem model included the fully coupled O3–NOx–hydrocarbon and aerosol chemistry module with more than 80 species and 300 reactions (Bey et al., 2001; Park et al., 2004). The PM2.5 components simulated in the GEOS-Chem model included sulfate, nitrate, ammonium, black carbon and primary organic carbon, mineral dust, and sea salt. Aerosol thermodynamic equilibrium is computed by the ISORROPIA package, which calculates the gas–aerosol partitioning of the sulfate–nitrate–ammonium system (Fountoukis and Nenes, 2007). Heterogeneous reactions of aerosols include the uptake of HO2 by aerosols (Thornton et al., 2008), irreversible absorption of NO2 and NO3 on wet aerosols (Jacob, 2000), and hydrolysis of N2O5 (Evans and Jacob, 2005). Two alternate simulations of aerosol microphysics are implemented in GEOS-Chem: the TOMAS simulation (Kodros and Pierce, 2017) and the APM simulation (Yu and Luo, 2009), which were both simulated in the experiments.
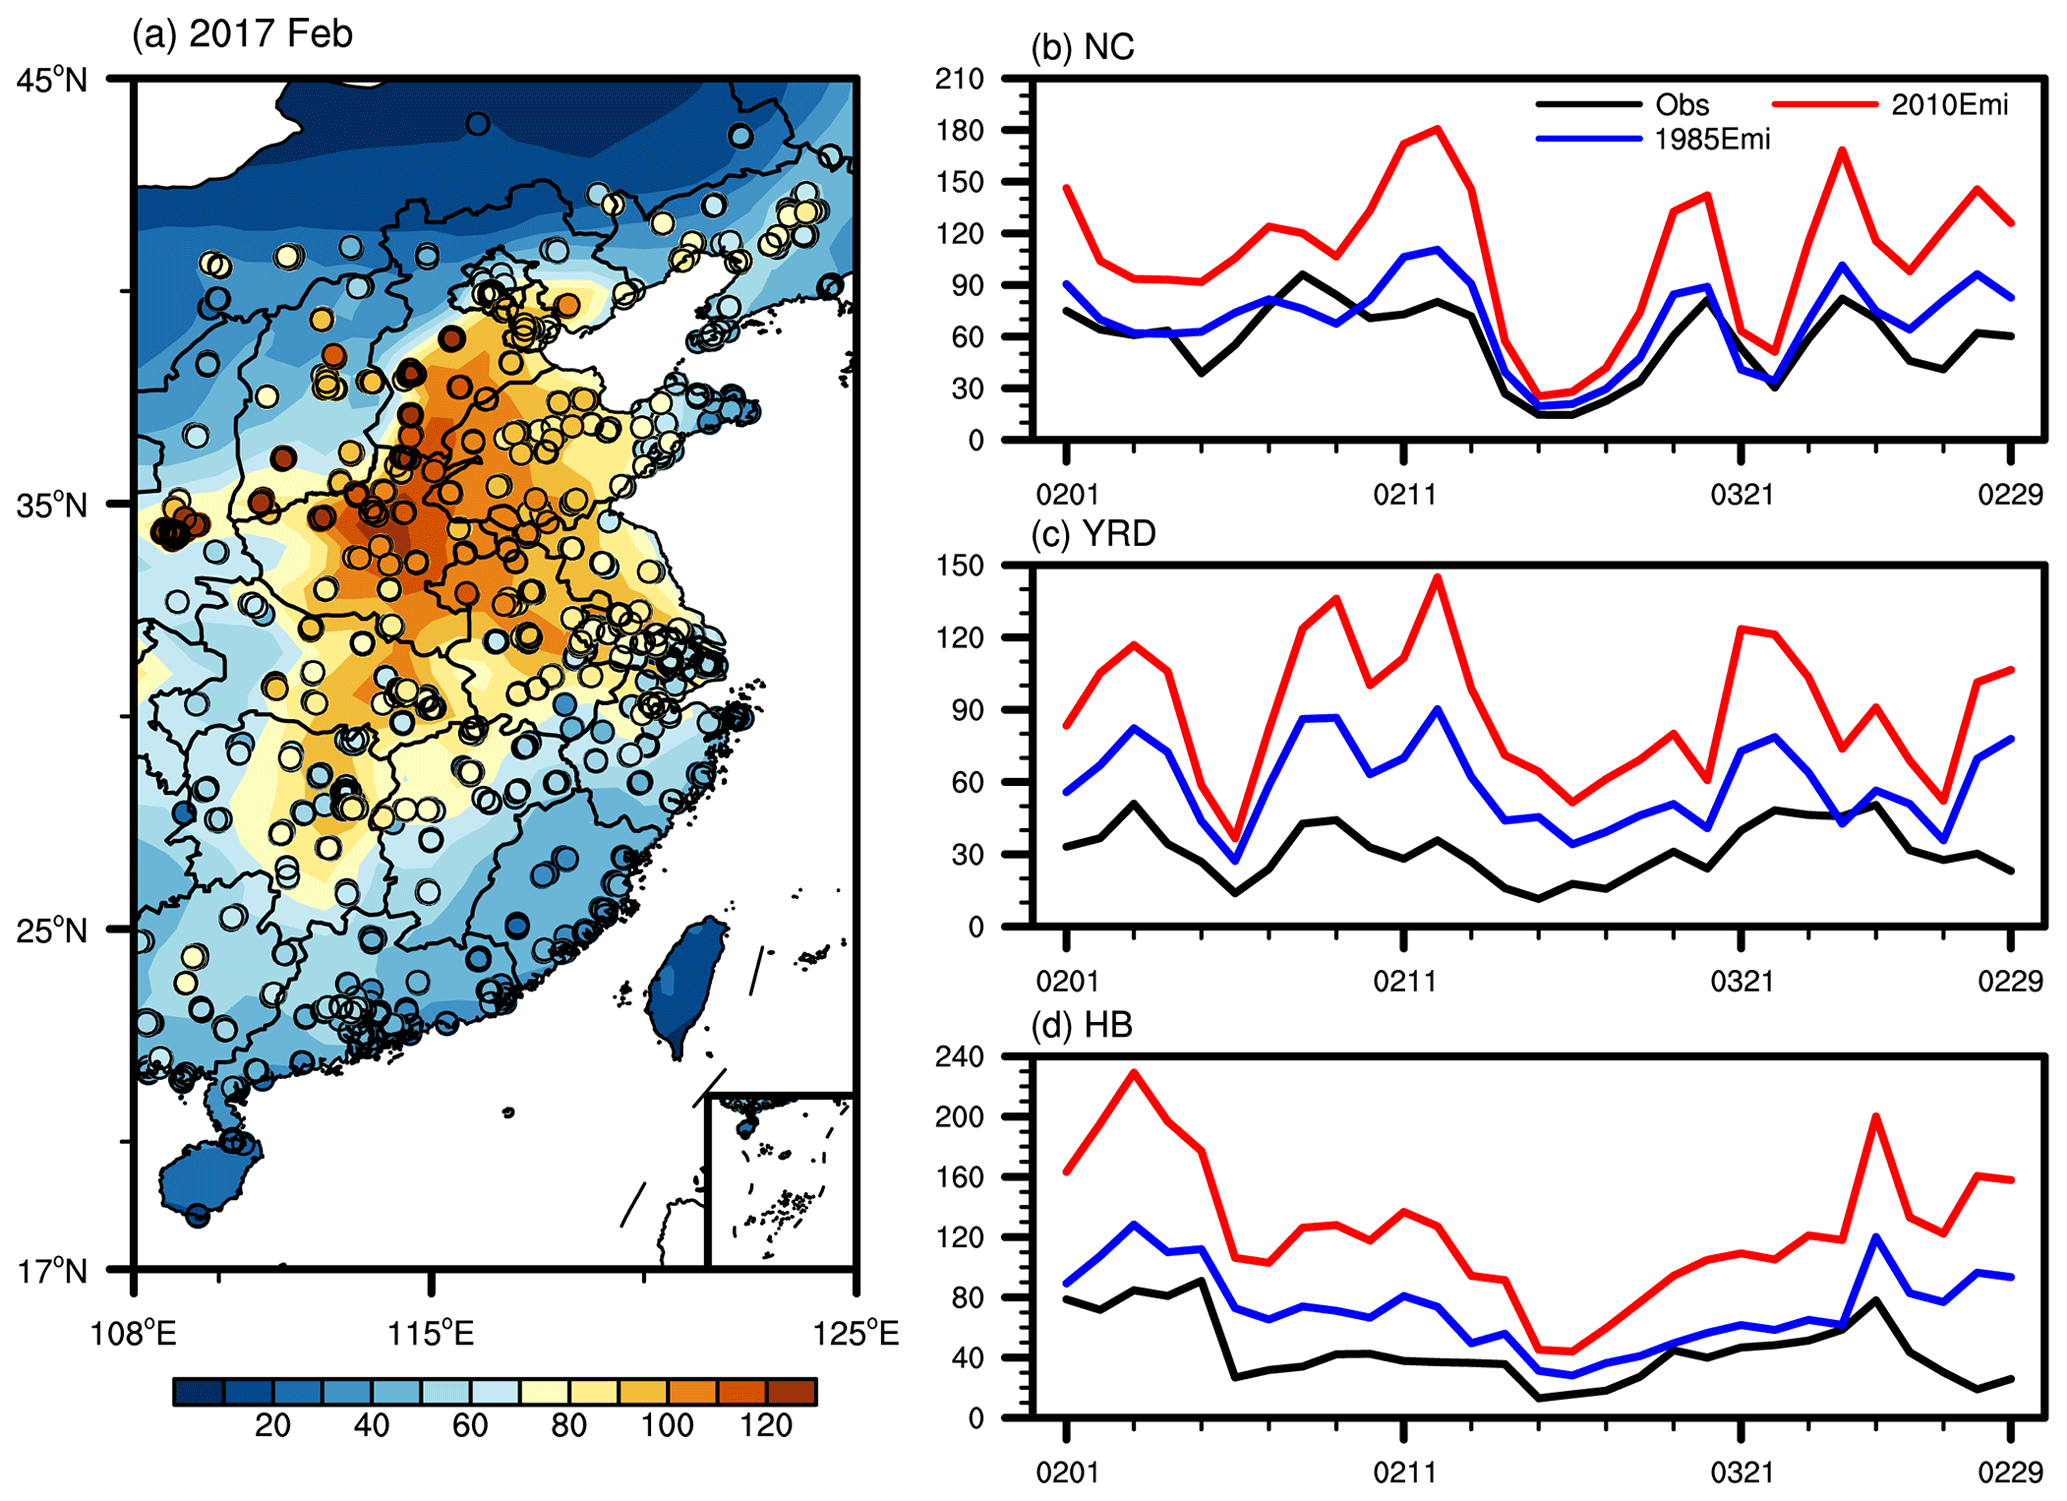
Figure 2(a) Spatial distribution of observed (dots) and GEOS-Chem-simulated (shading) PM2.5 (unit: µg m−3) in February 2017. Observed PM2.5 concentrations (black, unit: µg m−3) and simulated PM2.5 concentrations under 2010 emission (red) and 1985 emission (blue) scenarios in February 2020 in (b) North China (NC), (c) the Yangtze River Delta (YRD) and (d) Hubei Province (HB).
The GEOS-Chem model has been widely used to examine the historical changes in air quality in China and quantitatively separate the impacts of physical–chemical processes. Using the GEOS-Chem model, Yang et al. (2016) found an increasing trend in winter PM2.5 concentrations during 1985–2005, of which 80 % were due to anthropogenic emissions and 20 % were due to meteorological conditions. Here, we simulated the PM2.5 concentrations in February 2017 and evaluated the performance of GEOS-Chem (Fig. 2a). The values of mean square error ∕ mean were 5.8 %, 7.0 % and 5.4 % in North China (NC), the Yangtze River Delta (YRD) and Hubei Province (HB), respectively, indicating the good performance of reproducing the haze-polluted conditions. The absolute biases were larger in the south of China, which is consistent with Dang and Liao (2019). They also compared the simulated and observed daily mean PM2.5 concentrations at the Beijing, Shanghai and Chengdu grids, which had a low bias in Beijing with a normalized mean bias (NMB) of −9.2 % and high biases with NMBs of 18.6 % and 28.7 % in Shanghai and Chengdu, respectively. The simulations in February 2017 in this study substantially underestimated the PM2.5 in NC with an NMB of −3.0 % (Fig. 2a). Among them, the NMB in the Beijing–Tianjin–Hebei region was −3.3 %. However, in the Fenwei plain, the underestimation was even more pronounced, with the NMB reaching −16.3 %. The simulated biases possibly affected the subsequent results and brought uncertainties to some extent. The simulated spatial distribution of PM2.5 was also similar to that of observations with the spatial correlation coefficient = 0.78.
We further verified whether the simulations could capture the roles of meteorological changes in February 2020 under a substantial reduction in emissions because of COVID-19 quarantine measures. In NC, the YRD and HB, the correlation coefficients between daily PM2.5 observations and simulated data under the 2010 (1985) emission scenario reached 0.83 (0.82), 0.67 (0.63), and 0.79 (0.73), respectively (Fig. 2b–d), and could capture the maximum and minimum PM2.5 concentrations. For example, in NC, the simulation could well simulate severe haze events (e.g., from 8–13 and 19–25 February) and good air quality events (e.g., from 14–18 February), reflecting that it has the ability to accurately capture the change in meteorological conditions. The correlation coefficients under the 2010 emission scenario were all higher than those under the 1985 emission scenario maybe due to the emissions from each sector in 2010 being more similar to recent years, which was more reasonable.
The PM2.5 concentration in February from 2015 to 2020 was simulated in this study. Due to delayed updates of the emission inventory, we used the emissions data of 2010 (http://geoschemdata.computecanada.ca/ExtData/HEMCO/AnnualScalar, last access: 2 February 2021) and 1985 (Li et al., 2017) for the simulations, which represented high- and low-emission scenarios, respectively. In total, we conducted two sets of numerical experiments to drive the GEOS-Chem simulations, combining the meteorological conditions from 2015 to 2020 with fixed emissions in 1985 in one and with fixed emissions in 2010 in the other, which could determine the stability of simulated results.
2.3 The method to quantify the influence of the COVID-19 quarantine
As mentioned above, we aimed to examine the impact of the COVID-19 quarantine measures on PM2.5 over the February 2017 level basing on an observational–numerical hybrid method. The observed PM2.5 difference in February 2020 (PMdOBS) was linearly decomposed into three parts: the impacts of changing meteorology (PMdM), expected routine emission reductions (PMdR) and COVID-19 quarantine measures (PMdC), which was a reasonable approximation, and the decomposition equation was . That is, . It should be noted that PMdC is the impact of the COVID-19 quarantine measures compared to the situation whereby the pandemic did not occur and routine emission reductions were conventionally in effect. The value of PMdE (i.e., PMdR+PMdC) was the total impact of the emission reductions in February 2020 against the 2017 level.
Simulated PM2.5 data driven by changing meteorology with two fixed emissions (1985 and 2010) were employed to determine the ratio of PMdM of each year ∕ observed PM2.5 in 2017. Depending on the GEOS-Chem simulations, we found that the percentage of changed PM2.5 due to the differences in meteorology remained nearly constant regardless of the emission level (Fig. S1 in the Supplement), which was consistent with the results of Yin and Zhang (2020). This percentage was the difference in simulated PM2.5 between each year and 2017 under the same emission scenario divided by the simulated PM2.5 in 2017. For example, the percentages due to different meteorology between 2020 and 2017 were 22.1 % (21.4 %), −1.2 % (−0.7 %) and 9.0 % (8.2 %) in NC, the YRD and HB, respectively, under the low (high) emissions (Fig. S1). The percentage under the 2010 emission scenario was selected as the final percentage because the emissions from each sector in 2010 were more similar to recent years and thus were more reasonable. Then, through multiplying the 2017 observation by this percentage, PMdM can be quantified in each simulation grid with respect to 2017 (Step 1).
From 2015 to 2019, PMdC=0; thus, . Here, we repeated Step 1 to determine PMdM in each year from 2015 to 2019 relative to 2017 (i.e., PMdM=0 in 2017). After removing the effect of meteorological conditions in PM2.5 differences, PMdR in all years except 2020 can also be calculated. According to many previous studies, the change in emissions resulted in a linear change in air pollution in China from 2013–2019 (Wang et al., 2020; Geng et al., 2020) which might be related to the huge emission reduction due to the implementation of clean air action. Because the signal of emission reduction in China had been particularly strong since 2013, it could be easily detected and the assumption of a linear reduction in pollution caused by emission reduction has been applicable in China in the past few years. Based on this approximation, we used the method of extrapolation to speculate the impact of routine emission reduction on PM2.5. We performed linear extrapolation based on known PMdR values from 2015 to 2019 to obtain PMdR in 2020 (Step 2, Fig. S2). This PMdR in 2020 was calculated as the change in PM2.5 caused by expected routine emission reduction, which did not actually happen but merely gave an assessment in the case of “if no COVID-19”. In Beijing and Shanghai, for example, PM2.5 fell by 23.1 % and 26.6 % due to routine emission reduction in 2019, respectively, compared with 2015. Zhou et al. (2019) indicated that emission reductions caused 20 %–26 % decreases in winter in Beijing which has been translated into 5 years. Zhang et al. (2020) also showed that the emission controls in the Beijing–Tianjin–Hebei (BTH) region led to significant reductions in PM2.5 from 2013 to 2017 of approximately 20 % after excluding the impacts of meteorology. Geng et al. (2020) found a 20 % drop in the main component of PM2.5 in the Yangtze River Delta from 2013 to 2017. These results are consistent with our extrapolated results. Therefore, it is reasonable to obtain PMdR by extrapolation after disentangling the effects of meteorological conditions.
Through Step 1 and Step 2, PMdC and PMdR, respectively, in 2020 can be determined. PMdOBS can be directly calculated from the observed data. After removing the influences of climate anomalies and routine emission reductions, the impact of COVID-19 quarantine measures on PM2.5 (PMdC) was extracted as (Step 3).
The mean PM2.5 concentration in February 2020 was nearly below 80 µg m−3 at the vast majority of sites in the east of China, which was much lower than before (Fig. S3). North China (NC) was still the most polluted region (> 40 µg m−3), but the PM2.5 concentrations in the Pearl River Delta (PRD) and Yangtze River Delta (YRD) were < 20 and < 40 µg m−3, respectively. Relative to the observations in February 2017, negative PM2.5 anomalies were centered in NC, with values of approximately −60 to −40 µg m−3 in southern Hebei Province and northern Henan Province (Fig. 3). In Hubei Province (HB), where the COVID-19 pneumonia cases were the most severe in February, the PM2.5 concentration was 20–40 µg m−3 lower than that in 2017. The PM2.5 differences were also negative in the YRD and PRD. Therefore, how much did air pollution decrease due to the COVID-19 quarantine measures in February in the east of China?
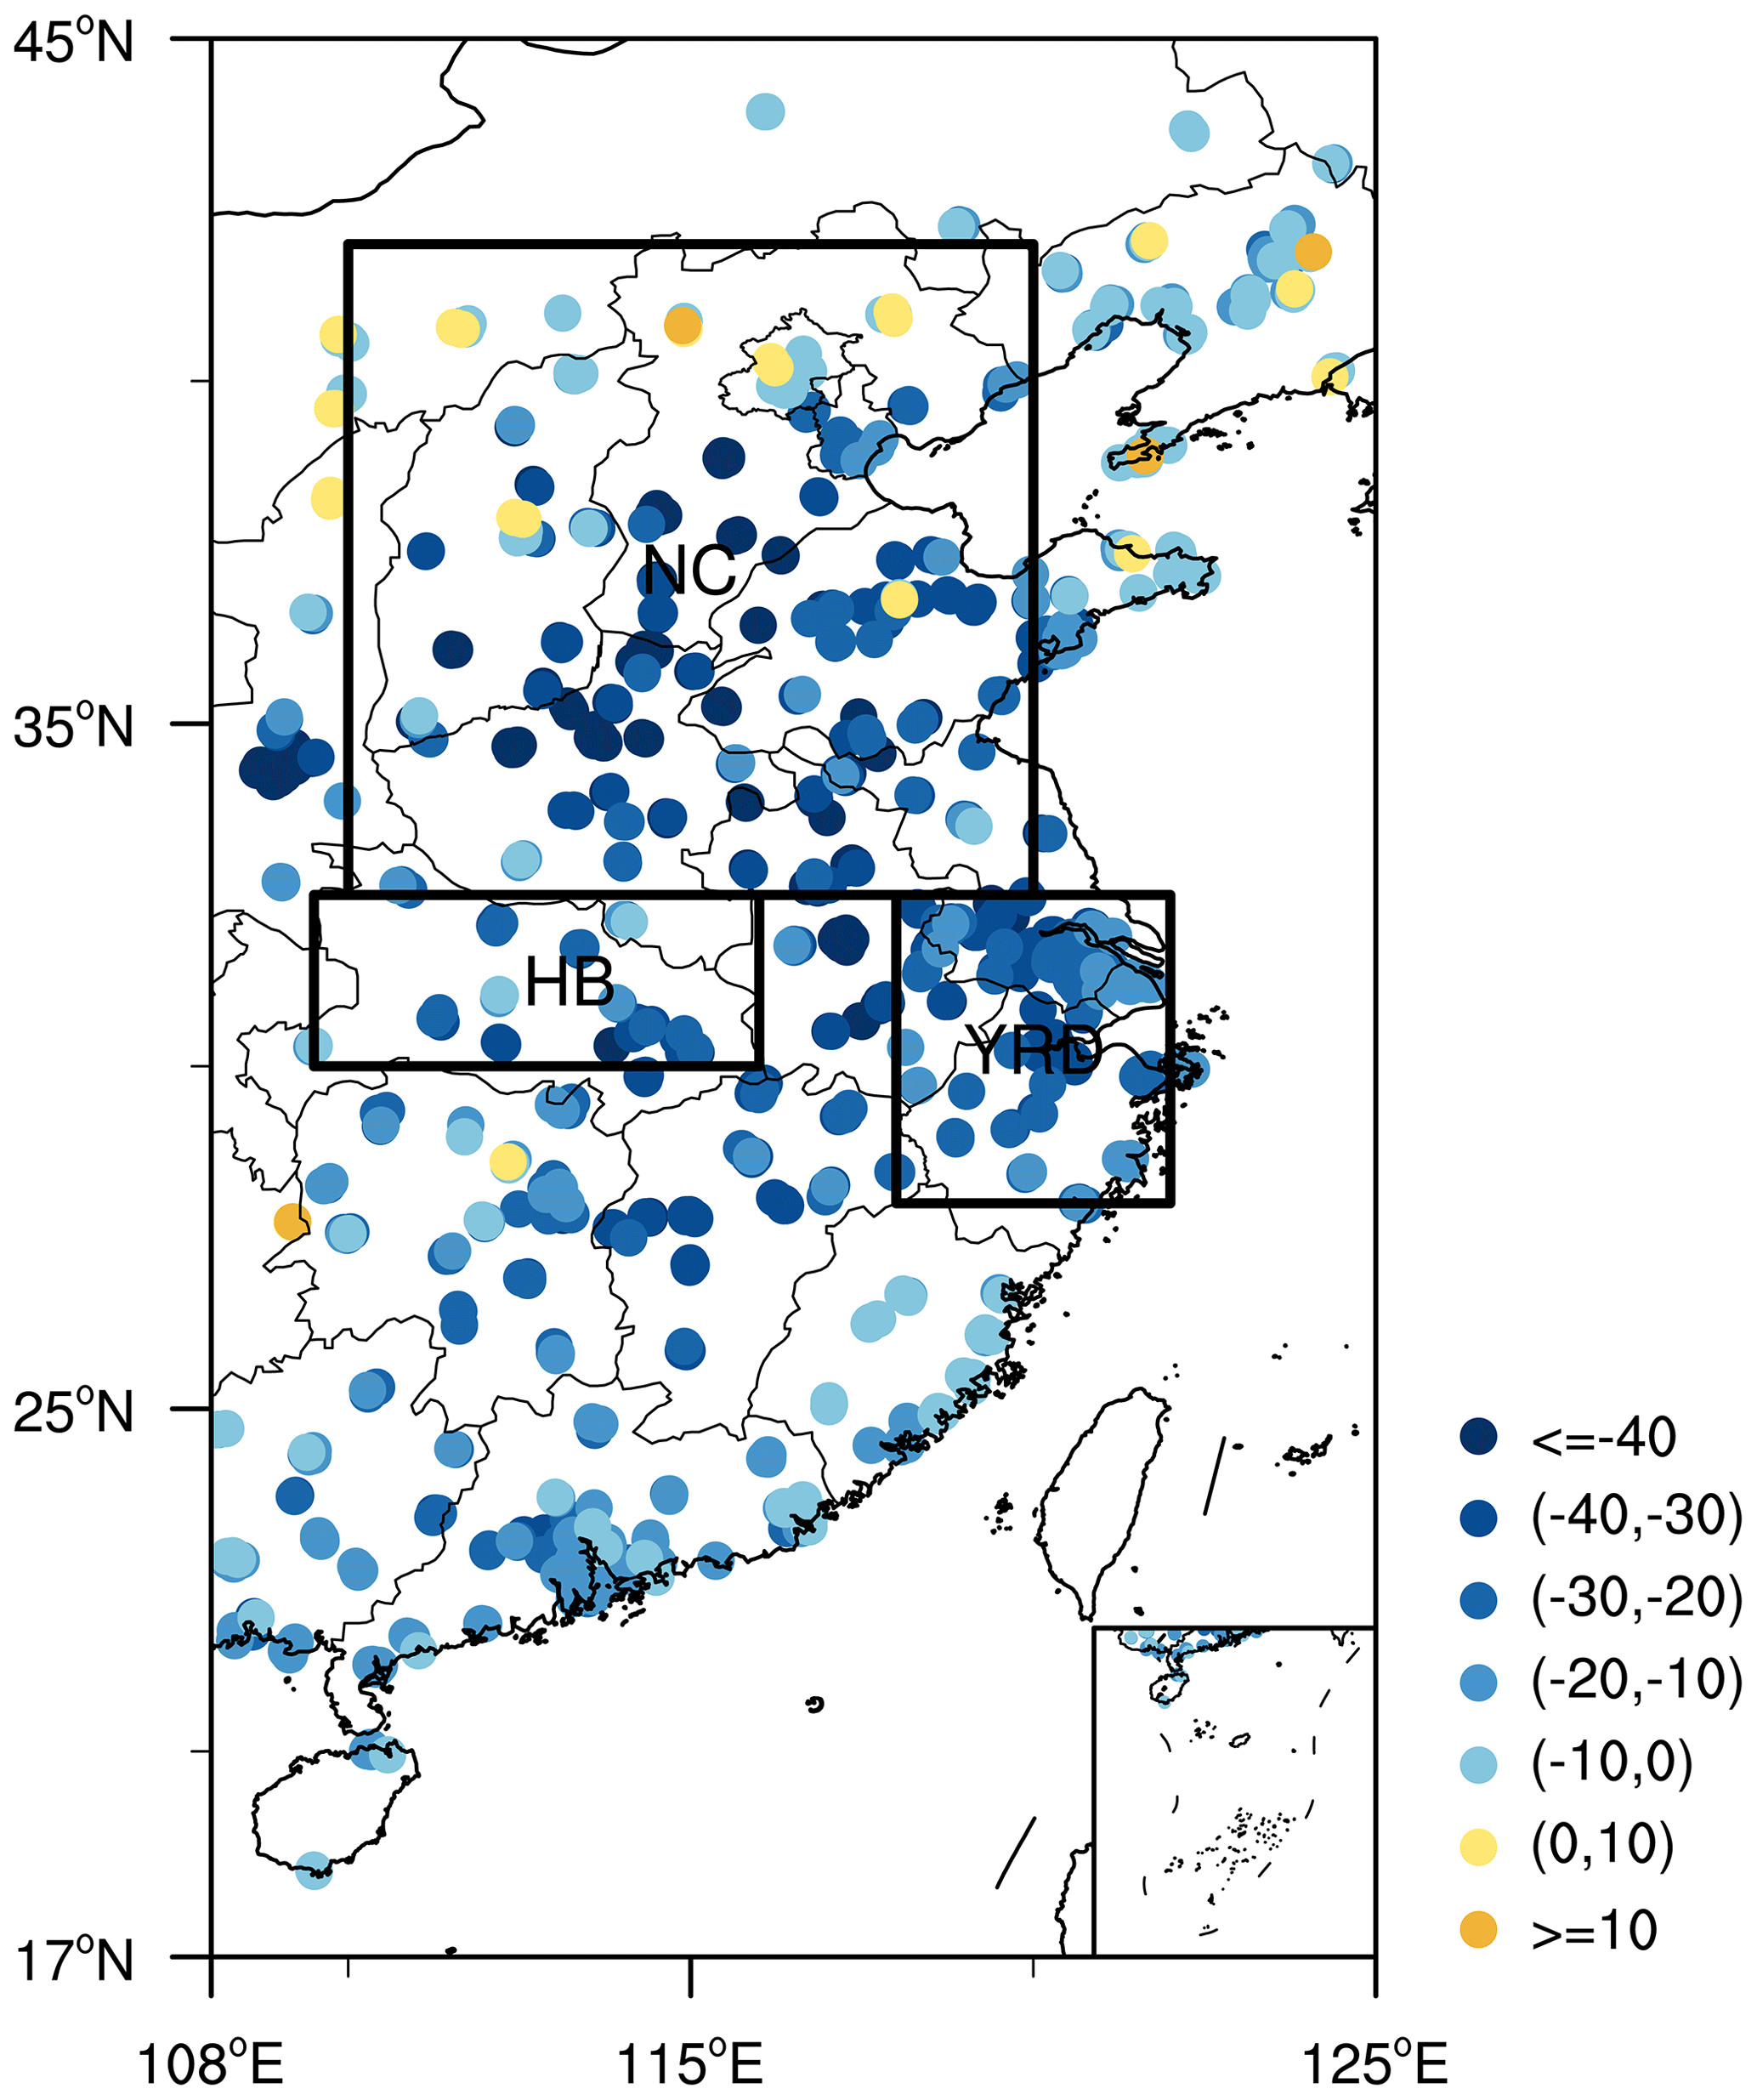
Figure 3Differences in the observed PM2.5 (unit: µg m−3) in February between 2020 and 2017. The black boxes indicate the locations of North China (NC; 32.5–42∘ N, 110–120∘ E), the Yangtze River Delta (YRD; 28–32.5∘ N, 118–122∘ E) and Hubei Province (HB; 30–32.5∘ N, 109.5–116∘ E).
Climate variability notably influences the interannual decadal variations in haze pollution as verified by both observational analysis (Yin et al., 2015) and GEOS-Chem simulations (Dang and Liao, 2019). Furthermore, Zhang et al. (2020) reported that meteorology contributed 50 % and 78 % of the wintertime PM2.5 reduction between 2017 and 2013 in BTH and the YRD, respectively. Therefore, it is necessary to disentangle the influences of climate anomalies before quantifying the contributions of the COVID-19 quarantine measures to the air quality. The highest observed PM2.5 concentrations were 274, 223 and 303 µg m−3 in Beijing, Tianjin and Shijiazhuang, respectively. Although human activities had sharply decreased, severe haze pollution (e.g., 8–13 and 19–25 February 2020) was not avoided, which was attributed to the stagnant atmosphere (Wang et al., 2020), and these severe haze events were also reproduced by the GEOS-Chem simulation (see Sect. 2.2 and Fig. 2b).
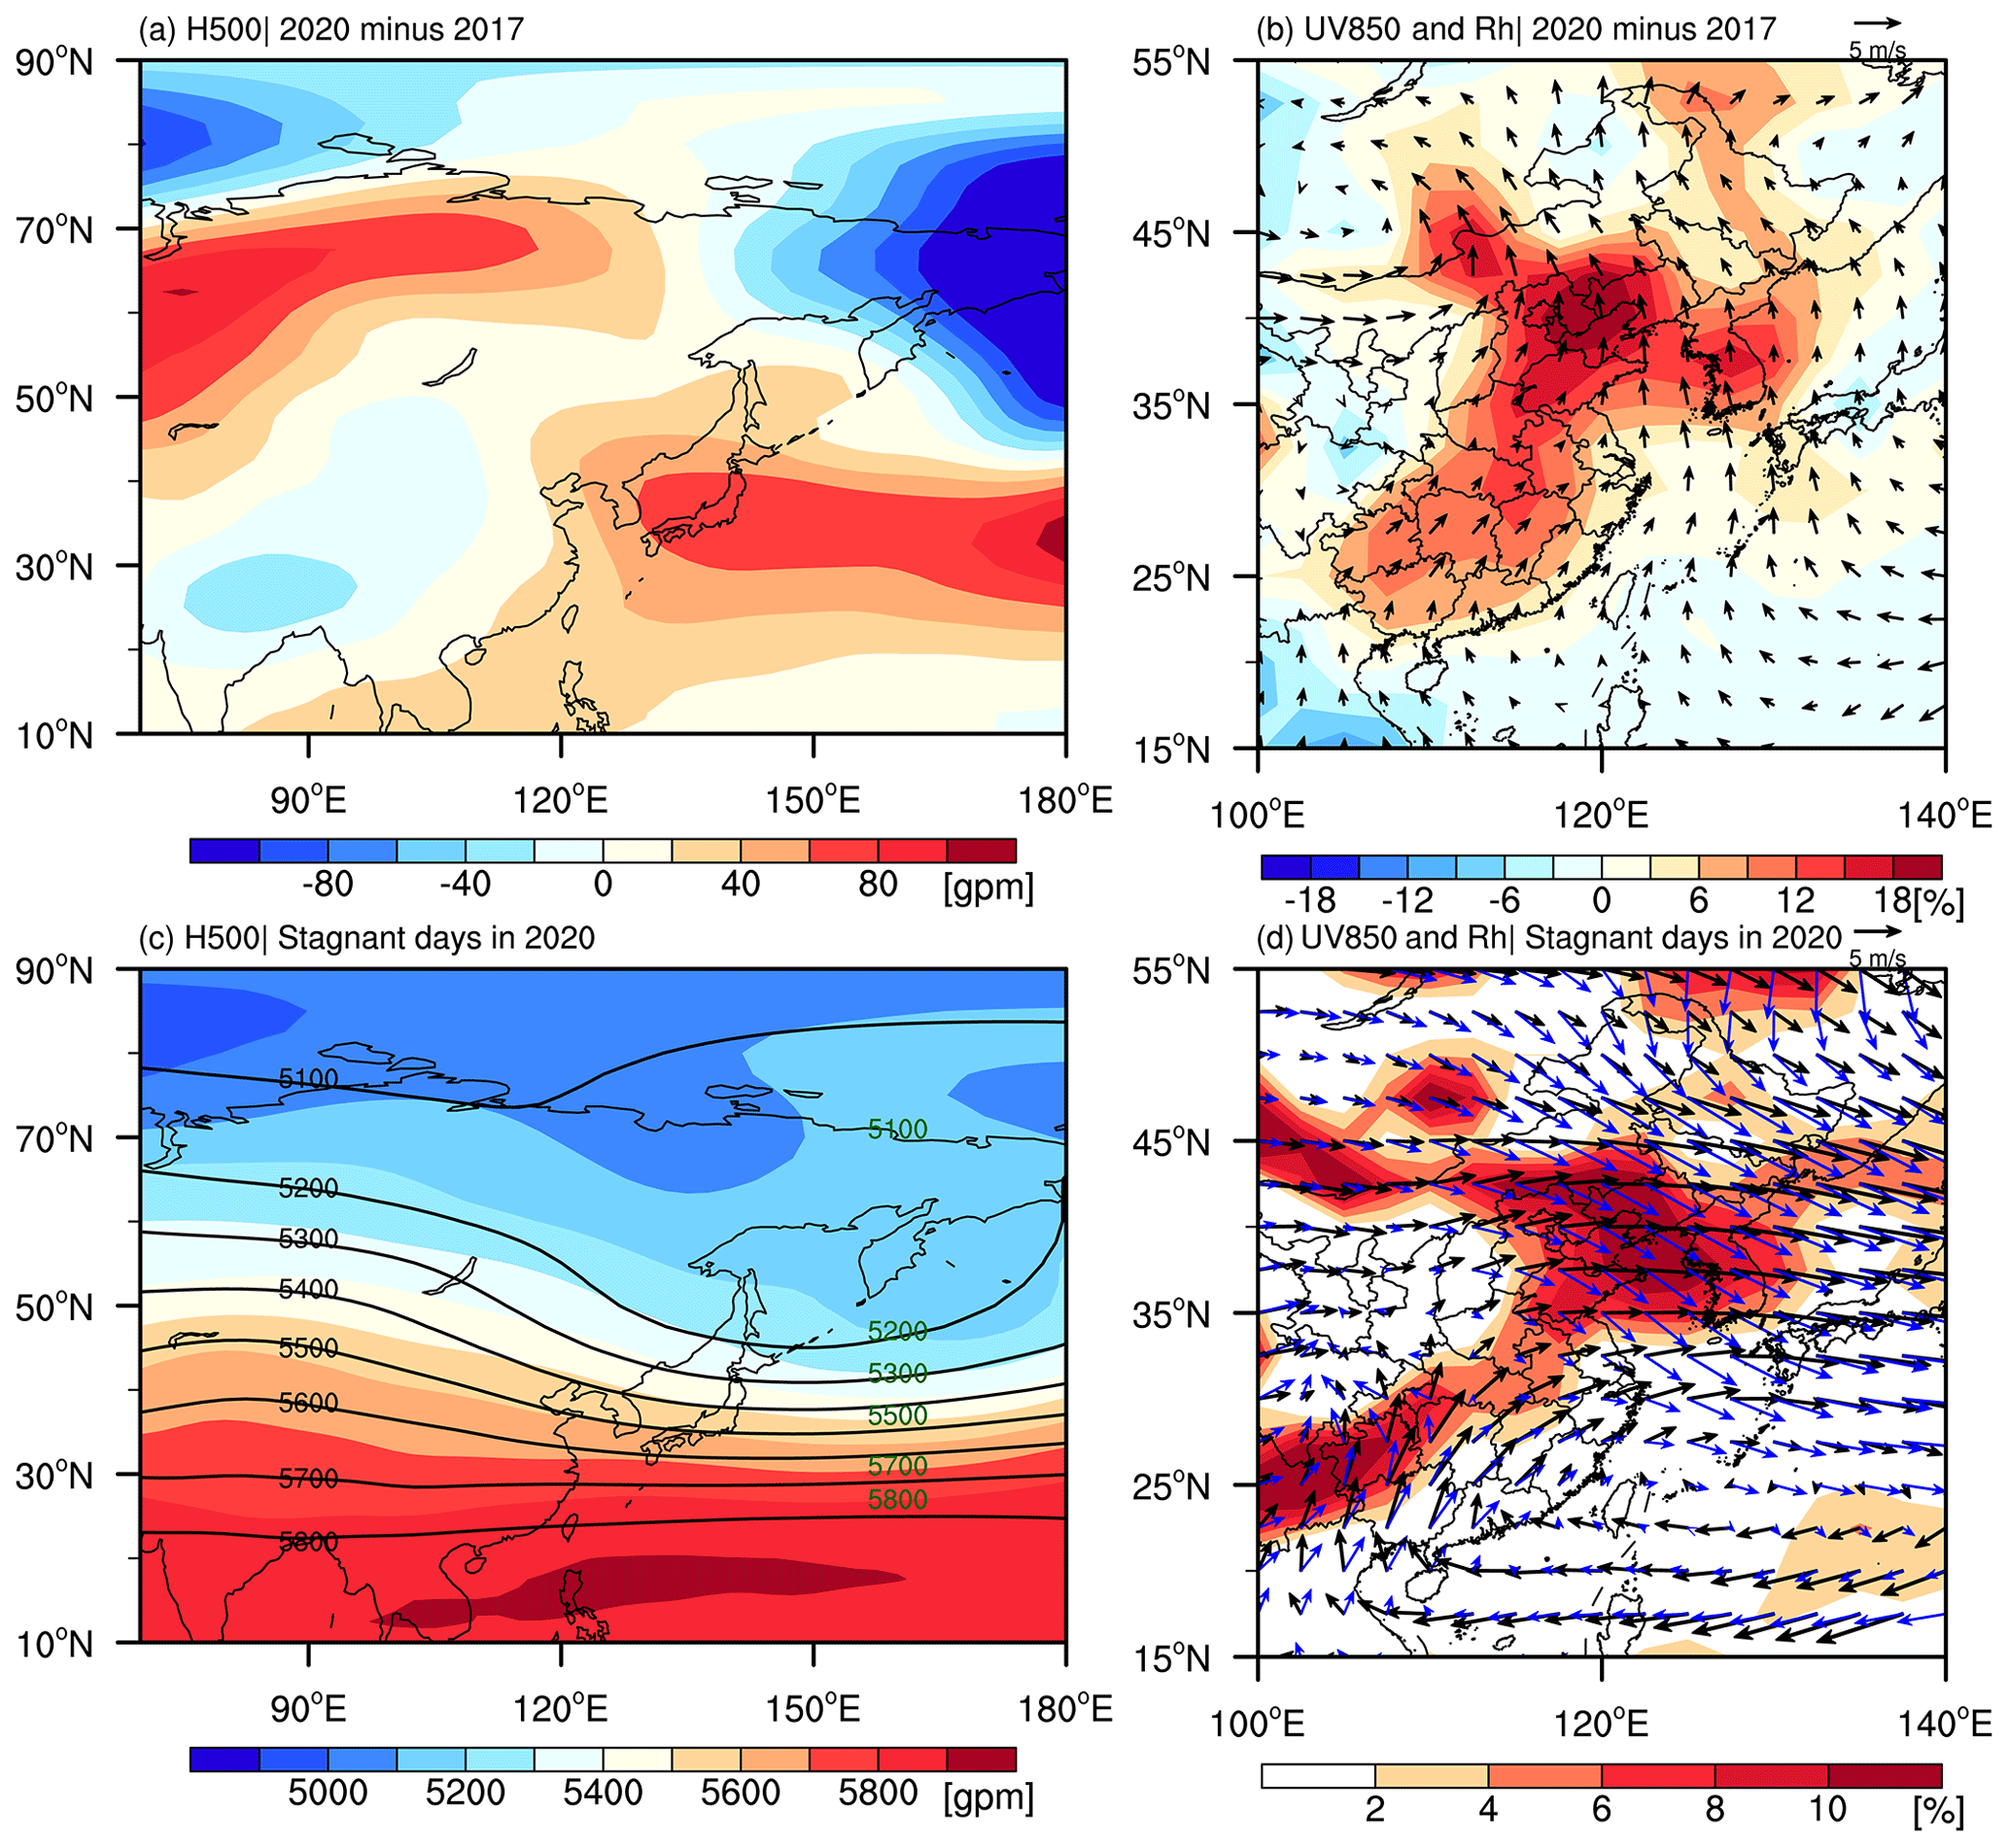
Figure 4Differences in the observed atmospheric circulation in February between 2020 and 2017, including (a) geopotential potential height at 500 hPa (unit: gpm), and (b) wind at 850 hPa (arrows; unit: m s−1) and surface relative humidity (shading; unit: %). The atmospheric circulations on the stagnant days (e.g., from 8–13 and 19–25 February 2020) are also shown, including (c) geopotential potential height at 500 hPa (shading; unit: gpm) and its climate mean in February (contours) and (d) wind at 850 hPa (black arrows; unit: m s−1), its climate mean (blue arrows) and the increased surface relative humidity (shading; unit: %; stagnant days minus climate mean).

Figure 5PM2.5 difference (unit: µg m−3) in February between 2020 and 2017 due to (a) changing meteorology (PMdM), (b) expected routine emission reductions (PMdR), (c) the COVID-19 quarantine measures (PMdC) and (d) the total emission reduction ().
As shown in Fig. 4a–b, the meteorological conditions in February 2020 were more favorable for the occurrence of haze pollution in NC. In the mid-troposphere, an anomalous anticyclone was located over NC and the Sea of Japan (Fig. 4a). These anticyclonic anomalies clearly stimulated anomalous southerlies over eastern China, which not only transported sufficient water vapor to NC but also overwhelmed the climatic northerlies in winter (Fig. 4b). In addition, the anomalous upward motion associated with anomalous anticyclones prevented the downward transportation of westerly momentum and preserved the thermal inversion layer over NC (Fig. S4). Particularly on the stagnant days (i.e., 8–13 and 19–25 February), the East Asia deep trough, one of the most significant zonally asymmetric circulations in the wintertime Northern Hemisphere (Song et al., 2016), shifted eastwards and northwards of the climate mean, which steered the cold air to the North Pacific instead of North China (Fig. 4c). The climatic northerlies in February, related to the East Asia winter monsoon, also turned to be southerly winds in the east of China (Fig. 4d). Physically, the weakening surface winds and strong thermal inversion corresponded to weaker dispersion conditions, and the higher humidity indicated a favorable environment for the hygroscopic growth of aerosol particles to evidently decrease the visibility. Compared with the climate (February 2017) monthly mean, boundary layer height (BLH) decreased by 19.5 m (34.5 m), surface relative humidity (RH) increased by 5 % (10.6 %) and surface air temperature (SAT) rose by 1.6 ∘C (0.9 ∘C) after detrending, changes which were conducive to the increase in PM2.5 concentration in February 2020. Furthermore, the correlation coefficients of daily PM2.5 with BLH, RH, wind speed and SAT in North China were −0.63, 0.44, −0.45 and 0.46, respectively, all of which passed the 95 % significance test using the t-test method and indicated the importance of meteorology. We used the meteorological data in February 2017 to establish a multiple linear regression equation to fit PM2.5. The correlation coefficients between the fitting results and the observed PM2.5 concentration in NC, the YRD and HB reached 0.84, 0.64 and 0.65, exceeding the 99 % significance test using the t-test method. Then, we put the observed meteorological data in February 2020 into this established multiple regression equation to obtain the predicted PM2.5 concentration. Using the regress-predicted value, the percentages of changed PM2.5 due to the differences in meteorology between 2017 and 2020 were recalculated and were 20.7 %, −3.2 % and 9.5 % in NC, the YRD and HB, respectively (Fig. S1), which is consistent with and enhanced the robustness of the results obtained by our previous model simulation. Based on the GEOS-Chem simulations, PMdM was calculated between February 2020 and 2017 (see Sect. 2.3). To the south of 30∘ N, most PMdM values were negative with small absolute values, at < 10 µg m−3. To the north of 30∘ N, the PMdM values were mostly positive, ranging from 30–60 µg m−3 in BTH (Fig. 5a).
Since 2013, the Chinese government has legislated and implemented stringent air pollution prevention and management policies that have clearly contributed to air quality improvement (Wang et al., 2019). As mentioned above, without the COVID-19 pandemic, these emission reduction policies would certainly have remained in effect in February 2020. Thus, we extrapolated PMdR (i.e., the PM2.5 difference due to expected routine emission reductions) between February 2020 and 2017 to isolate the impacts of the COVID-19 quarantine measures (i.e., PMdC). PMdR was mostly negative in the east of China (Fig. 5b). Because the impacts of meteorology were proactively removed, these negative values illustrated that routine emission reductions substantially reduced the wintertime PM2.5 concentration. The contributions of the emission reduction policies were the greatest in the south of BTH and were also remarkable in Hubei Province (Fig. 5b). Although the PMdR of Beijing in 2016 did not strictly comply with the pattern of monotonous decrease, which might be caused by the fluctuation in policy and its implementation, the value of PMdR in 2020 relative to 2017 was −8.4 µg m−3 and was comparable to the 11.5 µg m−3 reductions due to policy during 2013–2017 (Zhang et al., 2020). In Shanghai, PMdR was −12.0 µg m−3 (Fig. 6), whose magnitude was proportional to assessments by Zhang et al. (2020), and the trend was nearly linear. The rationality of the extrapolations of PMdR was also proved in Sect. 2.3. The trend in PMdR in Wuhan was −9.6 µg m−3 per year from 2015–2019, which indicated high efficiency of the emission reduction policies and resulted in large PMdR values in 2020 (i.e., −21.8 µg m−3).
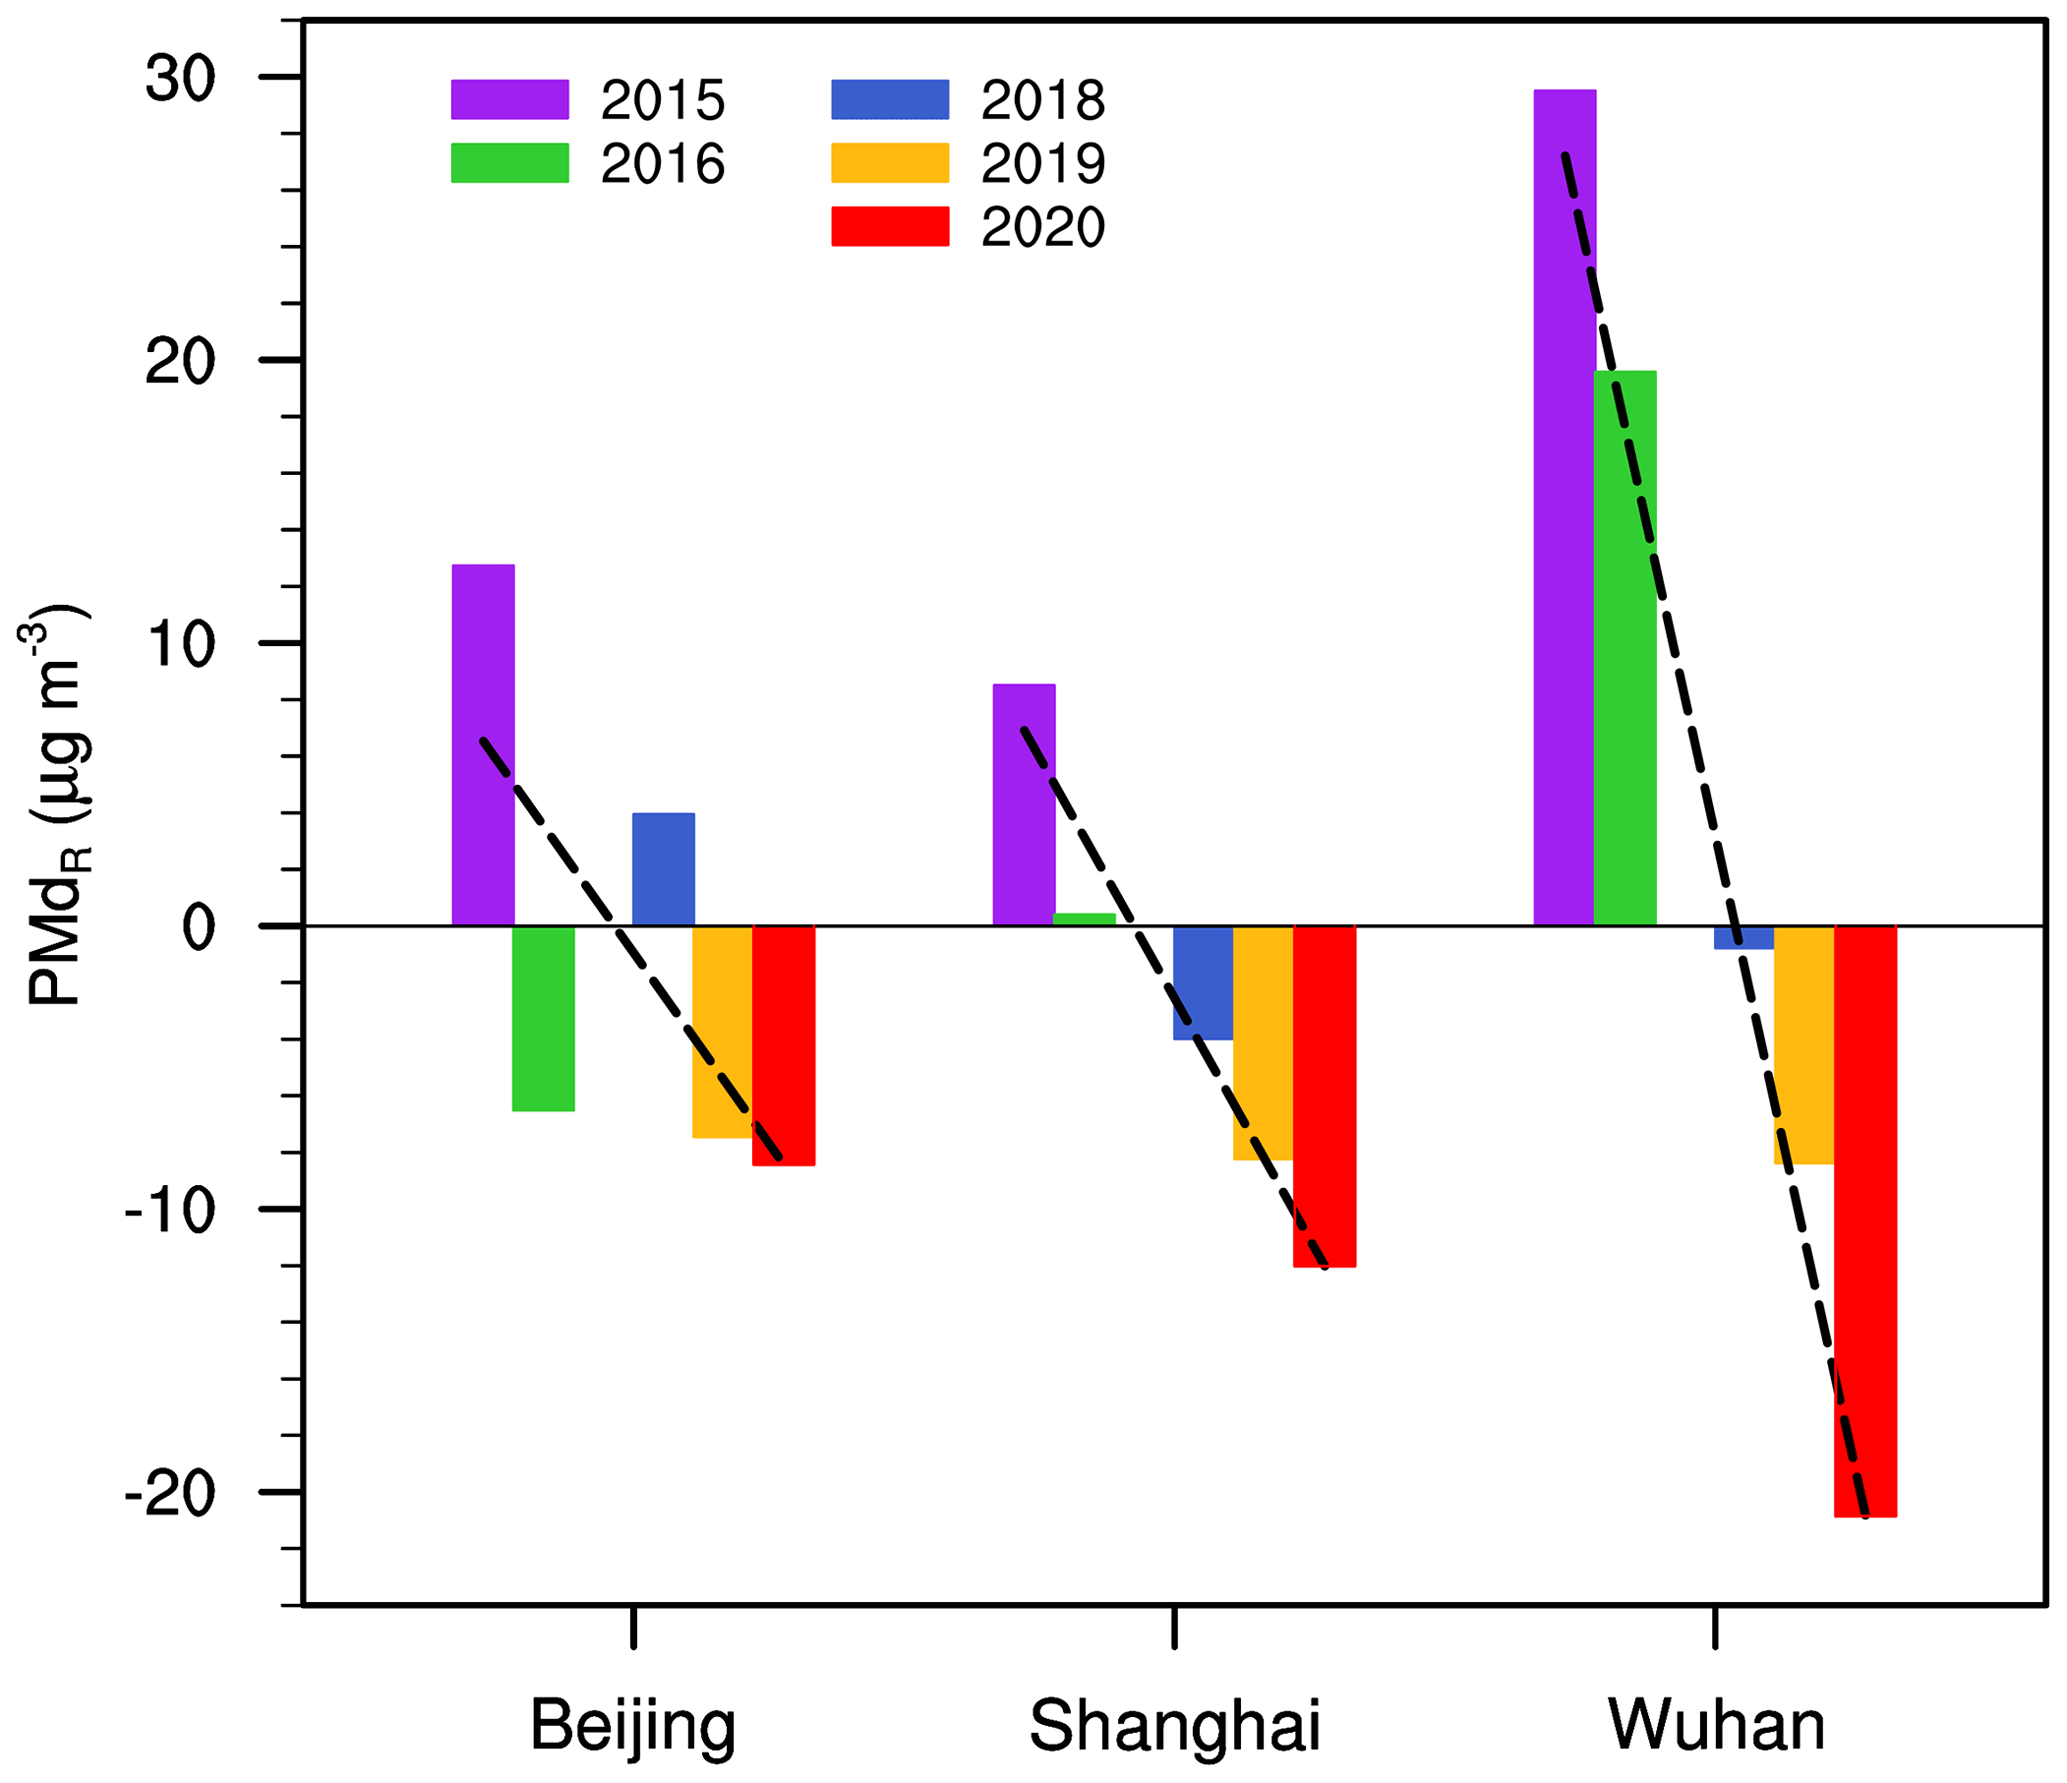
Figure 6Variation in PMdR (unit: µg m−3) with respect to the February 2017 level in Beijing, Shanghai and Wuhan from 2015 to 2019. PMdR in 2020 was linearly extrapolated from that in the 2015–2019 period. The dotted line is the linear trend.
By disentangling the impacts of meteorology and routine emission reduction policies, the change in PM2.5 due to the COVID-19 quarantine measures was quantitatively extracted. As expected, this severe pandemic caused dramatic slumps in the PM2.5 concentration across China (Fig. 5c). Large PMdC values (approximately −60 to −30 µg m−3) were located in the highly polluted NC regions where intensive heavy industries were stopped and the traditional massive social activities and transportation around the Chinese New Year were canceled as part of the COVID-19 quarantine measures. To the south of 30∘ N, the impacts of the COVID-19 quarantine measures on the air quality were relatively weaker (−30 to 0 µg m−3) than those in the north. Generally, the southern region was less polluted than the north; therefore the baseline of PM2.5 concentration was relatively lower (Fig. S3a). In addition, meteorological conditions in the south in February 2020 had no positive contribution (Fig. 5a), which would not lead to the increase in PM2.5 concentration. These two possible reasons resulted in a smaller space for PM2.5 decrease due to COVID-19 quarantine measures in the south and accompanying regional differences. To reduce the assessment uncertainties, the percentage of changed PM2.5 due to the differences in meteorology were recalculated based on the GEOS-Chem simulations with fixed emission in 1985. As described in Sect. 2.3, the recalculated PMdC values in Fig. S5 were consistent with those in Fig. 5c, showing a high robustness. Furthermore, the mean PM2.5 concentration decreases due to the COVID-19 quarantine measures in NC, HB and the YRD were analyzed, and they accounted for 59 %, 26 % and 72 %, respectively, of the observed February PM2.5 concentration in 2020 (Fig. 7).
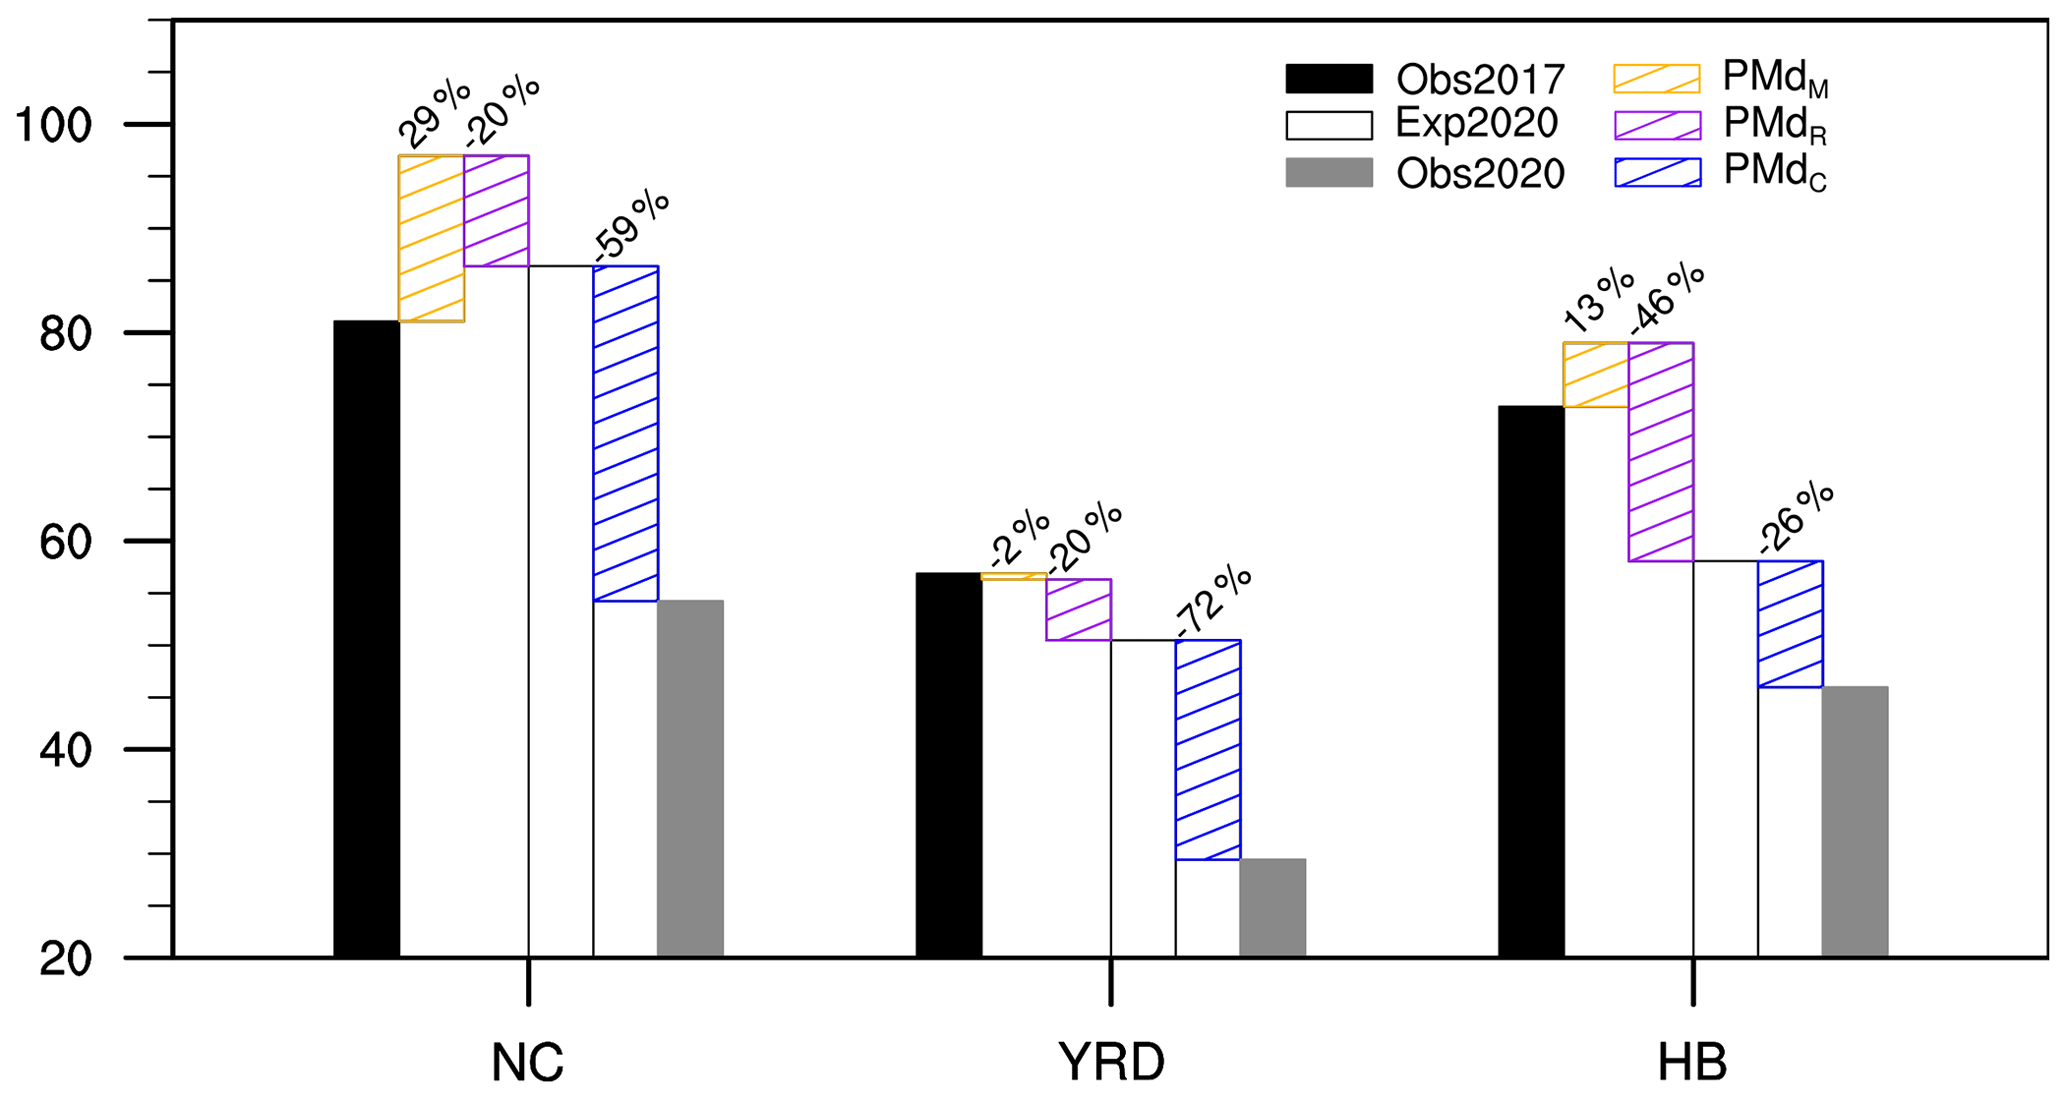
Figure 7Contributions of PMdM (orange bars with hatching), PMdR (purple bars with hatching) and PMdC (blue bars with hatching) to the change in PM2.5 concentration (unit: µg m−3) between 2020 and 2017 in the three regions. The observed PM2.5 concentration in February 2017 (black) and 2020 (gray) is also plotted, and the expected PM2.5 concentration without the COVID-19 quarantine is indicated by black-outlined bars. The contribution ratios of the three factors (relative to the PM2.5 observations in 2020) are also indicated on the corresponding bars.
It should be noted that the sum of PMdR and PMdC (i.e., PMdE) is the total contribution of the emission reduction in February 2020 with respect to 2017 (Fig. 5d). In NC, the YRD and HB, the COVID-19 quarantine measures and routine emission reductions drove PM2.5 in the same direction. The mean PM2.5 decrease in NC, due to the total emission reduction, was −43.3 µg m−3, accounting for 79 % of the observed February PM2.5 concentration in 2020 (Fig. 7). Although the absolute values of both PMdR and PMdC in the YRD were smaller than those in NC, the change percentage (92 %) was larger because of the lower base PM2.5 concentration. In HB, where more than 80 % of the confirmed COVID-19 cases in China occurred and the cities were in emergency lockdown, the total anthropogenic emissions were clearly limited, which resulted in a 72 % decline in PM2.5 in the atmosphere (Fig. 7). In particular, if the anthropogenic emissions had not declined, the PM2.5 concentration in NC, the YRD and HB would have increased to nearly twice the current observation (Fig. 7), indicating significant contributions of human activities to the air pollution in China.
The declines in PM2.5 seemed not to be directly proportional to the almost complete shutoff of vehicle traffic and industries; that is, the reduction ratio of PM2.5 concentrations was smaller than that of precursor emissions (Wang et al., 2020). The unexpected air pollution during the marked emission reductions was closely related to the stagnant airflow; enhanced production of secondary aerosols; and uninterrupted residential heating, power plant operation and petrochemical facility operation (Le et al., 2020). The partial impacts of stagnant meteorological conditions have been explained earlier (Fig. 4). In Wuhan, the PM2.5 remained the main pollutant during the city lockdown and the high level of sulfur dioxide (SO2) may be related to increased domestic heating and cooking (Lian et al., 2020). In North China, large reductions in primary aerosols were observed, but the decreases in secondary aerosols were much smaller (Sun et al., 2020; Shi and Brasseur, 2020). Because of the disruption of transportation, reduced nitrogen oxide (NOx) increased the concentrations of ozone and nighttime nitrate (NO3) radical formations. The increased oxidizing capacity in the atmosphere enhanced the formation of secondary particulate matters (Huang et al., 2020). Thus, the non-linear relationship of emission reduction and secondary aerosols also partially contributed to the haze occurrence during the COVID-19 lockdown.
At the beginning of 2020, the Chinese government implemented top-level emergency response measures to contain the spread of COVID-19. The traditional social activities surrounding the Chinese New Year, industrial and transportation activities, etc. were prohibited, which effectively reduced the number of confirmed cases in China. Concomitantly, anthropogenic emissions, which are the fundamental reason for haze pollution, were dramatically reduced by the COVID-19 quarantine measures. In this study, we employed observations and GEOS-Chem simulations to quantify the impacts of the COVID-19 quarantine measures on the air quality improvement in February 2020 after decomposing the contributions of expected routine emission reductions and climate variability. Although the specific influences varied by region, the COVID-19 quarantine measures substantially decreased the level of haze pollution in the east of China (Fig. 7). In North China, the meteorological conditions were stagnant which enhanced the PM2.5 concentration by 30 % (relative to the observations in 2020). In contrast, the expected routine emission reductions and emergency COVID-19 quarantine measures resulted in an 80 % decline. In the YRD, the impacts of meteorology were negligible but the COVID-19 quarantine measures decreased PM2.5 by 72 %. In Hubei Province, the impact of the total emission reduction (72 %) evidently exceeded the PM2.5 increase due to meteorological conditions (13 %). In March, due to the continued control of COVID-19, the quarantine measures still contributed to the negative anomalies of the observed PM2.5 between 2020 and 2017 (Fig. 8a). Because activities in production and life more generally were gradually resumed in March, the PM2.5 drops caused by the COVID-19 quarantine measures became weaker compared with February (Fig. 8b, c). The contributions of PMdC to the change in PM2.5 concentration in NC, the YRD and HB declined from 32.2, 21.0 and 12.1 µg m−3 in February to 7.0, 2.4 and 6.7 µg m−3 in March, respectively.

Figure 8(a) Differences in the observed PM2.5 (unit: µg m−3) in March between 2020 and 2017. (b) Contributions of PMdC to the change in PM2.5 concentration (unit: µg m−3) between 2020 and 2017 and (c) the contribution ratios of PMdC (relative to the PM2.5 observations in 2020) in March (blue) and February (red) in the three regions.
Because of the common update delay of the emission inventory, we employed a combined analysis consisting of observational and numerical methods. We strictly demonstrated the rationality of this method and the results, mainly based on the relatively constant contribution ratio of changing meteorology from GEOS-Chem simulations under the different emissions (Yin and Zhang 2020). However, there was a certain bias in the simulations by the GEOS-Chem model, and the biases also showed regional differences (Dang and Liao, 2019). Therefore, gaps between the assessed results and reality still exist, which requires further numerical experiments when the emission inventory is updated. Furthermore, during the calculation process, the observed PM2.5 difference in February 2020 was linearly decomposed into three parts. Although this linear decomposition has been reasonable in China in the past few years, we must note that this approximation has not considered the meteorology–emission interactions, the product of the emission, the loss lifetime and particularly the sulfate–nitrate–ammonia thermodynamics (Cai et al., 2017), which have brought some uncertainties. The actual emission reduction effect is considerable (Fig. 3d), in line with the increasingly strengthened emission reduction policies in recent years. When calculating the PMdR in 2020, we use the method of extrapolation. Although the result is consistent with other observational and numerical studies (Geng et al., 2020; Zhang et al., 2020; Zhou et al., 2019), it is still an estimated value rather than a true value. These issues need to be examined in future studies to unlock the respective effects of emissions and meteorological conditions on PM2.5 over eastern China. To restrict the possible uncertainties, we set up some constraints: (1) the pivotal contribution ratio of changing meteorology was calculated under two emission levels and recalculated by statistical regressed model; (2) the values of PMdM and PMdR were widely compared to previous studies.
If the COVID-19 epidemic had not occurred, the concentrations of PM2.5 would have increased by up to 1.3–1.7 times the observations in February 2020 (Fig. 7). Therefore, the pollution abatement must continue. Because of the huge population base in the east of China, the anthropogenic emissions exceeded the atmospheric environmental capacity even during COVID-19 quarantine measures. Although the PM2.5 dropped significantly, marked air pollution also occurred during this unique experiment in which the human emissions were sharply closed. This raised new scientific questions regarding changes in atmospheric heterogeneous reactions and oxidability under extreme emission control, quantitative meteorology–emission interactions, and so on. This also implied reconsiderations of policy for pollution controls and the necessity to cut off secondary production of particulate matters basing on sufficient scientific research (Le et al., 2020; Huang et al., 2020). Some studies estimated that thousands of deaths were prevented during the quarantine period because of the air pollution decrease (K. Chen et al., 2020). However, medical systems were still overstressed, and transportation to hospitals also decreased. Furthermore, the deaths related to air pollution were almost all due to respiratory diseases (Wang and Jin, 2001), and the corresponding medical resources were also further stressed by COVID-19. Therefore, the mortality impacted by the air pollution reduction during the COVID-19 outbreak should be comprehensively assessed in future work.
Monthly mean meteorological data are obtained from the ERA5 reanalysis data archive: https://cds.climate.copernicus.eu/cdsapp#!/search?type=dataset (ERA5, 2021). PM2.5 concentration data are acquired from the China National Environmental Monitoring Centre: https://quotsoft.net/air/ (CNEMC, 2021). The emissions data of 1985 can be downloaded from http://geoschemdata.computecanada.ca/ExtData/HEMCO/AnnualScalar/ (Annual Scalar, 2021), and those of 2010 can be obtained from MIX: http://geoschemdata.computecanada.ca/ExtData/HEMCO/MIX (MIX, 2021).
The supplement related to this article is available online at: https://doi.org/10.5194/acp-21-1581-2021-supplement.
HW and ZY designed and performed research. YZ simulated the PM2.5 by the GEOS-Chem model, and YL did the statistical analysis. ZY prepared the manuscript with contributions from all co-authors.
The authors declare that they have no conflict of interest.
The National Natural Science Foundation of China (42088101, 91744311 and 41991283) and the special project “The impacts of meteorology on large-scale spread of influenza virus” from CIC-FEMD supported this research.
This research has been supported by the National Natural Science Foundation of China (grant nos. 42088101, 91744311 and 41991283).
This paper was edited by Jianping Huang and reviewed by two anonymous referees.
Annual Scalar: Emission scalar for 1985, available at: http://geoschemdata.computecanada.ca/ExtData/HEMCO/AnnualScalar, last access: 2 February 2021.
Bey, I., Jacob, D. J., Yantosca, R. M., Logan, J. A., Field, B. D., Fiore, A. M., Li, Q. B., Liu, H. G. Y., Mickley, L. J., and Schultz, M. G.: Global modeling of tropospheric chemistry with assimilated meteorology: Model description and evaluation, J. Geophys. Res.-Atmos., 106, 23073–23095, https://doi.org/10.1029/2001jd000807, 2001.
Cai, S., Wang, Y., Zhao, B., Wang S., Chang, X., and Hao, J.: The impact of the “Air Pollution Prevention and Control Action Plan” on PM2.5 concentrations in Jing-Jin-Ji region during 2012–2020, Sci. Total Environ., 580, 197–209, 2017.
Cao, W., Fang, Z., Hou, G., Han, M., Xu, X., and Dong, J.: The psychological impact of the COVID-19 epidemic on college students in China, Psychiat. Res., 287, 112934, https://doi.org/10.1016/j.psychres.2020.112934, 2020.
Chen, K., Wang, M., Huang, C., Patrick, L., and Paul, T.: Air Pollution Reduction and Mortality Benefit during the COVID-19 Outbreak in China, Lancet Planet. Health, 4, E210–E212, https://doi.org/10.1016/S2542-5196(20)30107-8, 2020.
Chen, S., Yang, J., Yang W., Wang, C., and Till, B.: COVID-19 control in China during mass population movements at New Year, Lancet, 395, 764–766, 2020.
Cleaner air for China, Nat. Geosci., 12, 497–497, https://doi.org/10.1038/s41561-019-0406-7, 2019.
CNEMC (China National Environmental Monitoring Centre): PM2.5 monitoring network, available at: https://quotsoft.net/air/, last access: 2 February 2021.
Dang, R. and Liao, H.: Severe winter haze days in the Beijing–Tianjin–Hebei region from 1985 to 2017 and the roles of anthropogenic emissions and meteorology, Atmos. Chem. Phys., 19, 10801–10816, https://doi.org/10.5194/acp-19-10801-2019, 2019.
Ding, Y. and Liu, Y.: Analysis of long-term variations of fog and haze in China in recent 50 years and their relations with atmospheric humidity, Sci. China Ser. D., 57, 36–46, 2014.
ERA5: Meteorological data, available at: https://cds.climate.copernicus.eu/cdsapp#!/search?type=dataset, last access: 2 February 2021.
Evans, M. J. and Jacob, D. J.: Impact of new laboratory studies of N2O5 hydrolysis on global model budgets of tropospheric nitrogen oxides, ozone, and OH, Geophys. Res. Lett., 32, L09813, https://doi.org/10.1029/2005gl022469, 2005.
Fountoukis, C. and Nenes, A.: ISORROPIA II: a computationally efficient thermodynamic equilibrium model for K+-Ca2+-Mg2+-NH-Na+-SO-NO-Cl−-H2O aerosols, Atmos. Chem. Phys., 7, 4639–4659, https://doi.org/10.5194/acp-7-4639-2007, 2007.
Gelaro, R., McCarty, W., Suarez, M. J., Todling, R., Molod, A., Takacs,L., Randles, C. A., Darmenov,A., Bosilovich, M. G., Reichle, R., Wargan, K., Coy, L., Cullather, R., Draper, C., Akella, S., Buchard, V., Conaty, A., da Silva, A. M., Gu, W., Kim, G. K., Koster, R., Lucchesi, R., Merkova, D., Nielsen, J. E., Partyka, G., Pawson, S., Putman, W., Rienecker, M., Schubert, S. D., Sienkiewicz, M., and Zhao, B.: The Modern-Era Retrospective Analysis for Research and Applications, Version 2 (MERRA2), J. Climate, 30, 5419–5454, https://doi.org/10.1175/jcli-d-16-0758.1, 2017.
Geng, G., Xiao, Q., Zheng, Y., Tong, D., Zhang, Y., Zhang, X., Zhang, Q., He, H., and Liu, Y.: Impact of China's Air Pollution Prevention and Control Action Plan on PM2.5 chemical composition over eastern China, Sci. China Ser. D., 62, 1872–1884, https://doi.org/10.1007/s11430-018-9353-x, 2020.
Huang, X., Ding, A., Gao, J., Zheng, B., Zhou, D., Qi, X., Tang, R., Ren, C., Nie, W., Chi, X., Wang, J., Xu, Z., Chen, L., Li, Y., Che, F., Pang, N., Wang, H., Tong, D., Qin, W., Cheng, W., Liu, W., Fu, Q., Chai, F., Davis, S., Zhang, Q., and He, K.: Enhanced secondary pollution offset reduction of primary emissions during COVID-19 lockdown in China, Natl. Sci. Rev., 137, https://doi.org/10.31223/OSF.IO/HVUZY, 2020.
Jacob, D. J.: Heterogeneous chemistry and tropospheric ozone, Atmos. Environ., 34, 2131–2159, https://doi.org/10.1016/s1352-2310(99)00462-8, 2000.
Kalnay, E., Kanamitsu, M., Kistler, R., Collins, W., Deaven, D., Gandin, L., Iredell, M., Saha, S., White, G., Woollen, J., Zhu, Y., Leetmaa, A., Reynolds, R., Chelliah, M., Ebisuzaki, W., Higgins, W., Janowiak, J., Mo, K. C., Ropelewski, C., Wang, J., Jenne, R., and Joseph, D.: The NCEP/NCAR 40-year reanalysis project, B. Am. Meteorol. Soc., 77, 437–471, https://doi.org/10.1175/1520-0477(1996)077<0437:TNYRP>2.0.CO;2, 1996.
Kodros, J. K. and Pierce, J. R.: Important global and regional differences in cloud-albedo aerosol indirect effect estimates between simulations with and without prognostic aerosol microphysics, J. Geophys. Res., 122, 4003–4018, https://doi.org/10.1002/2016JD025886, 2017.
Le, T., Wang, Y., Liu, L., Yang, J., Yung, Y. L., Li, G., and John, H.: Unexpected air pollution with marked emission reductions during the covid-19 outbreak in China, Science, 369, eabb7431, https://doi.org/10.1126/science.abb7431, 2020.
Li, M., Zhang, Q., Kurokawa, J.-I., Woo, J.-H., He, K., Lu, Z., Ohara, T., Song, Y., Streets, D. G., Carmichael, G. R., Cheng, Y., Hong, C., Huo, H., Jiang, X., Kang, S., Liu, F., Su, H., and Zheng, B.: MIX: a mosaic Asian anthropogenic emission inventory under the international collaboration framework of the MICS-Asia and HTAP, Atmos. Chem. Phys., 17, 935–963, https://doi.org/10.5194/acp-17-935-2017, 2017.
Lian, X., Huang, J., Huang, R., Liu, C., and Zhang, T.: Impact of city lockdown on the air quality of COVID-19-hit of Wuhan city, Sci. Total Environ., 742, 140556, https://doi.org/10.1016/j.scitotenv.2020.140556, 2020.
Luo, Z.: The impact of new outbreak on economy, capital market and national governance and its response, Finance Economy, 2020, 8–15, 2020.
Ministry of Ecology and Environment: http://www.mee.gov.cn/xxgk2018/xxgk/xxgk05/201903/t20190306_694550.html (last access: 2 February 2021), 2019.
MIX: Emissions for 2010, available at: http://geoschemdata.computecanada.ca/ExtData/HEMCO/MIX, last access: 2 February 2021.
Niu, F., Li, Z., Li, C., Lee, K., and Wang, M: Increase of wintertime fog in China: Potential impacts of weakening of the Eastern Asian monsoon circulation and increasing aerosol loading, J. Geophys. Res., 115, D00K20, https://doi.org/10.1029/2009JD013484, 2010.
Park, R., Jacob, D., Field, B., Yantosca, R., and Chin, M.: Natural and transboundary pollution influences on sulfate-nitrate-ammonium aerosols in the United States: Implications for policy, J. Geophys. Res.-Atmos., 109, D15204, https://doi.org/10.1029/2003JD004473, 2004.
Shi, X. and Brasseur, G.: The Response in Air Quality to the Reduction of Chinese Economic Activities during the COVID Outbreak, Geophys. Res. Lett., 47, e2020GL088070, https://doi.org/10.1029/2020GL088070, 2020.
Shi, Y., Hu, F., Lü R., and He, Y.: Characteristics of urban boundary layer in heavy haze process based on beijing 325m tower data, Atmos. Ocean. Sci. Lett., 12, 41–49, 2019.
Song, L., Wang, L., Chen, W., and Zhang, Y.: Intraseasonal Variation of the Strength of the East Asian Trough and Its Climatic Impacts in Boreal Winter, J. Climate, 29, 2557–2577, https://doi.org/10.1175/JCLI-D-14-00834.1, 2016.
Sun, Y., Lei, L., Zhou, W., Chen, C., and Worsnop, D. R.: A chemical cocktail during the COVID-19 outbreak in Beijing, China: Insights from six-year aerosol particle composition measurements during the Chinese New Year holiday, Sci. Total Environ., 742, 140739, https://doi.org/10.1016/j.scitotenv.2020.140739, 2020.
Thornton, J. A., Jaegle, L., and McNeill, V. F.: Assessing known pathways for HO2 loss in aqueous atmospheric aerosols: Regional and global impacts on tropospheric oxidants, J. Geophys. Res.-Atmos., 113, D05303, https://doi.org/10.1029/2007jd009236, 2008.
Tian, H., Liu, Y., Li, Y., Wu, C., Chen, B., Kraemer, M., Li, B., Cai, J., Xu, B., Yang, Q., Wang, B., Yang, P., Cui, Y., Song, Y., Zheng, P., Wang, Q., Bjornstad, O., Yang, R., Grenfell, B., Pybus, O., Dye, C.: An investigation of transmission control measures during the first 50 days of the COVID-19 epidemic in China, Science, 368, 638–642, https://doi.org/10.1126/science.abb6105, 2020.
Wang, H. and Jin, Y.: The Study on Air Pollution Effects on the Mechanism of Respiratory System, Sci. Travel Med., 007, 29–33, 2001.
Wang, P., Chen, K., Zhu, S., Wang, P., and Zhang, H.: Severe air pollution events not avoided by reduced anthropogenic activities during COVID-19 outbreak, Resour. Conserv. Recy., 158, 104814, https://doi.org/10.1016/j.resconrec.2020.104814, 2020.
Wang, Y., Li, W., Gao, W., Liu, Z., Tian, S., Shen, R., Ji, D., Wang, S., Wang, L., Tang, G., Tao, S., Cheng, M., Wang, G., Gong, Z., Hao, J., and Zhang, Y.: Trends in particulate matter and its chemical compositions in China from 2013–2017, Sci. China Ser. D., 62, 1857–1871, 2019.
Xia, J. and Feng, X.: Impacts of COVID-19 epidemic on tourism industry and related countermeasures, Chinese Business and Market, 34, 3–10, 2020.
Xiao, D., Li, Y., Fan, S., Zhang, R., Sun, J., and Wang, Y.: Plausible influence of Atlantic Ocean SST anomalies on winter haze in China, Theor. Appl. Climatol., 122, 249–257, 2015.
Yang, Y., Liao, H., and Lou, S.: Increase in winter haze over eastern China in recent decades: Roles of variations in meteorological parameters and anthropogenic emissions, J. Geophys. Res.-Atmos., 121, 13050–13065, https://doi.org/10.1002/2016jd025136, 2016.
Yin, Z. and Wang, H.: The relationship between the subtropical Western Pacific SST and haze over North-Central North China Plain, Int. J. Climatol., 36, 3479–3491, 2016.
Yin, Z. and Wang, H.: Role of atmospheric circulations in haze pollution in December 2016, Atmos. Chem. Phys., 17, 11673–11681, https://doi.org/10.5194/acp-17-11673-2017, 2017.
Yin, Z. and Zhang, Y.: Climate anomalies contributed to the rebound of PM2.5 in winter 2018 under intensified regional air pollution preventions, Sci. Total Environ., 726, 138514, https://doi.org/10.1016/j.scitotenv.2020.138514, 2020.
Yin, Z., Wang, H., and Guo, W.: Climatic change features of fog and haze in winter over North China and Huang-Huai Area, Sci. China Ser. D., 58, 1370–1376, 2015.
Yu, F. and Luo, G.: Simulation of particle size distribution with a global aerosol model: contribution of nucleation to aerosol and CCN number concentrations, Atmos. Chem. Phys., 9, 7691–7710, https://doi.org/10.5194/acp-9-7691-2009, 2009.
Zhang, X., Xu, X., Ding, Y., Liu, Y., Zhang, H., Wang, Y., and Zhong, J.: The impact of meteorological changes from 2013 to 2017 on PM2.5 mass reduction in key regions in China, Sci. China Ser. D., 62, 1885–1902, https://doi.org/10.1007/s11430-019-9343-3, 2020.
Zhou, W., Gao, M., He, Y., Wang, Q., Xie, C., Xu, W., Zhao, J., Du, W., Qiu, Y., Lei, L., Fu, P., Wang, Z., Worsnop, D., Zhang, Q., and Sun, Y.: Response of aerosol chemistry to clean air action in Beijing, China: Insights from two-year ACSM measurements and model simulations, Environ. Pollut., 255, 113345, https://doi.org/10.1016/j.envpol.2019.113345, 2019.
Zou, Y., Wang, Y., Zhang, Y., and Koo, J.: Arctic sea ice, Eurasia snow, and extreme winter haze in China, Sci. Adv., 3, e1602751, https://doi.org/10.1126/sciadv.1602751, 2017.