the Creative Commons Attribution 4.0 License.
the Creative Commons Attribution 4.0 License.
 | 18 Oct 2021
Direct estimates of biomass burning NOx emissions and lifetimes using daily observations from TROPOMI
Qindan Zhu
Biomass burning emits an estimated 25 % of global annual nitrogen oxides (NOx), an important constituent that participates in the oxidative chemistry of the atmosphere. Estimates of NOx emission factors, representing the amount of NOx per mass burned, are primarily based on field or laboratory case studies, but the sporadic and transient nature of wildfires makes it challenging to verify whether these case studies represent the behavior of the global fires that occur on earth. Satellite remote sensing provides a unique view of the earth, allowing for the study of emissions and downwind evolution of NOx from a large number of fires. We describe direct estimates of NOx emissions and lifetimes for fires using an exponentially modified Gaussian analysis of daily TROPOspheric Monitoring Instrument (TROPOMI) retrievals of NO2 tropospheric columns. We update the a priori profile of NO2 with a fine-resolution (0.25∘) global model simulation from NASA's GEOS Composition Forecasting System (GEOS-CF), which largely enhances NO2 columns over fire plumes. We derive representative NOx emission factors for six fuel types globally by linking TROPOMI-derived NOx emissions with observations of fire radiative power from Moderate Resolution Imaging Spectroradiometer (MODIS). Satellite-derived NOx emission factors are largely consistent with those derived from in situ measurements. We observe decreasing NOx lifetime with fire emissions, which we infer is due to the increase in both NOx abundance and hydroxyl radical production. Our findings suggest promise for applying space-based observations to track the emissions and chemical evolution of reactive nitrogen from wildfires.
- Article
(3983 KB) - Full-text XML
-
Supplement
(8742 KB) - BibTeX
- EndNote


Biomass burning emissions affect global radiative forcing, the hydrological cycle, the ecosystem, and air quality (e.g., Crutzen and Andreae, 1990; Penner et al., 1992; Johnston et al., 2012; Liu et al., 2014). Biomass burning emits an estimated 25 % of global annual nitrogen oxides (), an important constituent that participates in the oxidative chemistry of the atmosphere, leading to the formation of tropospheric ozone (O3) and secondary aerosols that affect air quality, ecosystem, health and climate. Unlike other NOx sources such as power plants that are persistent and relatively static, the sporadic and transient nature of wildfires makes it challenging to estimate emissions experimentally over wide spatial and temporal scales (Ichoku and Ellison, 2014). Biomass burning emissions inventories used in models are subject to uncertainties in estimates or measurements of the burned area, fuel loadings, combustion efficiency and also the compound-specific emission factors that relate the mass of a chemical species emitted to fuel consumption (e.g., Petrenko et al., 2012; Liu et al., 2020; Carter et al., 2020). Current estimates of NOx emission factors are primarily based on field measurements that sample a few fires over a small region (Yokelson et al., 2007; Alvarado et al., 2010; Lindaas et al., 2021) or laboratory studies that measure fire emissions under controlled conditions (McMeeking et al., 2009; Roberts et al., 2020). These previous studies report large variations of NOx emission factors, even in a similar ecosystem, which could be due to variation in individual fire conditions, nitrogen content of the fuel burned, or differences in sampling techniques and analysis methods (Andreae, 2019). The NOx emission factors used in global biomass burning emission inventories also vary (Wiedinmyer et al., 2011; Kaiser et al., 2012; Darmenov and Silva, 2015; van der Werf et al., 2017). These varying perspectives raise the question of how well we understand how to extrapolate the emission factors derived from individual fires to the large number of fires that occur annually on the globe, each with distinct fire conditions, intensity, and fuel type.
Satellite remote sensing provides a unique view of the earth, which offers the opportunity to study a large number of fires globally. Satellite-based products such as fire radiative power (FRP) and burned area have been widely used in the fire detection (Wiedinmyer et al., 2011; van der Werf et al., 2017). The launch of GOME-1 in 1995 set the milestone for monitoring NOx from space (Richter et al., 2005). The Ozone Monitoring Instrument (OMI) aboard the Aura satellite has a finer spatial resolution with 13× 24 km2 at nadir, which is widely used to detect NOx emissions from anthropogenic sources (Beirle et al., 2011; Lu et al., 2015; Duncan et al., 2016; Liu et al., 2016). These studies typically rely on aggregation of multiple observations to reduce the noise of satellite retrievals or improve spatial resolutions via oversampling, tools which cannot be used to study the rapidly varying NOx from fires. In October 2017, the TROPOspheric Monitoring Instrument (TROPOMI) launched to space (Veefkind et al., 2012). The finer spatial resolution ( km2) and the improved signal-to-noise ratio of TROPOMI compared to OMI offer new opportunities to more reliably interpret observations of individual plumes (Veefkind et al., 2012; Judd et al., 2019; van Geffen et al., 2020).
The accuracy of satellite retrieval of NO2 columns largely depends on the a priori knowledge of NO2 vertical profile shape needed for calculating air mass factor (AMF) (e.g., Boersma et al., 2018; Verhoelst et al., 2021). The impacts of the a priori profile are especially evident for fire plumes with intense emissions and varying plume dynamics (Bousserez, 2014). Previous studies that use satellite observations to derive NOx emission factors (EFs) from fires all show lower EFs than in situ measurements, which could be due to inaccurate a priori profiles (Mebust et al., 2011; Mebust and Cohen, 2014; Schreier et al., 2015). Replacing the a priori vertical profile from a fine-resolution regional model can enhance the spatial gradient and correct the low bias of satellite-retrieved NO2 over polluted regions (e.g., Russell et al., 2011; Valin et al., 2011; Goldberg et al., 2017; Ialongo et al., 2020; Judd et al., 2020; Tack et al., 2021). However, conducting fine-resolution simulations for fires distributed globally is currently too computationally expensive for routine analysis. The GEOS Composition Forecasting System (GEOS-CF) produced by NASA Global Modeling and Assimilation Office (GMAO) provides real-time global simulations of atmospheric composition at a fine resolution of 0.25∘ (Keller et al., 2021). The GEOS-CF has provided an opportunity for capturing fine-scale features relevant to biomass burning plumes. Here we apply GEOS-CF NO2 as the a priori profile to recalculate AMFs for TROPOMI NO2 columns near fires, and we show that updating the a priori profile could resolve the underestimate of satellite-based NOx emission factors suggested in previous studies (Mebust et al., 2011; Mebust and Cohen, 2014; Schreier et al., 2015).
Satellite instruments observe fire NOx plumes as a mixture of fresh and aged smoke. NOx is a short-lived species, and its concentration will decay in the plume due to the formation of nitric acid (HNO3), peroxyacetyl nitrate (PAN), and organic nitrates (RONO2). The relationship between satellite-observed NOx concentration and emissions depends on the loss rate of NOx. The chemical processes governing the lifetime of NOx in the fire plumes are poorly understood (Alvarado et al., 2010). Previous studies assume a constant chemical NOx lifetime of 2 h (Mebust et al., 2011; Mebust and Cohen, 2014). Laughner and Cohen (2019) provide space-based evidence of changing NOx lifetimes over US cities as NOx emissions decline. As fire intensity varies by several orders of magnitude, assuming constant NOx lifetime for all fires will likely introduce errors in the derived NOx emissions (De Foy et al., 2014). The improved spatial resolution of TROPOMI allows for direct measurements of the length scale of NO2 decay. By analyzing the plume evolution downwind, we derive an effective NOx lifetime. Beirle et al. (2011) first proposed an exponentially modified Gaussian (EMG) approach to directly estimate NOx emissions and lifetimes from satellite observations, which has been widely used to derive NOx emissions from anthropogenic sources (Beirle et al., 2011; Lu et al., 2015; Goldberg et al., 2019; Laughner and Cohen, 2019). Our study is the first to apply the EMG approach to simultaneously estimate NOx emissions and lifetimes from biomass burning plumes. The resulting emission estimates provide a large ensemble with which to evaluate current emission models and also provide detailed constraints on the chemical evolution of NOx. The resulting lifetimes provide insights into hydroxyl radical abundances in the plume and thus constraints on the lifetime of other chemicals emitted from fires.
TROPOMI is a nadir-viewing hyperspectral spectrometer launched on 13 October 2017 by the European Space Agency (ESA) for the European Union's Copernicus Sentinel-5 Precursor (S5P) satellite mission. TROPOMI provides afternoon (∼ 13:30 LT, local time) global observations in UV–visible–near-infrared spectra with a fine spatial resolution of 7×3.5 km2 at nadir (increased to 5.5×3.5 km2 since August 2019). We obtain the daily level-2 TROPOMI retrievals of NO2 tropospheric column density data from April 2018 to June 2020 from NASA Goddard Earth Sciences (GES) Data and Information Services Center (DISC) (Copernicus Sentinel-5P, 2018a). The retrieval of the NO2 tropospheric vertical column includes three steps (van Geffen et al., 2019): (1) retrieval of the total slant column density along the optical path using differential optical absorption spectroscopy (Boersma et al., 2011); (2) subtraction of the total slant column density from stratospheric NO2 slant column based on information from a data assimilation system (Boersma et al., 2018); and (3) conversion of the tropospheric slant column density to vertical column density using AMFs, which are obtained from radiative transfer calculations that account for the viewing geometry, cloud fraction, surface properties, and the a priori vertical profile of NO2 (Boersma et al., 2018). We include TROPOMI observations with the quality assurance value higher than 0.5, which filters out problematic retrievals but still keeps good quality retrievals over cloud (or aerosols). In addition to NO2, we obtain TROPOMI aerosol layer height (ALH) or aerosol layer pressure (ALP) data, which provide height information of aerosol layer in the troposphere (Copernicus Sentinel-5P, 2018b). Retrieval of ALH or ALP is based on the O2 absorption band at near-infrared wavelengths between 759 and 770 nm (Graaf et al., 2019). Details of the aerosol layer retrieval algorithms can be found in Graaf et al. (2019) and Nanda et al. (2019).
We use the Moderate Resolution Imaging Spectroradiometer (MODIS) Active Fire products (collection 6) to provide information on the intensity and location of fires (Giglio et al., 2016), which are available from NASA's Fire Information for Resource Management System (NASA FIRMS, 2018a). We include daytime MODIS measurements from the Aqua satellite to match with the overpass of TROPOMI. Fire detection from MODIS is performed using a contextual algorithm that measures the infrared radiation from fires (Giglio et al., 2016). Each hotspot is recorded as the center of an km2 pixel that contains one or more fires, and the FRP is estimated via an empirical relationship using the 4 µm band brightness temperatures (Kaufman et al., 1998). We group fire pixels whose distances are within 20 km as a single fire event, and the center of the fire is calculated as the mean of fire pixel locations weighted by pixel FRP. To assess the sensitivity to the choice of FRP product, we also process the daytime Suomi NPP Visible Infrared Imaging Radiometer Suite (VIIRS) observations of active fire data (NASA FIRMS, 2018b). The VIIRS fire product uses a similar algorithm as MODIS for fire detection (Schroeder et al., 2014). To assess potential effects of aerosol from plumes on satellite retrieval of NO2, we acquire the Multi-Angle Implementation of Atmospheric Correction (MAIAC) aerosol optical depth (AOD) level-2 1 km daily gridded product (MCD19A2) from NASA's Earth Observing System Data and Information System (EOSDIS). Details of the retrieval of AOD can be found in Lyapustin et al. (2012, 2018a, b).
The fire episodes are classified based on MODIS-detected fire location following the fuel classification in the Global Fire Emission Database (GFED), which is estimated using the MODIS land cover type product and University of Maryland classification scheme (Friedl et al., 2010; van der Werf et al., 2017). We assign the fuel type to grid cells with mixed fuel types based on the dominant fuel type. We follow the definition of GFED, grouping savanna, grassland, and shrubland fires as a single herbaceous fuel type. To assess if the NOx EF varies among these three herbaceous types, we use the 500 m yearly MODIS land cover product (v5) to classify the herbaceous fires based on the dominant land cover type (Friedl et al., 2010). We use wind fields from the hourly ERA-5 reanalysis data developed by the European Centre for Medium-Range Weather Forecasts (ECMWF), which provides meteorological variables at resolution with 37 pressure levels from 1000 to 1 hPa from 1979 to present (Hersbach et al., 2018, 2020). We sample ERA-5 wind data closest to the center of each fire episode at the TROPOMI overpass time (∼ 13:00 LT).
3.1 An improved fire a priori profile for TROPOMI NO2
The a priori vertical profiles of NO2 used in the standard TROPOMI products are obtained from global daily model simulations (TM5) with coarse resolution (1∘) and monthly average biomass burning emissions (Williams et al., 2017). Fires are intrinsically episodic and occur over land areas that are often as small as a few kilometers. Here we recompute the tropospheric AMFs using the vertical NO2 profiles provided by the NASA GEOS-CF simulations with 0.25∘ resolution. The GEOS-CF system combines the GEOS weather analysis and forecasting system with GEOS-Chem chemistry scheme version 12.0.1 (Bey et al., 2001; Keller et al., 2014, 2021; Long et al., 2015). GEOS-CF includes detailed gas-phase and aerosol chemistry (Knowland et al., 2020; NASA GMAO, 2020; Keller et al., 2021). The near-real-time satellite-based Quick Fire Emission Database (QFED v2.5) is used to provide daily biomass burning emissions (Darmenov and Silva, 2015). In the GEOS-CF system, 65 % of biomass burning emissions are distributed within the boundary layer, and the other 35 % are distributed evenly between 3.5 and 5.5 km (Fischer et al., 2014). GEOS-CF provides hourly global vertical profiles of NO2 at 23 pressure levels from 1000 to 10 hPa since 2018.
We sample GEOS-CF products at the time and location of all fire episodes identified. For each episode, we spatially interpolate the NO2 profiles simulated by GEOS-CF to match the resolution of TROPOMI products. The AMF (AMFGC,clear) for clear sky conditions can be calculated following Eq. (1):
where ml is scattering weight, which is a function of satellite-viewing geometry, surface pressure, reflectivity, etc.; xGC,l is the GEOS-CF subcolumn for layer l. We acquire averaging kernels (AKs) from TROPOMI level-2 products, and we interpolate GEOS-CF vertical profiles to the 34 vertical layers that provide information on AKs. AK is equal to the ratio of the scattering weight to the tropospheric AMFs computed from the a priori profile (AMFa) (Eskes and Boersma, 2003):
Combining Eq. (1) and Eq. (2) gives Eq. (3):
Given that AMFa is the ratio of slant columns to vertical columns, we can relate the vertical columns with GEOS-CF-simulated profile (ΩGC,clear) to the originally retrieved vertical columns (Ωa) as Eq. (4):
For partly cloudy scenes, the air mass factor can be written as a linear combination of a clear and cloudy AMF as in Eq. (5) (Boersma et al., 2004):
where fcloud is radiance-weighed cloud fraction, and AMFGC,cloud is essentially the above-cloud component of Eq. (3) (Laughner et al., 2018). Therefore, we revise Eq. (4) for the partly cloudy scene as Eq. (6):
3.2 Estimation of emissions and lifetimes of wildfires
We apply an EMG approach to estimate NOx emissions and lifetime from each fire episode. For each fire episode, we first rotate TROPOMI NO2 swath data along the wind direction in the range of 200 km around the fire center, and we map the rotated TROPOMI NO2 column to a regular grid with 0.05∘ resolution by calculating area-weighted average as described in Jin et al. (2020). Next, we integrate the TROPOMI NO2 columns in the across-wind direction within ±100 km, which gives reduced one-dimensional line densities. The NO2 line densities (L) are then fitted with an EMG model, which is a convolution of a Gaussian-shaped emission and an exponential decay function (Beirle et al., 2011; Lu et al., 2015; Laughner and Cohen, 2019) following Eq. (7):
where x0 is the e-folding distance that represents the length scale of the NO2 decay, μx is the location of the apparent source relative to the fire center, σx represents the Gaussian smoothing length scale, ϕ is a cumulative distribution function, a is a scale factor that represents the observed total number of NO2 molecules in the fire plumes, and B represents the background NO2. We use the best guesses for initial values following Laughner and Cohen (2019). The effective NO2 lifetime (τEMG) and the estimated NOx emissions (EEMG) can be calculated from the fitted x0 and a following Eqs. (8) and (9):
where w is the wind speed, and γ is the ratio of NOx to NO2. The effective lifetime should represent chemical lifetime of NOx if the transport speed is uniform, the direction is constant, and deposition is negligible (De Foy et al., 2014). Previous studies either use the averaged wind of the first several layers (Beirle et al., 2011; Lu et al., 2015) or choose a constant layer such as 900 hPa (Mebust et al., 2011), but injection height of wildfires varies significantly, especially for large fires which inject emissions into high altitudes (Val Martin et al., 2010). To account for varying injection height, we use TROPOMI ALH as an approximation of the fire injection height instead of assuming a constant layer. We vertically interpolate ERA-5 wind data to the pressure level of aerosol layer. For the fires without valid ALH (∼36 % of the selected fires), we use 900 hPa, as the ALP level for the majority of selected fires is near 900 hPa (see Sect. 4.1). γ is assumed to be 1.32, which is between the measured mean ratio of 1.50 reported in Akagi et al. (2012) and 1.24 in Juncosa Clahorrano et al. (2021). We assume a constant γ, because O3 and the photolysis rate of NO2 vary little in the plume, and the timescale for NO and NO2 to reach steady state is on the order of 100 s (Alvarado and Prinn, 2009). Juncosa Clahorrano et al. (2021) show the ranges from 1.15 to 1.50 near the fire center before 15:00 LT, but the median varies little from center to plume edge. Mebust et al. (2011) suggest the uncertainty of is ∼20 %.
3.3 Idealized plume model
To understand the factors that control the NOx lifetime, we employ a one-dimensional (1-D) multi-box plume model based on the Python Editable Chemical Atmospheric Numerical Solver (PECANS; Laughner 2019; Laughner and Cohen, 2019). PECANS is a flexible idealized atmospheric chemistry modeling framework that allows for one box to three-dimensional multi-box simulations of atmospheric chemistry with idealized transport. In this study, we set the model to be 1-D with 600 km domain size and 2.5 km resolution, which is analogous to the integrated 1-D NO2 line density along wind direction. The wind speed is fixed at 5 m s−1, and the diffusion coefficients are also fixed at 100 m2 s−1 following Laughner and Cohen (2019). We assume a simplified set of reactions to represent a chemical condition within the NOx plume including (1) the permanent removal of NOx through the formation of HNO3 and RONO2, (2) the temporary removal and releases of NOx by PAN, (3) the instantaneous steady-state relationship between NO and NOx, and (4) the transport of NOx along the wind direction. The modeled volatile organic compounds (VOCs) are lumped into two groups: the first group (hereafter RVOC) does not contribute PAN formation, and the second group is modeled as an immediate PAN precursor (hereafter OVOC), specifically acetaldehyde. We include a Gaussian-shaped NOx emission source (expressed in NO) at x=200 km with 6 km in half width. The concentrations for O3, hydroxyl radical production rate P(HOx), VOC reactivities, and alkyl nitrate branching ratio are given as model input. The O3 concentration is fixed at 65 ppbv, which is close to observed mean O3 concentration near fire plumes (Alvarado and Prinn, 2009; Alvarado et al., 2014). A fixed branching ratio of 0.05 to form RONO2 in the RO2+ NO reaction is used following Laughner and Cohen (2019). We run PECANS repeatedly with varying NOx emissions, P(HOx), RVOC, and OVOC. Each model run outputs the concentration of NOx and its major sinks along the wind direction, which are then used to calculate both EMG-fitted and chemical NOx lifetimes.
3.4 Selection of fires
Since not all fire plumes are detectable from space and the EMG approach works best for single sources with clear plume patterns, we apply the following four criteria to select candidate fires from fire plumes identified from MODIS FRP observations (see Fig. S1 in the Supplement for a flowchart of the selection procedure):
First, fires should be large enough so that an apparent enhancement of NO2 is observed from TROPOMI. Considering the detection limit of TROPOMI NO2 and the greater uncertainty of MODIS FRP for small fires (Kaufman et al., 1998), fire episodes with MODIS FRP higher than 200 MW are selected. We then select fires where TROPOMI NO2 tropospheric columns on the fire day are at least 1 standard deviation higher than the mean TROPOMI NO2 columns 30 d before and after the fire day (excluding the nearest 4 d as fires may last for several days, defined as ). We only include fires in which TROPOMI NO2 line densities peak near the fire center, meaning that fires with monotonically increasing or decreasing line densities within the region are excluded.
Second, nearby fire plumes should not contribute to the NO2 line density of the selected fires. A major challenge of applying the EMG approach is that it only applies to a single source, but isolated wildfires are rare in nature. To reduce the influence of nearby plumes, we develop an algorithm that automatically detects and filters out the surrounding plumes (Fig. S2). We first identify plume-affected grid cells defined as higher than background NO2 (, Fig. S2b). Next, pixels are grouped to separate plumes based on their connections with surrounding pixels, assuming that plume pixels belonging to the same fire event should be connected. We then exclude the plumes that do not belong to the center fire plumes (Fig. S2c). The filtered areas are filled with background (Fig. S2d). The ability of clustering depends on the choice of : high may truncate plumes as edges are counted as background, while low may lead to the background being counted as fire plumes, so nearby plumes are connected with center plumes. To optimize the performance, we repeat the clustering and filtering steps with different values, and we select the that maximizes the filtered size of nearby plumes while retains the center plume. This filtering algorithm, however, does not apply to the case where fire plumes are overlapped. Therefore, we further exclude the fire plumes where comparable or larger fires are detected (i.e., total FRP of the nearby plumes is greater than one-third of the selected fire) over the region after applying the filtering.
Third, the fire plumes should align with the wind direction. We define a rotation bias as the angle between the wind direction and the observed apparent plume direction. From previous step, we obtain an approximate region of fire plumes, whose coordinates in x and y directions can be fitted with a line using linear regression, where the slope of the line can be converted to degrees (Fig. S3). We only select fire episodes with rotation biases between −30 and 30∘.
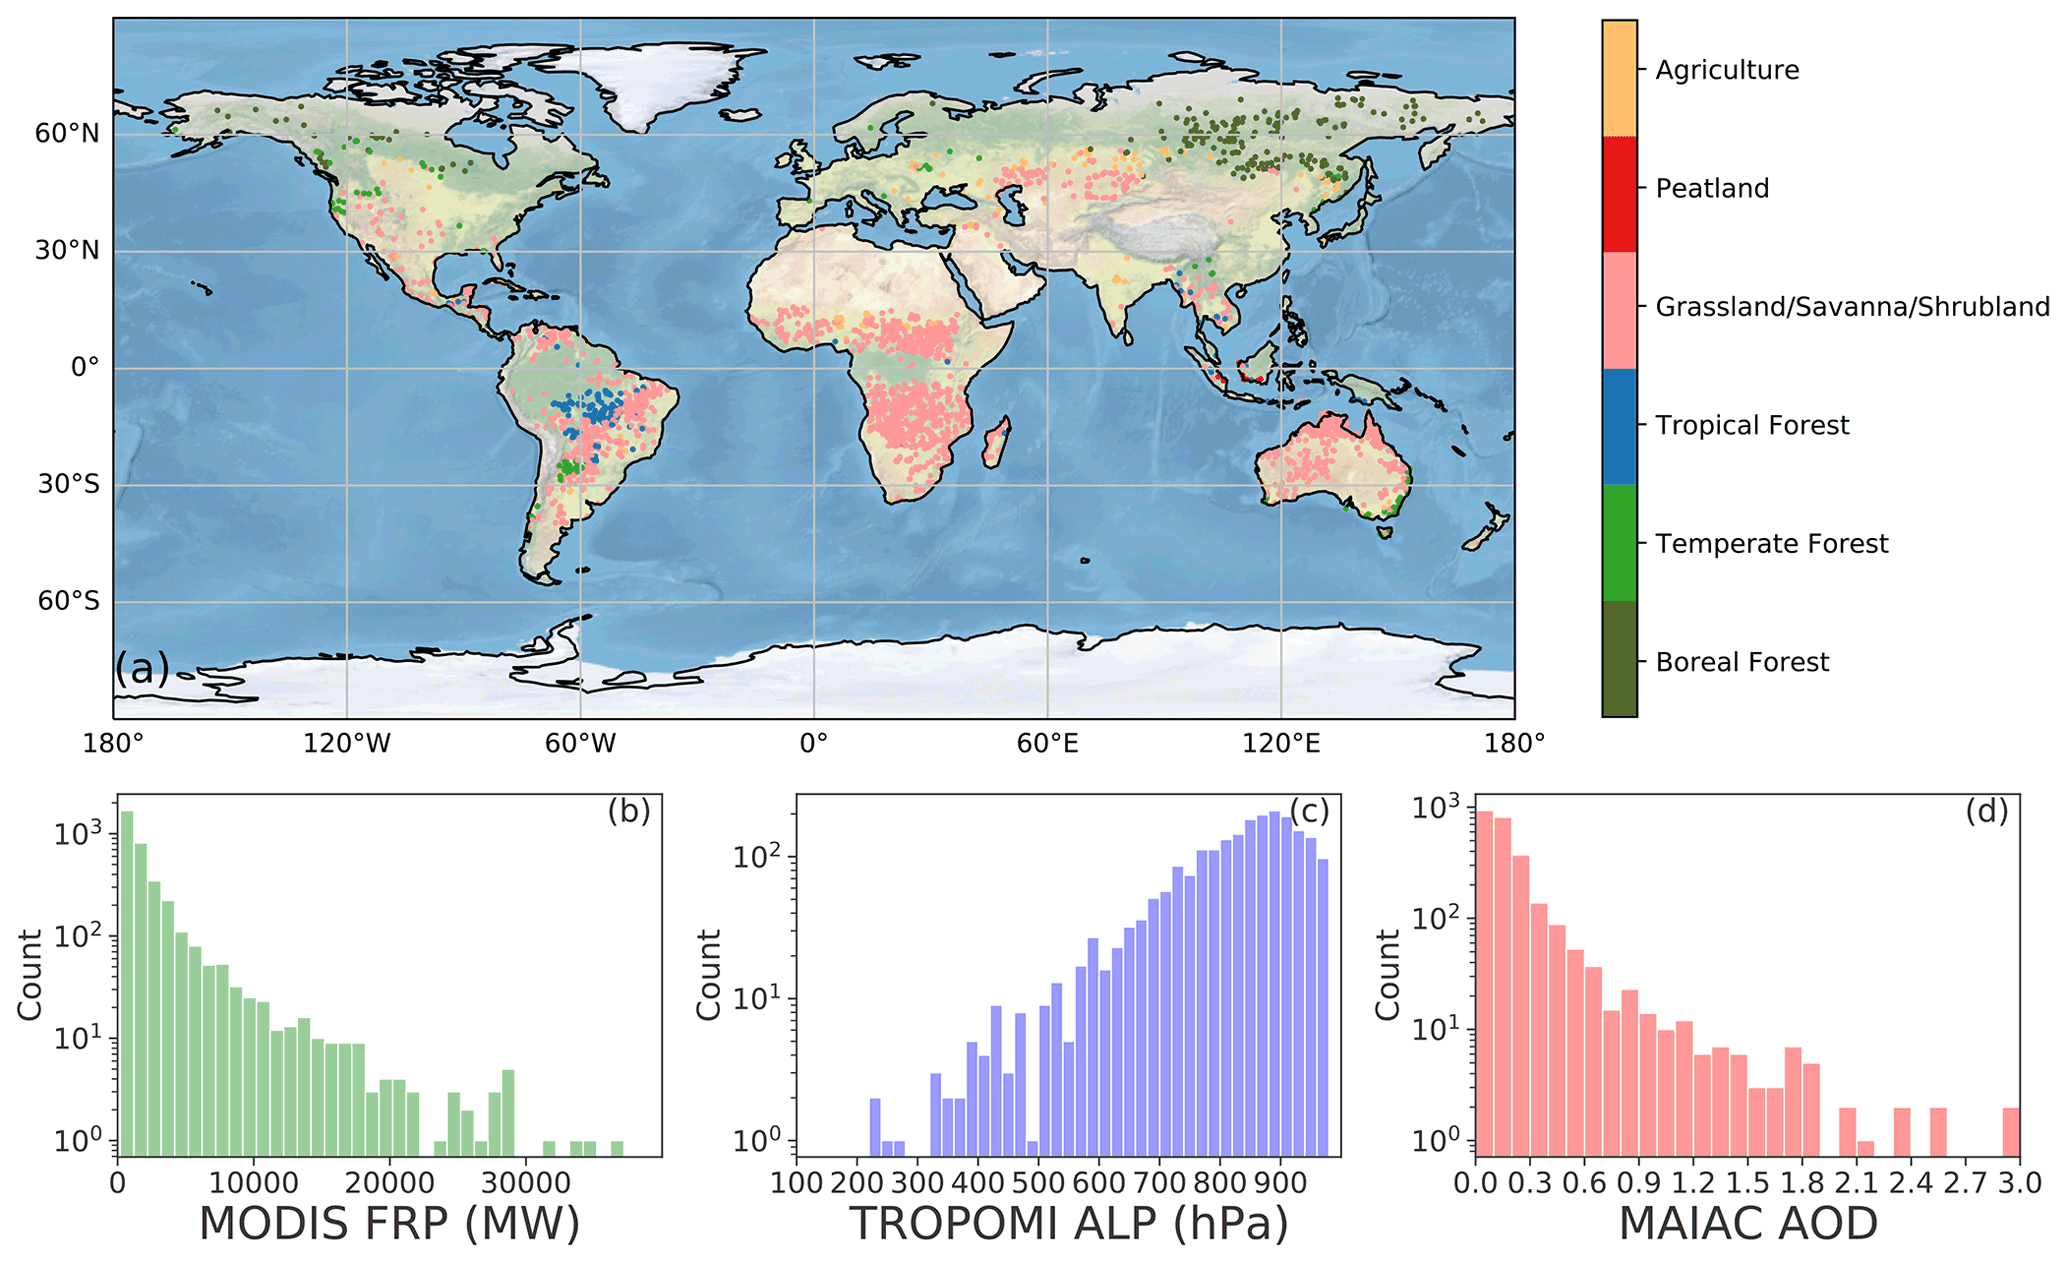
Figure 1(a) Map of the distribution of selected fire events and corresponding fuel type. Histograms of the distribution of (b) MODIS FRP, (c) TROPOMI ALP, (d) MAIAC AOD for the selected fire events. The number of fire events (y axis) is on a log scale.
Fourth, the fire plumes should give good fitting statistics that satisfy the following criteria: (1) R2 > 0.5; (2) σx < x0, meaning that emission width is smaller than the e-folding distance, which could prevent the case in which emission shape confounds with lifetime; and (3) < 50 km, meaning that the apparent source center is not too far from the fire center. Fires with more than 50 % missing TROPOMI NO2 values are excluded. The outcome of the EMG function is sensitive to the initial condition of each fitting parameter. To test the sensitivity of the fitting results to initial conditions, we repeat the fitting with varying initial values for each parameter 50 times, and we exclude fires where the standard deviation of resulting emissions is more than 50 % of the emissions. After excluding the fires sensitive to initial conditions, the uncertainty of the emission due to initial conditions is ∼5 %.
4.1 Characteristics of selected fires
Applying the above selection criteria, we identified 3248 fire episodes globally between April 2018 and June 2020 suitable for the EMG approach (Fig. 1a). The majority of the fires (77 %) occur in the savanna, grassland, and shrubland ecosystems. We identified 573 (18 %) forest fires, including 227 over the boreal forest, 153 over temperate forest, and 193 over the tropical forest fires. Twenty fire episodes are classified as peatland, which occurred in equatorial Asia. We also identified 158 fires (5 %) due to agriculture waste burning distributed across different regions. Figure 1b to d show the distributions of MODIS FRP, TROPOMI ALP, and MAIAC AOD of the selected fire episodes. The MODIS FRP is below 10 000 MW for 95 % of the selected fires, and 34 fires have FRP larger than 20 000 MW. The mean TROPOMI ALP is 828 hPa (or 1836 m for ALH), with 1σ standard deviation being 118 hPa (or 1751 m). Assuming TROPOMI ALH is indicative of fire injection height, more than 80 % of selected fires inject fire emissions to a pressure level between 700 and 950 hPa. About 83 % of the fire episodes show MAIAC AOD less than 0.3 near the fire center, and only 64 (3 %) fire episodes have AOD higher than 1.0. In summary, most of our selected fires can be characterized as median to large fires with relatively low injection height and small AOD.
4.2 Emission and lifetime estimates with an example fire
We estimate emissions and lifetime for each selected fire episode. As an example, Fig. 2 illustrates four major steps to estimate NOx emissions with a fire event occurred in western Australia (27.98∘ S, 125.90∘ E) on 21 October 2018. Several NO2 plumes are detected by TROPOMI on this day, which outperforms OMI observation on the same day which detects less smaller fires, shows less spatial gradients, and larger data gap (Fig. S4). For the fire event selected, we first rotate TROPOMI observations along wind direction (Fig. 2a). Second, we update the a priori profile of NO2 to improve the estimate of NO2 column (Sect. 3.1), which leads to an enhancement of NO2 gradient near the fire center (Fig. 2b). Third, we filter two nearby fire plumes, and the nearby plumes are filled with background NO2 (Fig. 2c). Fourth, we integrate across the wind direction to obtain a 1-D line density and fit with the EMG function (Fig. 2d and Eqs. 7 to 9). The EMG model captures the variation of the line density (R2= 0.98). The lifetime is estimated to be 1.6 h, and the total NOx emissions are estimated as 7870 g s−1.
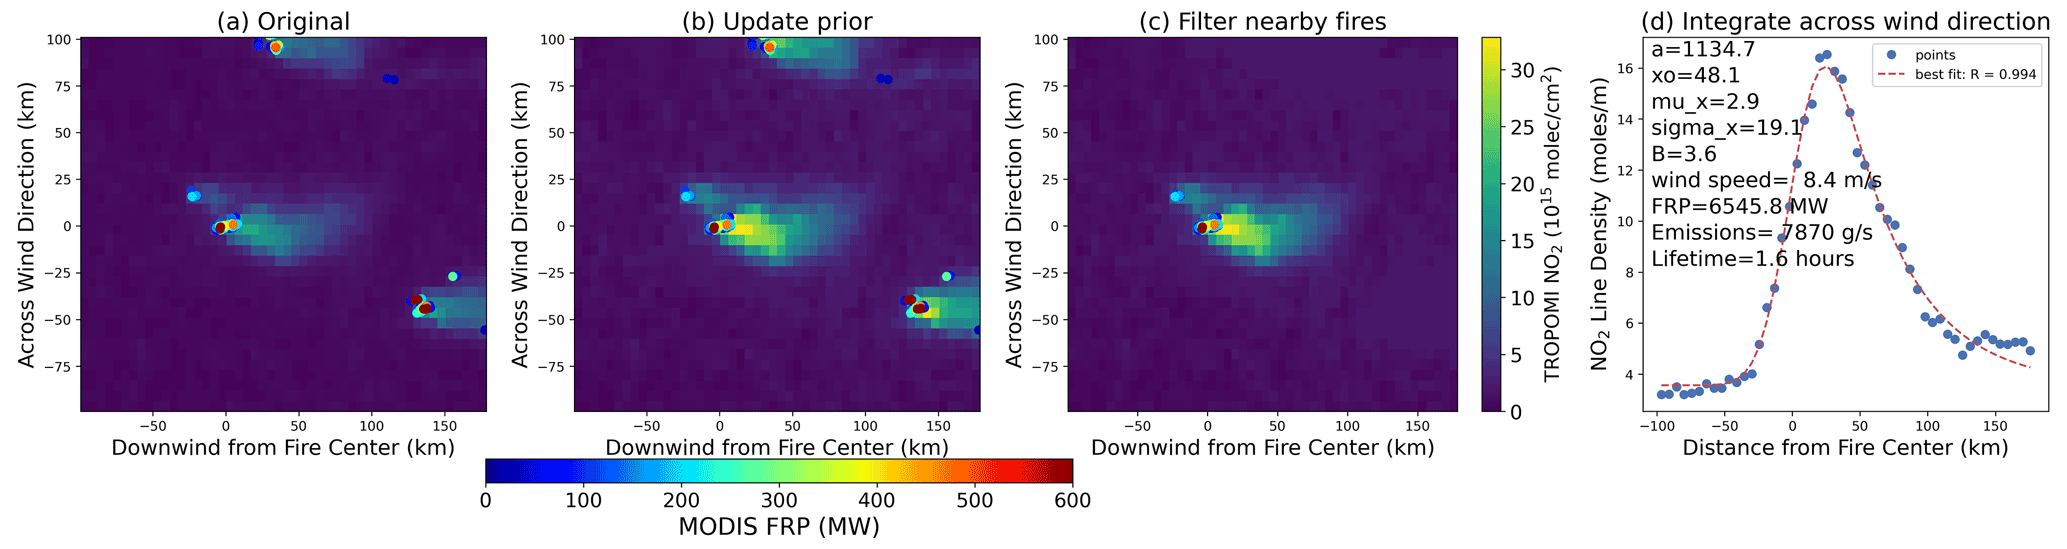
Figure 2An example fire event illustrating four steps to estimate NOx emissions and lifetime using the EMG approach: (a) original TROPOMI-retrieved NO2 tropospheric vertical column density rotated to align with the wind direction; (b) retrieved NO2 column density after replacing the a priori vertical profile of NO2 from NASA GEOS-CF simulation; (c) central fire plume after filtering the nearby fire plumes; and (d) NO2 line density calculated by integrating NO2 column density across the wind direction. The red line in panel (d) shows the fitted line density using the EMG function (Eq. 7). The lifetime is estimated from Eq. (8), and the total NOx emissions are estimated using Eq. (9). FRP is calculated as the sum of the FRP of all fire pixels detected by MODIS shown in panel (c).
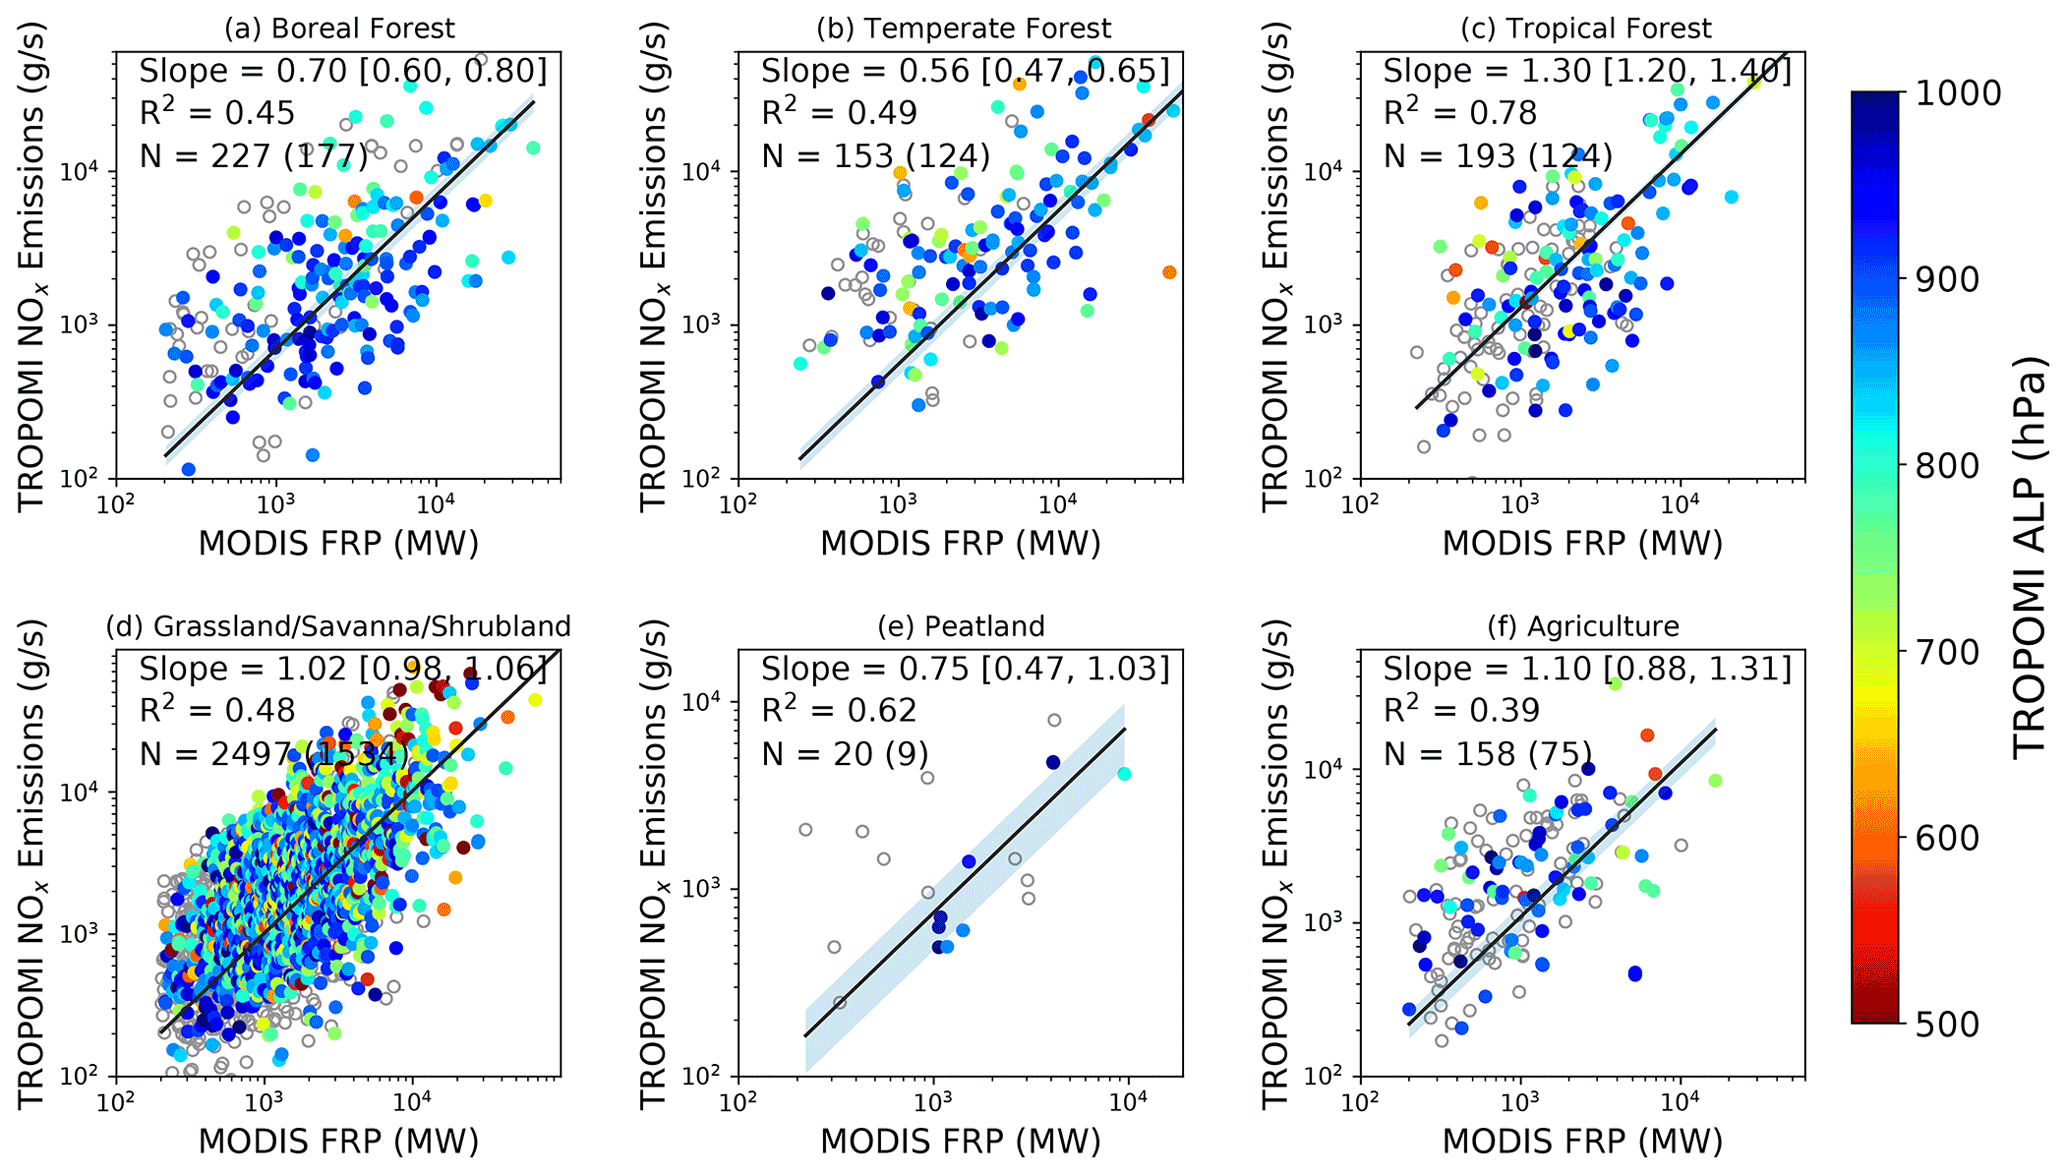
Figure 3Scatter plots between TROPOMI-derived NOx emissions (g s−1) and MODIS FRP (MW) for six fuel types: (a) boreal forest; (b) temperate forest; (c) tropical forest; (d) herbaceous fuel type that combines grassland, savanna, and shrubland together; (e) peatland; and (e) agricultural fires. The colors represent the TROPOMI ALP of the corresponding fire events. Fire events without valid ALP are shown as black circles. The black line indicates the regression line estimated from ordinary least squares with the intercept fixed at zero. The shadow represents the 95 % CI of the fitted line, calculated based on the Student's t-distribution test. R2 is the coefficient of determination of the linear fit. N is the number of fire events, and the number of fires with valid TROPOMI ALH is in the parenthesis. Emissions and FRP are on log scales.
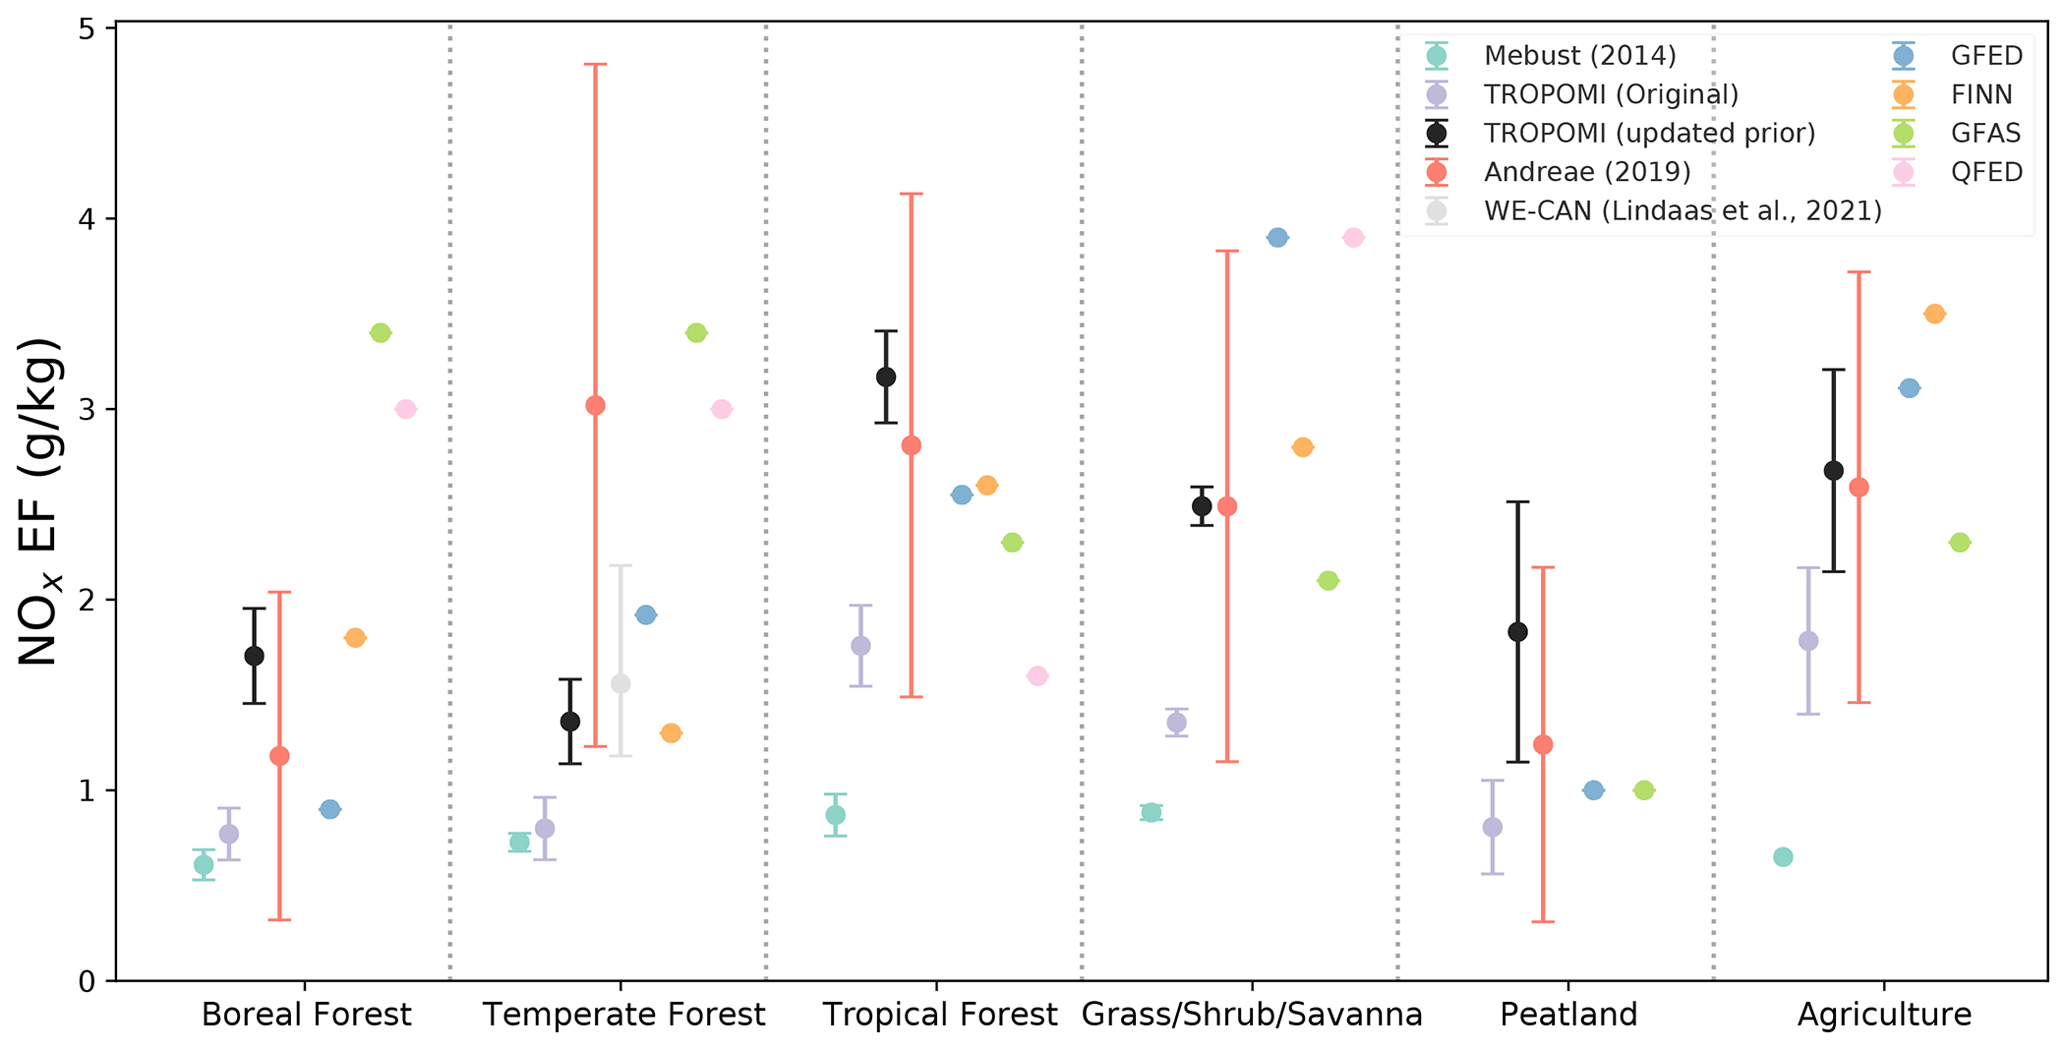
Figure 4Comparison of the TROPOMI-derived NOx emission factors with previous studies and those used in global biomass burning emission inventories. We include two estimates of NOx emission factors: one using the original TROPOMI NO2 (purple) and the other with updated a priori profile for AMF calculation (black). The error bars of TROPOMI NOx EFs represent 95 % CI calculated based on Student's t-distribution test. The red dots show the mean NOx EFs reported in previous studies compiled by Andreae (2019), and the error bars represent the standard deviation. The error bars of Mebust and Cohen (2014) are calculated using nonparametric bootstrap resampling. The error bars of Lindaas et al. (2021) indicate the overall uncertainty of measurements.
4.3 Satellite-derived fire NOx emissions
Deriving NOx emissions for the large ensemble of fires, we investigate what drives the variation of NOx emissions and lifetimes among these fires. MODIS FRP, which represents the radiant energy released by fires, has been used to approximate the biomass burned consumption in top-down emission inventories such as Global Fire Assimilation System (GFAS; Kaiser et al., 2012). We define the emission coefficient (EC) as the mass of pollutant emitted per unit of radiative energy (i.e., emissions per FRP), which has been used to derive the emissions of chemical species from fires (Ichoku and Kaufman, 2005; Mebust et al., 2011; Mebust and Cohen, 2014). Figure 3 shows the relationship between TROPOMI-derived NOx emissions with MODIS FRP for six different fuel types. Overall, we find TROPOMI-derived fire NOx emissions are positively correlated with MODIS FRP. We assess an overall EC by fitting a line with intercept fixed at zero. FRP explains 39 % to 78 % variance in emissions with the highest R2 for tropical forest fires and lowest for agricultural fires. The variability not accounted for may be related to the uncertainty of satellite retrieval of NO2, errors with the EMG approach, uncertainties with FRP (see Sect. 5), and/or true differences in NOx ECs for different fires in similar ecosystems. We compute the uncertainty of EC as 95 % confidence interval (CI) of the fitted EC based on the Student's t-distribution test. Comparing different forest types, EC is largest for tropical forests (1.30 [1.20, 1.40] g MJ−1), followed by boreal forests (0.70 [0.60, 0.80] g MJ−1) and temperate forests (0.56 [0.47, 0.65] g MJ−1). Aggregating all grassland, savanna, and shrubland fires as a single fuel type, we obtain an overall EC of 1.02 [0.98, 1.06] g MJ−1. Separating the fires into individual fuel types based on MODIS land cover classification leads to slightly improved R2 for savanna and grassland, but the derived EC is similar: 1.00 [0.93, 1.07] g MJ−1 for grassland, 1.13 [1.06, 1.19] g MJ−1 for savanna, and 0.89 [0.78, 1.01] g MJ−1 for shrubland (Fig. S5). Only 20 fires are classified as peatland fires, and we find a relatively good correlation between NOx emissions and FRP with R2= 0.62 and EC = 0.75 [0.47, 1.03] g MJ−1. For agricultural fires, there is a large scatter between NOx emissions and FRP with R2=0.39, and the estimated EC is 1.10 [0.88, 1.31] g MJ−1. Updating the a priori profile of NO2 enhances the spatial gradient of NO2 (Fig. 2b), allowing for better estimates of fire NOx emissions. Indeed, we find that using TROPOMI standard products gives a weaker correlation between FRP and NOx emissions, and the ECs decrease by 46 % on average (Fig. S6).
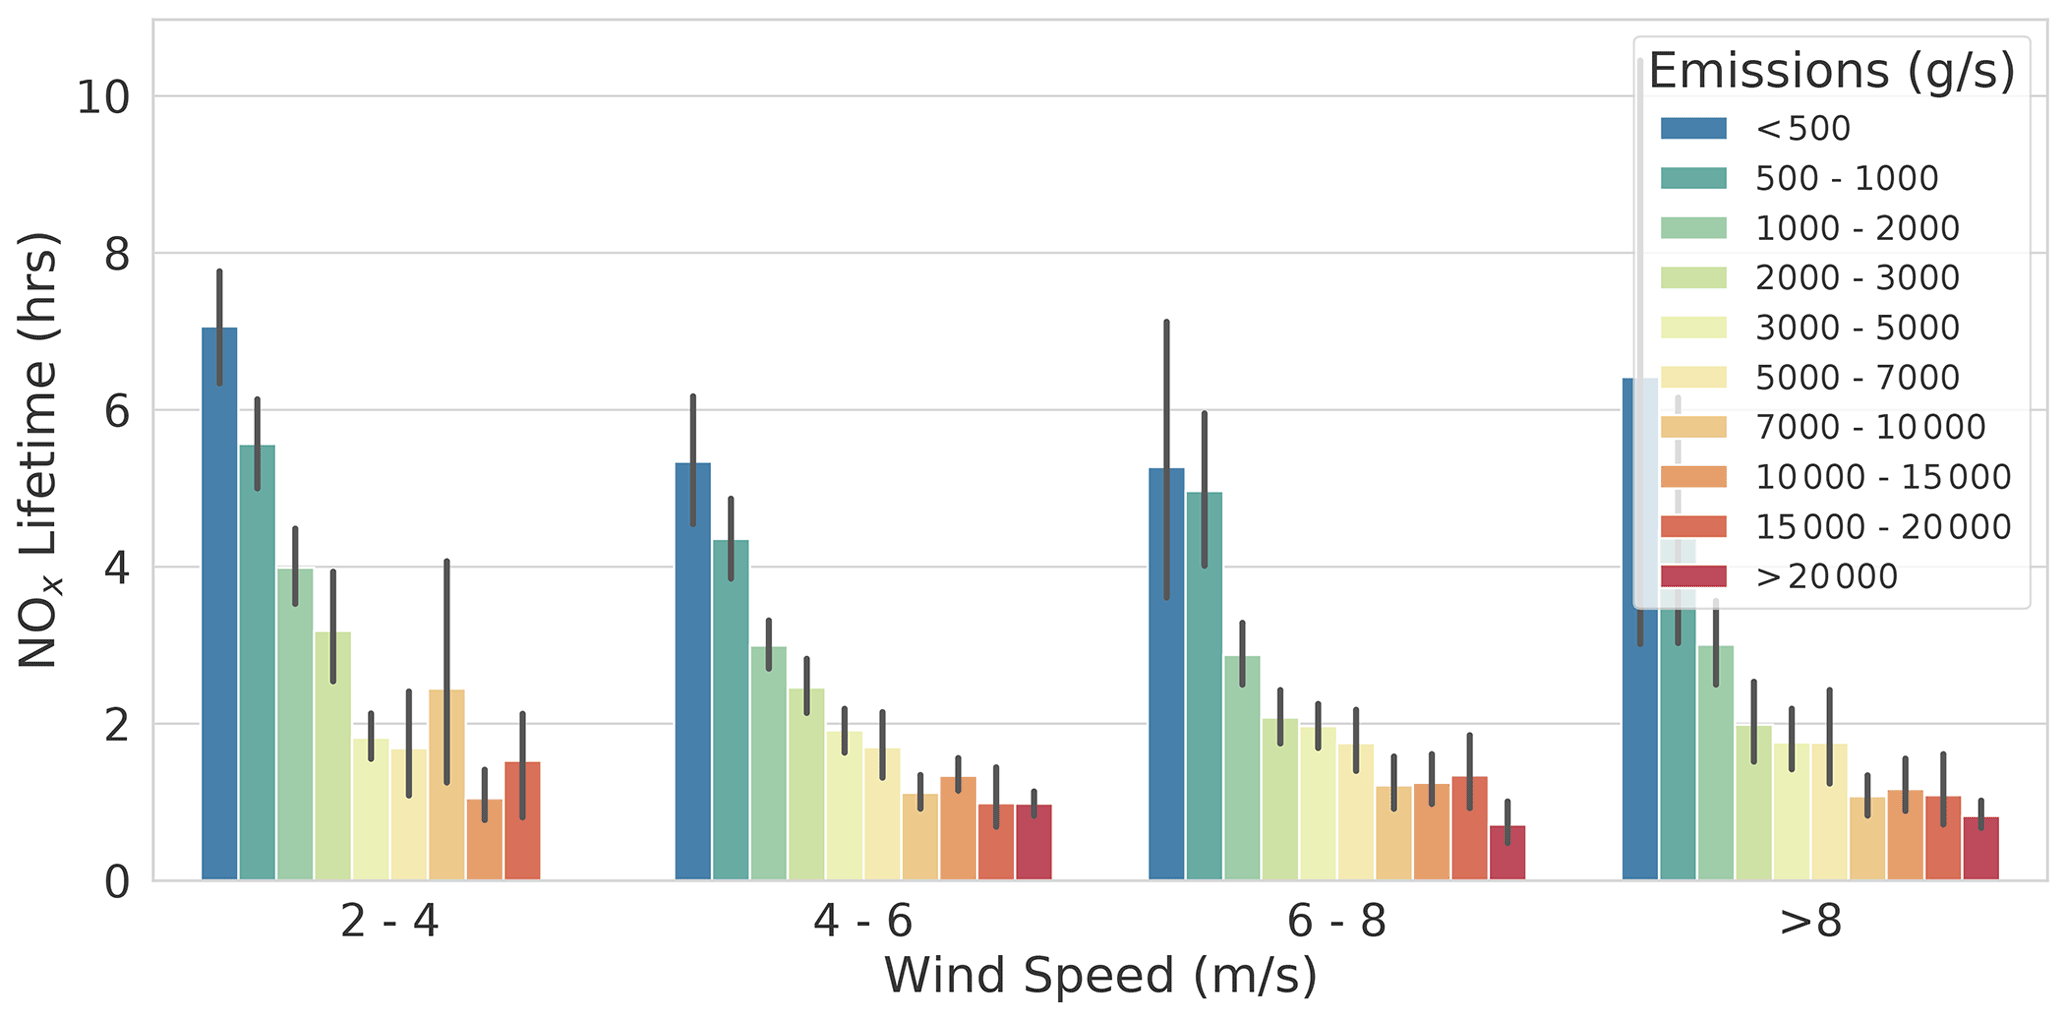
Figure 5The mean and standard deviation of TROPOMI-derived NOx lifetimes from fires at different emissions (color) and wind speeds. Fire episodes with less than 2 m s−1 wind speed are not shown.
4.4 Comparison with previous studies
To compare with previous studies, we convert the ECs to emission factors (EFs), assuming a constant ratio of fuel consumption to FRP: Kr=0.41 kg MJ−1 (Vermote et al., 2009; Mebust et al., 2011; Mebust and Cohen, 2014). Figure 4 shows the TROPOMI-derived NOx EFs and the associated uncertainties (95 % CI) compared to previous studies. We find that satellite-derived NOx EFs (hereafter EFssat) are largely consistent with the mean reported in the Andreae (2019, hereafter EFsandreae), which represent an up-to-date compilation of field and laboratory measurements over the last 2 decades. In most fuel types except for temperate forest, EFssat are largely consistent with EFsandreae to within 30 % difference. Our derived NOx EFsat for tropical forest (3.17 g kg−1) is nearly twice as large as that in the boreal forest (1.70 g kg−1), consistent with Andreae (2019), which also shows larger NOx EFs over the tropical forest (2.81 g kg−1) than boreal forest (1.18 g kg−1). However, for the temperate forest, the derived NOx EFsat (1.36 g kg−1) is less than half of EFandreae (3.02 g kg−1). There is a large spread of NOx EFs for the temperate forests in literature, ranging from 0.49 g kg−1 (Liu et al., 2017) to 7.44 g kg−1 (Yokelson et al., 2007). Our derived NOx EFsat, however, is close to the in situ estimates of NOx EFs (1.56 g kg−1) from the recent aircraft campaign (i.e., WE-CAN) over the western US during summer 2018 (Lindaas et al., 2021). In non-forest fuel types, we find the smallest NOx EFsat (1.83 g kg−1) over peatland, followed by grassland (2.49 g kg−1) and agriculture (2.68 g kg−1), which are close to EFsandreae. Using the standard TROPOMI NO2 products without updating the a priori profile, the derived NOx EFs are 44 % to 66 % of EFssat and 26 % to 68 % of EFsandreae. Assessment of TROPOMI NO2 with in situ measurements also suggests TROPOMI NO2 is biased low over polluted regions, and replacing the coarse-resolution a priori profile with fine-resolution simulations could largely reduce the low biases (Judd et al., 2020; Tack et al., 2021). Our derived NOx EFs are nearly 3 times larger than a previous study based on OMI observations, which suggest NOx EFs are lower than 1 g kg−1 in all fuel types (Mebust and Cohen, 2014). Besides the differences in satellite instruments and methods, the discrepancy is partially due to less accurate representation of biomass burning emissions in the a priori profile of NO2 in Mebust and Cohen (2014). Using the standard TROPOMI NO2 products without updating the a priori profile, the derived NOx EFs are similar to those developed by Mebust and Cohen (2014) for boreal and temperate forest fires but still higher over other fuel types.
As the development of biomass burning emission inventories is done by separate groups with different approaches, NOx EFs used in these inventories also differ. We compare our derived NOx EFs with those used in four commonly used global biomass burning emission inventories (Fig. 4), including (1) Global Fire Emissions Database (GFED; van der Werf et al., 2017), (2) Fire Inventory from NCAR (FINN; Wiedinmyer et al., 2011), (3) GFAS (Kaiser et al., 2012), and (4) QFED (Darmenov and Silva, 2015). We find that satellite-derived EFssat best agree with those used in FINN for forest and grassland in terms of absolute magnitude and variations among fuel types. GFED and FINN use smaller EFs over boreal (0.9 and 1.8 g kg−1) and temperate (1.9 and 1.3 g kg−1) forest than tropical forest (2.6 g kg−1), which is contrary to GFAS and QFED that use higher NOx EFs of 3.4 and 3.0 g kg−1 for the boreal and temperate forest than that for tropical forest (2.3 and 1.6 g kg−1, respectively). Our derived NOx EFsat for tropical forest fires is larger than those used in emission inventories. For grassland, our derived NOx EFsat of 2.49 g kg−1 is closest to that used in FINN (2.8 g kg−1) and GFAS (2.1 g kg−1) and smaller than that used in GFED and QFED (3.9 g kg−1). For peatland fires, both GFED and GFAS use EF of 1.0 g kg−1, which is smaller than our estimated EF of 1.83 g kg−1, but we acknowledge a large uncertainty in our derived EF for peatland given the small number of samples. For agricultural fires, our derived NOx EFsat (2.68 g kg−1) is slightly higher than that used in GFAS (2.3 g kg−1) but smaller than that used in GFED (3.11 g kg−1) and FINN (3.5 g kg−1).
4.5 Satellite-derived NOx lifetime and its driven factors
We find a large variation of NOx lifetimes in fire plumes. Figure 5 shows the variation of mean NOx lifetime as a function of NOx emissions at different wind speeds. We find an overall negative relationship between NOx lifetime and emissions: NOx lifetime decreases from over 5 h for fires with emissions less than 500 g s−1 to less than 2 h for fires higher than 5000 g s−1 (Fig. 5). We find similar NOx lifetime using original TROPOMI NO2 data (Fig. S7), largely because the derived NOx lifetime is determined by the shape of fire plumes that are not affected by the a priori data. The varying lifetime with emissions suggests that the assumption of constant lifetime used in previous studies leads to an overestimate in emissions for small fires and an underestimate of emissions for big fires. At low emission levels (< 2000 g s−1), NOx lifetime tends to decrease with increasing wind speed, which is due to the vertical and horizontal diffusion effects that dilute the concentration of NOx and thus alters the rate of NOx removal due to the feedback on OH and the rate of NOx removal (Valin et al., 2013). However, as NOx emissions further increase (> 2000 g s−1), the chemical removal becomes fast compared to dilution, and NOx lifetime no longer depends on wind speed (Fig. 5). We note that the EMG-derived NOx emissions depend on both NOx abundance and lifetime (Eq. 9), and thus the observed negative emission–lifetime relationship may partially reflect that emissions are estimated from derived NOx lifetime. However, we find a similar negative relationship between NOx lifetime and TROPOMI NO2 column density near the fire center (Fig. S8), indicating that chemical feedback of NOx is the primary driver of the derived NOx lifetime.
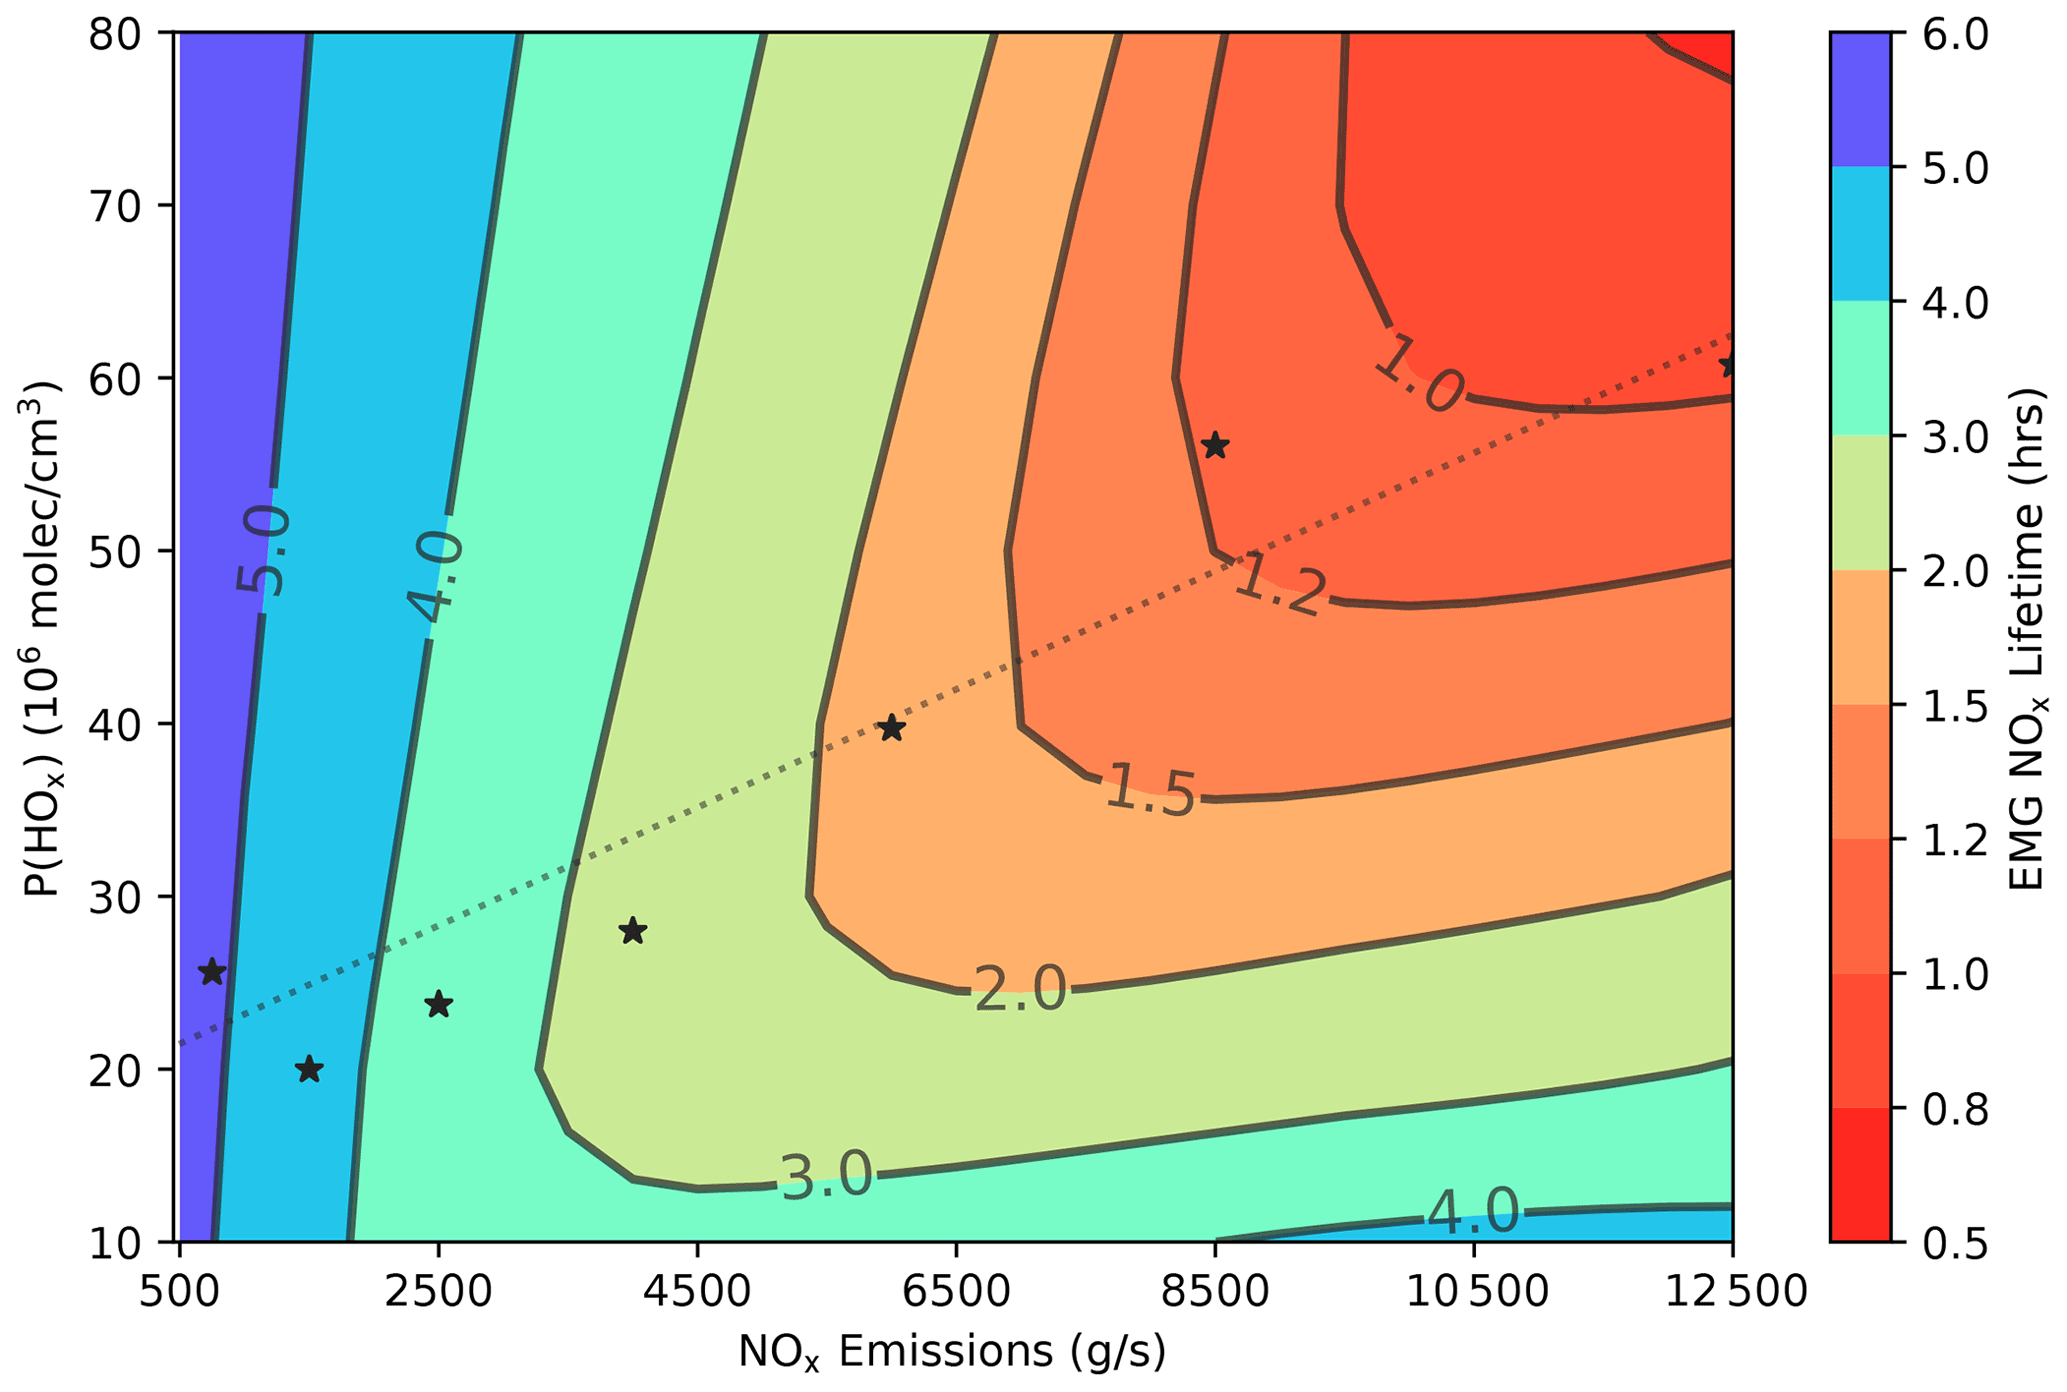
Figure 6Isopleth showing the NOx lifetime dependence on NOx emissions versus P(HOx). We run the PECANS 1-D model with varying NOx emissions and P(HOx). The lifetime is estimated by fitting the modeled NOx concentration along the wind direction with the EMG function (Eqs. 7 and 8). We run the model at a constant wind speed of 5 m s−1, and the VOC reactivity is set constant at 4.8 s−1 for both groups (RVOC and OVOC). The black stars show the TROPOMI-observed mean NOx emissions and lifetimes at wind speeds between 4 to 6 m s−1, where the P(HOx) value is estimated as the level that gives the closest NOx lifetime as observations at given NOx emissions. The dashed line represents the fitted regression line.

Figure 7Same as Fig. 6 but showing the NOx lifetime dependence on NOx emissions versus the reactivities of (a) RVOC and (b) OVOC. We run the model at a constant wind speed of 5 m s−1, and the P(HOx) is set constant at 50×106 molec. cm−3.
The NOx chemical lifetime, in theory, is determined by its loss to HNO3 and RONO2. We use the 1-D PECANS model to simulate NOx evolution downwind fire plumes and calculate a lifetime by fitting model simulated NOx concentration with the EMG function (Eq. 7). Figure 6 shows the dependence of the EMG-fitted NOx lifetime on NOx emissions rate and P(HOx). At low NOx emissions, the NOx lifetime decreases rapidly with increasing NOx emissions, while almost independent of P(HOx), indicating a NOx-limited regime. At the NOx-limited regime, increasing NOx facilitates the conversion from HO2 to OH and thus faster loss of NOx through formation of HNO3 (e.g., Valin et al., 2014; Romer et al., 2020). The loss of NOx through formation of RONO2 also increases with NOx emissions (e.g., Romer et al., 2020). As NOx emissions further increase, the NOx lifetime shows a strong dependence on P(HOx), and the NOx lifetime increases slightly with NOx emissions, indicating a NOx-saturated regime. In the NOx-saturated regime, as the loss of NOx through the formation of HNO3 consumes both NOx and OH, increasing NOx leads to decreasing oxidative capacity and thus a longer NOx lifetime. If the NOx lifetime is driven entirely by changes in NOx concentration, the derived NOx lifetime should first decrease and then increase with NOx emissions, which is not found from the observed lifetime–emission relationship. Therefore, we infer that it is likely that P(HOx) increases with fire intensity in fire plumes, which, combined with increasing NOx abundances, leads to an overall decrease of NOx lifetime with NOx emissions. If we assume VOC reactivities and branching ratio α are fixed, we could use TROPOMI-retrieved NOx emissions and lifetimes to infer an approximate level of P(HOx). Figure 6 labels the satellite-retrieved mean NOx lifetime at a given emission level, as well as the corresponding P(HOx). To match the observed negative lifetime–emission relationship, P(HOx) should also increase by nearly a factor of 4 from 15×106 molec. cm−3 for fires with lifetime longer than 4 h to 60×106 molec. cm−3 for fires with lifetime smaller than 1 h. The increase in P(HOx) may be related to increasing emissions of HONO that generate OH. A recent study suggests that previously underestimated HONO emissions from fires are responsible for two-thirds of the HOx production from fresh fire plumes (Theys et al., 2020). The changes of P(HOx), however, should be of secondary importance compared to NOx emissions in driving the observed variations in NOx lifetime, which can be evidenced from the slower rate of the increase in inferred P(HOx) and small changes of the NOx lifetime at high NOx emissions (Fig. 6).
In addition to NOx emissions and P(HOx), VOC reactivity is the third factor that affects the fitted NOx lifetime. At low NOx emissions, increasing RVOC reactivity leads to a shorter NOx lifetime, but its impacts become smaller and reverse with increasing NOx emissions (Fig. 7a). At low NOx emissions, increasing RVOC reactivity facilitates the loss of NOx through the formation of RONO2. At high NOx emissions, as both RVOC and NOx consumes OH, increasing VOC leads to a longer NOx lifetime. The formation of PAN acts as a temporal reservoir of NOx, which also affects the evolution of NOx. The formation of PAN depends on the concentration of OVOCs, OH level and temperature. Figure 7b shows the dependence of EMG-fitted NOx lifetime as a function of NOx emission rate and the reactivity of PAN's immediate precursor (OVOC). We find that increasing PAN formation through increasing OVOC reactivity will lead to an overall increase in EMG-fitted NOx lifetime. The impact of OVOC is especially evident at low levels of NOx emissions (Fig. 7b). Without PAN formation, the fitted NOx lifetime will be shorter than that derived from TROPOMI observations, suggesting that PAN formation plays a non-negligible role in determining the evolution of NOx and also the effective lifetime of NOx.
5.1 Uncertainties of satellite-retrieved NO2 columns
Satellite retrievals of NO2 columns are subject to uncertainties with spectral fitting and uncertainties from the a priori NO2 profile shape and scattering weights needed for calculating AMFs and stratospheric NO2 columns. Boersma et al. (2018) suggest an overall uncertainty of 35 % to 45 % for single-pixel OMI NO2 retrieval, which should be smaller for TROPOMI NO2 given its improved signal-to-noise ratio (van Geffen et al., 2020; Verhoelst et al., 2021). Due to the sporadic nature of fires, there is no validation of TROPOMI NO2 columns with fire NOx with ground-based measurements. Validation with ground-based differential optical absorption spectroscopy (DOAS) and Pandora measurements in urban stations show an overall good agreement between TROPOMI-retrieved and ground-based NO2 columns, and an overall negative bias is reported, but the biases vary with stations (Lambert et al., 2020; Verhoelst et al., 2021).
Over polluted regions, the uncertainty and bias of single-pixel satellite retrieval of NO2 columns is dominated by uncertainties of the AMF (Boersma et al., 2018). We replace the a priori profile shape of NO2 using NASA GEOS-CF simulations that include daily biomass burning emissions, which leads to higher NOx emission factors that are more consistent with in situ measurements. Bousserez (2014) similarly suggests that using a fire-specific NO2 profile shape can lead to a near 60 % reduction in AMF. In the NASA GEOS-CF, 65 % biomass burning emissions are distributed within the boundary layer, which will lead to negative biases in AMF for large fires with plumes that rise well above the boundary layer. In our study, since the ALH is below 2000 m for the majority of fires, model uncertainties of the injection height should have small impacts on the retrieval of NO2 columns. However, we notice that fire events with low ALP (< 700 hPa) tend to show higher NOx emissions per FRP, and most outliers in Fig. 3 are associated with high aerosol layers. Since satellite instruments are more sensitive to NO2 at higher altitudes, the inaccurate assumption of NO2 concentrated within the boundary layer will lead to an underestimate of the AMF and thus an overestimate of the retrieved vertical NO2 columns if the majority of NO2 is injected into the free troposphere.
In addition, the large amounts of aerosols emitted from wildfires may also impact the retrieval of NO2 columns from space. The impacts of aerosols depend on the magnitude, location, and optical properties (absorbing vs. scattering) of aerosols (Bousserez, 2014; Lin et al., 2015). In the TROPOMI NO2 retrieval algorithm, the effects of aerosols are implicitly accounted for through modifying the cloud properties (Boersma et al., 2011). Bousserez (2014) suggest that an explicit correction is needed in the presence of clouds and scattering aerosols, and the effects of aerosol correction can be as large as 100 % when cloud fraction is 30 % and AOD is higher than 1. In our study, the mean cloud fraction of the selected fire plumes is 9 %, and the mean AOD is 0.22, corresponding to a small uncertainty of less than 20 % based on Bousserez (2014).
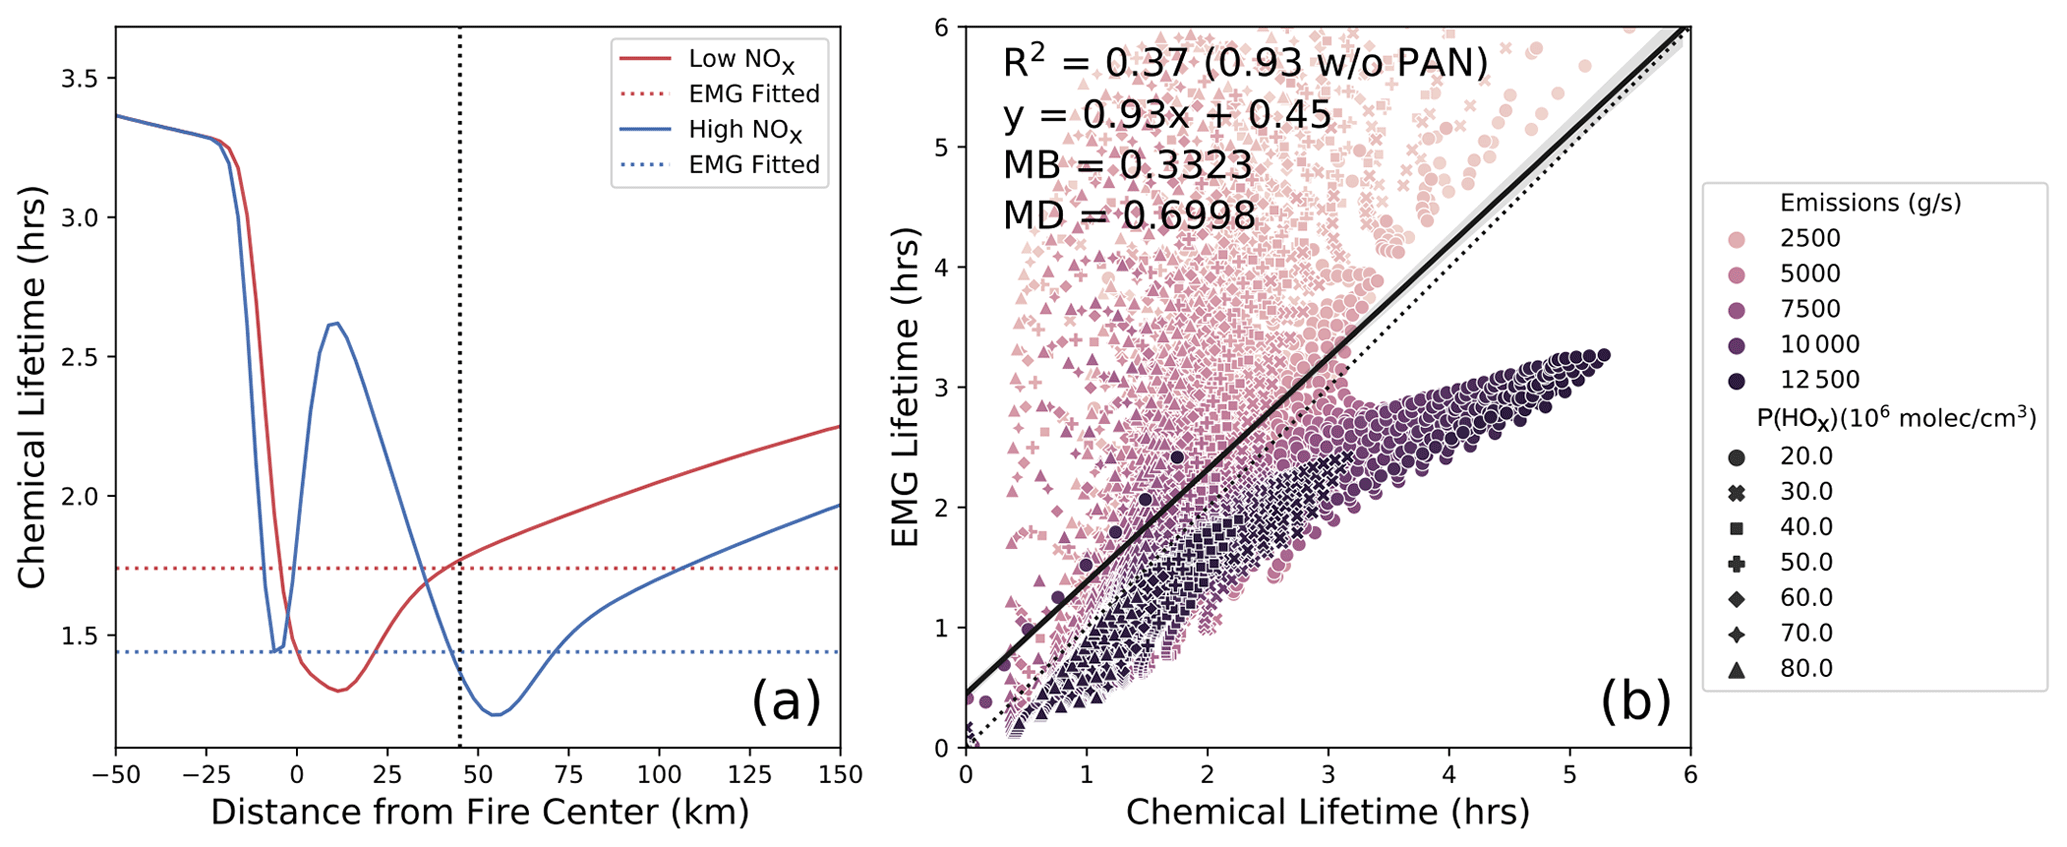
Figure 8(a) Illustration of the variation of NOx chemical lifetime with distance from fire center at both low (red) and high NOx emissions (blue). The EMG-fitted effective lifetime is shown as horizontal dashed lines. The vertical line indicates the distance where chemical lifetime and EMG-fitted lifetime agree. (b) Scatter plot between EMG-fitted versus overall chemical NOx lifetimes downwind calculated using varying NOx emissions, P(HOx), and VOC reactivities, where the colors represent different emission levels, and the symbols represent different levels of P(HOx). The chemical lifetime is calculated as the mean NOx concentration divided by the mean chemical loss of NOx through the formation of HNO3 and RONO2 over downwind region. We define the regional mean as the region between fire center and the downwind area where NOx concentration is higher than background, where background value is estimated from the EMG function (B in Eq. 7).
5.2 Uncertainties of MODIS FRP
Since we derive NOx EFs from the linear regression between TROPOMI NOx emissions and MODIS FRP, uncertainties in MODIS FRP should also contribute to uncertainties of the satellite-derived NOx EFs. Detection of MODIS FRP may be obscured by cloud, aerosols, or canopy cover. The uncertainty of FRP, however, is lower than 5 % for fires that aggregate 30 or more active fire pixels together (Freeborn et al., 2014). Our selected fire events are aggregated by 37 active fire pixels on average. To evaluate if our results are robust with the choice of FRP data, we conduct similar analysis with FRP measurements from Suomi NPP VIIRS sensors. In general, MODIS and VIIRS FRP are in good agreement (R2=0.72, Fig. S9). VIIRS FRP is lower than MODIS FRP by 5.8 % on average. Deriving NOx emission factors using VIIRS FRP, we find a slight increase of NOx EFs for forest and agricultural fires but a decrease for peatland (Fig. S10). For herbaceous fires, where a large number of fires are sampled, the derived NOx EF remains almost unchanged, suggesting that the difference in MODIS and VIIRS FRP should diminish as we increase the sample size. The overall relationship between NOx emissions and FRP is similar for both VIIRS and MODIS, though stronger correlation is found for MODIS FRP. Overall, we estimate the difference in NOx EFs using MODIS versus VIIRS FRP is ∼2 %. Here we assume linear relationship between emission rate and FRP. While the validity of the relationship has been verified in laboratory (Wooster et al., 2005; Freeborn et al., 2008), field experiments (Wiggins et al., 2020), and satellite observations (Ichoku and Kaufman, 2005), the choice of the mass-to-energy conversion factor (Kr) slightly differs in Wooster et al. (2005, 0.368 g MJ−1) and in Freeborn et al. (2008, 0.453 g MJ−1), suggesting an uncertainty of order 10 % for the value of Kr.
5.3 Uncertainties in the EMG approach
The first step of the EMG approach is to rotate TROPOMI observations along the wind direction. The derived NOx lifetimes and emissions are therefore subject to uncertainties of the wind direction and speed due to uncertain plume heights that cross wind shear or the plume thermodynamics that are not captured by ERA5 wind data. In the case when the fire plume does not align with wind direction, calculating line density along the wind direction should lead to an underestimate of the e-folding distance. In this study, we only select fires with less than 30∘ rotation bias, and the mean rotation bias is 10∘, which corresponds to less than 2 % underestimate of the e-folding distance. Uncertainty and variance of the wind speed, however, should lead to errors in the derived NOx lifetimes. Here we determine the wind speed by interpolating the wind profile to TROPOMI-derived aerosol layer. Comparison of TROPOMI ALH with plume height from the Cloud-Aerosol LIdar with Orthogonal Polarization (CALIOP) and the Multi-angle Imaging SpectroRadiometer (MISR) measurements suggest that TROPOMI ALH is overall 500 m lower (Griffin et al., 2020; Nanda et al., 2020). We estimate that an increase of 500 m ALH corresponds to ∼22 % increase of the wind speed on average, meaning that NOx lifetime will decrease by ∼18 %.
Here we use the EMG approach to derive an effective NOx lifetime of the entire fire plume. Chemical nonlinearities can result in an effective chemical lifetime that is averaged over the plume where at each point in the plume evolution a different chemical lifetime occurs. Besides, the effective lifetime in practice will be confounded by the mixing such as those plume movement in different directions that reduces the line density. To assess if EMG-fitted effective NOx lifetime is indicative of the chemical lifetime, we use the PECANS model to calculate an EMG-fitted lifetime and a chemical lifetime of NOx from two permanent losses of NOx through the formation of HNO3 and RONO2 over downwind region (i.e., mean NOx concentration divided by the mean chemical loss of NOx). The chemical lifetime of NOx varies with location (Fig. 8a), which reaches a minimum near the source center at low NOx emissions (NOx-limited regime) but shows maximum at high NOx emissions (NOx-saturated regime). The effect of varying lifetime on the emission estimates is not considered with the EMG approach, which instead gives an overall effective NOx lifetime of the plume. At low NOx, the EMG-fitted lifetime is higher than the chemical lifetime at the fire center, but the reverse occurs at high NOx (Fig. 8a). We notice that the EMG-fitted lifetime is overall more consistent with the chemical lifetime around 40 to 50 km downwind from the fire center, which should vary depending on the model input. Figure 8b compares the EMG-fitted lifetime with overall chemical lifetime over downwind regions under different NOx emissions, P(HOx) and VOC reactivities. We find a moderate correlation between EMG-fitted lifetime and chemical lifetime (R2=0.37). If PAN formation is not included, a nearly perfect correlation is found between the EMG-fitted and chemical lifetimes (R2=0.93). In the lower troposphere, PAN is generally considered a sink of NOx near the fire but a source of NOx over downwind region, which deepens the gradient of NO2 near the source but flattens the gradient downwind (Valin et al., 2013). For those large biomass burning events that inject PAN into upper troposphere, PAN acts as a stable reservoir of NOx, leading to long-range transport of NOx (Tereszchuk et al., 2013). The EMG approach is unable to capture the effects of PAN formation on the evolution of NOx as it assumes NOx decays exponentially. In the presence of PAN formation, we find the EMG approach tends to overestimate NOx lifetime at low NOx emission (< 5000 g s−1), in which the flattening effect of PAN is more evident, while underestimating NOx lifetime at high NOx emissions and low P(HOx), in which the deepening effect of PAN takes over. Overall, we assess that the overestimate at low NOx emissions (< 5000 g s−1) causes around 33 % negative biases to the derived emissions and 18 % positive biases at high NOx emissions (> 5000 g s−1). In situ measurements show rapid formation of PAN in young smoke within 4 h of aging, and PAN contributes about 25 % of the total reactive nitrogen (Alvarado et al., 2010; Juncosa Calahorrano et al., 2021), suggesting a non-negligible role of PAN as a sink of NOx near fire source.
We estimate NOx emissions and lifetimes from over 3000 fires globally using daily TROPOMI retrievals of NO2 tropospheric columns, and we derive NOx emission factors by linking TROPOMI-derived NOx emissions with MODIS FRP. The overall derived NOx emission factors are 1.70, 1.36, and 3.17 g kg−1 for the boreal, temperate, and tropical forest; 2.49 g kg−1 for herbaceous (grassland, savannas, and shrubland combined) fires; 1.83 g kg−1 for peatland; and 2.67 g kg−1 for agricultural burning. Satellite-derived NOx emission factors are largely consistent with the mean NOx emission factors reported by previous field studies (Andreae, 2019). By studying a large number of fires globally, we provide more representative NOx emission factors. These top-down emission estimates of NOx could be used to assess biomass burning emission inventories in terms of both emission factors and fuel consumption, which could help diagnose the causes of discrepancies among different emission inventories.
Our study features three improvements over previous studies that use satellite measurements to derive NOx emissions (Mebust et al., 2011; Mebust and Cohen, 2014; Schreier et al., 2015). First, we use observations from TROPOMI with finer spatial resolution and improved signal-to-noise ratio. Second, we relax the assumptions of constant NOx lifetime by directly estimating lifetime through fitting the evolution of NOx downwind with the EMG approach. Third, we replace the a priori profile of TROPOMI NO2 retrieval with a high-resolution global model simulation from NASA GEOS-CF simulations to calculate AMF. This update results in steeper gradients between the plumes and the background and a more accurate description of NO2 vertical shape, reducing the discrepancy between satellite and in situ derived estimates of NOx emission factors. The resolution of current global model simulation, however, is not sufficient to resolve the fine-scale chemical evolution of fire plumes, and better treatment of the fire injection is needed (Paugam et al., 2016). Assessment of the satellite retrieval uncertainty will benefit from high-resolution regional simulations combined with in situ measurements that sample individual fire smokes from the point of emission to downwind regions (Juncosa Clahorrano et al., 2021; Lindaas et al., 2020).
We observe decreasing NOx lifetime with increasing fire NOx emissions, which is indicative of NOx-limited chemistry, where increasing NOx emissions makes the chemical loss of NOx more efficient. However, for the largest fires with high NOx, a regime transition from a NOx-limited regime to a NOx-saturated regime is expected, where increasing NOx emissions leads to a longer NOx lifetime. Using a 1-D idealized plume model to interpret the factors affecting the NOx lifetime, we infer that P(HOx) must also increase with fire intensity, consistent with observations that indicate a large source of HONO in fires (Theys et al., 2020; Peng et al., 2020). The formation of PAN also impacts the NOx lifetime, but the evolution of NOx due to the formation of PAN and its thermal decomposition over downwind areas is not well captured by the EMG approach that assumes exponential decay with NOx downwind. Future studies will benefit from the integrative analysis of satellite retrievals of NO2, HONO, and PAN to more completely describe the chemical evolution of reactive nitrogen from wildfires, thus allowing for better prediction of the air quality impacts of fires. TROPOMI is limited to a single overpass per day, which cannot resolve the short-term evolution of fire plumes observed by in situ measurements (e.g., Juncosa Calahorrano et al., 2021). The newly launched or upcoming geostationary satellite instruments such as GEMS and TEMPO will offer an unprecedented opportunity to continuously observe the emissions and chemical evolution of NOx from fires that will no longer be limited to a single snapshot (Chance et al., 2013; Kim et al., 2019).
The TROPOMI NO2 data (https://doi.org/10.5270/S5P-s4ljg54, Copernicus Sentinel-5P, 2018a) and TROPOMI ALH (https://doi.org/10.5270/S5P-j7aj4gr, Copernicus Sentinel-5P, 2018b) are available from NASA Goddard Earth Sciences (GES) Data and Information Services Center (DISC, available at https://disc.gsfc.nasa.gov/datasets/, last access: 6 October 2021). MODIS (https://doi.org/10.5067/FIRMS/MODIS/MCD14ML, NASA FIRMS, 2018a) and VIIRS FRP (https://doi.org/10.5067/FIRMS/VIIRS/VNP14IMGT_NRT.002, NASA FIRMS, 2018b) data are available from NASA Earth Data Fire Information for Resource Management Systems, (available at https://earthdata.nasa.gov/earth-observation-data/near-real-time/firms, last access: 6 October 2021). MAIAC AOD data are available from NASA's Land Processes Distributed Active Archive Center (LP DAAC) located at the USGS Earth Resources Observation and Science (EROS) Center (available at https://doi.org/10.5067/MODIS/MCD19A2.006, Lyapustin and Wang, 2018b). ERA5 hourly wind data are available from the Copernicus Climate Service (C3S) Climate Data Store (available at https://doi.org/10.24381/cds.bd0915c6, Hersbach et al., 2018). GEOS-CF simulations are available from NASA Global Modeling and Assimilation Office (available at https://gmao.gsfc.nasa.gov/weather_prediction/GEOS-CF/data_access/; NASA GMAO, 2020). PECANS code is available from https://doi.org/10.5281/zenodo.3386652 (Laughner, 2019).
The supplement related to this article is available online at: https://doi.org/10.5194/acp-21-15569-2021-supplement.
XJ and RCC conceived the project. QZ provided the PECANS code. XJ carried out the data analysis and prepared the article with contributions from all co-authors.
The contact author has declared that neither they nor their co-authors have any competing interests.
Publisher’s note: Copernicus Publications remains neutral with regard to jurisdictional claims in published maps and institutional affiliations.
Xiaomeng Jin is supported by the NOAA Climate and Global Change Postdoctoral Fellowship Program, administered by UCAR's Cooperative Programs for the Advancement of Earth System Science (CPAESS) under award no. NA18NWS4620043B. This work is also supported by NASA grant 80NSSC18K0624.
This research has been supported by the National Oceanic and Atmospheric Administration (grant no. NA18NWS4620043B) and the National Aeronautics and Space Administration (grant no. 80NSSC18K0624).
This paper was edited by Hang Su and reviewed by Julieta Juncosa and two anonymous referees.
Akagi, S. K., Craven, J. S., Taylor, J. W., McMeeking, G. R., Yokelson, R. J., Burling, I. R., Urbanski, S. P., Wold, C. E., Seinfeld, J. H., Coe, H., Alvarado, M. J., and Weise, D. R.: Evolution of trace gases and particles emitted by a chaparral fire in California, Atmos. Chem. Phys., 12, 1397–1421, https://doi.org/10.5194/acp-12-1397-2012, 2012.
Alvarado, M. J. and Prinn, R. G.: Formation of ozone and growth of aerosols in young smoke plumes from biomass burning: 1. Lagrangian parcel studies, J. Geophys. Res.-Atmos., 114, D09306-20, https://doi.org/10.1029/2008jd011144, 2009.
Alvarado, M. J., Logan, J. A., Mao, J., Apel, E., Riemer, D., Blake, D., Cohen, R. C., Min, K.-E., Perring, A. E., Browne, E. C., Wooldridge, P. J., Diskin, G. S., Sachse, G. W., Fuelberg, H., Sessions, W. R., Harrigan, D. L., Huey, G., Liao, J., Case-Hanks, A., Jimenez, J. L., Cubison, M. J., Vay, S. A., Weinheimer, A. J., Knapp, D. J., Montzka, D. D., Flocke, F. M., Pollack, I. B., Wennberg, P. O., Kurten, A., Crounse, J., Clair, J. M. St., Wisthaler, A., Mikoviny, T., Yantosca, R. M., Carouge, C. C., and Le Sager, P.: Nitrogen oxides and PAN in plumes from boreal fires during ARCTAS-B and their impact on ozone: an integrated analysis of aircraft and satellite observations, Atmos. Chem. Phys., 10, 9739–9760, https://doi.org/10.5194/acp-10-9739-2010, 2010.
Andreae, M. O.: Emission of trace gases and aerosols from biomass burning – an updated assessment, Atmos. Chem. Phys., 19, 8523–8546, https://doi.org/10.5194/acp-19-8523-2019, 2019.
Beirle, S., Boersma, K. F., Platt, U., Lawrence, M. G., and Wagner, T.: Megacity Emissions and Lifetimes of Nitrogen Oxides Probed from Space, Science, 333, 1737–1739, https://doi.org/10.1126/science.1207824, 2011.
Bey, I., Jacob, D. J., Yantosca, R. M., Logan, J. A., Field, B. D., Fiore, A. M., Li, Q., Liu, H. Y., Mickley, L. J., and Schultz, M. G.: Global modeling of tropospheric chemistry with assimilated meteorology: Model description and evaluation, J. Geophys. Res.-Atmos., 106, 23073–23095, https://doi.org/10.1029/2001jd000807, 2001.
Boersma, K. F., Eskes, H. J., and Brinksma, E. J.: Error analysis for tropospheric NO2 retrieval from space, J. Geophys. Res.-Atmos., 109, D04311, https://doi.org/10.1029/2003jd003962, 2004.
Boersma, K. F., Eskes, H. J., Dirksen, R. J., van der A, R. J., Veefkind, J. P., Stammes, P., Huijnen, V., Kleipool, Q. L., Sneep, M., Claas, J., Leitão, J., Richter, A., Zhou, Y., and Brunner, D.: An improved tropospheric NO2 column retrieval algorithm for the Ozone Monitoring Instrument, Atmos. Meas. Tech., 4, 1905–1928, https://doi.org/10.5194/amt-4-1905-2011, 2011.
Boersma, K. F., Eskes, H. J., Richter, A., De Smedt, I., Lorente, A., Beirle, S., van Geffen, J. H. G. M., Zara, M., Peters, E., Van Roozendael, M., Wagner, T., Maasakkers, J. D., van der A, R. J., Nightingale, J., De Rudder, A., Irie, H., Pinardi, G., Lambert, J.-C., and Compernolle, S. C.: Improving algorithms and uncertainty estimates for satellite NO2 retrievals: results from the quality assurance for the essential climate variables (QA4ECV) project, Atmos. Meas. Tech., 11, 6651–6678, https://doi.org/10.5194/amt-11-6651-2018, 2018.
Bousserez, N.: Space-based retrieval of NO2 over biomass burning regions: quantifying and reducing uncertainties, Atmos. Meas. Tech., 7, 3431–3444, https://doi.org/10.5194/amt-7-3431-2014, 2014.
Carter, T. S., Heald, C. L., Jimenez, J. L., Campuzano-Jost, P., Kondo, Y., Moteki, N., Schwarz, J. P., Wiedinmyer, C., Darmenov, A. S., da Silva, A. M., and Kaiser, J. W.: How emissions uncertainty influences the distribution and radiative impacts of smoke from fires in North America, Atmos. Chem. Phys., 20, 2073–2097, https://doi.org/10.5194/acp-20-2073-2020, 2020.
Chance, K., Liu, X., Suleiman, R. M., Flittner, D. E., Al-Saadi, J., and Janz, S. J.: Tropospheric emissions: monitoring of pollution (TEMPO), Proc. SPIE 8866, Earth Observing Systems XVIII, 88660D (23 September 2013), https://doi.org/10.1117/12.2024479, 2013.
Copernicus Sentinel-5P (processed by ESA, Koninklijk Nederlands Meteorologisch Instituut): Sentinel-5P TROPOMI Tropospheric NO2 1-Orbit L2 7 km x 3.5 km [data set], available from Goddard Earth Sciences Data and Information Services Center (GES DISC), https://doi.org/10.5270/S5P-s4ljg54, 2018a.
Copernicus Sentinel-5P (processed by ESA, Koninklijk Nederlands Meteorologisch Instituut): Sentinel-5P TROPOMI Aerosol Layer Height 1-Orbit L2 7 km x 3.5 km [data set], available from Goddard Earth Sciences Data and Information Services Center (GES DISC), https://doi.org/10.5270/S5P-j7aj4gr, 2018b.
Crutzen, P. J. and Andreae, M. O.: Biomass Burning in the Tropics: Impact on Atmospheric Chemistry and Biogeochemical Cycles, Science, 250, 4988, 1669–1678, https://doi.org/10.1126/science.250.4988.1669, 1990.
Darmenov, A. S. and da Silva, A.: The Quick Fire Emissions Dataset (QFED): Technical Report Series on Global Modeling and Data Assimilation, 38, Documentation of versions 2.1, 2.2 and 2.4., available at: https://gmao.gsfc.nasa.gov/pubs/docs/Darmenov796.pdf (last access: 26 April 2021), 2015.
De Foy, B., Wilkins, J. L., Lu, Z., Streets, D. G., and Duncan, B. N.: Model evaluation of methods for estimating surface emissions and chemical lifetimes from satellite data, Atmos. Environ., 98, 66–77, https://doi.org/10.1016/j.atmosenv.2014.08.051, 2014.
de Graaf, M., de Haan, J. F., and Sanders, A. F. J.: TROPOMI ATBD of the Aerosol Layer Height, available at: http://www.tropomi.eu/sites/default/files/files/publicSentinel-5P-TROPOMI-ATBD-Aerosol-Height.pdf (last access: 26 April 2021), 2019.
Duncan, B. N., Lamsal, L. N., Thompson, A. M., Yoshida, Y., Lu, Z., Streets, D. G., Hurwitz, M. M., and Pickering, K. E.: A space-based, high-resolution view of notable changes in urban NOx pollution around the world (2005–2014), J. Geophys. Res.-Atmos., 121, 976–996, https://doi.org/10.1002/2015jd024121, 2016.
Eskes, H. J. and Boersma, K. F.: Averaging kernels for DOAS total-column satellite retrievals, Atmos. Chem. Phys., 3, 1285–1291, https://doi.org/10.5194/acp-3-1285-2003, 2003.
Fischer, E. V., Jacob, D. J., Yantosca, R. M., Sulprizio, M. P., Millet, D. B., Mao, J., Paulot, F., Singh, H. B., Roiger, A., Ries, L., Talbot, R. W., Dzepina, K., and Pandey Deolal, S.: Atmospheric peroxyacetyl nitrate (PAN): a global budget and source attribution, Atmos. Chem. Phys., 14, 2679–2698, https://doi.org/10.5194/acp-14-2679-2014, 2014.
Freeborn, P. H., Wooster, M. J., Hao, W. M., Ryan, C. A., Nordgren, B. L., Baker, S. P., and Ichoku, C.: Relationships between energy release, fuel mass loss, and trace gas and aerosol emissions during laboratory biomass fires, J. Geophys. Res.-Atmos., 113, 1984–2012, https://doi.org/10.1029/2007jd008679, 2008.
Freeborn, P. H., Wooster, M. J., Roy, D. P., and Cochrane, M. A.: Quantification of MODIS fire radiative power (FRP) measurement uncertainty for use in satellite-based active fire characterization and biomass burning estimation, Geophys. Res. Lett., 41, 1988–1994, https://doi.org/10.1002/2013gl059086, 2014.
Friedl, M. A., Sulla-Menashe, D., Tan, B., Schneider, A., Ramankutty, N., Sibley, A., and Huang, X.: MODIS Collection 5 global land cover: Algorithm refinements and characterization of new datasets, Remote Sens. Environ., 114, 168–182, https://doi.org/10.1016/j.rse.2009.08.016, 2010.
Giglio, L., Schroeder, W., and Justice, C. O.: The collection 6 MODIS active fire detection algorithm and fire products, Remote Sens. Environ., 178, 31–41, https://doi.org/10.1016/j.rse.2016.02.054, 2016.
Goldberg, D. L., Lamsal, L. N., Loughner, C. P., Swartz, W. H., Lu, Z., and Streets, D. G.: A high-resolution and observationally constrained OMI NO2 satellite retrieval, Atmos. Chem. Phys., 17, 11403–11421, https://doi.org/10.5194/acp-17-11403-2017, 2017.
Goldberg, D. L., Lu, Z., Streets, D. G., de Foy, B., Griffin, D., McLinden, C. A., Lamsal, L. N., Krotkov, N. A., and Eskes, H.: Enhanced Capabilities of TROPOMI NO2: Estimating NOX from North American Cities and Power Plants, Environ. Sci. Technol., 53, 12594–12601, https://doi.org/10.1021/acs.est.9b04488, 2019.
Griffin, D., Sioris, C., Chen, J., Dickson, N., Kovachik, A., de Graaf, M., Nanda, S., Veefkind, P., Dammers, E., McLinden, C. A., Makar, P., and Akingunola, A.: The 2018 fire season in North America as seen by TROPOMI: aerosol layer height intercomparisons and evaluation of model-derived plume heights, Atmos. Meas. Tech., 13, 1427–1445, https://doi.org/10.5194/amt-13-1427-2020, 2020.
Hersbach, H., Bell, B., Berrisford, P., Biavati, G., Horányi, A., Muñoz Sabater, J., Nicolas, J., Peubey, C., Radu, R., Rozum, I., Schepers, D., Simmons, A., Soci, C., Dee, D., and Thépaut, J.-N.: ERA5 hourly data on pressure levels from 1979 to present, Copernicus Climate Change Service (C3S) Climate Data Store (CDS) [data set], https://doi.org/10.24381/cds.bd0915c6, 2018.
Hersbach, H., Bell, B., Berrisford, P., Hirahara, S., Horányi, A., Muñoz-Sabater, J., Nicolas, J., Peubey, C., Radu, R., Schepers, D., Simmons, A., Soci, C., Abdalla, S., Abellan, X., Balsamo, G., Bechtold, P., Biavati, G., Bidlot, J., Bonavita, M., Chiara, G., Dahlgren, P., Dee, D., Diamantakis, M., Dragani, R., Flemming, J., Forbes, R., Fuentes, M., Geer, A., Haimberger, L., Healy, S., Hogan, R. J., Hólm, E., Janisková, M., Keeley, S., Laloyaux, P., Lopez, P., Lupu, C., Radnoti, G., Rosnay, P., Rozum, I., Vamborg, F., Villaume, S., and Thépaut, J.: The ERA5 global reanalysis, Q. J. Roy. Meteor. Soc., 146, 1999–2049, https://doi.org/10.1002/qj.3803, 2020.
Ichoku, C. and Ellison, L.: Global top-down smoke-aerosol emissions estimation using satellite fire radiative power measurements, Atmos. Chem. Phys., 14, 6643–6667, https://doi.org/10.5194/acp-14-6643-2014, 2014.
Ichoku, C. and Kaufman, Y. J.: A Method to Derive Smoke Emission Rates From MODIS Fire Radiative Energy Measurements, IEEE T. Geosci. Remote., 43, 2636–2649, https://doi.org/10.1109/tgrs.2005.857328, 2005.
Ialongo, I., Virta, H., Eskes, H., Hovila, J., and Douros, J.: Comparison of TROPOMI/Sentinel-5 Precursor NO2 observations with ground-based measurements in Helsinki, Atmos. Meas. Tech., 13, 205–218, https://doi.org/10.5194/amt-13-205-2020, 2020.
Jin, X., Fiore, A., Boersma, K. F., Smedt, I. D., and Valin, L.: Inferring changes in summertime surface ozone-NOx-VOC chemistry over U.S. urban areas from two decades of satellite and ground-based observations. Environ. Sci. Technol., 54, 6518–6529, https://doi.org/10.1021/acs.est.9b07785, 2020.
Johnston, F. H., Henderson, S. B., Chen, Y., Randerson, J. T., Marlier, M., DeFries, R. S., Kinney, P., Bowman, D. M. J. S., and Brauer, M.: Estimated global mortality attributable to smoke from landscape fires, Environ. Health Persp., 120, 695–701, https://doi.org/10.1289/ehp.1104422, 2012.
Judd, L. M., Al-Saadi, J. A., Janz, S. J., Kowalewski, M. G., Pierce, R. B., Szykman, J. J., Valin, L. C., Swap, R., Cede, A., Mueller, M., Tiefengraber, M., Abuhassan, N., and Williams, D.: Evaluating the impact of spatial resolution on tropospheric NO2 column comparisons within urban areas using high-resolution airborne data, Atmos. Meas. Tech., 12, 6091–6111, https://doi.org/10.5194/amt-12-6091-2019, 2019.
Judd, L. M., Al-Saadi, J. A., Szykman, J. J., Valin, L. C., Janz, S. J., Kowalewski, M. G., Eskes, H. J., Veefkind, J. P., Cede, A., Mueller, M., Gebetsberger, M., Swap, R., Pierce, R. B., Nowlan, C. R., Abad, G. G., Nehrir, A., and Williams, D.: Evaluating Sentinel-5P TROPOMI tropospheric NO2 column densities with airborne and Pandora spectrometers near New York City and Long Island Sound, Atmos. Meas. Tech., 13, 6113–6140, https://doi.org/10.5194/amt-13-6113-2020, 2020.
Juncosa Clahorrano, J., Lindaas, J., O'Dell, K., Palm, B. B., Peng, Q., Flocke, F., Pollack, I. B., Garofalo, L. A., Farmer, D. K., Pierce, J. R., Collett, J. L., Weinheimer, A., Campos, T., Hornbrook, R. S., Hall, S. R., Ullmann, K., Pothier, M. A., Apel, E. C., Permar, W., Hu, L., Hills, A. J., Montzka, D., Tyndall, G., Thornton, J. A., and Fischer, E. V.: Daytime Oxidized Reactive Nitrogen Partitioning in Western U.S. Wildfire Smoke Plumes, J. Geophys. Res.-Atmos., 126, e2020JD033484, https://doi.org/10.1029/2020jd033484, 2021.
Kaiser, J. W., Heil, A., Andreae, M. O., Benedetti, A., Chubarova, N., Jones, L., Morcrette, J.-J., Razinger, M., Schultz, M. G., Suttie, M., and van der Werf, G. R.: Biomass burning emissions estimated with a global fire assimilation system based on observed fire radiative power, Biogeosciences, 9, 527–554, https://doi.org/10.5194/bg-9-527-2012, 2012.
Kaufman, Y. J., Justice, C. O., Flynn, L. P., Kendall, J. D., Prins, E. M., Giglio, L., Ward, D. E., Menzel, W. P., and Setzer, A. W.: Potential global fire monitoring from EOS-MODIS. J. Geophys. Res.-Atmos., 103, 32215–32238, https://doi.org/10.1029/98jd01644, 1998.
Keller, C. A., Long, M. S., Yantosca, R. M., Da Silva, A. M., Pawson, S., and Jacob, D. J.: HEMCO v1.0: a versatile, ESMF-compliant component for calculating emissions in atmospheric models, Geosci. Model Dev., 7, 1409–1417, https://doi.org/10.5194/gmd-7-1409-2014, 2014.
Keller, C. A., Knowland, K. E., Duncan, B. N., Liu, J., Anderson, D. C., Das, S., Lucchesi, R. A., Lundgren, E. W., Nicely, J. M., Nielsen, E., Ott, L. E., Saunders, E., Strode, S. A., Wales, P. A., Jacob, D. J., and Pawson, S.: Description of the NASA GEOS Composition Forecast Modeling System GEOS-CF v1.0, J. Adv. Model. Earth Sy., 13, e2020MS002413, https://doi.org/10.1029/2020MS002413, 2021.
Kim, J., Jeong, U., Ahn, M., Kim, J. H., Park, R. J., Lee, H., Song, C. H., Choi, Y., Lee, K., Yoo, J., Jeong, M., Park, S. K., Lee, K., Song, C., Kim, S., Kim, Y. J., Kim, S., Kim, M., Go, S., Liu, X., Chance, K., Chan Miller, C., Al-Saadi, J., Veihelmann, B., Bhartia, P. K., Torres, O., Abad, G. G., Haffner, D. P., Ko, D. H., Lee, S. H., Woo, J., Chong, H., Park, S. S., Nicks, D., Choi, W. J., Moon, K., Cho, A., Yoon, J., Kim, S., Hong, H., Lee, K., Lee, H., Lee, S., Choi, M., Veefkind, P., Levelt, P. F., Edwards, D. P., Kang, M., Eo, M., Bak, J., Baek, K., Kwon, H., Yang, J., Park, J., Han, K. M., Kim, B., Shin, H., Choi, H., Lee, E., Chong, J., Cha, Y., Koo, J., Irie, H., Hayashida, S., Kasai, Y., Kanaya, Y., Liu, C., Lin, J., Crawford, J. H., Carmichael, G. R., Newchurch, M. J., Lefer, B. L., Herman, J. R., Swap, R. J., Lau, A. K. H., Kurosu, T. P., Jaross, G., Ahlers, B., Dobber, M., McElroy, C. T., and Choi, Y.: New Era of Air Quality Monitoring from Space: Geostationary Environment Monitoring Spectrometer (GEMS) New Era of Air Quality Monitoring from Space: Geostationary Environment Monitoring Spectrometer (GEMS), B. Am. Meteorol. Soc., 101, E1–E22, https://doi.org/10.1175/bams-d-18-0013.1, 2019.
Knowland, K. E., Keller, C. A., and Lucchesi, R.: File Specification for GEOS-CF Product. GMAO Office Note No. 17 (Version 1.1), available at: https://gmao.gsfc.nasa.gov/pubs/docs/Knowland1204.pdf (last access: 26 April 2021), 2020.
Lambert, J. C., Compernolle, S., Eichmann, K.-U., Graaf, M. de, Hubert, D., Keppens, A., Kleipool, Q., Langerock, B., Sha, M. K., Verhoelst, T., Wagner, T., Ahn, C., Argyrouli, A., Balis, D., Chan, K. L., Smedt, I. D., Eskes, H., Fjæraa, A. M., Garane, K., Gleason, J. F., Goutail, F., Granville, J., Hedelt, P., Heue, K.-P., Jaross, G., Koukouli, M. L., Landgraf, J., Lutz, R., Nanda, S., Niemeijer, S., Pazmiño, A., Pinardi, G., Pommereau, J.-P., Richter, A., Rozemeijer, N., Sneep, M., SteinZweers, D., Theys, N., Tilstra, G., Torres, O., Valks, P., van Geffen, J., Vigouroux, C., Wang, P., and Weber, M.: Quarterly Validation Report of the Copernicus Sentinel-5 Precursor Operational Data Products #09: April 2018–November 2020, S5P MPC Routine Operations Consolidated Validation Report series, available at: http://www.tropomi.eu/sites/default/files/files/publicS5P-MPC-IASB-ROCVR-02.0.2-20190411_FINAL.pdf (last access: 26 April 2021), 2020.
Laughner, J. L.: PECANS (Python Editable Chemical Atmospheric Numeric Solver), Zenodo [code], available at: https://doi.org/10.5281/zenodo.3386652, 2019.
Laughner, J. L. and Cohen, R. C.: Direct observation of changing NOx lifetime in North American cities, Science, 366, 723–727, https://doi.org/10.1126/science.aax6832, 2019.
Laughner, J. L., Zhu, Q., and Cohen, R. C.: The Berkeley High Resolution Tropospheric NO2 product, Earth Syst. Sci. Data, 10, 2069–2095, https://doi.org/10.5194/essd-10-2069-2018, 2018.
Lin, J.-T., Liu, M.-Y., Xin, J.-Y., Boersma, K. F., Spurr, R., Martin, R., and Zhang, Q.: Influence of aerosols and surface reflectance on satellite NO2 retrieval: seasonal and spatial characteristics and implications for NOx emission constraints, Atmos. Chem. Phys., 15, 11217–11241, https://doi.org/10.5194/acp-15-11217-2015, 2015.
Lindaas, J., Pollack, I. B., Garofalo, L. A., Pothier, M. A., Farmer, D. K., Kreidenweis, S. M., Campos, T. L., Flocke, F., Weinheimer, A. J., Montzka, D. D., Tyndall, G. S., Palm, B. B., Peng, Q., Thornton, J. A., Permar, W., Wielgasz, C., Hu, L., Ottmar, R. D., Restaino, J. C., Hudak, A. T., Ku, I., Zhou, Y., Sive, B. C., Sullivan, A., Collett, J. L., and Fischer, E. V.: Emissions of Reactive Nitrogen From Western U.S. Wildfires During Summer 2018, J. Geophys. Res.-Atmos., 126, e2020JD032657, https://doi.org/10.1029/2020jd032657, 2021.
Liu, Y., Goodrick, S., and Heilman, W.: Wildland fire emissions, carbon, and climate: Wildfire-climate interactions, Forest Ecol. Manag., 317, 80–96, https://doi.org/10.1016/j.foreco.2013.02.020, 2014.
Liu, F., Beirle, S., Zhang, Q., Dörner, S., He, K., and Wagner, T.: NOx lifetimes and emissions of cities and power plants in polluted background estimated by satellite observations, Atmos. Chem. Phys., 16, 5283–5298, https://doi.org/10.5194/acp-16-5283-2016, 2016.
Liu, X., Huey, L. G., Yokelson, R. J., Selimovic, V., Simpson, I. J., Müller, M., Jimenez, J. L., Campuzano-Jost, P., Beyersdorf, A. J., Blake, D. R., Butterfield, Z., Choi, Y., Crounse, J. D., Day, D. A., Diskin, G. S., Dubey, M. K., Fortner, E., Hanisco, T. F., Hu, W., King, L. E., Kleinman, L., Meinardi, S., Mikoviny, T., Onasch, T. B., Palm, B. B., Peischl, J., Pollack, I. B., Ryerson, T. B., Sachse, G. W., Sedlacek, A. J., Shilling, J. E., Springston, S., Clair, J. St. M., Tanner, D. J., Teng, A. P., Wennberg, P. O., Wisthaler, A., and Wolfe, G. M.: Airborne measurements of western U.S. wildfire emissions: Comparison with prescribed burning and air quality implications, J. Geophys. Res.-Atmos., 122, 6108–6129, https://doi.org/10.1002/2016jd026315, 2017.
Liu, T., Mickley, L. J., Marlier, M. E., DeFries, R. S., Khan, M. F., Latif, M. T., and Karambelas, A.: Diagnosing spatial biases and uncertainties in global fire emissions inventories: Indonesia as regional case study, Remote Sens. Environ., 237, 111557, https://doi.org/10.1016/j.rse.2019.111557, 2020.
Long, M. S., Yantosca, R., Nielsen, J. E., Keller, C. A., da Silva, A., Sulprizio, M. P., Pawson, S., and Jacob, D. J.: Development of a grid-independent GEOS-Chem chemical transport model (v9-02) as an atmospheric chemistry module for Earth system models, Geosci. Model Dev., 8, 595–602, https://doi.org/10.5194/gmd-8-595-2015, 2015.
Lu, Z., Streets, D. G., de Foy, B., Lamsal, L. N., Duncan, B. N., and Xing, J.: Emissions of nitrogen oxides from US urban areas: estimation from Ozone Monitoring Instrument retrievals for 2005–2014, Atmos. Chem. Phys., 15, 10367–10383, https://doi.org/10.5194/acp-15-10367-2015, 2015.
Lyapustin, A. I., Wang, Y., Laszlo, I., Hilker, T., Hall, F. G., Sellers, P. J., Tucker, C. J., and Korkin, S. V.: Multi-angle implementation of atmospheric correction for MODIS (MAIAC): 3. Atmospheric correction, Remote Sens. Environ., 127, 385–393, 2012.
Lyapustin, A. and Wang, Y.: MCD19A2 MODIS/Terra+Aqua Land Aerosol Optical Depth Daily L2G Global 1 km SIN Grid V006 [data set], https://doi.org/10.5067/MODIS/MCD19A2.006, 2018a.
Lyapustin, A., Wang, Y., Korkin, S., and Huang, D.: MODIS Collection 6 MAIAC algorithm, Atmos. Meas. Tech., 11, 5741–5765, https://doi.org/10.5194/amt-11-5741-2018, 2018b.
McMeeking, G. R., Kreidenweis, S. M., Baker, S., Carrico, C. M., Chow, J. C., Collett, J. L., Hao, W. M., Holden, A. S., Kirchstetter, T. W., Malm, W. C., Moosmüller, H., Sullivan, A. P., and Wold, C. E.: Emissions of trace gases and aerosols during the open combustion of biomass in the laboratory, J. Geophys. Res.-Atmos., 114, 1984–2012, https://doi.org/10.1029/2009jd011836, 2009.
Mebust, A. K. and Cohen, R. C.: Space-based observations of fire NOx emission coefficients: a global biome-scale comparison, Atmos. Chem. Phys., 14, 2509–2524, https://doi.org/10.5194/acp-14-2509-2014, 2014.
Mebust, A. K., Russell, A. R., Hudman, R. C., Valin, L. C., and Cohen, R. C.: Characterization of wildfire NOx emissions using MODIS fire radiative power and OMI tropospheric NO2 columns, Atmos. Chem. Phys., 11, 5839–5851, https://doi.org/10.5194/acp-11-5839-2011, 2011.
Nanda, S., de Graaf, M., Veefkind, J. P., ter Linden, M., Sneep, M., de Haan, J., and Levelt, P. F.: A neural network radiative transfer model approach applied to the Tropospheric Monitoring Instrument aerosol height algorithm, Atmos. Meas. Tech., 12, 6619–6634, https://doi.org/10.5194/amt-12-6619-2019, 2019.
Nanda, S., de Graaf, M., Veefkind, J. P., Sneep, M., ter Linden, M., Sun, J., and Levelt, P. F.: A first comparison of TROPOMI aerosol layer height (ALH) to CALIOP data, Atmos. Meas. Tech., 13, 3043–3059, https://doi.org/10.5194/amt-13-3043-2020, 2020.
NASA FIRMS: MODIS Collection 6 Hotspot/Active Fire Detections MCD14ML [data set], https://doi.org/10.5067/FIRMS/MODIS/MCD14ML, 2018a.
NASA FIRMS: NRT VIIRS 375 m Active Fire product VNP14IMGT [data set], https://doi.org/10.5067/FIRMS/VIIRS/VNP14IMGT_NRT.002, 2018b.
NASA GMAO (Global Modeling and Assimilation Office): GEOS Composition Forecast (GEOS-CF) products [data set], available at: https://gmao.gsfc.nasa.gov/weather_prediction/GEOS-CF/data_access/ (last access: 6 October 2021), 2020.
Paugam, R., Wooster, M., Freitas, S., and Val Martin, M.: A review of approaches to estimate wildfire plume injection height within large-scale atmospheric chemical transport models, Atmos. Chem. Phys., 16, 907–925, https://doi.org/10.5194/acp-16-907-2016, 2016.
Peng, Q., Palm, B. B., Melander, K. E., Lee, B. H., Hall, S. R., Ullmann, K., Campos, T., Weinheimer, A. J., Apel, E. C., Hornbrook, R. S., Hills, A. J., Montzka, D. D., Flocke, F., Hu, L., Permar, W., Wielgasz, C., Lindaas, J., Pollack, I. B., Fischer, E. V., Bertram, T. H., and Thornton, J. A.: HONO Emissions from Western U.S. Wildfires Provide Dominant Radical Source in Fresh Wildfire Smoke, Environ. Sci. Technol., 54, 5954–5963, https://doi.org/10.1021/acs.est.0c00126, 2020.
Penner, J. E., Dickinson, R. E., and O'Neill, C. A.: Effects of Aerosol from Biomass Burning on the Global Radiation Budget, Science 256, 1432–1434, https://doi.org/10.1126/science.256.5062.1432, 1992
Petrenko, M., Kahn, R., Chin, M., Soja, A., Kucsera, T., and Harshvardhan: The use of satellite-measured aerosol optical depth to constrain biomass burning emissions source strength in the global model GOCART, J. Geophys. Res., 117, D18212, https://doi.org/10.1029/2012jd017870, 2012.
Richter, A., Burrows, J. P., Nüß, H., Granier, C., and Niemeier, U.: Increase in tropospheric nitrogen dioxide over China observed from space, Nature, 437, 129–132, https://doi.org/10.1038/nature04092, 2005.
Roberts, J. M., Stockwell, C. E., Yokelson, R. J., de Gouw, J., Liu, Y., Selimovic, V., Koss, A. R., Sekimoto, K., Coggon, M. M., Yuan, B., Zarzana, K. J., Brown, S. S., Santin, C., Doerr, S. H., and Warneke, C.: The nitrogen budget of laboratory-simulated western US wildfires during the FIREX 2016 Fire Lab study, Atmos. Chem. Phys., 20, 8807–8826, https://doi.org/10.5194/acp-20-8807-2020, 2020.
Romer Present, P. S., Zare, A., and Cohen, R. C.: The changing role of organic nitrates in the removal and transport of NOx, Atmos. Chem. Phys., 20, 267–279, https://doi.org/10.5194/acp-20-267-2020, 2020.
Russell, A. R., Perring, A. E., Valin, L. C., Bucsela, E. J., Browne, E. C., Wooldridge, P. J., and Cohen, R. C.: A high spatial resolution retrieval of NO2 column densities from OMI: method and evaluation, Atmos. Chem. Phys., 11, 8543–8554, https://doi.org/10.5194/acp-11-8543-2011, 2011.
Schreier, S. F., Richter, A., Schepaschenko, D., Shvidenko, A., Hilboll, A., and Burrows, J. P.: Differences in satellite-derived NOx emission factors between Eurasian and North American boreal forest fires, Atmos. Environ., 121, 55–65, https://doi.org/10.1016/j.atmosenv.2014.08.071, 2015.
Schroeder, W., Oliva, P., Giglio, L., and Csiszar, I. A.: The New VIIRS 375 m active fire detection data product: Algorithm description and initial assessment, Remote Sens. Environ., 143, 85–96, https://doi.org/10.1016/j.rse.2013.12.008, 2014.
Tack, F., Merlaud, A., Iordache, M.-D., Pinardi, G., Dimitropoulou, E., Eskes, H., Bomans, B., Veefkind, P., and Van Roozendael, M.: Assessment of the TROPOMI tropospheric NO2 product based on airborne APEX observations, Atmos. Meas. Tech., 14, 615–646, https://doi.org/10.5194/amt-14-615-2021, 2021.
Tereszchuk, K. A., Moore, D. P., Harrison, J. J., Boone, C. D., Park, M., Remedios, J. J., Randel, W. J., and Bernath, P. F.: Observations of peroxyacetyl nitrate (PAN) in the upper troposphere by the Atmospheric Chemistry Experiment-Fourier Transform Spectrometer (ACE-FTS), Atmos. Chem. Phys., 13, 5601–5613, https://doi.org/10.5194/acp-13-5601-2013, 2013.
Theys, N., Volkamer, R., Müller, J.-F., Zarzana, K. J., Kille, N., Clarisse, L., Smedt, I. D., Lerot, C., Finkenzeller, H., Hendrick, F., Koenig, T. K., Lee, C.F., Knote, C., Yu, H., and Roozendael, M. V.: Global nitrous acid emissions and levels of regional oxidants enhanced by wildfires, Nat. Geosci., 13, 681–686, https://doi.org/10.1038/s41561-020-0637-7, 2020.
Valin, L. C., Russell, A. R., Hudman, R. C., and Cohen, R. C.: Effects of model resolution on the interpretation of satellite NO2 observations, Atmos. Chem. Phys., 11, 11647–11655, https://doi.org/10.5194/acp-11-11647-2011, 2011.
Valin, L. C., Russell, A. R., and Cohen, R. C.: Variations of OH radical in an urban plume inferred from NO2 column measurements, Geophys. Res. Lett., 40, 1856–1860, https://doi.org/10.1002/grl.50267, 2013.
Valin, L. C., Russell, A. R., and Cohen, R. C.: Chemical feedback effects on the spatial patterns of the NOx weekend effect: a sensitivity analysis, Atmos. Chem. Phys., 14, 1–9, https://doi.org/10.5194/acp-14-1-2014, 2014.
Val Martin, M., Logan, J. A., Kahn, R. A., Leung, F.-Y., Nelson, D. L., and Diner, D. J.: Smoke injection heights from fires in North America: analysis of 5 years of satellite observations, Atmos. Chem. Phys., 10, 1491–1510, https://doi.org/10.5194/acp-10-1491-2010, 2010.
van der Werf, G. R., Randerson, J. T., Giglio, L., van Leeuwen, T. T., Chen, Y., Rogers, B. M., Mu, M., van Marle, M. J. E., Morton, D. C., Collatz, G. J., Yokelson, R. J., and Kasibhatla, P. S.: Global fire emissions estimates during 1997–2016, Earth Syst. Sci. Data, 9, 697–720, https://doi.org/10.5194/essd-9-697-2017, 2017.
van Geffen, J. H. G. M., Eskes, H. J., Boersma, K. F., Maasakkers, J. D., and Veefkind, J. P.: TROPOMI ATBD of the total and tropospheric NO2 data products (issue 1.4.0), Royal Netherlands Meteorological Institute (KNMI), De Bilt, the Netherlands, 2019.
van Geffen, J., Boersma, K. F., Eskes, H., Sneep, M., ter Linden, M., Zara, M., and Veefkind, J. P.: S5P TROPOMI NO2 slant column retrieval: method, stability, uncertainties and comparisons with OMI, Atmos. Meas. Tech., 13, 1315–1335, https://doi.org/10.5194/amt-13-1315-2020, 2020.
Veefkind, J. P., Aben, I., McMullan, K., Förster, H., Vries, J. de, Otter, G., Claas, J., Eskes, H. J., de Haan, J. F., Kleipool, Q., Weele, M. van, Hasekamp, O., Hoogeveen, R., Landgraf, J., Snel, R., Tol, P., Ingmann, P., Voors, R., Kruizinga, B., Vink, R., Visser, H., and Levelt, P. F.: TROPOMI on the ESA Sentinel-5 Precursor: A GMES mission for global observations of the atmospheric composition for climate, air quality and ozone layer applications, Remote Sens. Environ., 120, 70–83, https://doi.org/10.1016/j.rse.2011.09.027, 2012.
Verhoelst, T., Compernolle, S., Pinardi, G., Lambert, J.-C., Eskes, H. J., Eichmann, K.-U., Fjæraa, A. M., Granville, J., Niemeijer, S., Cede, A., Tiefengraber, M., Hendrick, F., Pazmiño, A., Bais, A., Bazureau, A., Boersma, K. F., Bognar, K., Dehn, A., Donner, S., Elokhov, A., Gebetsberger, M., Goutail, F., Grutter de la Mora, M., Gruzdev, A., Gratsea, M., Hansen, G. H., Irie, H., Jepsen, N., Kanaya, Y., Karagkiozidis, D., Kivi, R., Kreher, K., Levelt, P. F., Liu, C., Müller, M., Navarro Comas, M., Piters, A. J. M., Pommereau, J.-P., Portafaix, T., Prados-Roman, C., Puentedura, O., Querel, R., Remmers, J., Richter, A., Rimmer, J., Rivera Cárdenas, C., Saavedra de Miguel, L., Sinyakov, V. P., Stremme, W., Strong, K., Van Roozendael, M., Veefkind, J. P., Wagner, T., Wittrock, F., Yela González, M., and Zehner, C.: Ground-based validation of the Copernicus Sentinel-5P TROPOMI NO2 measurements with the NDACC ZSL-DOAS, MAX-DOAS and Pandonia global networks, Atmos. Meas. Tech., 14, 481–510, https://doi.org/10.5194/amt-14-481-2021, 2021.
Vermote, E., Ellicott, E., Dubovik, O., Lapyonok, T., Chin, M., Giglio, L., and Roberts, G. J.: An approach to estimate global biomass burning emissions of organic and black carbon from MODIS fire radiative power, J. Geophys. Res.-Atmos., 114, 1984–2012, https://doi.org/10.1029/2008jd011188, 2009.
Wiedinmyer, C., Akagi, S. K., Yokelson, R. J., Emmons, L. K., Al-Saadi, J. A., Orlando, J. J., and Soja, A. J.: The Fire INventory from NCAR (FINN): a high resolution global model to estimate the emissions from open burning, Geosci. Model Dev., 4, 625–641, https://doi.org/10.5194/gmd-4-625-2011, 2011.
Wiggins, E. B., Soja, A. J., Gargulinski, E., Halliday, H. S., Pierce, R. B., Schmidt, C. C., Nowak, J. B., DiGangi, J. P., Diskin, G. S., Katich, J. M., Perring, A. E., Schwarz, J. P., Anderson, B. E., Chen, G., Crosbie, E. C., Jordan, C., Robinson, C. E., Sanchez, K. J., Shingler, T. J., Shook, M., Thornhill, K. L., Winstead, E. L., Ziemba, L. D., and Moore, R. H.: High Temporal Resolution Satellite Observations of Fire Radiative Power Reveal Link Between Fire Behavior and Aerosol and Gas Emissions, Geophys. Res. Lett., 47, e2020GL090707, https://doi.org/10.1029/2020gl090707, 2020.
Williams, J. E., Boersma, K. F., Le Sager, P., and Verstraeten, W. W.: The high-resolution version of TM5-MP for optimized satellite retrievals: description and validation, Geosci. Model Dev., 10, 721–750, https://doi.org/10.5194/gmd-10-721-2017, 2017.
Wooster, M. J., Roberts, G., Perry, G. L. W., and Kaufman, Y. J.: Retrieval of biomass combustion rates and totals from fire radiative power observations: FRP derivation and calibration relationships between biomass consumption and fire radiative energy release, J. Geophy. Res., 110, D24311, https://doi.org/10.1029/2005jd006318, 2005.
Yokelson, R. J., Urbanski, S. P., Atlas, E. L., Toohey, D. W., Alvarado, E. C., Crounse, J. D., Wennberg, P. O., Fisher, M. E., Wold, C. E., Campos, T. L., Adachi, K., Buseck, P. R., and Hao, W. M.: Emissions from forest fires near Mexico City, Atmos. Chem. Phys., 7, 5569–5584, https://doi.org/10.5194/acp-7-5569-2007, 2007.