the Creative Commons Attribution 4.0 License.
the Creative Commons Attribution 4.0 License.
 | 15 Oct 2021
OMI-observed HCHO in Shanghai, China, during 2010–2019 and ozone sensitivity inferred by an improved HCHO ∕ NO2 ratio
Danran Li
Shanshan Wang
Ruibin Xue
Sanbao Zhang
Zhibin Sun
Bin Zhou
In recent years, satellite remote sensing has been increasingly used in the long-term observation of ozone (O3) precursors and its formation regime. In this work, formaldehyde (HCHO) data from Ozone Monitoring Instrument (OMI) were used to analyze the temporal and spatial distribution of HCHO vertical column densities (VCDs) in Shanghai from 2010 to 2019. HCHO VCDs exhibited the highest value in summer and the lowest in winter, the high VCD being concentrated in western Shanghai. Temperature largely influences HCHO by affecting the biogenic emissions and photochemical reactions, and industry was the major anthropogenic source. The satellite-observed formaldehyde-to-nitrogen dioxide ratio (FNRSAT) reflects that the O3 formation regime had significant seasonal characteristics and gradually manifested as a transitional ozone formation regime dominating in Shanghai. The uneven distribution in space was mainly reflected in the higher FNRSAT and surface O3 concentration in suburban areas. To compensate for the shortcoming of FNRSAT that it can only characterize O3 formation around satellite overpass time, correction of FNRSAT was implemented with hourly surface FNR and O3 data. After correction, the O3 formation regime showed the trend moving towards being VOC-limited in both time and space, and the regime indicated by FNRSAT can better reflect O3 formation for a day. This study can help us better understand HCHO characteristics and O3 formation regimes in Shanghai and also provide a method to improve FNRSAT for characterizing O3 formation in a day, which will be significant for developing O3 prevention and control strategies.
- Article
(5856 KB) - Full-text XML
-
Supplement
(452 KB) - BibTeX
- EndNote


Formaldehyde (HCHO) is an important trace gas in the atmosphere. It has an irritating effect on human eyes, skin, and respiratory mucosa and can also cause cancer in high concentration (Zhu et al., 2017a; R. Liu et al., 2018). Atmospheric HCHO is an intermediate product of almost all volatile organic compound (VOC) oxidation, it can be therefore indicative of the overall VOC level (Chan et al., 2019). HCHO can also be emitted through anthropogenic sources, biogenic sources, and biomass combustion. Anthropogenic sources like transportation, power, industry, and residential emissions increase the amount of HCHO by emitting VOCs into the atmosphere (Wang et al., 2017). In addition, biogenic volatile organic compounds (BVOCs) are also important sources of HCHO. Isoprene emitted by plants can be oxidized to generate HCHO, which causes the concentration of HCHO in some lush vegetation areas to be largely affected by emission of BVOCs (Millet et al., 2008). The removal of HCHO is mainly through photolysis, reaction with OH radicals, and the deposition (Ling et al., 2016; Xing et al., 2020).
Satellite remote sensing can achieve large-scale observation of atmospheric pollutant gases including HCHO, which has been widely used in recent years. Sensors currently available for HCHO observation include the Global Ozone Monitoring Experiment (GOME) on ERS-2 (Burrows et al., 1999; Martin et al., 2004b); Scanning Imaging Absorption Spectrometer for Atmospheric Chartography (SCIAMACHY) on ENVISAT (Bovensmann et al., 1999; Stavrakou et al., 2009); Ozone Monitoring Instrument (OMI) on Aura (Levelt et al., 2006; Zhu et al., 2017b); GOME-2 A, B, and C on METOP as the successor of GOME (Callies et al., 2000; De Smedt et al., 2012); Ozone Mapping and Profiler Suite (OMPS) on Suomi-NPP (Su et al., 2019); and Tropospheric Monitoring Instrument (TROPOMI) on Sentinel-5P (Veefkind et al., 2012; Vigouroux et al., 2020). OMI can provide daily data of HCHO with higher spatial resolution (13 km×24 km). As part of a new generation of sensors, TROPOMI was launched in 2017, and it has better spatial resolution (7 km×7 km) but lacks long-term observations so far. It would be an advantageous tool of satellite remote sensing to achieve more detailed analysis in the future (Veefkind et al., 2012).
Previous studies reported satellite-observed long-term and large-scale distribution and variation of HCHO in China and all over the world (Millet et al., 2008; Zhu et al., 2017a; Liu et al., 2020). The 12-year multi-satellite observations (OMI, GOME-2, SCIAMACHY) showed that the trend of HCHO vertical column densities (VCDs) over eastern China is consistent with that of anthropogenic VOCs (Shen et al., 2019). Based on 10-year observations of OMI HCHO, R. Liu et al. (2018) indicated that high HCHO VCDs in tropical forest regions are greatly affected by biomass burning and meteorological factors including temperature and precipitation. In addition, the ground-based remote sensing can also be available for HCHO observation, such as multi-axis differential optical absorption spectroscopy (MAX-DOAS) measurement. The vertical distribution of HCHO derived from MAX-DOAS measurement was characterized by the higher HCHO concentrated near the surface (Lee et al., 2015; Chan et al., 2019). By employing the box model, X. Li et al. (2014) found that isoprene oxidation initiated by OH radicals has a great contribution to the HCHO formation in semi-rural regions of the Pearl River Delta (PRD) in China.
HCHO participates in the complex photochemical reaction of NOx () and directly affects the production of O3 in troposphere. Due to the short lifetime of HCHO and NO2, their spatial distributions were greatly affected by local emission of VOCs and NOx, which received widespread attention as precursors of tropospheric O3 (Zaveri et al., 2003; Chan et al., 2019). Consequently, HCHO and NO2 can be assumed to be indicators of VOCs and NOx, and the ratio of formaldehyde to nitrogen dioxide (HCHO NO2, FNR) can be an indicator to analyze the O3 formation regime (Sillman, 1995; Martin et al., 2004a; Schroeder et al., 2017). For instance, by using FNR from long-term OMI HCHO and NO2 data, O3 sensitivity of the United States was evaluated. A O3 formation regime can be designated as VOC-limited for FNR<1, NOx-limited for FNR>2, and transitional for , which serves as the transitional regime between VOC-limited and NOx-limited regimes, indicating the production of O3 can be changed by both VOC and NOx (Duncan et al., 2010). In view of China, OMI products over three representative regions (North China Plain (NCP), the Yangtze River Delta (YRD), and the PRD) were investigated, revealing that the O3 formation regime varied in both time and space, and the contribution of emission sectors to precursors changed with the type of regimes (Jin and Holloway, 2015). During special events such as the Asia–Pacific Economic Cooperation in 2014 and Grand Military Parade in 2015, FNR in Beijing had become higher compared with previous periods, and the O3 formation regime shifted toward a NOx-limited regime with control strategies (Liu et al., 2016).
In this study, OMI satellite data were used to investigate the temporal and spatial distribution characteristics of atmospheric HCHO in Shanghai from 2010 to 2019, combined with meteorological data and emission inventories to analyze the influencing factors. FNR calculated by satellite HCHO and NO2 were applied to capture variations of the O3 formation regime in Shanghai over the past decade. Considering that satellite data only reflect the column density of trace gases around overpass time, hourly surface FNR and O3 concentration increments were proposed to correct the satellite FNR, so that it can better indicate O3 formation in the daytime.
2.1 Satellite data
OMI on Aura orbits the earth in about 98 min, which can achieve full coverage of the earth in one day. It overpasses at 13:45 LT each day. The scanning width is 2600 km and is divided into 60 rows. The sensor contains three channels, including UV-1, UV-2, and VIS, with a wavelength coverage of 264–504 nm. This band allows a variety of trace gases to be observed, e.g., HCHO, NO2, and SO2 (Zhang et al., 2019). The retrieval algorithm of this product is based on nonlinear least-squares fitting which get slant column density (SCD) as the result. Then SCD can be converted to VCD through air mass factors (AMFs). The Level-2 OMI HCHO product OMHCHO Version 3 is used in this study (https://doi.org/10.5067/Aura/OMI/DATA2015, Chance, 2007). Since atmospheric HCHO is mainly distributed in the troposphere, the total VCD can be regarded as the tropospheric VCD of HCHO (Duncan et al., 2010). The Level-2 OMI NO2 product OMNO2.003 Version 4 is adopted for tropospheric NO2 VCD in this study (https://doi.org/10.5067/Aura/OMI/DATA2017, Krotkov et al., 2019).
2.2 Methodology
In this study, Shanghai and surrounding areas were gridded into to a spatial resolution of . Then pixels falling within a 24 km radius of the grid center were averaged and were further assigned to that grid (Fioletov et al., 2011; McLinden et al., 2012; Zhu et al., 2014). In order to remove data with poor quality as much as possible, HCHO data with cloud fraction ≤30 %, solar zenith angle ≤70∘, and main data quality flag=0 were selected in this study. In addition, the quality of pixel data with large size is poor, so 5 marginal pixels on each side were abandoned, and only pixel data within 6–55 were selected (Zhu et al., 2017a; Xue et al., 2020). Because OMI has experienced a row anomaly since 2007, Xtrack quality flags=0 was required to eliminate the influence of poor-quality data affected by the row anomaly (http://projects.knmi.nl/omi/research/product/rowanomaly-background, last access: 24 December 2019). As HCHO satellite data have large errors, fitting root mean square (RMS) ≤0.003 was limited to remove most outliers (Souri et al., 2017). The selection of NO2 satellite data was basically the same as that of HCHO, but without fitting RMS parameter filtering, and cloud radiance fraction ≤30 % was required (Krotkov et al., 2016; Xue et al., 2020). Moreover, the linear regressions of monthly deseasonalized zonal mean HCHO VCDs with 0.5∘ latitude steps over remote pacific region (29–33∘ N, 160–140∘ W) indicated that the OMI HCHO product used in this study does not show obvious drift (Zhu et al., 2017b).
2.3 Auxiliary data
The meteorological data, including monthly temperature, sunshine hours, precipitation, and relative humidity, are acquired from the National Bureau of Statistics of China (http://www.stats.gov.cn/, last access: 3 October 2021). The anthropogenic sources of HCHO in Shanghai are calculated based on the Multi-resolution Emission Inventory for China (MEIC, http://www.meicmodel.org/, last access: 3 October 2021) (Li et al., 2017; Zheng et al., 2018). Surface HCHO and NO2 concentrations were measured by long-path differential optical absorption spectroscopy (LP-DOAS) at the Jiangwan campus of Fudan University in Shanghai (31.34∘ N, 121.52∘ E). The O3 data of Qingpu Dianshan Lake Site (31.09∘ N, 120.98∘ E) and Hongkou Site (31.30∘ N, 121.47∘ E) in Shanghai are obtained from the Shanghai Environmental Monitoring Center (http://www.semc.com.cn/aqi/Home/Index, last access: 3 October 2021).
3.1 The temporal and spatial variation of HCHO
HCHO VCDs for annual, monthly, and seasonal variations in Shanghai from 2010 to 2019 are shown in Fig. 1. HCHO VCDs decreased from the highest value of 12.78×10¹⁵ in 2010 to the lowest value of 10.37×10¹⁵ in 2012, then rebounded from 2012 to 2014, and fluctuated slightly in the following years (Fig. 1a). The column value and variation are similar to previous study in the YRD, China (Zhang et al., 2019). Before 2018, the high VCD was concentrated in June to August with about 15×1015 to 20×1015 , the low VCD appeared in January to February and November to December with about 3×10¹⁵ to 9×10¹⁵ , and VCDs were comparable in the remaining months (Fig. 1b). In addition, the amplitude of monthly HCHO VCDs was relatively smaller in 2018 and 2019 and mainly concentrated from 6×10¹⁵ to 15×1015 . The HCHO VCDs varied with the season, with the maxima and minima corresponding to the respective summer (June, July, and August) and winter (December, January, and February) and moderate levels in spring (March, April, and May) and autumn (September, October, and November) (Fig. 1c). Previous MAX-DOAS and OMI observations also exhibited the same seasonal patterns of HCHO in the YRD, China (Jin and Holloway, 2015; Chan et al., 2019). High temperature and abundant radiation are conducive to the plant growth to produce BVOCs and the photochemical reaction of VOCs, which boost the HCHO formation in summer (Sharkey and Loreto, 1993; Duncan et al., 2009; Narumi et al., 2009). Thus, HCHO VCDs would be relatively low in winter under the opposite weather conditions.
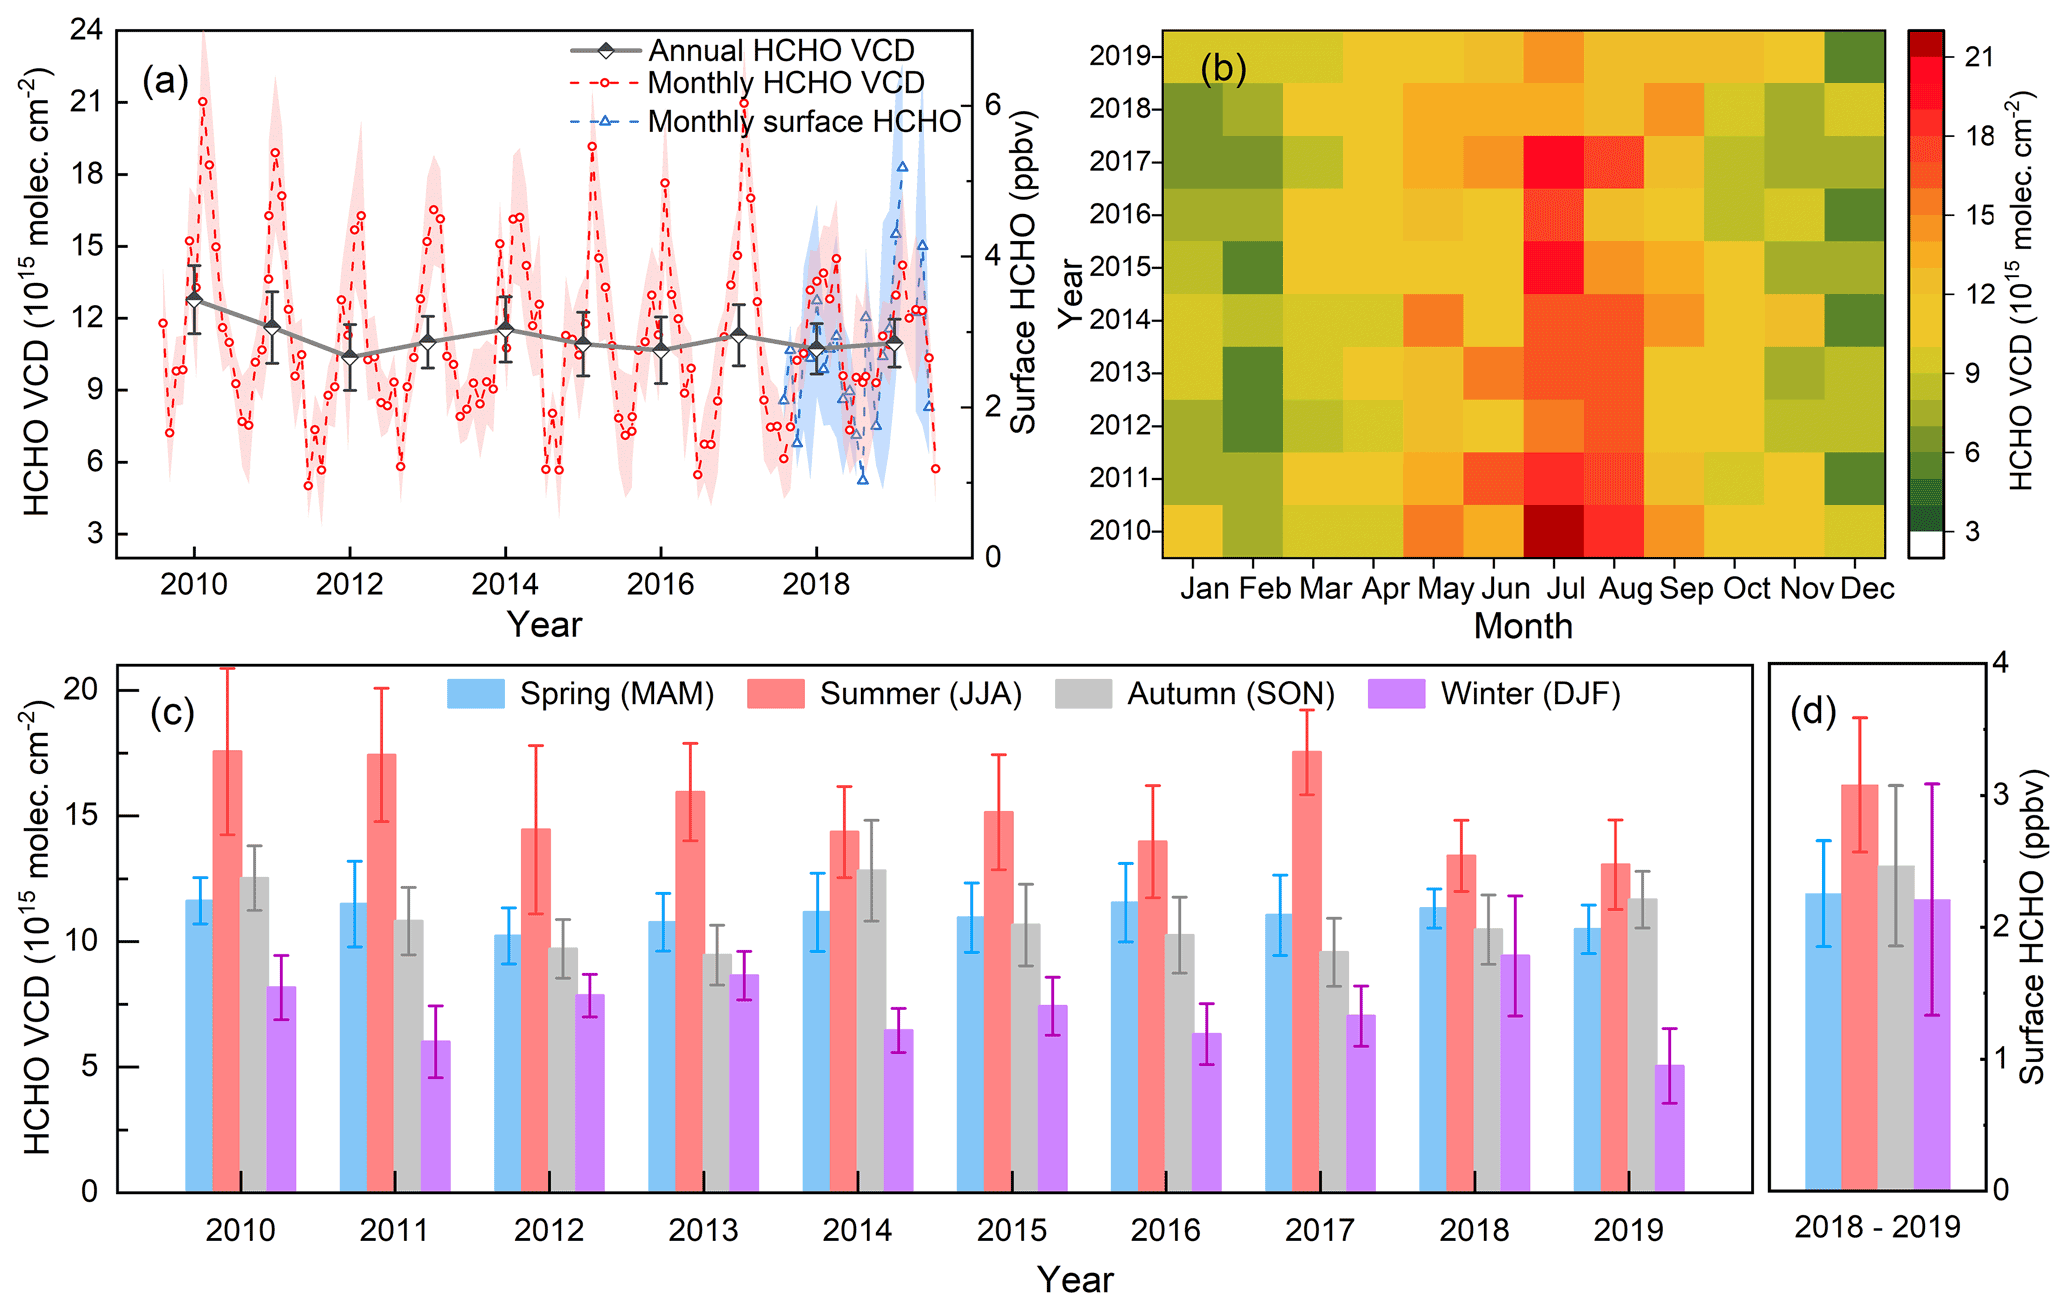
Figure 1OMI- and LP-DOAS-observed time series of HCHO in Shanghai. Panels (a–c) reflect the annual, monthly, and seasonal variations of HCHO VCD during 2010–2019, and (d) reflects the seasonal variation of surface HCHO during 2018–2019.
The HCHO VCDs within 10 km of the LP-DOAS measurement site were averaged to compare with the surface HCHO between 13:00 and 14:00 LT (Fig. S1 in the Supplement). This shows that HCHO VCDs and surface HCHO concentrations are not very consistent, as HCHO is not completely concentrated near the ground but has a high concentration at higher altitudes (Chan et al., 2019; Wang et al., 2019). Spatial heterogeneity of surface HCHO in the horizontal can also impact the consistency of the comparison. However, the surface HCHO observed by LP-DOAS shows the same seasonal characteristics as HCHO VCDs (Fig. 1d).
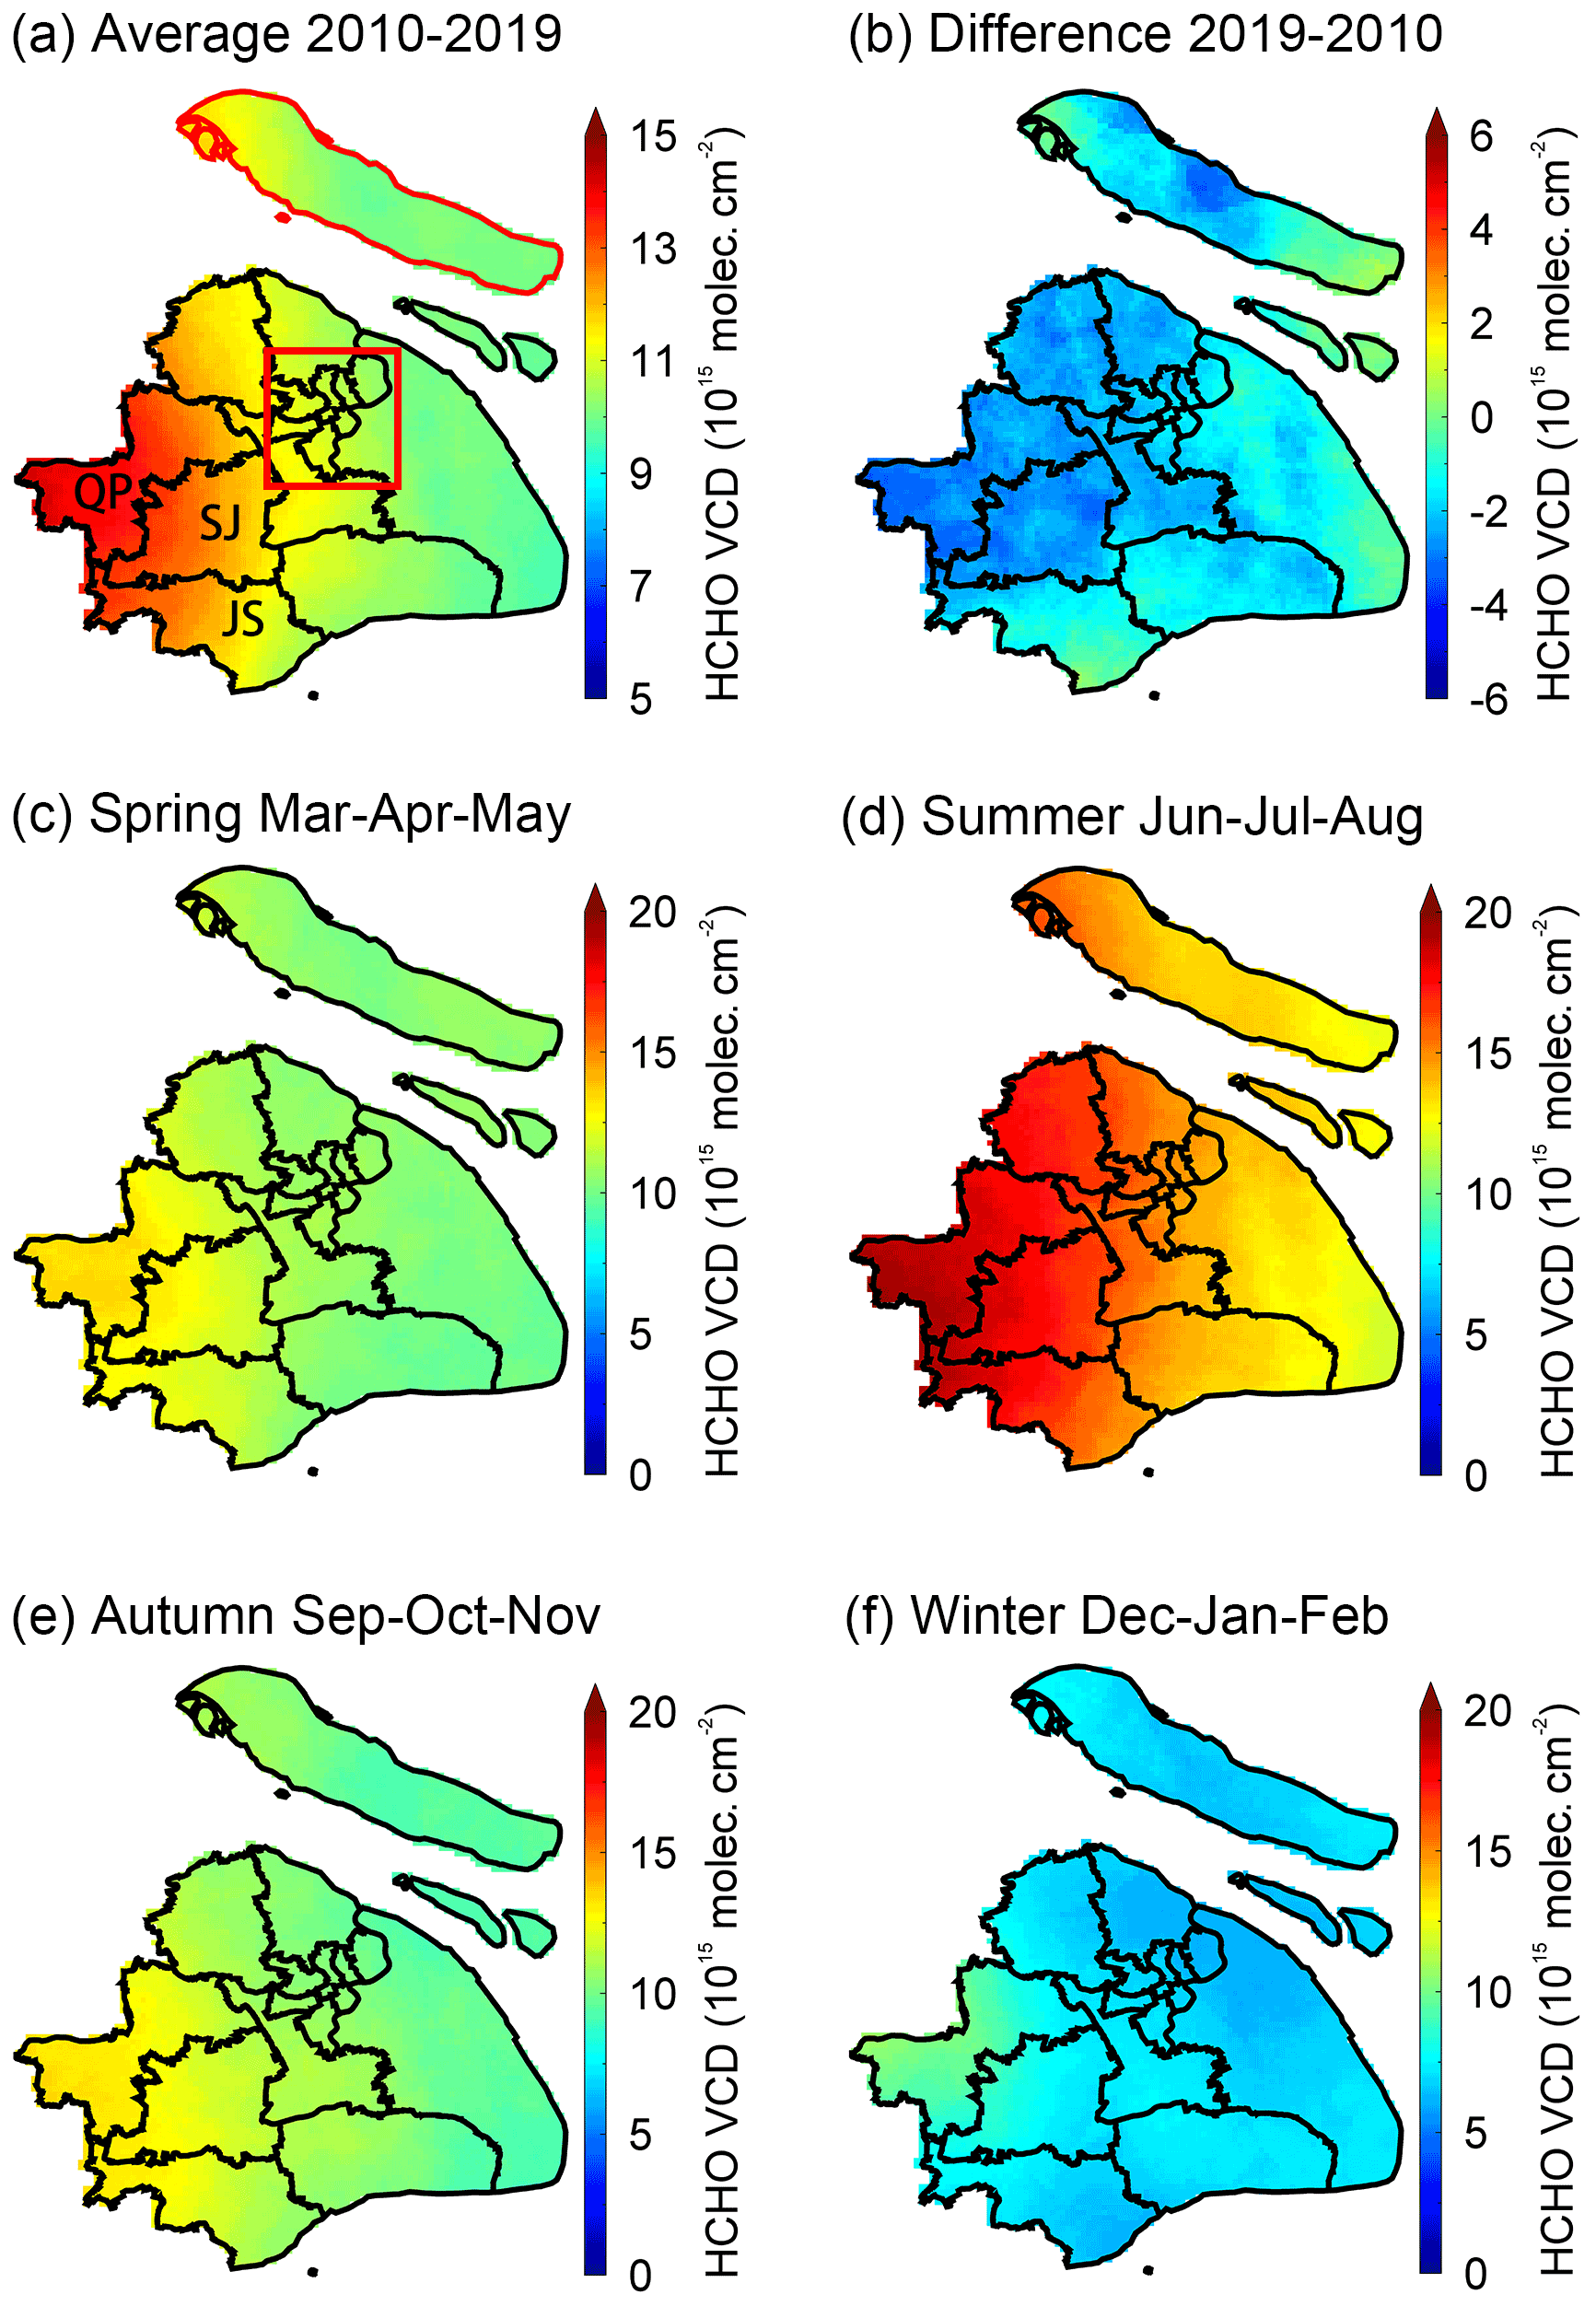
Figure 2Spatial distribution of HCHO VCDs in Shanghai: (a) average HCHO VCD for 10 years, (b) the difference of HCHO VCDs between 2019 and 2010 (2019 minus 2010), and (c–f) for different seasons. In (a) the city center is marked with a red box; Chongming Island is displayed with a red boundary. QP, SJ, and JS refer to Qingpu, Songjiang, and Jinshan districts.
The spatial distribution of 10-year-averaged HCHO VCD was given in Fig. 2a. In general, HCHO VCDs in the eastern coastal area were relatively low, with the level of about 10×1015 , while those in western regions adjacent to other provinces were relatively higher, about 13×1015 . Note that areas with the highest HCHO VCD in Shanghai did not appear in the city center (marked by the red box) but in the relatively remote Qingpu (QP) district, followed by Songjiang (SJ) and Jinshan (JS) district. Compared to the anthropogenic non-methane volatile organic compound (NMVOC) emissions, the distribution of HCHO VCDs does not show the same spatial pattern (An et al., 2021). The high HCHO in western Shanghai was frequently observed and may be explained by the transport of air masses containing high concentrations of reactive VOCs, sometimes from Zhejiang and Jiangsu provinces, and the significant contribution of local biogenic isoprene to HCHO (Su et al., 2019; Zhang et al., 2020, 2021).
Figure 2b shows the difference of HCHO VCDs between 2019 and 2010. It suggests that except for the eastern and southern coastal areas, as well as the eastern area of Chongming Island, HCHO VCDs in Shanghai showed an overall downward trend during the past 10 years, with western regions experiencing the largest decline. Figure 2c to f display the spatial distribution of HCHO VCDs in different seasons. HCHO VCD in summer was basically above 12×1015 . In winter, the value was around 7×10¹⁵ for most regions except for Qingpu district, while in spring and autumn, it was at the moderate level of about 10×1015 . The spatial distribution of HCHO VCDs in different seasons was similar to the 10-year-averaged characteristics of high values in the west and low values in the east.
3.2 Influencing factors
The relationship between monthly HCHO VCDs and meteorological variables including temperature, sunshine hours, precipitation, and relative humidity were analyzed via the linear regression. The stepwise regression results show that only temperature correlated with HCHO VCDs significantly among these four meteorological factors. The linear regression of temperature contribution and HCHO VCD was shown in Fig. 3. The temperature contribution has a good correlation with the observed HCHO VCD (R2=0.73), which means that temperature can explain about 73 % of the variation of HCHO VCD. The remaining part that cannot be explained by temperature appears in the form of a residual, which is considered as the influence of other changing factors such as anthropogenic emissions (K. Li et al., 2019). The residual in summer in some years would be particularly large, which indicates that, in addition to temperature, there are other factors affecting HCHO VCD significantly.
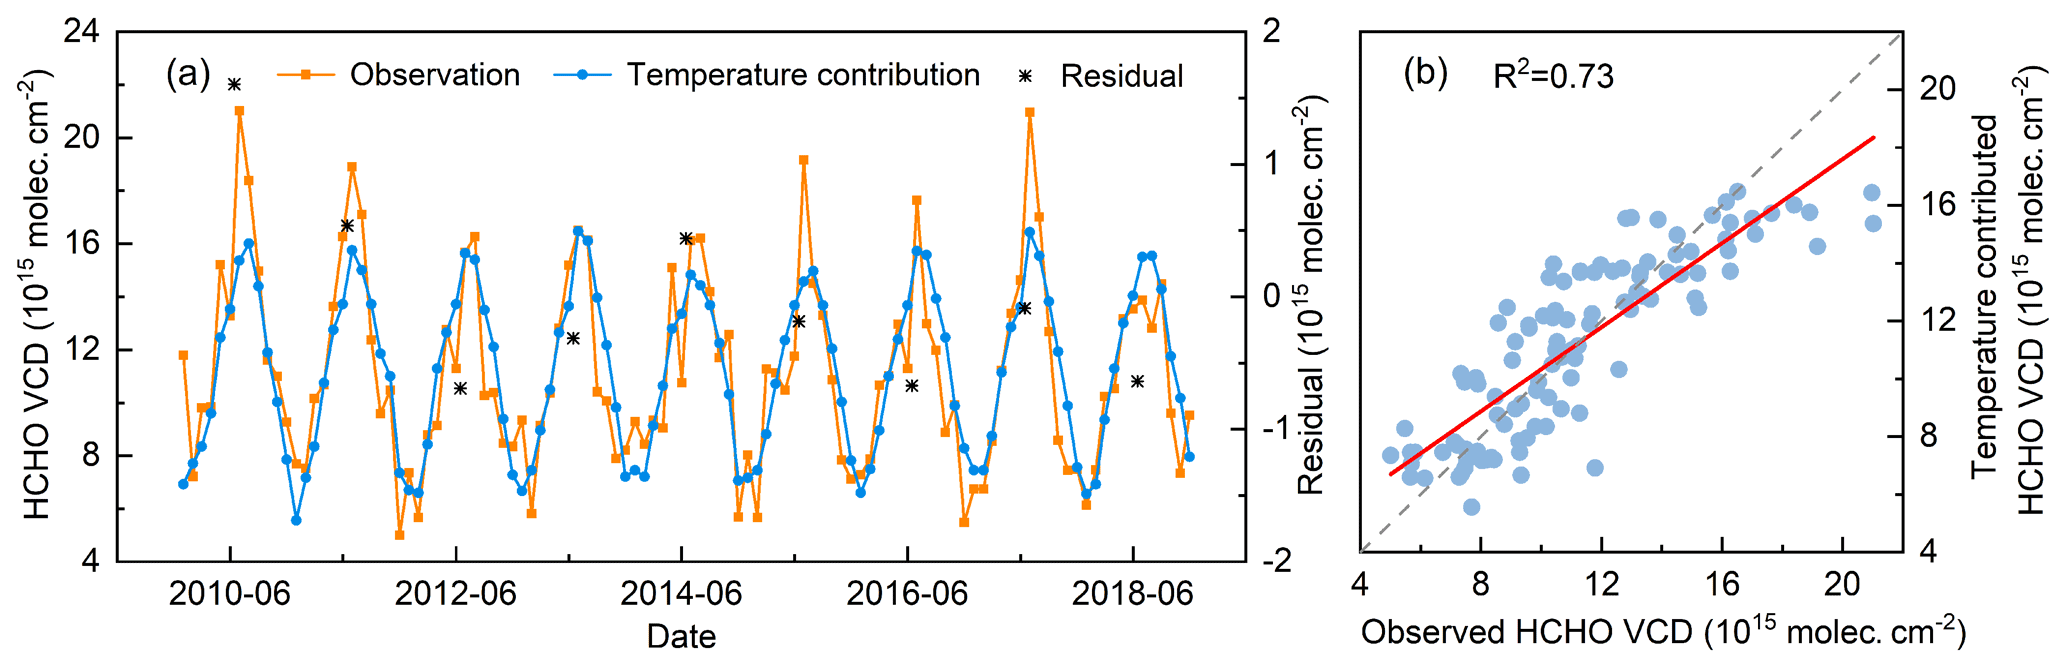
Figure 3Monthly HCHO VCDs and the temperature contribution in Shanghai during 2010–2018. Panel (a) reflects the temporal variations, and (b) illustrates the correlation analysis. The black points represent the annual average residuals.
The precipitation and relative humidity reached a peak in June, when the sunshine hours were significantly low, and HCHO VCD declined as the temperature rose (Fig. S2 in the Supplement). Shanghai has a subtropical monsoon climate with rain and heat in the same period. Abundant precipitation largely favored the wet deposition of HCHO and offset the impact of rising temperature, resulting in a small decrease in HCHO VCDs in June (Pang et al., 2009). The result of Fisher's exact test also illustrates that when the relative humidity changes remarkably, the variation of HCHO VCDs in summer would be significantly affected (P<0.05).
To explore the impacts of anthropogenic sources on HCHO abundance, primary emissions and secondary productions of HCHO from anthropogenic sources were estimated. NMVOC emissions from MEIC v.1.3 grid inventories for the year 2010, 2012, 2014, and 2016 were mapped to SAPRC07 mechanism species (M. Li et al., 2014, 2019). Primary HCHO was directly obtained from the inventory, and secondary HCHO production was calculated based on 1 d HCHO yields of several NMVOCs under high-NOx conditions (Table S1 in the Supplement) (Shen et al., 2019).
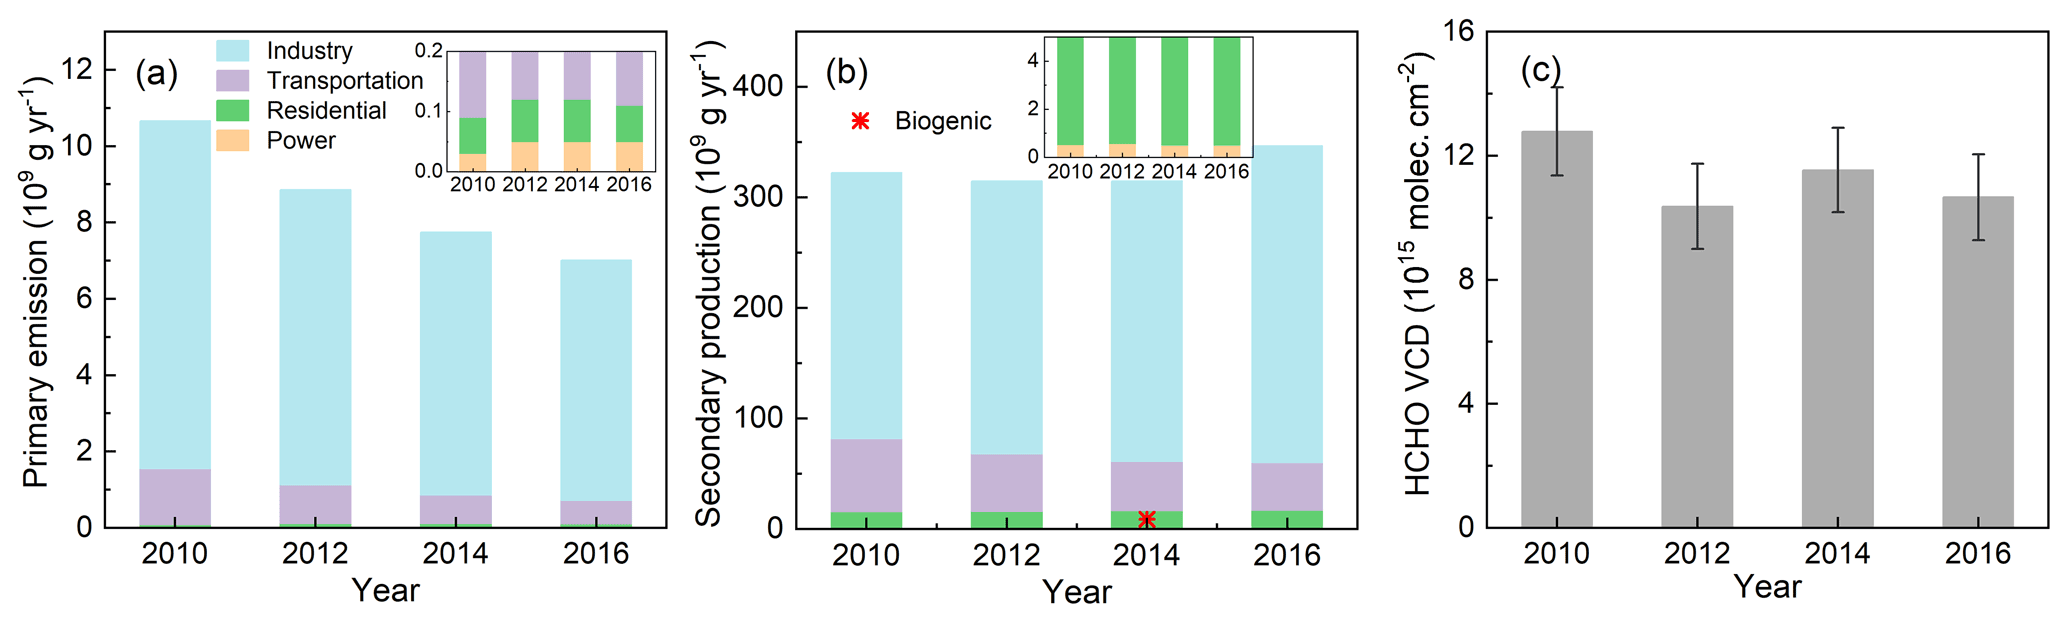
Figure 4Primary and estimated secondary production of HCHO from anthropogenic NMVOCs. The biogenic contribution of HCHO in 2014 was marked as a red cross in (b).
In Fig. 4a and b, for the total of primary emissions and secondary productions, the contribution of the industrial sector was much higher than other sectors, accounting for about 79.3 % of the total, followed by transportation sector, accounting for about 15.7 %. Residential and power sectors were far lower; the proportions over these years were less than 5 %. In the major sectors, the contribution of industry increased by 17.2 %, while the contribution of transportation decreased by about 35.2 %. The primary emission of HCHO keeps decreasing (about 34.2 % compared to 2010), while secondary produced HCHO did not change significantly. Furthermore, the changes and proportional relationships between primary emission and secondary production of HCHO for these sectors are different, which means the VOC source profile of different emission sectors would affect the amount of secondary HCHO production. It should be noted that the estimation here is the potential of secondary HCHO production from anthropogenic NMVOCs and does not represent those actually produced in the atmosphere.
In addition, HCHO produced by biogenic sources in 2014 was also calculated, and the BVOC emissions were referred from Liu et al. (2018a, b). HCHO yield from BVOC emission was about 9.07×10⁹ g, which is much smaller compared with the anthropogenic contribution, indicating that anthropogenic activity is the main contributor of secondary production of HCHO in Shanghai (Shen et al., 2019; Fan et al., 2021). The spatial distribution of surface land types in Shanghai (Fig. S3 in the Supplement) also suggest less emission and contribution of biogenic sources in urbanized and densely populated area compared to forested regions.
Figure 4c shows that the annual trend of HCHO VCDs is not synchronized with that of primary or secondary HCHO. It means that, besides the combined effect of the primary and secondary source, the changes of HCHO VCDs should also be affected complexly by various factors. In addition, it should be noted that HCHO yield from VOCs is proportional to NOx conditions (Palmer et al., 2006; Marais et al., 2012; Miller et al., 2017). Within the context of the continuous NOx decreases in Shanghai, the estimation using a fixed HCHO yield may overestimate secondary HCHO production in later years (Xue et al., 2020). However, the NOx concentration in Shanghai (about 30–60 ppbv in urban areas) is still much higher than the high-NOx conditions (1 ppbv) defined in previous studies (Gao et al., 2017). Therefore, in such a high-NOx conditions, the effect of NOx decreases on HCHO yield needs to be further studied.
3.3 FNR and O3 formation regime
As the important precursors of O3, HCHO, and NO2 can be served as indicators for VOCs and NOx. On this basis, the HCHO NO2 ratio from satellite observation (FNRSAT) can be employed to identify the O3 formation regime. The variations of monthly averaged VCDs of HCHO, NO2, and FNRSAT in Shanghai over the past 10 years are given in Fig. 5. NO2 VCDs were featured by the highest in winter and the lowest in summer, which was opposite to HCHO and fluctuated more fiercely. The peaks were mainly on account of its longer lifetime in winter (Zhang et al., 2007), while in summer, the adequate sunlight and precipitation accelerated the photochemical removal and wet deposition of NO2, resulting in the dip (Wang et al., 2018; Xue et al., 2020). FNRSAT also exhibited the obvious annual cycle of high in summer and low in winter. According to the criteria proposed by Duncan et al. (2010), the O3 formation regime in Shanghai was usually NOx-limited from June to August and controlled by a VOC-limited and transitional regime for the rest of the months. From May to September in 2014, Shanghai was under a NOx-limited regime, and FNRSAT reached the highest value over the past 10 years. In 2019, the value of monthly FNRSAT fluctuated gently, which showed the trend moving towards the transitional regime threshold of 1–2.
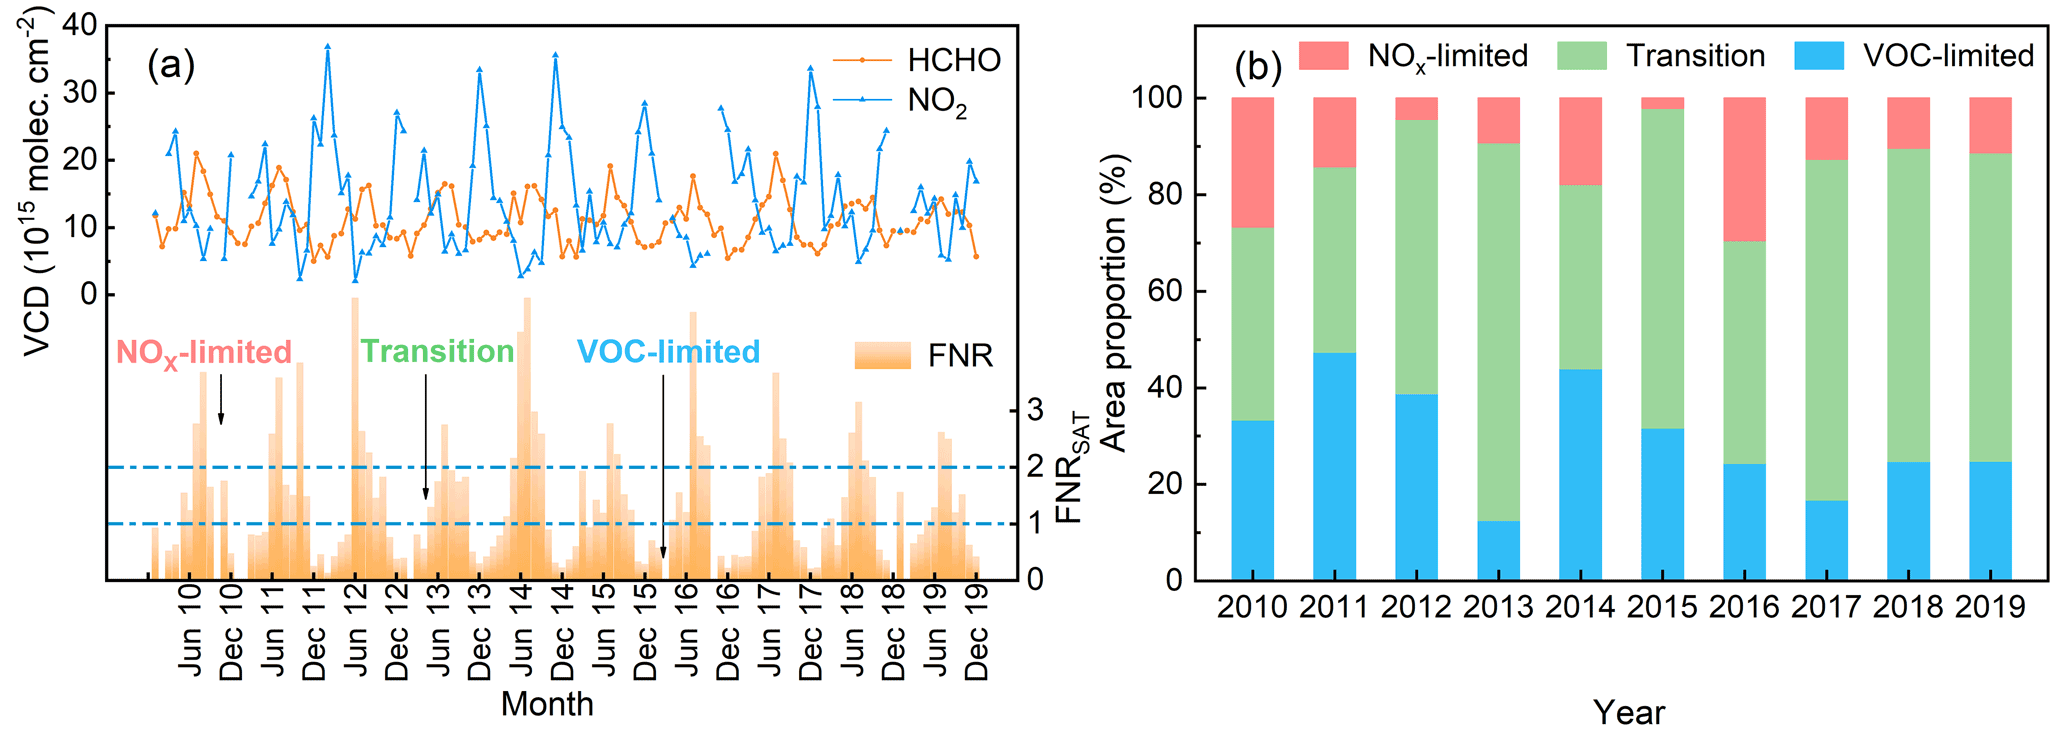
Figure 5Temporal and spatial variation of FNRSAT in Shanghai: (a) variations of HCHO, NO2, and FNRSAT from 2010 to 2019, and (b) the area proportion for different O3 formation regimes in these years.
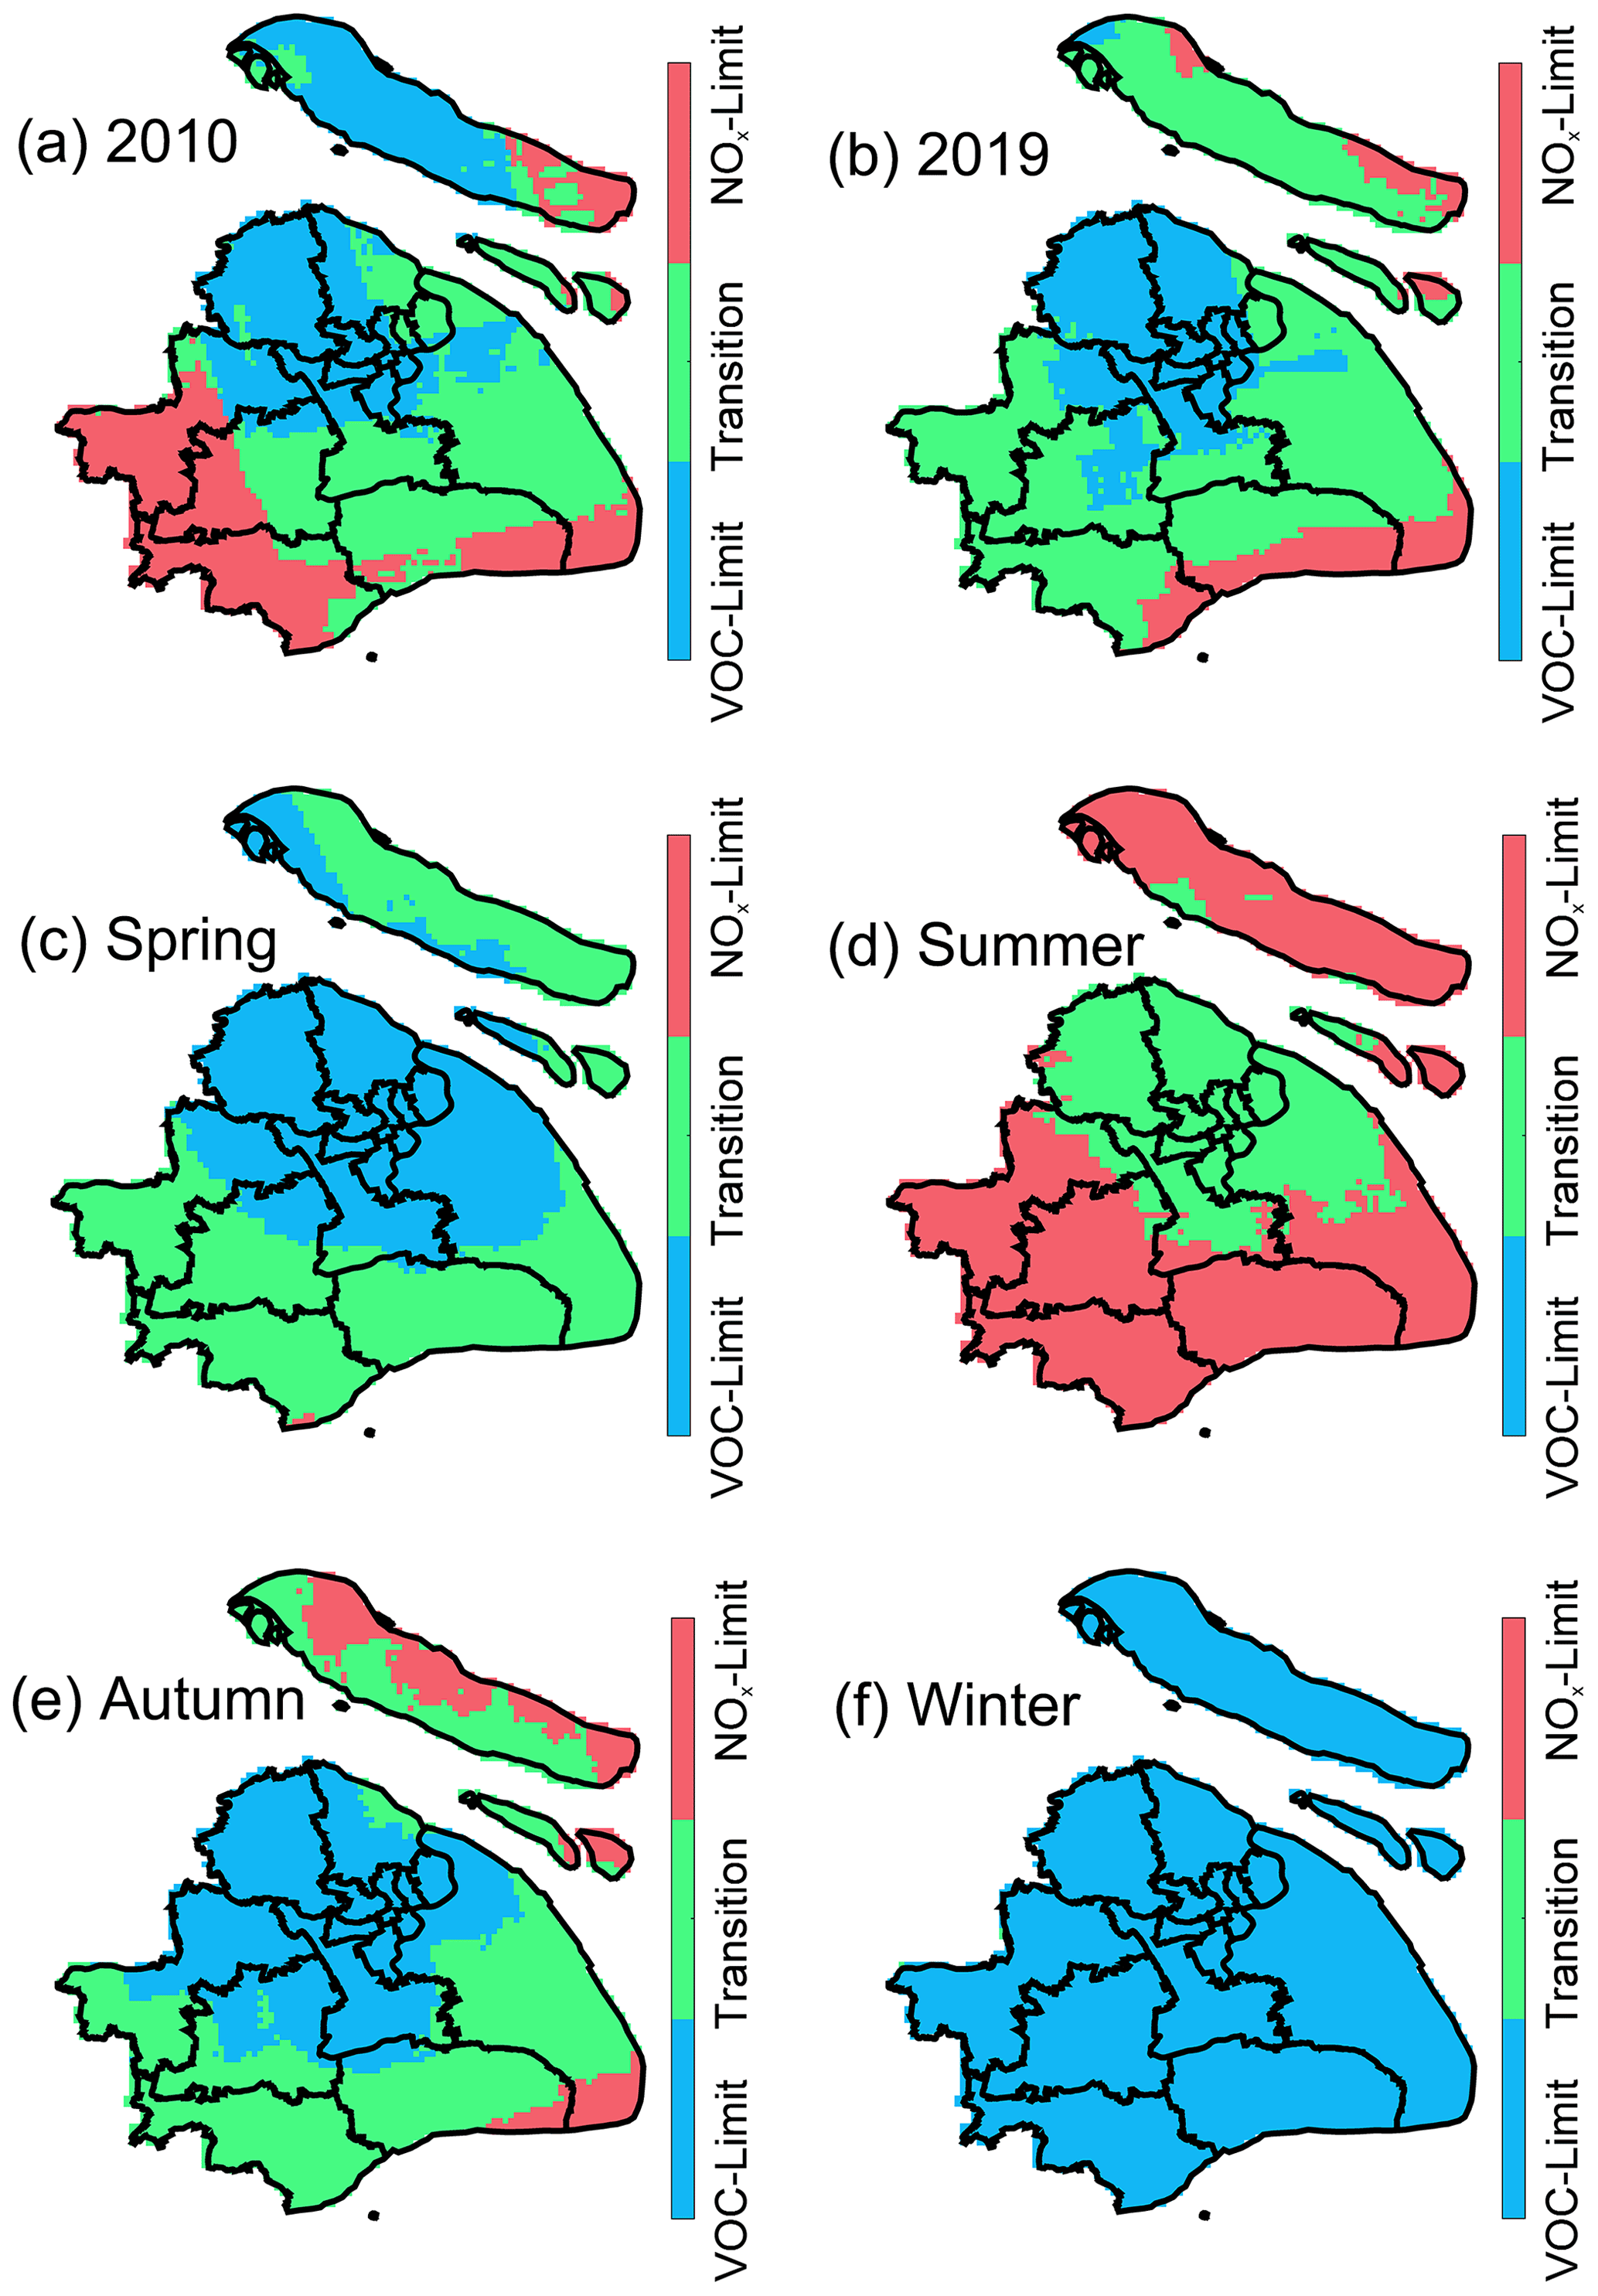
Figure 6The spatial distribution of FNRSAT for (a) 2010, (b) 2019, and (c–f) different seasons in Shanghai.
The spatial distribution of FNRSAT in Shanghai is presented in Fig. 6. Comparing FNRSAT in 2019 with that in 2010, the NOx-limited regime in the western Shanghai transformed into a transitional regime, and a VOC-limited regime on the northern Chongming Island almost completely became a transitional regime. It manifests itself in the reduction in the NOx-limited and VOC-limited regimes with the increase in the transitional regime. Referring to previous study on the variation of NO2 VCDs spatial distribution in Shanghai observed by satellite, this phenomenon may be related to the spatial characteristics of concentration variations of two precursors (Xue et al., 2020). This result is also reflected in Fig. 5b. In the past 10 years, the proportion decreased from 33.4 % to 24.9 % for VOC-limited areas, and from 26.7 % to 11.3 % for NOx-limited areas. Meanwhile, the transitional regime area increased from 40.0 % to 63.8 %. Xu et al. (2019) suggested that the O3 formation regime in Shanghai trends to transform from a VOC-limited regime to a NOx-limited regime after 2020 through WRF-Chem model simulation. In this study, the increase in the transitional regime may be the transition state from a VOC-limited to a NOx-limited regime.
Figure 6c to f show the spatial distribution of FNRSAT for different seasons during the decade. In spring, the northern area of Shanghai was VOC-limited regime while the southern area had a transitional regime. From spring to summer, the VOC-limited area almost transformed into having a transitional regime, and the transitional regime nearly turned NOx-limited at the same time, which was mainly caused by the increase in HCHO and the decrease in NO2. The distribution in autumn was similar to that in spring. In winter, Shanghai was basically under a VOC-limited regime. In the light of the temporal and spatial distribution of O3 formation regime inferred by FNRSAT, the emission reduction measures for the O3 precursors would be more rational.
As well as this, there are differences in the O3 formation regime in urban and suburban areas of Shanghai, with the main manifestation being that the central urban area was inclined to be in a VOC-limited regime and the suburban area was more likely to be in a NOx-limited regime. In order to analyze the differences in more detail, an area within 10 km around the Jiangwan campus of Fudan University was selected to represent the urban area (about 12 km to the city center), and an equally sized area around Dianshan Lake (31.09∘ N, 120.98∘ E) of Qingpu district was regarded as the suburban area (about 50 km to the city center). Since O3 pollution is relatively serious from April to September, this period was chosen as a research case. The maximum 8 h average concentrations of O3 at the Hongkou and the Qingpu Dianshan Lake Site were used to characterize O3 concentrations in urban and suburban areas. NO2 VCDs in the urban area were higher than those in the suburban area, while HCHO VCDs presented the opposite character (Fig. 7a). The lower NO2 in the suburban area was associated with less NOx emission than that in the urban area, corresponding to the larger FNRSAT. From Fig. 7b, the O3 production was under a transitional regime in the urban area, while a NOx-limited regime occupied for most years in the suburban area. The O3 concentration in the suburban area was always higher than that in the urban (Fig. 7c). In this study, high concentrations of NOx in the urban area may lead to titration of O3 by NO, which would cause the lower O3 concentration in the urban area (Geng et al., 2008; Duncan et al., 2010).
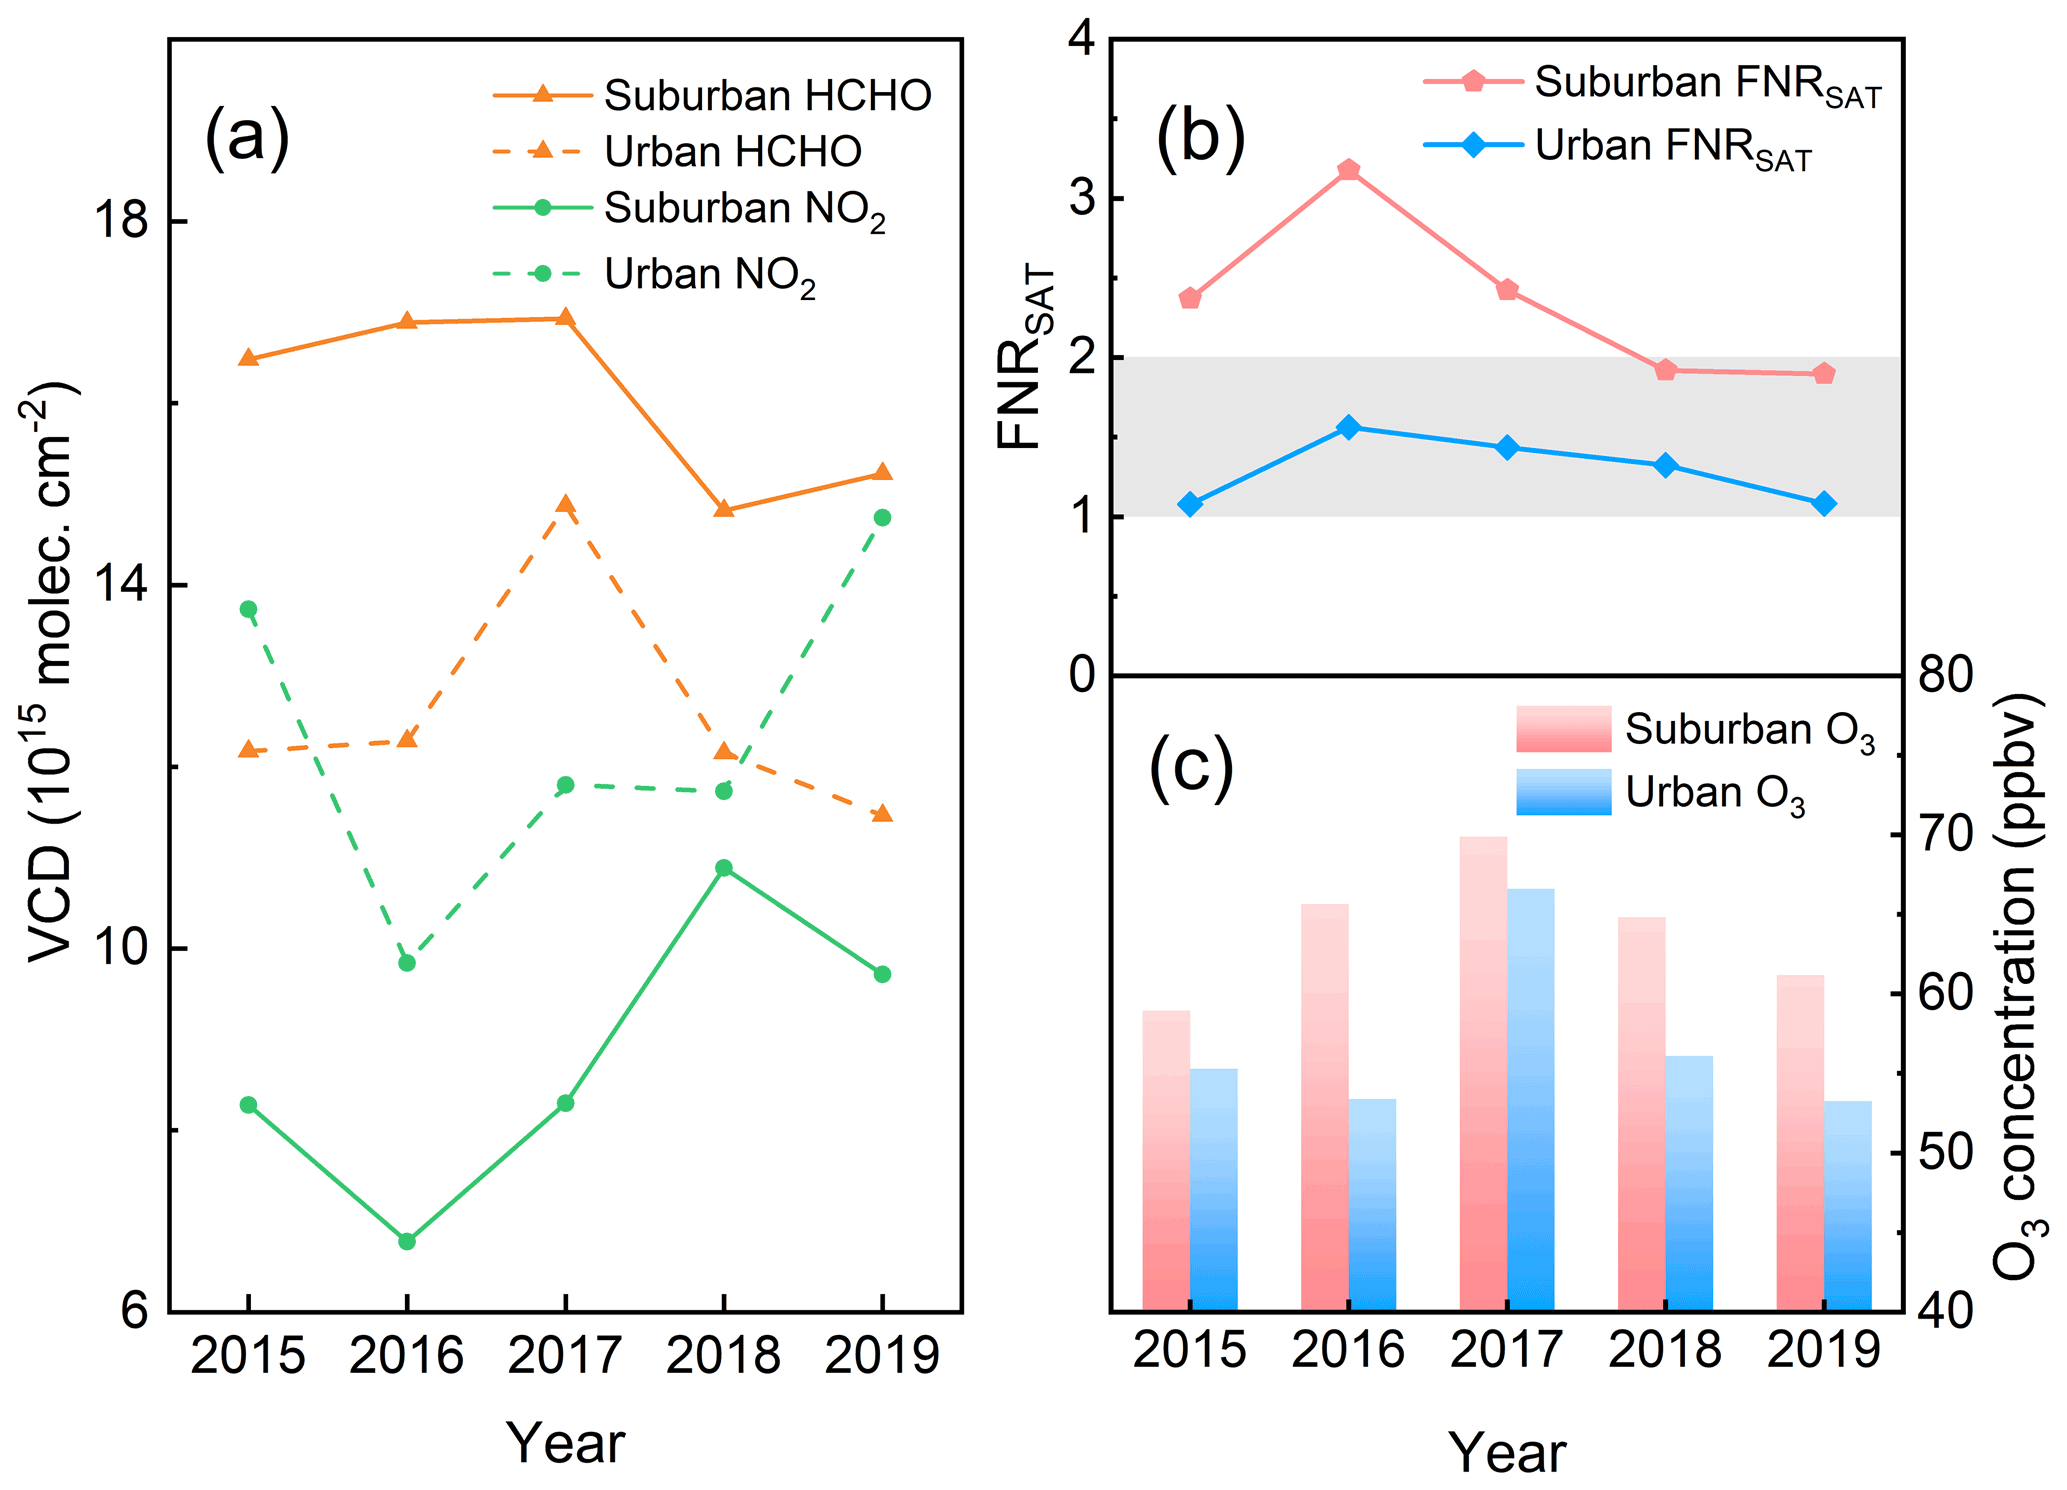
Figure 7Differences of (a) satellite observation of HCHO and NO2 VCDs, (b) FNRSAT, and (c) surface O3 concentration in urban and suburban areas of Shanghai from 2015 to 2019.
3.4 Correction of FNRSAT
FNR was originally proposed as an indicator to characterize the sensitivity of the instantaneous O3 production rate (Duncan et al., 2010). Satellite observation only reflects the averaged column of the trace gases around overpass time, so the FNRSAT may not accurately infer the surface O3 formation regime during the day (Duncan et al., 2010; Jin and Holloway, 2015; Jin et al., 2017). FNRSAT was compared with FNRLP at the satellite overpass time on the monthly and daily scales. Results show that FNRSAT and FNRLP were consistent well on a monthly scale (R2=0.95, between April and August), but they were quite different on the daily scale, and the relationship was easily affected by the boundary layer height (BLH) and other factors (Schroeder et al., 2017).
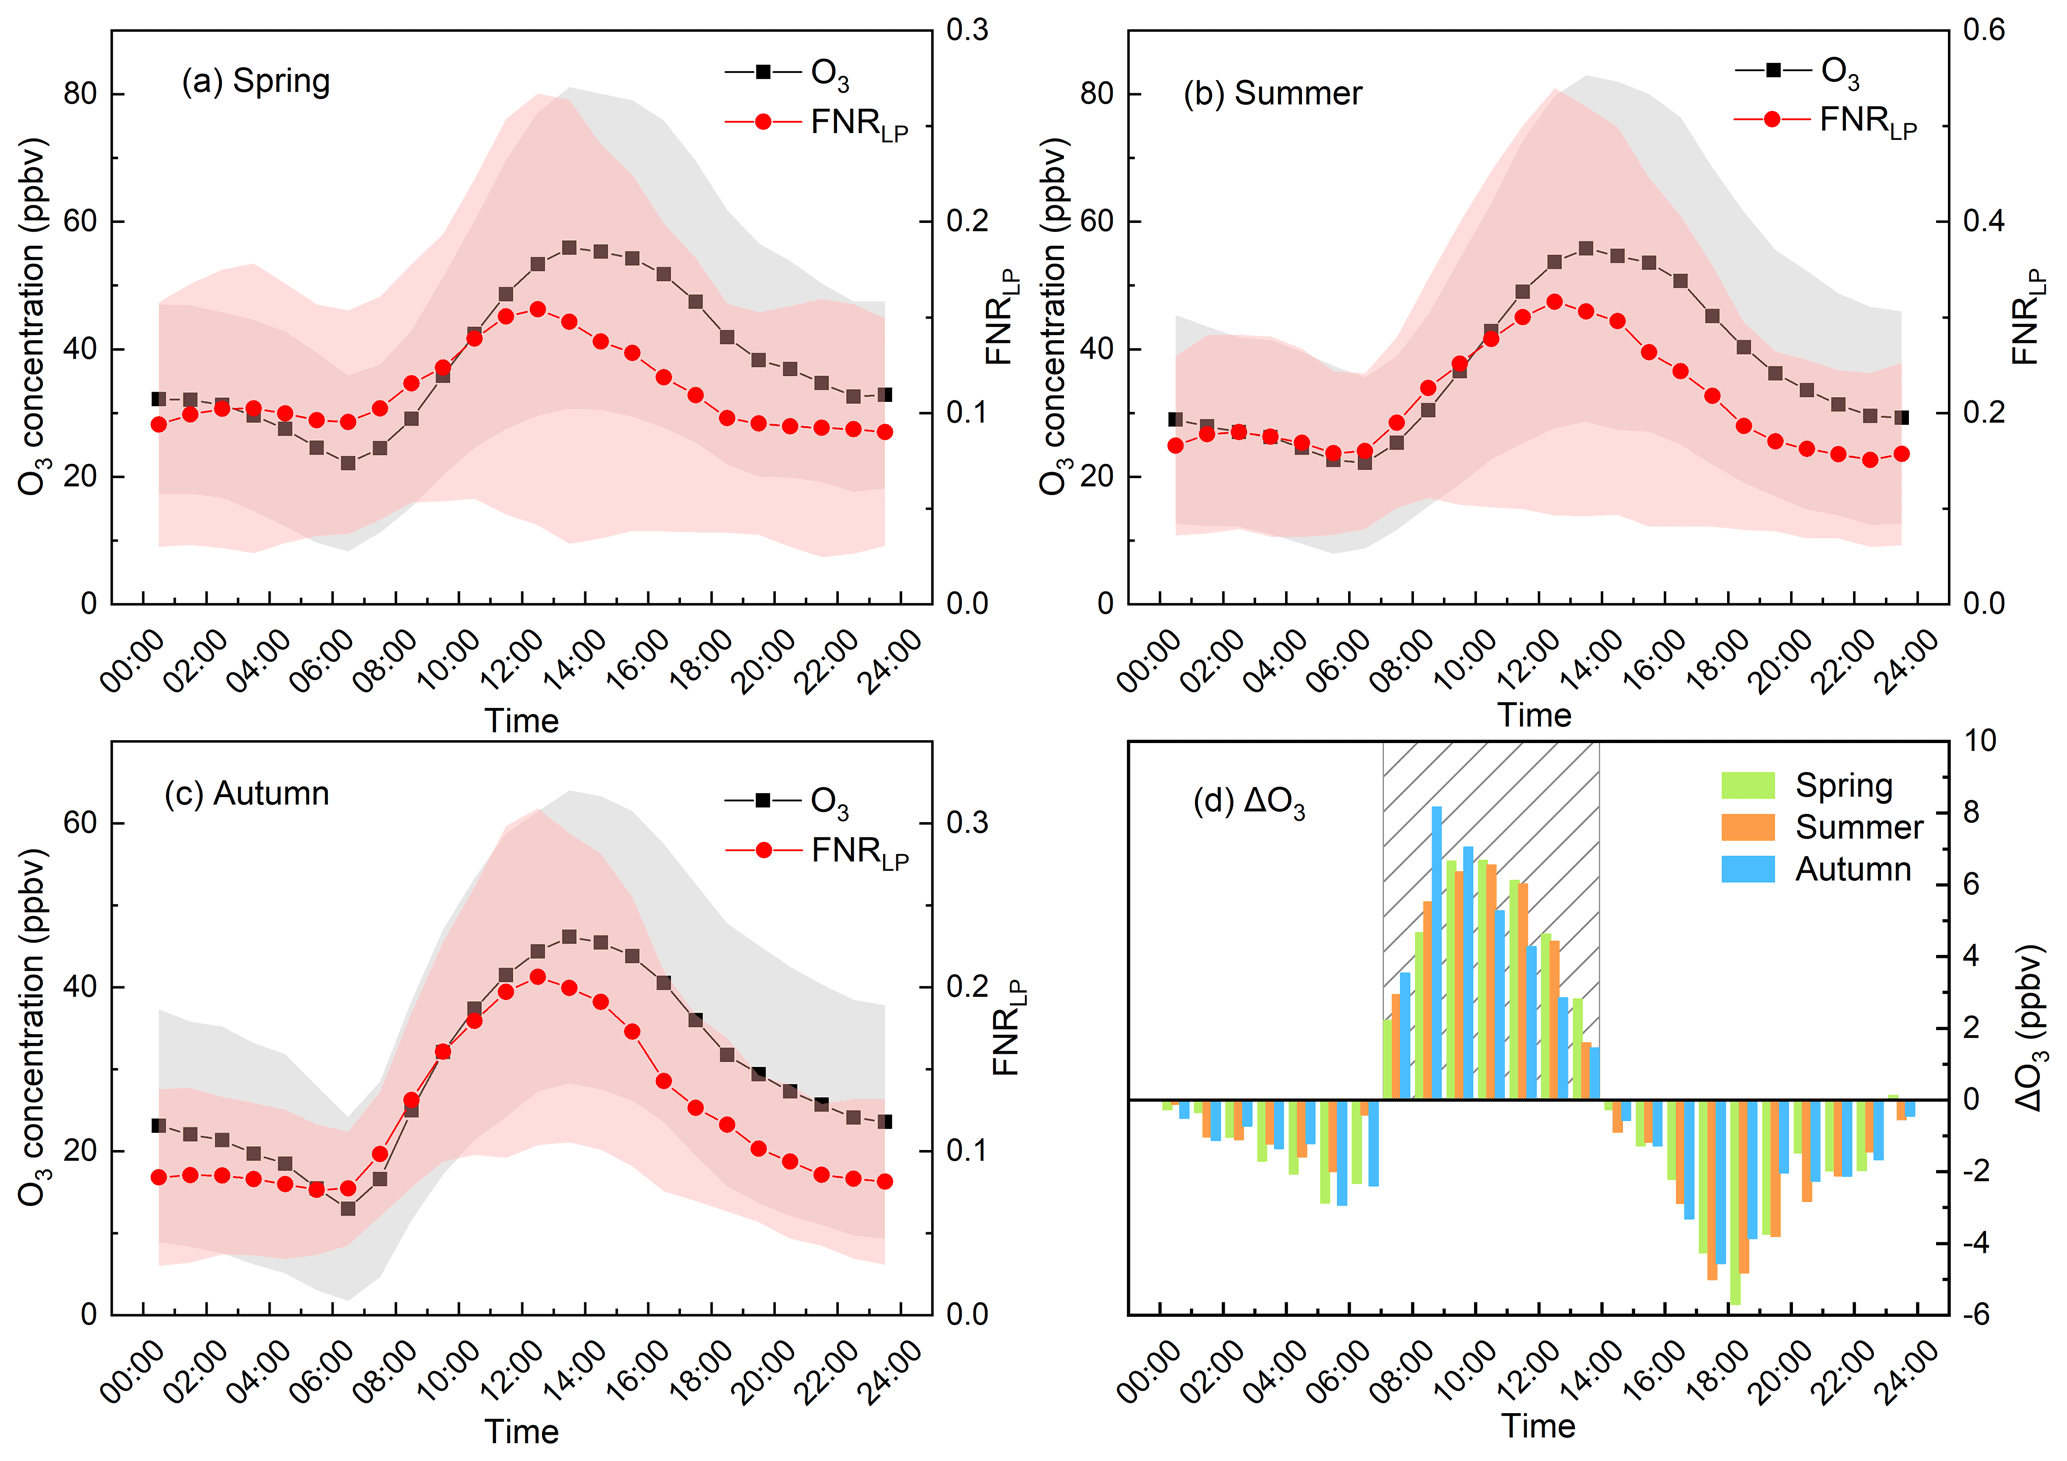
Figure 8Diurnal variations of FNRLP, O3, and ΔO3 for spring, summer, and autumn during 2018–2019. ΔO3 represents increment of hourly O3 concentration, as referred to in Eq. (3). The shaded area in (d) represents the period when ΔO3 greater than 0.
As shown in Fig. 8a to c, LP-DOAS observation provided FNRLP with a high temporal resolution throughout the day, and FNRLP was in good agreement with hourly O3 concentrations. It means that FNRLP should be a good indicator to distinguish the formation regime of surface O3 on a detailed timescale. In addition, the highest value of FNRLP at noon means that FNRSAT at overpass time is approximately close to the highest level in a day. Thus, it would be valuable to introduce the time series of FNRLP to make FNRSAT better reflect the characteristics of O3 formation during the daytime.
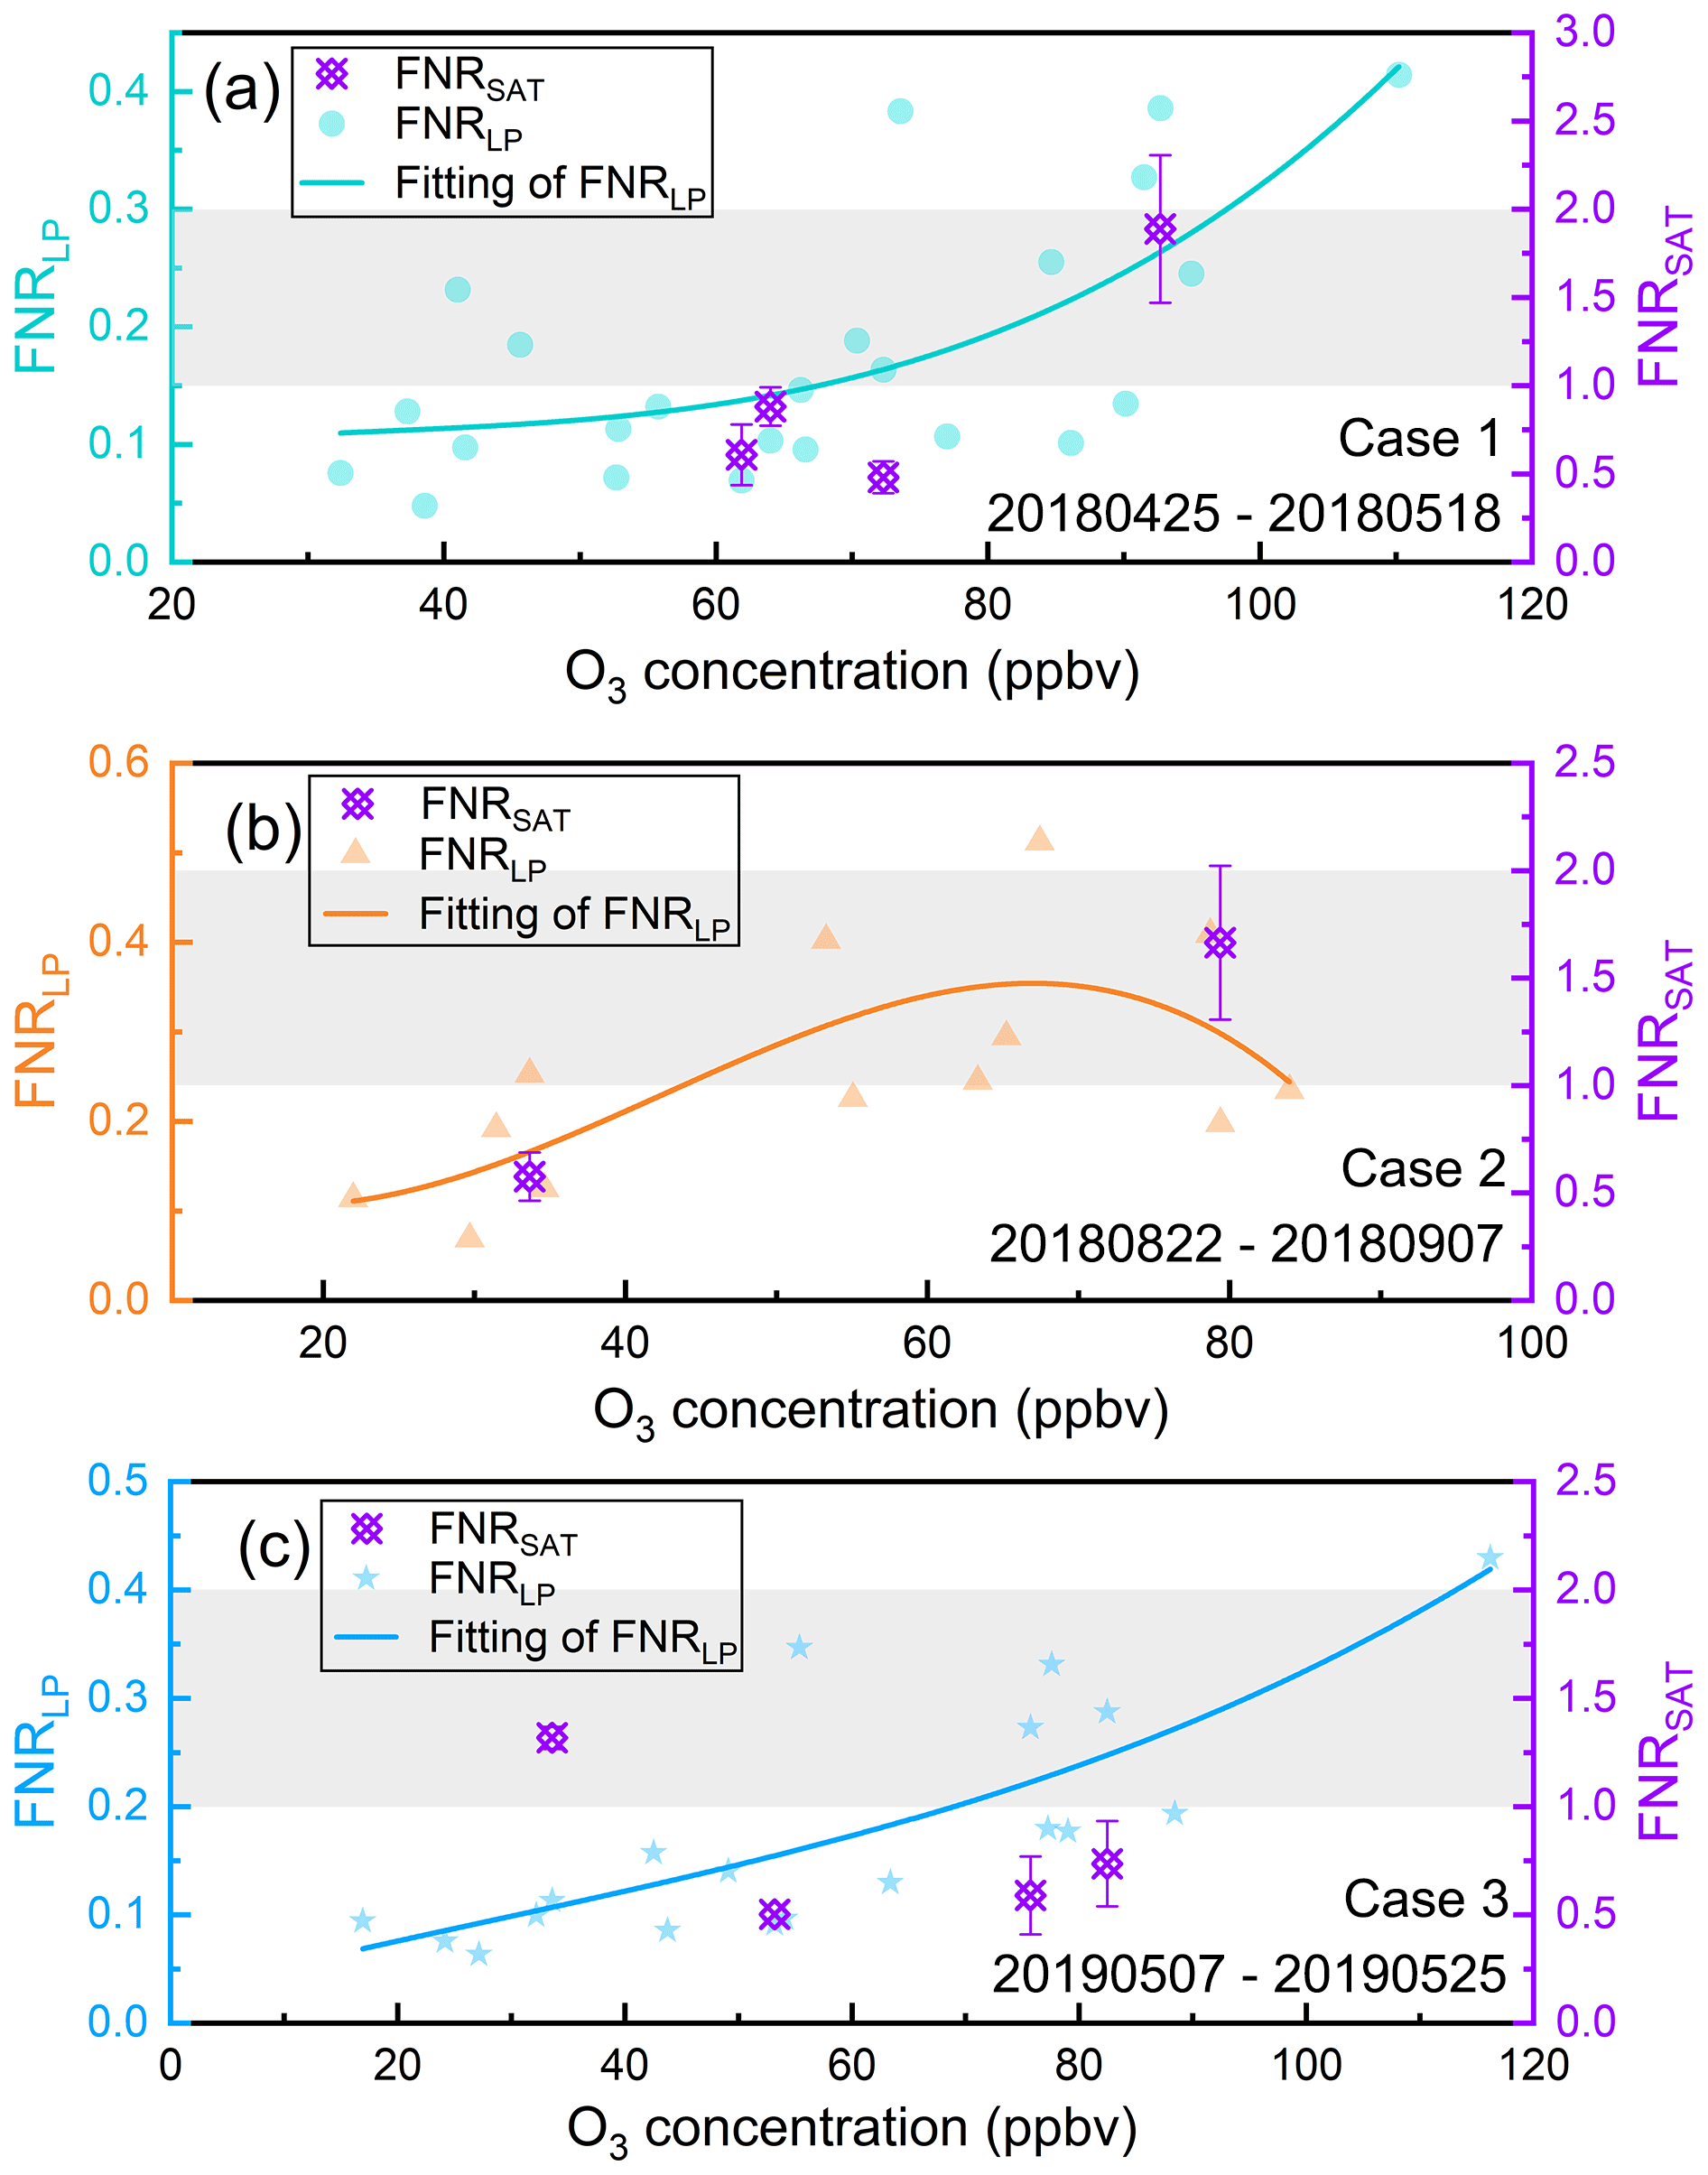
Figure 9Comparison of FNRSAT and FNRLP in three O3 pollution cases. The curves are polynomial fit of FNRLP, and the points are FNRSAT in corresponding cases; the gray area indicates the transitional regime for FNRSAT. Only LP-DOAS-measured data between 08:00–18:00 LT were used.
Three cases during the LP-DOAS observation at the Jiangwan campus of Fudan University were selected for further discussion under the criteria of the hourly concentration of O3 exceeding 200 µg m−3 (secondary concentration limit stipulated in ambient air quality standards of China, GB 3095-2012). In Fig. 9a and c, the upward trend in FNRLP as the O3 concentration increases means that the formation of O3 was under a VOC-limited regime in Case 1 and 3. VOC-limited and transitional regimes caught in Case 1 through FNRSAT were different from that identified by FNRLP. In Case 3, the O3 formation regime remained in a VOC-limited regime, which was the same as FNRLP. As shown in Fig. 9b, FNRLP indicated that the O3 formation regime switched between three regimes in Case 2. As O3 concentration increased, the growth of FNRLP at the beginning indicated a VOC-limited regime, while the subsequent slow variation suggested a transitional regime. When O3 concentration reached maximum, FNRLP got smaller, which implied a NOx-limited regime. But FNRSAT only captured the VOC-limited and transitional regime in Case 2. According to the results above, it is feasible and necessary to correct FNRSAT to better represent the sensitivity of surface O3 formation. Due to less O3 pollution in winter, FNRSAT was only corrected for the remaining three seasons.
The correction of FNRSAT was achieved through the following process. Firstly, the ratio of FNR at satellite overpass time to averaged FNR during the O3 pollution period (ΔO3 greater than 0, i.e. , 07:00 to 13:00 LT; see Fig. 8d) obtained from ground surface measurement was assumed to be same as that of satellite observation, which is expressed as follows:
where is the weighted average of FNR during the O3 pollution period observed by ground surface LP-DOAS measurements, and FNRLP,overpass time is ground surface FNR observed at satellite overpass time. reflects the numerical relationship of FNR between satellite overpass time and the O3 polluted period during a day and can serve as the correction coefficient to realize the correction for FNRSAT on a timescale to obtain the . Considering the relationship between time series of FNR and O3 formation, ΔO3 was involved to calculate the weighted average of FNRLP () during 07:00 to 13:00 LT via Eq. (2), which can better indicate the ozone formation in a day.
where is the increase in O3 concentration at time T, and FNRLP,T is the FNRLP at time T. Moreover, variation characteristics of FNRLP in different seasons (as shown in Fig. 8a to c) suggest that the correction of FNRSAT should be discussed seasonally.
Table 1Variations in the number and proportions of months in 2010–2019 for each regime before and after the correction.
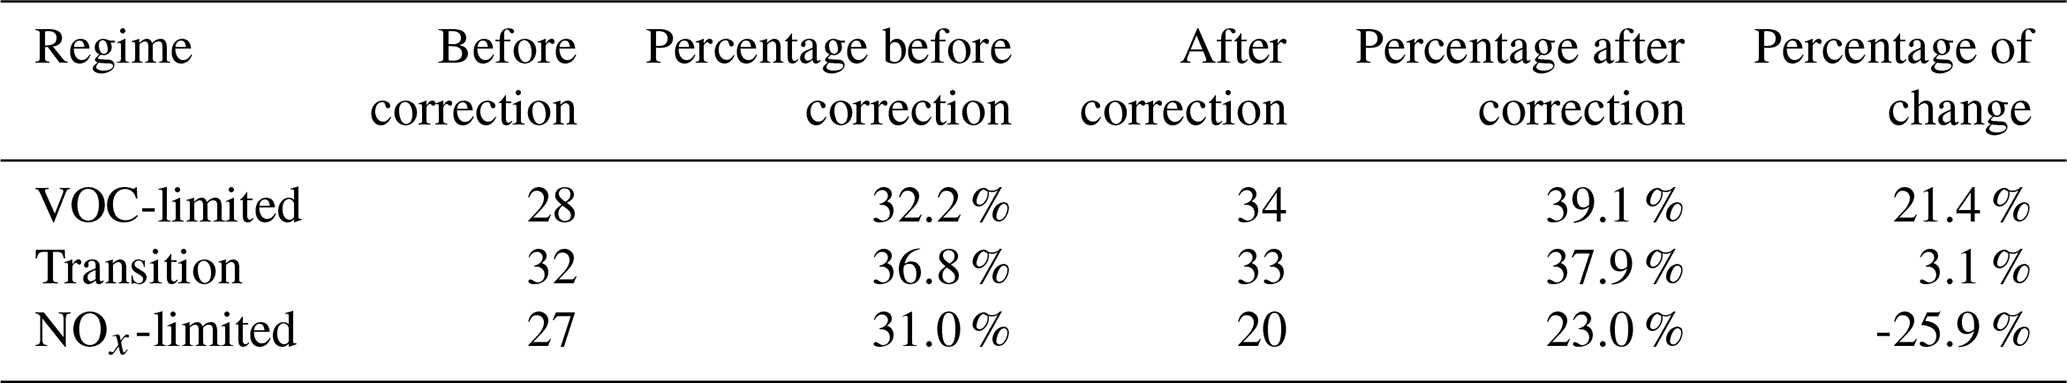
Afterwards, the seasonal correction coefficients of 0.85, 0.84, and 0.77 were obtained for spring, summer, and autumn, respectively. It is noted that all the correct coefficients were less than 1 due to the FNRLP value for OMI overpass time being relatively larger than other times. It would inevitably make the O3 formation regime inferred by corrected FNRSAT trend VOC-limited. There were 87 months with effective FNRSAT in three seasons during 2010–2019, and the proportion of months for different regimes was listed in Table 1. Before the correction, the VOC-limited and NOx-limited regimes, as well as the transitional regime, almost accounted for about one-third of the total months. After the correction, months that had VOC-limited and transitional regimes increased. The months under the VOC-limited regime increased by 21.4 %, while there was a decrease of about 25.9 % for NOx-limited regime. Jin et al. (2020) used O3 exceedance probability as the indicator to analyze non-linear dependence of long-term surface O3 concentrations on precursor emissions and determined the OMI HCHO NO2 under a transitional regime ranging from 3.2 to 4.1. These thresholds are significantly larger than the value proposed by Duncan et al. (2010), which has the equivalent effect as the use of correction factors less than 1 in this study.
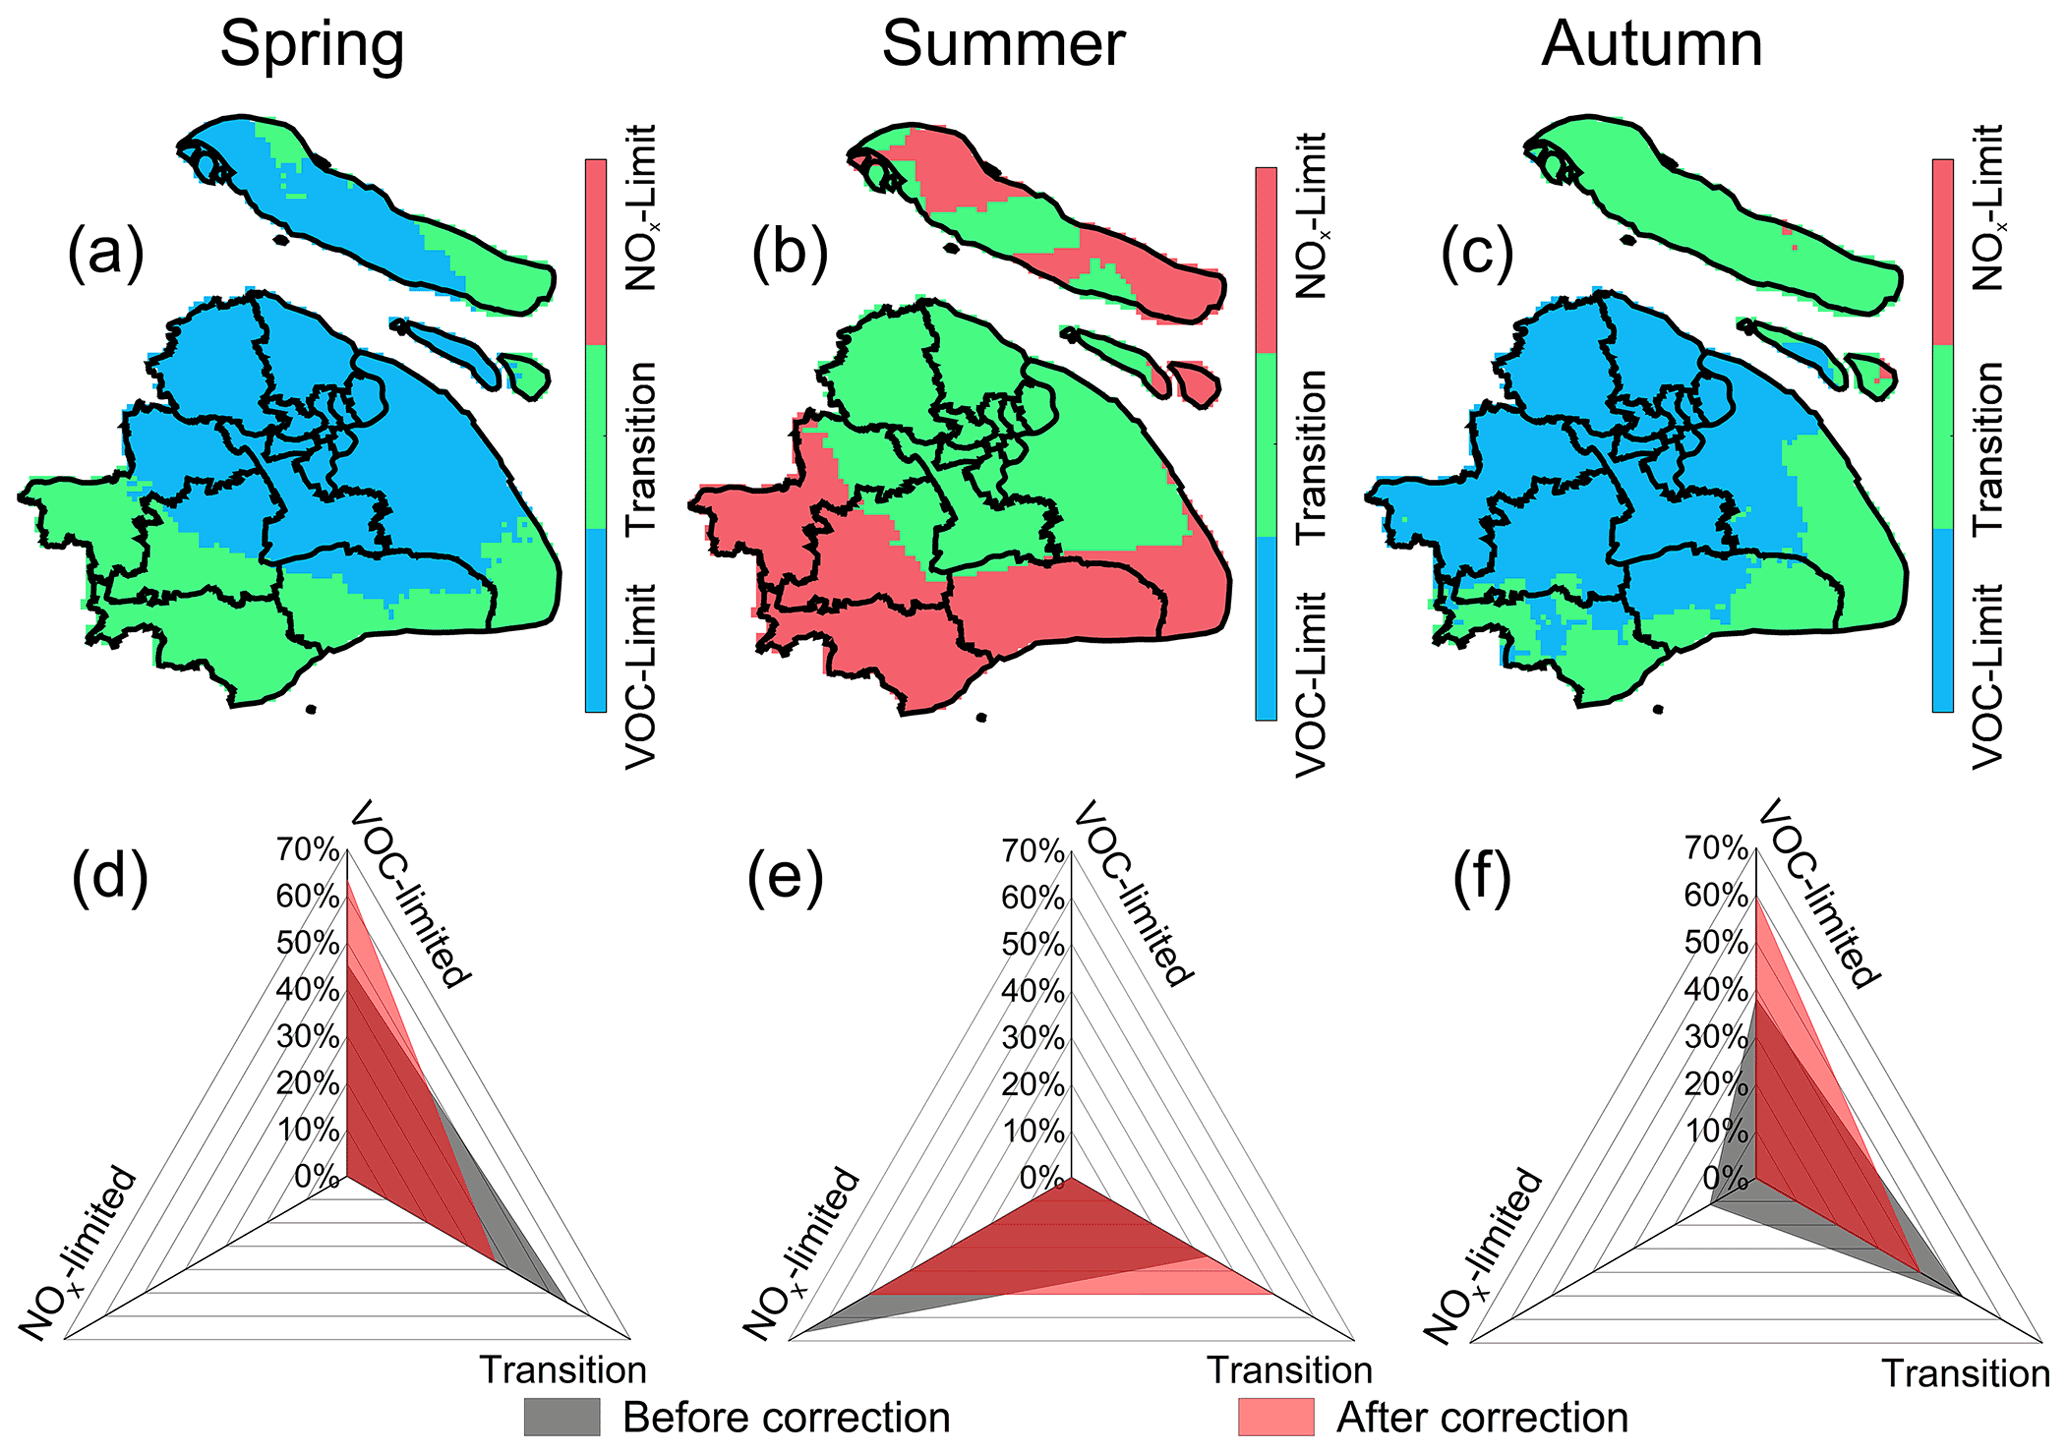
Figure 10Spatial distribution of O3 formation regime (a–c) and area proportion for each regime (d–f) after correction for different seasons in Shanghai during 2010–2019.
In terms of spatial distribution, the O3 formation regime after correction in different seasons is shown in Fig. 10. Compared with Fig. 6, part of the transitional regime area in spring transformed into a VOC-limited regime after the correction, and this VOC-limited regime obviously expanded and increased by about 18.2 %. Most areas on Chongming Island transformed into having a VOC-limited regime. In summer, part of the NOx-limited regime area transformed into having a transitional regime, and the area of the transitional regime increased by about 16.2 %. In autumn, the NOx-limited regime almost disappeared, and the proportion of the transitional regime area also decreased significantly, by about 10.4 %, while the proportion of the VOC-limited regime area increased by about 21.5 %. The O3 formation regime on Chongming Island was basically under a transitional regime. Researchers also pointed out that thresholds of criteria would be regionally dependent, so the local surface FNR and O3 concentration should be introduced in satellite correction (Duncan et al., 2010; Jin et al., 2020).

Figure 11The variation of O3 with surface HCHO and NO2 for two cases of (a) 3 May 2019 and (b) 10 October 2019. FNRSAT_before and FNRSAT_after indicate the O3 formation regimes inferred from the satellite FNR before and after the correction.
In order to verify whether the correction of the satellite FNR improved the regime classification, O3 formation regimes determined by satellite FNR before and after the correction were compared with those of surface observations. The variations of O3 with surface HCHO and NO2 have been plotted to determine the O3 formation regimes from the surface observation (Fig. 11). The daytime surface HCHO and NO2 are from LP-DOAS measurements, and the O3 was observed by SP-DOAS (short-path DOAS), which is also located at the Jiangwan campus of Fudan University and has a high temporal resolution. O3 formation regimes inferred from satellite FNR before and after the correction have also each been marked in Fig. 11.
For Case I, O3 decreases with the increase in NO2, which can be attributed to the titration of O3 by NO (Duncan et al., 2010). O3 increased from top to bottom indicating it was under a VOC-limited regime in Case I (Luo et al., 2020). For Case II, it can be seen that the high O3 appeared with high HCHO and low NO2, indicating it was under a VOC-limited regime. The uncorrected satellite FNR indicated that these two cases were both under a transitional regime, while the corrected satellite FNR indicated they transferred to a VOC-limited regime, which is consistent with the results of surface observation. It indicates that the correction of FNRSAT in this study can be considered to be effective and sensible.
Satellite data of OMI were used to study the temporal and spatial variation of HCHO in Shanghai from 2010 to 2019. HCHO VCDs fluctuated during the 10 years with obvious seasonal characteristics of highest value in summer, the lowest value in winter, and a moderate level in spring and autumn. In terms of spatial distribution, HCHO VCDs in western areas were much higher than that in eastern coastal area. Compared with 2010, HCHO VCDs of Shanghai in 2019 showed an overall downward trend. As for the influencing factors, temperature give the significant positive effect on HCHO VCDs while the abundant precipitation reduces HCHO in summer. Industry was an important contributor of HCHO, and anthropogenic secondary production of HCHO constituted the majority of the HCHO source.
In the past 10 years, the O3 formation regime changed toward a transitional regime gradually. The O3 formation regime in urban areas was more likely to be a VOC-limited regime, while a regime in suburban areas was more likely to be NOx-limited. FNRSAT was corrected based on the hourly surface FNR and O3 data to make it better to reflect O3 formation in a day. After correcting FNRSAT with seasonal correction coefficients of 0.85, 0.84, and 0.77 for spring, summer, and autumn respectively, the O3 formation regime in Shanghai was more inclined to be VOC-limited in both time and spatial distribution, and the effectiveness of the FNRSAT correction was confirmed by the surface observation. Thus, this correction is significant for using satellite data to improve the accuracy in indicating surface O3 formation.
Data are available for scientific purposes upon request to the corresponding author.
The supplement related to this article is available online at: https://doi.org/10.5194/acp-21-15447-2021-supplement.
DL and SW designed and implemented the research and prepared the paper. RX contributed to the analysis of OMI products and MEIC inventory. JZ provided the HCHO and NO2 data observed by LP-DOAS. SZ and ZS revised the paper. BZ provided constructive comments and supported the DOAS measurements.
The authors declare that they have no conflict of interest.
Publisher's note: Copernicus Publications remains neutral with regard to jurisdictional claims in published maps and institutional affiliations.
We acknowledge the free use of OMI HCHO and NO2 products from NASA Goddard Earth Sciences (GES) Data and Information Services Center (DISC). We also thank the Center for Earth System Science at Tsinghua University for MEIC data.
This research was funded by National Key Research and Development Program of China (grant no. 2017YFC0210002), National Natural Science Foundation of China (grant nos. 41775113, 21777026), and Funds for International Cooperation and Exchange of the National Natural Science Foundation of China (Grant no. 42061134006).
This paper was edited by Robert McLaren and reviewed by two anonymous referees.
An, J., Huang, Y., Huang, C., Wang, X., Yan, R., Wang, Q., Wang, H., Jing, S., Zhang, Y., Liu, Y., Chen, Y., Xu, C., Qiao, L., Zhou, M., Zhu, S., Hu, Q., Lu, J., and Chen, C.: Emission inventory of air pollutants and chemical speciation for specific anthropogenic sources based on local measurements in the Yangtze River Delta region, China, Atmos. Chem. Phys., 21, 2003–2025, https://doi.org/10.5194/acp-21-2003-2021, 2021.
Bovensmann, H., Burrows, J. P., Buchwitz, M., Frerick, J., Noel, S., Rozanov, V. V., Chance, K. V., and Goede, A. P. H.: SCIAMACHY: Mission objectives and measurement modes, J. Atmos. Sci., 56, 127–150, https://doi.org/10.1175/1520-0469(1999)056<0127:Smoamm>2.0.Co;2, 1999.
Burrows, J. P., Weber, M., Buchwitz, M., Rozanov, V., Ladstatter-Weissenmayer, A., Richter, A., DeBeek, R., Hoogen, R., Bramstedt, K., Eichmann, K. U., and Eisinger, M.: The global ozone monitoring experiment (GOME): Mission concept and first scientific results, J. Atmos. Sci., 56, 151–175, https://doi.org/10.1175/1520-0469(1999)056<0151:Tgomeg>2.0.Co;2, 1999.
Callies, J., Corpaccioli, E., Eisinger, M., Hahne, A., and Lefebvre, A.: GOME-2 – Metop's second-generation sensor for operational ozone monitoring, ESA Bull.-Eur. Space, 102, 28–36, 2000.
Chan, K. L., Wang, Z., Ding, A., Heue, K.-P., Shen, Y., Wang, J., Zhang, F., Shi, Y., Hao, N., and Wenig, M.: MAX-DOAS measurements of tropospheric NO2 and HCHO in Nanjing and a comparison to ozone monitoring instrument observations, Atmos. Chem. Phys., 19, 10051–10071, https://doi.org/10.5194/acp-19-10051-2019, 2019.
Chance, K.: OMI/Aura Formaldehyde (HCHO) Total Column 1-orbit L2 Swath 13x24 km V003, Greenbelt, MD, USA, Goddard Earth Sciences Data and Information Services Center (GES DISC) [data set], https://doi.org/10.5067/Aura/OMI/DATA2015, 2007.
Chan Miller, C., Jacob, D. J., Marais, E. A., Yu, K., Travis, K. R., Kim, P. S., Fisher, J. A., Zhu, L., Wolfe, G. M., Hanisco, T. F., Keutsch, F. N., Kaiser, J., Min, K.-E., Brown, S. S., Washenfelder, R. A., González Abad, G., and Chance, K.: Glyoxal yield from isoprene oxidation and relation to formaldehyde: chemical mechanism, constraints from SENEX aircraft observations, and interpretation of OMI satellite data, Atmos. Chem. Phys., 17, 8725–8738, https://doi.org/10.5194/acp-17-8725-2017, 2017.
De Smedt, I., Van Roozendael, M., Stavrakou, T., Müller, J.-F., Lerot, C., Theys, N., Valks, P., Hao, N., and van der A, R.: Improved retrieval of global tropospheric formaldehyde columns from GOME-2/MetOp-A addressing noise reduction and instrumental degradation issues, Atmos. Meas. Tech., 5, 2933–2949, https://doi.org/10.5194/amt-5-2933-2012, 2012.
Duncan, B. N., Yoshida, Y., Damon, M. R., Douglass, A. R., and Witte, J. C.: Temperature dependence of factors controlling isoprene emissions, Geophys. Res. Lett., 36, L05813, https://doi.org/10.1029/2008GL037090, 2009.
Duncan, B. N., Yoshida, Y., Olson, J. R., Sillman, S., Martin, R. V., Lamsal, L., Hu, Y. T., Pickering, K. E., Retscher, C., Allen, D. J., and Crawford, J. H.: Application of OMI observations to a space-based indicator of NOx and VOC controls on surface ozone formation, Atmos. Environ., 44, 2213–2223, https://doi.org/10.1016/j.atmosenv.2010.03.010, 2010.
Fan, J. C., Ju, T. Z., Wang, Q. H., Gao, H. Y., Huang, R. R., and Duan, J. L.: Spatiotemporal variations and potential sources of tropospheric formaldehyde over eastern China based on OMI satellite data, Atmos. Pollut. Res., 12, 272–285, https://doi.org/10.1016/j.apr.2020.09.011, 2021.
Fioletov, V. E., McLinden, C. A., Krotkov, N., Moran, M. D., and Yang, K.: Estimation of SO2 emissions using OMI retrievals, Geophys. Res. Lett., 38, L21811, https://doi.org/10.1029/2011gl049402, 2011.
Gao, W., Tie, X. X., Xu, J. M., Huang, R. J., Mao, X. Q., Zhou, G. Q., and Chang, L. Y.: Long-term trend of O3 in a mega City (Shanghai), China: Characteristics, causes, and interactions with precursors, Sci. Total. Environ., 603, 425–433, https://doi.org/10.1016/j.scitotenv.2017.06.099, 2017.
Geng, F. H., Tie, X. X., Xu, J. M., Zhou, G. Q., Peng, L., Gao, W., Tang, X., and Zhao, C. S.: Characterizations of ozone, NOx, and VOCs measured in Shanghai, China, Atmos. Environ., 42, 6873–6883, https://doi.org/10.1016/j.atmosenv.2008.05.045, 2008.
Jin, X. M. and Holloway, T.: Spatial and temporal variability of ozone sensitivity over China observed from the Ozone Monitoring Instrument, J. Geophys. Res.-Atmos., 120, 7229–7246, https://doi.org/10.1002/2015jd023250, 2015.
Jin, X. M., Fiore, A. M., Murray, L. T., Valin, L. C., Lamsal, L. N., Duncan, B., Folkert Boersma, K., De Smedt, I., Abad, G. G., Chance, K., and Tonnesen, G. S.: Evaluating a Space-Based Indicator of Surface Ozone-NOx-VOC Sensitivity Over Midlatitude Source Regions and Application to Decadal Trends, J. Geophys. Res.-Atmos., 122, 10231–10253, https://doi.org/10.1002/2017jd026720, 2017.
Jin, X. M., Fiore, A., Boersma, K. F., De Smedt, I., and Valin, L.: Inferring Changes in Summertime Surface Ozone-NOx-VOC Chemistry over US Urban Areas from Two Decades of Satellite and Ground-Based Observations, Environ. Sci. Technol., 54, 6518–6529, https://doi.org/10.1021/acs.est.9b07785, 2020.
Krotkov, N. A., McLinden, C. A., Li, C., Lamsal, L. N., Celarier, E. A., Marchenko, S. V., Swartz, W. H., Bucsela, E. J., Joiner, J., Duncan, B. N., Boersma, K. F., Veefkind, J. P., Levelt, P. F., Fioletov, V. E., Dickerson, R. R., He, H., Lu, Z., and Streets, D. G.: Aura OMI observations of regional SO2 and NO2 pollution changes from 2005 to 2015, Atmos. Chem. Phys., 16, 4605–4629, https://doi.org/10.5194/acp-16-4605-2016, 2016.
Krotkov, N. A., Lamsal, L. N., Marchenko, S. V., Bucsela, E. J., Swartz, W. H., Joiner, J., and the OMI core team: OMI/Aura Nitrogen Dioxide (NO2) Total and Tropospheric Column 1-orbit L2 Swath 13x24 km V003, Greenbelt, MD, USA, Goddard Earth Sciences Data and Information Services Center (GES DISC) [data set], https://doi.org/10.5067/Aura/OMI/DATA2017, 2019.
Lee, H., Ryu, J., Irie, H., Jang, S. H., Park, J., Choi, W., and Hong, H.: Investigations of the Diurnal Variation of Vertical HCHO Profiles Based on MAX-DOAS Measurements in Beijing: Comparisons with OMI Vertical Column Data, Atmosphere-Basel, 6, 1816–1832, https://doi.org/10.3390/atmos6111816, 2015.
Levelt, P. F., Van den Oord, G. H. J., Dobber, M. R., Malkki, A., Visser, H., de Vries, J., Stammes, P., Lundell, J. O. V., and Saari, H.: The Ozone Monitoring Instrument, IEEE T. Geosci. Remote, 44, 1093–1101, https://doi.org/10.1109/Tgrs.2006.872333, 2006.
Li, K., Jacob, D. J., Liao, H., Shen, L., Zhang, Q., and Bates, K. H.: Anthropogenic drivers of 2013–2017 trends in summer surface ozone in China, P. Natl. Acad. Sci. USA, 116, 422–427, https://doi.org/10.1073/pnas.1812168116, 2019.
Li, M., Zhang, Q., Streets, D. G., He, K. B., Cheng, Y. F., Emmons, L. K., Huo, H., Kang, S. C., Lu, Z., Shao, M., Su, H., Yu, X., and Zhang, Y.: Mapping Asian anthropogenic emissions of non-methane volatile organic compounds to multiple chemical mechanisms, Atmos. Chem. Phys., 14, 5617–5638, https://doi.org/10.5194/acp-14-5617-2014, 2014.
Li, M., Liu, H., Geng, G., Hong, C., Liu, F., Song, Y., Tong, D., Zheng, B., Cui, H., Man, H., Zhang, Q., and He, K.: Anthropogenic emission inventories in China: a review, Natl. Sci. Rev., 4, 834–866, https://doi.org/10.1093/nsr/nwx150, 2017.
Li, M., Zhang, Q., Zheng, B., Tong, D., Lei, Y., Liu, F., Hong, C., Kang, S., Yan, L., Zhang, Y., Bo, Y., Su, H., Cheng, Y., and He, K.: Persistent growth of anthropogenic non-methane volatile organic compound (NMVOC) emissions in China during 1990–2017: drivers, speciation and ozone formation potential, Atmos. Chem. Phys., 19, 8897–8913, https://doi.org/10.5194/acp-19-8897-2019, 2019.
Li, X., Rohrer, F., Brauers, T., Hofzumahaus, A., Lu, K., Shao, M., Zhang, Y. H., and Wahner, A.: Modeling of HCHO and CHOCHO at a semi-rural site in southern China during the PRIDE-PRD2006 campaign, Atmos. Chem. Phys., 14, 12291–12305, https://doi.org/10.5194/acp-14-12291-2014, 2014.
Ling, Z. H., Guo, H., Chen, G. X., Lam, S. H. M., and Fan, S. J.: Formaldehyde and Acetaldehyde at Different Elevations in Mountainous Areas in Hong Kong, Aerosol Air Qual. Res., 16, 1868–1878, https://doi.org/10.4209/aaqr.2015.09.0571, 2016.
Liu, H. R., Liu, C., Xie, Z. Q., Li, Y., Huang, X., Wang, S. S., Xu, J., and Xie, P. H.: A paradox for air pollution controlling in China revealed by “APEC Blue” and “Parade Blue”, Sci. Rep., 6, 13, https://doi.org/10.1038/srep34408, 2016.
Liu, R., Feng, T., Wang, S. S., Shi, C. Z., Guo, Y. L., Nan, J. L., Deng, Y., and Zhou, B.: OMI satellite observed formaldehyde column from 2006 to 2015 over Xishuangbanna, southwest China, and validation using ground based zenith-sky DOAS, Sci. Total. Environ., 613, 168–175, https://doi.org/10.1016/j.scitotenv.2017.08.210, 2018.
Liu, Y., Li, L., An, J., Zhang, W., Yan, R., Huang, L., Huang, C., Wang, H., Wang, Q., and Wang, M.: Emissions, Chemical Composition, and Spatial and Temporal Allocation of the BVOCs in the Yangtze River Delta Region in 2014, Environm. Sci., 39, 608–617, 2018a.
Liu, Y., Li, L., An, J. Y., Huang, L., Yan, R. S., Huang, C., Wang, H. L., Wang, Q., Wang, M., and Zhang, W.: Estimation of biogenic VOC emissions and its impact on ozone formation over the Yangtze River Delta region, China, Atmos. Environ., 186, 113–128, https://doi.org/10.1016/j.atmosenv.2018.05.027, 2018b.
Liu, Y., Tang, Z. P., Abera, T., Zhang, X. Z., Hakola, H., Pellikka, P., and Maeda, E.: Spatio-temporal distribution and source partitioning of formaldehyde over Ethiopia and Kenya, Atmos. Environ., 237, 117706, https://doi.org/10.1016/j.atmosenv.2020.117706, 2020.
Luo, H. H., Yang, L. F., Yuan, Z. B., Zhao, K. H., Zhang, S., Duan, Y. S., Huang, R. Z., and Fu, Q. Y.: Synoptic condition-driven summertime ozone formation regime in Shanghai and the implication for dynamic ozone control strategies, Sci. Total. Environ., 745, 141130, https://doi.org/10.1016/j.scitotenv.2020.141130, 2020.
Marais, E. A., Jacob, D. J., Kurosu, T. P., Chance, K., Murphy, J. G., Reeves, C., Mills, G., Casadio, S., Millet, D. B., Barkley, M. P., Paulot, F., and Mao, J.: Isoprene emissions in Africa inferred from OMI observations of formaldehyde columns, Atmos. Chem. Phys., 12, 6219–6235, https://doi.org/10.5194/acp-12-6219-2012, 2012.
Martin, R. V., Fiore, A. M., and Van Donkelaar, A.: Space-based diagnosis of surface ozone sensitivity to anthropogenic emissions, Geophys. Res. Lett., 31, L06120, https://doi.org/10.1029/2004gl019416, 2004a.
Martin, R. V., Parrish, D. D., Ryerson, T. B., Nicks, D. K., Chance, K., Kurosu, T. P., Jacob, D. J., Sturges, E. D., Fried, A., and Wert, B. P.: Evaluation of GOME satellite measurements of tropospheric NO2 and HCHO using regional data from aircraft campaigns in the southeastern United States, J. Geophys. Res.-Atmos., 109, D24307, https://doi.org/10.1029/2004jd004869, 2004b.
McLinden, C. A., Fioletov, V., Boersma, K. F., Krotkov, N., Sioris, C. E., Veefkind, J. P., and Yang, K.: Air quality over the Canadian oil sands: A first assessment using satellite observations, Geophys. Res. Lett., 39, L04804, https://doi.org/10.1029/2011gl050273, 2012.
Millet, D. B., Jacob, D. J., Boersma, K. F., Fu, T. M., Kurosu, T. P., Chance, K., Heald, C. L., and Guenther, A.: Spatial distribution of isoprene emissions from North America derived from formaldehyde column measurements by the OMI satellite sensor, J. Geophys. Res.-Atmos., 113, D02307, https://doi.org/10.1029/2007jd008950, 2008.
Narumi, D., Kondo, A., and Shimoda, Y.: The effect of the increase in urban temperature on the concentration of photochemical oxidants, Atmos. Environ., 43, 2348–2359, https://doi.org/10.1016/j.atmosenv.2009.01.028, 2009.
Palmer, P. I., Abbot, D. S., Fu, T. M., Jacob, D. J., Chance, K., Kurosu, T. P., Guenther, A., Wiedinmyer, C., Stanton, J. C., Pilling, M. J., Pressley, S. N., Lamb, B., and Sumner, A. L.: Quantifying the seasonal and interannual variability of North American isoprene emissions using satellite observations of the formaldehyde column, J. Geophys. Res.-Atmos., 111, D12315, https://doi.org/10.1029/2005jd006689, 2006.
Pang, X. B., Mu, Y. J., Lee, X. Q., Zhang, Y. J., and Xu, Z.: Influences of characteristic meteorological conditions on atmospheric carbonyls in Beijing, China, Atmos. Res., 93, 913–919, https://doi.org/10.1016/j.atmosres.2009.05.001, 2009.
Schroeder, J. R., Crawford, J. H., Fried, A., Walega, J., Weinheimer, A., Wisthaler, A., Muller, M., Mikoviny, T., Chen, G., Shook, M., Blake, D. R., and Tonnesen, G. S.: New insights into the column CH2ONO2 ratio as an indicator of near-surface ozone sensitivity, J. Geophys. Res.-Atmos., 122, 8885–8907, https://doi.org/10.1002/2017jd026781, 2017.
Sharkey, T. D. and Loreto, F.: Water-stress, temperature, and light effects on the capacity for isoprene emission and photosynthesis of kudzu leaves, Oecologia, 95, 328–333, https://doi.org/10.1007/bf00320984, 1993.
Shen, L., Jacob, D. J., Zhu, L., Zhang, Q., Zheng, B., Sulprizio, M. P., Li, K., De Smedt, I., Abad, G. G., Cao, H. S., Fu, T. M., and Liao, H.: The 2005–2016 Trends of Formaldehyde Columns Over China Observed by Satellites: Increasing Anthropogenic Emissions of Volatile Organic Compounds and Decreasing Agricultural Fire Emissions, Geophys. Res. Lett., 46, 4468–4475, https://doi.org/10.1029/2019gl082172, 2019.
Sillman, S.: The use of NOy, H2O2, and HNO3 as indicators for Ozone-NOx-Hydrocarbon sensitivity in Urban Locations, J. Geophys. Res.-Atmos., 100, 14175–14188, https://doi.org/10.1029/94jd02953, 1995.
Souri, A. H., Choi, Y., Jeon, W., Woo, J. H., Zhang, Q., and Kurokawa, J.: Remote sensing evidence of decadal changes in major tropospheric ozone precursors over East Asia, J. Geophys. Res.-Atmos., 122, 2474–2492, https://doi.org/10.1002/2016jd025663, 2017.
Stavrakou, T., Müller, J.-F., De Smedt, I., Van Roozendael, M., van der Werf, G. R., Giglio, L., and Guenther, A.: Global emissions of non-methane hydrocarbons deduced from SCIAMACHY formaldehyde columns through 2003–2006, Atmos. Chem. Phys., 9, 3663–3679, https://doi.org/10.5194/acp-9-3663-2009, 2009.
Su, W., Liu, C., Hu, Q., Zhao, S., Sun, Y., Wang, W., Zhu, Y., Liu, J., and Kim, J.: Primary and secondary sources of ambient formaldehyde in the Yangtze River Delta based on Ozone Mapping and Profiler Suite (OMPS) observations, Atmos. Chem. Phys., 19, 6717–6736, https://doi.org/10.5194/acp-19-6717-2019, 2019.
Veefkind, J. P., Aben, I., McMullan, K., Forster, H., de Vries, J., Otter, G., Claas, J., Eskes, H. J., de Haan, J. F., Kleipool, Q., van Weele, M., Hasekamp, O., Hoogeveen, R., Landgraf, J., Snel, R., Tol, P., Ingmann, P., Voors, R., Kruizinga, B., Vink, R., Visser, H., and Levelt, P. F.: TROPOMI on the ESA Sentinel-5 Precursor: A GMES mission for global observations of the atmospheric composition for climate, air quality and ozone layer applications, Remote Sens. Environ., 120, 70–83, https://doi.org/10.1016/j.rse.2011.09.027, 2012.
Vigouroux, C., Langerock, B., Bauer Aquino, C. A., Blumenstock, T., Cheng, Z., De Mazière, M., De Smedt, I., Grutter, M., Hannigan, J. W., Jones, N., Kivi, R., Loyola, D., Lutsch, E., Mahieu, E., Makarova, M., Metzger, J.-M., Morino, I., Murata, I., Nagahama, T., Notholt, J., Ortega, I., Palm, M., Pinardi, G., Röhling, A., Smale, D., Stremme, W., Strong, K., Sussmann, R., Té, Y., van Roozendael, M., Wang, P., and Winkler, H.: TROPOMI–Sentinel-5 Precursor formaldehyde validation using an extensive network of ground-based Fourier-transform infrared stations, Atmos. Meas. Tech., 13, 3751–3767, https://doi.org/10.5194/amt-13-3751-2020, 2020.
Wang, T., Wang, P., Theys, N., Tong, D., Hendrick, F., Zhang, Q., and Van Roozendael, M.: Spatial and temporal changes in SO2 regimes over China in the recent decade and the driving mechanism, Atmos. Chem. Phys., 18, 18063–18078, https://doi.org/10.5194/acp-18-18063-2018, 2018.
Wang, Y., Beirle, S., Lampel, J., Koukouli, M., De Smedt, I., Theys, N., Li, A., Wu, D., Xie, P., Liu, C., Van Roozendael, M., Stavrakou, T., Müller, J.-F., and Wagner, T.: Validation of OMI, GOME-2A and GOME-2B tropospheric NO2, SO2 and HCHO products using MAX-DOAS observations from 2011 to 2014 in Wuxi, China: investigation of the effects of priori profiles and aerosols on the satellite products, Atmos. Chem. Phys., 17, 5007–5033, https://doi.org/10.5194/acp-17-5007-2017, 2017.
Wang, Y. P., Wang, Z. F., Yu, C., Zhu, S. Y., Cheng, L. X., Zhang, Y., and Chen, L. F.: Validation of OMI HCHO Products Using MAX-DOAS observations from 2010 to 2016 in Xianghe, Beijing: Investigation of the Effects of Aerosols on Satellite Products, Remote Sens.-Basel, 11, 203, https://doi.org/10.3390/rs11020203, 2019.
Xing, C. Z., Liu, C., Hu, Q. H., Fu, Q. Y., Lin, H., Wang, S. T., Su, W. J., Wang, W. W., Javed, Z., and Liu, J. G.: Identifying the wintertime sources of volatile organic compounds (VOCs) from MAX-DOAS measured formaldehyde and glyoxal in Chongqing, southwest China, Sci. Total. Environ., 715, 12, https://doi.org/10.1016/j.scitotenv.2019.136258, 2020.
Xu, J., Tie, X., Gao, W., Lin, Y., and Fu, Q.: Measurement and model analyses of the ozone variation during 2006 to 2015 and its response to emission change in megacity Shanghai, China, Atmos. Chem. Phys., 19, 9017–9035, https://doi.org/10.5194/acp-19-9017-2019, 2019.
Xue, R. B., Wang, S. S., Li, D. R., Zou, Z., Chan, K. L., Valks, P., Saiz-Lopez, A., and Zhou, B.: Spatio-temporal variations in NO2 and SO2 over Shanghai and Chongming Eco-Island measured by Ozone Monitoring Instrument (OMI) during 2008–2017, J. Clean Prod., 258, 120563, https://doi.org/10.1016/j.jclepro.2020.120563, 2020.
Zaveri, R. A., Berkowitz, C. M., Kleinman, L. I., Springston, S. R., Doskey, P. V., Lonneman, W. A., and Spicer, C. W.: Ozone production efficiency and NOx depletion in an urban plume: Interpretation of field observations and implications for evaluating O3-NOx-VOC sensitivity, J. Geophys. Res.-Atmos., 108, 4436, https://doi.org/10.1029/2002jd003144, 2003.
Zhang, C. X., Liu, C., Hu, Q. H., Cai, Z. N., Su, W. J., Xia, C. Z., Zhu, Y. Z., Wang, S. W., and Liu, J. G.: Satellite UV-Vis spectroscopy: implications for air quality trends and their driving forces in China during 2005–2017, Light-Sci. Appl., 8, 100, https://doi.org/10.1038/s41377-019-0210-6, 2019.
Zhang, K., Li, L., Huang, L., Wang, Y. J., Huo, J. T., Duan, Y. S., Wang, Y. H., and Fu, Q. Y.: The impact of volatile organic compounds on ozone formation in the suburban area of Shanghai, Atmos. Environ., 232, 117511, https://doi.org/10.1016/j.atmosenv.2020.117511, 2020.
Zhang, K., Huang, L., Li, Q., Huo, J., Duan, Y., Wang, Y., Yaluk, E., Wang, Y., Fu, Q., and Li, L.: Explicit modeling of isoprene chemical processing in polluted air masses in suburban areas of the Yangtze River Delta region: radical cycling and formation of ozone and formaldehyde, Atmos. Chem. Phys., 21, 5905–5917, https://doi.org/10.5194/acp-21-5905-2021, 2021.
Zhang, Q., Streets, D. G., He, K., Wang, Y., Richter, A., Burrows, J. P., Uno, I., Jang, C. J., Chen, D., Yao, Z., and Lei, Y.: NOx emission trends for China, 1995–2004: The view from the ground and the view from space, J. Geophys. Res.-Atmos., 112, D22306, https://doi.org/10.1029/2007jd008684, 2007.
Zheng, B., Tong, D., Li, M., Liu, F., Hong, C., Geng, G., Li, H., Li, X., Peng, L., Qi, J., Yan, L., Zhang, Y., Zhao, H., Zheng, Y., He, K., and Zhang, Q.: Trends in China's anthropogenic emissions since 2010 as the consequence of clean air actions, Atmos. Chem. Phys., 18, 14095–14111, https://doi.org/10.5194/acp-18-14095-2018, 2018.
Zhu, L., Jacob, D. J., Mickley, L. J., Marais, E. A., Cohan, D. S., Yoshida, Y., Duncan, B. N., Abad, G. G., and Chance, K. V.: Anthropogenic emissions of highly reactive volatile organic compounds in eastern Texas inferred from oversampling of satellite (OMI) measurements of HCHO columns, Environ. Res. Lett., 9, 114004, https://doi.org/10.1088/1748-9326/9/11/114004, 2014.
Zhu, L., Jacob, D. J., Keutsch, F. N., Mickley, L. J., Scheffe, R., Strum, M., Abad, G. G., Chance, K., Yang, K., Rappengluck, B., Millet, D. B., Baasandorj, M., Jaegle, L., and Shah, V.: Formaldehyde (HCHO) As a Hazardous Air Pollutant: Mapping Surface Air Concentrations from Satellite and Inferring Cancer Risks in the United States, Environ. Sci. Technol., 51, 5650–5657, https://doi.org/10.1021/acs.est.7b01356, 2017a.
Zhu, L., Mickley, L. J., Jacob, D. J., Marais, E. A., Sheng, J. X., Hu, L., Abad, G. G., and Chance, K.: Long-term (2005–2014) trends in formaldehyde (HCHO) columns across North America as seen by the OMI satellite instrument: Evidence of changing emissions of volatile organic compounds, Geophys. Res. Lett., 44, 7079–7086, https://doi.org/10.1002/2017gl073859, 2017b.