the Creative Commons Attribution 4.0 License.
the Creative Commons Attribution 4.0 License.
 | 27 Sep 2021
Evaluation of the contribution of new particle formation to cloud droplet number concentration in the urban atmosphere
Sihui Jiang
Fang Zhang
Jingye Ren
Lu Chen
Jieyao Liu
Zhanqing Li
The effect of new particle formation (NPF) on cloud condensation nuclei (CCN) varies widely in diverse environments. CCN or cloud droplets from NPF sources remain highly uncertain in the urban atmosphere; they are greatly affected by the high background aerosols and frequent local emissions. In this study, we quantified the effect of NPF on cloud droplet number concentration (CDNC, or Nd) at typical updraft velocities (V) in clouds based on field observations on 25 May–18 June 2017 in urban Beijing. We show that NPF increases the Nd by 32 %–40 % at V=0.3–3 m s−1 during the studied period. The Nd is reduced by 11.8 ± 5.0 % at V=3 m s−1 and 19.0 ± 4.5 % at V=0.3 m s−1 compared to that calculated from constant supersaturations due to the water vapor competition effect, which suppresses the cloud droplet formation by decreasing the environmental maximum supersaturation (Smax). The effect of water vapor competition becomes smaller at larger V that can provide more sufficient water vapor. However, under extremely high aerosol particle number concentrations, the effect of water vapor competition becomes more pronounced. As a result, although a larger increase of CCN-sized particles by NPF events is derived on clean NPF days when the number concentration of preexisting background aerosol particles is very low, no large discrepancy is presented in the enhancement of Nd by NPF between clean and polluted NPF days. We finally reveal a considerable impact of the primary sources on the evaluation of the contribution of NPF to CCN number concentration (NCCN) and Nd based on a case study. Our study highlights the importance of full consideration of both the environmental meteorological conditions and multiple sources (i.e., secondary and primary) to evaluate the effect of NPF on clouds and the associated climate effects in polluted regions.
- Article
(4581 KB) - Full-text XML
-
Supplement
(1983 KB) - BibTeX
- EndNote


In the global climate system, aerosols, cloud condensation nuclei (CCN) and cloud droplets are very important components. Clouds, serving as a bridge connecting aerosols and climate, are the most uncertain factor of climate change (IPCC, 2013; Seinfeld et al., 2016; Cai et al., 2020). The microphysical link between aerosols and clouds as the most important part has received extensive attention. Cloud droplet activation is a key process from aerosol to clouds, and researchers have tried to simulate the microphysical processes using numerical activation models (e.g., Boucher and Lohmann, 1995; Abdul-Razzak et al., 1998; Ghan et al., 1993; Khvorostyanov and Curry, 1999; Abdul-Razzak and Ghan, 2000; Nenes et al., 2001, 2003; Petters and Kreidenweis, 2007; Ren et al., 2018; Genz et al., 2020).
New particle formation (NPF) events have been observed and occur frequently in different atmospheric environments in the world (Spracklen et al., 2010; Yue et al., 2011; Peng et al., 2017; Kerminen et al., 2018; Bousiotis et al., 2019; Zimmerman et al., 2020). NPF events are one of the most significant sources of fine particles in the atmosphere (Shi et al., 1999; Stanier et al., 2004; Kulmala and Kerminen, 2008). For example, it has been found that NPF contributed about 76 % of the total fine particle number concentration in urban Beijing (Wu et al., 2011). These nucleated particles subsequently grow through coagulation or condensation processes to CCN-relevant sizes or act as CCN in convective clouds (Fan et al., 2013; Li et al., 2010). In reality, field studies have shown that these fine particles produced from NPF can subsequently result in an enhancement in NCCN at cloud-relevant supersaturation (Kalkavouras et al., 2017; Peng et al., 2014; Wu et al., 2015; Ma et al., 2016; Z. Li et al., 2017; Zhang et al., 2019). It was estimated that up to 80 % of CCN number concentration (NCCN) is from the nucleation process in urban Beijing (Wiedensohler et al., 2008).
However, the NCCN only reflects the cloud-forming potential of aerosol particles at a given supersaturation. The measurement of CCN is usually carried out at constant supersaturations. Different from the prescribed supersaturation used in the evaluation of NCCN, when calculating the cloud droplet number concentration (CDNC, or Nd), researchers considered the dynamic situations in clouds. In clouds, the supersaturation exhibits variable levels that instantaneously adjust to the intensity of cloud updrafts and the particle number size distribution (PNSD) (Nenes et al., 2003; Hudson et al., 2015). So the CDNC (or Nd) depends on the size distribution, chemical properties of aerosol and the cloud updraft velocity, all of which regulate the maximum supersaturation (Smax) that can be formed in a cloud parcel (Nenes and Seinfeld, 2003). Studies have shown that the CDNC in clouds exhibits a sublinear relationship to aerosol number concentration (NCN) (Twomey, 1977; Leaitch et al., 1986; Ghan et al., 1993; Boucher and Lohmann, 1995; Nenes et al., 2001; Ramanathan et al., 2001; Sullivan et al., 2016); this is different from CCN due to the limitation of the water vapor in the actual environment. Using the prescribed supersaturation to calculate CDNC may therefore provide a bias in the evaluation of the aerosol indirect effect. For example, Kalkavouras et al. (2017, 2019) reported an average 12 % enhancement of CDNC during two consecutive NPF episodes in the eastern Mediterranean, which was significantly smaller than the enhancement of NCCN (∼ 87 %) during the NPF events. Hence, it is critical to fully consider the background meteorological conditions (e.g., using dynamic water vapor under different updraft velocities) to simulate the Smax when evaluating the effect of NPF on clouds and the associated climate effects.
Relevant studies have been carried out in clean regions, but fewer were conducted in polluted urban areas. Field studies have shown that NPF events can occur frequently in polluted urban sites, although the high concentration of background particles is not conducive to the generation of new particles (Wu et al., 2011; Peng et al., 2014; Zimmerman et al., 2020), and the formation and growth rate of new particles may be larger than those of a relatively clean atmosphere. Wiedensohler et al. (2012) found that, under the high concentration levels of gaseous pollutants and strong oxidation in polluted areas, the high concentration of nanoparticles generated by NPF events can rapidly grow to tens or even hundreds of nanometers in a few hours. Zhang et al. (2019) observed that the subsequent growth of newly formed particles can last 2–3 d in urban Beijing, producing more CCN-sized particles. Previous studies in polluted regions demonstrated the complex and nonlinear relationship between aerosol particles and CCN due to multiple emission sources (Zhang et al., 2014, 2016, 2017, 2019; Ren et al., 2018; Fan et al., 2020), highlighting the importance of understanding the connections between aerosols and CCN or cloud droplets close to the source regions. Particularly, owing to the extremely high CN number concentrations (with order of magnitude as high as 104 or even 105 cm−3) during NPF events in the urban area, the effect of competition for water vapor and reduction in cloud supersaturation is expected to be exacerbated.
The current study quantifies the contribution of NPF to NCCN and CDNC in the polluted urban atmosphere of Beijing using field measurements of aerosol number size distributions and chemical composition. The effect of water vapor competition on evaluating Nd during NPF events is examined. The impact of the background preexisting particles on the enhancement of CCN and CDNC is also discussed by contrasting the results on typical clean NPF days and polluted NPF days. Given the strong local primary sources like traffic emissions in the urban area, a case study is conducted to investigate the impact of primary emissions on the evaluation of the effect of NPF on Nd.
2.1 Site and experiment
A field campaign was conducted from 25 May to 18 June 2017 at the Institute of Atmospheric Physics (IAP), Chinese Academy of Sciences (39.98∘ N, 116.39∘ E), for measurements of aerosol physical and chemical properties. The IAP is located between the North Third Ring Road and Fourth Ring Road in northern Beijing. It is a typical urban background site, mainly affected by traffic and cooking emissions. Beijing is hot in summer, with high ambient relative humidity, which is conductive to the generation of atmospheric convection and reduces the high background aerosol condensation sink. The radiation in summer is stronger than other seasons, which promotes the generation of nucleated particles. In addition, local sources from traffic and cooking emissions, which may contribute many CCN size-relevant particles, can be important at the site (Sun et al., 2015). The instruments during the campaign were deployed in a container at ground level (∼ 8 m on a meteorological tower).
The number size distribution of particles in the size range from 10 to 550 nm (scanned range) was measured with a time resolution of 5 min by a scanning mobility particle sizer (SMPS; Wang and Flagan, 1990; Collins et al., 2002), which consists of a differential mobility analyzer (DMA, model 3081L, TSI Inc.) to classify particles with different sizes of particles, and a condensation particle counter (CPC, model 3772, TSI Inc.) to detect the size-classified particles. The sampled particles were dried to a relative humidity < 30 % before entering the DMA. The non-refractory chemical composition of PM1 is measured by an aerosol chemical speciation monitor (ACSM), which consists of an aerodynamic lens to efficiently sample and focus submicron particles into the ACSM (Ng et al., 2011). Before sampling into the ACSM, aerosol particles are dried by silica gel desiccant. The ACSM was operated at a time resolution of 15 min. And the non-refractory chemical components that can be measured mainly include organics, sulfate salts (SO), nitrate salts (NO), ammonium (NH) and chloride (Cl−) (Ng et al., 2011). The refractory components mainly include black carbon (BC), and the BC mass concentration was measured using a seven-wavelength aethalometer (AE33, Magee Scientific Corp) .
2.2 Calculation of NCCN
According to the hygroscopic growth process of particles described by Köhler theory (Köhler, 1936), the particles with a dry particle diameter (Dp) larger than the critical dry particle diameter (Dc) can be activated to form a cloud droplet. In this study, the κ-Köhler theory (Petters and Kreidenweis, 2007), which simply describes the approximate relationship between the Dc with the critical supersaturation (Sc), is applied as follows, when κ>0.1:
where Mw is the molecular weight of water (Mw=0.018015 kg mol−1), ρw is the density of water (ρw=997.1 kg m−3), T is the parcel temperature (T=298.15 K), where σw is the droplet surface tension at the point of activation (σw=0.072 J m−2), and R is the universal gas constant (R=8.315 J K−1 mol−1). κ is a hygroscopic parameter which depends on the chemical composition of the particle. In this study, based on the assumption that particles are internally mixed and their chemical composition will not be impacted by changes in particle size, we derived the κ with a simple mixing rule on the basis of chemical volume fractions (Petters and Kreidenweis, 2007; Gunthe et al., 2009). We used ACSM data, combined with the positive matrix factorization (PMF) analysis data to calculate the organic and inorganic volume fraction, according to the following equation:
where κi and εi are the hygroscopic parameter and volume fraction for each individual (dry) component in the mixture, respectively. The κ value and density (ρ) of each species used in the calculation are given in Table 1, which are from Petters and Kreidenweis (2007) and Topping (2005).
Table 1Densities of different chemical species and their κ measured by the laboratory.
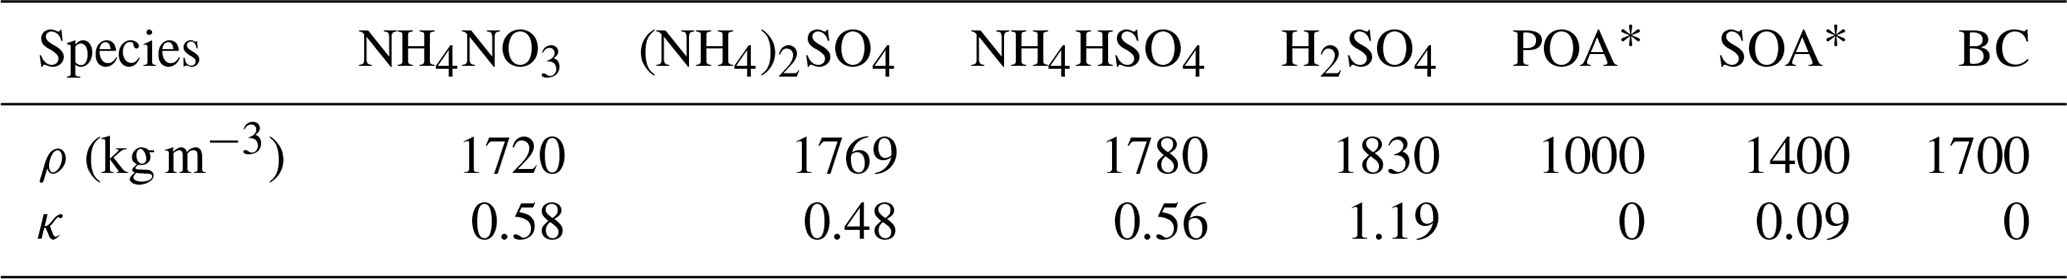
POA∗ refers to primary organic aerosol, and SOA∗ refers to secondary organic aerosol.
In Eq. (1), the corresponding Dc can be obtained from a given Sc, and all particles with diameters larger than Dc can be activated. So the NCCN can be calculated by integrating the PNSD from Dc to the largest particle size measured:
where n(log Dp) is the particle number that corresponds to each particle size bin dlog Dp in the aerosol number size distribution.
2.3 Calculation of Nd
The Nd depends on the Smax that can be formed in adiabatic ascending clouds. And this “cloud-relevant” supersaturation varies at different updraft velocity. A global scheme of cloud droplet parameterization has been established and developed for the calculation of the Nd and Smax (Nenes and Seinfeld, 2001, 2003; Fountoukis and Nenes, 2005). In this study, the Smax was calculated from an equation that expresses the water vapor balance in adiabatic ascending cloud (Nenes and Seinfeld, 2003):
where α and γ are two coefficients that can be calculated by meteorological constants, the product of α and V expresses the increase of supersaturation due to the adiabatic cooling of the parcel, and denotes the water condensation rate during the aerosol activation and subsequent growth processes, shown in detail in Eq. (4). And expresses the growth rate of supersaturation; when it is equal to 0, the supersaturation reaches the maximum value.
where ρw is the density of water. ns ( is the number concentration of particles activated between S′ and .
Nenes et al. (2001) used a sectional representation of the CCN spectrum (i.e., particle number supersaturation distribution nS(S′)) and total number of particles with Sc smaller than S, FS(S), which is given by
where Sx is the supersaturation in the environment and nS(S′) represents the number concentration of particles activated between S′ and in the CCN spectrum. The FS(Sx) can be calculated by the integration of nS(S′) from the lower limit 0 to upper limit Sx. If the Smax is known, the activated Nd can be calculated from Eq. (7), as
In this study, we used the PNSD, chemical components, and empirical values of cloud updraft velocity to determine the Smax and Nd during NPF days in urban Beijing. Owing to the fact that the direct measurement of cloud-scale updraft velocity in the atmosphere is almost impossible, the prescribed updraft velocity used in this study is from previous studies. Generally, the updraft velocities are reported to be very small (Martin and Johnson, 1994) and range from 0.1 to 1.0 m s−1 in stratocumulus and cumulus clouds in the remote or marine boundary layer (Meskhidze et al., 2005; Morales and Nenes, 2010). The vertical updraft velocities were derived to vary from 0.3 to 3 m s−1 (Zheng et al., 2015), which is typical of cumulus and convective clouds in summer in north China; thus they were selected and applied in this study.
2.4 Method for calculating the contribution of NPF to NCCN and Nd
The increment of NCCN or Nd by the NPF (ΔNCCN or ΔNd) is usually quantified by comparing the NCCN or Nd prior to and after the NPF event (Peng et al., 2014; Wu et al., 2015; Ma et al., 2016; Ren et al., 2018; Zhang et al., 2019; Fan et al., 2020). In this study, the NCCN or Nd prior to the NPF event was determined as a 2 h average of NCCN or Nd before the burst of newly formed nucleated particles. And the NCCN and Nd after the NPF event were calculated as the average of NCCN or Nd from the beginning to the end of the NPF impact on the NCCN or Nd. So it is critical to determine when a NPF event starts and ends or when NPF begins and ends its impact on the NCCN or Nd.
Generally, the burst in the nucleation-mode particles symbolizes the beginning of an NPF event. Here, the moment when a half-hour concentration of the nucleation-mode particles suddenly increases by orders of magnitude as high as ∼ 104 cm−3 during NPF cases was defined as tstart. The end time of an NPF event, tend, is defined by the moment when the half-hour concentration of nucleated particle is lower than that at tstart.
Since some time is needed for the newly formed nucleated particles to grow to a sufficient size to act as CCN, the NCCN would not be enhanced as soon as new particles are generated. To determine the time that NPF begins and ends its impact on the NCCN, denoted as tstart,CCN and tend,CCN respectively, the time series of NCCN was firstly divided by the NCCN at tstart at each prescribed supersaturation, to derive the normalized time series of NCCN, denoted as RS. The equation is written as follows:
where S represents the supersaturation. Before the new particles reach a large enough size to impact NCCN, the variations of RS should remain constant for different supersaturations if the concentrations of the background or preexisting aerosols change insignificantly. And at tstart,CCN when NPF begins to impact the NCCN, an apparent increase in RS is observed, taking the observation on 11 June as an example (Fig. 1a). Also, due to the heterogenous composition and distinct CCN activity of the newly formed particles (Duan et al., 2018; Ren et al., 2018; Zhang et al., 2019; Tao et al., 2021), a parameter, Rd, which was calculated with the relative standard deviation of the RS of different supersaturations at a given time, is applied to fix the tstart,CCN and tend,CCN. Then the tstart,CCN and tend,CCN correspond to the moments when the Rd starts to increase and goes back to nearly zero (Fig. 1b) between the tstart and tend. The same method is used to determine the time that NPF begins and ends its impact on the Nd, denoted as and respectively (Fig. 1d, e). More details about the method can be found in Kalkavouras et al. (2019). As shown in Fig. 1, it is clear that both the NCCN and Nd exhibit a large increase in the NPF-impacted time zone between tstart,CCN and tend,CCN (Fig. 1c) and between and (Fig. 1f). The average time lag between tstart and was about 3–5 h, which is shortened by 50 % compared to that reported by Kalkavouras et al. (2019). This case on 11 June was not a unique case, and similar patterns are also shown on other NPF days during the campaign (Figs. S3–S8).
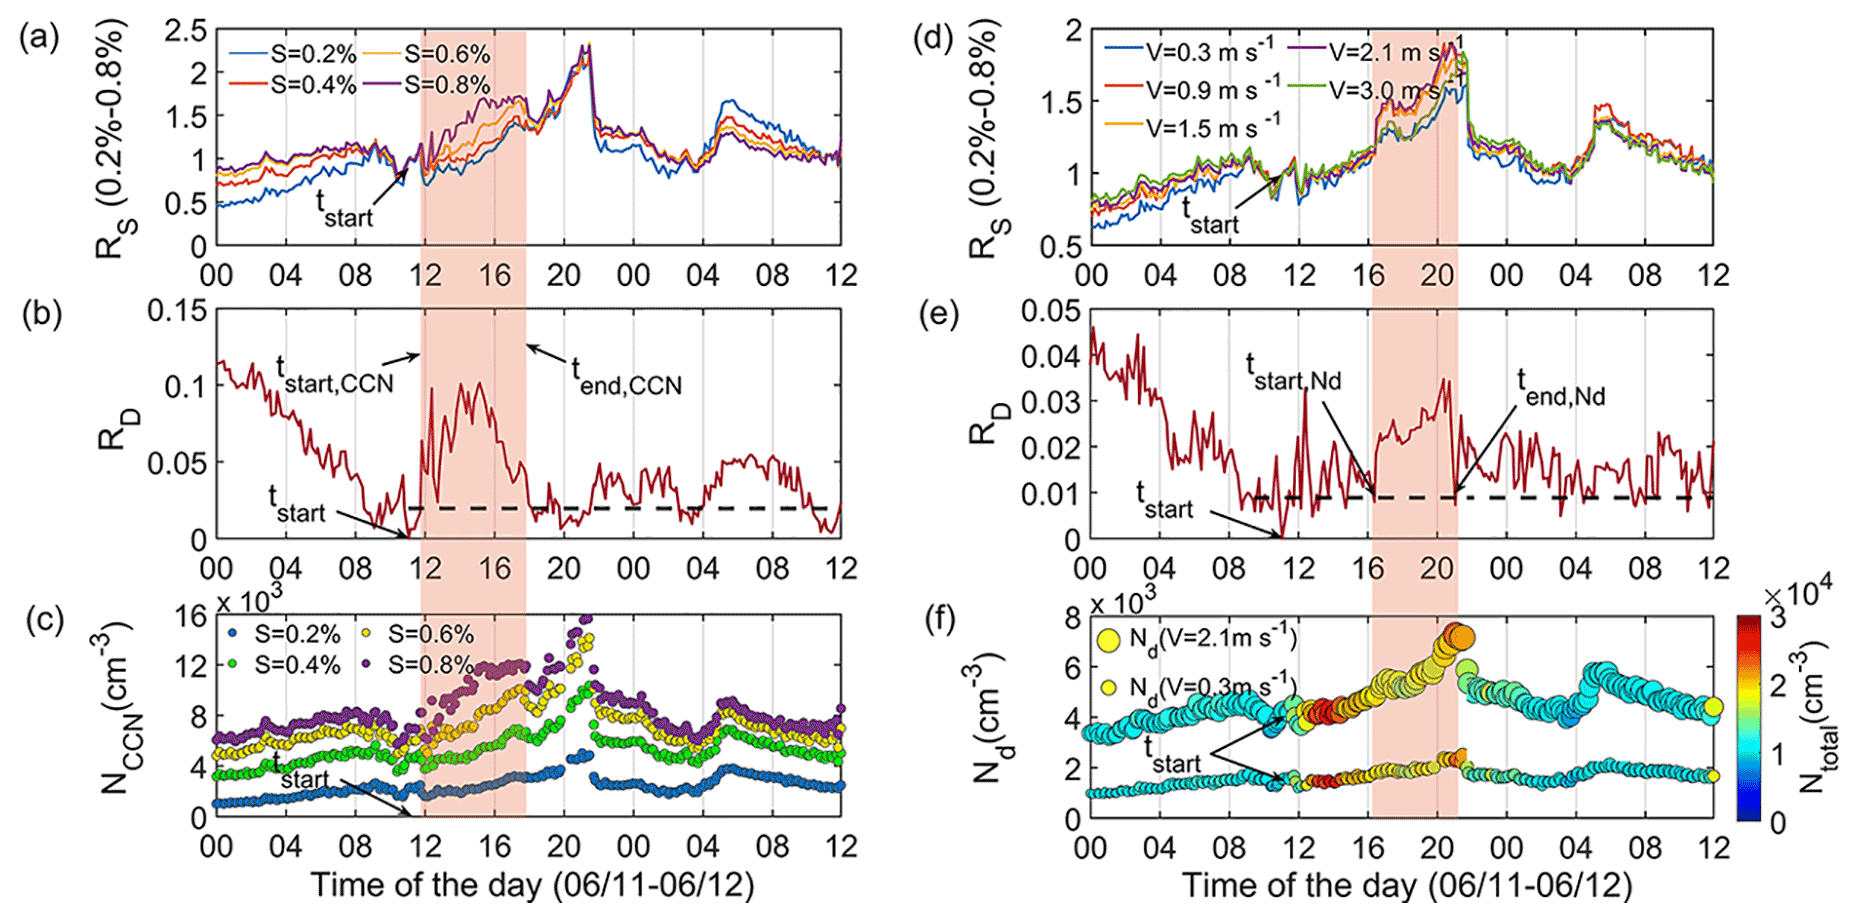
Figure 1The diurnal evolution of (a) the RS of NCCN at different supersaturations, (b) the relative dispersion of RS and Rd, for NCCN at different supersaturations, (c) the calculated NCCN under different supersaturations, (d) the RS of Nd under updraft velocities from 0.3 to 3.0 m s−1, (e) the Rd for Nd and (f) the calculated Nd at updraft velocities of 0.3 and 2.1 m s−1 on 11 June 2017.
Note that this method operates with an assumption of the unchanged background preexisting aerosols during the NPF events, without consideration of the impacts from local emission sources and diurnal changes in the planetary boundary layer (PBL). As shown in Fig. 2b, the time series of NCN presents a baseline which indicates that the concentrations of the background aerosols on each of the 7 typical NPF days do not vary much; the impact from the variation of background aerosol particles thus should be insignificant. The impact of PBL is expected to be small when the growth of the newly formed particles spans only a few hours. However, when the growth continues over a longer period to evening or at night, which may coincide with the period during which the PBL height changes from high to low (Kerminen et al., 2012; Altstädter, et al., 2015; Z. Li et al., 2017), it will result in a larger NCCN and Nd, leading to an overestimation of the contribution of NPF to NCCN and Nd. A quantitative evaluation of such an impact is difficult due to the contemporary PBL data not being available. Therefore, here we only investigate the impact of local emissions on the evaluation of the effect of NPF on Nd based on a case study.
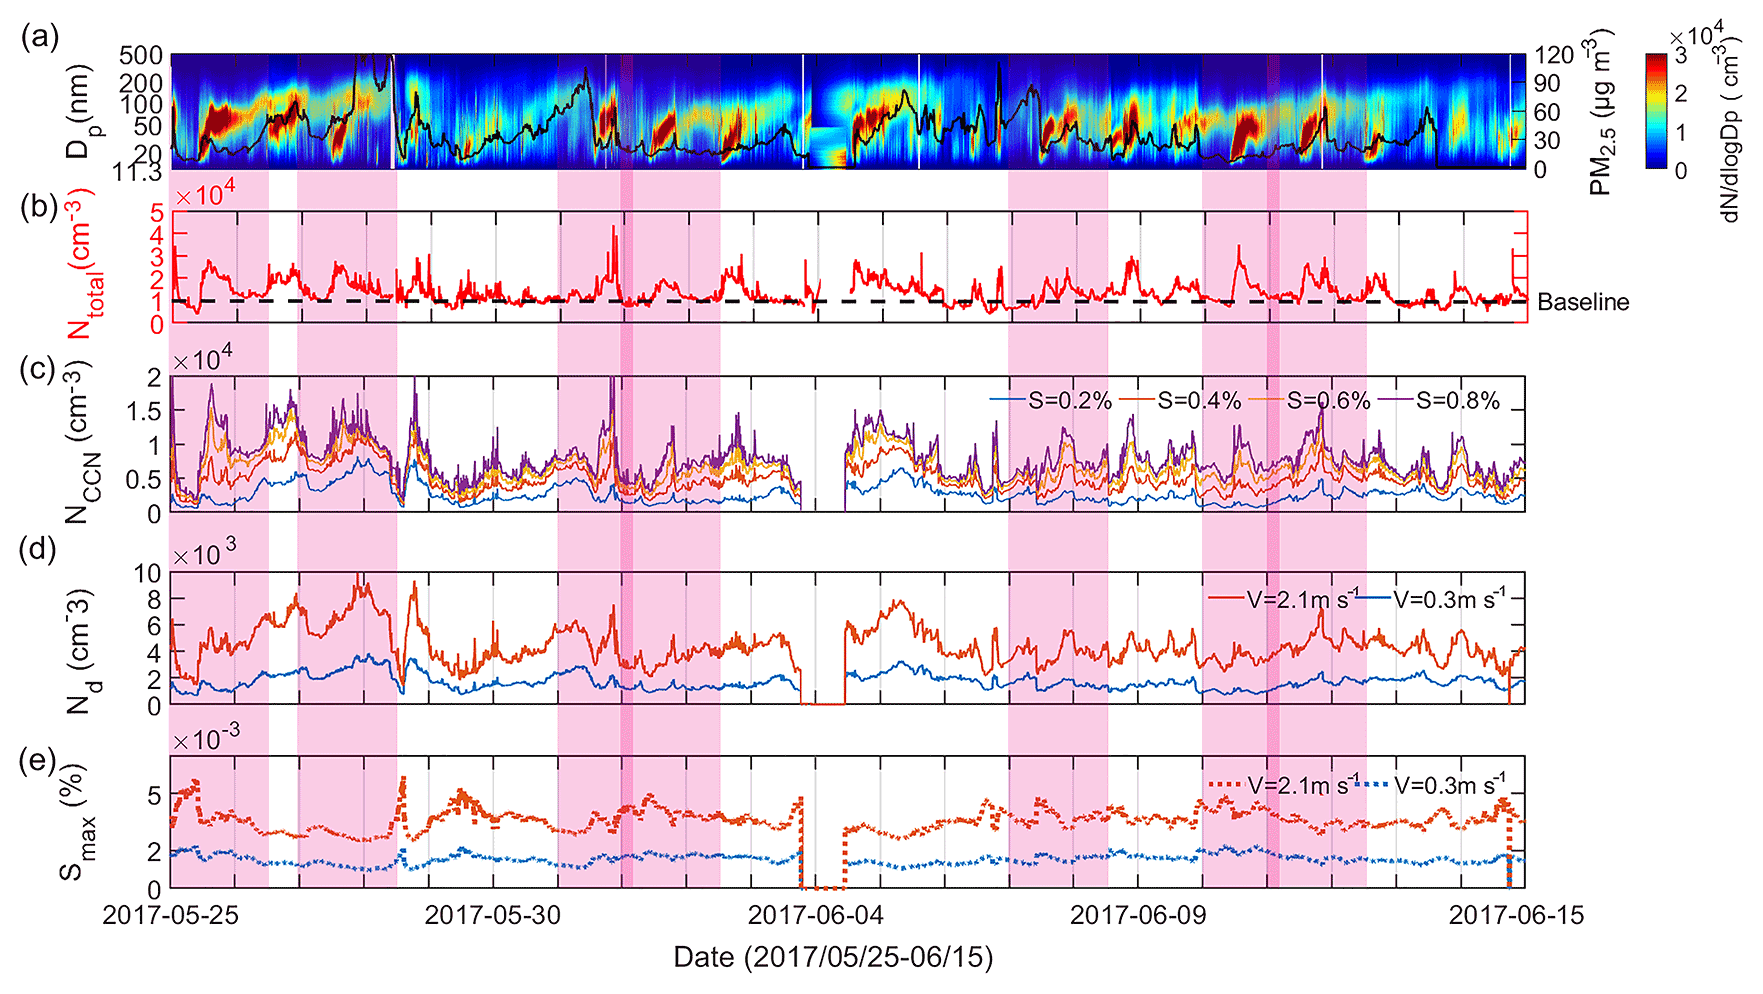
Figure 2Time series of (a) particle number size distribution (PNSD) (the selected seven typical NPF events are marked by pink shading), (b) the total particle number concentration (Ntotal), (c) CCN number concentration (NCCN), (d) cloud droplet number concentration (Nd) and (e) the maximum supersaturation (Smax) from 25 May to 15 June 2017.
3.1 Time series of observed NPF events and calculated NCCN and Nd
During the observed periods from 25 May to 15 June 2017, the NPF events occurred on most days (∼ 13 d) (Fig. 2a). According to Dal et al. (2005) and Wu et al. (2015), a typical NPF event includes the sudden appearance and continuous growth of particles smaller than 25 nm, and a “banana” shape can be seen on the particle number size spectrum. While non-NPF events may also have sudden increases of fine particles at a short timescale (e.g., local sources from vehicle or cooking emissions), they do not show a banana shape. Therefore, those cases with a typical banana shape (seven NPF events in total), which presents a complete NPF evolution process from nucleation to subsequent growth (not interrupted by meteorological conditions either), are selected for further study (marked by pink shading in Fig. 2). Figure 2b, c and d present the time series of NCN, NCCN and Nd. The figure shows that the NPF event drives the variation of NCCN and Nd, confirming that the occurrence of NPF events is an important source of CCN. The variation trend of NCN is more correlated with that of NCCN than Nd (see also Fig. 4, Table S5). This is because the NCCN was calculated based on a constant S rather than referring to the availability of water vapor, while the calculation of Nd is based on the Smax that can be reached in the real atmosphere at a given updraft velocity. In the cloud, the change in the quantity of cloud particles can be directly reflected by the change in Smax. As shown in Fig. 2e, the average Smax for the two vertical updraft velocity of V=0.3 and V=2.1 m s−1 was calculated to be under 0.2 % and 0.4 %, varying largely with the variation of NCN due to the effect of water vapor competition, which will be discussed in Sect. 3.3.
3.2 Quantitative evaluation of the NPF impact on NCCN and Nd
Based on the method in Sect. 2.4, the contribution of the NPF to NCCN and Nd is calculated and is shown in Fig. 3. The results show that the NCCN is increased on average by 32.0 %, 43.0 %, 53.0 % and 65.0 % at S of 0.2 %, 0.4 %, 0.6 % and 0.8 % respectively during NPF events (Fig. 3b, c, Table S3), amounting to about 24 %–37 % of environment CCN at the cloud-relevant supersaturation being directly originated from NPF during the studied period in urban Beijing. And the rest (about 63 %–76 %) of CCN are from other sources or preexisting particles, which is a much larger proportion than that derived in remote Finokalia, Crete, Greece, by Kalkavouras et al (2019). In other words, due to the higher background concentration of aerosol particles in the polluted urban area, the relative contribution of NPF to NCCN is more significant in remote clean regions.
The estimated results of Nd for selected vertical updraft velocities are shown in Fig. 3d–f. Generally, the average Smax was calculated to be under 0.4 % and 0.2 % for V=2.1 and V=0.3 m s−1 respectively (Fig. 2e), corresponding to critical particle sizes (Dc) of ∼ 70 and ∼ 110 nm. This means that most activated drops are from accumulation-mode particles and larger particles in Aitken mode. The large contribution of the Aitken-mode particles leads to a large number of cloud droplets in urban Beijing, especially for high updraft velocity. Basically, the average ΔNd values (increased by NPF) are 433, 854, 1117, 1281 and 1523 cm−3 at updraft velocities of 0.3, 0.9, 1.5, 2.1 and 3 m s−1 respectively (Fig. 3d), which is a much larger magnitude compared with that in the clean areas (Morales Betancourt et al., 2014; Sullivan et al., 2016; Kalkavouras et al., 2019). This is equal to the Nd being enhanced by 32 %, 37 %, 38 %, 38 % and 40 % at updraft velocities of 0.3, 0.9, 1.5, 2.1 and 3 m s−1 respectively (Fig. 3e), suggesting that the higher cloud updraft velocity not only generates more cloud droplets, but also induces larger enhancements in Nd. We also show that the NPF contributes about 30 % to the total Nd during the studied period in urban Beijing (Fig. 3f). And the rest (about 70 %) of cloud droplets are from the other sources or preexisting particles. With the increase of the S, the percentages of NPF-initiated NCCN and the contributions of the NPF to NCCN increased more significantly than for Nd with the increase of V. In other words, the percentages of NPF-initiated Nd and the contributions of the NPF to Nd are relatively independent of the variation of V. This is primarily due to the water vapor competition effect under very high CN number concentrations when calculating the Nd. Under high NCN, the water vapor competition effect will lead to lower Smax, which is smaller than the constant S for calculating NCCN. Roughly, the Nd at V of 0.3–3 m s−1 corresponds to the NCCN at S of 0.1 %–0.5 %, within which the percentages of ΔNCCN and the contributions of the NPF to NCCN do not change much either. The effect of water vapor competition will be further examined in the following section.
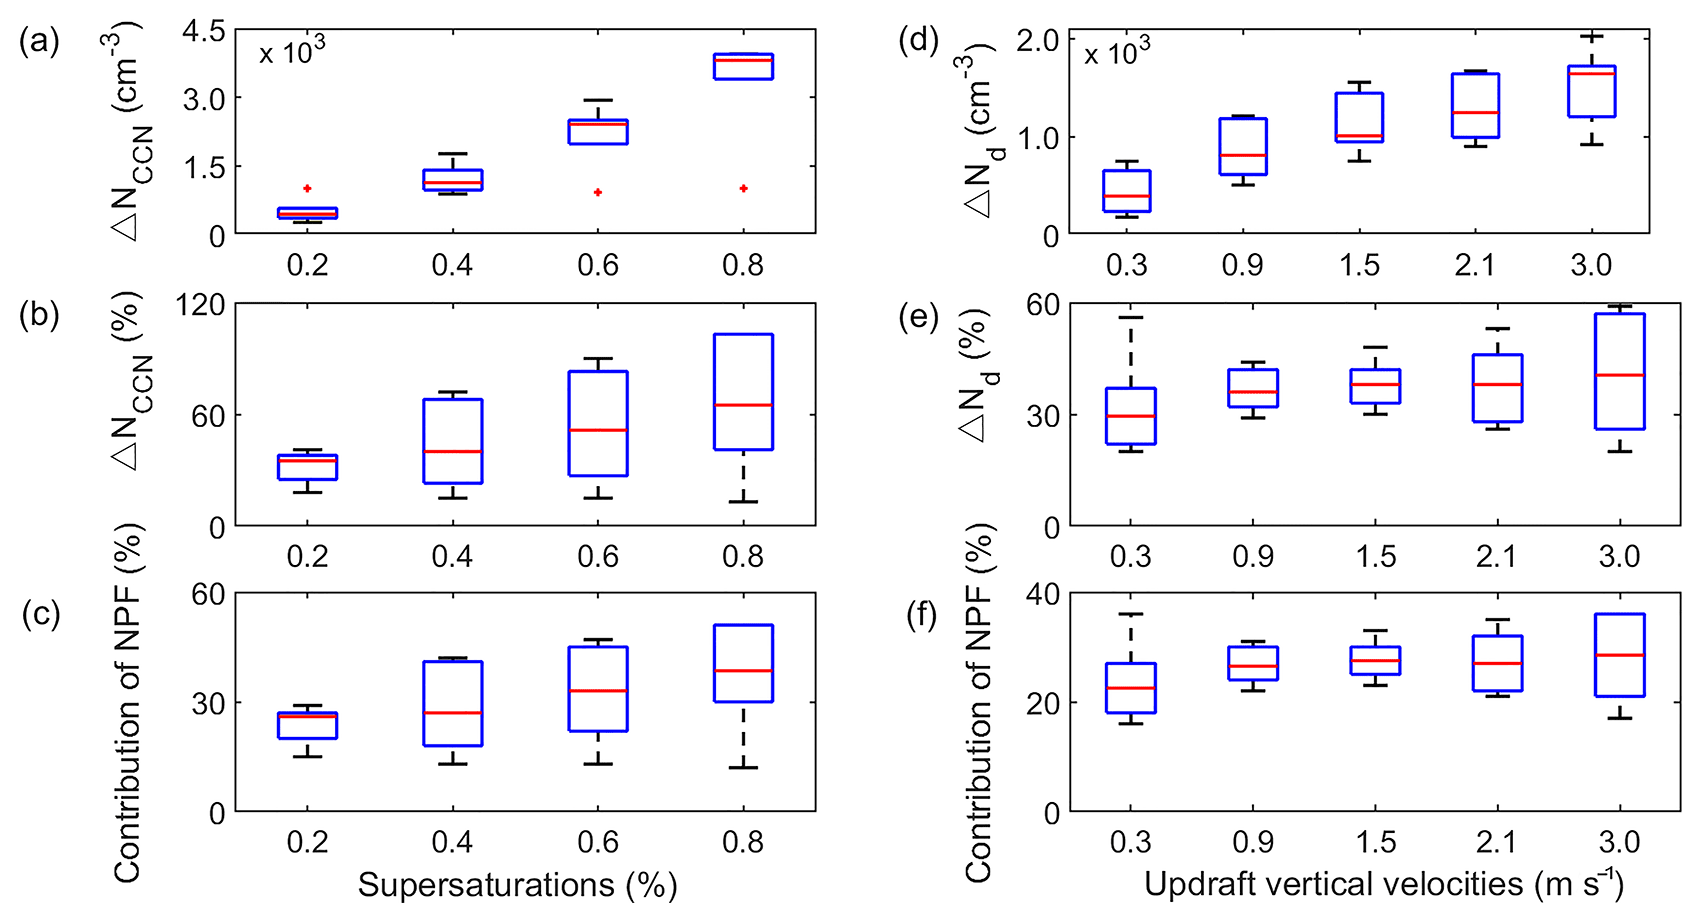
Figure 3Box diagram of the increment of (a) CCN number concentration NCCN (ΔNCCN), (b) enhanced percentage of NCCN and (c) the contribution to total NCCN by NPF for different supersaturations (0.2 %–0.8 %) and (d) cloud droplet number concentration Nd (ΔNd), (e) enhanced percentage of Nd and (f) the contribution to total Nd by NPF under different updraft velocities (0.3–3.0 m s−1).
3.3 The effect of water vapor competition on evaluating Nd
Figure 4 shows the scatter plots of correlations between NCN and NCCN at supersaturations of 0.6 % and 0.8 % and the correlations between NCN and Nd under updraft vertical velocities of 2.1 and 3.0 m s−1. The NCCN and NCN were obviously linearly related, but the correlation between Nd and NCN was nonlinear. When shown as average values with error bars, the Nd increases linearly as NCN increases when the NCN is below 15 000, then the Nd begins to decrease with the further increase of NCN. This has been presented in previous studies (Nenes et al., 2001; Ramanathan et al., 2001; Sullivan et al., 2016) and is believed to be caused by the water vapor competition of the aerosol particles. Although the larger updraft velocities can achieve greater supersaturation in adiabatic ascending clouds, and more particles can be activated into cloud droplets, the water vapor competition still occurred when background aerosol particles increased to a certain number. This is strongly suggested by the difference between the calculated NCCN using the constant S and the Nd using the variable Smax in the air parcels because in the actual environment, it is often not possible to achieve sufficient supersaturation compared to the prescribed levels that are preset by the instrument. For example, the average Smax is lower than 0.5 % at the maximum cloud updraft velocity of 3 m s−1 according to the calculation results in this study. Therefore, although NPF events may strongly increase NCCN, the formed Nd is eventually limited by water vapor competition, which determines the Smax that varies in the cloud. The Smax is related to the cloud formation dynamics and the aerosol levels in the region.

Figure 4Scatter plots of correlation between total number concentration (NCN) and CCN number concentration (NCCN) at supersaturation of (a) 0.6 % and (c) 0.8 % respectively. Scatter plot of correlation between NCN and cloud droplet number concentration (Nd) at updraft vertical velocities of (b) 2.1 m s−1 and (d) 3.0 m s−1 respectively.
To evaluate the effect of water vapor competition on Nd, by taking the case on 11 June as an example, we compare the Nd calculated from the varied Smax at different updraft velocities with the Nd at constant S (Fig. 5). The results from other NPF cases are also summarized in Tables S6 and S7. Obviously, after the tstart, the Smax starts to decrease and was negatively correlated with Nd for both the updraft velocities, reflecting the enhanced effect of competition for water vapor from the growing number of droplets (Fig. 5a and b). It is shown that Smax was decreased by 14.5 ± 3.5 %, 13.3 ± 4.0 %, 13.4 ± 4.2 %, 12.0 ± 4.1 % and 11.7 ± 3.9 % for V=0.3, 0.9, 1.5, 2.1 and 3 m s−1 respectively (Fig. 5c, d).
Therefore, in comparison to the Nd calculated from the constant S, the Nd calculated from the variable Smax is greatly reduced at both the updraft velocities of 0.3 m s−1 and 2.1 m s−1, suggesting a significant suppression of cloud droplet formation. Quantitatively, the Nd is reduced by 19.0 ± 4.5 %, 15.7 ± 4.7 %, 14.8 ± 5.6 %, 12.3 ± 4.9 % and 11.8 ± 5.0 % at updraft velocity of 0.3, 0.9, 1.5, 2.1 and 3 m s−1 respectively on the NPF days. Our results are similar to those reported by Kalkavouras et al. (2017), who showed that these competition effects suppress Nd by 20 % for V=0.3 and 12.3 % for V=0.6 m s−1. In addition, the declined percentages with an increase in updraft velocity suggest that the effect becomes smaller at larger V, achieving greater Smax in the environment. Essentially, water vapor competition led to the reduction in Nd by decreasing the required Smax for the CN activation.

Figure 5(a) The diurnal changes of the calculated maximum supersaturation (Smax) (referring to the constant supersaturation S) at V=0.3 and 2.1 m s−1 on 11 June 2017. (b) Comparison of the cloud droplet number concentration (Nd) under the constant S and Smax on 11 June 2017. The suppression percentage of (c) Smax and (d) Nd due to the competition of water vapor.
3.4 The variations of CCN and cloud droplet on typical clean and polluted NPF days: a case study
Generally, lower PM2.5 means a low background condensation sink (CS), which is conducive to the condensation and coagulation of nucleation particles (Wu et al., 2011; Yue et al., 2011; Wiedensohler et al., 2012). Different from the remote clean area, some of the NPF events in urban Beijing during the campaign occurred with background pollution (with daily mass concentrations of PM2.5 of ∼ 40 µg m−3) or are impacted by local primary emissions. This kind of NPF event has different characteristics from that in clean conditions, as the sudden increase of nucleation particles less than 25 nm is often accompanied by an increase of large particles at the beginning of NPF. Here, they are named as polluted and clean NPF events respectively. Two days, on 27 May and 11 June, representing the typical polluted and clean NPF events respectively, are selected for contrasting the effect of the two kinds of NPF on CCN and CDNC. As shown in Fig. 7, there is a higher preexisting background of accumulation-mode particles throughout the day on the polluted NPF day of 27 May than on the clean NPF day of 11 June. On the clean NPF days, many more nucleation- and Aitken-mode particles, with NCN enhancement 2-fold higher than that on polluted days (Fig. 7a), were generated, and NPF events developed more strongly in the initial stage. The beginning of NPF events (tstart) in the polluted case (11:00) was about 2 h later than that in the clean case (∼ 09:00).
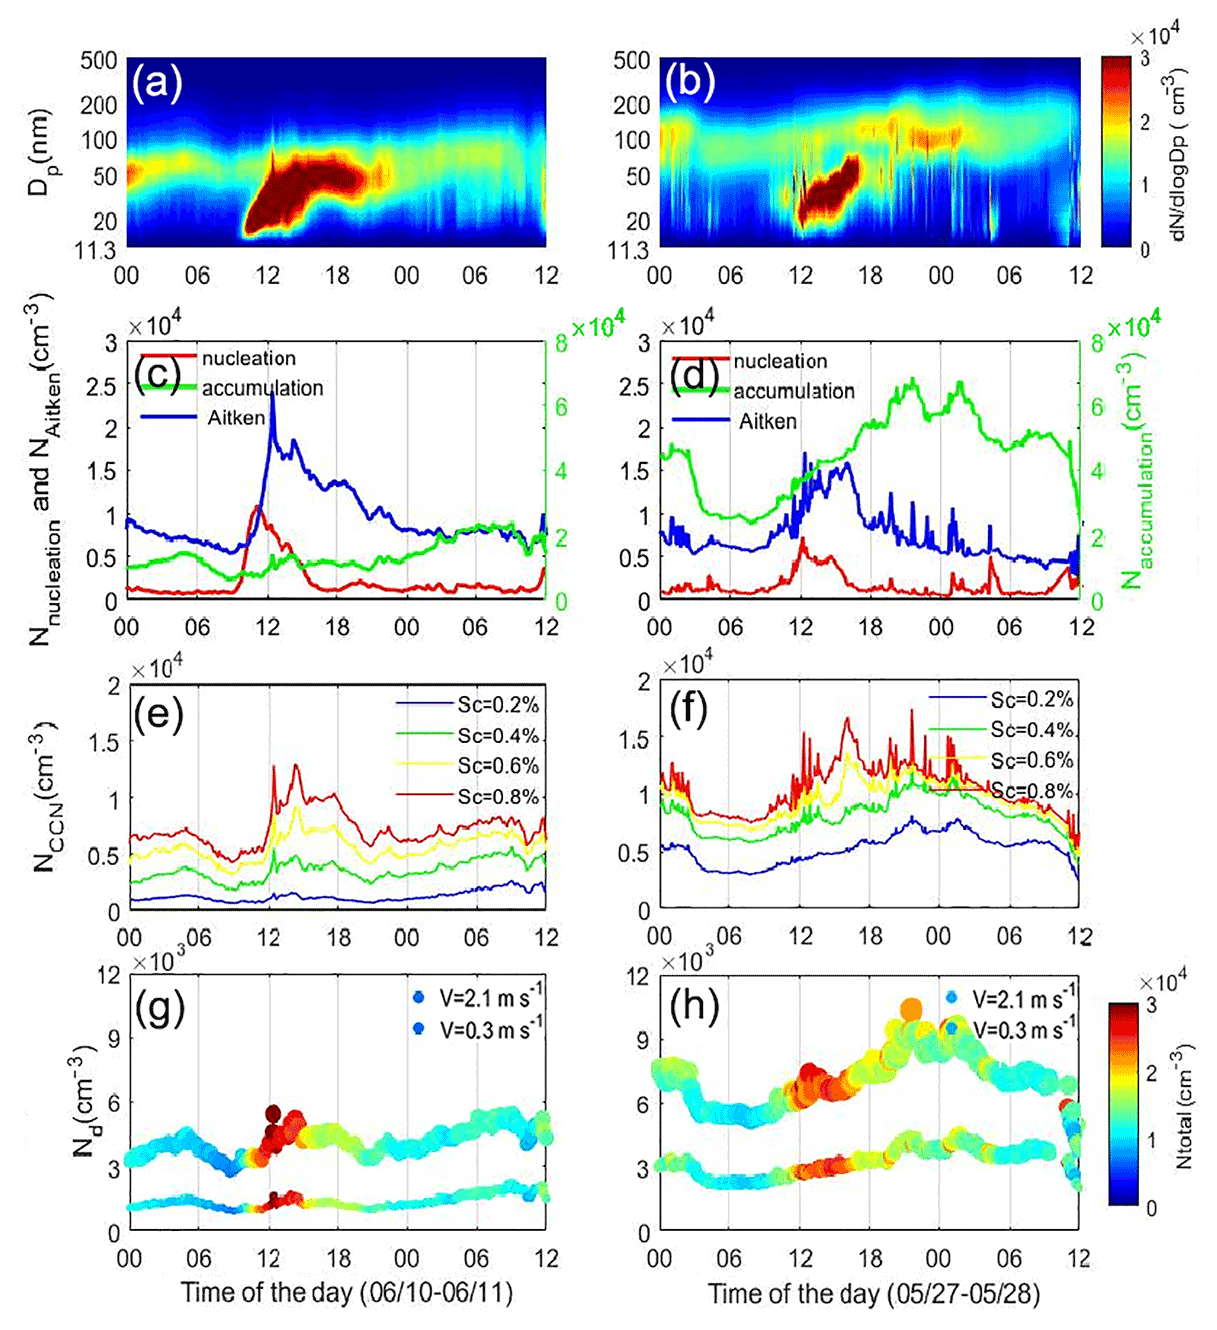
Figure 6Comparison of (a, b) the particle number size distribution PNSD, (c, d) aerosol particle number concentration NCN, (e, f) CCN number concentration NCCN and (g, h) cloud droplet number concentration Nd between a clean and a polluted NPF event. The clean NPF day is with a clean background (PM2.5=14 (µg/m3), and the polluted NPF day is with PM2.5 of 73 µg/m3.
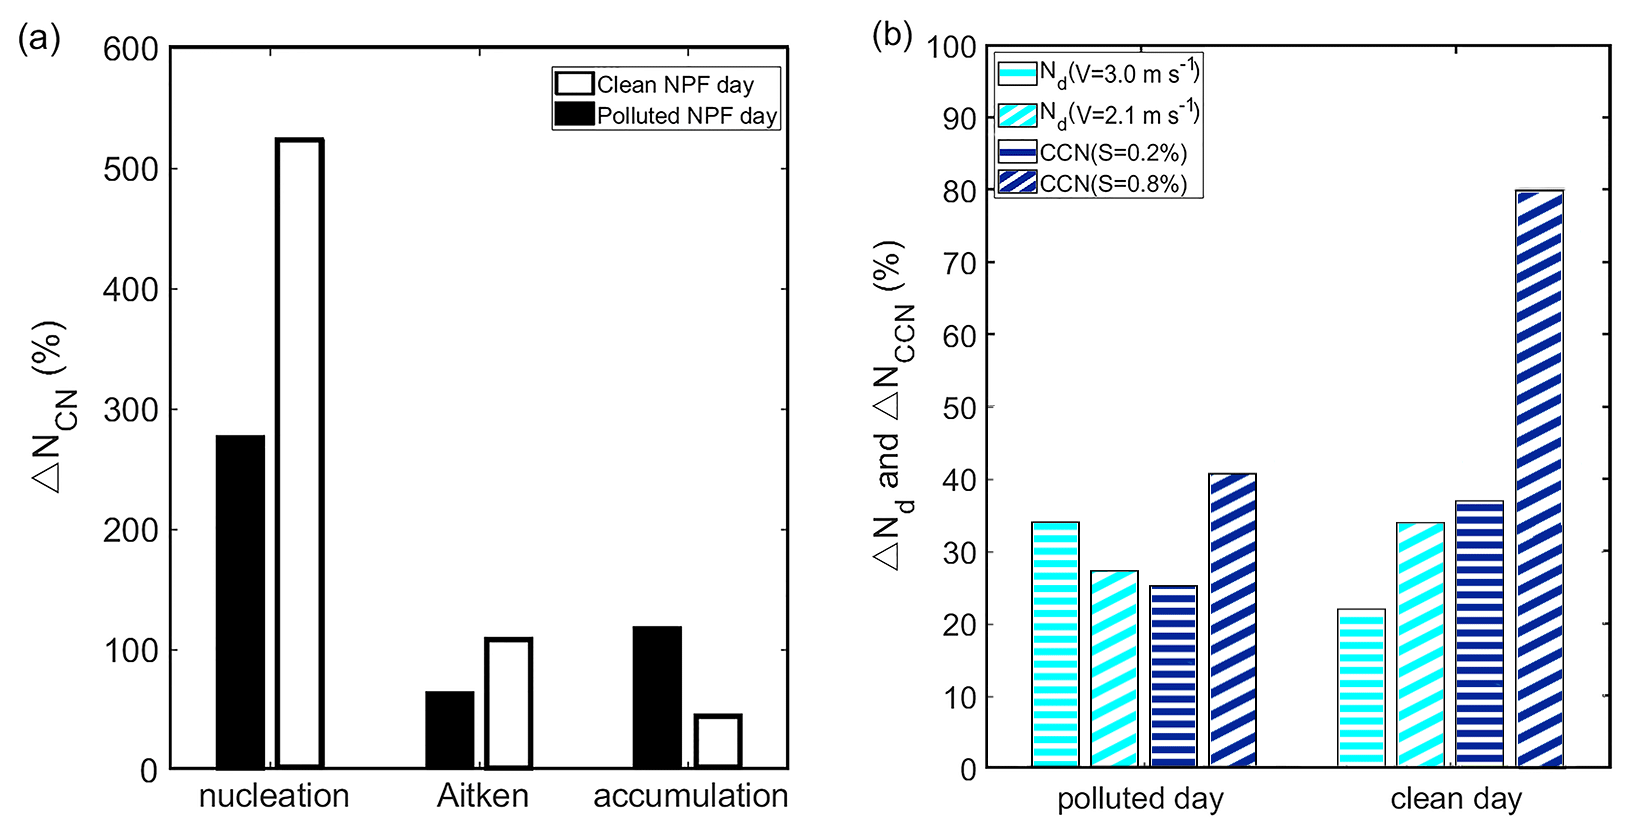
Figure 7Comparison of the increments of (a) total particle number concentration (NCN) and (b) CCN number concentration (NCCN) and cloud droplet number concentration (Nd) between the two different typical NPF events.
For both cases, the NCCN is increased with the evolution of the NPF events (Fig. 6a, b, e, f). But the magnitude of the enhancements in the two cases is quite different. The NCCN during NPF events on polluted days was generally twice than that of clean days (Fig. 6e and f) because there were a large number of preexisting CCN-sized aerosol particles on polluted NPF days. As a result, a larger increment of NCCN is derived on clean NPF days, showing 37 %–80 % and 25 %–41 % percentage increases of NCCN from NPF on clean and polluted days respectively (Fig. 7b). For Nd, the percentage increase on clean days was 22 % and 37 % and on polluted days 34 % and 26 % under updraft velocities of 0.3 and 2.1 m s−1. The percentage increases in Nd between clean and polluted days are comparable. This result further illustrates the effect of water vapor competition on Nd under high NCN in the polluted atmosphere. This suggests that it is critical to fully consider the background meteorological conditions (e.g., using dynamic water vapor under different updraft velocities) to simulate the Nd when evaluating the effect of NPF on clouds and the associated climate effects.
Table 2Quantitative evaluation of the contribution of primary emissions to Nd and NCCN.
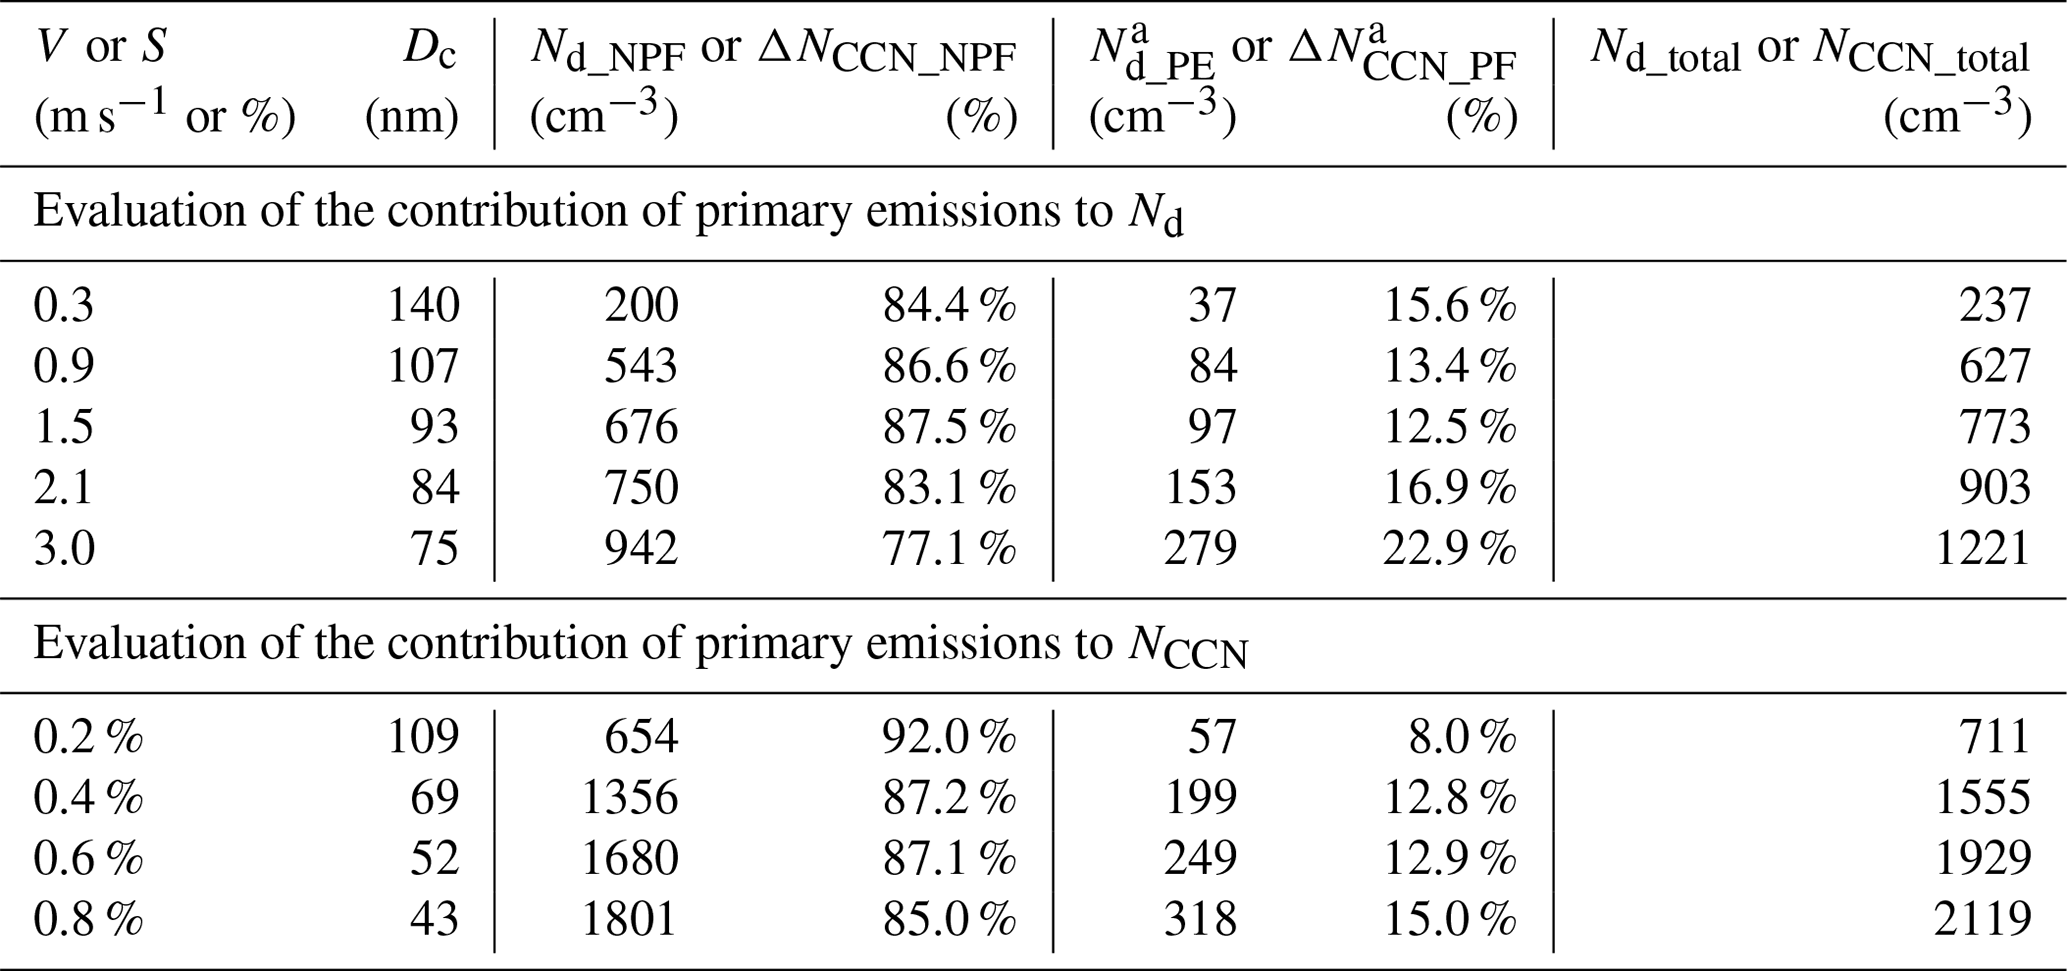
a PE, primary emission.
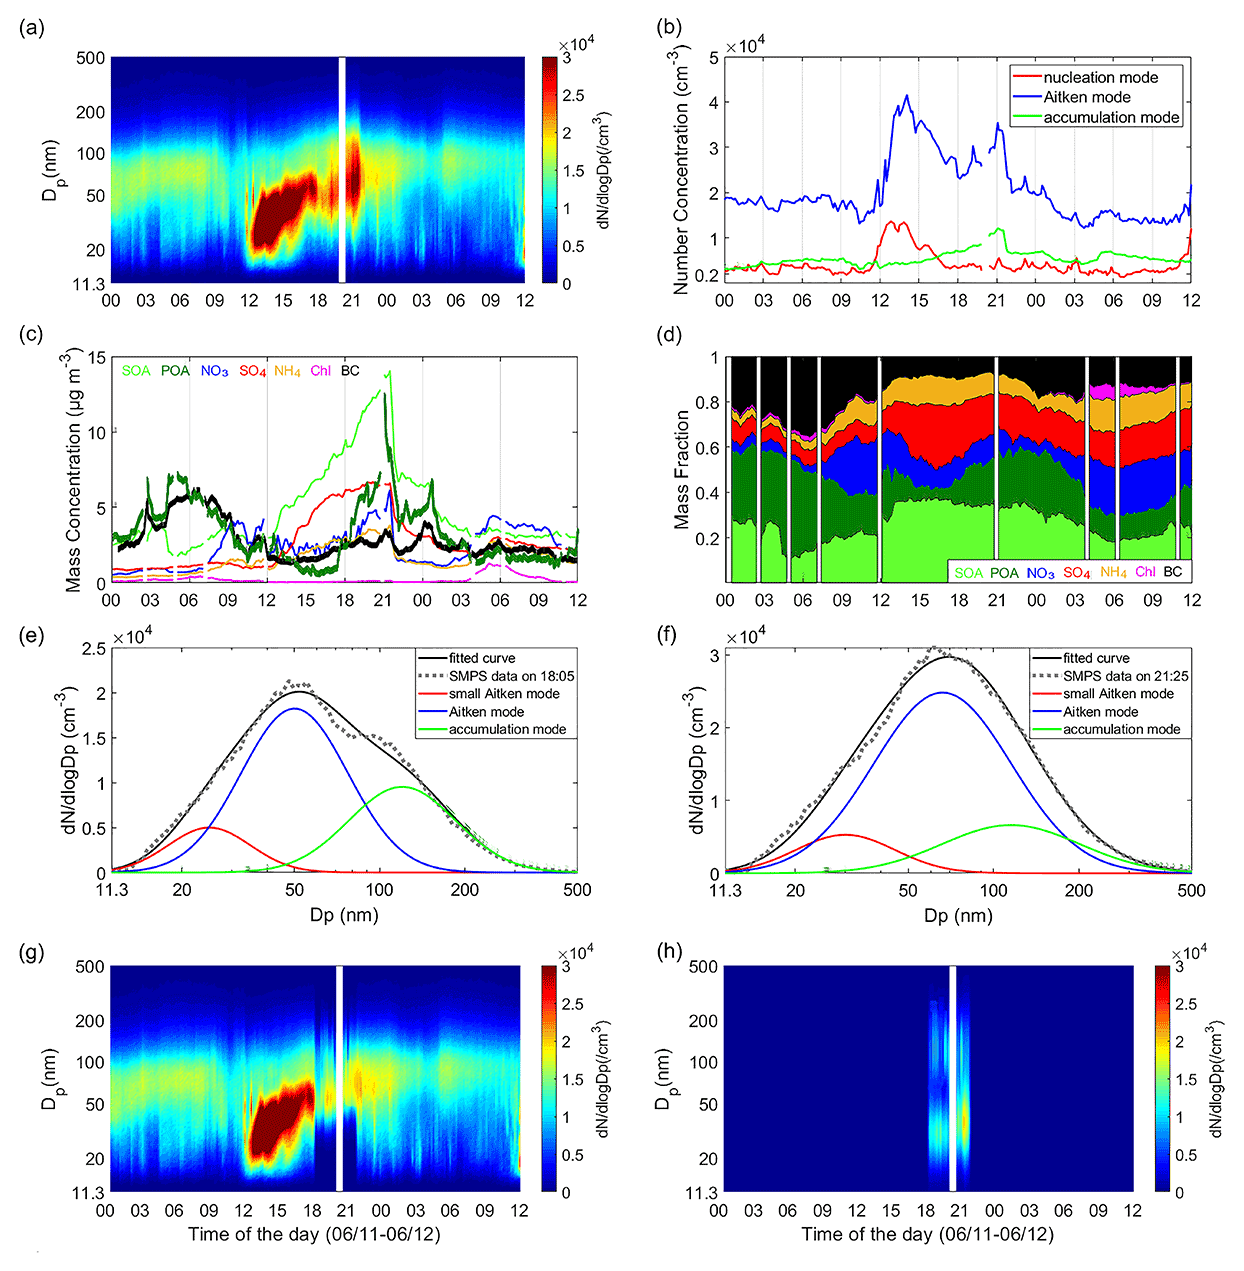
Figure 8Diurnal variations of the (a) aerosol size distribution, (b) particle number concentrations for different size modes, (c) mass concentrations of aerosol chemical composition and (d) mass fraction of aerosol chemical components, (e, f) fitted three modes of the particle number concentration PNSD at 18:00 and 21:30, and (g) diurnal variations of the separated NPF-related PNSD and (h) the PNSD of primary aerosols.
3.5 The impact of primary emissions during evening rush hour on the calculation of the contribution of NPF to NCCN and Nd: a case study
During the campaign, very high number concentrations of fine particles were observed during evening rush hour (as shown in Fig. 2a) when primary emissions related to automobile exhaust or cooking activities near the site may impact the PNSD. Those particles from primary emissions can serve as CCN and thereby impact the evaluation of the contribution of NPF to Nd. Therefore, taking the day of 11 June as an example, such an effect from primary emissions during evening rush hour is investigated (Fig. 8). On the day, 1 h after the burst of newly formed particles at ∼ 12:00, the Nd began to rise rapidly, and the increase of Nd continued until 21:30 (Fig. 1f). At ∼ 18:00, the primary emissions also begin to impact the NCCN and Nd. Note that a sudden decrease and dilution in the PNSD are due to a precipitation event at ∼ 21:30. From 18:00–21:30, the CCN and cloud droplets were from both the NPF source and the primary emissions. The impact of primary emissions is also indicated by the variations of particles composition during 18:00–22:00, when both the primary organic aerosols (POAs) and BC show a rapid increase in the mass concentration and fraction (Fig. 8c and d). Here, a positive matrix factorization (PMF) analysis was performed to separate the primary and secondary organic aerosol factors quantitatively for the purpose of source apportionment based on field measurement by an Aerodyne high-resolution time-of-flight aerosol mass spectrometer (HR-ToF-AMS) (Xu et al., 2017; Zhang et al., 2011). The PMF algorithm in the robust mode (Paatero and Tapper, 1994) was applied to the high-resolution mass spectra to resolve distinct organic aerosol factors representing primary and secondary sources and processes. More details about operation of the HR-ToF-AMS and PMF analysis also can be found in the supporting information of Liu et al. (2021).
To evaluate the impact of the primary emissions, it is critical to separate the particle modes representing the primary aerosols from the observed PNSD. According to the observed characteristics of PNSD, the newly formed particles continue to grow and are dominated by Aitken mode for several hours after the NPF occurred (Fig. 8a). The size mode of the newly formed particles during the rush hour is estimated by applying a growth rate of 3.2 ± 0.5 nm h−1, which is calculated by the variation of median particle size during 12:00–18:00. The calculation results show that the NPF-tracked particles can grow to ∼ 50–60 nm during the rush hour period. The primary particles from vehicles or cooking generally have a smaller size (∼ 30 nm) than the NPF-tracked mode and accumulation mode (∼ 100–120 nm) (Brines et al., 2015; Dall'Osto, et al., 2011; Harrison, et al., 2011), so we applied three modes to fit the PNSD from the beginning of the evening rush hour to the end, assuming a normal distribution. Note that the size mode for background aerosols almost coincides with the accumulation mode of primary emitted particles during the period. Since the mode and concentration of background aerosols do not change much before and after the occurrence of new particles (Fig. 8a, b), the impact of background aerosol is thus deducted from the fitting accumulation mode. The fitted result shows a major peak in the Aitken mode at ∼ 50 nm that is related to the NPF event and two minor peaks in Aitken (∼ 30 nm) and accumulation (∼ 100–120 nm) mode (Fig. 8e, f) that are associated with the primary vehicle or cooking emissions. Figure 8g and h show the separated PNSD of the NPF-related and primary aerosols respectively. Then the increments of NCCN and Nd from NPF are obtained from the PNSD of NPF mode, and the increments of NCCN and Nd from primary emissions are obtained by subtracting the increment of NCCN and Nd by NPF from the total increment of Nd.
The calculated results are summarized in Table 2. For Nd, the average contribution of primary emission to Nd is 15.6 %, 13.4 %, 12.5 %, 16.9 % and 22.9 % cm−3 for updraft velocities of 0.3, 0.9, 1.5, 2.1 and 3 m s−1 respectively. The proportion of contribution from NPF and primary emission to the Nd increment changes with the variation of V. The higher proportion of contribution from primary emission is obtained at higher V, which may be determined by the different characteristics between atmospheric particles emitted from the evening traffic sources and generated from NPF events. For NCCN, the average contribution from primary emissions is 8.0 %, 12.8 %, 12.9 % and 15.0 % at S of 0.2 %, 0.4 %, 0.6 % and 0.8 % respectively. Compared with Nd, the contribution percentage of primary emission to NCCN is smaller due to the total NCCN being much more than the total Nd. Our results show a considerable impact of these primary sources when evaluating the contribution of NPF to cloud droplet number, highlighting the importance of considering the influence from multiple (i.e., secondary and primary) sources on clouds in the polluted atmosphere. Finally, it is worth noting that the dynamic changes of PBL would also impact the NCCN and Nd during the period, and the decrease in the height of PBL from the daytime to evening will result in an increase of NCCN or Nd. However, for this case, the impact from primary emissions is much more prominent, as indicated by the sharply raised particle number concentrations during the rush hour (Fig. 8b).
In this study, we quantified the contribution of NPF to Nd at typical updraft velocities in clouds using field measurements of aerosol number size distributions and chemical composition in urban Beijing. We show that NPF drives the variations of NCCN and Nd. About 32 %–65 % NCCN are increased by NPF events for supersaturation of 0.2 %–0.8 % in the polluted atmosphere. And the Nd is increased about 32 %–40 % by NPF at V=0.3–3 m s−1 accordingly. A significant reduction in Nd is observed due to water vapor competition with consideration of actual environmental updraft velocity, with decrease rates of 11.8 % ± 5.0 % at V=3 m s−1 and 19.0 % ± 4.5 % at V=0.3 m s−1 in comparison with a constant supersaturation. The effect of water vapor competition becomes smaller at larger V, at which a greater Smax can be achieved. Essentially, water vapor competition led to the reduction in Nd by decreasing the environmental Smax for the activation of aerosol particles. It is shown that Smax was decreased by 14.5 ± 3.5 % to 11.7 ± 3.9 % for V=0.3–3 m s−1. Our results suggest significant suppression of cloud droplet formation due to the water vapor competition, particularly at extremely high aerosol particle number concentrations. As a result, although a larger enhancement of CCN-sized particles by NPF event is derived on clean NPF days when there are few preexisting background aerosol particles, there is no large discrepancy in the enhancement of Nd by NPF between the clean and polluted NPF days. Finally, we show a considerable impact of the primary sources when evaluating the contribution of NPF to cloud droplet number using a case study. Our study highlights the importance of full consideration of both the environmental meteorological conditions and multiple sources (i.e., secondary and primary) to evaluate the effect of NPF on clouds and the associated climate effects. For example, Merikanto et al. (2010) used model to simulate the variation of CDNC from the year 1850 to 2000 and showed that NPF made a nearly equal contribution (16 %–13.5 %) to global CDNC in all those years, leading to about a 50 % enhancement in the year from 1850 to 2000 in cloud albedo. There are still large uncertainties in how to accurate quantitatively assess the response of these climate effects to NPF. This study is carried out in a polluted urban area and is beneficial for the research on aerosol–cloud microphysical processes. It provides a new perspective for follow-up research in the urban atmosphere. Note that there are still limitations of our studies, as we only investigated several NPF cases within a short period due to the limited measurement data. The small sample size might cause bias in the results. Further studies based on more measurement data, i.e., with longer time periods and more observational sites, are warranted to verify and refine our results, so as to parameterize the impact of NPF events on cloud, precipitation, and radiative forcing in models.
All data used in the study are available at https://data.mendeley.com/datasets/hkkzbn4zv3/1 (last access: 4 January 2021, Zhang, 2021) or from the corresponding author upon request (fang.zhang@bnu.edu.cn).
The supplement related to this article is available online at: https://doi.org/10.5194/acp-21-14293-2021-supplement.
FZ and SJ conceived the conceptual development of the paper. LC, YS and JR contributed measurements. SJ directed and performed the experiments with LC, JL, JR, XY, ZL and FZ. SJ conducted the data analysis and wrote the draft of the paper. All authors commented on the paper.
The authors declare that they have no conflict of interest.
Publisher's note: Copernicus Publications remains neutral with regard to jurisdictional claims in published maps and institutional affiliations.
This work was supported by the National Basic Research Program of China (grant no. 2017YFC1501702) and the National Natural Science Foundation of China (grant nos. 41675141 and 41975174).
This research has been supported by the National Key Research and Development Program of China (grant no. 2017YFC1501702) and the National Natural Science Foundation of China (grant nos. 41675141 and 41975174).
This paper was edited by Veli-Matti Kerminen and reviewed by two anonymous referees.
Albrecht, B. A.: Aerosols, cloud microphysics, and fractional cloudiness, Science, 245, 1227–1230, 1989.
Altstädter, B., Platis, A., Wehner, B., Scholtz, A., Wildmann, N., Hermann, M., Käthner, R., Baars, H., Bange, J., and Lampert, A.: ALADINA – an unmanned research aircraft for observing vertical and horizontal distributions of ultrafine particles within the atmospheric boundary layer, Atmos. Meas. Tech., 8, 1627–1639, https://doi.org/10.5194/amt-8-1627-2015, 2015.
Abdul-Razzak, H., Ghan, S., and Rivera-Carpio, C.: A parametreization of aerosol activation: 1. Single aerosol types, J. Geophys. Res., 103, 6123–6131, 1998.
Abdul-Razzak, H. and Ghan, S.: A parametreization of aerosol activation: 2. Multiple aerosol types, J. Geophys. Res., 105, 6837–6844, 2000.
Asmi, E., Kivekäs, N., Kerminen, V.-M., Komppula, M., Hyvärinen, A.-P., Hatakka, J., Viisanen, Y., and Lihavainen, H.: Secondary new particle formation in Northern Finland Pallas site between the years 2000 and 2010, Atmos. Chem. Phys., 11, 12959–12972, https://doi.org/10.5194/acp-11-12959-2011, 2011.
Boucher, O. and Lohmann, U.: The sulfate-CCN-cloud albedo effect, Tellus, 47, 281–300, 1995.
Bousiotis, D., Dall'Osto, M., Beddows, D. C. S., Pope, F. D., and Harrison, R. M.: Analysis of new particle formation (NPF) events at nearby rural, urban background and urban roadside sites, Atmos. Chem. Phys., 19, 5679–5694, https://doi.org/10.5194/acp-19-5679-2019, 2019.
Brines, M., Dall'Osto, M., Beddows, D. C. S., Harrison, R. M., Gómez-Moreno, F., Núñez, L., Artíñano, B., Costabile, F., Gobbi, G. P., Salimi, F., Morawska, L., Sioutas, C., and Querol, X.: Traffic and nucleation events as main sources of ultrafine particles in high-insolation developed world cities, Atmos. Chem. Phys., 15, 5929–5945, https://doi.org/10.5194/acp-15-5929-2015, 2015.
Cai, M., Liang, B., Sun, Q., Zhou, S., Chen, X., Yuan, B., Shao, M., Tan, H., and Zhao, J.: Effects of continental emissions on cloud condensation nuclei (CCN) activity in the northern South China Sea during summertime 2018, Atmos. Chem. Phys., 20, 9153–9167, https://doi.org/10.5194/acp-20-9153-2020, 2020.
Collins, D. R., Flagan, R. C., and Seinfeld, J. H.: Improved inversion of scanning DMA data, Aerosol Sci. Tech., 36, 1–9, 2002.
Dal, M., Kulmala, M., Riipinen, I., Wagner, R., Hussein, T., Aalto, P. P., and Lehtinen, K. E. J.: Formation and growth of fresh atmospheric aerosols: eight years of aerosol size distribution data from SMEAR II, Hyytiälä, Finland, Boreal Environ. Res., 10, 323–336, 2005.
Dall'Osto, M., Thorpe, A., Beddows, D. C. S., Harrison, R. M., Barlow, J. F., Dunbar, T., Williams, P. I., and Coe, H.: Remarkable dynamics of nanoparticles in the urban atmosphere, Atmos. Chem. Phys., 11, 6623–6637, https://doi.org/10.5194/acp-11-6623-2011, 2011.
Duan, J., Wang, Y., Xie, X., Li, M., Tao, J., Wu, Y., Cheng, T.: Influence of pollutants on activity of aerosol cloud condensation nuclei (CCN) during pollution and post-rain periods in Guangzhou, southern China, Sci. Tot. Environ., 642, 1008–1019, https://doi.org/10.1016/j.scitotenv.2018.06.053, 2018.
Fan, J., Leung, R., Rosenfeld, D., Chen, Q., Li, Z., Zhang, J., and Yan, H.: Microphysical effects determine macrophysical response for aerosol impacts on deep convective clouds, P. Natl. Aacad. Sci. USA, 110, 4581–4590, https://doi.org/10.1073/pnas.1316830110, 2013.
Fan, X., Liu, J., Zhang, F., Chen, L., Collins, D., Xu, W., Jin, X., Ren, J., Wang, Y., Wu, H., Li, S., Sun, Y., and Li, Z.: Contrasting size-resolved hygroscopicity of fine particles derived by HTDMA and HR-ToF-AMS measurements between summer and winter in Beijing: the impacts of aerosol aging and local emissions, Atmos. Chem. Phys., 20, 915–929, https://doi.org/10.5194/acp-20-915-2020, 2020.
Fountoukis, C. and Nenes, A.: Continued development of a cloud droplet formation parameterization for global climate models, J. Geophys. Res., 110, D11212, https://doi.org/10.1029/2004JD005591, 2005.
Genz, C., Schrödner, R., Heinold, B., Henning, S., Baars, H., Spindler, G., and Tegen, I.: Estimation of cloud condensation nuclei number concentrations and comparison to in situ and lidar observations during the HOPE experiments, Atmos. Chem. Phys., 20, 8787–8806, https://doi.org/10.5194/acp-20-8787-2020, 2020.
Ghan, S., Chung, C., and Penner, J.: A parameterization of cloud droplet nucleation part I: single aerosol type, Atmos. Res., 30, 198–221, https://doi.org/10.1016/0169-8095(93)90024-I, 1993.
Gunthe, S. S., King, S. M., Rose, D., Chen, Q., Roldin, P., Farmer, D. K., Jimenez, J. L., Artaxo, P., Andreae, M. O., Martin, S. T., and Pöschl, U.: Cloud condensation nuclei in pristine tropical rainforest air of Amazonia: size-resolved measurements and modeling of atmospheric aerosol composition and CCN activity, Atmos. Chem. Phys., 9, 7551–7575, https://doi.org/10.5194/acp-9-7551-2009, 2009.
Harrison, R. M., Beddows, D. and Dall'Osto, M.: PMF Analysis of Wide-Range Particle Size Spectra Collected on a Major Highway, Environ. Sci. Tech., 45, 5522, https://doi.org/10.1021/es201998m, 2011.
Hudson, J. G. , Noble, S., and Tabor, S.: Cloud supersaturations from CCN spectra hoppel minima, J. Geophys. Res.-Atmos., 120, 3436–3452, https://doi.org/10.1002/2014JD022669, 2015.
Kalkavouras, P., Bossioli, E., Bezantakos, S., Bougiatioti, A., Kalivitis, N., Stavroulas, I., Kouvarakis, G., Protonotariou, A. P., Dandou, A., Biskos, G., Mihalopoulos, N., Nenes, A., and Tombrou, M.: New particle formation in the southern Aegean Sea during the Etesians: importance for CCN production and cloud droplet number, Atmos. Chem. Phys., 17, 175–192, https://doi.org/10.5194/acp-17-175-2017, 2017.
Kalkavouras, P., Bougiatioti, A., Kalivitis, N., Stavroulas, I., Tombrou, M., Nenes, A., and Mihalopoulos, N.: Regional new particle formation as modulators of cloud condensation nuclei and cloud droplet number in the eastern Mediterranean, Atmos. Chem. Phys., 19, 6185–6203, https://doi.org/10.5194/acp-19-6185-2019, 2019.
Kazil, J., Stier, P., Zhang, K., Quaas, J., Kinne, S., O'Donnell, D., Rast, S., Esch, M., Ferrachat, S., Lohmann, U., and Feichter, J.: Aerosol nucleation and its role for clouds and Earth's radiative forcing in the aerosol-climate model ECHAM5-HAM, Atmos. Chem. Phys., 10, 10733–10752, https://doi.org/10.5194/acp-10-10733-2010, 2010.
Kerminen, V.-M., Paramonov, M., Anttila, T., Riipinen, I., Fountoukis, C., Korhonen, H., Asmi, E., Laakso, L., Lihavainen, H., Swietlicki, E., Svenningsson, B., Asmi, A., Pandis, S. N., Kulmala, M., and Petäjä, T.: Cloud condensation nuclei production associated with atmospheric nucleation: a synthesis based on existing literature and new results, Atmos. Chem. Phys., 12, 12037–12059, https://doi.org/10.5194/acp-12-12037-2012, 2012.
Kerminen, V. M., Chen, X., Vakkari, V., Petäjä, T., Kulmala, M., and Bianchi, F.: Atmospheric new particle formation and growth: review of field observations, Environ. Res. Lett., 13, 103003, https://doi.org/10.1088/1748-9326/aadf3c, 2018.
Khvorostyanov, V. I., and Curry, J. A.: A simple analytical model of aerosol properties with account for hygroscopic growth: 1. Equilibrium size spectra and cloud condensation nuclei activity spectra, J. Geophys. Res., 104, 2175–2184, https://doi.org/10.1029/98JD02687, 1999.
Köhler, H.: The nucleus in and the growth of hygroscopic droplets, Transactions of the Faraday Society, 32, 1152–1161, https://doi.org/10.1039/tf9363201152, 1936.
Kulmala, M. and Kerminen, V. M.: On the formation and growth of atmospheric nanoparticles, Atmos. Res., 90, 132–150, https://doi.org/10.1016/j.atmosres.2008.01.005, 2008.
Kulmala, M., Petäjä, T., Nieminen, T., Sipilä, M., Manninen, H. E., Lehtipalo, K., Dal, Maso, M., Aalto, P., Junninen, H., Paasonen, P., Riipinen, I., Lehtinen, K. E. J., Laaksonen, A., and Kerminen, V.-M.: Measurement of the nucleation of atmospheric aerosol particles, Nat. Protocol., 7, 1651–1667, https://doi.org/10.1038/nprot.2012.091, 2012.
Leaitch, W. R., Strapp, J. W., and Isaac, G. A.: Cloud droplet nucleation and cloud scavenging of aerosol sulphate in polluted atmospheres, Tellus B, 38, 328–344, https://doi.org/10.1111/j.1600-0889.1986.tb00258.x ,1986
Leino, K., Nieminen, T., Manninen, H. E., Petäjä, T., Kerminen, V. M., and Kulmala, M.: Intermediate ions as a strong indicator of new particleformation bursts in a boreal forest, Boreal Environ. Res., 21, 274–286, 2016.
Li, Y., Zhang, F., Li, Z., Sun, L., Wang, Z., Li, P., Sun, Y., Ren, J., Wang, Y., and Cribb, M.: Influences of aerosol physiochemical properties and new particle formation on CCN activity from observation at a suburban site of China, Atmos. Res., 188, 80–89, https://doi.org/10.1016/j.atmosres.2017.01.009, 2017.
Li, Z., Guo, J., Ding, A., Liao, H., Liu, J., Sun, Y., Wang, T., Xue, H., Zhang, H., and Zhu, B.: Aerosols and boundary-layer interactions and impact on air quality, Natl. Sci. Rev., 4, 810–833, https://doi.org/10.1093/nsr/nwx117, 2017.
Li, Z., Feng, N., Fan, J., Liu, Y., and Ding, Y.: Long-term impacts of aerosols on the vertical development of clouds and precipitation, Nat. Geosci., 4, 888–894, https://doi.org/10.1038/ngeo1313, 2011.
Liu, C., Wang, T., Rosenfeld, D., Zhu, Y., Yue, Z., and Yu, X.: Anthropogenic effects on cloud condensation nuclei distribution and rain initiation in East Asia, Geophys. Res. Lett., 47, e2019GL086184, https://doi.org/10.1029/2019GL086184, 2019.
Liu, J., Zhang, F., Xu, W., Sun, Y., Chen, L., and Li, S.: Hygroscopicity of organic aerosols linked to formation mechanisms. Geophys. Res. Lett., 48, e2020GL091683, https://doi.org/10.1029/2020GL091683, 2021.
Ma, N., Zhao, C., Tao, J., Wu, Z., Kecorius, S., Wang, Z., Größ, J., Liu, H., Bian, Y., Kuang, Y., Teich, M., Spindler, G., Müller, K., van Pinxteren, D., Herrmann, H., Hu, M., and Wiedensohler, A.: Variation of CCN activity during new particle formation events in the North China Plain, Atmos. Chem. Phys., 16, 8593–8607, https://doi.org/10.5194/acp-16-8593-2016, 2016.
Martin, G. and Johnson, D.: The measurement and parameterization of effective radius of droplets in warm stratocumulus clouds, J. Atmos. Sci., 51, 1823–1842, https://doi.org/10.1175/1520-0469(1994)051<1823:TMAPOE>2.0.CO;2, 1994.
Merikanto, J., Spracklen, D. V., Pringle, K. J., and Carslaw, K. S.: Effects of boundary layer particle formation on cloud droplet number and changes in cloud albedo from 1850 to 2000, Atmos. Chem. Phys., 10, 695–705, https://doi.org/10.5194/acp-10-695-2010, 2010.
Meskhidze, N., Nenes, A., Conant, W., and Seinfeld, J.: Evaluation of a new cloud droplet activation parameterization with in situ data from CRYSTAL-FACE and CSTRIPE, J. Geophys. Res., 110, D16202, https://doi.org/10.1029/2004JD005703, 2005.
Morales, R. and Nenes, A.: Characteristic updrafts for computing distribution-averaged cloud droplet number and stratocumulus cloud properties, J. Geophys. Res., 115, D18220, https://doi.org/10.1029/2009JD013233, 2010.
Morales Betancourt, R. and Nenes, A.: Understanding the contributions of aerosol properties and parameterization discrepancies to droplet number variability in a global climate model, Atmos. Chem. Phys., 14, 4809–4826, https://doi.org/10.5194/acp-14-4809-2014, 2014.
Nenes, A. and Seinfeld, J. H.: Parameterization of cloud droplet formation in global climate models, J. Geophys. Res, 108, 4415, https://doi.org/10.1029/2002JD002911, 2003.
Nenes, A., Chan, S., Abdul-Razzak, H., Chuang, P., and Seinfeld, J. H.: Kinetic limitations on cloud droplet formation and impact on cloud albedo, Tellus B, 53, 133–149, https://doi.org/10.3402/tellusb.v53i2.16569, 2001.
Ng, N. L., Herndon, S. C., Trimborn, A., Canagaratna, M. R., Croteau, P. L., and Onasch, T. B.: An aerosol chemical speciation monitor (ACSM) for routine monitoring of the composition and mass concentrations of ambient aerosol, Aerosol Sci. Tech., 45, 780-794, https://doi.org/10.1080/02786826.2011.560211, 2011.
Paatero, P. and Tapper, U.: Positive matrix factorization: A nonnegative factor model with optimal utilization of error-estimates of data values, J. Citation Rep., 5, 112–126, https://doi.org/10.1002/env.3170050203, 1994.
Peng, J. F., Hu, M., Wang, Z. B., Huang, X. F., Kumar, P., Wu, Z. J., Guo, S., Yue, D. L., Shang, D. J., Zheng, Z., and He, L. Y.: Submicron aerosols at thirteen diversified sites in China: size distribution, new particle formation and corresponding contribution to cloud condensation nuclei production, Atmos. Chem. Phys., 14, 10249–10265, https://doi.org/10.5194/acp-14-10249-2014, 2014.
Peng,Y., Dong, Y., and Li, X. M.: Different Characteristics of New Particle Formation Events at Two Suburban Sites in Northern China, Atmosphere, 8, 258, https://doi.org/10.3390/atmos8120258, 2017.
Petters, M. D. and Kreidenweis, S. M.: A single parameter representation of hygroscopic growth and cloud condensation nucleus activity, Atmos. Chem. Phys., 7, 1961–1971, https://doi.org/10.5194/acp-7-1961-2007, 2007.
Ramanathan, V., Crutzen, P. J., Kiehl, J. T., and Rosenfeld, D.: Aerosols, climate, and the hydrological cycle, Science, 294, 2119–2124, https://doi.org/10.1126/science.1064034, 2001.
Ren, J., Zhang, F., Wang, Y., Collins, D., Fan, X., Jin, X., Xu, W., Sun, Y., Cribb, M., and Li, Z.: Using different assumptions of aerosol mixing state and chemical composition to predict CCN concentrations based on field measurements in urban Beijing, Atmos. Chem. Phys., 18, 6907–6921, https://doi.org/10.5194/acp-18-6907-2018, 2018.
Rose, C., Sellegri, K., Moreno, I., Velarde, F., Ramonet, M., Weinhold, K., Krejci, R., Andrade, M., Wiedensohler, A., Ginot, P., and Laj, P.: CCN production by new particle formation in the free troposphere, Atmos. Chem. Phys., 17, 1529–1541, https://doi.org/10.5194/acp-17-1529-2017, 2017.
Seinfeld, J. H., Bretherton, C. S., Carslaw, K. S., Coe, H., DeMott, P. J., Dunlea, E. J., Feingold, G., Ghan, S. J., Guenther, A.B., Kahn, R. A., Kracunas, I. P., Kreidenweis, S. M., Molina, M. J., Nenes, A., Penner, J. E., Prather, K. A., Ramanathan, V., Ramaswamy, V., Rasch, P. J., Ravishankara, A. R., Rosenfeld, D., Stephens, G., and Wood R.: Improving Our Fundamental Understanding of the Role of Aerosol-Cloud Interactions in the Climate System, P. Nat. Acad. Sci. USA, 113, 5781–5790, https://doi.org/10.1073/pnas.1514043113, 2016.
Shi, J., Khan, A., Harrison, R.: Measurements of ultrafine particle concentration and size distribution in the urban atmosphere, Sci. Tot. Environ., 235, 51–64, https://doi.org/10.1016/S0048-9697(99)00189-8, 1999.
Spracklen, D. V., Carslaw, K. S., Merikanto, J., Mann, G. W., Reddington, C. L., Pickering, S., Ogren, J. A., Andrews, E., Baltensperger, U., Weingartner, E., Boy, M., Kulmala, M., Laakso, L., Lihavainen, H., Kivekäs, N., Komppula, M., Mihalopoulos, N., Kouvarakis, G., Jennings, S. G., O'Dowd, C., Birmili, W., Wiedensohler, A., Weller, R., Gras, J., Laj, P., Sellegri, K., Bonn, B., Krejci, R., Laaksonen, A., Hamed, A., Minikin, A., Harrison, R. M., Talbot, R., and Sun, J.: Explaining global surface aerosol number concentrations in terms of primary emissions and particle formation, Atmos. Chem. Phys., 10, 4775–4793, https://doi.org/10.5194/acp-10-4775-2010, 2010.
Stanier, C., Khlystov, A., and Pandis, S.: Ambient aerosol size distributions and number concentrations measured during the Pittsburgh Air Quality Study (PAQS), Atmos. Environ., 38, 3275–3284, https://doi.org/10.1016/j.atmosenv.2004.03.020, 2004.
Sullivan, S. C., Lee, D., Oreopoulos, L., and Nenes, A.: The role of updraft velocity in temporal variability of cloud hydrometeor number, P. Natl. Acad. Sci. USA, 113, 5781–5790, https://doi.org/10.1073/pnas.1514043113, 2016.
Sun, Y. L., Wang, Z. F., Du, W., Zhang, Q., Wang, Q. Q., Fu, P. Q., Pan, X. L., Li, J., Jayne, J., and Worsnop, D. R.: Long-term real-time measurements of aerosol particle composition in Beijing, China: seasonal variations, meteorological effects, and source analysis, Atmos. Chem. Phys., 15, 10149–10165, https://doi.org/10.5194/acp-15-10149-2015, 2015.
Tao, J., Kuang, Y., Ma, N., Hong, J., Sun, Y., Xu, W., Zhang, Y., He, Y., Luo, Q., Xie, L., Su, H., and Cheng, Y.: Secondary aerosol formation alters CCN activity in the North China Plain, Atmos. Chem. Phys., 21, 7409–7427, https://doi.org/10.5194/acp-21-7409-2021, 2021.
Topping, D. O., McFiggans, G. B., and Coe, H.: A curved multi-component aerosol hygroscopicity model framework: Part 1 – Inorganic compounds, Atmos. Chem. Phys., 5, 1205–1222, https://doi.org/10.5194/acp-5-1205-2005, 2005.
Twomey, S.: The influence of pollution on the shortwave albedo of clouds, J. Atmos. Sci., 34, 1149–1152, https://doi.org/10.1175/1520-0469(1977)0342.0.CO;2, 1977.
Wang, S. C. and Flagan, R. C.: Scanning Electrical Mobility Spectrometer, Aerosol Sci. Tech., 13, 230–240, https://doi.org/10.1080/02786829008959441, 1990.
Wang, Y., Zhang, F., Li, Z., Tan, H., Xu, H., Ren, J., Zhao, J., Du, W., and Sun, Y.: Enhanced hydrophobicity and volatility of submicron aerosols under severe emission control conditions in Beijing, Atmos. Chem. Phys., 17, 5239–5251, https://doi.org/10.5194/acp-17-5239-2017, 2017.
Wiedensohler, A., Birmili, W., Nowak, A., Sonntag, A., Weinhold, K., Merkel, M., Wehner, B., Tuch, T., Pfeifer, S., Fiebig, M., Fjäraa, A. M., Asmi, E., Sellegri, K., Depuy, R., Venzac, H., Villani, P., Laj, P., Aalto, P., Ogren, J. A., Swietlicki, E., Williams, P., Roldin, P., Quincey, P., Hüglin, C., Fierz-Schmidhauser, R., Gysel, M., Weingartner, E., Riccobono, F., Santos, S., Grüning, C., Faloon, K., Beddows, D., Harrison, R., Monahan, C., Jennings, S. G., O'Dowd, C. D., Marinoni, A., Horn, H.-G., Keck, L., Jiang, J., Scheckman, J., McMurry, P. H., Deng, Z., Zhao, C. S., Moerman, M., Henzing, B., de Leeuw, G., Löschau, G., and Bastian, S.: Mobility particle size spectrometers: harmonization of technical standards and data structure to facilitate high quality long-term observations of atmospheric particle number size distributions, Atmos. Meas. Tech., 5, 657–685, https://doi.org/10.5194/amt-5-657-2012, 2012.
Wiedensohler, A., Chen, Y. F., Nowak, A., Wehner, B., Achtert, P., Berghof, M., Birmili, W., Wu, Z. J., Hu, M., Zhu, T., Takegawa, N., Kita, K., Kondo, Y., Lou, S. R., Hofzumahaus, A., Holland, F., Wahner, A., Gunthe, S. S., Rose, D., Su, H., and Pöschl, U.: Rapid aerosol particle growth and increase of cloud condensation nucleus activity by secondary aerosol formation and condensation: A case study for regional air pollution in northeastern China, J. Geophys. Res., 114, D00G08, https://doi.org/10.1029/2008JD010884, 2008.
Wu, Z., Hu, M., Liu, S., Wehner, B., and Wiedensohler, A.: Particle number size distribution in the urban atmosphere of Beijing, China, Atmos. Environ., 42, 7967–7980, https://doi.org/10.1016/j.atmosenv.2008.06.022, 2008.
Wu, Z. J., Hu, M., and Yue, D. L.: Evolution of particle number size distribution in an urban atmosphere during episodes of heavy pollution and new particle formation, Sci. China Earth Sci., 54, 1772–1778, https://doi.org/10.1007/s11430-011-4227-9, 2011.
Wu, Z. J., Poulain, L., Birmili, W., Größ, J., Niedermeier, N., Wang, Z. B., Herrmann, H., and Wiedensohler, A.: Some insights into the condensing vapors driving new particle growth to CCN sizes on the basis of hygroscopicity measurements, Atmos. Chem. Phys., 15, 13071–13083, https://doi.org/10.5194/acp-15-13071-2015, 2015.
Xu, W. Q., Han, T. T., Du, W., Wang, Q. Q., Chen, C., Zhao, J.: Effects of aqueous-phase and photochemical processing on secondary organic aerosol formation and evolution in Beijing, China, Environ. Sci. Tech., 51, 762–770, https://doi.org/10.1021/acs.est.6b04498, 2017.
Yue, D. L., Hu, M., Zhang, R. Y., Wu, Z. J., Su, H., Wang, Z. B., Peng, J. F., He, L. Y., Huang, X. F., Gong, Y. G., and Wiedensohler, A.: Potential contribution of new particle formation to cloud condensation nuclei in Beijing, Atmos. Environ., 45, 6070–6077, https://doi.org/10.1016/j.atmosenv.2011.07.037, 2011.
Zimmerman, A. , Petters, M. D., and Meskhidze, N.: Observations of new particle formation, modal growth rates, and direct emissions of sub-10 nm particles in an urban environment, Atmos. Environ., 242, 117835, https://doi.org/10.1016/j.atmosenv.2020.117835, 2020.
Zhang, F., Li, Y., Li, Z., Sun, L., Li, R., Zhao, C., Wang, P., Sun, Y., Liu, X., Li, J., Li, P., Ren, G., and Fan, T.: Aerosol hygroscopicity and cloud condensation nuclei activity during the AC3Exp campaign: implications for cloud condensation nuclei parameterization, Atmos. Chem. Phys., 14, 13423–13437, https://doi.org/10.5194/acp-14-13423-2014, 2014.
Zhang, F., Li, Z., Li, Y., Sun, Y., Wang, Z., Li, P., Sun, L., Wang, P., Cribb, M., Zhao, C., Fan, T., Yang, X., and Wang, Q.: Impacts of organic aerosols and its oxidation level on CCN activity from measurement at a suburban site in China, Atmos. Chem. Phys., 16, 5413–5425, https://doi.org/10.5194/acp-16-5413-2016, 2016.
Zhang, F., Wang, Y., Peng, J., Ren, J., Collins, D., Zhang, R., and Li, Z.: Uncertainty in predicting CCN activity of aged and primary aerosols, J. Geophys. Res.-Atmos., 122, 11723–11736, https://doi.org/10.1002/2017JD027058, 2017.
Zhang, F., Ren, J., Fan, T., Chen, L., Xu, W., and Sun, Y.: Significantly enhanced aerosol CCN activity and number concentrations by nucleation haze events: A case study in urban Beijing, J. Geophys. Res.-Atmos., 124, 14102–14113, https://doi.org/10.1029/ 2019JD031457, 2019.
Zhang, Q., Jimenez, J. L., Canagaratna, M. R., Ulbrich, I. M., Ng, N. L., Worsnop, D. R., and Sun, Y. L.: Understanding atmospheric organic aerosols via factor analysis of aerosol mass spectrometry: A review, Anal. Bioanal. Chem., 401, 3045–3067, https://doi.org/10.1007/s00216-011-5355-y, 2011.
Zhang, F.: Evaluation of the contribution of new particle formation to cloud droplet in urban atmosphere [data set], available at: https://data.mendeley.com/datasets/hkkzbn4zv3/1, last access: 4 January 2021.
Zheng, Y. T., Rosenfeld, D., and Li, Z. Q.: Satellite Inference of Thermals and Cloud-Base Updraft Speeds Based on Retrieved Surface and Cloud-Base Temperatures, J. Atmos. Sci., 72, 2411–2428, https://doi.org/10.1175/JAS-D-14-0283.1, 2015.