the Creative Commons Attribution 4.0 License.
the Creative Commons Attribution 4.0 License.
 | 24 Sep 2021
The response of the Amazon ecosystem to the photosynthetically active radiation fields: integrating impacts of biomass burning aerosol and clouds in the NASA GEOS Earth system model
Huisheng Bian
Eunjee Lee
Randal D. Koster
Donifan Barahona
Mian Chin
Peter R. Colarco
Anton Darmenov
Sarith Mahanama
Michael Manyin
Peter Norris
John Shilling
Hongbin Yu
Fanwei Zeng
The Amazon experiences fires every year, and the resulting biomass burning aerosols, together with cloud particles, influence the penetration of sunlight through the atmosphere, increasing the ratio of diffuse to direct photosynthetically active radiation (PAR) reaching the vegetation canopy and thereby potentially increasing ecosystem productivity. In this study, we use the NASA Goddard Earth Observing System (GEOS) model with coupled aerosol, cloud, radiation, and ecosystem modules to investigate the impact of Amazon biomass burning aerosols on ecosystem productivity, as well as the role of the Amazon's clouds in tempering this impact. The study focuses on a 7-year period (2010–2016) during which the Amazon experienced a variety of dynamic environments (e.g., La Niña, normal years, and El Niño). The direct radiative impact of biomass burning aerosols on ecosystem productivity – called here the aerosol diffuse radiation fertilization effect – is found to increase Amazonian gross primary production (GPP) by 2.6 % via a 3.8 % increase in diffuse PAR (DFPAR) despite a 5.4 % decrease in direct PAR (DRPAR) on multiyear average during burning seasons. On a monthly basis, this increase in GPP can be as large as 9.9 % (occurring in August 2010). Consequently, the net primary production (NPP) in the Amazon is increased by 1.5 %, or ∼92 Tg C yr−1 – equivalent to ∼37 % of the average carbon lost due to Amazon fires over the 7 years considered. Clouds, however, strongly regulate the effectiveness of the aerosol diffuse radiation fertilization effect. The efficiency of this fertilization effect is the highest in cloud-free conditions and linearly decreases with increasing cloud amount until the cloud fraction reaches ∼0.8, at which point the aerosol-influenced light changes from being a stimulator to an inhibitor of plant growth. Nevertheless, interannual changes in the overall strength of the aerosol diffuse radiation fertilization effect are primarily controlled by the large interannual changes in biomass burning aerosols rather than by changes in cloudiness during the studied period.
- Article
(6275 KB) - Full-text XML
-
Supplement
(1758 KB) - BibTeX
- EndNote


The Amazon is home to more than 34 million people and hosts a large variety of plants and animals. The rainforest plays a vital role in the global climate, regulating temperatures and storing vast quantities of carbon (Laurance, 1999; Nepstad et al., 2008). It is matter of intense research whether light or water is the limiting factor that controls plant growth over Amazonia. Considerable evidence demonstrates that sunlight indeed drives Amazon forest growth (Doughty et al., 2019; Huete et al., 2006; Myneni et al., 2007), although water deficit could be a limiting factor during severe droughts (Doughty et al., 2015; Feldpausch et al., 2016; Saatchi et al., 2013). Satellite observations show a clear seasonal cycle with a gradual crescendo in both leaf area and incoming surface sunlight beginning at the onset of the dry season (∼ August–November) (Myneni et al., 2007). Vegetation index maps also show that a majority of Amazonia is greener in the dry season than in the wet season (∼mid-December–mid-May) (Huete et al., 2006). It is in the dry season, when more light reaches the canopy level, that the Amazon forest thrives.
Plant photosynthesis requires sunlight to reach the leaves of the canopy. While aerosols and clouds in the atmosphere decrease the total amount of light that reaches the canopy, they also increase scattering, thereby increasing the ratio of diffuse radiation to direct radiation. This is important because the efficiency of plant photosynthesis increases under diffuse sunlight – a phenomenon both explained theoretically (Rap et al., 2015; Roderick et al., 2001; Zhou et al., 2020) and observed in the field (Cirino et al., 2014; Doughty et al., 2010; Ezhova et al., 2018; Gu et al., 2003; Lee et al., 2018; Niyogi et al., 2004; Oliveira et al., 2007). Leaf photosynthesis increases nonlinearly with solar radiation, becoming saturated on bright days at light levels above which leaves cannot take more light (Gu et al., 2003; Mercado et al., 2009). Under clear- and clean-sky conditions, particularly around midday, sunlight is mainly direct, and while this allows the sunlit leaves on top to be light saturated, the shaded leaves below them receive relatively little sunlight and thus participate less in photosynthesis (Rap et al., 2015; Roderick et al., 2001). In contrast, under cloudy conditions or in the presence of aerosols, much of the midday light is diffuse, and diffuse light can penetrate deeper into the canopy and illuminate shaded leaves. Li and Yang (2015) conducted a chamber experiment to explore diffuse light on light distribution within a canopy and the resulting effects on crop photosynthesis and plant growth. They concluded that diffusion of the incident light improves spatial light distribution, lessens the variation in temporal light distribution in the canopy, and allows more light-stimulated growth of shade-tolerant potted plants.
The situation is more profound during the Amazon dry season when intensive seasonal fires release large amounts of primary aerosol particles as well as gas precursors that form secondary organic and inorganic aerosols. Using stand-alone radiation and vegetation models, Rap et al. (2015) concluded that fires over the Amazon dry season increase Amazon net primary production (NPP) by 1.4 %–2.8 % by increasing diffuse radiation. This enhancement of Amazon Basin NPP (78–156 Tg C yr−1) is equivalent to 33 %–65 % of the annual regional carbon emissions from biomass burning and accounts for 8 %–16 % of the observed carbon sink across mature Amazonian forests. Moreira et al. (2017) advanced this analysis by coupling an ecosystem module and aerosol model within a Eulerian transport model. Their study indicated that biomass burning aerosols lead to increases of about 27 % in Amazonian gross primary production (GPP) and 10 % in plant respiration as well as a decline in soil respiration of 3 %. However, their approach assumes cloud-free conditions through their use of a diffuse irradiance parameterization based on the multiwavelength aerosol optical depth (AOD) measurement. Malavelle et al. (2019) explored the overall net impact of biomass burning aerosol on the Amazon ecosystem using an Earth system model (ESM) (HadGEM2-ES, The Hadley Centre Global Environment Model, version 2 – Earth System). They estimated NPP to increase by 80 to 105 Tg C yr−1, or 1.9 % to 2.7 %, ascribing this net change to an increase in diffuse light, a reduction in the total amount of radiation, and feedback from climate adjustments in response to the aerosol forcing. Their study takes into account the dynamic feedback of short-lifetime cloud fields. However, the authors have not explicitly quantified the impact of Amazon background clouds and their interannual changes in tempering the aerosol diffuse radiation fertilization effect (DRFE).
When clouds and aerosol co-exist, the impact from clouds on the ecosystem typically dominates because clouds are optically thicker. The surface sunlight for cloudy versus cloud-free conditions can differ greatly even if the AOD is the same. (Note that, unless specified otherwise, solar radiation in this study refers to the wavelength range of 400–700 nm, i.e., photosynthetically active radiation, or PAR). Measurements indicate that the desirable range of clearness index (CI) – the ratio of total (i.e., direct plus diffuse) light at the surface to the total incoming light at the top of atmosphere – is around 0.4–0.7 for some forest ecosystems and above 0.3 for peatland (Butt et al., 2010; Letts and Lafleur, 2005). Quite often a low CI occurs during a cloudy day, but on occasion it might result from the presence of a very thick aerosol layer. As suggested above, if the CI is high, the diffuse fraction of the total solar radiation is low and the overall productivity of the canopy is reduced. For example, Cirino et al. (2014) found that the net ecosystem exchange (NEE) of CO2 is increased by 29 % and 20 % at two Amazon stations – the Jaru Biological Reserve (RBJ) and the Cuieiras Biological Reserve at the K34 Large-Scale Biosphere–Atmosphere Experiment in Amazonia (LBA) tower, respectively – when AOD is 0.1–1.5 at 550 nm under clear conditions. Higher AOD (>3) leads to a strong reduction in photosynthesis (via reducing PAR) up to the point where NEE approaches zero. Oliveira et al. (2007) found that Amazon forest productivity was enhanced under moderately thick smoke loading because of an increase in diffuse solar radiation, but large aerosol loading (i.e., AOD>2.7) results in lower net productivity of the Amazon forest.
Despite its name, the Amazon's “dry season” (June–November) still features significant cloudiness, and the interannual variations in the clouds can be large. Furthermore, rain does fall during the dry season – close to 40 % of the total annual precipitation falls therein (Li et al., 2006). Clouds in the dry season are mostly formed by small-scale processes that influence the weather (see an example of a uniform layer of “popcorn” clouds observed by the Moderate Resolution Imaging Spectroradiometer (MODIS) on 19 August 2009 in https://earthobservatory.nasa.gov/images/39936/afternoon-clouds-over-the-amazonrainforest, 15 September 2021). It is during this period, when sunlight (particularly diffuse light) shines on the trees due to reduced rain (and fewer clouds) relative to the wet season, that the forest grows the most. A consideration of the joint effects of clouds and biomass burning aerosols on diffuse and direct PAR during the dry season is thus particularly important.
This study has two objectives. First, we investigate how Amazon biomass burning aerosols (BBaer) affect the land productivity (i.e., GPP and NPP) via their impact on direct and diffuse PAR (DRPAR and DFPAR). Second, we investigate the sensitivity of the BBaer DRFE to the presence of the Amazon dry-season cloud fields within the range indicated by the interannual variation in the clouds. In our analysis, we use a version of the NASA GEOS ESM that includes coupling between aerosol, cloud, radiation, and ecosystem processes. To our knowledge, only one other study has used an ESM to investigate such fire impacts across Amazonia (Malavelle et al., 2019), and as noted above, that study did not address the ability of Amazon clouds to temper the BBaer impacts. Accordingly, our study is the first ESM-based study to investigate the BBaer DRFE within a range of interannual Amazon cloud levels. Together our objectives provide a full and comprehensive study of BBaer DRFE in a context of potential Amazon dry-season atmospheric conditions.
It is necessary to point out, however, that our study focuses only on the impact of Amazon biomass burning aerosol. We do not consider the radiative impacts of other potentially important aerosols. These other aerosol types have been examined in various observational studies (e.g., Cirino et al., 2014; Ezhova et al., 2018; Hemes et al., 2020; Wang et al., 2018; Yan et al., 2014) and model investigations that focus, for example, on anthropogenic aerosol (Keppel et al., 2016; O'Sullivan et al., 2016), dust (Xi et al., 2012), biogenic aerosol (Rap et al., 2018; Sporre et al., 2019), volcanic aerosol (Gu et al., 2003), and the general aerosol field (Feng et al., 2019).
The paper is organized as follows. Section 2 describes the NASA GEOS ESM and its relevant modules (Sect. 2.1), the observational data used for model evaluation and explanation (Sect. 2.2), and the experimental setup (Sect. 2.3). Section 3 provides an evaluation of the model (Sect. 3.1), basic theory regarding the impact of aerosol and cloud on the surface downward radiation (Sect. 3.2), results regarding the simulated ecosystem response to BBaer-induced radiation changes (Sect. 3.3), and the impacts of Amazon background clouds on this response (Sect. 3.4). A final summary is provided in Sect. 4.
2.1 Model description
The GEOS modeling system connects state-of-the-art models of the various components of the Earth's climate system together using the Earth System Modeling Framework (ESMF) (Molod et al., 2015, 2012; Rienecker et al., 2011; https://gmao.gsfc.nasa.gov/, 15 September 2021). We discuss here the components of the system that are particularly relevant to our study, including aerosol, cloud microphysics, radiative transfer, and land ecosystem modules.
GEOS Goddard Chemistry Aerosol Radiation and Transport (GOCART) simulates a number of major atmospheric aerosol species and precursor gases from natural and anthropogenic sources, including sulfate, nitrate, ammonium, black carbon (BC), organic aerosol (OA, including primary and secondary OA), dust, sea salt, dimethyl sulfide (DMS), SO2, and NH3 (Bian et al., 2010, 2013, 2017, 2019; Chin et al., 2009, 2014; Colarco et al., 2010, 2017; Murphy et al., 2019; Randles et al., 2013). Monthly emissions from shipping, aircraft, and other anthropogenic sources are obtained from the recent Coupled Model Intercomparison Project version 6 (CMIP6) Community Emissions Data System (CEDS). Daily biomass burning emissions are provided by Global Fire Emissions Database (GFED4s) (https://daac.ornl.gov/VEGETATION/guides/fire_emissions_v4.html, 15 September 2021). Estimates of degassing and eruptive volcanic emissions are derived from the Ozone Monitoring Instrument (OMI) satellite (Carn et al., 2017). Emissions of dust, sea salt, and DMS are dynamically calculated online as a function of the model-simulated near-surface winds and other surface properties. A more recent development of GOCART relevant to this study involves the modification of the absorbing properties of “brown carbon” from biomass burning organic aerosols (Colarco et al., 2017) and the inclusion of secondary organic aerosol (SOA) produced via chemical reactions of volatile organic compounds (VOCs) emitted from anthropogenic and biomass burning sources, following the approach developed by Hodzic and Jimenez (2011) and Kim et al. (2015). In addition, the SOA from biogenic sources has been updated with its precursor gases of isoprene and monoterpene emissions calculated online as a function of light and temperature using the Model of Emissions of Gases and Aerosols from Nature (MEGAN) version 2.1 (Guenther et al., 2012), assuming an SOA yield of 3 % from isoprene and 5 % from monoterpene oxidations (Kim et al., 2015).
The GEOS two-moment cloud microphysics module is used in this study. The module includes the implementation of a comprehensive stratiform microphysics module, a new cloud coverage scheme that allows ice supersaturation, and a new microphysics module embedded within the moist convection parameterization (Barahona et al., 2014). At present, aerosol number concentrations are derived from the GEOS GOCART-calculated aerosol mass mixing ratio and prescribed size distributions and mixing state, which are then used for cloud condensation nuclei (CCN) activation (following the approach of Abdul-Razzak and Ghan, 2000) and ice nucleation (following the approach of Barahona and Nenes, 2009) processes. Aerosol–cloud interactions are thus accounted for in our simulation. The model calculates various cloud properties, including cloud fraction, cloud droplet and ice crystal number concentrations and effective radii, and cloud liquid and ice water paths. These fields have been evaluated against satellite observations and field measurements; the model shows a realistic simulation of cloud characteristics despite a few remaining deficiencies (Barahona et al., 2014; Breen et al., 2020).
The current default GEOS solar radiation transfer module is the shortwave rapid radiation transfer model for general circulation models (RRTMG_SW), a correlated k-distribution model (Iacono et al., 2008). This general circulation model (GCM) version utilizes a reduced complement of 112 g points, which is half of the 224 g points used in the standard RRTMG_SW, and a two-stream method for radiative transfer. Total fluxes are accurate to within 1–2 W m−2 relative to the standard RRTMG_SW (using discrete ordinates radiative transfer, DISORT) with aerosols in clear sky and within 6 W m−2 in overcast sky. RRTMG_SW with DISORT is itself accurate to within 2 W m−2 of the data-validated multiple scattering model, CHARTS. RRTMG_SW specifically calculates the direct and diffuse components of PAR (400–700 nm) separately. The GEOS atmospheric radiative transfer calculation is designed in a way that allows users to examine the impact of various combinations of atmospheric aerosol and cloud fields on radiation. In addition to the standard calculation of solar radiation for ambient atmospheric conditions, diagnostic calculations can be carried out by repeating the calculation of the radiation transfer scheme with different combinations of atmospheric conditions: clean air (no aerosols), clear air (no clouds), and clean plus clear air. Using this architecture, for this study we modify the radiation scheme to allow the additional diagnosis of radiation fields under conditions of zero BBaer but retained non-BBaer and ambient clouds.
The catchment land surface model (LSM) with carbon and nitrogen physics (Catchment-CN) in GEOS is in essence a merger of the C–N physics within the NCAR–DOE Community Land Model (CLM) (Oleson et al., 2010, 2013; Lawrence et al., 2019) version 4.0 and the energy and water balance calculations of the NASA GMAO (Global Modeling and Assimilation Office) catchment LSM (Koster et al., 2000). The original NASA catchment LSM used a prescribed representation of phenology (leaf area index, or LAI, and greenness fraction) to compute the canopy conductance, the parameter describing the ease with which the plants transpire water. The light interception by vegetation in the GEOS Catchment-CN utilizes the same parameterization as that in CLM version 4 (CLM4). The photosynthesis and transpiration depend nonlinearly on solar radiation. The canopy is assumed to consist of sunlit leaves and shaded leaves, and the DRPAR and DFPAR absorbed by the vegetation are apportioned to the sunlit and shaded leaves as described by Thornton and Zimmermann (2007). The prognostic carbon storages underlying the phenological variables are computed as a matter of course along with values of canopy conductance that reflect an explicit treatment of photosynthesis physics. These canopy conductances, along with the LAIs diagnosed from the new carbon prognostic variables, are fed into the energy and water balance calculations in the original catchment LSM. The output fluxes from the merged system include carbon fluxes in addition to traditional fluxes of heat and moisture. The merger of the two models allows Catchment-CN to follow 19 distinct vegetation types. Koster and Walker (2015) have used Catchment-CN within an atmospheric global circulation model (AGCM) framework to investigate interactive feedback among vegetation phenology, soil moisture, and temperature. In this study, the modeled atmospheric CO2 from the AGCM is used to drive the carbon, water, and energy dynamics in the Catchment-CN model.
In addition to the GEOS ESM, we use a photolysis scheme, fast-JX, in its stand-alone mode to explore how incoming solar radiation penetrates the atmosphere in the presence of aerosols and clouds in order to enhance our basic understanding of the role of atmospheric particles on radiation. Fast-JX is based on the original Fast-J scheme, which was developed for tropospheric photochemistry with an interactive consideration of aerosol and cloud impacts at 291–850 nm (Wild et al., 2000), and Fast-J2, which extended the scheme into the deep UV spectrum range of 177–291 nm (Bian and Prather, 2002).
2.2 Observational data
We mostly rely on the GoAmazon (Green Ocean Amazon) field campaign (https://www.arm.gov/research/campaigns/amf2014goamazon, 15 September 2021) for in situ aerosol observations to assess the model-simulated OA concentrations. GoAmazon is an integrated field campaign conducted in the central Amazon Basin (Martin et al., 2016). Specifically, the following datasets are used: (a) the surface OA concentration measured in 2014 by the Aerosol Chemical Speciation Monitor (ACSM) operated by the Department of Energy's (DOE) Atmospheric Radiation Measurement (ARM) mobile facility located 70 km downwind of Manaus, Brazil (Ng et al., 2011), (b) the surface CO volume mixing ratio in 2014 at Manaus measured by Los Gatos Research (LGR) N2O/CO analyzer that uses LGR's patented off-axis integrated cavity output spectroscopy (ICOS) technology, and (c) the vertical profile of OA concentration measured by a time-of-flight aerosol mass spectrometer (ToF-AMS) instrument on the ARM Aerial Facility Gulfstream-1 (G-1) aircraft during the dry season of 2014 (6 September–4 October 2014) (Shilling et al., 2018). The G-1 aircraft was based at the Manaus International Airport and flew patterns designed to intersect the Manaus urban plume at increasing downwind distance from the city (e.g., 4–2.5∘ S and 59–61∘ W). In addition, we evaluate the model with AOD and single-scattering albedo (SSA) measurements taken at a central Amazon station (Alta Floresta) in the ground-based Aerosol Robotic Network (AERONET) sun photometer network (http://aeronet.gsfc.nasa.gov, 15 September 2021). We also use the MODIS collection 6.1 level-3 AOD product (http://modis.gsfc.nasa.gov/data/dataprod/index.php, 15 September 2021), which is characterized by observations with large spatial coverage.
MODIS cloud products (https://modis-atmosphere.gsfc.nasa.gov/data/dataprod/, 15 September 2021), specifically total cloud fraction and cloud optical depth in liquid and ice particles, are used to evaluate the model cloud simulation. We use the cloud data from MODIS collection 6.1 MYD08_D3, a level-3 global gridded monthly joint product derived from the MODIS level-2 pixel-level products. MODIS level-2 cloud fraction is produced by the infrared retrieval methods during both day and night at a 5×5 1 km pixel resolution. Level-2 cloud optical thickness used in this study is derived using the MODIS visible and near-infrared channel radiances from the Aqua platform.
The satellite-derived Clouds and the Earth's Radiant Energy System (CERES) product EBAF is used to evaluate the GEOS simulation of radiation fields. CERES-EBAF retrieves surface downward shortwave radiation (RSFC) using cloud information from more recent satellite data (MODIS, CERES, CloudSat, and CALIPSO) and aerosol fields from AERONET MODIS validation-based estimates (Kato et al., 2013). This global product is provided at a horizontal resolution and covers the years 2000–2015 for both all- and clear-sky conditions. The multiyear RSFC products provide both a spatial and temporal view of radiation over Amazonia.
Two observation-based GPP products (FluxCom and FluxSat) are used to evaluate ecosystem productivity in the GEOS simulations. The FluxCom GPP product provides globally distributed eddy-covariance-based estimates of carbon fluxes between the biosphere and the atmosphere through upscaling using machine learning methods (Jung et al., 2020). FluxSat GPP is estimated with models that use satellite data (e.g., MODIS reflectances and solar-induced fluorescence, SIF) within a simplified light-use efficiency framework (Joiner et al., 2018). We use monthly GPP of 2010–2015 in this study.
2.3 Experiment setup
All experiments were run with the coupled atmosphere and land components of the NASA GEOS ESM system discussed above. The sea surface temperature (SST) for the atmospheric dynamic circulation is provided by the GEOS Atmospheric Data Assimilation System (ADAS) that incorporates satellite and in situ SST observations and assimilates advanced very high-resolution radiometer (AVHRR) brightness temperatures. The experiments were run in replay mode, which means that the model dynamical variables (winds, pressure, temperature, and humidity) were set, every 6 h, to the values archived by the Modern-Era Retrospective Analysis for Research and Applications version 2 (MERRA2) meteorological reanalysis (Gelaro et al., 2017); a 6-hourly forecast provided the dynamical and physical fields between the 6 h resets. In effect, the replay approach forces the atmospheric “weather” simulated in the model to agree with the reanalysis. This nudging of the GEOS dynamic fields toward the MERRA2 reanalysis ensures that the atmospheric conditions of our four simulations (see below) remain close to each other, allowing a more focused study of radiative impact on the ecosystem. All designed experiments were run over 2010–2016, a period that includes La Niña (2010–2011), El Niño (2015–2016), and neutral years as indicated by the Oceanic Niño Index (ONI, https://origin.cpc.ncep.noaa.gov/products/analysis_monitoring/ensostuff/ONI_v5.php, 15 September 2021) (Fig. S1 in the Supplement). Information regarding long-term biomass burning (BB) OA emissions (i.e., 1997–2016) and long-term MERRA2 cloud fraction anomalies (i.e., 1995–2018) is shown in Fig. S2. The selected period of 2010–2016 represents well the long-term period in terms of the variation in BB emissions and cloud coverage.
Our experimental design makes extensive use of GEOS's highly flexible configuration. First, the GEOS GOCART module includes a tagged aerosol mechanism. Each specific aerosol component in GOCART is simulated independently from the others, and the contribution of each emission type to the total aerosol mass is also not interfered with by that of other emission types. Thus, additional aerosol tracers can easily be “tagged” according to emission source types. This makes it possible for GOCART to calculate and transfer two sets of aerosol fields (e.g., one with and one without a biomass burning source) to the radiation module. Second, the radiation module can in turn calculate a set of atmospheric radiation fields corresponding to each set of aerosol fields, and it can then disseminate both sets of radiation fields to the various components of interest (i.e., cloud module, land ecosystem module, etc.) according to the needs of our experiments (see below).
Table 1Designed experiments (2010–2016) with their perturbation on aerosol fields and subsequent impact on radiation and ecosystem. “dir”: direct; “dif”: diffuse.

R: radiation. Rtop: radiation at the top of the atmosphere. Rdir and Rdif: atmospheric direct and diffuse radiation.
Table 1 provides a brief summary of the experiments performed for this study. First, we designed a pair of experiments (allaer and nobbaer, hereafter referred to as “pair1”) to explore the BBaer DRFE on the land productivity via PAR (objective 1). The allaer and nobbaer experiments are designed to simulate the same atmospheric dynamics but send different PAR fluxes into the Catchment-CN model. Specifically, both the allaer and nobbaer experiments used all atmospheric aerosols including real-time biomass burning emissions over 2010–2016 to calculate a set of radiation fields (R1) to drive atmospheric circulation; however, with the help of GEOS's flexible configuration, the nobbaer experiment also calculated a second set of radiation fields (R2) that used non-BB aerosols only. R1 was sent to Catchment-CN in the allaer experiment, whereas R2 was sent to Catchment_CN in the nobbaer experiment. In this way, the only difference between the allaer and nobbaer experiments was the PAR fluxes used to drive the ecosystem model – only the PAR fluxes used in allaer reflected the presence of biomass burning aerosols. The atmospheric meteorological fields in the two experiments, including clouds, skin temperature, and soil moisture, show only minor differences stemming from land feedback (Figs. S3–S4, Tables 3, S1e, and S2e in the Supplement). A negligible impact on cloud fields has also been reported in Pedruzo-Bagazgoitia et al. (2017).
We also designed a pair of experiments (callaer and cnobbaer, hereafter referred to as “pair2”) to address the sensitivity of the BBaer DRFE to the presence of the Amazon dry-season cloud fields (objective 2). The pair2 experiments are similar to those in pair1 except that the particular BB emissions of the year 2010 were repeated during all 7 years. Applying a fixed aerosol emission allows us to attribute the interannual variation in the ecosystem solely to the influence of interannual variations in atmospheric meteorological fields, including clouds. In addition, combining the pair1 and pair2 experiments provides two biomass burning aerosol emissions for each year except 2010, which allows us to compare the impacts of different emissions under similar meteorological environments (Figs. S3–S4, Tables 3, S1e and S2e). Please note that the experiments in this study were intentionally designed to allow the aerosols to affect the vegetation only through their impact on the direct and diffuse radiation that enters the ecosystem and not, for example, through their other potential impacts on the environment. Future study may focus on these other impacts. Given that the experiment period covers strong La Niña and El Niño years, we can examine BBaer impacts on ecosystem productivity under the full range of Amazon background cloud fields.
3.1 Evaluation of GEOS simulations of aerosol, cloud, radiation, and ecosystem response
The NASA GEOS ESM model, including its aerosol, cloud, radiation, and ecosystem modules as used in the baseline simulation (i.e., experiment allaer), has been evaluated extensively and utilized in a number of scientific studies. However, very few of the past studies with GEOS concentrated on detailed model evaluation over South America. We provide such an evaluation here.
The simulated tracer fields are compared with measurements over the Amazon in Figs. 1 and 2. Figure 1 shows results for surface OA concentration, surface CO concentration, and the OA concentration vertical profile. We focus primarily on the OA evaluation since it is the major component of biomass burning aerosols. Figure 1a shows the comparison of surface daily OA concentration between the model simulation and the GoAmazon measurements at Manaus, Brazil, in 2014 (the location is indicated in Fig. 2c with an open diamond). The simulated OA broadly captures the seasonal trend in OA concentrations measured at Manaus, but it is lower than observed OA values by ∼24 % during September–October and ∼30 % annually. For the period of interest, the model simulates a large fire signal in August that is not seen in the measurements. However, this strong August biomass burning signal does show up in the CO measurements (Fig. 1b), which should also be from biomass burning. The reasons for such a discrepancy from observations are not clear.
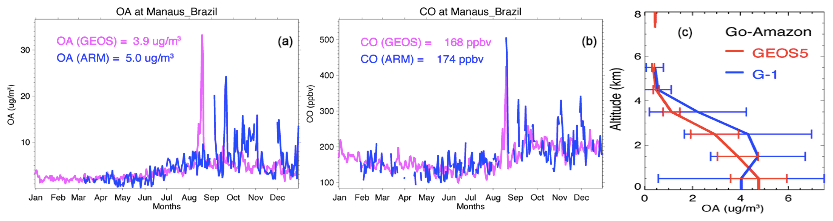
Figure 1(a) Comparison of the ACMS (aerosol chemical speciation monitor) measured organic aerosol (OA) daily surface mass concentration at the GoAmazon DOE ARM facility in Manaus, Brazil (location marked in Fig. 2c as an open diamond) in 2014 with GEOS simulated values. (b) Similar to (a) but for carbon monoxide (CO) volume mixing ratio. (c) GoAmazon G-1 aircraft measurement of vertical OA mass concentration during 6 September–4 October 2014 in the vicinity of Manaus, compared to GEOS simulations. The error bars in panel (c) indicate 1 standard deviation of the data within each 1 km vertical layer.

Figure 2(a) Comparison of GEOS simulated AOD at 550 nm with AERONET and MODIS daily measurements at the Alta Floresta AERONET site for 2014. (b) Similar comparison for aerosol single-scattering albedo at 440 nm during 2014. (c) Mean MODIS collection 6.1 AOD at 550 nm during the period August–October 2014. (d) GEOS simulated AOD at 550 nm for the same period as in (c) with daily model data sampled following MODIS measurements. Note that the mean AOD values shown for (c, d) are averaged over the Amazon region (i.e., the shaded land area within 25∘ S–5∘ N, 80–30∘ W shown in d). Station locations of Alta Floresta (filled-circle) and Manaus (open diamond) are marked in (c).
When compared with aircraft G-1 measurements over a region around the center of Manaus during the biomass burning season (6 September–4 October 2014) (Fig. 1c), the simulated vertical OA concentrations underestimate the measurements above 1 km altitude but overestimate them under it, although they overlap within their standard deviations for all altitudes. Here the model data have been sampled spatially and temporally along the G-1 flight paths. This surface OA overestimation by the model seems to contradict the model's underestimation seen in Fig. 1a, indicating that capturing aerosols at the right times and locations is a challenge.
Figure 2 shows the AOD (550 nm) and SSA (440 nm) comparison at the AERONET station of Alta Floresta, which is located close to the area of the most intensive Amazon fires (location is marked in Fig. 2c as a filled-in circle). The model-simulated, AERONET-measured, and MODIS-retrieved AODs at this site agree within 20 % (Fig. 2a), all showing a peak of AOD during the biomass burning season. SSA during the burning season generally ranges between 0.85–0.95 (Fig. 2b). The model agrees with the measurements with an accuracy better than 5 % except during the first half of August, when the model aerosols are too scattered. However, it is puzzling to observe the extremely low measured SSA at the beginning of August given that the AOD is still low then, as shown in Fig. 2a. It could be that the quality of AERONET SSA is not “reliable” at low AOD (Chin et al., 2009). Because of the low sensitivity to the absorption when aerosol loading is low, SSA is retrieved with sufficiently high accuracy only when the total AOD at 440 nm is equal or higher than 0.4 and the solar zenith angle is 50∘ or higher (Dubovik et al., 2000, 2002). Regionally over the Amazon region, defined throughout the study as the land area within 25∘ S–5∘ N, 80–30∘ W (shaded land area in Fig. 2d), the model-simulated AOD (0.22 in Fig. 2d) during the biomass burning season generally agrees with MODIS satellite retrievals (0.21 in Fig. 2c). A simulated high bias is seen over the east Amazon; however, though this region is in our area of interest, the bias should only have a minor impact on our study given that the area is relatively bare, with little vegetation coverage.
The accurate simulation of cloud fields is also important for our study. In Fig. 3 we evaluate the GEOS-simulated cloud cover fraction and cloud optical depth with MODIS satellite products. Here the GEOS data have been sampled with MODIS overpass time and location. GEOS generally captures the magnitude and main features of the cloud fields observed in MODIS, though with some differences; the model overestimates the cloud quantities over the central Amazon and underestimates them in northwest South America. The overall difference over the Amazon region between simulated and MODIS-based estimates is less than 7 % for cloud cover fraction, 10 % for liquid water cloud optical depth, and 15 % for ice cloud optical depth. The seasonality of these cloud quantities is shown in Fig. S5a–c to further evaluate the model performance. The model has a better cloud simulation during the period of August–October, which is the focus period of this study since Amazon fires occur periodically every year in this season.
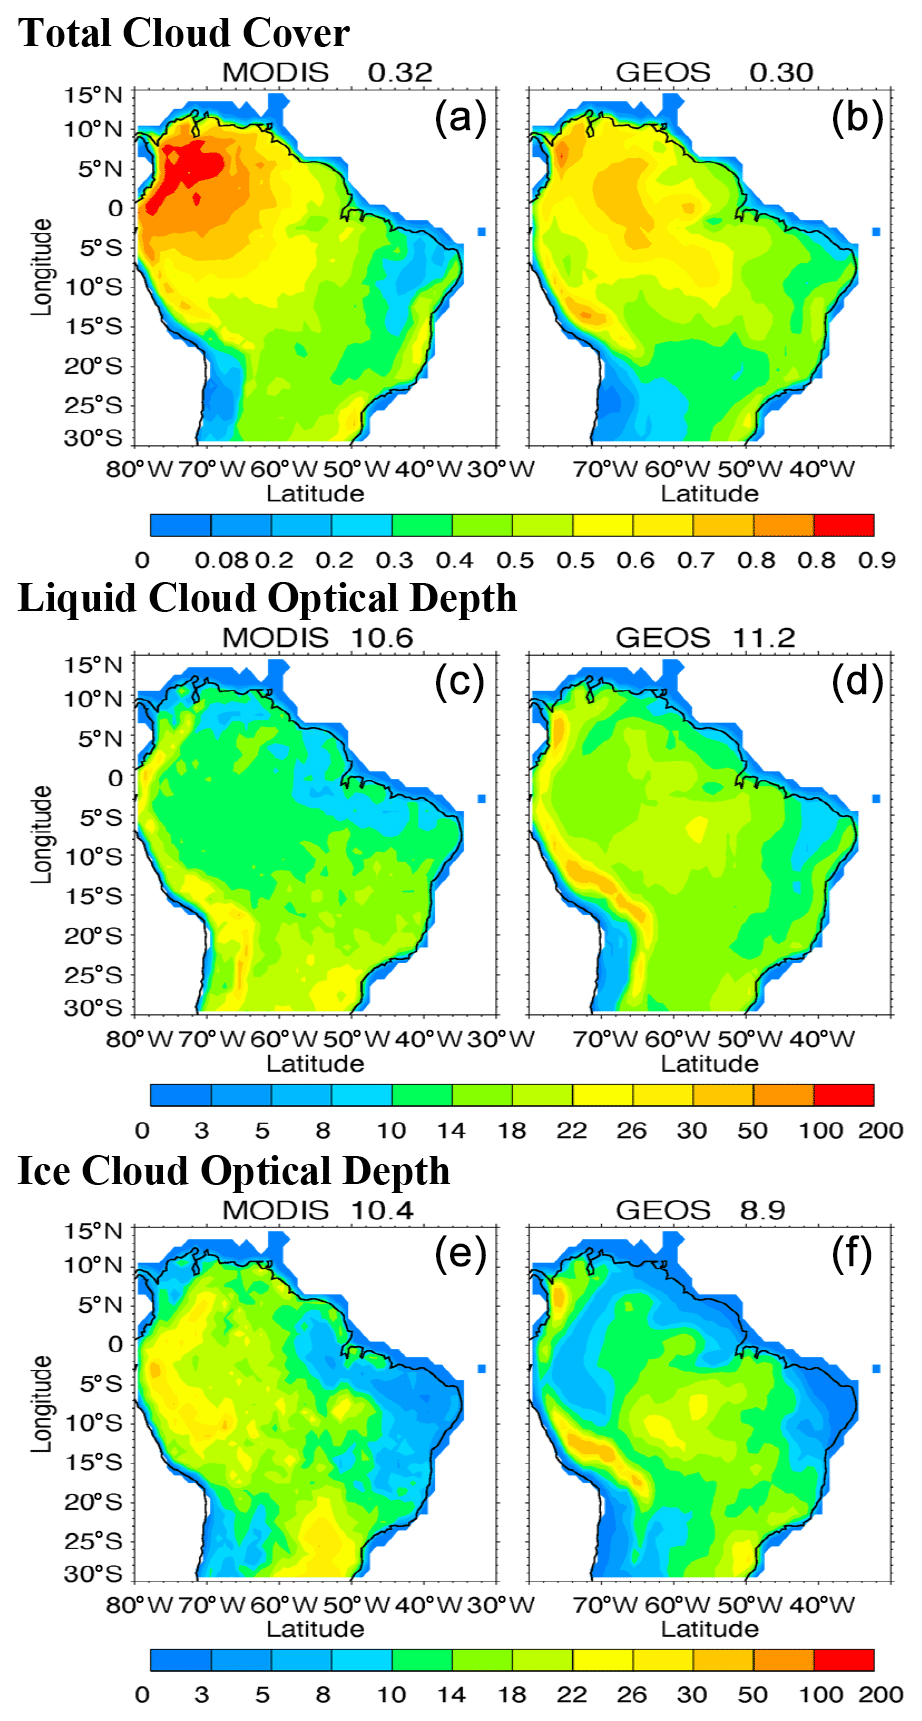
Figure 3Multiyear seasonal (August–October 2010–2016) cloud field comparison between MODIS retrieved (a, c, e) and GEOS simulated (b, d, f), total cloud cover (a, b), liquid cloud optical depth (c, d), and ice cloud optical depth (e, f).
Figure 4 shows a comparison between the simulated downward shortwave radiation at the surface and CERES-EBAF measurements averaged over August–October, 2010–2016 for both clear-sky and all-sky conditions. The comparison of the time series of monthly mean shortwave radiation during 2010–2016 over the Amazon region is shown in Fig. S6. GEOS captures the observed spatial patterns with ∼4 % high bias for both clear- and all-sky conditions over the Amazon region.
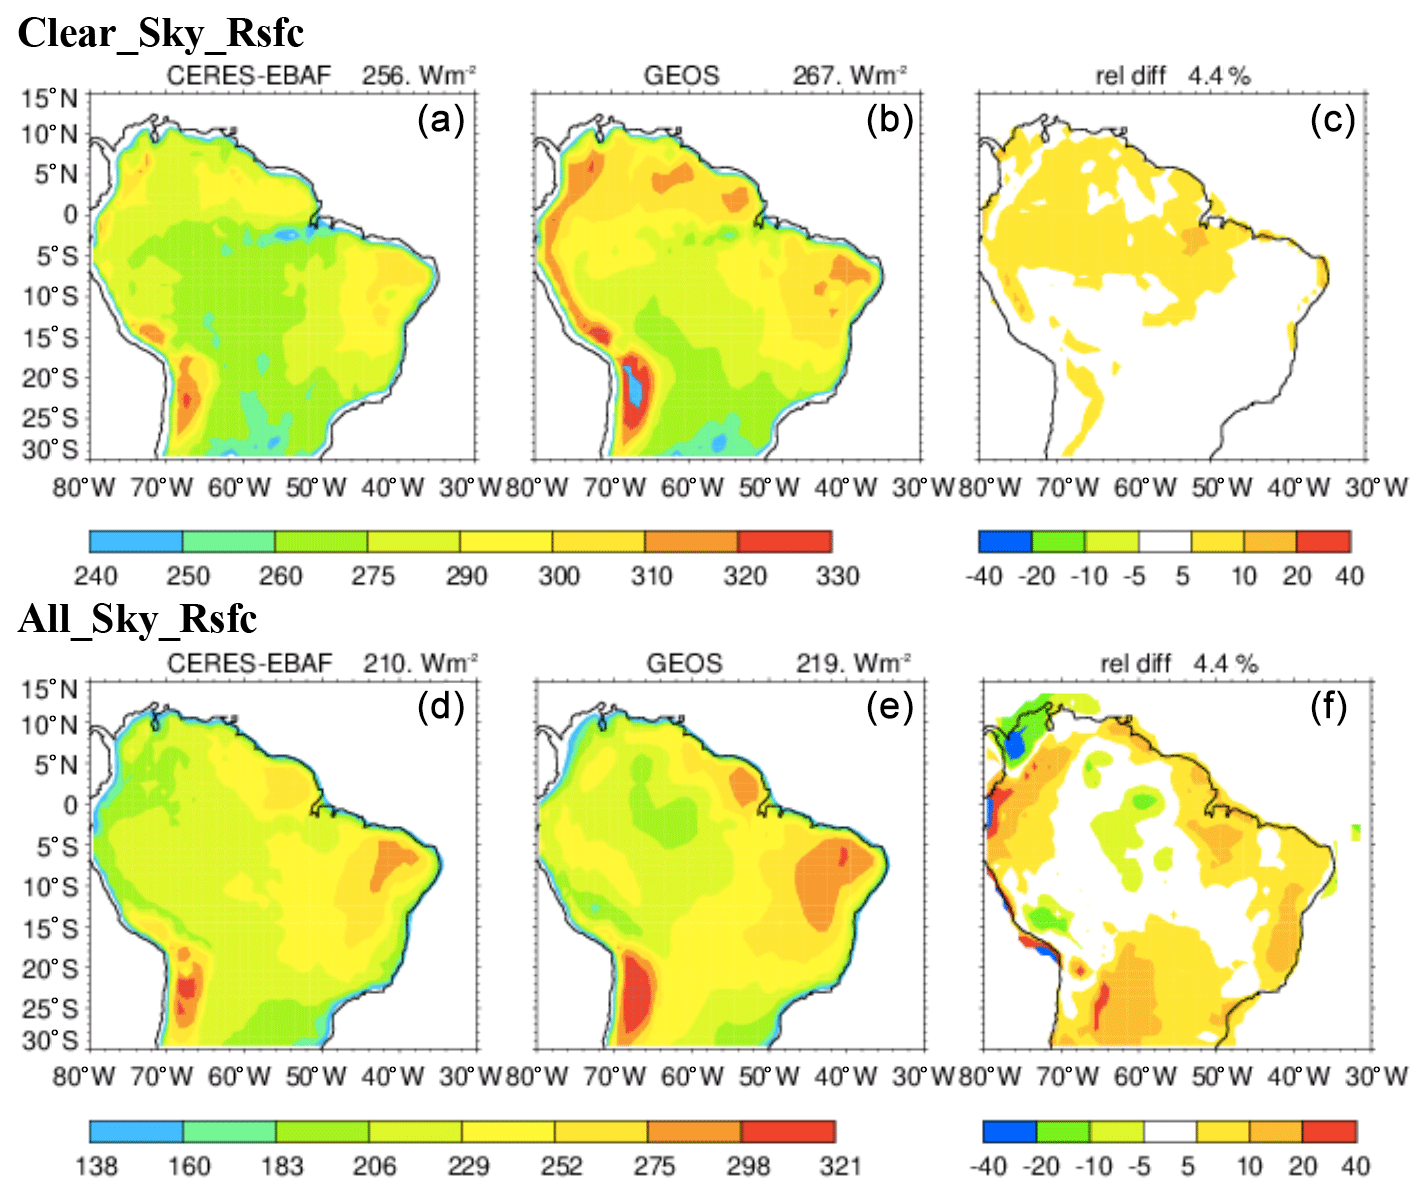
Figure 4Comparison of surface downward shortwave radiation Rsfc (W m−2) between CERES-EBAF measurement and GEOS simulation averaged over August–October 2010–2016 for clear-sky (a, b) and all-sky (d, e) conditions. The right column (c, f) shows the relative difference between GEOS and CERES-EBAF.
Following the evaluation approach in Malavelle et al. (2019), we evaluate our model's ability to simulate GPP on the global scale against FluxCom and FluxSat. As mentioned in Sect. 2.2, FluxCom GPP is derived from surface measurements of carbon fluxes, whereas FluxSat GPP is derived from satellite data. The comparison of global distribution of multiyear average GPP (Fig. 5) and zonal mean multiyear average GPP (Fig. 6) shows that GEOS captures the GPP global distribution seen in the observations, with a GPP peak in tropics. The model does show a second peak in middle latitudes of the Southern Hemisphere but misses the observed peak in the Northern Hemisphere subtropics.
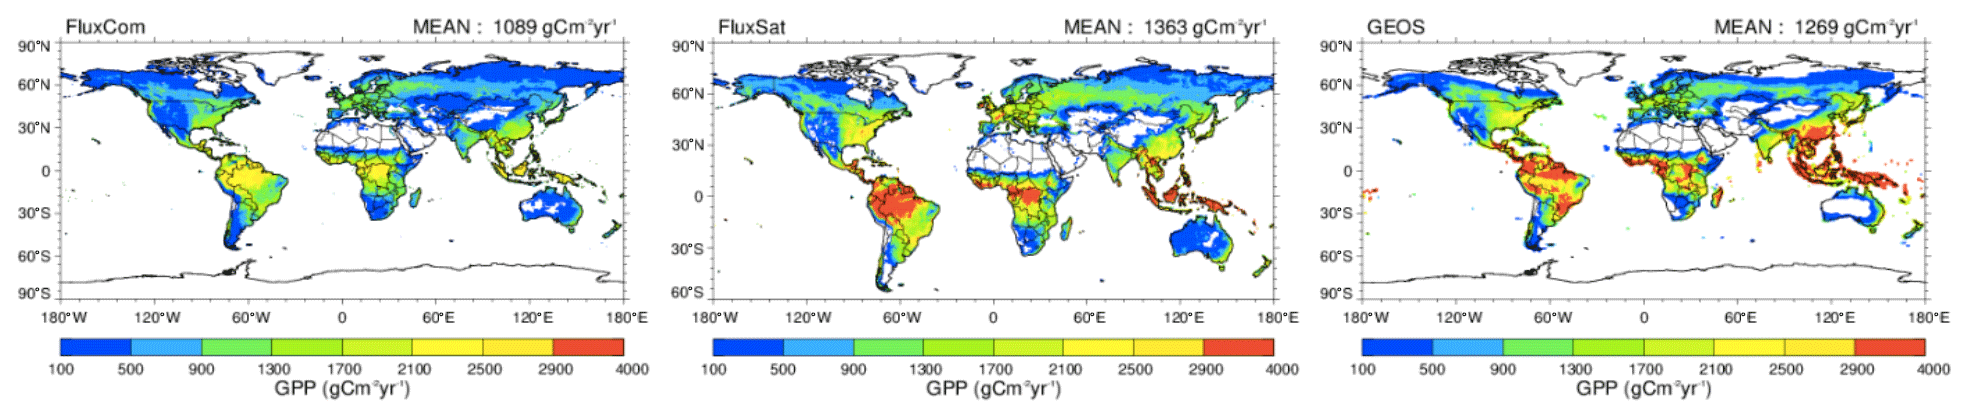
Figure 52010–2015 multiyear average global GPP from FluxCom, FluxSat, and GEOS. The global average value is shown at the top.

Figure 7 shows GPP averaged over August to October of 2010–2015 from the two observation-based products and the GEOS simulation. The overall spatial distributions of GEOS GPP (Fig. 7c) over South America show a similar spatial pattern to both of the observation-based datasets (Fig. 7a and b) with higher values over the eastern part of the domain but lying between the two datasets in other areas. Over the studied period and the Amazon region, the GEOS GPP is comparable to the FluxSat GPP and is about 35 % higher than the FluxCom GPP.
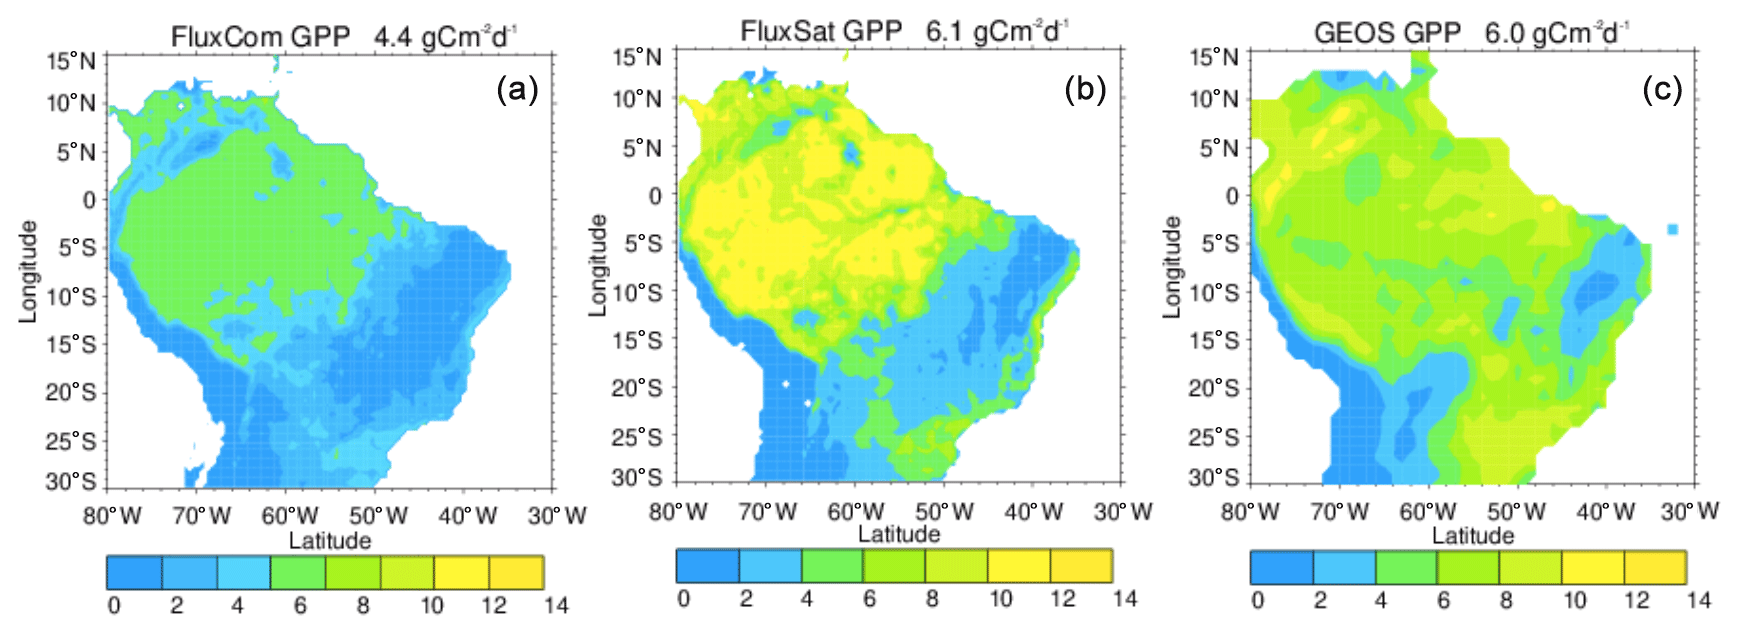
Figure 7The multiyear (2010–2015) August–October mean Amazon GPP from (a) FluxCom (Jung et al., 2020), (b) FluxSat (Joiner et al., 2018), and (c) the GEOS ecosystem simulation with units of . The Amazon regional average value is shown at the top.
The seasonality of GPP over the Amazon region from FluxCom, FluxSat, and GEOS during 2010–2015 is shown in Fig. S7, and the corresponding time series of monthly means is shown in Fig. S8. During all four seasons, regional FluxCom GPP is the lowest and FluxSat GPP is the highest. All datasets show higher GPP during November–April than during May–October. GEOS multiyear annual average GPP is close to that of FluxSat but is higher than that of FluxCom. Although there are few observation sites available in FLUXNET 2015 Tier 1 (https://fluxnet.org/data/fluxnet2015-dataset/, 15 September 2021), Joiner et al. (2018) evaluated FluxSat GPP performance around Amazonia using the flux tower measurements, which showed that the high GPP values produced by FluxSat were supported by the flux tower values (Joiner et al., 2018).
Although the evaluations of global and regional multiyear average GPP conducted above (Figs. 5–7) are needed for the examination of the model's fundamental mechanisms including photosynthesis, a more direct evaluation to address the model's accuracy in simulating observed GPP response to changes in diffuse and direct surface radiation is shown in Fig. 8. Following the evaluation approach of Rap et al. (2015), we compared the GPP response to direct and diffuse light at two Amazon sites: Tapajos and Guyaflux. The figure clearly demonstrates that in the model, as in observations, diffuse light is more efficient in stimulating GPP.
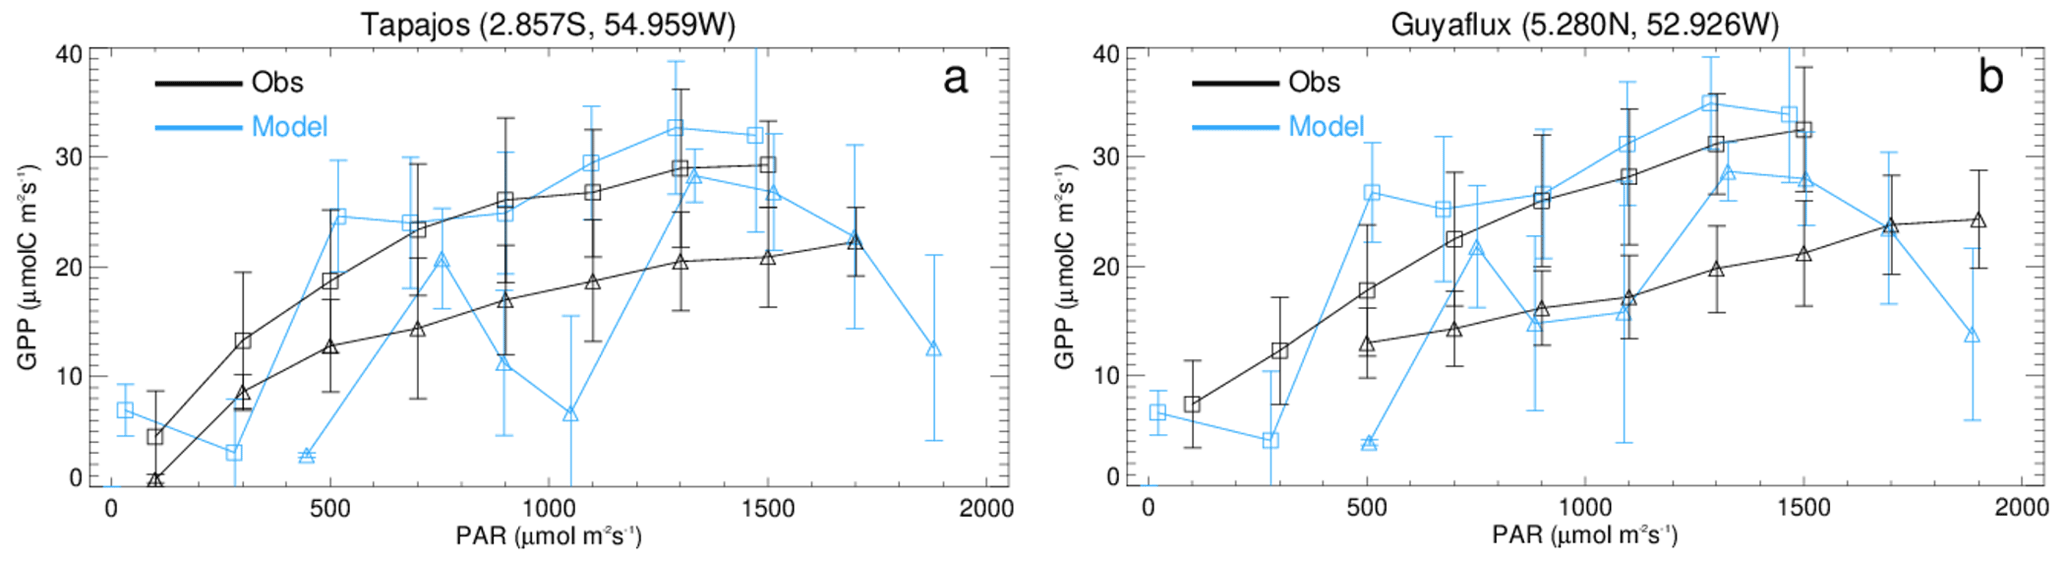
Figure 8Observed (black) and GEOS modeled (blue) response of GPP to direct (triangles) and diffuse (squares) photosynthetically active radiation (PAR) averaged over bins of 200 µmol quanta m2 s−1 at (a) Tapajos and (b) Guyaflux. Error bars show 1 standard deviation of all values within a bin. The observation data, representing the period 2002–2005 for Tapajos and 2006–2007 for Guyaflux, are taken from Fig. 2 of Rap et al. (2015), whereas the model period is 2010–2016 for both sites.
3.2 Principle of aerosol and cloud impact on surface downward radiation
Radiative responses to aerosols and cloud fields are nonlinear. To better explain the phenomenon examined here – that plant growth increases at low-to-intermediate AOD but decreases at high AOD – we ran the column version of a radiation model, fast-JX (Wild et al., 2000; Bian and Prather, 2002). Fast-JX solves the eight-stream multiple scattering in atmospheric solar radiation transfer for direct and diffuse beams, using the exact scattering phase function and optical depths of atmospheric molecules, aerosols, and clouds, and provides photolytic intensities accurate typically to better than 3 %, with worst case errors of no more than 10 % over a wide range of atmospheric conditions (Wild et al., 2000). No special approximations are needed to treat strongly forward-peaked phase functions. The model has also been evaluated against various other models that participated in an international multi-model comparison for solar fluxes and photolysis calculation (PhotoChem-2008 in Chipperfield et al., 2010) and against the measurements from actinic flux spectroradiometers during the Atmospheric Tomography (ATom) mission (Hall et al., 2018). In the aforementioned evaluations, the fast-JX model is among the models with good performance. The model calculations provide three ratios: (i) CIdir, the ratio of direct downward solar radiation at the surface (Rdir@srf) to the incoming total solar radiation flux at the top of the atmosphere (Rtot@toa), (ii) CIdiff, the ratio of the downward diffuse solar radiation flux (Rdiff@srf) to Rtot@toa, and (iii) CI, the ratio of total solar radiation at the surface to Rtot@toa. Note that all Rs are for the 400–700 nm spectral band. Results for different biomass burning AODs (including the clean-air condition, where AOD=0) for cloud-free conditions are shown in Fig. 9a. When the sky is clear and clean (both cloud-free and without aerosols), roughly 90 % of the incoming solar radiation at the top of the atmosphere can reach the plant canopy (i.e., at BBAOD=0; BBAOD – biomass burning AOD). The direct solar flux decreases rapidly as the atmosphere becomes polluted (i.e., as BBAOD increases), but for BBAOD levels less than ∼0.75, the diffuse solar flux increases. The two are equivalent at AOD This light redistribution from direct to diffuse can significantly stimulate plant photosynthesis given that plants use diffuse light more efficiently. Ecosystems could still respond positively to the increase in BBAOD even if the incident diffuse radiation decreases below its peak value, though for some value of BBAOD, the reduction in total radiation will be large enough to overwhelm the impact of increased diffuse radiation, and plant photosynthesis will be lower than that for clean-sky conditions.

Figure 9The ratio of Rdir@srf to Rtot@toa (blue), which presents the clearness index for the direct radiation portion (CIdir), the ratio of Rdiff@srf to Rtot@toa (red) for the diffuse radiation portion (CIdiff), and the ratio of Rtot@srf to Rtot@toa (green). Here, Rtot@toa is incoming total solar flux at the top of atmosphere (TOA), Rdir@srf is surface downward direct solar flux, Rdiff@srf is surface downward diffuse solar flux, and Rtot@srf is the sum of Rdir@srf and Rdif@srf. All Rs are over 400–700 nm. (a) The change in the radiative flux ratios in BBAOD=0–3 under clear-sky condition. (b) Same as (a) but under cloudy conditions (cloud fraction=1) with COD=1. (c) Same as (b) but for COD=10. Calculations use the fast-JX radiation model column version adopting a standard atmospheric condition of the typical tropics at ozone column=260 Dobson units, , and surface albedo=0.1.
The Amazon dry season is characterized by high biomass burning aerosol loading combined with low cloud cover, a good match to obtain more diffuse radiation without the loss of too much total radiation. However, as we have pointed out, cloud impacts on radiation typically dominate those of aerosols. To examine this, we repeated the radiation model calculations after adding, at the top of the aerosol layer (∼3.5 km), a cloud layer with a cloud fraction of 1.0 and a cloud optical depth (COD) of 1 (Fig. 9b) and 10 (Fig. 9c). The latter COD is close to the mean liquid cloud COD over the Amazon dry season (Fig. 3). The impact on Rdir@srf and Rdiff@srf is quite large even with a very thin overhead cloud (Fig. 9b). Without BBaer, the clouds already produce abundant diffuse light that can reach the surface (i.e., CIdiff>50 %, as seen in both Fig. 9b and c), while almost shutting down the direct light (i.e., CIdir<1 % in Fig. 9c). Accordingly, for full cloud coverage, a clean sky (i.e., no aerosols) would provide the best conditions for plant growth. When fires start, the diffuse light declines rapidly, reducing the potential for plant growth. At BBAOD ∼3 the ratios among Fig. 9a–c look similar; that is, essentially very little radiation reaches the surface.
The simple examples in Fig. 9 illustrate the complicated responses of direct and diffuse light to the presence of aerosol and cloud. Measurements indicate that plant growth peaks for a clearness index (CI, which equals CIdir + CIdiff) of about 0.4–0.7 for some forest ecosystems (Butt et al., 2010; Letts and Lafleur, 2005). Based on Fig. 9, this CI range translates into a BBAOD range of about 0.3∼1.5 in clear-sky and 0∼0.5 in cloudy-sky conditions.
3.3 How the ecosystem responds to the BBaer diffuse radiation fertilization effect
We first examine the two experiments in pair1 by taking a close look at the time series of aerosol, cloud, radiation, and ecosystem responses generated at a selected site (15∘ S, 54∘ W) during August–October 2010 (Fig. 10) (site location marked in Fig. 11), with the aim of extending the general understanding gained in Sect. 3.2 to a real case study at a single site in the Amazon. This is an interesting site and period, showing a large DFPAR change (Fig. 11f) and providing a wide variety of conditions for study – the sky alternates between clear and cloudy conditions in August, is relatively clear in September but relatively cloudy in October, and the biomass burning aerosols increase in August, peak in September, and diminish greatly in early October (Fig. 10). During August–September, when the atmosphere experiences biomass burning pollution, the allaer (with BBAOD light fertilizer) and nobbaer (without BBAOD light fertilizer) results differ significantly: DRPAR for allaer (solid line) lies below that for nobbaer (dotted line), while DFPAR and GPP for allaer are generally higher than those for nobbaer. In October, the sky is almost clean (i.e., low BBaer), leading to very similar results for DRPAR, DFPAR, and GPP between the two experiments. Looking closer, we see that the changes in DRPAR, DFPAR, and GPP between allaer and nobbaer are more prominent when the atmosphere has low cloudiness and high aerosol (e.g., at the end of August), confirming both that BBaer does transform some of the direct light at the surface into diffuse light and that plants are more efficient in their use of diffuse light. When both cloudiness and aerosols are high (e.g., at the end of September), the influence of aerosols is overwhelmed by clouds, and the impact of the aerosols on radiation and the ecosystem becomes secondary.
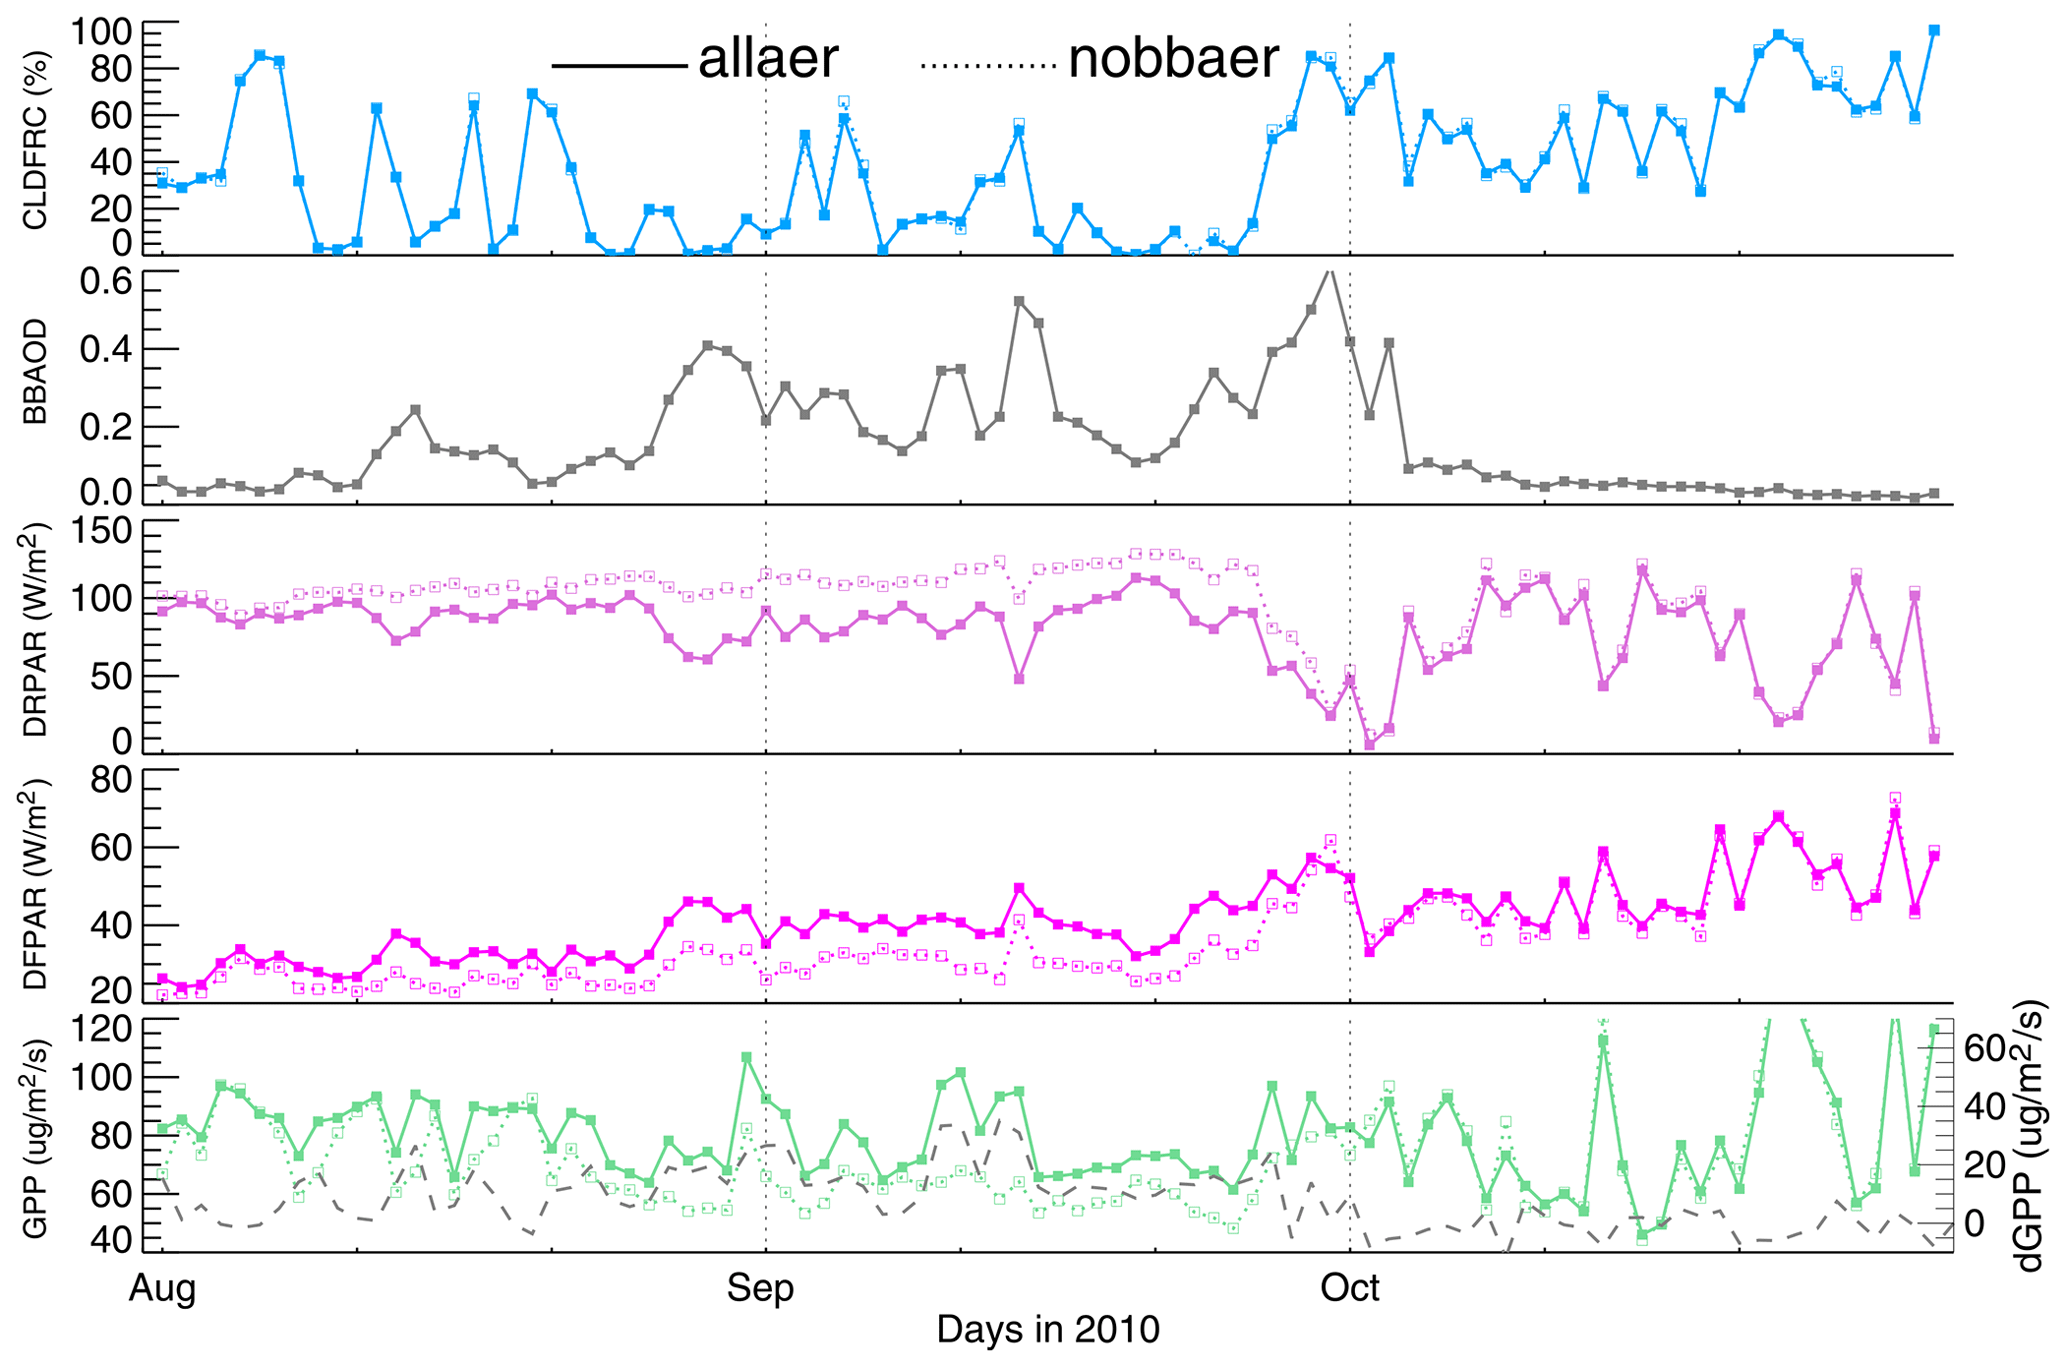
Figure 10GEOS simulated daily values of total cloud fraction (CLDFRC, %), biomass burning AOD (BBAOD), direct PAR (DRPAR, W m−2), diffuse PAR (DFPAR, W m−2), and gross primary growth (GPP, ) from the two experiments of pair1 at a selected site (15∘ S, 54∘ W; marked with a diamond in Fig. 11) during August–October 2010. The gray dashed line in the bottom panel shows the absolute GPP difference (dGPP) between allaer and nobbaer.
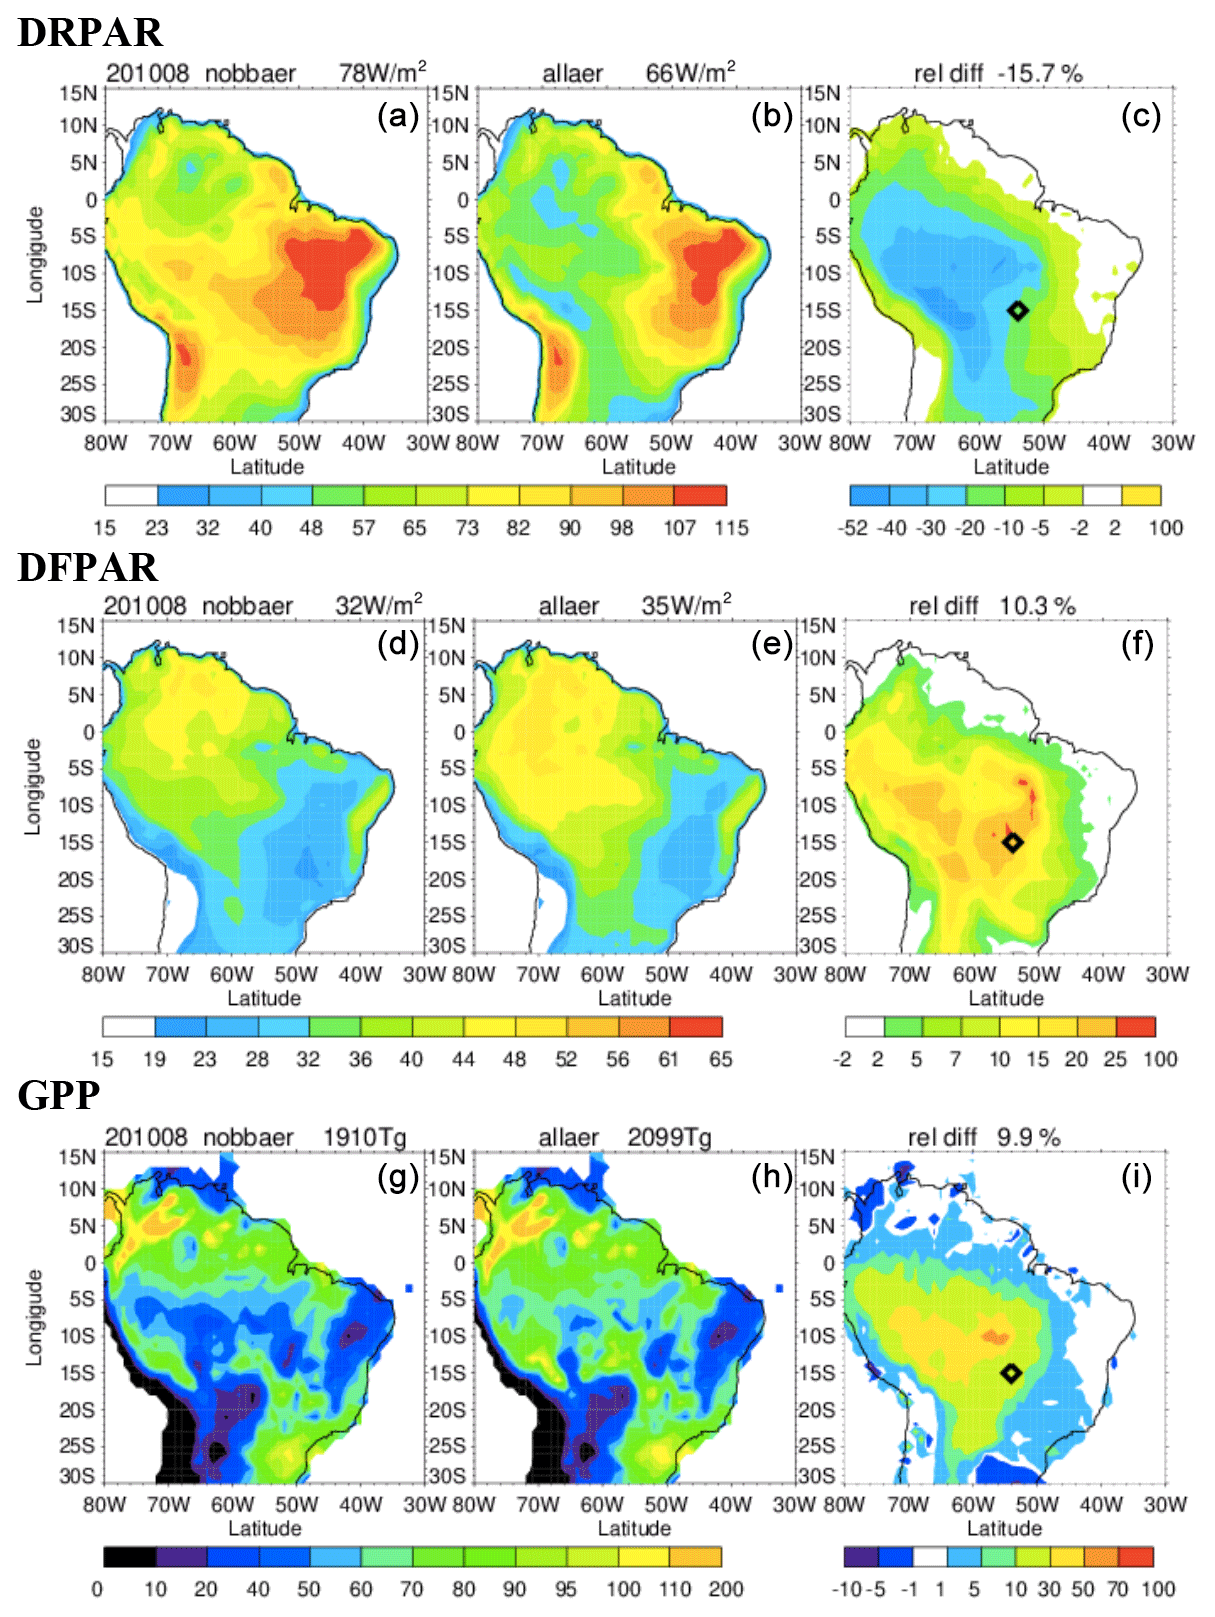
Figure 11August 2010 Amazon DRPAR (W m−2) (a, b, c), DFPAR (W m−2) (d, e, f), and GPP () (g, h, i) from the nobbaer (a, d, g) and allaer (b, e, h) GEOS experiments. The (c, f, i) show the relative change between allaer and nobbaer. All values are the Amazon regional average except the GPP values of (g, h) are regional total. Further analyses on the (c, f, i) diamond locations are given in Fig. 10.
We now evaluate BB aerosol impacts on radiation and ecosystem fields over the Amazon during August 2010, when the aerosol has its largest impact. Figure 11 shows the simulated Amazon DRPAR, DFPAR, and GPP fields from the two experiments comprising pair1 (nobbaer and allaer). The distribution of DRPAR shows a clear spatial gradient, with low values in the northwest and high values in the southeast, and the spatial pattern of DFPAR shows the reverse pattern. These features are primarily controlled by the cloud distribution (Fig. 3). Comparing the nobbaer and allaer results by calculating field relative change (i.e., ), we find that BBaer decreases DRPAR by 16 % and increases DFPAR by 10 % over the Amazon region, with maximum local changes of up to −50 % for DRPAR and 25 % for DFPAR. Interestingly, these maxima are not co-located, though the spatial patterns of perturbations do agree with each other. The mismatch in the locations of the maxima in the difference fields implies a nonlinear response of direct and diffuse light to aerosol and cloud particles (see Sect. 3.2). In response to the inclusion of BBaer, the Amazon GPP increases by 10 %. That is, the increase in GPP stemming from the increase in the diffuse light fraction overwhelms a potential reduction in GPP from a reduction in total PAR. When we consider all burning seasons over the 7-year studied period, the biomass burning aerosol increases DFPAR by 3.8 % and decreases DRPAR by 5.4 %, allowing it to increase Amazon GPP by 2.6 %. However, the 7-year averaged GPP increases by 0.99 % (Table 2), which is much less than the value during burning seasons.
Table 2Summary of model estimation of GPP increase in response to biomass burning aerosol over the Amazon Basin.
Dir, dif, and clm stand for direct radiation, diffuse radiation, and
climate adjustment, respectively. ICBC stands for initial condition and boundary condition.
3BEM: the Brazilian Biomass Burning Emission
BRAMS: Brazilian developments on the Regional Atmospheric Modeling System
CARMA: the Community Aerosol and Radiation Model for Atmospheres
CCATT: a Eulerian transport model suitable to simulate trace gases and aerosols
CLASSIC: the Coupled Large-scale Aerosol Simulator for Studies In Climate
GLOMAP: The 3-D GLObal Model of Aerosol Processes Model
HadGEM2-ES: The Hadley Centre Global Environment Model, version 2 – Earth System
IPCC AR5: The Intergovernmental Panel on Climate Change Fifth Assessment Report
ISCCP-D2: the International Satellite Cloud Climatology Project
JULES: the Joint UK Land Environment Simulator v3.0
OMA: One-Moment Aerosol
SOCRATES: Suite Of Community RAdiative Transfer codes based on Edwards and Slingo
YIBs: The Yale Interactive Terrestrial Biosphere model
freeGCM: the model forecasts meteorological fields by its governing equations
throughout its simulation period.
Replay: every 6 h, the model dynamic state is set to the balanced state provided by MERRA2 and then a 6 h forecast is performed.
ModelE2: the new coupled atmosphere–ocean models.
LSM4: land surface model version 4.
We also examine the multiyear (2010–2016) BBaer impacts on net primary production (NPP), that is, the rate at which carbon is accumulated (GPP) in excess of autotrophic respiration. In essence, NPP can be considered a proxy for the net plant sink of atmospheric carbon. Figure 12 shows monthly and long-term averaged NPP over the Amazon Basin from the two experiments comprising pair1. The monthly change in NPP (i.e., ) is shown in the figure as a green line. Each year, during the August–September period when BBaer is high and cloudiness is low over the Amazon, BBaer is seen to enhance NPP. The percentage difference of annually averaged NPP in percent is 4.2, 0.06, 1.9, 0.5, 1.3, 1.9, and 1.0 for the 7 studied years. That means the BBaer-induced NPP increases range from 5 Tg C yr−1 or 0.06 % (2011) to 278 Tg C yr−1 or 4.2 % (2010), with a 7-year average of 92 Tg C yr−1 or 1.5 %. This is equivalent to storing 92 Tg C annually within the Amazon ecosystem during the studied period. The CO2 fire emission data from the GFED4.1s emission inventory indicate that over this area and time period fires emit ∼250 Tg C yr−1. The NPP enhancement due to the BBaer-induced diffuse sunlight fertilization thus compensates for about 37 % of carbon loss by fires.
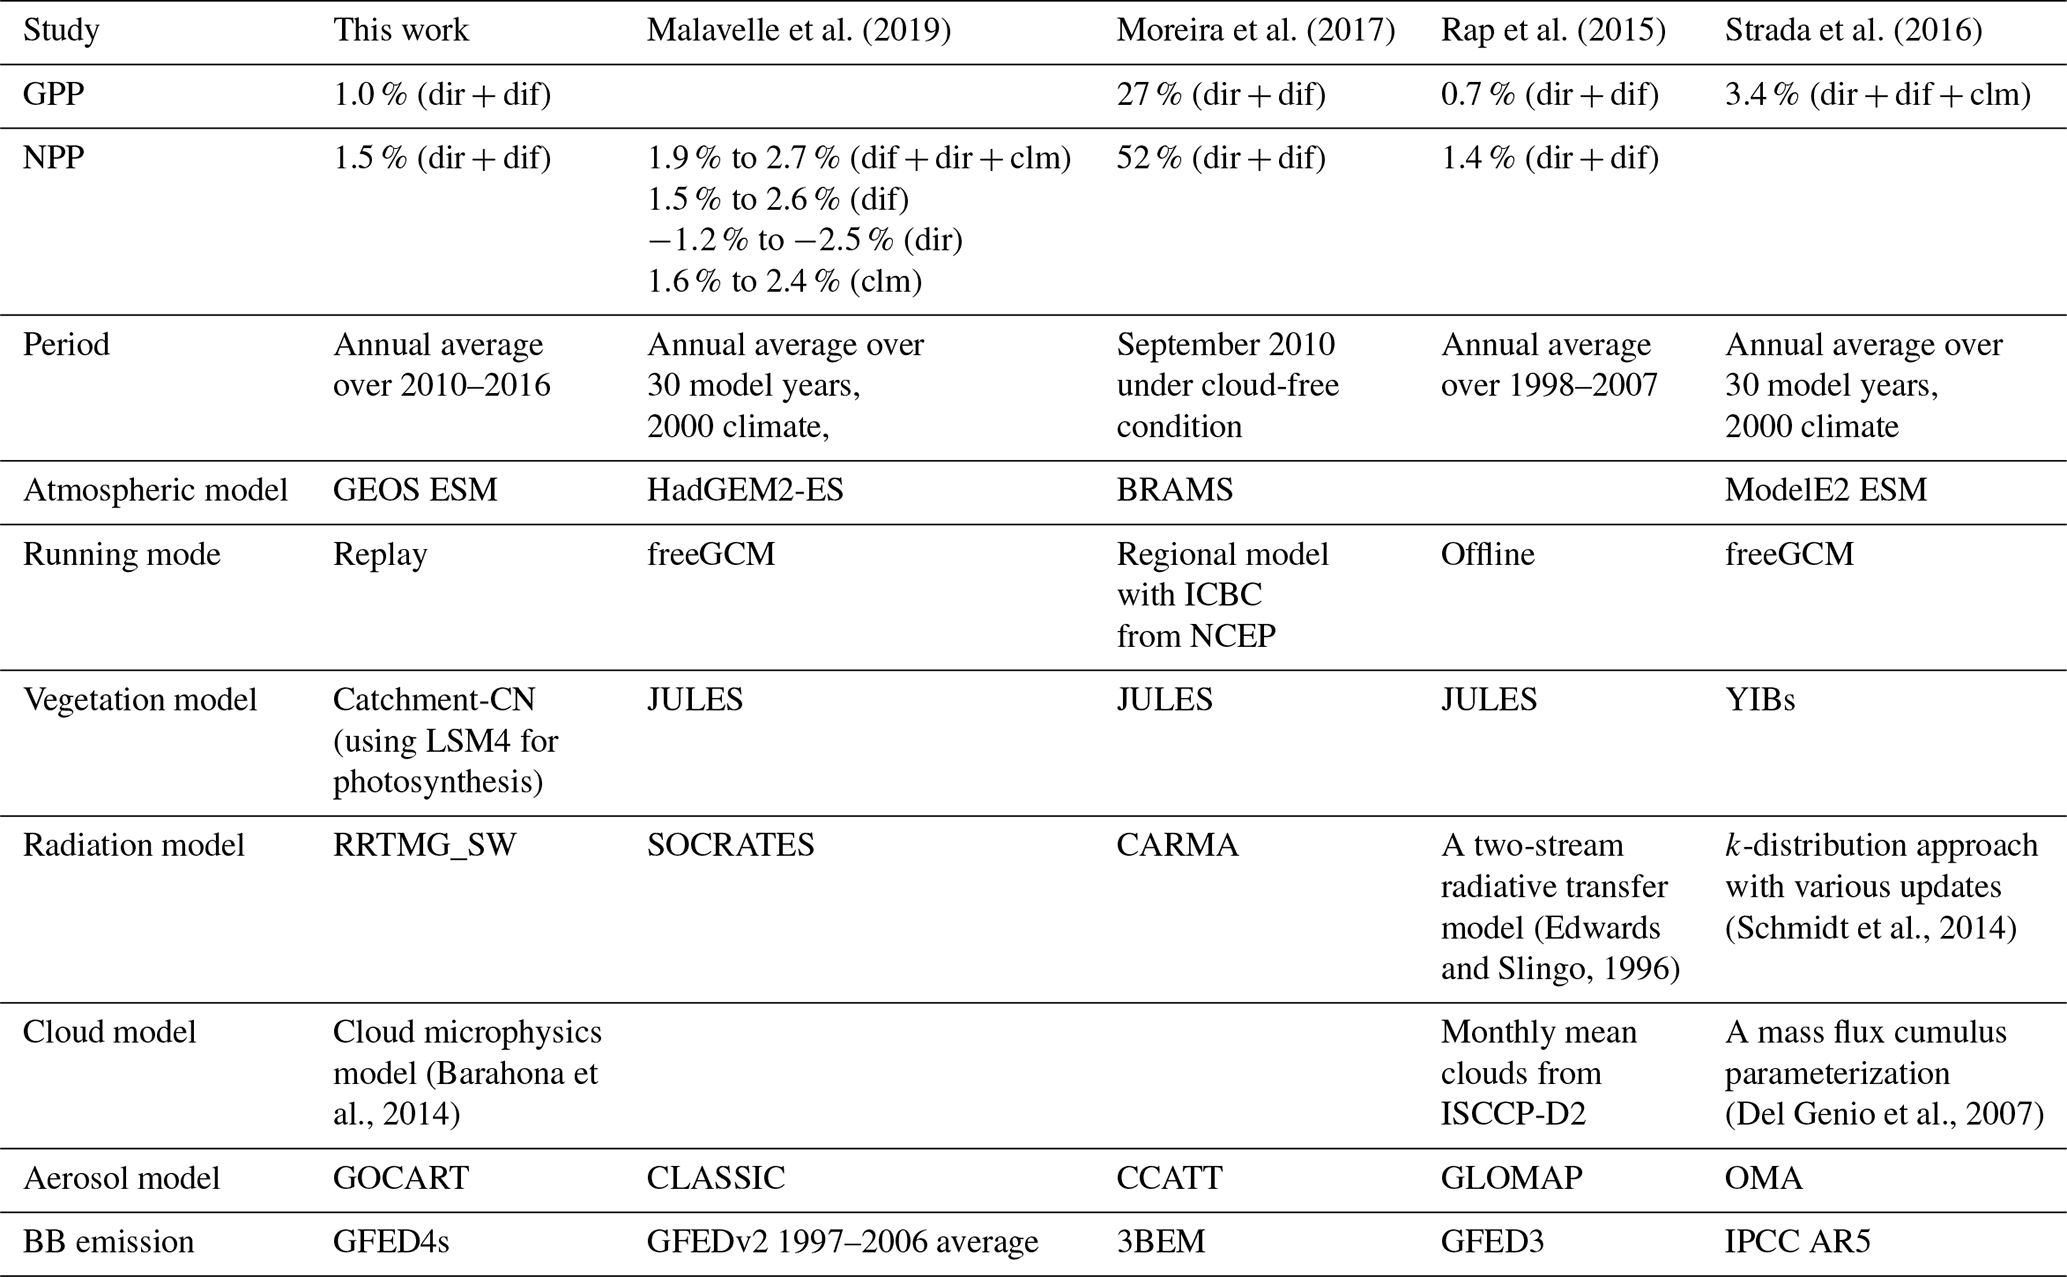
To assess how our simulated GPP and NPP response compares with other existing model estimates, we summarize all relevant studies in Table 2. In addition to differences in model formulations of fundamental physical mechanisms, these studies also differ in model simulation configuration (e.g., online vs. offline, freeGCM vs. Replay – for definitions of freeGCM and Reply, see below Table 2), BB emission inventory, and study period. Although our estimates of the increases in NPP across the Amazon region have a wide interannual variation (ranging from 0.5 % to 4.2 %), our 7-year averaged NPP increase (1.5 %) is close to the value (1.4 %) reported by Rap et al. (2015). Both studies considered only aerosol DRFE with cloud presence. The NPP can be increased up to 52 % in the burning season under clear-sky conditions (Moreira et al., 2017). By accounting for the feedback from aerosol–climate adjustments, the influence of aerosol on GPP and NPP is further increased (Malavelle et al., 2019; Strada et al., 2016).
3.4 How clouds adjust the BBaer diffuse radiation fertilization effect
Our second objective in this study is to investigate how the presence of clouds modulates the ability of BBaer to affect GPP. We highlight the cloud impact because even at the same BBAOD, the surface downward DRPAR and DFPAR can be very different between cloudy and cloud-free conditions (see Sect. 3.2). As mentioned above, the Amazon's so-called dry season still features a considerable amount of cloud, and the cloudiness levels vary significantly from year to year. This raises some questions: how do clouds affect the aerosol impact on radiation fields during the Amazon biomass burning season? Could different levels of background clouds have different impacts on the efficacy of the BBaer DRFE? There are two distinctive features in clouds and aerosols that require us to treat them differently in their impact on the radiation flux to the ecosystem. First, like our distinction between natural and anthropogenic aerosols in their impact on air quality and climate, the cloud is a more natural phenomenon, while biomass burning aerosols (BBaer) can be, at least partially, controlled by humans. Second, clouds are much more efficient in controlling both direct and diffuse radiation fields than aerosol (Fig. 9). What is the potential range of the variation in Amazon clouds in burning seasons when the Amazon experiences environments of La Niña, normal years, and El Niño? To what extent does this range of cloud variation adjust the efficiency of the “diffuse radiation fertilization effect” under the same emission strategy? These questions were not addressed clearly in previous studies, and we have tried to answer these questions in this study. Here, to quantify the cloud influence, we examine BBaer impacts during clear-sky (cloud cover <0.1), cloudy-sky (cloud cover 0.1–0.3, 0.3–0.6 and >0.6), and all-sky conditions based on GEOS gridded daily cloud cover over the Amazon region as shown in Fig. 13.
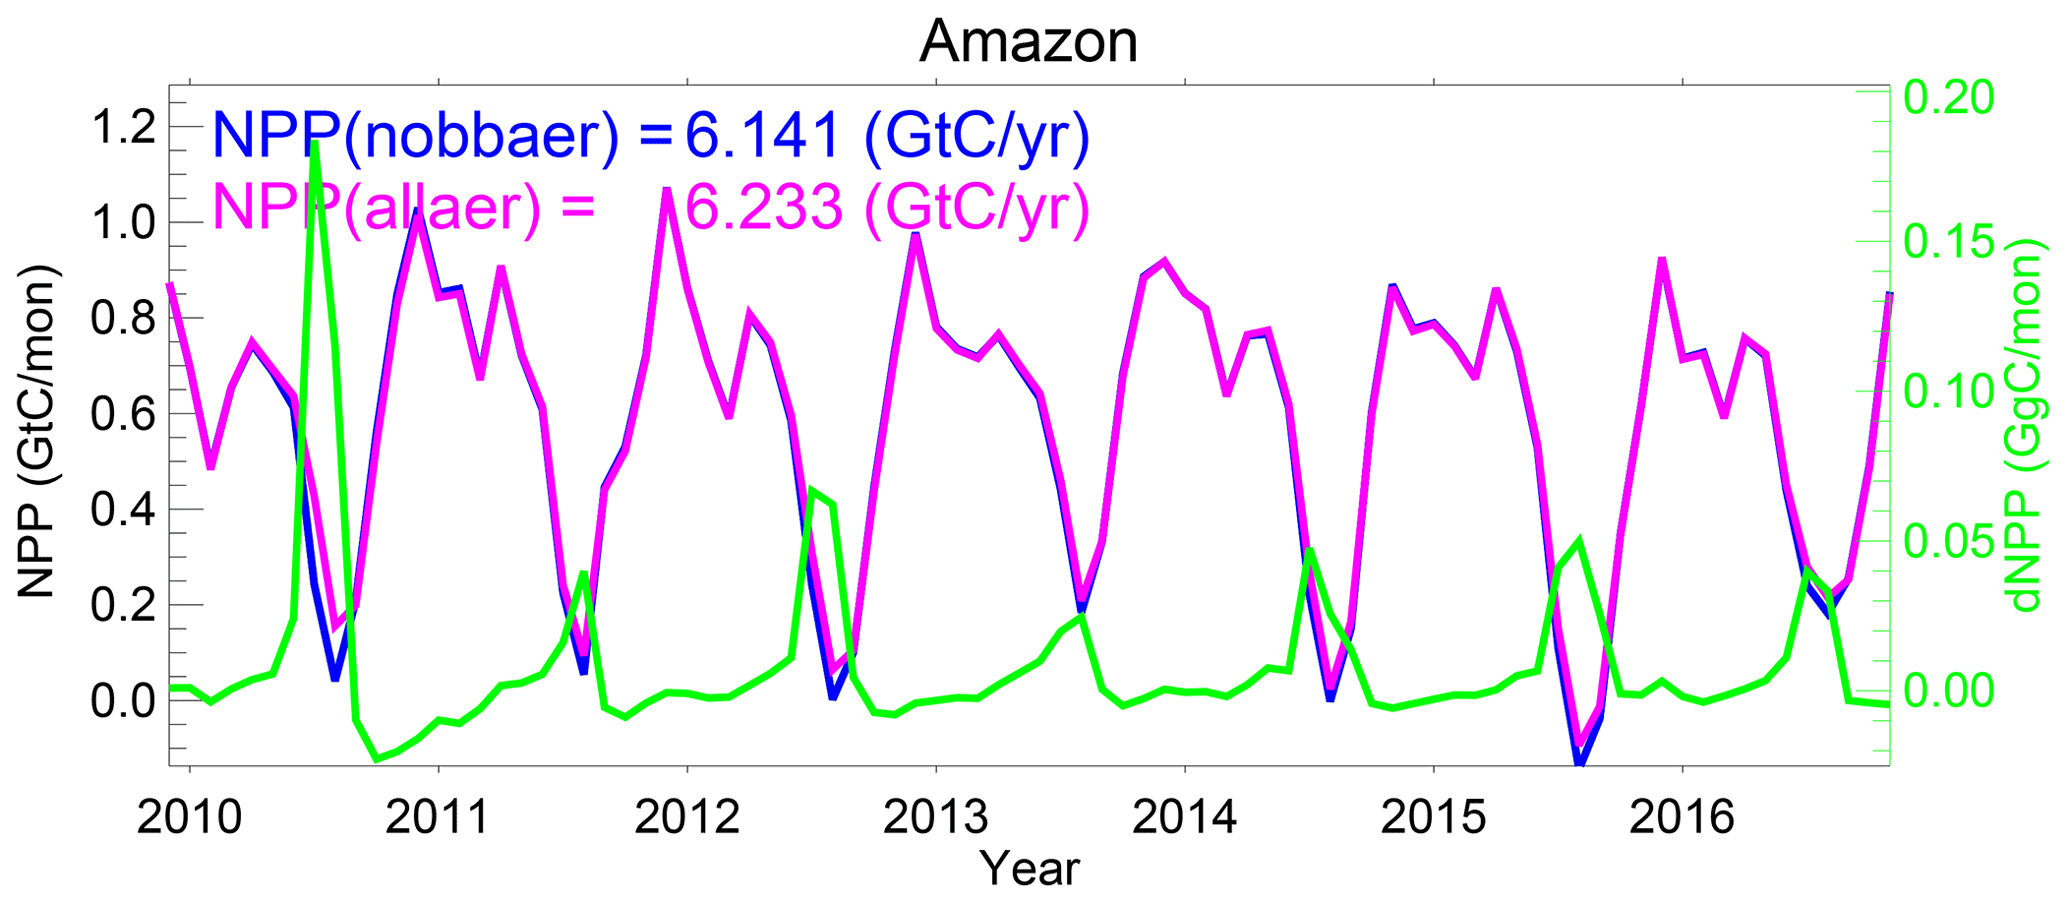
Figure 12Monthly net primary product (NPP) over the Amazon Basin (i.e., the land area of 25∘ S–5∘ N, 80–30∘ W) for the allaer (magenta, solid) and nobbaer (blue, solid) GEOS simulations with the multiyear mean values indicated in the legend. The monthly difference of NPP () is shown by the green line and the right y axis.
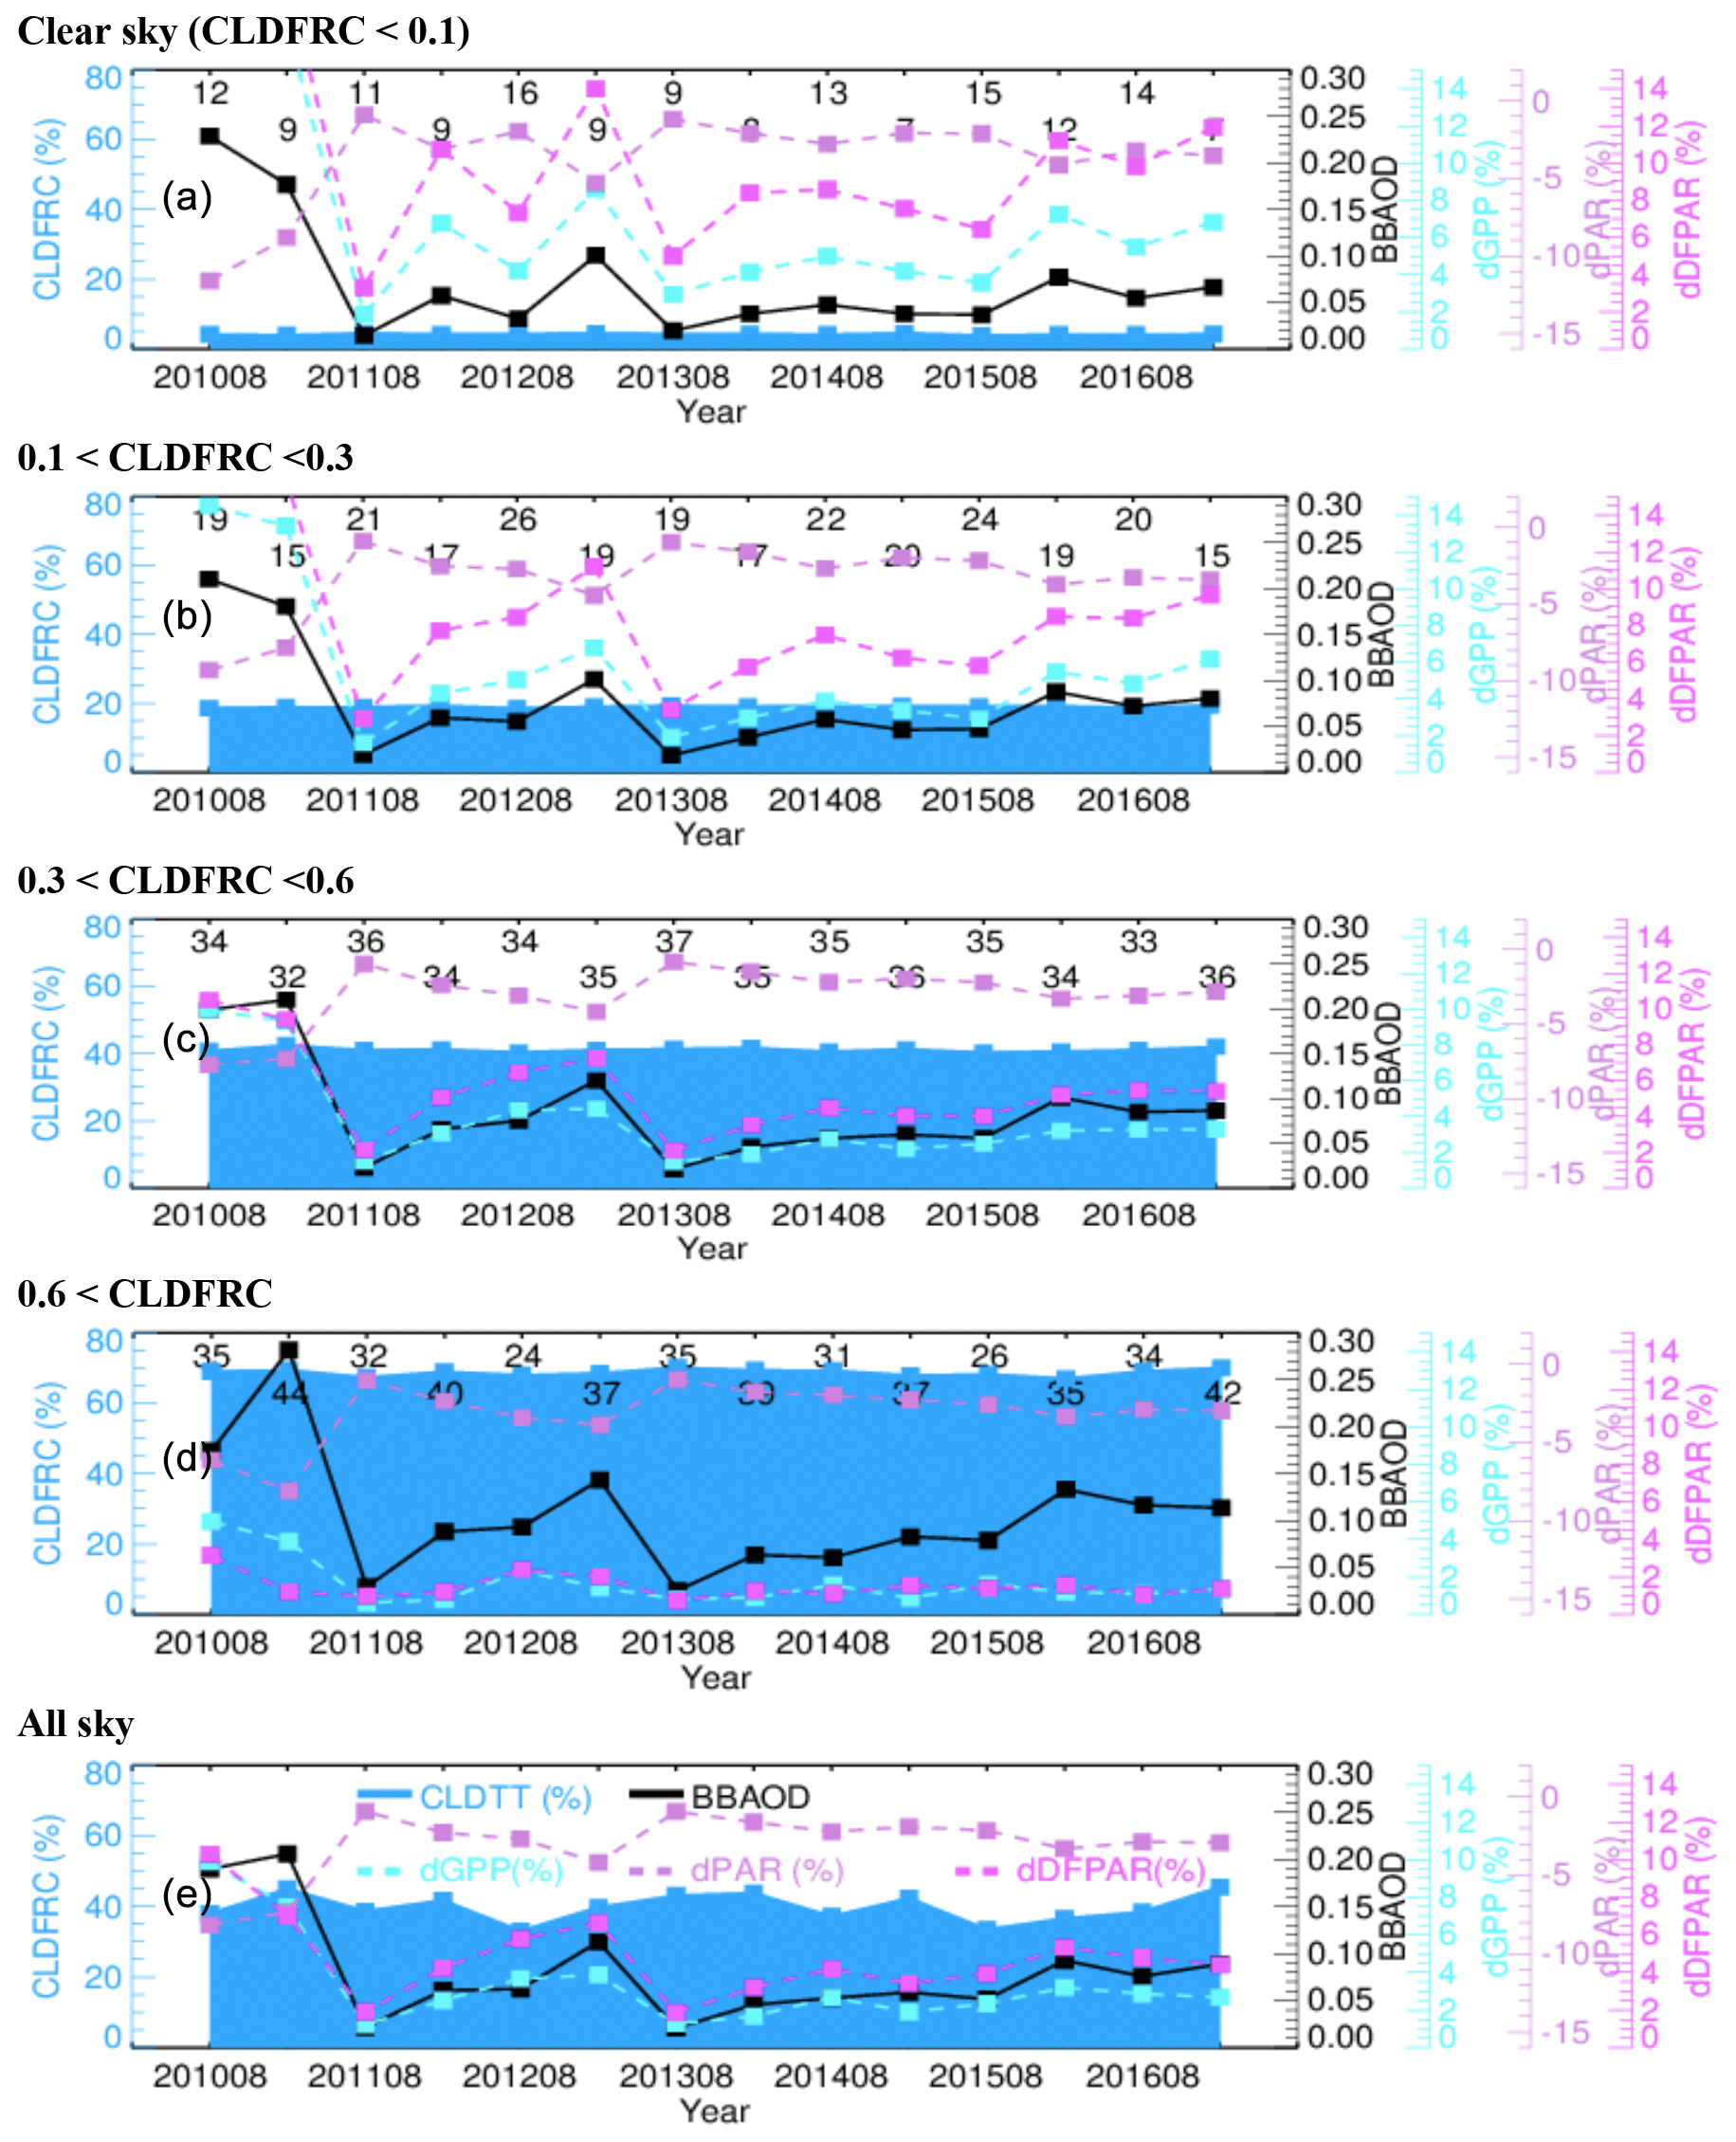
Figure 13Monthly (August and September) averaged fields during 2010–2016 over the Amazon range (25∘ S–5∘ N, 80–30∘ W) for different cloudy conditions. The fields shown here are CLDFRC (shaded area), biomass burning aerosol optical depth (BBAOD, black solid line), and the changes in GPP (dGPP), direct (dDRPAR), and diffuse (dDFPAR) fields due to the biomass burning aerosol impact on radiative fields (dashed lines) estimated by the two pair1 experiments. Note that all the changed fields are calculated as d; here X=GPP, DRPAR, or DFPAR. The numbers marked in (a–d) are the frequency of occurrence in percent of the corresponding cloud cover over the Amazon Basin in each month. Note that the dGPP is 119.5 % (201008) and 92.6 % (201009) in (a). The dDFPAR is 111.1 % (201008) and 105.5 % (201009) in (a) and 97.1% (201008) in (b).
Generally, the curves for BBAOD (solid black line) and dGPP (GPP difference, dashed light-blue line) are strongly and positively correlated, from R=77.4 % for cloud cover >0.6 (Fig. 13d) to R>94.5 % for the four other cloudiness conditions (Figs. 13a–c, e). This indicates that interannual changes in dGPP are primarily controlled by interannual fluctuations of biomass burning aerosols. The correlation presumably stems from the fact that biomass burning aerosols increase the diffuse PAR reaching the canopy (dashed pink line), although they decrease the total PAR (dotted purple line) via decreasing direct PAR (Tables 3 and S1a). This aerosol–radiation–GPP relationship is seen to vary with cloud amount with clouds acting to reduce the aerosol impact; both the diffuse radiation and the GPP show larger changes with BBAOD under clear-sky conditions. The overall (i.e., all-sky) aerosol impact on dGPP is similar to that for a cloud coverage of 0.3–0.6, simply because the averaged cloud coverage over the Amazon during the studied period is roughly in that range.
Table 3Summary of mean GPP, DRPAR, DFPAR, CLDFRC, and BBAOD over August–September of 2011–2016, as well as the relative changes in GPP, DRPAR, DFPAR, and CLDFRC within a pair of simulations.
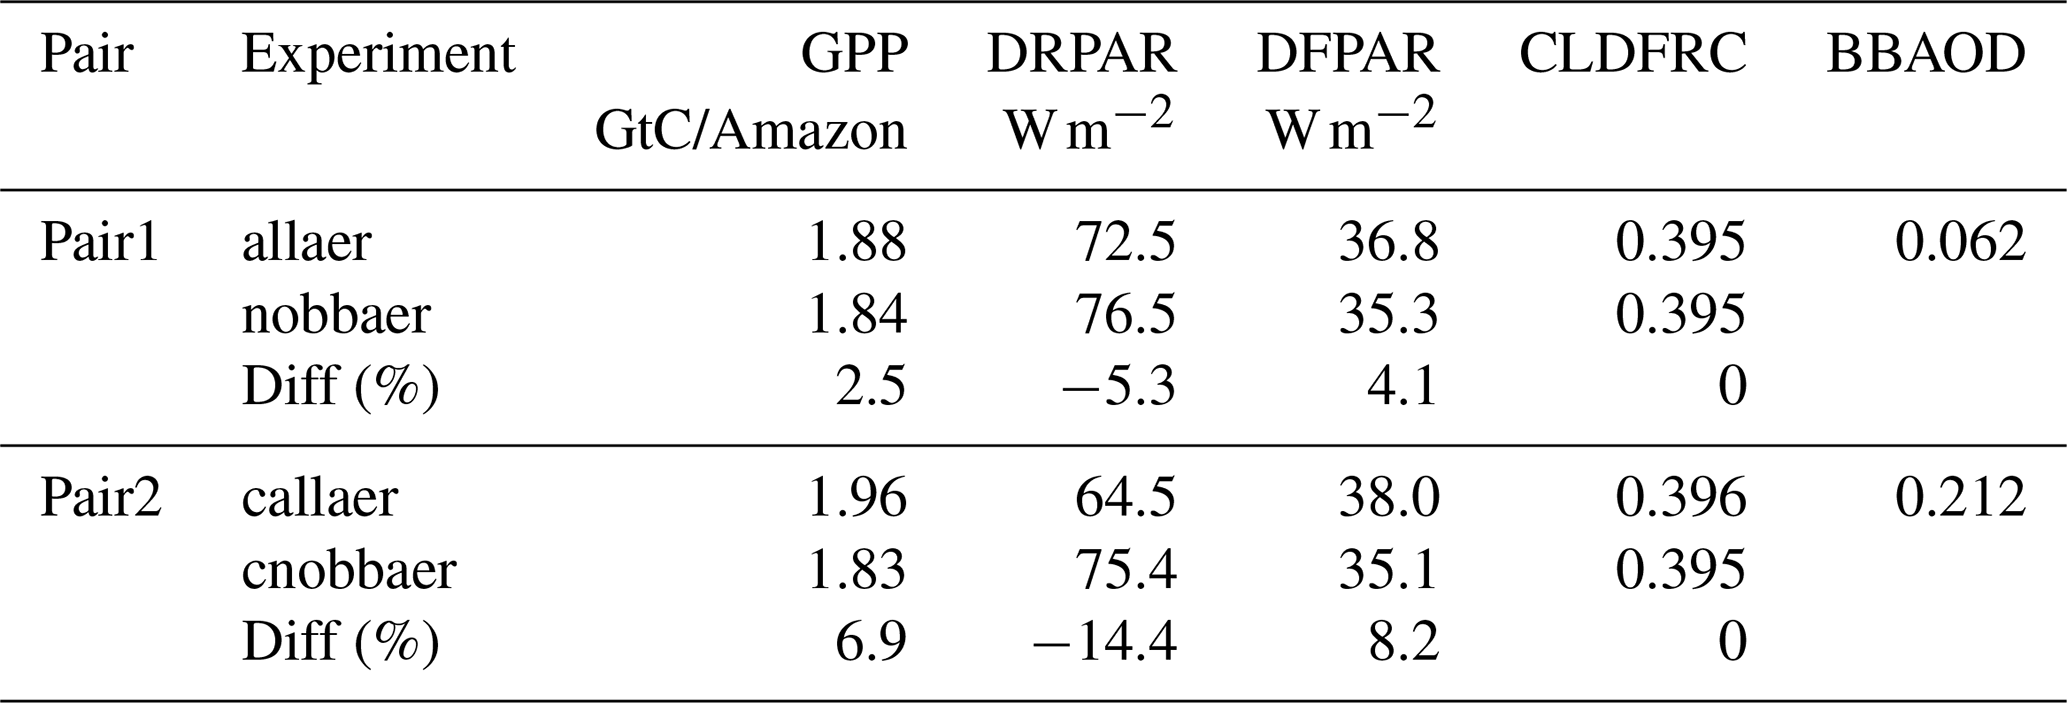
Figure 13 and Table S1e show that on an interannual (dry-season) basis, the aerosol DRFE differed the most between 2010 and 2011 (i.e., the dGPP was 8.7 % in 2010 and 1.8 % in 2011). During these 2 years, the average cloud fractions (CLDFRCs) are similar – 42 % in 2010 and 41 % in 2011 – but BBAOD decreased significantly by about 80 % from 0.198 in 2010 to 0.042 in 2011. Thus, although cloudiness does temper the impact of aerosols on radiation and the ecosystem, the interannual variation in the aerosol DRFE is primarily controlled by variations in biomass burning aerosols (e.g., >6 times variation in biomass burning emissions and BBAOD, Table S1e). In addition to the detailed information given in Tables S1a–e and S2a–e, in Table 3 we summarize the averaged GPP, DFPAR, DRPAR, CLDFRC, and BBAOD during August–September 2011–2016 over the Amazon region in all-sky conditions. Also given in Table 3 is the multiyear (2011–2016) averaged GPP over the Amazon region from all four simulations.
Recall that the pair2 experiments are equivalent to the pair1 experiments except for using the 2010 BB emissions for every year during 2011–2016. By jointly analyzing pair1 and pair 2, we can quantify the impacts of two different sets of BB emissions during the study period. This is, in principle, similar to the method of aerosol radiative forcing (RF) estimation (i.e., estimating aerosol radiative effect (RE) with and without aerosol for present-day (pair1) and pre-industrial (pair2) conditions and then deriving RF as a difference between the two pair REs). Here we study the sensitivity of the aerosol DRFE to a unit change in AOD. We call it susceptibility of the DRFE to BB aerosols. That is, on a daily basis, the sensitivity of a variable X to a change in the biomass burning AOD is calculated as . Here, the X represents GPP, DRPAR, and DFPAR, and the subscripts 1 and 2 represent the pair1 or pair2 experiment, respectively.
ddXdAOD is computed on a gridded daily basis over August–September of 2011–2016. The calculations are then catalogued according to daily cloud cover fraction – we combine the results within each of 10 cloud fraction bins (0–0.1, 0.1–0.2,…, 0.9–1.0). To examine the maximum impact of interannual cloud change during our study period, the binned ddXdAOD vs. CLDFRC relationship is also computed separately from daily (August–September) values in 2013 and from corresponding daily values in 2015, as these are the years for which monthly cloud cover is around the maximum (0.44) and minimum (0.35), respectively (Fig. 13 and Table S1e).
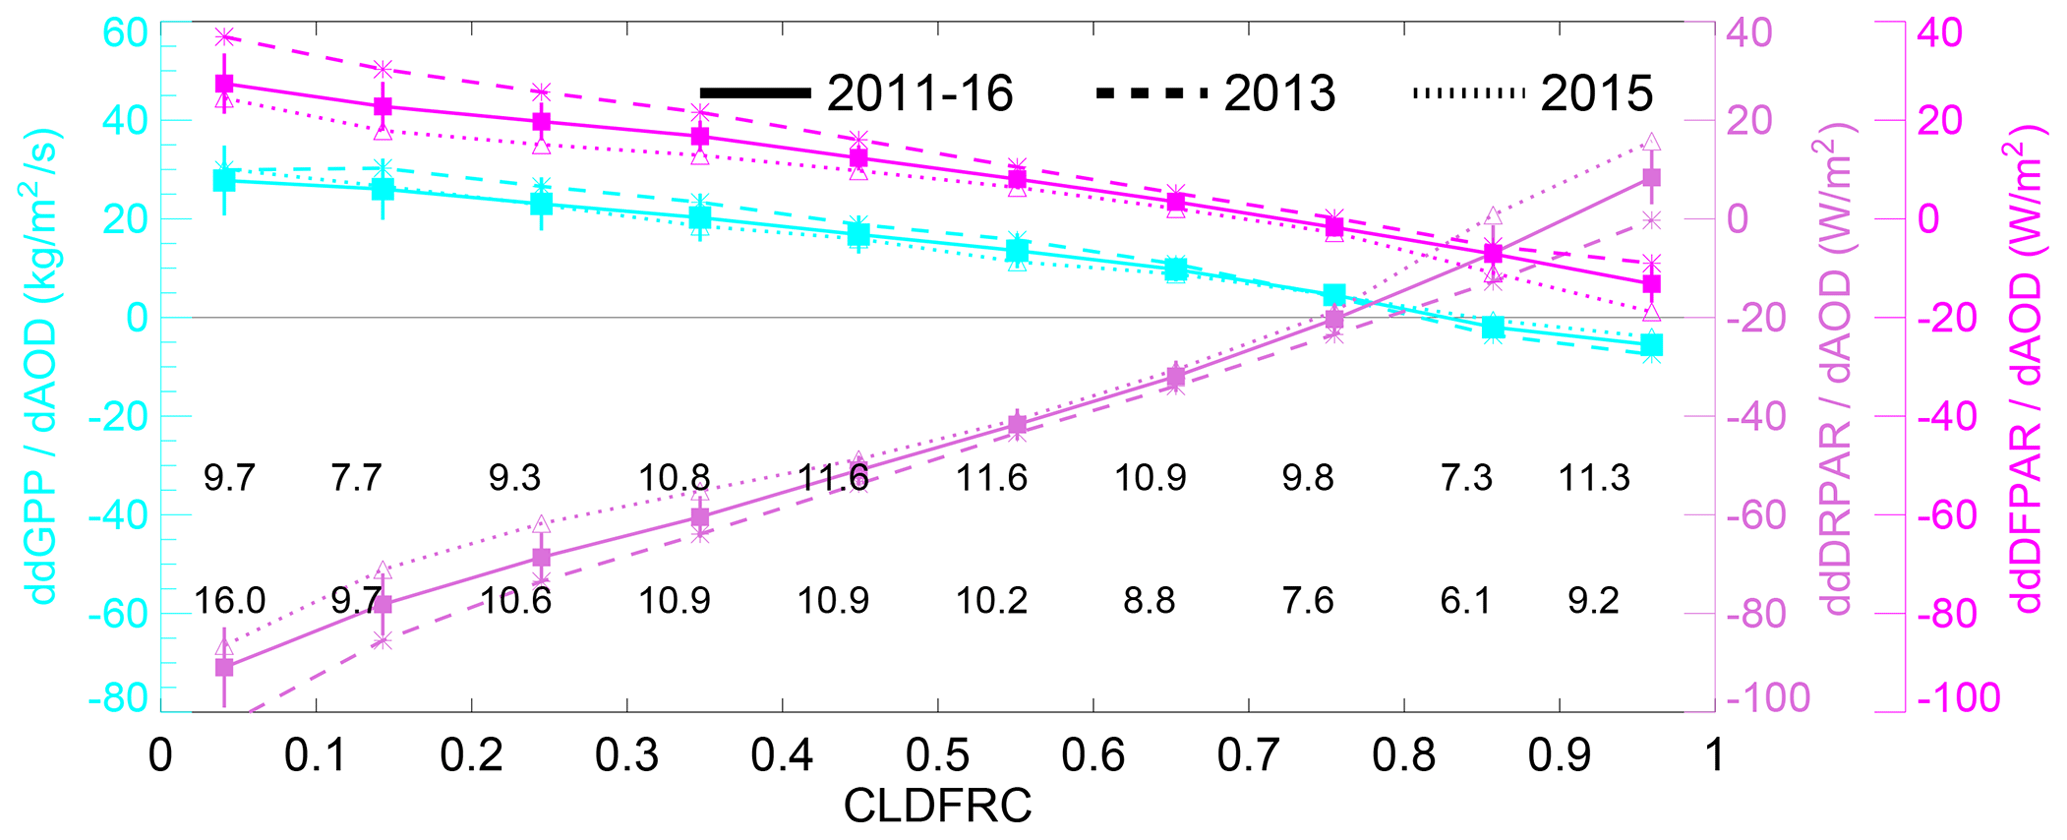
Figure 14Radiation (DRPAR and DFPAR) and ecosystem (GPP) perturbation on every unit AOD change calculated combining the two pairs of experiments, i.e., , , and ; here subscripts refer to the experiments of pair1 and pari2. These changes are sorted based on the values of the grid box cloud fraction on a daily basis during the reported timeframe (e.g., solid line for August–September 2011–2016, dashed line for August–September 2013, and dotted line for August–September 2015). Also shown are the vertical bars for 1 standard deviation and the number of the occurrence frequency in percent of each cloud fraction bin (0.1 increment) over the Amazon region for 2013 (first row) and 2015 (second row).
Figure 14 shows the results. An almost linear relationship is seen between the ddXdAOD values and cloud cover fraction. BB aerosols increase GPP in clear-sky conditions (e.g., 29.6 ) but decrease it under full-cloudiness conditions (e.g., −5.8 ). The cloud fraction at which BB aerosol switches from stimulating to inhibiting plant growth occurs at Cloud conditions thus not only strongly affect the strength of the aerosol DRFE but can also change the fundamental direction of the effect. The lines produced for the three different study periods are fairly similar, indicating that the relationship of ddXdAOD to CLDFRC is fairly stable within the range of cloud cover seen over the Amazon during the period of interest. Figure 14 also indicates that the dGPP can change from 18.5 to 15.5 () with a unit AOD of burning particles released to the atmosphere under the range of Amazon interannual cloud variation in the dry season, which is 0.35 to 0.44 in our study period. In other words, there is ∼20 % dGPP uncertainty adjusted by background Amazon cloud. Our work demonstrates quantitatively the role of clouds in tempering the aerosol diffuse radiation fertilization effect.
We use the NASA GEOS ESM system with coupled aerosol, cloud, radiation, and ecosystem modules to investigate the impact of biomass burning aerosols on plant productivity across the Amazon Basin under the natural background cloud fields experienced during 2010–2016 – a period containing a broad range of cloudiness conditions. We find that the biomass burning aerosol DRFE does stimulate plant growth and has a notable impact on Amazon ecosystem productivity during the biomass burning season (August–September). In the long-term mean, the aerosol light fertilizer increases DFPAR by 3.8 % and decreases DRPAR by 5.4 %, allowing it to increase Amazon GPP by 2.6 % during burning seasons. The 7-year averaged GPP increases by 0.99 %, which is much less than the value during burning seasons. On a monthly basis, the DRFE can increase GPP by up to 9.9 %. Consequently, biomass burning aerosols increase Amazonian yearly NPP by 1.5 % on average, with yearly increases ranging from 0.06 % to 4.2 % over the 7 years studied. This 1.5 % NPP enhancement (or ∼92 Tg C yr−1) is equivalent to ∼37 % of the carbon loss due to Amazon fires.
The aerosol DRFE is strongly dependent on the presence of clouds, much stronger in clear-sky conditions, and decreases with the increase in cloudiness. A fairly robust linear relationship is found between cloud cover fraction and the sensitivity of radiation and GPP change to a change in biomass burning AOD. BB aerosols stimulate plant growth under clear-sky conditions but suppress it under full-cloudiness conditions. Over the Amazon region within our study period, the cloud fraction at which a unit AOD switches from stimulating to inhibiting plant growth occurs at Note, however, that while our results show a clear sensitivity of the aerosol DRFE to cloudiness, interannual variations in the aerosol light fertilizer's overall effectiveness are controlled primarily by interannual variations in biomass burning aerosols during our studied period because biomass burning AOD can vary by a factor of 6 from year to year. The associated large variations in BBAOD are inevitably propagated to the radiation and ecosystem fields. Overall, our work indicates that feedbacks between aerosols, radiation, and the ecosystem need to be performed in the context of an atmospheric environment with a cloud presence.
This study examines the potential for the biomass burning aerosol DRFE to stimulate growth in unburned forest over the Amazon Basin. The net feedback of Amazon fires on the Amazon biome is still an open question. Some changes, such as increasing atmospheric CO2 and aerosols, serve as forest fertilizers, whereas others, such as increasing O3 pollution levels and the deposition of smoke particles on plant leaves, reduce plant photosynthesis. On top of this, fires also induce changes in meteorological fields (e.g., temperature, precipitation, clouds) that can affect plant growth (Malavelle et al., 2019; Strada and Unger, 2016; Unger et al., 2017). More efforts are needed to investigate the ecosystem effect of Amazon fires by integrating all these potential factors.
All of the observational data used in this study are publicly accessible, e.g., AERONET (https://aeronet.gsfc.nasa.gov, last access: 15 September 2021, NASA, 2021), CERES-EBAF (https://ceres.larc.nasa.gov/data/, last access: 15 September 2021, NASA Langley Research Center, 2021), FluxCom (http://www.fluxcom.org, last access: 15 September 2021, FluxCom, 2021), FluxSat (https://avdc.gsfc.nasa.gov, last access: 15 September 2021, AVDC, 2021), and GoAmazon (2021, https://www.arm.gov/research/campaigns/amf2014goamazon, last access: 15 September 2021). The GEOS model results can be provided by contacting the corresponding author.
The supplement related to this article is available online at: https://doi.org/10.5194/acp-21-14177-2021-supplement.
HB took an overall responsibility for the experiment design, model simulation, and data analysis. EL, RDK, SPM, and FZ contributed to the ecosystem study, DOB contributed to the cloud study, MC, PRC, ASD, MEM, and HY contributed to the aerosol study and the model–observation comparison, PN contributed to the radiation study, and JS provided the GoAmazon results. All authors contributed to paper writing.
The authors declare that they have no conflict of interest.
Publisher's note: Copernicus Publications remains neutral with regard to jurisdictional claims in published maps and institutional affiliations.
The authors thank the various observational groups (i.e., AERONET, CERES-EBAF, FluxCom, FluxSat, and GoAmazon). Huisheng Bian and Mian Chin were supported by NASA ACMAP funding (grant no. NNX17AG31G). Peter R. Colarco was supported by the Chemistry–Climate Modeling work package funded by the NASA Modeling, Analysis, and Prediction program (David Considine, program manager). John Shilling was supported by the by the U.S. Department of Energy's Atmospheric System Research, an Office of Science Biological and Environmental Research program. PNNL is operated for the DOE by Battelle Memorial Institute under contract DE-AC05-76RL01830.
Resources supporting this work were provided by the NASA GMAO SI-Team and the High-End Computing (HEC) Program through the NASA Center for Climate Simulation (NCCS) at the Goddard Space Flight Center (GSFC). FluxSat data were provided by Joanna Joiner's group in GSFC. GoAmazon data were obtained from the Atmospheric Radiation Measurement (ARM) user facility, a U.S. Department of Energy (DOE) Office of Science User facility managed by the Biological and Environmental Research program.
This research has been supported by NASA ACMAP funding (grant no. NNX17AG31G).
This paper was edited by Dominick Spracklen and reviewed by two anonymous referees.
Abdul-Razzak, H. and Ghan, S.: A parameterisation of aerosol activation 2. Multiple aerosol types, J. Geophys. Res., 105, 6837–6844, https://doi.org/10.1029/1999JD901161, 2000.
Aura Validation Data Center (AVDC): https://avdc.gsfc.nasa.gov, last access: 15 September 2021.
Barahona, D. and Nenes, A.: Parameterizing the competition between homogeneous and heterogeneous freezing in cirrus cloud formation – monodisperse ice nuclei, Atmos. Chem. Phys., 9, 369–381, https://doi.org/10.5194/acp-9-369-2009, 2009.
Barahona, D., Molod, A., Bacmeister, J., Nenes, A., Gettelman, A., Morrison, H., Phillips, V., and Eichmann, A.: Development of two-moment cloud microphysics for liquid and ice within the NASA Goddard Earth Observing System Model (GEOS-5), Geosci. Model Dev., 7, 1733–1766, https://doi.org/10.5194/gmd-7-1733-2014, 2014.
Bian, H. and Prather, M. J.: Accurate simulation of stratospheric photolysis in global chemical model, J. Atmos. Chem., 41, 281–296, https://doi.org/10.1023/A:1014980619462, 2002.
Bian, H., Chin, M., Kawa, S. R., Yu, H., and Diehl, T.: Multi-scale carbon monoxide and aerosol correlations from MOPITT and MODIS satellite measurements and GOCART model: implication for their emissions and atmospheric evolutions, J. Geophys. Res., 115, D07302, https://doi.org/10.1029/2009JD012781, 2010.
Bian, H., Colarco, P. R., Chin, M., Chen, G., Rodriguez, J. M., Liang, Q., Blake, D., Chu, D. A., da Silva, A., Darmenov, A. S., Diskin, G., Fuelberg, H. E., Huey, G., Kondo, Y., Nielsen, J. E., Pan, X., and Wisthaler, A.: Source attributions of pollution to the Western Arctic during the NASA ARCTAS field campaign, Atmos. Chem. Phys., 13, 4707–4721, https://doi.org/10.5194/acp-13-4707-2013, 2013.
Bian, H., Chin, M., Hauglustaine, D. A., Schulz, M., Myhre, G., Bauer, S. E., Lund, M. T., Karydis, V. A., Kucsera, T. L., Pan, X., Pozzer, A., Skeie, R. B., Steenrod, S. D., Sudo, K., Tsigaridis, K., Tsimpidi, A. P., and Tsyro, S. G.: Investigation of global particulate nitrate from the AeroCom phase III experiment, Atmos. Chem. Phys., 17, 12911–12940, https://doi.org/10.5194/acp-17-12911-2017, 2017.
Bian, H., Froyd, K., Murphy, D. M., Dibb, J., Darmenov, A., Chin, M., Colarco, P. R., da Silva, A., Kucsera, T. L., Schill, G., Yu, H., Bui, P., Dollner, M., Weinzierl, B., and Smirnov, A.: Observationally constrained analysis of sea salt aerosol in the marine atmosphere, Atmos. Chem. Phys., 19, 10773–10785, https://doi.org/10.5194/acp-19-10773-2019, 2019.
Breen, K. H., Barahona, D., Yuan, T., Bian, H., and James, S. C.: Effect of volcanic emissions on clouds during the 2008 and 2018 Kilauea degassing events, Atmos. Chem. Phys., 21, 7749–7771, https://doi.org/10.5194/acp-21-7749-2021, 2021.
Butt, N., New, M., Malhi, Y., Lola da Costa, A. C., Oliveira, P., and Silva-Espejo, J. E.: Diffuse radiation and cloud fraction relationships in two contrasting Amazonian rainforest sites, Agr. Forest Meteorol., 150, 361–368, https://doi.org/10.1016/j.agrformet.2009.12.004, 2010.
Carn, S., Fioletov, V., McLinden, C., Li, C., and Krotkov, N. A.: A decade of global volcanic SO2 emissions measured from space, Sci. Rep.-UK, 7, 44095, https://doi.org/10.1038/srep44095, 2017.
Chin, M., Diehl, T., Dubovik, O., Eck, T. F., Holben, B. N., Sinyuk, A., and Streets, D. G.: Light absorption by pollution, dust, and biomass burning aerosols: a global model study and evaluation with AERONET measurements, Ann. Geophys., 27, 3439–3464, https://doi.org/10.5194/angeo-27-3439-2009, 2009.
Chin, M., Diehl, T., Tan, Q., Prospero, J. M., Kahn, R. A., Remer, L. A., Yu, H., Sayer, A. M., Bian, H., Geogdzhayev, I. V., Holben, B. N., Howell, S. G., Huebert, B. J., Hsu, N. C., Kim, D., Kucsera, T. L., Levy, R. C., Mishchenko, M. I., Pan, X., Quinn, P. K., Schuster, G. L., Streets, D. G., Strode, S. A., Torres, O., and Zhao, X.-P.: Multi-decadal aerosol variations from 1980 to 2009: a perspective from observations and a global model, Atmos. Chem. Phys., 14, 3657–3690, https://doi.org/10.5194/acp-14-3657-2014, 2014.
Chipperfield M., Kinnison, D., Bekki S., Bian H., Brühl, C., Canty T., Cionni I., Dhomse S., Froidevaux L., Fuller R., Müller R., Prather M., Salawitch R., Santee M., Tian W., and Tilmes S.: Stratospheric Cheistry (Chapter 6), in: SPARC Report on the Evaluation of Chemistry-Climate Models, SPARC CCMVal, edited by: Eyring, V., Shepherd, T. G., and Waugh, D. W., World Meteorological Organization (WMO) World Climate Research Program (WCRP) Stratosphere-troposphere Processes And their Role in Climate (SPARC), WMO, SPARC Report No. 5, pp. 191–252, WCRP-132, WMO/TD-No. 1526, http://www.atmosp.physics.utoronto.ca/SPARC (last access: 15 September 2021), 2010.
Colarco, P. R., da Silva, A., Chin, M., and Diehl, T.: Online simulations of global aerosol distributions in the NASA GEOS-4 model and comparisons to satellite and ground-based aerosol optical depth, J. Geophys. Res., 115, D14207, https://doi.org/10.1029/2009JD012820, 2010.
Colarco, P. R., Gassó, S., Ahn, C., Buchard, V., da Silva, A. M., and Torres, O.: Simulation of the Ozone Monitoring Instrument aerosol index using the NASA Goddard Earth Observing System aerosol reanalysis products, Atmos. Meas. Tech., 10, 4121–4134, https://doi.org/10.5194/amt-10-4121-2017, 2017.
Cirino, G. G., Souza, R. A. F., Adams, D. K., and Artaxo, P.: The effect of atmospheric aerosol particles and clouds on net ecosystem exchange in the Amazon, Atmos. Chem. Phys., 14, 6523–6543, https://doi.org/10.5194/acp-14-6523-2014, 2014.
Del Genio, A. D., Yao, M.-S., and Jonas, J.: Will moist convection be stronger in a warmer climate?, Geophys. Res. Lett., 34, L16703, https://doi.org/10.1029/2007GL030525, 2007.
Doughty, C. E., Flanner, M. G., and Goulden, M. L.: Effect of smoke on subcanopy shaded light, canopy temperature, and carbon dioxide uptake in an Amazon rainforest, Global Biogeochem. Cy., 24, GB3015, https://doi.org/10.1029/2009GB003670, 2010.
Doughty, C. E., Metcalfe, D. B., Girardin, C. A. J., Farfan-Amezquita, F., Galiano Cabrera, D., Huaraca Huasco, W., Silva-Espejo, J. E., Araujo-Murakami, A., da Costa, M. C., Rocha, W., Feldpausch, T. R., Mendoza, A. L. M., da Costa, A. C. L., Meir, P., Phillips, O. L., and Malhi, Y.: Drought impact on forest carbon dynamics and fluxes in Amazonia, Nature, 519, 78–82, 2015.
Doughty, R., Köhler, P., Frankenberg, C., Magney, T. S., Xiao, X., Qin, Y., Wu, X., and Moore, B.: TROPOMI reveals dry-season increase of solar-induced chlorophyll fluorescence in the Amazon forest, P. Natl. Acad. Sci. USA, 116, 22393–22398, https://doi.org/10.1073/pnas.1908157116, 2019.
Dubovik, O., Smirnov, A., Holben, B. N., King, M. D., Kauf- man, Y. J., Eck, T. F., and Slutsker, I.: Accuracy assessments of aerosol optical properties retrieved from AERONET Sun and sky-radiance measurements, J. Geophys. Res., 105, 9791–9806, https://doi.org/10.1029/2000JD900040, 2000.
Dubovik, O., Holben, B. N., Eck, T. F., Smirnov, A., Kaufman, Y. J., King, M. D., Tanre Í, D., and Slutsker, I.: Variability of ab- sorption and optical properties of key aerosol types observed in worldwide locations, J. Atmos. Sci., 59, 590–608, https://doi.org/10.1175/1520-0469(2002)059<0590:VOAAOP>2.0.CO;2, 2002.
Edwards, J. M. and Slingo, A.: Studies with a flexible new radiation code. 1: Choosing a configuration for a large-scale model, W. J. R. Meteorol. Soc., 122, 689–719, https://doi.org/10.1002/qj.49712253107, 1996.
Ezhova, E., Ylivinkka, I., Kuusk, J., Komsaare, K., Vana, M., Krasnova, A., Noe, S., Arshinov, M., Belan, B., Park, S.-B., Lavrič, J. V., Heimann, M., Petäjä, T., Vesala, T., Mammarella, I., Kolari, P., Bäck, J., Rannik, Ü., Kerminen, V.-M., and Kulmala, M.: Direct effect of aerosols on solar radiation and gross primary production in boreal and hemiboreal forests, Atmos. Chem. Phys., 18, 17863–17881, https://doi.org/10.5194/acp-18-17863-2018, 2018.
Feldpausch, T. R., Phillips, O. L., Brienen, R. J. W., Gloor, E., Lloyd, J., Lopez-Gonzalez, G., Monteagudo-Mendoza, A., Malhi, Y., Alarcón, A., Álvarez Dávila, E., Alvarez-Loayza, P., Andrade, A., Aragáo, L. E. O. C., Arroyo, L., Aymard C., G. A., Baker, T. R., Baraloto, C., Barroso, J., Bonal, D., Castro, W., Chama, V., Chave, J., Domingues, T. F., Fauset, S., Groot, N., Honorio Coronado, E., Laurance, S., Laurance, W. F., Lewis, S. L., Licona, J. C., Marimon, B. S., Marimon-Junior, B. H., Mendoza Bautista, C., Neill, D. A., Oliveira, E. A., Oliveira dos Santos, C., Pallqui Camacho, N. C., Pardo-Molina, G., Prieto, A., Quesada, C. A., Ramírez, F., Ramírez-Angulo, H., Réjou-Méchain, M., Rudas, A., Saiz, G., Salomáo, R. P., Silva-Espejo, J. E., Silveira, M., ter Steege, H., Stropp, J., Terborgh, J., Thomas-Caesar, R., van der Heijden, G. M. F., Vásquez Martinez, R., Vilanova, E., and Vos, V. A.: Amazon forest response to repeated droughts. Global Biogeochem. Cy., 30, 964– 982, https://doi.org/10.1002/2015GB005133, 2016.
Feng, Y., Chen, D. and Zhao, X.: Estimated long-term variability of direct and diffuse solar radiation in North China during 1959–2016, Theor. Appl. Climatol., 137, 153–163, https://doi.org/10.1007/s00704-018-2579-1, 2019.
FluxCom: http://www.fluxcom.org, last access: 15 September 2021.
Gelaro, R., McCarty, W., Suárez, M. J., Todling, R., Molod, A., Takacs, L., Takacs, L., Randles, C. A., Darmenov, A., Bosilovich, M. G., Reichle, R., Wargan, K., Coy, L., Cullather, R., Draper, C., Akella, S., Buchard, V., Conaty, A., da Silva1, A. M., Gu, W., Kim, G. K., Koster, R., Lucchesi, R., Merkova, D., Nielsen, J. E., Partyka, G., Pawson, S., Putman, W., Rienecker, M., Schubert, S. D., Sienkiewicz, M., and Zhao, B.: The Modern-Era Retrospective Analysis for Research and Applications, Version 2 (MERRA-2), J. Climate, 30, 5419–5454, https://doi.org/10.1175/JCLI-D-16-0758.1, 2017.
GoAmazon: https://www.arm.gov/research/campaigns/amf2014 goamazon, last access: 15 September 2021.
Gu, L. H., Baldocchi, D. D., Wofsy, S. C., Munger, J. W., Michalsky, J. J., Urbanski, S. P., and Boden, T. A.: Response of a deciduous forest to the Mount Pinatubo eruption: Enhanced photosynthesis, Science, 299, 2035–2038, https://doi.org/10.1126/science.1078366, 2003.
Guenther, A. B., Jiang, X., Heald, C. L., Sakulyanontvittaya, T., Duhl, T., Emmons, L. K., and Wang, X.: The Model of Emissions of Gases and Aerosols from Nature version 2.1 (MEGAN2.1): an extended and updated framework for modeling biogenic emissions, Geosci. Model Dev., 5, 1471–1492, https://doi.org/10.5194/gmd-5-1471-2012, 2012.
Hall, S. R., Ullmann, K., Prather, M. J., Flynn, C. M., Murray, L. T., Fiore, A. M., Correa, G., Strode, S. A., Steenrod, S. D., Lamarque, J.-F., Guth, J., Josse, B., Flemming, J., Huijnen, V., Abraham, N. L., and Archibald, A. T.: Cloud impacts on photochemistry: building a climatology of photolysis rates from the Atmospheric Tomography mission, Atmos. Chem. Phys., 18, 16809–16828, https://doi.org/10.5194/acp-18-16809-2018, 2018.
Hemes, K. S., Verfaillie, J., and Baldocchi, D. D.: Wildfire-Smoke Aerosols Lead to Increased Light Use Efficiency Among Agricultural and Restored Wetland Land Uses in California's Central Valley, J. Geophys. Res.-Biogeo., 125, e2019JG005380, https://doi.org/10.1029/2019jg005380, 2020.
Hodzic, A. and Jimenez, J. L.: Modeling anthropogenically controlled secondary organic aerosols in a megacity: a simplified framework for global and climate models, Geosci. Model Dev., 4, 901–917, https://doi.org/10.5194/gmd-4-901-2011, 2011.
Huete, A. R., Didan, K., Shimabukuro, Y. E., Ratana, P., Saleska, S. R., Hutyra, L. R., Yang, W., Nemani, R. R., and Myneni, R.: Amazon rainforests green-up with sunlight in dry season, Geophys. Res. Lett., 33, L06405, https://doi.org/10.1029/2005GL025583, 2006.
Iacono, M. J., Delamere, J. S., Mlawer, E. J., Shephard, M. W., Clough, S. A., and Collins, W. D.: Radiative forcing by long-lived greenhouse gases: Calculations with the AER radiative transfer models, J. Geophys. Res., 113, D13103, https://doi.org/10.1029/2008JD009944, 2008.
Joiner, J., Yoshida, Y., Zhang, Y., Duveiller, G., Jung, M., Lya- pustin, A., Wang, Y., and Tucker, J. C.: Estimation of Terres- trial Global Gross Primary Production (GPP) with Satellite Data- Driven Models and Eddy Covariance Flux Data, Remote Sens.-Basel, 10, 1346, https://doi.org/10.3390/rs10091346, 2018.
Jung, M., Schwalm, C., Migliavacca, M., Walther, S., Camps-Valls, G., Koirala, S., Anthoni, P., Besnard, S., Bodesheim, P., Carvalhais, N., Chevallier, F., Gans, F., Goll, D. S., Haverd, V., Köhler, P., Ichii, K., Jain, A. K., Liu, J., Lombardozzi, D., Nabel, J. E. M. S., Nelson, J. A., O'Sullivan, M., Pallandt, M., Papale, D., Peters, W., Pongratz, J., Rödenbeck, C., Sitch, S., Tramontana, G., Walker, A., Weber, U., and Reichstein, M.: Scaling carbon fluxes from eddy covariance sites to globe: synthesis and evaluation of the FLUXCOM approach, Biogeosciences, 17, 1343–1365, https://doi.org/10.5194/bg-17-1343-2020, 2020.
Kato, S., Loeb, N., Rose, F. G., Doelling, D. R., Rutan, D. A., Caldwell, T. E., Yu, L., and Weller, R. A.: Surface irradiances consistent with CERES-derived top-of-atmosphere shortwave and longwave irradiances, J. Climate, 26, 2719–2740, https://doi.org/10.1175/JCLI-D-12-00436.1, 2013.
Keppel-Aleks, G. and Washenfelder, R. A.: The effect of atmospheric sulfate reductions on diffuse radiation and photosynthesis in the United States during 1995–2013, Geophys. Res. Lett., 43, 9984–9993, https://doi.org/10.1002/2016GL070052, 2016.
Kim, P. S., Jacob, D. J., Fisher, J. A., Travis, K., Yu, K., Zhu, L., Yantosca, R. M., Sulprizio, M. P., Jimenez, J. L., Campuzano-Jost, P., Froyd, K. D., Liao, J., Hair, J. W., Fenn, M. A., Butler, C. F., Wagner, N. L., Gordon, T. D., Welti, A., Wennberg, P. O., Crounse, J. D., St. Clair, J. M., Teng, A. P., Millet, D. B., Schwarz, J. P., Markovic, M. Z., and Perring, A. E.: Sources, seasonality, and trends of southeast US aerosol: an integrated analysis of surface, aircraft, and satellite observations with the GEOS-Chem chemical transport model, Atmos. Chem. Phys., 15, 10411–10433, https://doi.org/10.5194/acp-15-10411-2015, 2015.
Koster, R. D. and Walker, G. K.: Interactive vegetation phenology, soil moisture, and monthly temperature forecasts, J. Hydrometeorol., 16, 1456–1465, https://doi.org/10.1175/JHM-D-14-0205.1, 2015.
Koster, R. D., Suarez, M. J., Ducharne, A., Stieglitz, M., and Kumar, P.: A catchment-based approach to modeling land surface processes in a general circulation model: 1. Model structure, J. Geophys. Res., 105, 24 809–24 822, https://doi.org/10.1029/2000JD900327, 2000.
Laurance, W. F.: Gaia's lungs: Are rainforests inhaling Earth's excess carbon dioxide?, Nat. Hist., 108, p. 96, 1999.
Lawrence, D. M., Fisher, R. A., Koven, C. D., Oleson, K. W., Swenson, S. C., Bonan, G., Collier, N., Ghimire, B., van Kampenhout, L., Kennedy, D., Kluzek, E., Lawrence, P. J., Li, F., Li, H., Lombardozzi, D., Riley, W. J., Sacks, W. J., Shi, M., Vertenstein, M., Wieder, W. R., Xu, C., Ali, A. A., Badger, A. M., Bisht, G., van den Broeke, M., Brunke, M. A., Burns, S. P., Buzan, J., Clark, M., Craig, A., Dahlin, K., Drewniak, B., Fisher, J. B., Flanner, M., Fox, A. M., Gentine, P., Hoffman, F., Keppel-Aleks, G., Knox, R., Kumar, S., Lenaerts, J., Leung, L., R., Lipscomb, W. H., Lu, Y., Pandey, A., Pelletier, J. D., Perket, J., Randerson, J. T., Ricciuto, D. M., Sanderson, B. M., Slater, A., Subin, Z. M., Tang, J., Thomas, R. Q., Val Martin, M., and Zeng, X.: The Community Land Model version 5: Description of new features, benchmarking, and impact of forcing uncertainty, J. Adv. Model. Earth Sy., 11, 4245–4287, https://doi.org/10.1029/2018MS001583, 2019.
Lee, M. S., Hollinger, D. Y., Keenan, T. F., Ouimette, A. P., Ollinger, S. V., and Richardson, A. D.: Model-based analysis of the impact of diffuse radiation on CO2 exchange in a temperate deciduous forest, Agr. Forest Meteorol., 249, 377–389, https://doi.org/10.1016/j.agrformet.2017.11.016, 2018.
Letts, M. G., Lafleur, P. M., and Roulet, N. T.: On the relationship between cloudiness and net ecosystem carbon dioxide exchange in a peatland ecosystem Ecoscience, 12, 53–59, https://doi.org/10.2980/i1195-6860-12-1-53.1, 2005.
Li, T. and Yang, Q.: Advantages of diffuse light for horticultural production and perspectives for further research, Front. Plant Sci., 6, 704, https://doi.org/10.3389/fpls.2015.00704, 2015.
Li, W., Fu, R., and Dickinson, R. E.: Rainfall and its seasonality over the Amazon in the 21st century as assessed by the coupled models for the IPCC AR4, J. Geophys. Res., 111, D02111, https://doi.org/10.1029/2005JD006355, 2006.
Malavelle, F. F., Haywood, J. M., Mercado, L. M., Folberth, G. A., Bellouin, N., Sitch, S., and Artaxo, P.: Studying the impact of biomass burning aerosol radiative and climate effects on the Amazon rainforest productivity with an Earth system model, Atmos. Chem. Phys., 19, 1301–1326, https://doi.org/10.5194/acp-19-1301-2019, 2019.
Martin, S. T., Artaxo, P., Machado, L. A. T., Manzi, A. O., Souza, R. A. F., Schumacher, C., Wang, J., Andreae, M. O., Barbosa, H. M. J., Fan, J., Fisch, G., Goldstein, A. H., Guenther, A., Jimenez, J. L., Pöschl, U., Silva Dias, M. A., Smith, J. N., and Wendisch, M.: Introduction: Observations and Modeling of the Green Ocean Amazon (GoAmazon2014/5), Atmos. Chem. Phys., 16, 4785–4797, https://doi.org/10.5194/acp-16-4785-2016, 2016.
Mercado, L. M., Bellouin, N., Sitch, S., Boucher, O., Huntingford, C., Wild, M., and Cox. P. M.: Impact of changes in diffuse radiation on the global land carbon sink, Nature, 458, 1014–1017, https://doi.org/10.1038/nature07949, 2009.
Myneni, R. B., Wenze Y., Nemani, R. R., Huete, A. R., Dickinson, R. E., Knyazikhin, Y., Didan, K., Fu, R., Juárez, R. I. N., Saatchi, S. S., Hashimoto, H., Ichii, K.. Shabanov, N. V., Tan, B., Ratana, P., Privette, J. L., Morisette, J. T., Vermote, E. F., Roy, D. P., Wolfe, R. E., Friedl, M. A., Running, S. W., Votava, P., El-Saleous, N., Sadashiva, D., Su, Y., S., and Salomonson, S. V.: Large seasonal changes in leaf area of amazon rainforests, P. Natl. Acad. Sci. USA, 104, 4820–4823, https://doi.org/10.1073/pnas.0611338104, 2007.
Molod, A., Takacs, L., Suarez, M., Bacmeister, J., Song, I.-S., and Eichmann, A.: The GEOS-5 Atmospheric General Circulation Model: Mean Climate and Development from MERRA to Fortuna. Technical Report Series on Global Modeling and Data Assimilation, National Aeronautics and Space Administration (NASA), Goddard Space Flight Center Greenbelt, Maryland, NASA/TM-2012-104606/Vol 28, available at: http://gmao.gsfc.nasa.gov/pubs/docs/Molod484.pdf (last access: 15 September 2021), 2012.
Molod, A., Takacs, L., Suarez, M., and Bacmeister, J.: Development of the GEOS-5 atmospheric general circulation model: evolution from MERRA to MERRA2, Geosci. Model Dev., 8, 1339–1356, https://doi.org/10.5194/gmd-8-1339-2015, 2015.
Moreira, D. S., Longo, K. M., Freitas, S. R., Yamasoe, M. A., Mercado, L. M., Rosário, N. E., Gloor, E., Viana, R. S. M., Miller, J. B., Gatti, L. V., Wiedemann, K. T., Domingues, L. K. G., and Correia, C. C. S.: Modeling the radiative effects of biomass burning aerosols on carbon fluxes in the Amazon region, Atmos. Chem. Phys., 17, 14785–14810, https://doi.org/10.5194/acp-17-14785-2017, 2017.
Murphy, D. M., Froyd, K. D., Bian, H., Brock, C. A., Dibb, J. E., DiGangi, J. P., Diskin, G., Dollner, M., Kupc, A., Scheuer, E. M., Schill, G. P., Weinzierl, B., Williamson, C. J., and Yu, P.: The distribution of sea-salt aerosol in the global troposphere, Atmos. Chem. Phys., 19, 4093–4104, https://doi.org/10.5194/acp-19-4093-2019, 2019.
NASA: AERONET (AErosol RObotic NETwork), available at: (https://aeronet.gsfc.nasa.gov, last access: 15 September 2021.
NASA Langley Research Center: CERES Data Products, ASDC, available at: https://ceres.larc.nasa.gov/data/, last access: 15 September 2021.
Ng, N. L., Herndon, S. C., Trimborn, A., Canagaratna, M. R., Croteau, P. L., Onasch, T. B., Sueper, D., Worsnop, D. R., Zhang, Q., Sun, Y. L. and Jayne, J. T.: An Aerosol Chemical Speciation Monitor (ACSM) for Routine Monitoring of the Composition and Mass Concentrations of Ambient Aerosol, Aerosol Sci. Tech., 45, 780–794, https://doi.org/10.1080/02786826.2011.560211, 2011.
Niyogi, D., Chang, H.-I, Saxena, V. K., Holt, T., Alapaty, K., Booker, F., Chen, F., Davis, K. J.., Holben, B., Matsui, T., Meyers, T., Oechel, W. C., Pielke Sr, R. A., Wells, R., Wilson, K., and Xue, Y.: Direct observations of the effects of aerosol loading on net ecosystem CO2 exchanges over different landscapes, Geophys. Res. Lett., 31, L20506, https://doi.org/10.1029/2004GL020915, 2004.
Oliveira, P. H. F., Artaxo, P., Pires, C., De Lucca, S., Procopio, A., Holben, B., Schafer, J., Cardoso, L. F., Wofsy, S. C., and Rocha, H. R.: The effects of biomass burning aerosols and clouds on the CO2 flux in Amazonia, Tellus B, 59, 338–349, 2007.
Oleson, K. W., Lawrence, D. M., Bonan, G. B., Flanner, M. G., Kluzek, E., Lawrence, P. J., Levis, S., Swenson, S. C., and Thornton, P. E.: Technical description of version 4.0 of the Community Land Model (CLM). NCAR Tech. Note NCAR/TN-478+STR, 257 pp., https://doi.org/10.5065/D6FB50WZ, 2010.
Oleson, K. W., Lawrence, D. M., Bonan, G. B., Drewniak, B., Huang, M., Koven, C. D., Levis, S., Li, F., Riley, W. J., Subin, Z. M., Swenson, S. C., Thornton, P. E., Bozbiyik, A., Fisher, R., Heald, C. L., Kluzek, E., Lamarque, J.-F., Lawrence, P. J., Leung, L. R., Lipscomb, W., Muszala, S., Ricciuto, D. M., Sacks, W., Sun, Y., Tang, J., and Yang, Z.-L.: Technical description of version 4.5 of the Community Land Model (CLM), NCAR Tech. Note NCAR/TN-503+STR, National Center for Atmospheric Research, Boulder, Colorado, 420 pp., 2013.
O'Sullivan, M., Rap, A., Reddington, C. L., Spracklen, D. V., Gloor, M., and Buermann, W.: Small global effect on terrestrial net primary production due to increased fossil fuel aerosol emissions from East Asia since the turn of the century, Geophys. Res. Lett., 16, 8060–8067, https://doi.org/10.1002/2016GL068965, 2016.
Pedruzo-Bagazgoitia, X., Ouwersloot, H. G., Sikma, M., vanHeerwaarden, C. C., Jacobs, C. M., and Vilà-Guerau deArellano, J.: Direct and Diffuse Radiation in the Shal-low Cumulus–Vegetation System: Enhanced and Decreased Evapotranspiration Regimes, J. Hydrometeorol., 18, 1731–1748, https://doi.org/10.1175/JHM-D-16-0279.1, 2017.
Rap, A., Spracklen, D. V., Mercado, L., Reddington, C. L., Haywood, J. M., Ellis, R. J., Phillips, O. L., Artaxo, P., Bonal, D., Restrepo Coupe, N., and Butt, N.: Fires increase amazon forest productivity through increases in diffuse radiation, Geophys. Res. Lett., 42, 4654–4662, https://doi.org/10.1002/2015GL063719, 2015.
Rap, A, Scott, C, Reddington, C, Mercado, L, Ellis, R, Garraway, S, Evans, M, Beerling, D, MacKenzie, A. R., Hewitt, C. N., and Spracklen, D. V.: Enhanced global primary production by biogenic aerosol via diffuse radiation fertilisation, Nat. Geosci., 11, 640–644, https://doi.org/10.1038/s41561-018-0208-3, 2018.
Randles, C. A., Kinne, S., Myhre, G., Schulz, M., Stier, P., Fischer, J., Doppler, L., Highwood, E., Ryder, C., Harris, B., Huttunen, J., Ma, Y., Pinker, R. T., Mayer, B., Neubauer, D., Hitzenberger, R., Oreopoulos, L., Lee, D., Pitari, G., Di Genova, G., Quaas, J., Rose, F. G., Kato, S., Rumbold, S. T., Vardavas, I., Hatzianastassiou, N., Matsoukas, C., Yu, H., Zhang, F., Zhang, H., and Lu, P.: Intercomparison of shortwave radiative transfer schemes in global aerosol modeling: results from the AeroCom Radiative Transfer Experiment, Atmos. Chem. Phys., 13, 2347–2379, https://doi.org/10.5194/acp-13-2347-2013, 2013.
Rienecker, M. M., Suarez, M. J., Gelaro, R., Todling, R., Bacmeister, J., Liu, E., Bosilovich, M. G., Schubert, S. D., Takacs, L., Kim, G.-K., Bloom, S., Chen, J., Collins, D., Conaty, A., da Silva, A., Gu, Joiner, W., J., Koster, R. D., Lucchesi, R., Molod, A., Owens, T., Pawson, S., Pegion, P., Redder, C. R., Reichle, R., Robertson, F. R., Ruddick, A. G., Sienkiewicz, M., and Woollen, J.: MERRA – NASA's Modern-Era Retrospective Analysis for Research and Applications, J. Climate, 24, 3624–3648, https://doi.org/10.1175/JCLI-D-11-00015.1, 2011.
Roderick, M. L., Farquhar, G. D., Berry, S. L., and Noble, I. R.: On the direct effect of clouds and atmospheric particles on the productivity and structure of vegetation, Oecologia, 129, 21–30, 2001.
Saatchi, S., Asefi-Najafabady, S., Malhi, Y., Aragão, L. E. O. C., Anderson, L. O., Myneni, R. B., and Nemani, R.: Persistent effects of a severe drought on Amazonian forest canopy, P. Natl. Acad. Sci. USA, 110, 565–570, https://doi.org/10.1073/pnas.1204651110, 2013.
Schmidt, G. A., Kelley, M., Nazarenko, L., Ruedy, R., Russell, G. L., Aleinov, I., Bauer, M., Bauer, S. E., Bhat, M. K., Bleck, R., Canuto, V., Chen, Y.-H., Cheng, Y., Clune, T. L., Del Genio, A., de Fainchtein, R., Faluvegi, G., Hansen, J. E., Healy, R. J., Kiang, N. Y., Koch, D., Lacis, A. A., LeGrande, A. N., Lerner, J., Lo, K. K., Matthews, E. E., Menon, S., Miller, R. L., Oinas, V., Oloso, A. O., Perlwitz, J. P., Puma, M. J., Putman, W. M., Rind, D., Romanou, A., Sato, M., Shindell, D. T., Sun, S., Syed, R. A., Tausnev, N., Tsigaridis, K., Unger, N., Voulgarakis, A., Yao, M.-S., and Zhang, J.: Configuration and assessment of the GISS ModelE2 contributions to the CMIP5 archive, J. Adv. Model. Earth Sy., 6, 141–184, https://doi.org/10.1002/2013ms000265, 2014.
Shilling, J. E., Pekour, M. S., Fortner, E. C., Artaxo, P., de Sá, S., Hubbe, J. M., Longo, K. M., Machado, L. A. T., Martin, S. T., Springston, S. R., Tomlinson, J., and Wang, J.: Aircraft observations of the chemical composition and aging of aerosol in the Manaus urban plume during GoAmazon 2014/5, Atmos. Chem. Phys., 18, 10773–10797, https://doi.org/10.5194/acp-18-10773-2018, 2018.
Sporre, M. K., Blichner, S. M., Karset, I. H. H., Makkonen, R., and Berntsen, T. K.: BVOC–aerosol–climate feedbacks investigated using NorESM, Atmos. Chem. Phys., 19, 4763–4782, https://doi.org/10.5194/acp-19-4763-2019, 2019.
Strada, S. and Unger, N.: Potential sensitivity of photosynthesis and isoprene emission to direct radiative effects of atmospheric aerosol pollution, Atmos. Chem. Phys., 16, 4213–4234, https://doi.org/10.5194/acp-16-4213-2016, 2016.
Thornton, P. E. and Zimmermann, N. E.: An improved canopy integration scheme for a land surface model with prognostic canopy structure, J. Climate, 20, 3902–3923, https://doi.org/10.1175/JCLI4222.1, 2007.
Unger, N., Yue, X., and Harper, K. L.: Aerosol climate change effects on land ecosystem services, Faraday Discuss., 200, 121–142, https://doi.org/10.1039/c7fd00033b, 2017.
Wang, X., Wu, J., Chen, M., Xu, X., Wang, Z., Wang, B., Wang, C., Piao, S., Lin, W., and Miao, G.: Field evidences for the positive effects of aerosols on tree growth, Glob. Change Biol., 24, 4983– 4992, https://doi.org/10.1111/gcb.14339, 2018.
Wild, O., Zhu, X., and Prather, M.: Fast-J: Accurate simulation of in- and below-cloud photolysis in tropospheric chemical models, J. Atmos. Chem. 37, 245–282, 2000.
Xi, X. and Sokolik, I. N.: Impact of Asian dust aerosol and surface albedo on photosynthetically active radiation and surface radiative balance in dryland ecosystems, Adv. Meteorol., 2012, Article ID 276207, https://doi.org/10.1155/2012/276207, 2012.
Yan, X., Shi, W. Z., Zhao, W. J., and Luo, N.: Impact of aerosols and atmospheric particles on plant leaf proteins, Atmos. Environ., 88, 115–122, https://doi.org/10.1016/j.atmosenv.2014.01.044, 2014.
Zhou, Y., Wu, X., Ju, W., Zhang, L., Chen, Z., He, W., Liu, Y., Shen, Y.: Modeling the Effects of Global and Diffuse Radiation on Terrestrial Gross Primary Productivity in China Based on a Two-Leaf Light Use Efficiency Model, Remote Sens. 12, 3355; https://doi.org/10.3390/rs12203355, 2020.