the Creative Commons Attribution 4.0 License.
the Creative Commons Attribution 4.0 License.
 | 23 Sep 2021
Total organic carbon and the contribution from speciated organics in cloud water: airborne data analysis from the CAMP2Ex field campaign
Ewan Crosbie
Paola Angela Bañaga
Grace Betito
Rachel A. Braun
Zenn Marie Cainglet
Maria Obiminda Cambaliza
Melliza Templonuevo Cruz
Julie Mae Dado
Miguel Ricardo A. Hilario
Gabrielle Frances Leung
Alexander B. MacDonald
Angela Monina Magnaye
Jeffrey Reid
Claire Robinson
Michael A. Shook
James Bernard Simpas
Shane Marie Visaga
Edward Winstead
Luke Ziemba
Armin Sorooshian
This work focuses on total organic carbon (TOC) and contributing species in cloud water over Southeast Asia using a rare airborne dataset collected during NASA's Cloud, Aerosol and Monsoon Processes Philippines Experiment (CAMP2Ex), in which a wide variety of maritime clouds were studied, including cumulus congestus, altocumulus, altostratus, and cumulus. Knowledge of TOC masses and their contributing species is needed for improved modeling of cloud processing of organics and to understand how aerosols and gases impact and are impacted by clouds. This work relies on 159 samples collected with an axial cyclone cloud-water collector at altitudes of 0.2–6.8 km that had sufficient volume for both TOC and speciated organic composition analysis. Species included monocarboxylic acids (glycolate, acetate, formate, and pyruvate), dicarboxylic acids (glutarate, adipate, succinate, maleate, and oxalate), methanesulfonic acid (MSA), and dimethylamine (DMA). TOC values range between 0.018 and 13.66 ppm C with a mean of 0.902 ppm C. The highest TOC values are observed below 2 km with a general reduction aloft. An exception is samples impacted by biomass burning for which TOC remains enhanced at altitudes as high as 6.5 km (7.048 ppm C). Estimated total organic matter derived from TOC contributes a mean of 30.7 % to total measured mass (inorganics + organics). Speciated organics contribute (on a carbon mass basis) an average of 30.0 % to TOC in the study region and account for an average of 10.3 % to total measured mass.
The order of the average contribution of species to TOC, in decreasing contribution of carbon mass, is as follows (±1 standard deviation): acetate (14.7 ± 20.5 %), formate (5.4 ± 9.3 %), oxalate (2.8 ± 4.3 %), DMA (1.7 ± 6.3 %), succinate (1.6 ± 2.4 %), pyruvate (1.3 ± 4.5 %), glycolate (1.3 ± 3.7 %), adipate (1.0 ± 3.6 %), MSA (0.1 ± 0.1 %), glutarate (0.1 ± 0.2 %), and maleate (< 0.1 ± 0.1 %). Approximately 70 % of TOC remains unaccounted for, highlighting the complex nature of organics in the study region; in samples collected in biomass burning plumes, up to 95.6 % of TOC mass is unaccounted for based on the species detected. Consistent with other regions, monocarboxylic acids dominate the speciated organic mass (∼ 75 %) and are about 4 times more abundant than dicarboxylic acids.
Samples are categorized into four cases based on back-trajectory history, revealing source-independent similarity between the bulk contributions of monocarboxylic and dicarboxylic acids to TOC (16.03 %–23.66 % and 3.70 %–8.75 %, respectively). Furthermore, acetate, formate, succinate, glutarate, pyruvate, oxalate, and MSA are especially enhanced during biomass burning periods, which is attributed to peat emissions transported from Sumatra and Borneo. Lastly, dust (Ca2+) and sea salt () tracers exhibit strong correlations with speciated organics, supporting how coarse aerosol surfaces interact with these water-soluble organics.
- Article
(1317 KB) - Full-text XML
-
Supplement
(263 KB) - BibTeX
- EndNote


The last 2 decades have witnessed an acceleration in research to unravel the nature of the organic fraction of airborne particles, including speciation (Hallquist et al., 2009; Kanakidou et al., 2005), with implications for how particles impact air quality, public health, and the planet's energy balance. However, there has been much less progress on organic research into cloud droplets, owing largely to the inaccessibility of clouds compared with particles that can be measured more easily near the surface. Analyzing organic matter in cloud water will lead to a better understanding of secondary aerosol formation and the nature of cloud condensation nuclei (CCN) that form droplets. The interaction of aerosol particles and clouds constitutes the largest uncertainty in estimating total anthropogenic radiative forcing (IPCC, 2013), which motivates the use of cloud composition as a tool to learn about these processes (MacDonald et al., 2020). Characterizing cloud water composition is insightful for atmospheric chemical processes such as the removal of gases that would otherwise participate in gas-phase reactions and for aqueous reactions that yield products without an efficient gas-phase source (e.g., dicarboxylic acids) (Ervens et al., 2013). While modeling of sulfate production in clouds is fairly mature (Barth et al., 2000; Faloona, 2009; Kreidenweis et al., 2003; Liu et al., 2021), the formation and evolution of organics in cloud water is much more poorly constrained (Ervens, 2015).
Advancing this research requires in situ measurements of cloud water composition. Among the most common methods of characterizing the organic fraction of cloud water samples is total organic carbon (TOC) analysis. Irrespective of whether studies have been focused on cloud water or fog water, most work has shown the following: (i) TOC is enhanced in air masses with higher anthropogenic influence (Collett et al., 1998; Deguillaume et al., 2014; Herckes et al., 2013; Raja et al., 2009); (ii) ∼ 40 %–85 % of TOC is attributed to unidentified species (Benedict et al., 2012; Boris et al., 2016, 2018; Herckes et al., 2002; Raja et al., 2008); (iii) organic acids usually account for 15 % of TOC (Deguillaume et al., 2014; Gioda et al., 2011; Straub et al., 2007); (iv) monocarboxylic acids are more abundant than dicarboxylic acids (Löflund et al., 2002); and (v) acetic and formic acids are the most dominant organic acids contributing to TOC (Collett et al., 2008; Gioda et al., 2011). Most of the aforementioned studies focused on fog, motivating a closer look at cloud water, as solute concentrations depend on the type of aqueous medium (Fig. 1). More specifically, TOC concentrations are reported to be higher in fog water relative to rain water (Kim et al., 2020), whereas cloud water solute concentrations exceed those in rain water (Decesari et al., 2005; Gioda et al., 2008).
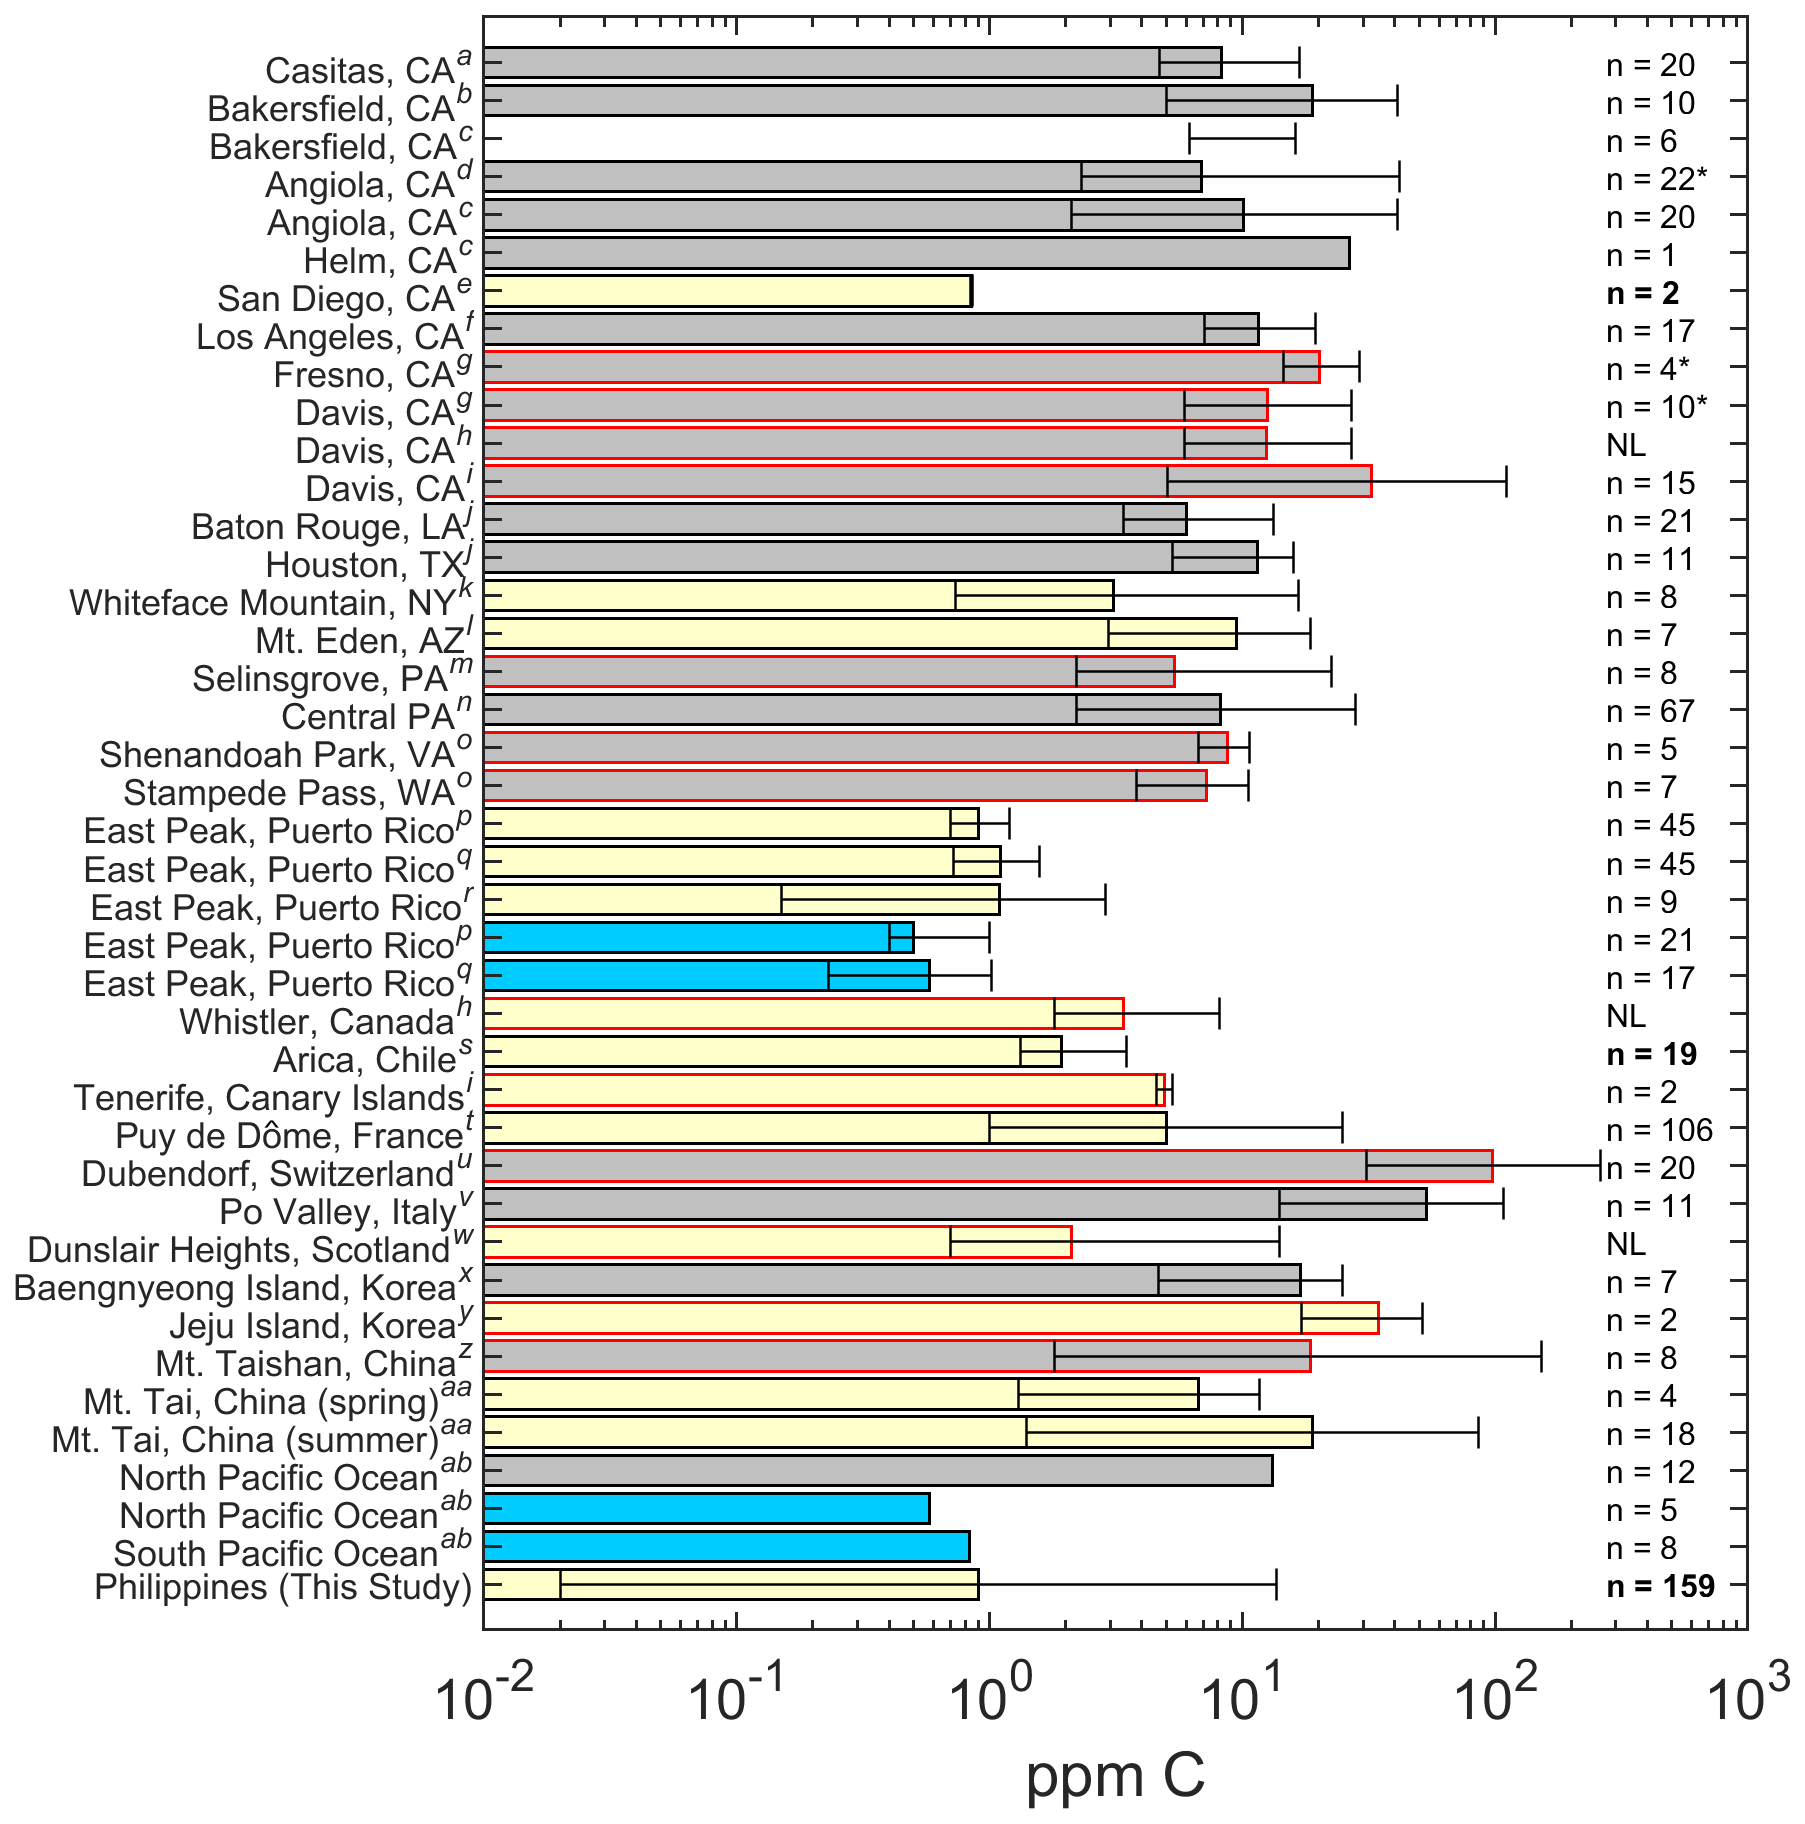
Figure 1TOC (or dissolved organic carbon, DOC, if TOC values were unavailable) concentrations reported for past studies in relation to this work organized by continent. Bars represent the average values, and the error bars represent the minimum and maximum values. The absence of a solid bar means that no average was available. No error bars means that there was no range given, and “*” indicates that the median value was reported rather than an average. Gray, yellow, and blue bars represent studies looking at fog, clouds, and rain, respectively. Bars that are outlined in black are studies that used TOC, and bars outlined in red are studies that used DOC. The n values represent the number of samples used in the study, and NL means that the number of samples was not listed. Bolded n values denote airborne samples. This figure is similar to Fig. 2 in Herckes et al. (2013) with additional information presented and organized by continent. The superscript letters used in the figure denote the following: a – Boris et al. (2018), b – Collett et al. (1998), c – Herckes et al. (2002), d – Herckes et al. (2007), e – Straub et al. (2007), f – Erel et al. (1993), g – Ehrenhauser et al. (2012), h – Ervens et al. (2013), i – Zhang and Anastasio (2001), j – Raja et al. (2008), k – Cook et al. (2017), l – Hutchings et al. (2008), m – Straub et al. (2012), n – Straub (2017), o – Anastasio et al. (1994), p – Gioda et al. (2011), q – Gioda et al. (2008), r – Reyes-Rodríguez et al. (2009), s – Benedict et al. (2012), t – Deguillaume et al. (2014), u – Capel et al. (1990), v – Gelencser et al. (2000), w – Hadi et al. (1995), x – Boris et al. (2016), y – Decesari et al. (2005), z – Wang et al. (2011), aa – Shen (2011), and ab – Kim et al. (2020).
Southeast Asia is an ideal laboratory to investigate the nature of TOC and its constituents, as it is impacted by a multitude of emission sources in an environment with persistent cloud cover from a variety of cloud types (e.g., shallow cumulus and cumulus congestus clouds) (Reid et al., 2013). The complex meteorology of the region makes it very difficult to model (Wang et al., 2013; Xian et al., 2013) but also simultaneously provides a remarkable opportunity to learn more about how aerosols impact (and are impacted by) tropical cloud systems. A knowledge gap exists, as there have been no studies of cloud composition in this region based on airborne measurements. Analysis of fog water at Baengnyeong Island in the eastern Yellow Sea revealed that organic acids accounted for 36 %–69 % of TOC (Boris et al., 2016). The Acid Deposition Monitoring Network in East Asia (https://www.eanet.asia/, last access: 10 August 2021) provides data on wet deposition at surface sites such as at the Manila Observatory (Ma et al., 2021), Metropolitan Manila (Metro Manila), Philippines, and is limited to inorganic ions. Previous studies such as the Seven South East Asian Studies (7SEAS) (Reid et al., 2013) and the Cloud, Aerosol and Monsoon Processes Philippines Experiment (CAMP2Ex) weatHEr and CompoSition Monitoring (CHECSM) were carried out in this region; however, these campaigns were ground- and ship-based, and focused mainly on aerosol particles and not cloud composition (Hilario et al., 2020b; Reid et al., 2015, 2016). Moreover, it should be noted that there have also been a handful of high-elevation studies carried out in Southeast Asia examining fog and cloud water organic acids (i.e., Decesari et al., 2005; Li et al., 2017; Mochizuki et al., 2020).
Recent studies in Metro Manila, Philippines, provide the following results of relevance to this work: (i) a third to a half of the total aerosol particle mass is often unaccounted for after considering water-soluble species (inorganic and organic acid ions and elements) and black carbon (Cruz et al., 2019; Stahl et al., 2020); (ii) organic acids account for less than 1 % of total aerosol mass, with oxalate being the most abundant acid (Stahl et al., 2020); (iii) organic acid concentrations are more enhanced during biomass burning periods (Hilario et al., 2020a), especially succinate and oxalate (Braun et al., 2020; Stahl et al., 2020); and (iv) wet deposition samples clearly show the influence of biomass burning tracer species on cloud composition (Ma et al., 2021). Based on these points, we test two hypotheses: (i) the relative contribution of organic acids to TOC will exceed what was observed in the surface layer over Metro Manila owing to more aged air masses aloft compared with the surface layer in Metro Manila, which is exposed to fresher emissions; and (ii) clouds impacted by biomass burning emissions will exhibit chemical profiles shifted to higher TOC concentrations and with a greater portion of that TOC accounted for by organic acids. To address these hypotheses in addition to characterizing the organic fraction of cloud water, we utilized a rich set of cloud water samples collected around the Philippines during CAMP2Ex between August and October in 2019. The subsequent results and discussion focus on TOC concentrations in addition to the relative contribution and interrelationships between a suite of organic species (organic acids, methanesulfonic acid, and dimethylamine) both spatially and as a function of altitude and air mass source origin. A unique aspect of this dataset is the large sample number with both TOC and speciated organic acid information from an airborne platform.
2.1 Study overview
A total of 159 cloud water samples were collected by the NASA P-3B Orion aircraft across 19 research flights (RF; 23 August–5 October 2019) during CAMP2Ex and were measured for ions, pH, and TOC. Flights were based out of Clark International Airport (15.189∘ N, 120.547∘ E) and extended to regions around the island of Luzon (Fig. 2). Cloud water samples were collected over a wide range of altitudes ranging from 0.2 to 6.8 km.

Figure 2Map of the sample region. The stars represent the midpoint of the cloud water samples where total organic carbon (TOC) was measured, and they are colored by TOC on a logarithmic scale.
2.2 Cloud water collection and handling
Samples were collected using an axial cyclone cloud-water collector (AC3), (Crosbie et al., 2018), which efficiently (> 60 % collection efficiency) collects cloud droplets with diameters > 20 µm. The size dependence of the collection efficiency may influence the measured properties of the bulk cloud water in cases where there is a strong size dependence in the droplet composition. Sample water evaporation was identified to affect low-liquid-water-content environments and may increase aqueous concentrations. For this study, the pipe position was set to position 10, as described in Crosbie et al. (2018), and mounted to the fuselage pylon approximately 300 mm from the skin. The AC3 has a shutter attached to a servo motor, allowing the collector to be closed when not in a cloud to prevent contamination. Samples were collected for between 10 s and 10 min depending on cloud availability and liquid water content (i.e., shorter times possible with higher liquid water content). Cloud water was collected in prewashed 15 mL plastic conical vials. Due to thorough prewashing of the plastic conical vials, leaching of organics into samples was negligible. Additional laboratory tests also indicated that there was no appreciable evidence that organics were adsorbing to the walls of the conical vials. Before each flight, the collector was flushed with ∼ 1 L of ultra-purified Milli-Q water (18.2 MΩ.cm) prior to obtaining two blank samples. Blanks, which were similarly flushed prior to collection, were also collected post-flight. During flight, samples were collected and stored in a cooler containing a sufficient number of ice packs to reduce possible decomposition. After flights, samples were immediately taken to an on-site laboratory where sample volumes were recorded and analyzed for ionic composition, TOC, and pH. A background was subtracted from the samples based on the bottom 10th percentile of all blanks collected during the campaign (both pre- and post-flight). The 10th percentile of the blanks was used instead of the mean, as it is a compromise between removing the influence of background contamination and conserving data points. Excess samples were stored in a refrigerator for future analyses that are outside the scope of this study.
2.3 Cloud water analysis
2.3.1 Ion chromatography
Cloud water was speciated using ion chromatography (IC; Dionex ICS-2100) immediately after each flight to reduce the possibility of sample degradation. Measured anionic species of interest were glycolate, acetate, formate, methanesulfonic acid, pyruvate, glutarate, adipate, succinate, maleate, oxalate, Cl−, NO, Br−, NO, and SO. Measured cations were Na+, NH, K+, dimethylamine (DMA), Mg2+, and Ca2+. A 23 min instrument method with a 2 min equilibration period was used for both anion and cation columns, yielding a 25 min sampling period per sample. The instrument flow rate was 0.4 mL min−1. The anions were measured using a Dionex IonPac AS11-HC 2 mm × 250 mm column, a Dionex AERS 500e suppressor, and potassium hydroxide as the eluent. The cations were measured using a Dionex IonPac CS12A 2 × 250 mm column, a Dionex CERS 500e suppressor, and using methanesulfonic acid (MSA) as the eluent. The instrument methods used for analysis are as follows: (i) for anions, the eluent concentration started at 1 mM, ramped up to 4 mM between 0 and 10 min, ramped up to 6 mM between 10 and 11 min, and finally ramped up to 7 mM between 11 and 23 min using a suppressor current of 8 mA; (ii) for cations, the eluent concentration started at 5 mM and remained isocratic between 0 and 10 min, ramped up to 18 mM between 10 and 12 min, and finally remained isocratic at 18 mM between 12 and 23 min using a suppressor current of 22 mA. The limits of detection (LODs) for these species can be found in Table 1 and were calculated using 3Sab−1, where Sa is the standard deviation of the response, and b is the slope of the calibration curve for that species.
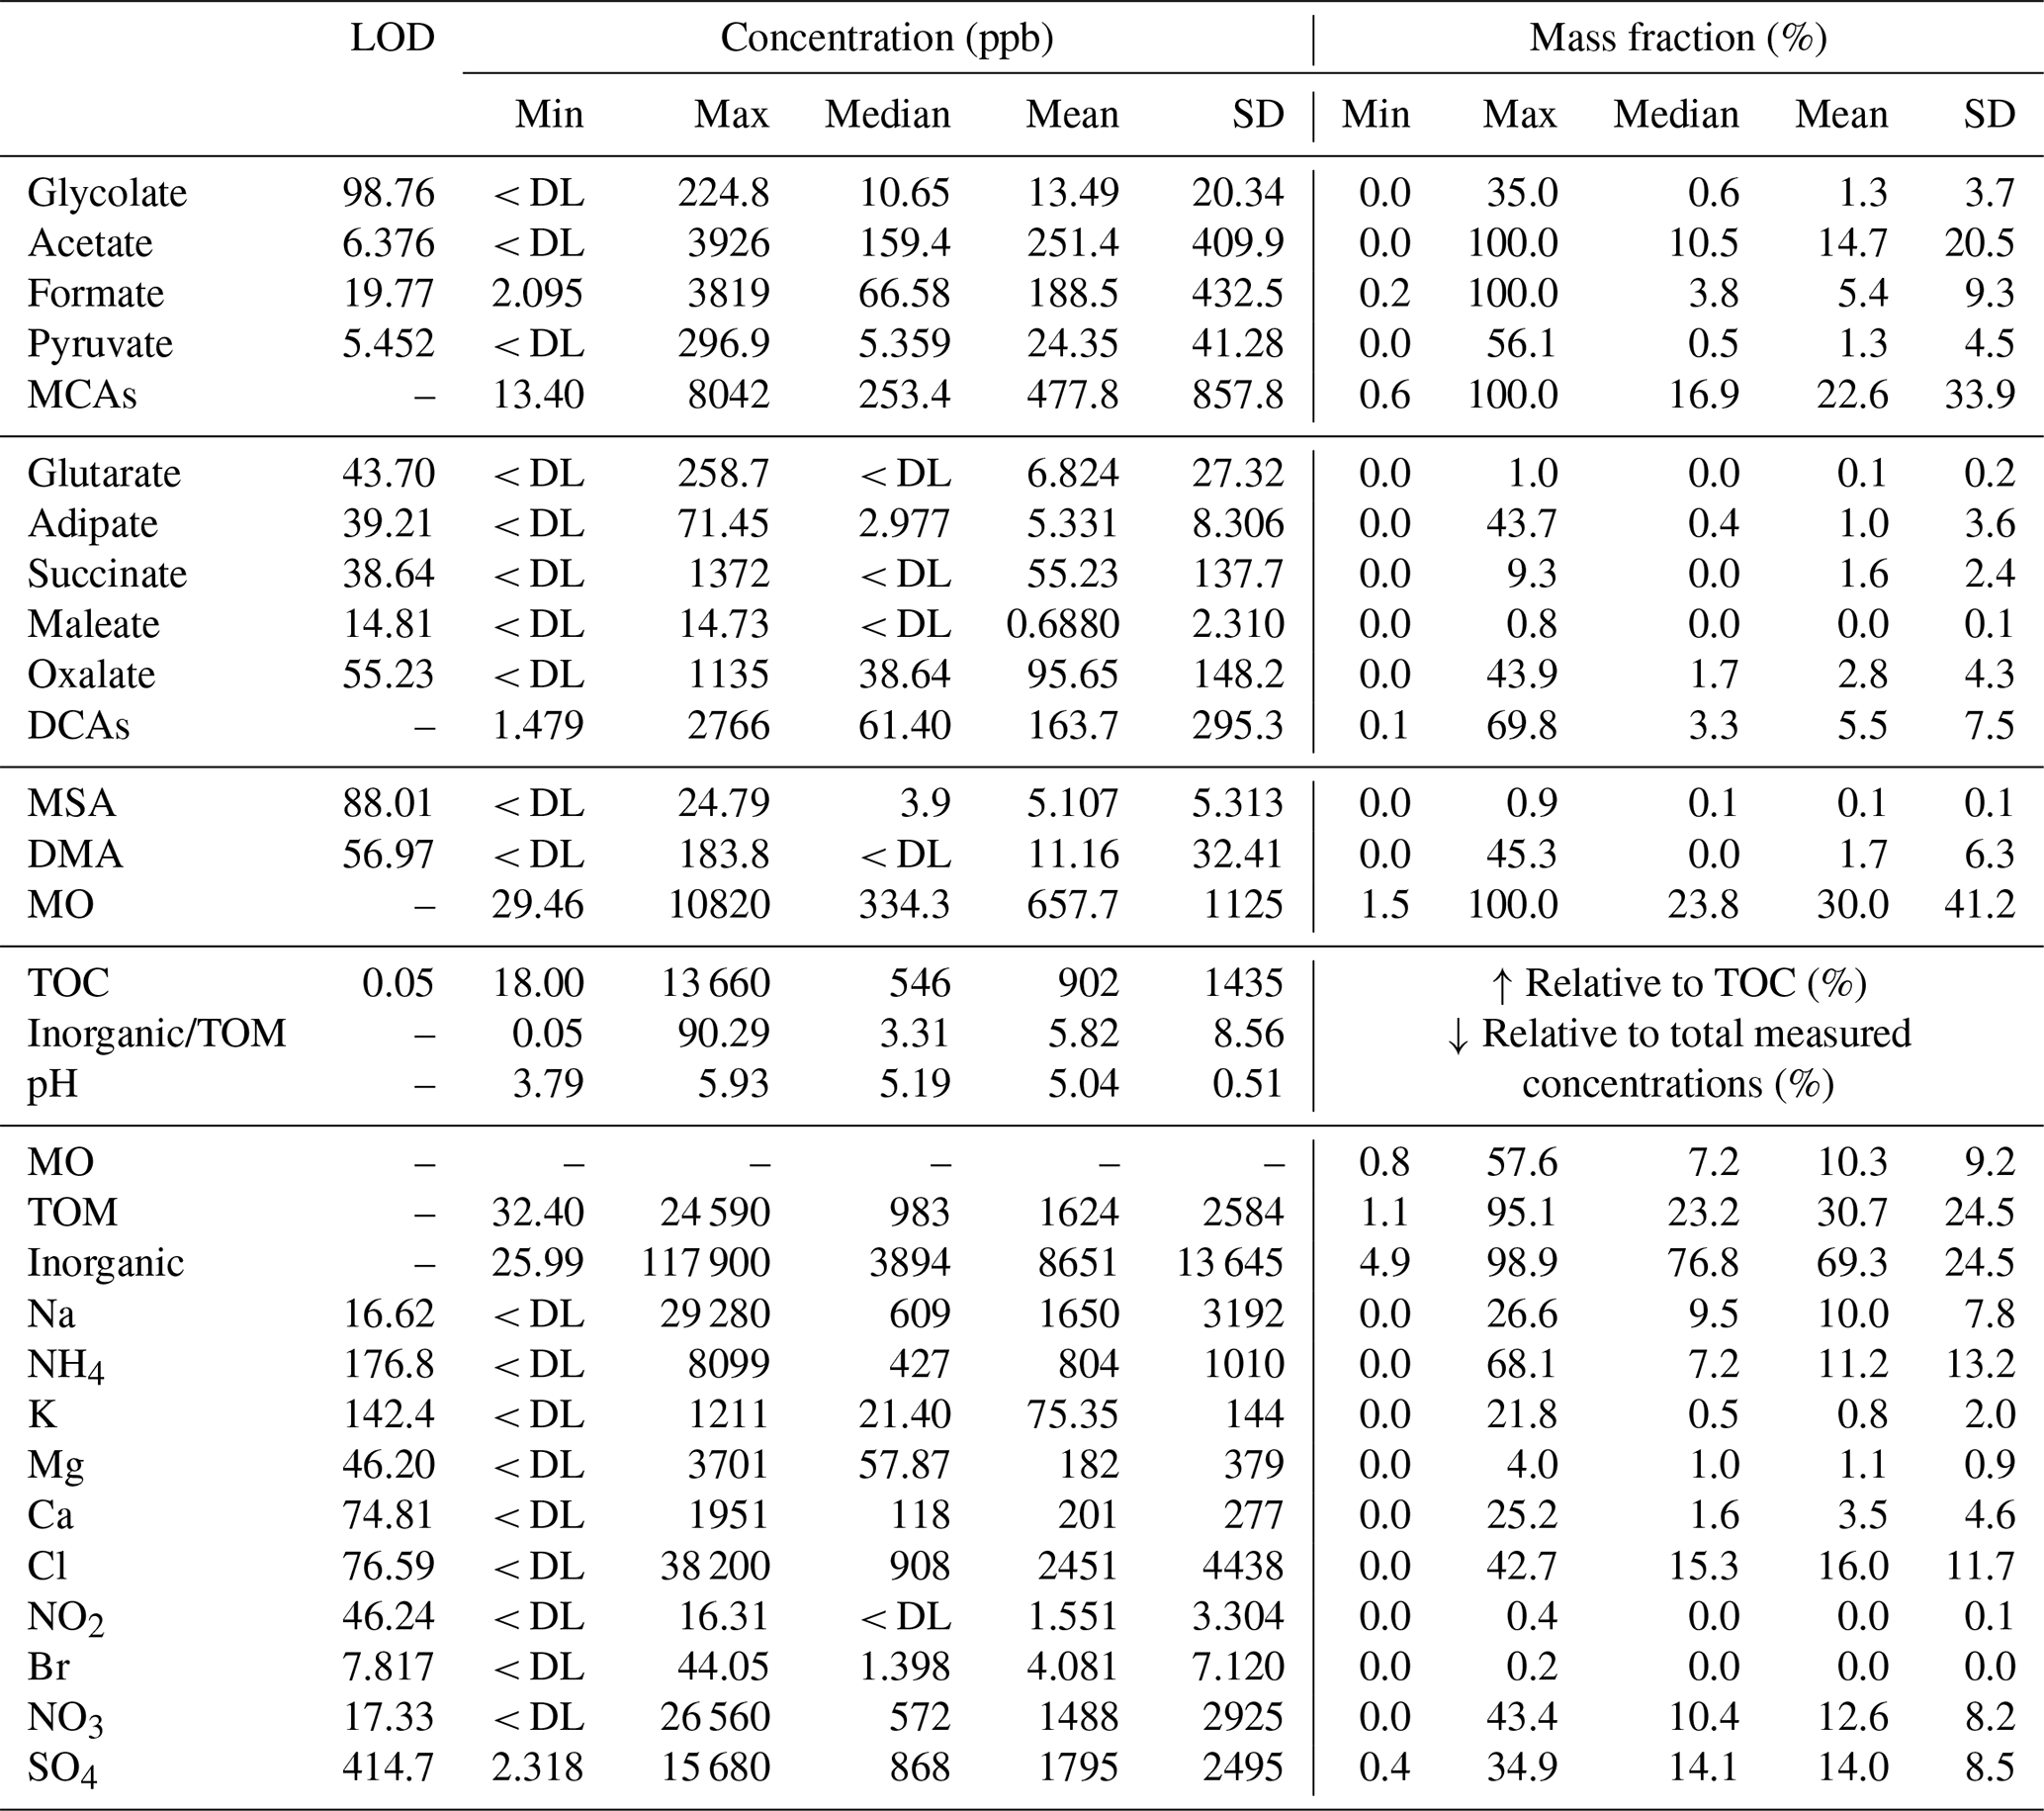
Table 1Mass concentration limits of detection (LODs), minimum, maximum, mean, 1 standard deviation, and median values (ppb; left), in addition to the mass fraction (%; right) for the 159 CAMP2Ex cloud water samples with TOC data; note that mass fraction values depend on the C mass of each organic species shown. Total measured mass is defined as the sum of TOM, Na+, NH, K+, Mg2+, Ca2+, Cl−, NO, Br−, NO, and SO. The abbreviations used in the table are as follows: MCAs – monocarboxylic acids, DCAs – dicarboxylic acids, MSA – methanesulfonic acid, DMA – dimethylamine, MO – measured organics, TOM – total organic matter, and DL – detection limit.
2.3.2 Total organic carbon and pH
Total organic carbon (TOC) was measured using a Sievers 800 Turbo TOC analyzer. Sample aliquots were diluted to obtain the minimum volume needed by the instrument. The TOC analyzer was operated in turbo mode, and TOC values were averaged over a stable concentration period. Milli-Q water was used as an internal reference, and calibrations were performed before and after each batch of samples was analyzed (i.e., one batch approximately every three to four flights) using a range of different concentrations from an oxalate standard solution. A volume of approximately 10 mL was used for each measurement, and Milli-Q water was used intermittently to flush the instrument between each sample.
The pH of the cloud water samples was measured using an Orion Star™ A211 pH meter with an Orion™ 8103BNUWP ROSS Ultra™ pH electrode (precision of 0.01). A two-point calibration (pH = 4 and pH = 7) was performed at the beginning of the analysis of a particular flight's set of samples.
2.3.3 Units
While many studies report concentrations in terms of air-equivalent concentrations, we instead use the native liquid-phase concentrations. Aqueous concentrations of TOC and individual molecular components are reported in units of parts per billion by mass (ppb). TOC concentrations are specific to the mass of carbon atoms only, whereas molecules measured by IC correspond to the specific mass of the species (unless noted otherwise). TOC was converted to total organic matter (TOM) via multiplication by 1.8 (Zhang et al., 2005).
The choice to focus on aqueous-equivalent rather than air-equivalent concentrations was made for various reasons. First, our analysis focuses heavily on relative amounts of species that were unaffected by multiplying native aqueous units by cloud liquid water content. Second, the definition of liquid water content applied by studies can vary widely based on the lower and upper bound of what is considered a droplet. Third, relationships between solute concentrations in cloud water and liquid water content, anticipated from nucleation scavenging, are ineffective when gases like acetic and formic acids absorb directly into droplets rather than having been part of the initial CCN activating into droplets (Khare et al., 1999; Marinoni et al., 2004). Lastly, many studies of cloud water composition that our results can be contrasted with also use liquid units. The primary liquid units reported for cloud water concentrations are parts per million by volume (ppm) and ppb. However, it should be noted that species concentrations in cloud water can be high simply due to the liquid water content being low, or inversely, the concentrations can be low due to being diluted by high liquid water content.
2.4 Aerosol composition
To complement the cloud water composition results, we use aerosol composition results from a high-resolution time-of-flight aerosol mass spectrometer (AMS; Aerodyne, Inc.), which reports non-refractory composition for the submicrometer range (DeCarlo et al., 2006). As summarized by Hilario et al. (2021), the AMS deployed in CAMP2Ex functioned in 1 Hz Fast-MS mode with data averaged to a 30 s time resolution with the lower limit of detection (units of µg m−3) as follows for the measured species: organic (0.169), NH (0.169), SO (0.039), NO (0.035), and Cl− (0.036). Negative mass concentrations were recorded owing to the difference method used with the limits of detection. These negative values were included in the analyses to avoid positive biases but were interpreted as zero concentrations. We also use data specifically for the mass spectral marker representative of acid-like oxygenated organic species ( 44 = COO+) (Aiken et al., 2008) and its mass relative to total organic mass (f44). AMS data were omitted from the analysis if the total mass of all detected species was < 0.5 µg m−3. By convention for airborne sampling, AMS data are reported at standard temperature and pressure (STP; 273 K, 1013 hPa).
AMS data were reported separately for cloud-free and cloudy conditions owing to the use of a counterflow virtual impactor (CVI) inlet (Brechtel Manufacturing Inc.) (Shingler et al., 2012) in clouds to isolate and dry droplets, leaving the residual particles for sampling by the AMS. Cloud-free data involve sampling with a separate inlet designed by the University of Hawaii (McNaughton et al., 2007). For cloud-free AMS results, data were selected 60 s before and after each cloud water sample's start and end time, respectively, when the aircraft was not in cloud. AMS–CVI data were reported for data collected within the period of cloud water collection. It should be noted that cloud-free AMS data are missing for some cloud water samples when the CVI was still in use for the 60 s before and after a sample's start and end time, respectively.
2.5 HYSPLIT
Air mass origination was determined using 5 d back trajectories from the National Oceanic and Atmospheric Administration (NOAA) Hybrid Single Particle Lagrangian Integrated Trajectory (HYSPLIT) model (Rolph et al., 2017; Stein et al., 2015). Trajectories were generated at 1 min temporal resolution with meteorological inputs from the Global Forecast System (GFS) reanalysis with a horizontal resolution of 0.25∘ × 0.25∘ using the “model vertical velocity” method.
2.6 NAAPS
The Navy Aerosol Analysis and Prediction System (NAAPS) global aerosol model was implemented to assist in identifying biomass burning cases (Lynch et al., 2016) (https://www.nrlmry.navy.mil/aerosol/, last access: 10 August 2021). NAAPS relies on global meteorological fields from the Navy Global Environmental Model (NAVGEM) (Hogan and Brody, 1993; Hogan and Rosmond, 1991) that analyzes and forecasts a 1∘ × 1∘ grid with 6 h intervals and 24 vertical levels. In terms of identifying biomass burning cases, surface smoke concentrations were examined.
3.1 Concentration statistics
TOC values ranged from 0.018 to 13.66 ppm C, with median and mean concentrations of 0.546 and 0.902 ppm C, respectively (Table 1). Samples in this study exhibited nearly the lowest mean TOC value of all cloud water studies surveyed in Fig. 1, with the other lowest values being over the Pacific Ocean west of San Diego, California (0.85 ppm C), (Straub et al., 2007) and East Peak, Puerto Rico (0.90 ppm C), (Gioda et al., 2008, 2011; Reyes-Rodríguez et al., 2009). The CAMP2Ex dataset exhibited the lowest minimum TOC value of all shown studies. For context, the highest mean and maximum TOC masses in cloud water studies were 34.5 and 51.7 ppm C, respectively, at Jeju Island, Korea, while the peak dissolved organic carbon (DOC) mass in cloud water was 85.6 ppm C at Mt. Tai, China. For comparisons to published cloud water measurements, DOC and TOC are assumed to be sufficiently similar in nature to directly compare values. Differences in TOC between our study and other work can partly be attributed to the different types of clouds studied in the CAMP2Ex region (e.g., cumulus congestus, cumulus, altocumulus, and altostratus) and the higher collection altitudes being conducive to enhanced liquid water contents and droplet sizes compared with stratocumulus clouds in regions like the northeastern (Straub et al., 2007) and southeastern Pacific Ocean (Benedict et al., 2012). Previous studies have primarily sampled stratocumulus or stratus clouds (Fig. 1). Also, some of our samples may have included rain water, which naturally has lower TOC concentrations than cloud water due to dilution (Fig. 1). To illustrate the importance of this dilution effect, an average of the mean values from the studies listed in Fig. 1 shows the following (ppm C): fog = 17.8, cloud = 6.4, and rain = 0.6. We further note that direct comparisons of our results to others need to account for the fact that water collectors have different transmission efficiency behaviors as a function of droplet size, as well as compositional differences across the droplet size spectrum (i.e., Boris et al., 2016; Collett et al., 2008; Herckes et al., 2013).
The order of species is as follows in terms of decreasing average contribution of C mass relative to total TOC (±1 standard deviation): acetate (14.7 ± 20.5 %), formate (5.4 ± 9.3 %), oxalate (2.8 ± 4.3 %), DMA (1.7 ± 6.3 %), succinate (1.6 ± 2.4 %), pyruvate (1.3 ± 4.5 %), glycolate (1.3 ± 3.7 %), adipate (1.0 ± 3.6 %), MSA (0.1 ± 0.1 %), glutarate (0.1 ± 0.2 %), and maleate (< 0.1 ± 0.1 %). An average of 70.0 % of TOC mass went unaccounted for. The predominant sources and production pathways of these species are briefly explained here. Precursor emission sources for acetate and formate include plants, soil, vehicles, and biomass burning, with key production routes including the oxidation of isoprene, the ozonolysis of olefins, and peroxy radical reactions (Khare et al., 1999, and references therein). Pyruvate is considered the most abundant aqueous reaction product of methylglyoxal, generated by the oxidation of gas-phase anthropogenic volatile organic compounds (Boris et al., 2014; Carlton et al., 2006; Lim et al., 2013; Stefan et al., 1996; Tan et al., 2010). Glycolate has been linked to aqueous processing of acetate and is a precursor of glyoxylate (Boris et al., 2014), which is formed via the oxidation of glycolaldehyde by hydroxide radicals (Thomas et al., 2016). Oxalate is the most abundant dicarboxylic acid across different environments (Cruz et al., 2019; Stahl et al., 2020; Yang et al., 2014; Ziemba et al., 2011) and can be emitted directly by biogenic sources (Kawamura and Kaplan, 1987), combustion exhaust (Kawamura and Kaplan, 1987; Kawamura and Yasui, 2005), and biomass burning (Narukawa et al., 1999; Yang et al., 2014); however, it is also formed through the oxidation and degradation of longer-chain organic acids and acts as a notable tracer for cloud processing (Ervens et al., 2004; Sorooshian et al., 2006). Saturated organics like glutarate, adipate, and succinate are linked to fresh emissions, mainly from the ozonolysis of cyclic alkenes (such as from vehicular emissions), in the study region (Hatakeyama et al., 1985; Stahl et al., 2020). Maleate can be secondarily formed from the photooxidation of benzene (Rogge et al., 1993) or from the primary emissions of combustion engines (Kawamura and Kaplan, 1987). Alkyl amines (i.e., DMA) have numerous sources such as biomass burning, vehicular emissions, industrial activity, animal husbandry, waste treatment, and the ocean (Youn et al., 2015). Finally, MSA is formed via photooxidation reactions involving dimethylsulfide (DMS) from oceanic emissions (Berresheim, 1987; Saltzman et al., 1983) or dimethyl sulfoxide (DMSO) from anthropogenic emissions (Yuan et al., 2004), in addition to being linked to agricultural emissions and biomass burning (Sorooshian et al., 2015).
Measured organic species were further grouped into categories: monocarboxylic acids (MCAs; glycolate, acetate, formate, and pyruvate), dicarboxylic acids (DCAs; glutarate, adipate, succinate, maleate, and oxalate), and measured organics (MO; the sum of MCAs, DCAs, MSA, and DMA). Total MCA concentrations accounted on average for ∼ 75 % of MO and were approximately 4 times larger than those of DCAs. MO values ranged from 29.46 to 10 820 ppb, accounting for an average of 30.0 % (median 23.8 %) of TOC when masses were converted to just the C masses of the measured species (Table 1). Examples of other undetected organics include tricarboxylic acids, aromatics, alcohols, sugars, carbohydrates, and aldehydes. Previous studies reported that undetected species account for ∼ 45 % (Boris et al., 2016) and 82.9 % (Boris et al., 2018) of organics. Interestingly, the ionic charge balance for the 159 samples shows an anion deficit (Fig. S1 in the Supplement), with a slope of 0.95 (i.e., anion charge on y axis). This strong charge balance suggests that detected organic species were balanced by cations detected via IC analysis. Species contributing to the anion deficit likely include a mix of unspeciated organic and inorganic anions.
TOC was converted to total organic matter (TOM) by multiplying it by 1.8 (Zhang et al., 2005), as in other cloud water studies (Boris et al., 2016, 2018), in order to compare it to total measured mass (i.e., the sum of TOM, Na+, NH, K+, Mg2+, Ca2+, Cl−, NO, Br−, NO, and SO). We caution that using a fixed 1.8 conversion value yields uncertainty, as samples were collected in a range of air masses, but 1.8 is a value that is fairly intermediate with respect to those reported in the literature: 1.6 ± 0.2 for urban aerosols (Turpin and Lim, 2001), 2.07 ± 0.05 in nonurban areas (Yao et al., 2016), and values for biomass burning organic aerosols ranging from 1.56 to 2.0 (Aiken et al., 2008; Turpin and Lim, 2001) based on fuel type and combustion conditions (Aiken et al., 2008). Higher values are expected for more oxidized organics. Estimated TOM accounted for a median and mean of 23.2 % and 30.7 % of total measured mass, respectively, with the maximum for a single sample being 95.1 %. The median and mean ratios of MO to TOM were 38.1 % and 46.4 %, respectively. Furthermore, the median and mean ratios of MO to total measured mass were 7.2 % and 10.3 %, respectively, with a maximum of 57.6 %. On average, chloride, sulfate, and nitrate were the most abundant species (≥ 12.6 %), with the median and mean ratio of total inorganic mass to TOM being 3.3 and 5.8, respectively. The pH of the cloud water with TOC measurements ranged from 3.79 to 5.93 and averaged 5.04 ± 0.51. The lowest pH values all occurred over the ocean.
Our calculated percentages of MO relative to total measured mass are in contrast with results from a surface site in Metro Manila (Stahl et al., 2020), where most of the same organic species (adipate, succinate, maleate, oxalate, and MSA) accounted for ∼ 1.3 % of the total aerosol mass, excluding black carbon. Therefore, the first hypothesis of this study – that the contributions of measured organic species account for a greater portion of total measured mass in cloud water compared with surface particulate matter – holds true.
Gravimetry was used to measure total mass in the surface measurements, whereas total measured mass was more restrictive in cloud water in terms of being based on measurable species, thereby qualifying our percentages as an upper bound. However, the measured ions in cloud water should contribute relatively more to total measured mass in cloud water, owing to their hygroscopic nature (e.g., sea salt) and the greater ease with which they become associated with cloud water compared with more hydrophobic species (Chang et al., 2017; Dalirian et al., 2018; Pringle et al., 2010) like black carbon that contribute significantly to total aerosol mass in the boundary layer of Metro Manila (Cruz et al., 2019). For example, black carbon accounted for 78.1 % and 51.8 % of the total mass between 0.10–0.18 and 0.18–0.32 µm in Metro Manila surface aerosol particles (Cruz et al., 2019), respectively, which are size ranges that are highly relevant to droplet activation. Air masses aloft in the CAMP2Ex region, especially those processed by clouds, are likely more aged and oxidized than fresh organic emissions (e.g., automobiles, industry, and burning) in the surface layer over Metro Manila, which is the most populated urban area within the CAMP2Ex flight domain. Recent work has shown that cloud processing of isoprene oxidation products (a key fraction of organic precursor vapors involved with organic aerosol generation) is the main source of secondary organic aerosol (SOA) in the mid-troposphere (4–6 km) (Lamkaddam et al., 2021). This motivates the examination of vertical TOC and organic species characteristics in more detail, which is discussed next.
3.2 Vertical profiles
The vertical profiles of TOC mass were of interest, as they relate to the general vertical distribution of organic matter in the troposphere. Measurements off the coast of Japan approximately 2 decades ago during the ACE-Asia campaign revealed unexpectedly high organic aerosol concentrations in the free troposphere due to presumed SOA formation (Heald et al., 2005). During that campaign, organic aerosol concentrations in the boundary layer and free troposphere, and their relative contribution to total non-refractory aerosol mass (organic, SO, NO, and NH), were amongst the highest of the various global regions examined (Heald et al., 2011). Therefore, it is of interest to examine these types of vertical profiles farther south in the CAMP2Ex region where data are more scarce, with the unique aspect of this work being the focus on cloud water composition.
The highest TOC masses were observed in the bottom 2 km, with a general reduction above that altitude (Fig. 3). The decrease in the TOC concentration with respect to altitude could be attributed to more dilution in larger droplet sizes; the results of cloud microphysical data will be the focus of forthcoming work. Four data points influenced by biomass burning were singled out (red markers Fig. 3a) as they had systematically higher TOC masses than other points. Those points will be discussed in more detail in Sect. 4, and it is noteworthy that clouds were impacted by biomass burning across a wide range of altitudes up to almost 7 km.
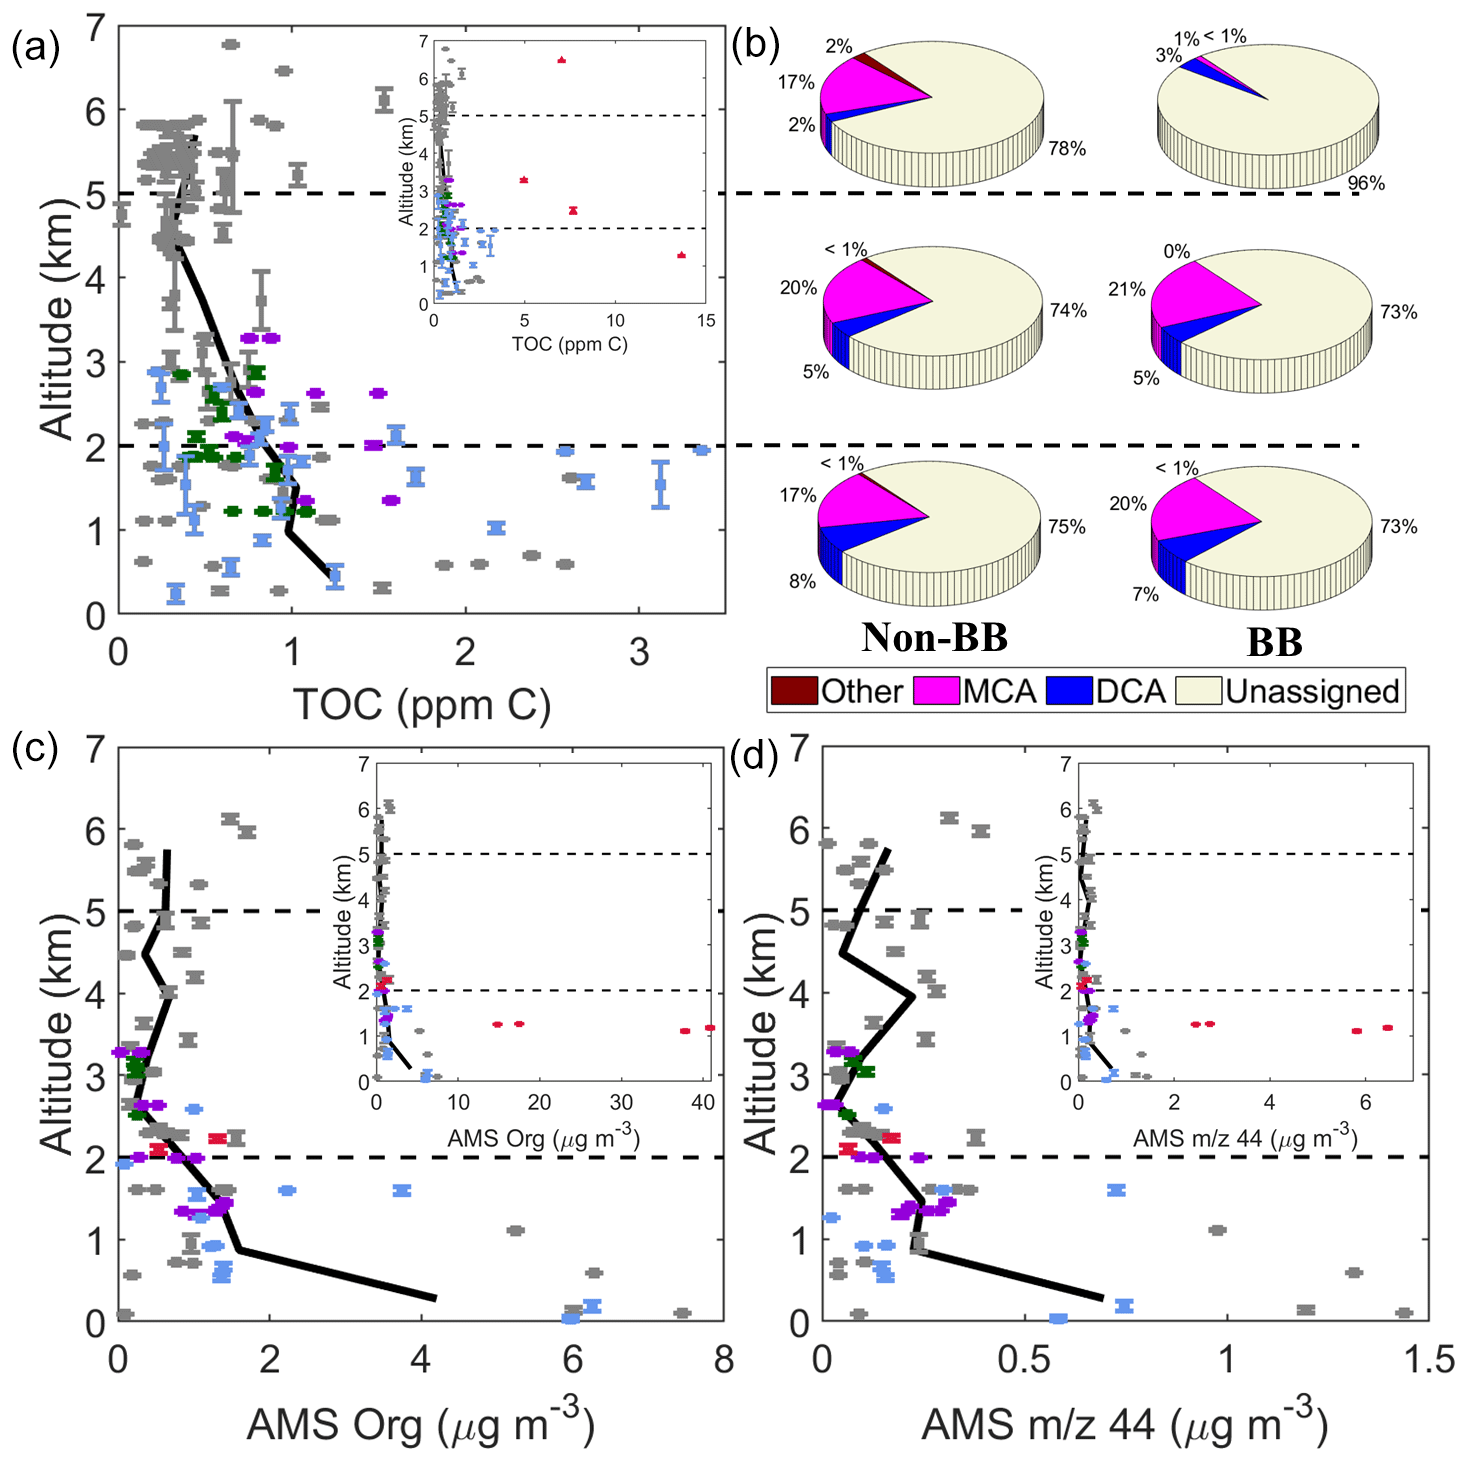
Figure 3(a) Vertical profile of TOC concentrations (n = 159 samples) with the smaller inset including the four samples with enhanced TOC owing to biomass burning (BB) influence. (b) Mass fractions of different subsets of species contributing to TOC at high (> 5 km), mid (2–5 km), and low (< 2 km) altitude, with the beige area representing undetected species. Vertical profile of AMS (c) organic and (d) 44 mass concentrations corresponding to spatially and temporally adjacent cloud-free periods of the collected cloud water samples. Colors in panels (a), (b), and (d) represent the case study points in Sect. 4: North (green), East (purple), Biomass Burning (red), Clark (blue), and non-case points (gray). The solid black lines in panels (a), (b), and (d) represent locally weighted average values. The error bars represent 1 standard deviation of the altitude variance.
Focusing on the non-biomass burning (non-BB) data, there was considerable variation in TOC in the bottom 2 km, with concentrations as low as 0.144 ppm C and as high as 3.362 ppm C. Interestingly, cloud water collected above 5 km still tended to show enhanced TOC masses, reaching up to 1.530 ppm C (6.1 km) among the non-BB points. The composition contributing to TOC was similar with altitude in non-BB and biomass burning (BB) conditions, with ∼ 75 % of TOC mass unaccounted for by the measured species and MCAs dominating the measured organic mass (Fig. 3b). The exception to that was the high-altitude BB point where 95.6 % of TOC was unassigned. Figure 3c–d show that there was some qualitative agreement in the vertical profile of AMS organic and 44 mass concentrations for data collected immediately adjacent to the cloud water samples in cloud-free air; more specifically, the highest concentrations of AMS organic mass, 44 mass, and TOC were in the bottom 2 km. However, some interesting differences exist, as they related to specific air mass types, as will be discussed in Sect. 4. Some differences could be rooted in how AMS data represent submicrometer particles whereas cloud water data encompass a wider range of particle sizes that activated into cloud droplets (including supermicrometer dust and sea salt particles) and also gases partitioning to cloud water.
Vertical profiles of ratios representative of the relative amount of oxidized organics are shown in Fig. 4. The MO : TOC ratio was quite variable with altitude, ranging from 0.16 to 0.32 based on the locally averaged curve shown; individual sample values ranged from 0.01 to 0.92. Vertically resolved ratio values for f44 in cloud-free air and in cloud (downstream CVI) ranged on average from 0 to 0.35 and from 0.13 to 0.35, respectively. While mass concentrations decreased with altitude (Fig. 3), ratios relevant to the degree of organic aerosol oxidation and makeup of the organic component of cloud water did not exhibit a clear change with altitude.
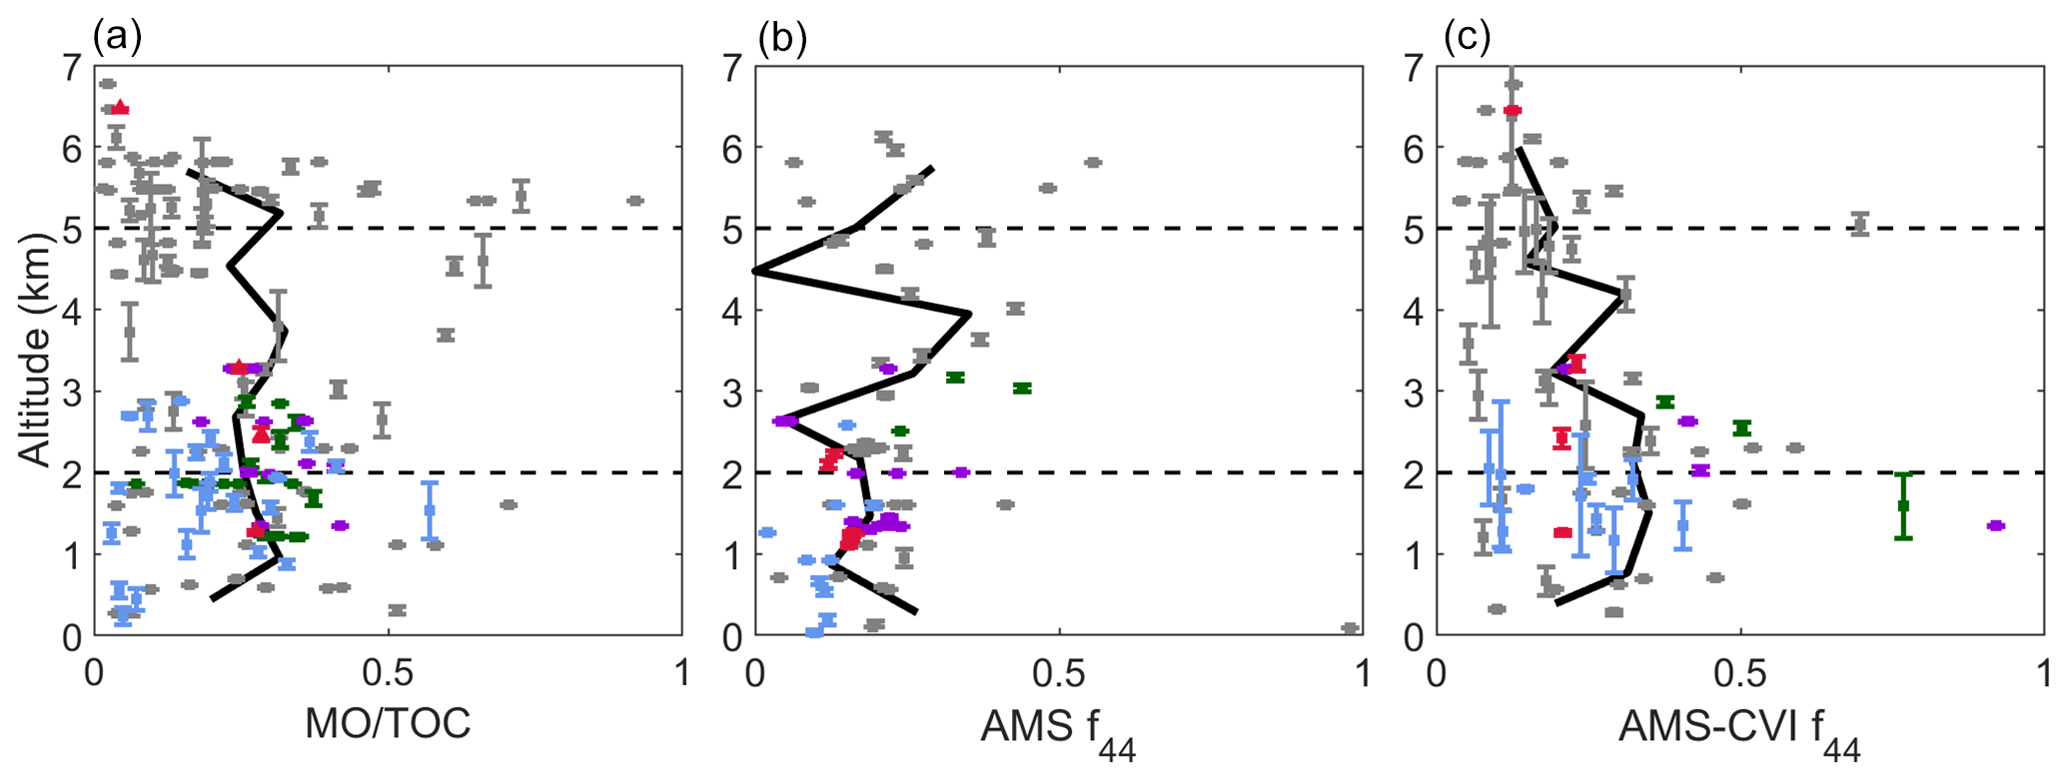
Figure 4Vertical profile of (a) the ratio of C mass from measured organics (MO) to TOC for cloud water samples, (b) AMS f44 in cloud-free air and (c) AMS-CVI f44 in cloudy air. AMS data in panel (b) correspond to cloud-free periods that were spatially and temporally adjacent to the collected cloud water samples, while the data in panel (c) are within the period of cloud water collection times in cloud. Colors in panels (a), (b), and (d) represent the same case study points as in Fig. 3: North (green), East (purple), Biomass Burning (red), Clark (blue), and non-case points (gray). The black lines in panels (a), (b), and (d) represent locally weighted average values.
Four subsets of samples are examined here to probe how the organic nature of cloud water varies for distinct air masses. Sources of the air masses are visually shown in Fig. 5 based on 5 d HYSPLIT back trajectories: (i) “North” (RF11, n=20) collected off the northern coast of Luzon with influence from East Asia, the Korean Peninsula, and Japan; (ii) “East” (RF13, n=11) collected off the eastern coast of Luzon with back trajectories traced to southern China with subsequent passage across Luzon before arriving in the sample collection area; (iii) “Biomass Burning” (RF09, n=4) collected to the southwest of Luzon above the Sulu Sea with influence from biomass burning plumes from Borneo and Sumatra primarily consisting of peat as the fuel type (Field and Shen, 2008; Levine, 1999; Page et al., 2002; Stockwell et al., 2016; Xian et al., 2013); and (iv) “Clark” (RF04, RF06, RF07, RF09, RF10, and RF11, n=25) collected around the operational area over Luzon, approximately ∼ 90 km northwest of Metro Manila, with back trajectories extending to the west and southwest of Luzon.
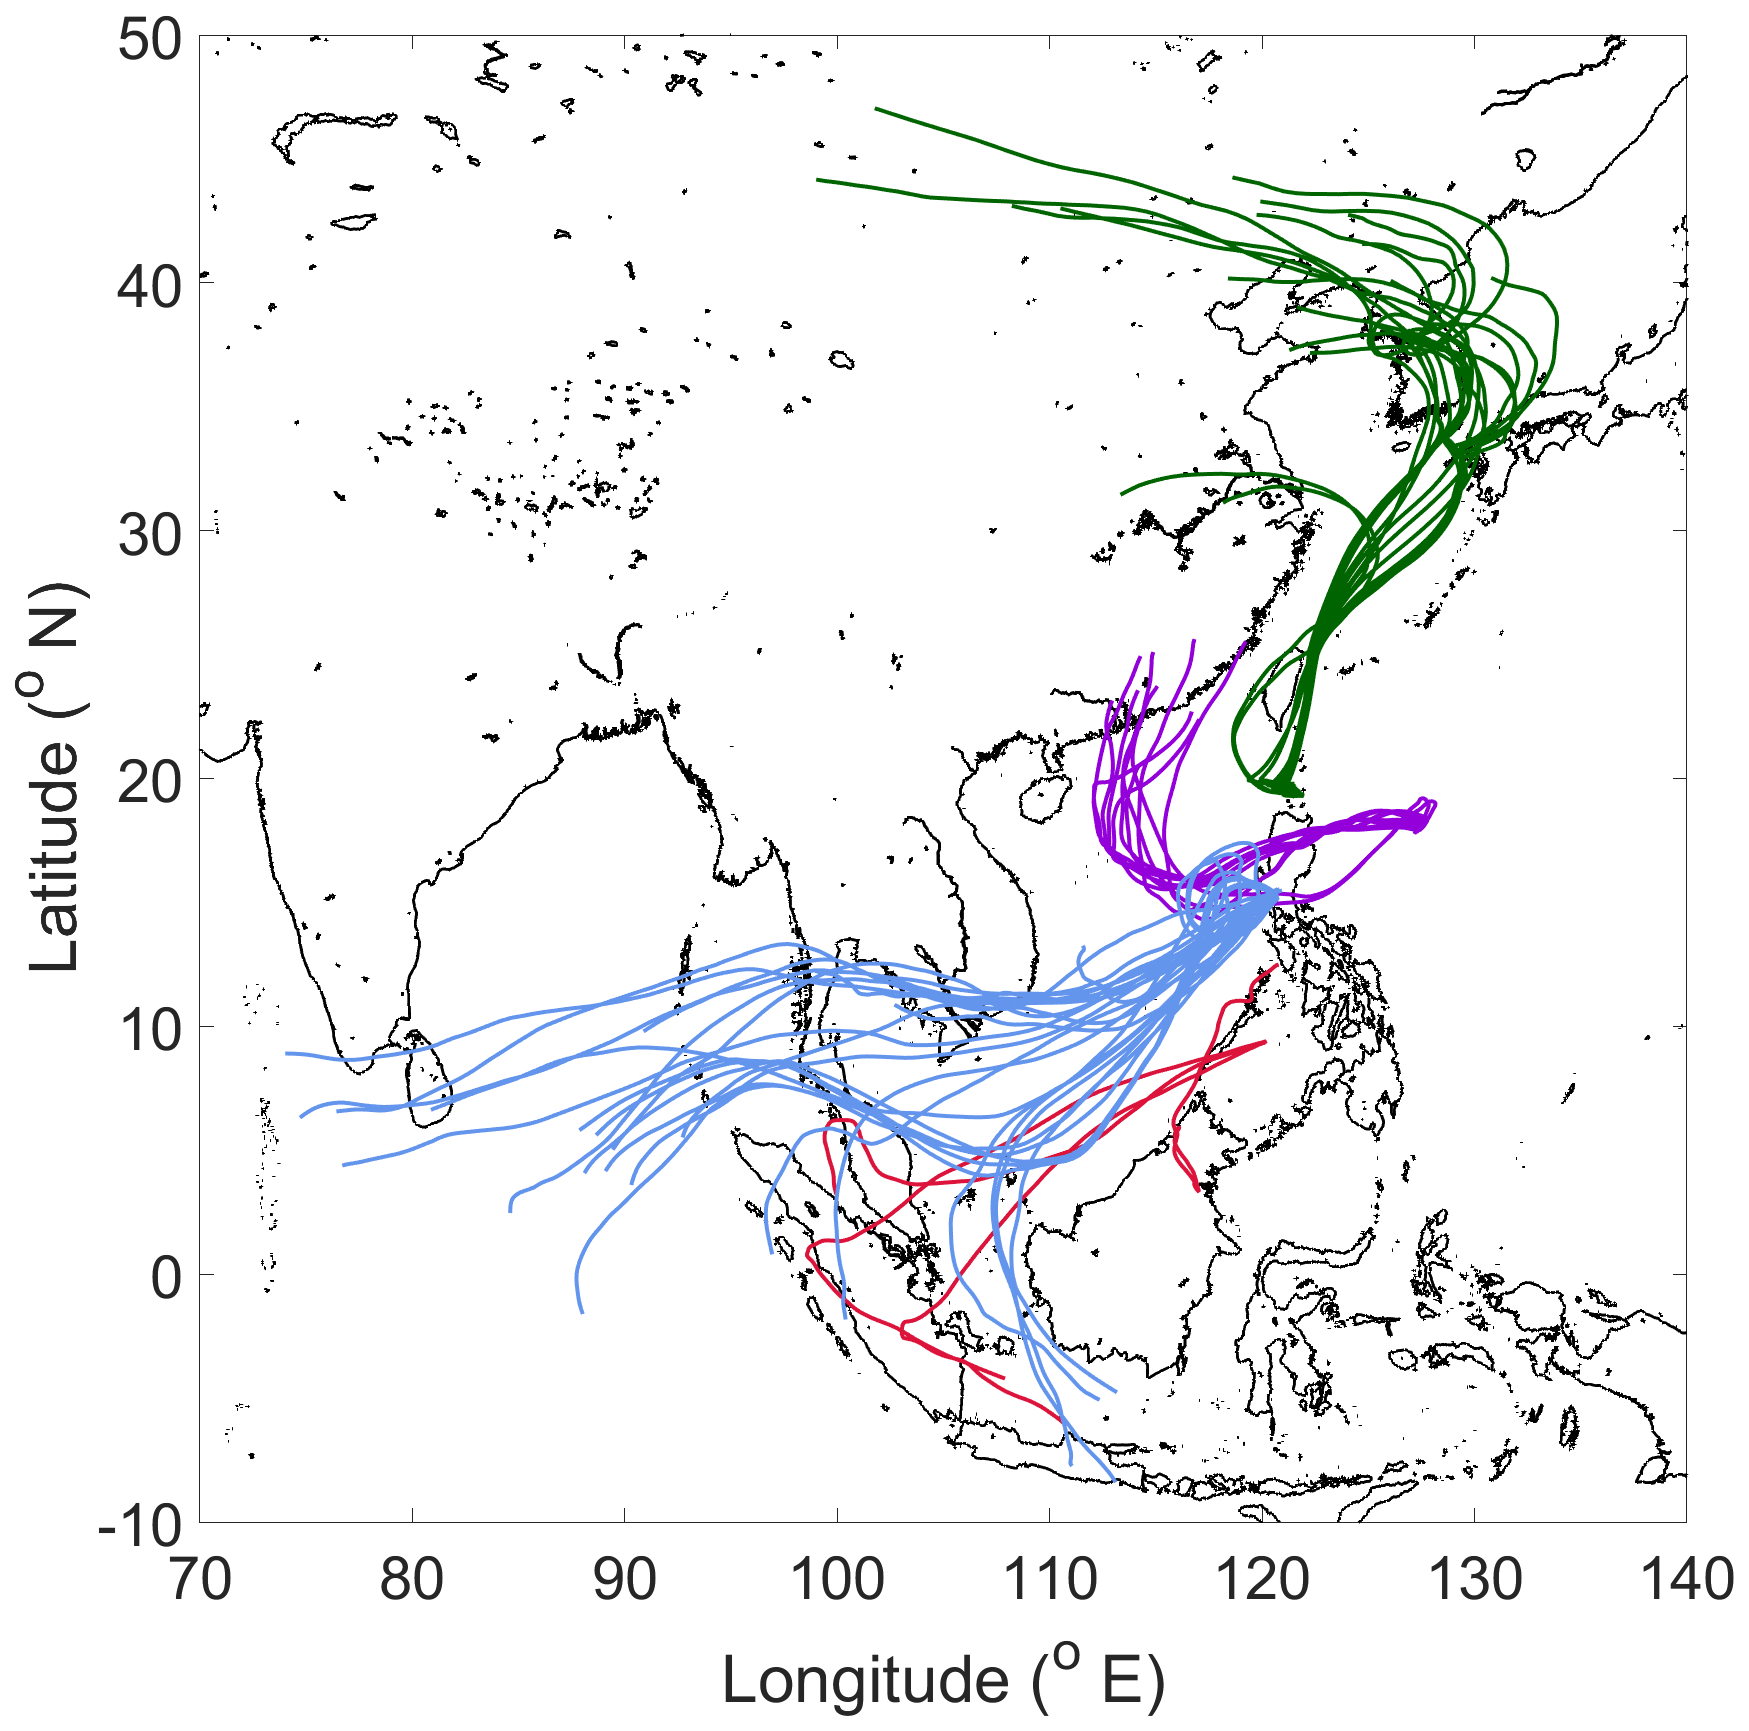
Figure 5Spatial summary of 120 h back trajectories for each sample included in respective case study sample sets: North (green; n = 20), East (purple; n = 11), Biomass Burning (red; n = 4), and Clark (blue; n = 25).
Biomass burning samples were identified based on the following criteria: flight scientist notes, elevated surface smoke concentrations and aerosol optical depth (AOD) from the NAAPS model, and the remarkable enhancement in chemical concentrations in cloud water. TOC, K+, SO, and NH in particular were enhanced in these samples with concentrations exceeding 4 ppm C, 0.13 ppm, 2.3 ppm, and 2.5 ppm, respectively.
The vertical profile results shown previously (Figs. 3, 4) display markers corresponding to these four case studies. With the exception of one BB sample collected at 6.5 km, samples in the four cases were obtained below 3.3 km.
4.1 North
This category of samples was unique in that the mean MO (527.5 ± 301.6 ppb) and TOC (636.1 ± 230.4 ppb C) concentrations were the lowest of all four cases (Table 2). The largest three organic contributors to TOC (±1 standard deviation) were acetate (177.8 ± 72.96 ppb C; 11.5 ± 4.0 %), oxalate (148.7 ± 81.47 ppb C; 6.0 ± 1.3 %), and formate (83.16 ± 79.65 ppb C; 3.0 ± 2.2 %). Maleate and DMA were not detected for this case, and 73.3 % of TOC went unaccounted for. Samples in this category were collected between 1.2 and 2.9 km, without any pronounced organic chemical trends with altitude (Figs. 3, 4).
Table 2Speciated concentrations of organics (ppb) for each case study: the first group of rows is monocarboxylic acids (MCAs); the second group of rows is dicarboxylic acids (DCAs); the third group of rows is other organics, including total measured organics (MO) and total organic carbon (TOC); the fourth group of rows is inorganic ions; and the fifth group is select ratios. n stands for number of samples, Ace denotes acetate, and For represents formate.
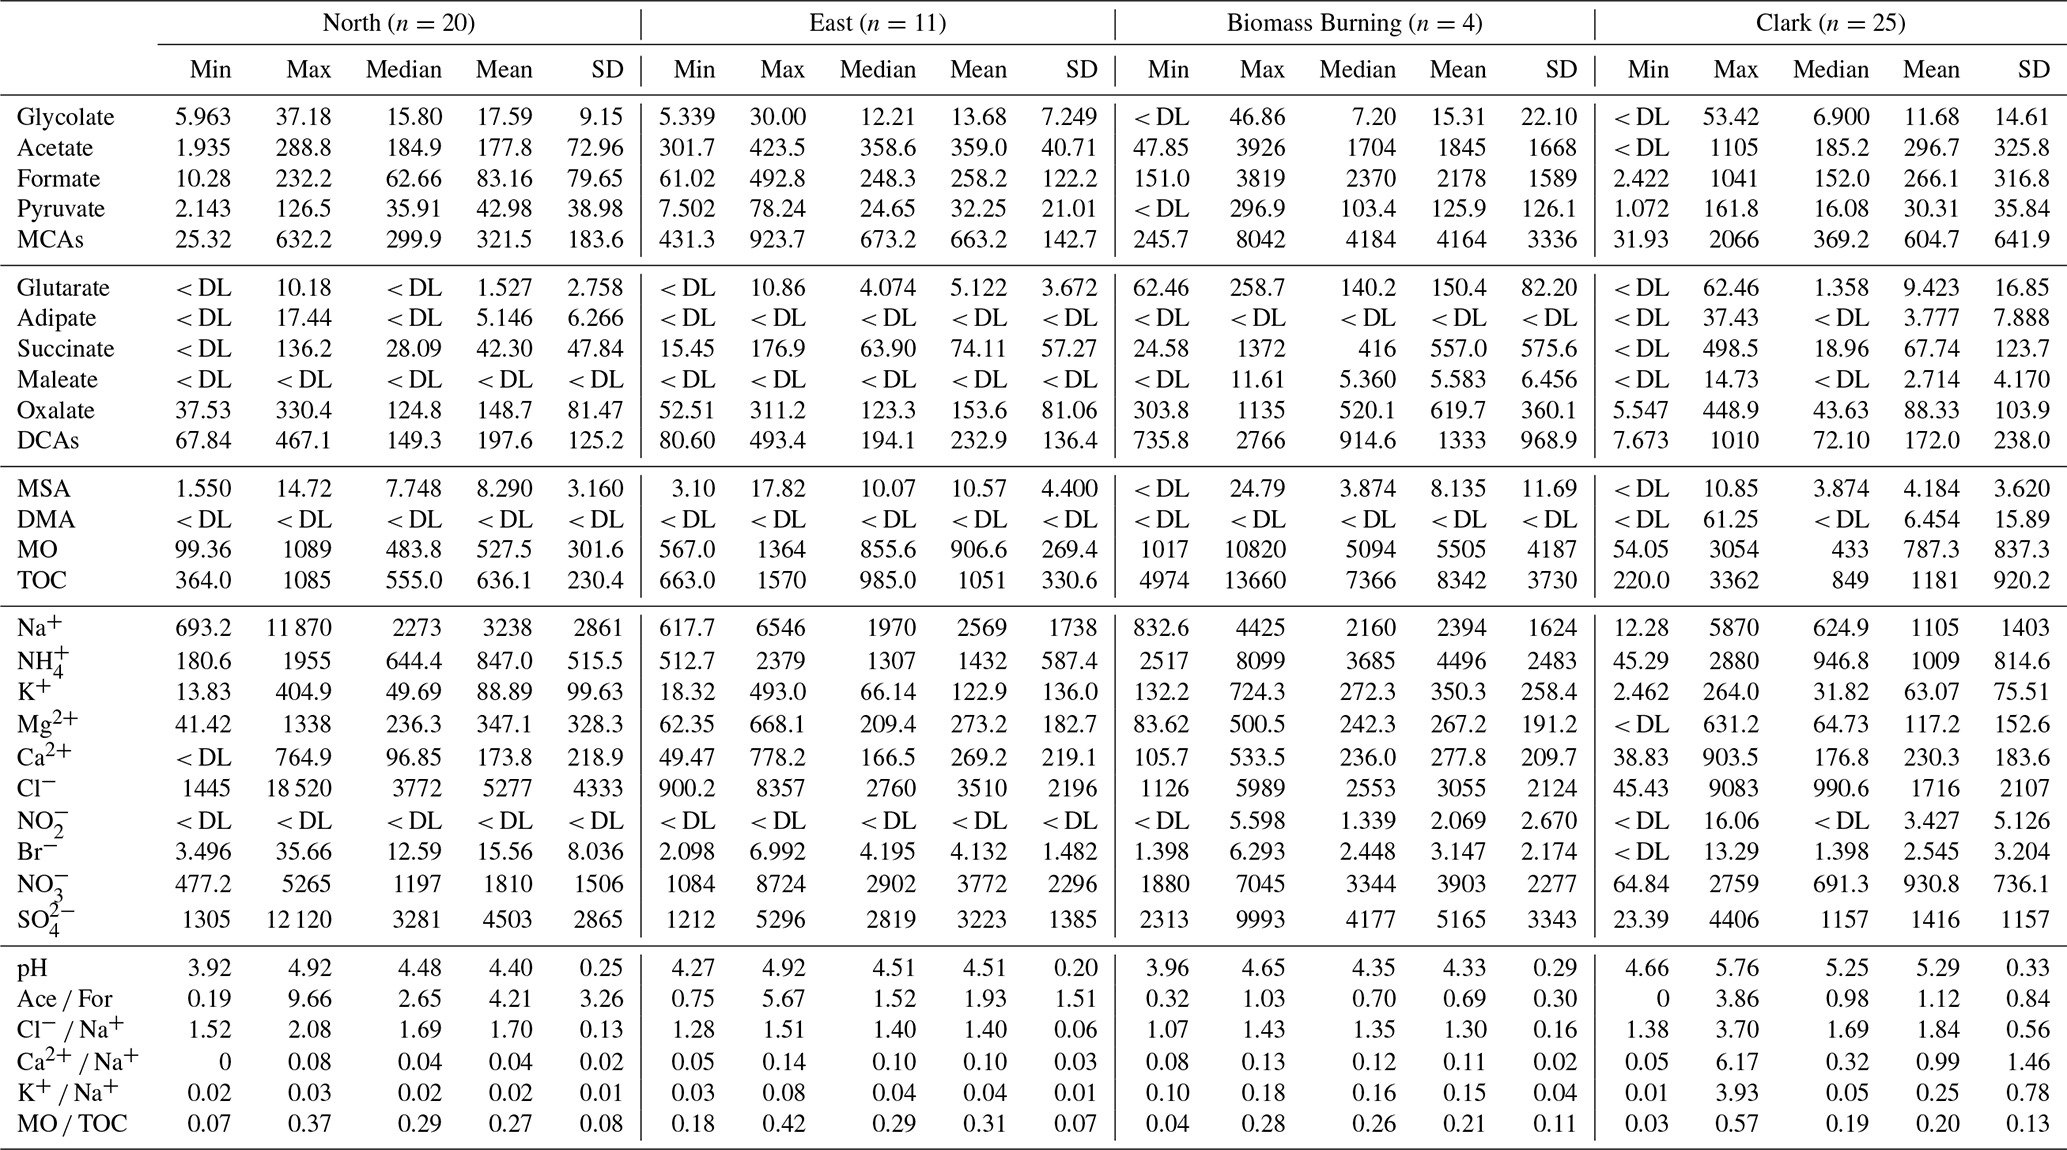
This case exhibited a few distinct features worth noting. First, it had the highest sea salt presence based on the highest case-wide concentrations of Na+ (3238 ± 2861 ppb), Cl− (5277 ± 4333 ppb), Mg2+ (347.1 ± 328.3 ppb), and Br− (15.56 ± 8.036 ppb), the latter of which is a trace component of sea salt (Seinfeld and Pandis, 2016). MSA originates partly from marine emissions of DMS, but its concentration was among the lowest of all species for all four cases with a mass contribution to total TOC (based on C mass) of only 0.17 ± 0.05 % in the North category (Table 3). In their analysis of aerosol data in the surface layer of Metro Manila, Stahl et al. (2020) showed lower overall organic acid aerosol concentrations in the northeast monsoon season where northeasterly air masses originated predominantly from East Asia; Stahl et al. (2020) also showed that those air masses were characterized by an enhancement in organic acid masses in the supermicrometer size range owing to adsorption to coarse particle types such as sea salt and dust, although with a preference for dust (Mochida et al., 2003; Rinaldi et al., 2011; Sullivan and Prather, 2007; Turekian et al., 2003). As there was no direct evidence of dust in this case because the ratio was on average (0.04) nearly the same as sea salt (0.038) (Seinfeld and Pandis, 2016), organic acids could have interacted with sea salt. There were strong correlations between sea salt constituents, TOC, and almost all detected organics (Table S1 in the Supplement).
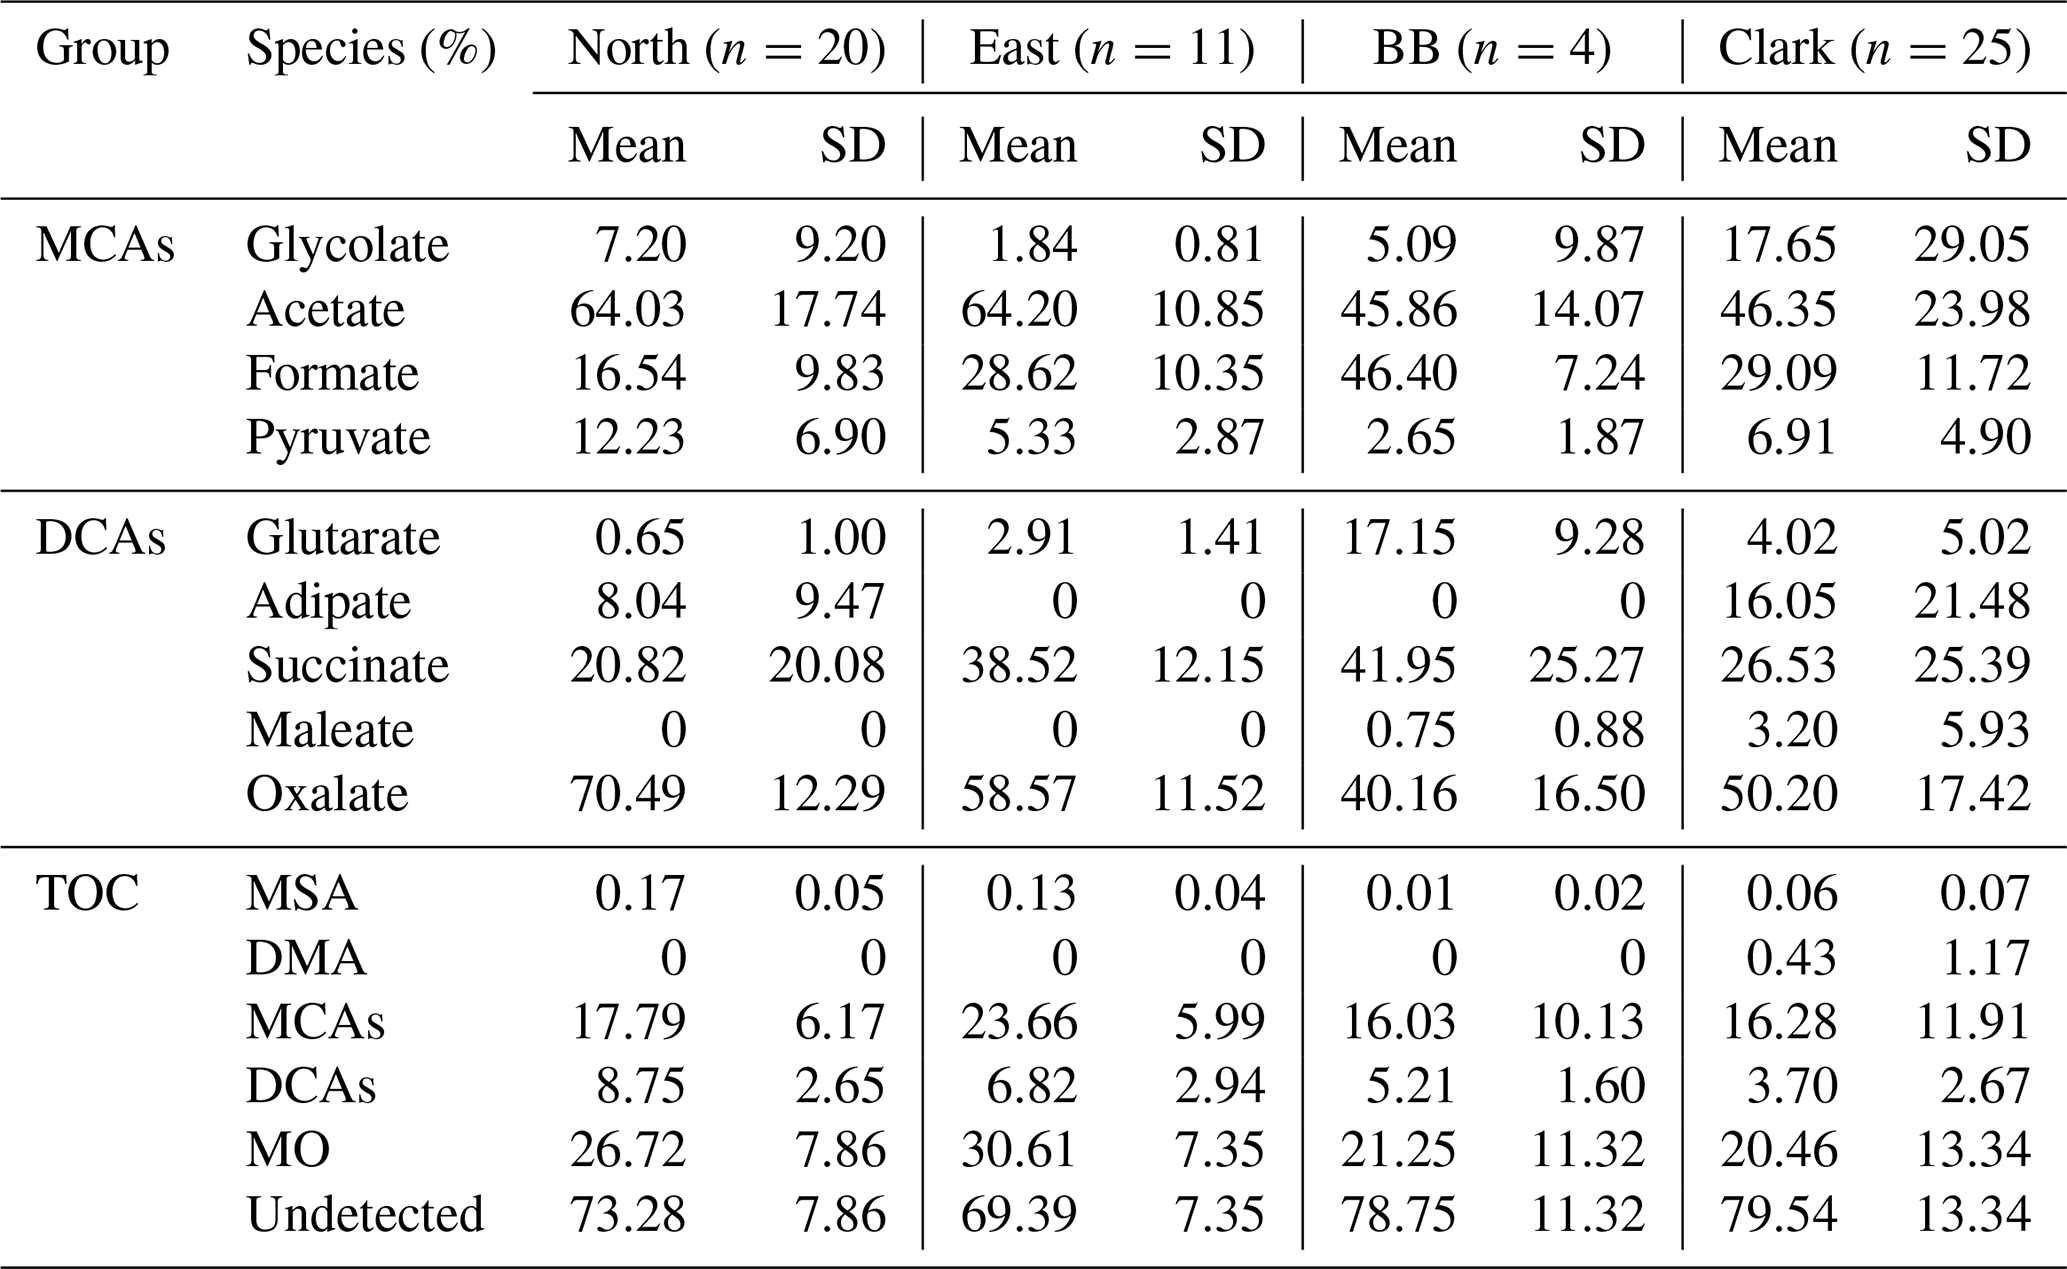
Table 3Average organic composition for each case study where the first, second, and third groups of rows show the percentage contributions (%) of individual components to monocarboxylic acids (MCAs), dicarboxylic acids (DCAs), and total organic carbon (TOC), respectively.
The second notable feature of this case was limited air mass aging characteristics based on speciated ratios. The acetate : formate ratio is often used to indicate the relative influence of fresh emissions (higher ratios) as compared to secondary production (lower ratios) (Talbot et al., 1988; Wang et al., 2007). In at least one study, fresh emissions were linked to cloud water ratios above 1.5 and aged samples having values below 1 (Coggon et al., 2014). The mean acetate : formate ratio for this air mass category was 4.21 ± 3.26, which was the highest of all four categories in Table 2, suggestive of fresh emissions and low aging. This was consistent with the ratio (1.70 ± 0.13) being close to sea water (1.81); our use of this ratio in the study assumes that these species originate primarily from sea salt. Lower values in the study region coincide with sea salt reactions with acids such as sulfuric, nitric, and organic acids (AzadiAghdam et al., 2019). This was one of the two cases that had adipate present, with this category exhibiting the highest mean concentration (5.146 ± 6.266 ppb). This suggests that there was influence from cyclic organics possibly originating from combustion sources, among others, during transport to the sample region. Adipate exhibited negative correlations with almost all other organic species in this case (r from −0.48 to −0.72), suggestive of limited aging to form shorter-chain carboxylic acids via photochemical reactions (Table S1 in the Supplement). With the exception of adipate, interrelationships between the other organics detected in this case exhibited positive and significant correlations with one another, which is suggestive of common precursors and/or production mechanisms. Therefore, the results of the North case point to influences from marine emissions and limited aging signatures based on speciated ratios.
4.2 East
The dominant organic contributors to TOC (1051 ± 330.6 ppb C) in the East case were the same as in the North case with the difference being the order after acetate (±1 standard deviation): acetate (359.0 ± 40.71 ppb; 14.9 ± 3.1 %), formate (258.2 ± 122.2 ppb; 7.2 ± 3.8 %), and oxalate (153.6 ± 81.06 ppb; 3.8 ± 1.2 %). The percentage of TOC unaccounted for by the speciated measurements (69.4 %) was the lowest out of all of the cases. This case resembled the North case in that there was marine influence, although the differences were a more pronounced dust influence and greater evidence of aging based on chemical ratios. Marine signatures come from the second highest concentrations of Na+, Cl−, and Mg2+ after North, with high correlations between these species (Table S2).
Unlike the previous case, the ratio (0.10) was elevated from that of typical sea salt (0.038). Wang et al. (2018) showed that East Asian dust can get lofted up during dust storms, which could contribute to the transport to the Philippines. Previous studies have shown that organic acids adsorb more readily to dust compared with sea salt due to dust's more alkaline nature (Stahl et al., 2020; Sullivan and Prather, 2007). While Ca2+ was correlated with 6 of the 11 organic species for this case (r = 0.70–0.96; Table S2), the magnitude of the correlations was very similar to those between either Na+ or Cl− and the speciated organics. TOC also exhibited similar correlations with Na+, Cl−, and Ca2+ (r = 0.83–0.87). Therefore, it is too difficult with the given data to assert whether (if at all) the organic acids had a preference towards either salt or dust aerosol particles; of note, however, is that oxalate exhibited the strongest correlation with either Na+, Cl−, or Ca2+ (r = 0.96–0.99) among all species and also TOC. Additionally, Park et al. (2004) showed enhanced Ca2+ and NO in the coarse mode owing to continental Asian dust. In the East case, speciated organics were fairly well correlated with NO (r = 0.68–0.99), which has been associated with adsorption onto coarse aerosol types like dust and sea salt (e.g., Maudlin et al., 2015; Stahl et al., 2020). Nitrate was especially well correlated with Na+, Cl−, and Ca2+ (r = 0.98–1.00), which exceeded correlations of other common inorganic ions such as SO and NH.
The vertical profiles clearly show the systematically higher TOC masses relative to the North case across roughly the same altitude range (1.3–3.3 km); however, the AMS organic and 44 values (although sparse) were more comparable, which again can simply be due to the differences in what is being measured, with AMS not accounting for the supermicrometer particles types (i.e., dust and sea salt) that were likely more influential in the cloud water in the East case. However, the importance of droplet uptake of water-soluble organic gases should also be considered, as they can influence TOC mass.
Evidence of greater aging compared with the North case comes from a few ratios of interest. The ratio for this case (1.40 ± 0.06) was lower than for the North case, suggestive of more sea salt reactivity aided by presumed aging. Furthermore, the acetate : formate ratio (1.93 ± 1.51) was less than half the value from the North case. More broadly, the overall contribution of MCAs and DCAs to TOC were very similar between the North and East cases and also the next two cases: MCA:TOC = 16.03 %–23.66 %, and DCA:TOC = 3.70 %–8.75 % (Table 3). In contrast with the North case, this category of samples had weaker interrelationships between organic species, which was presumed to be due to the mixture of sources impacting this case including dust, marine particles, and likely other anthropogenic and biogenic sources over land.
4.3 Biomass Burning
The Biomass Burning (BB) category samples exhibited the highest concentrations of TOC (8342 ± 3730 ppb C) and almost every organic, with the dominant contributors to TOC (±1 standard deviation) being formate (2178 ± 1589 ppb; 7.0 ± 4.5 %), acetate (1845 ± 1668 ppb; 8.4 ± 5.6 %), and succinate (557.0 ± 575.6 ppb; 2.4 ± 1.7 %). As acetate and formate were so abundant, the relative enhancement of MCA mass was much larger than DCA mass compared with the three other cases examined (Table 2). While the correlation matrix for this case was quite sparse in terms of significant values, owing partly to the use of only a few points (n=4), TOC and K+ were highly correlated (r = 0.99), which demonstrates the strong linkage between TOC and biomass burning emissions (Table S3) as also shown by others (Cook et al., 2017). For context, Desyaterik et al. (2013) reported cloud water TOC masses of 100.6 ppm C in a biomass burning air mass at Mt. Tai in eastern China that were 8 times higher than typical values in the absence of agricultural burning. Cook et al. (2017) observed significantly higher cloud water TOC masses during wildfire periods (16.6 ppm C) at Whiteface Mountain, New York, than during biogenic (2.16 ppm C) or urban (2.11 ppm C) periods.
In our BB samples, mean values of succinate (557.0 ± 575.6 ppb), glutarate (150.4 ± 82.20 ppb), and pyruvate (125.9 ± 126.1 ppb) were significantly elevated above the other cases. Stahl et al. (2020) recently showed that succinate, oxalate, and MSA were especially enhanced in aerosol samples collected in the study region during BB periods in the 2018 southwest monsoon season. Study-wide peak concentrations of succinate (1372 ppb), oxalate (1135 ppb), and MSA (24.79 ppb) were found in this case, reinforcing those findings (Stahl et al., 2020). Unlike the previous two cases, maleate was detected in BB samples (5.583 ± 6.456 ppb). Although maleate is associated with combustion sources (Kawamura and Kaplan, 1987; Rogge et al., 1993), such as from extensive ship traffic around the sampling area, other studies have shown enhancements of maleate in BB air masses (i.e., Mardi et al., 2019; Tsai et al., 2013). The percentage of mass contributing to TOC that was unaccounted for was 78.7 %, with the highest sample at 6.5 km having 95.6 % undetected, which was surprisingly large based on the prevalence of organic acids in biomass burning emissions (Reid et al., 1998). Therefore, the second hypothesis posed in this study is partly true in that the BB case exhibited much higher TOC values; however, these samples did not exhibit a greater contribution from organic acids to TOC, as the North and East cases actually had a greater contribution from such species. This highlights the need for more attention to be paid to organic chemical speciation in clouds impacted by biomass burning emissions, as such a large portion of the TOC mass went unaccounted for in this study.
While absolute concentrations of most organics were greatly enhanced in BB, the relative contributions of individual organics within the MCA and DCA subsets of species also varied. Most notably in the MCA category, formate was greatly enhanced with a mass contribution to total MCA mass of 46.40 % versus 16.54 %–29.09 % for other cases. In the DCA population of species, glutarate and succinate accounted for higher mass fractions in the BB case (17.15 % and 41.95 %, respectively) than in the other three cases (0.65 %–4.02 % and 20.82 %–38.52 %, respectively).
The ratio was 1.30 ± 0.06 and suggestive of Cl− depletion, which has been observed in other regions experiencing biomass burning and has been linked to high concentrations of inorganic and organic acids (Braun et al., 2017, and references therein). This is supported by how the values of MO, SO, and NO3− were the highest in this case (Table 2). The acetate : formate ratio was 0.69 ± 0.30, but it is unclear how effective this and other ratios are as aging indicators when biomass burning is present, especially as fuel type varies between regions. Talbot et al. (1988) and Wang et al. (2007) both report that the acetate : formate ratio is substantially larger in biomass burning samples, which is contradictory to the ratios that are reported for this case (0.32 to 1.03). This could be due to the fuel type or aging of the biomass burning plume; however, this is speculatory and should be examined more extensively.
4.4 Clark
Samples in this category were collected during ascents after takeoff and descents during approaches to the airfield, which allowed for sample collection closer to the surface than the other categories (altitude range of 0.2–2.9 km). Clark International Airport is located within the Clark Freeport Zone, which is part of both the Pampanga and Tarlac provinces and consists of five cities and municipalities: Angeles city, Mabalacat city, Porac, Capas, and Bamban. This gives the Clark area a population of approximately 996 000 with a population density of ∼ 3100 km−2, which is low in comparison to the most populated city in the Philippines, Quezon City in Metro Manila, with 2.94 million people and a population density of ∼ 17 000 km−2 (PSA, 2016). In addition to Metro Manila just to the southeast (∼ 90 km), Clark lies between Mt. Pinatubo to the west and Mt. Arayat to the east, which are active and potentially active volcanoes, respectively.
The average TOC for this case (1181 ± 920.2 ppb C) was most similar to the East case and exhibited the most variability relative to the mean TOC value of all four cases, which we attribute to numerous sources impacting these samples, including local and regional emissions, time of day variability, local spatial variability, and number of flights. This case exhibited the highest percentage of TOC mass that was unaccounted for by speciated organics (79.5 %), with the three largest measured contributors (±1 standard deviation) consisting of acetate (296.7 ± 325.8 ppb; 9.6 ± 9.5 %), formate (266.1 ± 316.8 ppb; 4.8 ± 3.3 %), and oxalate (88.33 ± 103.9 ppb; 1.7 ± 1.0 %). A few notable features are mentioned that are specific to this case. This was the only case that had DMA present (6.454 ± 15.89 ppb), albeit with a low mass contribution to total TOC (0.43 ± 1.17 %). This case exhibited the highest mass fractions of maleate (3.20 ± 5.93 %) and adipate (16.05 ± 21.48 %) relative to DCA mass, suggestive of greater anthropogenic emission influence and processed aromatic compounds. DMA was only correlated with maleate (r = 0.67) among the organic species, which is suggestive of a similar source (Table S4). Stahl et al. (2020) showed increased aerosol concentrations of freshly emitted organics (i.e., phthalate and maleate) owing to the vast sources of combustion engines to the southeast of the Clark area. Clark is situated near a major highway that could also contribute to the high combustion sources, although commercial aircraft emissions could also play a significant role.
Because succinate peaked in concentration for this case (498.50 ppb) and back trajectories originated from Borneo and Sumatra, there may have been some influence from biomass burning (Fig. 5). The ratio was elevated (0.25) above that of sea salt (0.036) (Seinfeld and Pandis, 2016) and was even higher than the Biomass Burning case (0.15), suggestive of local and/or regional biomass burning influence. This case exhibited the highest mean ratio (0.99) and was well above the sea salt value (0.038), which we presume could be largely linked to resuspended and/or transported dust. For Metro Manila, Cruz et al. (2019) showed that resuspended dust, especially linked to vehicular traffic, is an important source of dust in the study region. Stahl et al. (2020) showed that adipate is most influenced by crustal sources in the study region and was unique among the studied organics in this work in that it exhibited a prominent peak in the supermicrometer range based on surface aerosol measurements in Metro Manila. Consistent with that work, Ca2+ was only correlated with adipate in the Clark samples (r = 0.71) among the studied organics (Table S4), adding support for how organic acids like adipate can partition to dust with the novelty here being that the signature was observed in cloud water.
This work analyzed 159 cloud water samples collected over a 2-month period as part of the CAMP2Ex airborne campaign around the Philippines. TOC and a total of 11 organic compounds comprised of 4 MCAs (glycolate, acetate, formate, and pyruvate), 5 DCAs (glutarate, adipate, succinate, maleate, and oxalate), MSA, and DMA were measured. The measured organics were then compared to TOC to determine the percentage of organic species measured compared with the total organic composition. Notable results are summarized below including responses to the two hypotheses proposed at the end of Sect. 1.
TOC masses ranged widely between 0.018 and 13.66 ppm C from 0.2 to 6.8 km, with a mean value of 0.902 ppm C. The contribution (in C mass) of the 11 measured species to total TOC was on average 30 %. Using a conversion factor of 1.8 for organic matter relative to organic carbon, the mean amount of total organic matter (TOM) accounted for by our measured 11 species was 46.4 %. Furthermore, the mean contribution of TOM and speciated organics to total mass (inorganics + organics) was 30.7 % (maximum of 95.1 %) and 10.3 % (maximum of 57.6 %), respectively. The mean ratio of inorganic to TOM was 5.8. The study's first hypothesis that the measured organic species account for a higher mass fraction relative to total mass compared with surface layer aerosol measurements over Luzon, excluding black carbon (∼ 1.3 %) (Stahl et al., 2020) holds true. This is likely owing to more processed air masses aloft and the reduced influence of black carbon that is so abundant in areas like Metro Manila (Cruz et al., 2019; Hilario et al., 2020a). The uptake of water-soluble gases can also attribute to greater organic mass contributions.
In terms of the chemical profile of the speciated organics, the order in decreasing contribution of C mass relative to TOC was as follows (±1 standard deviation): acetate (14.7 ± 20.5 %), formate (5.4 ±,9.3 %), oxalate (2.8 ± 4.3 %), DMA (1.7 ± 6.3 %), succinate (1.6 ± 2.4 %), pyruvate (1.3 ± 4.5 %), glycolate (1.3 ± 3.7 %), adipate (1.0 ± 3.6 %), MSA (0.1 ± 0.1 %), glutarate (0.1 ± 0.2 %), and maleate (< 0.1 ± 0.1 %). Approximately 70.0 % of TOC went unaccounted for, highlighting the complexity and difficulty of organic speciation in the study region, with this value being fairly similar to other regions (Benedict et al., 2012; Boris et al., 2016, 2018; Herckes et al., 2002; Raja et al., 2008). Monocarboxylic acids dominated the speciated organic mass (∼ 75 %) and were about 4 times more abundant than dicarboxylic acids, which is suggestive of a higher abundance of gaseous species and precursors. It should also be noted that MCAs have a higher volatility than DCAs, which could contribute to the higher organic mass. Additionally, the MCAs measured in this study were predominately short-chain organics that have naturally higher volatilities (Chebbi and Carlier, 1996; Wang et al., 2007).
Vertical profiles of TOC revealed higher concentrations in the bottom 2 km with a reduction above that. Samples impacted by biomass burning emissions were substantially enhanced in TOC and most speciated organic masses, ranging in altitude from as low as 1.3 km to as high as 6.5 km. While vertical profiles of AMS organic and 44 mass concentrations qualitatively resembled that of TOC with reductions above 2 km, the vertical behavior of chemical ratios relevant to the composition of the cloud (ratio of C mass from measured organics to TOC) and aerosol organics (f44) did not reveal any clear trend. For both non-BB and BB samples, monocarboxylic acids uniformly dominated C mass with ∼ 75 % of TOC mass unaccounted for across the range of altitudes studied.
The second hypothesis in this study proved to be partly true, as clouds impacted by biomass burning exhibited markedly higher TOC values (4.974–13.66 ppm C) and masses of most of the other species detected compared with the other three categories of samples in Sect. 4 (North, East, and Clark). However, the part of the hypothesis about speciated organic acids contributing more to BB samples did not hold true, as total measured organics accounted on average for 21.25 % of TOC, which was lower than two of the other categories of samples (North, 26.72 %, and East, 30.61 %). Interestingly, the highest BB sample (6.5 km) had 95.6 % of the C mass unaccounted for by speciated organics. This highlights the need for increased attention to be paid to organic speciation in clouds impacted by biomass burning.
Four categories of samples with different air mass history characteristics were compared, revealing a few notable features: (i) while speciated concentrations and TOC masses varied considerably between the four cases, the contributions of MCAs and DCAs (based on C mass) to TOC were remarkably similar with little variation (MCA:TOC = 16.03 %–23.66 % and DCA:TOC = 3.70 %–8.75 %); (ii) dust and sea salt tracer species were strongly correlated with most of the speciated organics for the North and East cases, suggestive of interactions between such species and coarse aerosol surfaces, as supported by past work (Stahl et al., 2020; Sullivan and Prather, 2007); (iii) for samples with limited aging (North case) based on selected chemical ratio values, adipate was more abundant and was negatively correlated with smaller carboxylic acids; (iv) BB samples exhibited the highest TOC concentrations (8342 ± 3730 ppb C) as well as significantly elevated levels of individual organics such as acetate, formate, succinate, glutarate, pyruvate, oxalate, and MSA; and (v) the Clark case had a higher variability in TOC (1181 ± 920.2 ppb C) than the North and East cases, presumably owing to a greater mix of influential sources such as fresh anthropogenic emissions (e.g., enhanced maleate) as well as the transport of biomass burning plumes from Borneo and Sumatra (e.g., enhanced succinate), dust, and spatial and temporal variances across different flights. Related to dust, Ca2+ was only correlated with adipate in the Clark samples, which is consistent with a recent study in Metro Manila (Stahl et al., 2020) showing that adipate uniquely exhibits a prominent supermicrometer peak among organic acids, attributed to interactions with dust.
All data used can be found on the NASA data repository at https://doi.org/10.5067/Suborbital/CAMP2EX2018/DATA001 (last access: 10 August 2021). Specifically, the two datasets used in this paper can be found at https://doi.org/10.5067/Airborne/CAMP2Ex_Cloud_AircraftInSitu_P3_Data_1 (NASA/LARC/SD/ASDC, 2020a) and https://doi.org/10.5067/Airborne/CAMP2Ex_Aerosol_AircraftInSitu_P3_Data_1 (NASA/LARC/SD/ASDC, 2020b).
The supplement related to this article is available online at: https://doi.org/10.5194/acp-21-14109-2021-supplement.
EC, RAB, CS, ABM, and AS designed the experiment. All coauthors carried out various aspects of the data collection. EC, CS, and AS conducted analysis and interpretation of the data. CS and AS prepared the manuscript with contributions from the coauthors.
The contact author has declared that neither they nor their coauthors have any competing interests.
Publisher's note: Copernicus Publications remains neutral with regard to jurisdictional claims in published maps and institutional affiliations.
This article is part of the special issue “Cloud, Aerosol and Monsoon Processes Philippines Experiment (CAMP2Ex) (ACP/AMT inter-journal SI)”. It is not associated with a conference.
The authors acknowledge support from NASA (grant no. 80NSSC18K0148) in the framework of the NASA CAMP2Ex project. Rachel A. Braun acknowledges support from the ARCS Foundation, Melliza Templonuevo Cruz was supported by the Philippine Department of Science and Technology's ASTHRD program, and Alexander B. MacDonald acknowledges support from the Mexican National Council for Science and Technology (CONACYT).
This research has been supported by the National Aeronautics and Space Administration (grant no. 80NSSC18K0148).
This paper was edited by Manvendra K. Dubey and reviewed by two anonymous referees.
Aiken, A. C., Decarlo, P. F., Kroll, J. H., Worsnop, D. R., Huffman, J. A., Docherty, K. S., Ulbrich, I. M., Mohr, C., Kimmel, J. R., Sueper, D., Sun, Y., Zhang, Q., Trimborn, A., Northway, M., Ziemann, P. J., Canagratna, M. R., Onasch, T. B., Alfarra, M. R., Prevot, A. S. H., Dommen, J., Duplissy, J., Metzger, A., Baltensperger, U., and Jimenez, J. L.: O/C and OM/OC ratios of primary, secondary, and ambient organic aerosols with high-resolution time-of-flight aerosol mass spectrometry, Environ. Sci. Technol., 42, 4478–4485, https://doi.org/10.1021/es703009q, 2008.
Anastasio, C., Faust, B. C., and Allen, J. M.: Aqueous phase photochemical formation of hydrogen peroxide in authentic cloud waters, J. Geophys. Res.-Atmos., 99, 8231-08248, https://doi.org/10.1029/94JD00085, 1994.
AzadiAghdam, M., Braun, R. A., Edwards, E.-L., Bañaga, P. A., Cruz, M. T., Betito, G., Cambaliza, M. O., Dadashazar, H., Lorenzo, G. R., Ma, L., MacDonald, A. B., Nguyen, P., Simpas, J. B., Stahl, C., and Sorooshian, A.: On the nature of sea salt aerosol at a coastal megacity: Insights from Manila, Philippines in Southeast Asia, Atmos. Environ., 216, 116922, https://doi.org/10.1016/j.atmosenv.2019.116922, 2019.
Barth, M., Rasch, P., Kiehl, J., Benkovitz, C., and Schwartz, S.: Sulfur chemistry in the National Center for Atmospheric Research Community Climate Model: Description, evaluation, features, and sensitivity to aqueous chemistry, J. Geophys. Res.-Atmos., 105, 1387–1415, https://doi.org/10.1029/1999JD900773, 2000.
Benedict, K. B., Lee, T., and Collett Jr., J. L.: Cloud water composition over the southeastern Pacific Ocean during the VOCALS regional experiment, Atmos. Environ., 46, 104–114, https://doi.org/10.1016/j.atmosenv.2011.10.029, 2012.
Berresheim, H.: Biogenic sulfur emissions from the Subantarctic and Antarctic Oceans, J. Geophys. Res.-Atmos., 92, 13245–13262, https://doi.org/10.1029/JD092iD11p13245, 1987.
Boris, A. J., Lee, T., Park, T., Choi, J., Seo, S. J., and Collett Jr., J. L.: Fog composition at Baengnyeong Island in the eastern Yellow Sea: detecting markers of aqueous atmospheric oxidations, Atmos. Chem. Phys., 16, 437–453, https://doi.org/10.5194/acp-16-437-2016, 2016.
Boris, A. J., Desyaterik, Y., and Collett Jr., J. L.: How do components of real cloud water affect aqueous pyruvate oxidation?, Atmos. Res., 143, 95–106, https://doi.org/10.1016/j.atmosres.2014.02.004, 2014.
Boris, A. J., Napolitano, D. C., Herckes, P., Clements, A. L., and Collett Jr., J. L.: Fogs and air quality on the southern California coast, Aerosol Air Qual. Res., 18, 224–239, https://doi.org/10.4209/aaqr.2016.11.0522 2018.
Braun, R. A., Dadashazar, H., MacDonald, A. B., Aldhaif, A. M., Maudlin, L. C., Crosbie, E., Aghdam, M. A., Mardi, A. H., and Sorooshian, A.: Impact of wildfire emissions on chloride and bromide depletion in marine aerosol particles, Environ. Sci. Technol., 51, 9013–9021, https://doi.org/10.1021/acs.est.7b02039, 2017.
Braun, R. A., Aghdam, M. A., Bañaga, P. A., Betito, G., Cambaliza, M. O., Cruz, M. T., Lorenzo, G. R., MacDonald, A. B., Simpas, J. B., Stahl, C., and Sorooshian, A.: Long-range aerosol transport and impacts on size-resolved aerosol composition in Metro Manila, Philippines, Atmos. Chem. Phys., 20, 2387–2405, https://doi.org/10.5194/acp-20-2387-2020, 2020.
Capel, P. D., Gunde, R., Zuercher, F., and Giger, W.: Carbon speciation and surface tension of fog, Environ. Sci. Technol., 24, 722–727, https://doi.org/10.1021/es00075a017, 1990.
Carlton, A. G., Turpin, B. J., Lim, H.-J., Altieri, K. E., and Seitzinger, S.: Link between isoprene and secondary organic aerosol (SOA): Pyruvic acid oxidation yields low volatility organic acids in clouds, Geophys. Res. Lett., 33, L06822, https://doi.org/10.1029/2005gl025374, 2006.
Chang, D., Lelieveld, J., Tost, H., Steil, B., Pozzer, A., and Yoon, J.: Aerosol physicochemical effects on CCN activation simulated with the chemistry-climate model EMAC, Atmos. Environ., 162, 127–140, https://doi.org/10.1016/j.atmosenv.2017.03.036, 2017.
Chebbi, A. and Carlier, P.: Carboxylic acids in the troposphere, occurrence, sources, and sinks: A review, Atmos. Environ., 30, 4233–4249, https://doi.org/10.1016/1352-2310(96)00102-1, 1996.
Coggon, M., Sorooshian, A., Wang, Z., Craven, J., Metcalf, A., Lin, J., Nenes, A., Jonsson, H., Flagan, R., and Seinfeld, J.: Observations of continental biogenic impacts on marine aerosol and clouds off the coast of California, J. Geophys. Res.-Atmos., 119, 6724–6748, https://doi.org/10.1002/2013JD021228, 2014.
Collett Jr., J. L., Hoag, K. J., Sherman, D. E., Bator, A., and Richards, L. W.: Spatial and temporal variations in San Joaquin Valley fog chemistry, Atmos. Environ., 33, 129–140, https://doi.org/10.1016/S1352-2310(98)00136-8, 1998.
Collett Jr., J. L., Herckes, P., Youngster, S., and Lee, T.: Processing of atmospheric organic matter by California radiation fogs, Atmos. Res., 87, 232–241, https://doi.org/10.1016/j.atmosres.2007.11.005, 2008.
Cook, R. D., Lin, Y.-H., Peng, Z., Boone, E., Chu, R. K., Dukett, J. E., Gunsch, M. J., Zhang, W., Tolic, N., Laskin, A., and Pratt, K. A.: Biogenic, urban, and wildfire influences on the molecular composition of dissolved organic compounds in cloud water, Atmos. Chem. Phys., 17, 15167–15180, https://doi.org/10.5194/acp-17-15167-2017, 2017.
Crosbie, E., Brown, M. D., Shook, M., Ziemba, L., Moore, R. H., Shingler, T., Winstead, E., Thornhill, K. L., Robinson, C., MacDonald, A. B., Dadashazar, H., Sorooshian, A., Beyersdorf, A., Eugene, A., Collett Jr., J., Straub, D., and Anderson, B.: Development and characterization of a high-efficiency, aircraft-based axial cyclone cloud water collector, Atmos. Meas. Tech., 11, 5025–5048, https://doi.org/10.5194/amt-11-5025-2018, 2018.
Cruz, M. T., Bañaga, P. A., Betito, G., Braun, R. A., Stahl, C., Aghdam, M. A., Cambaliza, M. O., Dadashazar, H., Hilario, M. R., Lorenzo, G. R., Ma, L., MacDonald, A. B., Pabroa, P. C., Yee, J. R., Simpas, J. B., and Sorooshian, A.: Size-resolved composition and morphology of particulate matter during the southwest monsoon in Metro Manila, Philippines, Atmos. Chem. Phys., 19, 10675–10696, https://doi.org/10.5194/acp-19-10675-2019, 2019.
Dalirian, M., Ylisirniö, A., Buchholz, A., Schlesinger, D., Ström, J., Virtanen, A., and Riipinen, I.: Cloud droplet activation of black carbon particles coated with organic compounds of varying solubility, Atmos. Chem. Phys., 18, 12477–12489, https://doi.org/10.5194/acp-18-12477-2018, 2018.
DeCarlo, P. F., Kimmel, J. R., Trimborn, A., Northway, M. J., Jayne, J. T., Aiken, A. C., Gonin, M., Fuhrer, K., Horvath, T., Docherty, K. S., Worsnop, D. R., and Jimenez, J. L.: Field-deployable, high-resolution, time-of-flight aerosol mass spectrometer, Anal. Chem., 78, 8281–8289, https://doi.org/10.1021/ac061249n, 2006.
Decesari, S., Facchini, M., Fuzzi, S., McFiggans, G., Coe, H., and Bower, K.: The water-soluble organic component of size-segregated aerosol, cloud water and wet depositions from Jeju Island during ACE-Asia, Atmos. Environ., 39, 211–222, https://doi.org/10.1016/j.atmosenv.2004.09.049, 2005.
Deguillaume, L., Charbouillot, T., Joly, M., Vaïtilingom, M., Parazols, M., Marinoni, A., Amato, P., Delort, A.-M., Vinatier, V., Flossmann, A., Chaumerliac, N., Pichon, J. M., Houdier, S., Laj, P., Sellegri, K., Colomb, A., Brigante, M., and Mailhot, G.: Classification of clouds sampled at the puy de Dôme (France) based on 10 yr of monitoring of their physicochemical properties, Atmos. Chem. Phys., 14, 1485–1506, https://doi.org/10.5194/acp-14-1485-2014, 2014.
Desyaterik, Y., Sun, Y., Shen, X., Lee, T., Wang, X., Wang, T., and Collett Jr., J. L.: Speciation of “brown” carbon in cloud water impacted by agricultural biomass burning in eastern China, J. Geophys. Res.-Atmos., 118, 7389–7399, https://doi.org/10.1002/jgrd.50561, 2013.
Ehrenhauser, F. S., Khadapkar, K., Wang, Y., Hutchings, J. W., Delhomme, O., Kommalapati, R. R., Herckes, P., Wornat, M. J., and Valsaraj, K. T.: Processing of atmospheric polycyclic aromatic hydrocarbons by fog in an urban environment, J. Environ. Monitor., 14, 2566–2579, https://doi.org/10.1039/C2EM30336A, 2012.
Erel, Y., Pehkonen, S. O., and Hoffmann, M. R.: Redox chemistry of iron in fog and stratus clouds, J. Geophys. Res.-Atmos., 98, 18423–18434, https://doi.org/10.1029/93JD01575, 1993.
Ervens, B., Feingold, G., Clegg, S. L., and Kreidenweis, S. M.: A modeling study of aqueous production of dicarboxylic acids: 2. Implications for cloud microphysics, J. Geophys. Res.-Atmos., 109, D15206, https://doi.org/10.1029/2004jd004575, 2004.
Ervens, B., Wang, Y., Eagar, J., Leaitch, W. R., Macdonald, A. M., Valsaraj, K. T., and Herckes, P.: Dissolved organic carbon (DOC) and select aldehydes in cloud and fog water: the role of the aqueous phase in impacting trace gas budgets, Atmos. Chem. Phys., 13, 5117–5135, https://doi.org/10.5194/acp-13-5117-2013, 2013.
Ervens, B.: Modeling the processing of aerosol and trace gases in clouds and fogs, Chem. Rev., 115, 4157–4198, https://doi.org/10.1021/cr5005887, 2015.
Faloona, I.: Sulfur processing in the marine atmospheric boundary layer: A review and critical assessment of modeling uncertainties, Atmos. Environ., 43, 2841–2854, https://doi.org/10.1016/j.atmosenv.2009.02.043, 2009.
Field, R. D. and Shen, S. S.: Predictability of carbon emissions from biomass burning in Indonesia from 1997 to 2006, J. Geophys. Res.-Biogeo., 113, G04024, https://doi.org/10.1029/2008JG000694, 2008.
Gelencser, A., Sallai, M., Krivacsy, Z., Kiss, G., and Meszaros, E.: Voltammetric evidence for the presence of humic-like substances in fog water, Atmos. Res., 54, 157–165, https://doi.org/10.1016/S0169-8095(00)00042-9, 2000.
Gioda, A., Mayol-Bracero, O. L., Reyes-Rodriguez, G. J., Santos-Figueroa, G., and Collett Jr., J. L.: Water-soluble organic and nitrogen levels in cloud and rainwater in a background marine environment under influence of different air masses, J. Atmos. Chem., 61, 85–99, https://doi.org/10.1007/s10874-009-9125-6, 2008.
Gioda, A., Reyes-Rodríguez, G. J., Santos-Figueroa, G., Collett Jr., J. L., Decesari, S., Ramos, M. d. C. K., Bezerra Netto, H. J., de Aquino Neto, F. R., and Mayol-Bracero, O. L.: Speciation of water-soluble inorganic, organic, and total nitrogen in a background marine environment: Cloud water, rainwater, and aerosol particles, J. Geophys. Res.-Atmos., 116, D05203, https://doi.org/10.1029/2010JD015010, 2011.
Hadi, D., Crossley, A., and Cape, J.: Particulate and dissolved organic carbon in cloud water in southern Scotland, Environ. Pollut., 88, 299–306, https://doi.org/10.1016/0269-7491(95)93443-4, 1995.
Hallquist, M., Wenger, J. C., Baltensperger, U., Rudich, Y., Simpson, D., Claeys, M., Dommen, J., Donahue, N. M., George, C., Goldstein, A. H., Hamilton, J. F., Herrmann, H., Hoffmann, T., Iinuma, Y., Jang, M., Jenkin, M. E., Jimenez, J. L., Kiendler-Scharr, A., Maenhaut, W., McFiggans, G., Mentel, Th. F., Monod, A., Prévôt, A. S. H., Seinfeld, J. H., Surratt, J. D., Szmigielski, R., and Wildt, J.: The formation, properties and impact of secondary organic aerosol: current and emerging issues, Atmos. Chem. Phys., 9, 5155–5236, https://doi.org/10.5194/acp-9-5155-2009, 2009.
Hatakeyama, S., Tanonaka, T., Weng, J., Bandow, H., Takagi, H., and Akimoto, H.: Ozone-cyclohexene reaction in air: quantitative analysis of particulate products and the reaction mechanism, Environ. Sci. Technol., 19, 935–942, https://doi.org/10.1021/es00140a008, 1985.
Heald, C. L., Coe, H., Jimenez, J. L., Weber, R. J., Bahreini, R., Middlebrook, A. M., Russell, L. M., Jolleys, M., Fu, T.-M., Allan, J. D., Bower, K. N., Capes, G., Crosier, J., Morgan, W. T., Robinson, N. H., Williams, P. I., Cubison, M. J., DeCarlo, P. F., and Dunlea, E. J.: Exploring the vertical profile of atmospheric organic aerosol: comparing 17 aircraft field campaigns with a global model, Atmos. Chem. Phys., 11, 12673–12696, https://doi.org/10.5194/acp-11-12673-2011, 2011.
Heald, C. L., Jacob, D. J., Park, R. J., Russell, L. M., Huebert, B. J., Seinfeld, J. H., Liao, H., and Weber, R. J.: A large organic aerosol source in the free troposphere missing from current models, Geophys. Res. Lett., 32, L18809, https://doi.org/10.1029/2005GL023831, 2005.
Herckes, P., Hannigan, M. P., Trenary, L., Lee, T., and Collett Jr., J. L.: Organic compounds in radiation fogs in Davis (California), Atmos. Res., 64, 99–108, https://doi.org/10.1016/S0169-8095(02)00083-2, 2002.
Herckes, P., Chang, H., Lee, T., and Collett Jr., J. L.: Air pollution processing by radiation fogs, Water Air Soil Pollut., 181, 65–75, https://doi.org/10.1007/s11270-006-9276-x, 2007.
Herckes, P., Valsaraj, K. T., and Collett Jr., J. L.: A review of observations of organic matter in fogs and clouds: Origin, processing and fate, Atmos. Res., 132-133, 434–449, https://doi.org/10.1016/j.atmosres.2013.06.005, 2013.
Hilario, M. R. A., Cruz, M. T., Bañaga, P. A., Betito, G., Braun, R. A., Stahl, C., Cambaliza, M. O., Lorenzo, G. R., MacDonald, A. B., AzadiAghdam, M., Pabroa, P. C., Yee, J. R., Simpas, J. B., and Sorooshian, A.: Characterizing weekly cycles of particulate matter in a coastal megacity: The importance of a seasonal, size-resolved, and chemically-speciated analysis, J. Geophys. Res.-Atmos., 125, e2020JD032614, https://doi.org/10.1029/2020JD032614, 2020a.
Hilario, M. R. A., Cruz, M. T., Cambaliza, M. O. L., Reid, J. S., Xian, P., Simpas, J. B., Lagrosas, N. D., Uy, S. N. Y., Cliff, S., and Zhao, Y.: Investigating size-segregated sources of elemental composition of particulate matter in the South China Sea during the 2011 Vasco cruise, Atmos. Chem. Phys., 20, 1255–1276, https://doi.org/10.5194/acp-20-1255-2020, 2020b.
Hilario, M. R. A., Crosbie, E., Shook, M., Reid, J. S., Cambaliza, M. O. L., Simpas, J. B. B., Ziemba, L., DiGangi, J. P., Diskin, G. S., Nguyen, P., Turk, F. J., Winstead, E., Robinson, C. E., Wang, J., Zhang, J., Wang, Y., Yoon, S., Flynn, J., Alvarez, S. L., Behrangi, A., and Sorooshian, A.: Measurement report: Long-range transport patterns into the tropical northwest Pacific during the CAMP2Ex aircraft campaign: chemical composition, size distributions, and the impact of convection, Atmos. Chem. Phys., 21, 3777–3802, https://doi.org/10.5194/acp-21-3777-2021, 2021.
Hogan, T. F. and Rosmond, T. E.: The description of the Navy Operational Global Atmospheric Prediction System's spectral forecast model, Mon. Weather Rev., 119, 1786–1815, https://doi.org/10.1175/1520-0493(1991)119<1786:TDOTNO>2.0.CO;2, 1991.
Hogan, T. F. and Brody, L. R.: Sensitivity studies of the Navy's global forecast model parameterizations and evaluation of improvements to NOGAPS, Mon. Weather Rev., 121, 2373–2395, https://doi.org/10.1175/1520-0493(1993)121<2373:SSOTNG>2.0.CO;2, 1993.
Hutchings, J. W., Robinson, M. S., McIlwraith, H., Kingston, J. T., and Herckes, P.: The chemistry of intercepted clouds in Northern Arizona during the North American monsoon season, Water Air Soil Pollut., 199, 191–202, https://doi.org/10.1007/s11270-008-9871-0, 2008.
IPCC: Climate Change 2013: The Physical Science Basis, Cambridge University Press, https://doi.org/10.1017/CBO9781107415324, 2013.
Kanakidou, M., Seinfeld, J. H., Pandis, S. N., Barnes, I., Dentener, F. J., Facchini, M. C., Van Dingenen, R., Ervens, B., Nenes, A., Nielsen, C. J., Swietlicki, E., Putaud, J. P., Balkanski, Y., Fuzzi, S., Horth, J., Moortgat, G. K., Winterhalter, R., Myhre, C. E. L., Tsigaridis, K., Vignati, E., Stephanou, E. G., and Wilson, J.: Organic aerosol and global climate modelling: a review, Atmos. Chem. Phys., 5, 1053–1123, https://doi.org/10.5194/acp-5-1053-2005, 2005.
Kawamura, K. and Kaplan, I. R.: Motor exhaust emissions as a primary source for dicarboxylic acids in Los Angeles ambient air, Environ. Sci. Technol., 21, 105–110, https://doi.org/10.1021/es00155a014, 1987.
Kawamura, K. and Yasui, O.: Diurnal changes in the distribution of dicarboxylic acids, ketocarboxylic acids and dicarbonyls in the urban Tokyo atmosphere, Atmos. Environ., 39, 1945–1960, https://doi.org/10.1016/j.atmosenv.2004.12.014, 2005.
Khare, P., Kumar, N., Kumari, K., and Srivastava, S.: Atmospheric formic and acetic acids: An overview, Rev. Geophy., 37, 227–248, https://doi.org/10.1029/1998RG900005, 1999.
Kim, H. J., Lee, T., Park, T., Park, G., Collett Jr., J. L., Park, K., Ahn, J. Y., Ban, J., Kang, S., Kim, K., Park, S.-M., Jho, E. H., and Choi, Y.: Ship-borne observations of sea fog and rain chemistry over the North and South Pacific Ocean, J. Atmos. Chem., 76, 315–326, https://doi.org/10.1007/s10874-020-09403-8, 2020.
Kreidenweis, S. M., Walcek, C. J., Feingold, G., Gong, W., Jacobson, M. Z., Kim, C. H., Liu, X., Penner, J. E., Nenes, A., and Seinfeld, J. H.: Modification of aerosol mass and size distribution due to aqueous-phase SO2 oxidation in clouds: Comparisons of several models, J. Geophys. Res.-Atmos., 108, 4213, https://doi.org/10.1029/2002JD002697, 2003.
Lamkaddam, H., Dommen, J., Ranjithkumar, A., Gordon, H., Wehrle, G., Krechmer, J., Majluf, F., Salionov, D., Schmale, J., Bjelić, S., Carslaw, K. S., Haddad, I. E., and Baltensperger, U.: Large contribution to secondary organic aerosol from isoprene cloud chemistry, Sci. Adv., 7, eabe2952, https://doi.org/10.1126/sciadv.abe2952, 2021.
Levine, J. S.: The 1997 fires in Kalimantan and Sumatra, Indonesia: Gaseous and particulate emissions, Geophys. Res. Lett., 26, 815–818, https://doi.org/10.1029/1999GL900067, 1999.
Li, J., Wang, X., Chen, J., Zhu, C., Li, W., Li, C., Liu, L., Xu, C., Wen, L., Xue, L., Wang, W., Ding, A., and Herrmann, H.: Chemical composition and droplet size distribution of cloud at the summit of Mount Tai, China, Atmos. Chem. Phys., 17, 9885–9896, https://doi.org/10.5194/acp-17-9885-2017, 2017.
Lim, Y. B., Tan, Y., and Turpin, B. J.: Chemical insights, explicit chemistry, and yields of secondary organic aerosol from OH radical oxidation of methylglyoxal and glyoxal in the aqueous phase, Atmos. Chem. Phys., 13, 8651–8667, https://doi.org/10.5194/acp-13-8651-2013, 2013.
Liu, T., Chan, A. W., and Abbatt, J. P.: Multiphase oxidation of sulfur dioxide in aerosol particles: Implications for sulfate formation in polluted environments, Environ. Sci. Technol., 55, 4227–4242, https://doi.org/10.1021/acs.est.0c06496, 2021.
Löflund, M., Kasper-Giebl, A., Schuster, B., Giebl, H., Hitzenberger, R., and Puxbaum, H.: Formic, acetic, oxalic, malonic and succinic acid concentrations and their contribution to organic carbon in cloud water, Atmos. Environ., 36, 1553–1558, https://doi.org/10.1016/S1352-2310(01)00573-8, 2002.
Lynch, P., Reid, J. S., Westphal, D. L., Zhang, J., Hogan, T. F., Hyer, E. J., Curtis, C. A., Hegg, D. A., Shi, Y., Campbell, J. R., Rubin, J. I., Sessions, W. R., Turk, F. J., and Walker, A. L.: An 11-year global gridded aerosol optical thickness reanalysis (v1.0) for atmospheric and climate sciences, Geosci. Model Dev., 9, 1489–1522, https://doi.org/10.5194/gmd-9-1489-2016, 2016.
Ma, L., Dadashazar, H., Hilario, M. R. A., Cambaliza, M. O., Lorenzo, G. R., Simpas, J. B., Nguyen, P., and Sorooshian, A.: Contrasting wet deposition composition between three diverse islands and coastal North American sites, Atmos. Environ., 244, 117919, https://doi.org/10.1016/j.atmosenv.2020.117919, 2021.
MacDonald, A. B., Hossein Mardi, A., Dadashazar, H., Azadi Aghdam, M., Crosbie, E., Jonsson, H. H., Flagan, R. C., Seinfeld, J. H., and Sorooshian, A.: On the relationship between cloud water composition and cloud droplet number concentration, Atmos. Chem. Phys., 20, 7645–7665, https://doi.org/10.5194/acp-20-7645-2020, 2020.
Mardi, A. H., Dadashazar, H., MacDonald, A. B., Crosbie, E., Coggon, M. M., Aghdam, M. A., Woods, R. K., Jonsson, H. H., Flagan, R. C., Seinfeld, J. H., and Sorooshian, A.: Effects of biomass burning on stratocumulus droplet characteristics, drizzle rate, and composition, J. Geophys. Res.-Atmos., 124, 12301–12318, https://doi.org/10.1029/2019JD031159, 2019.
Marinoni, A., Laj, P., Sellegri, K., and Mailhot, G.: Cloud chemistry at the Puy de Dôme: variability and relationships with environmental factors, Atmos. Chem. Phys., 4, 715–728, https://doi.org/10.5194/acp-4-715-2004, 2004.
Maudlin, L. C., Wang, Z., Jonsson, H. H., and Sorooshian, A.: Impact of wildfires on size-resolved aerosol composition at a coastal California site, Atmos. Environ., 119, 59–68, https://doi.org/10.1016/j.atmosenv.2015.08.039, 2015.
McNaughton, C. S., Clarke, A. D., Howell, S. G., Pinkerton, M., Anderson, B., Thornhill, L., Hudgins, C., Winstead, E., Dibb, J. E., Scheuer, E., and Maring, H.: Results from the DC-8 Inlet Characterization Experiment (DICE): Airborne versus surface sampling of mineral dust and sea salt aerosols, Aerosol Sci. Tech., 41, 136–159, https://doi.org/10.1080/02786820601118406, 2007.
Mochida, M., Umemoto, N., Kawamura, K., and Uematsu, M.: Bimodal size distribution of C2-C4 dicarboxylic acids in the marine aerosols, Geophys. Res. Lett., 30, 1672, https://doi.org/10.1029/2003gl017451, 2003.
Mochizuki, T., Kawamura, K., Yamaguchi, T., and Noguchi, I.: Distributions and sources of water-soluble organic acids in fog water from mountain site (Lake Mashu) of Hokkaido, Japan, Geochem. J., 54, 315–326, https://doi.org/10.2343/geochemj.2.0601, 2020.
Narukawa, M., Kawamura, K., Takeuchi, N., and Nakajima, T.: Distribution of dicarboxylic acids and carbon isotopic compositions in aerosols from 1997 Indonesian forest fires, Geophys. Res. Lett., 26, 3101–3104, https://doi.org/10.1029/1999gl010810, 1999.
NASA/LARC/SD/ASDC: CAMP2Ex P-3 In-Situ Cloud Data, NASA Langley Atmospheric Science Data Center DAAC [data set], https://doi.org/10.5067/Airborne/CAMP2Ex_Cloud_AircraftInSitu_P3_Data_1, 2020a.
NASA/LARC/SD/ASDC: CAMP2Ex P-3 In-Situ Aerosol Data, NASA Langley Atmospheric Science Data Center DAAC [data set], https://doi.org/10.5067/Airborne/CAMP2Ex_Aerosol_AircraftInSitu_P3_Data_1, 2020b.
Page, S. E., Siegert, F., Rieley, J. O., Boehm, H.-D. V., Jaya, A., and Limin, S.: The amount of carbon released from peat and forest fires in Indonesia during 1997, Nature, 420, 61–65, https://doi.org/10.1038/nature01131, 2002.
Pringle, K. J., Tost, H., Pozzer, A., Pöschl, U., and Lelieveld, J.: Global distribution of the effective aerosol hygroscopicity parameter for CCN activation, Atmos. Chem. Phys., 10, 5241–5255, https://doi.org/10.5194/acp-10-5241-2010, 2010.
PSA: Highlights of the Philippine population 2015 census of population, available at: https://psa.gov.ph/content/highlights-philippine-population-2015-census-population, last access: 7 January 2016.
Raja, S., Raghunathan, R., Yu, X.-Y., Lee, T., Chen, J., Kommalapati, R. R., Murugesan, K., Shen, X., Qingzhong, Y., Valsaraj, K. T., and Collett Jr., J. L.: Fog chemistry in the Texas–Louisiana gulf coast corridor, Atmos. Environ., 42, 2048–2061, https://doi.org/10.1016/j.atmosenv.2007.12.004, 2008.
Raja, S., Raghunathan, R., Kommalapati, R. R., Shen, X., Collett Jr., J. L., and Valsaraj, K. T.: Organic composition of fogwater in the Texas–Louisiana gulf coast corridor, Atmos. Environ., 43, 4214–4222, https://doi.org/10.1016/j.atmosenv.2009.05.029, 2009.
Reid, J. S., Hobbs, P. V., Ferek, R. J., Blake, D. R., Martins, J. V., Dunlap, M. R., and Liousse, C.: Physical, chemical, and optical properties of regional hazes dominated by smoke in Brazil, J. Geophys. Res.-Atmos., 103, 32059–32080, https://doi.org/10.1029/98jd00458, 1998.
Reid, J. S., Hyer, E. J., Johnson, R. S., Holben, B. N., Yokelson, R. J., Zhang, J., Campbell, J. R., Christopher, S. A., Di Girolamo, L., Giglio, L., Holz, R. E., Kearney, C., Miettinen, J., Reid, E. A., Turk, F. J., Wang, J., Xian, P., Zhao, G., Balasubramanian, R., Chew, B. N., Janjai, S., Lagrosas, N., Lestari, P., Lin, N.-H., Mahmud, M., Nguyen, A. X., Norris, B., Oanh, N. T. K., Oo, M., Salinas, S. V., Welton, E. J., and Liew, S. C.: Observing and understanding the Southeast Asian aerosol system by remote sensing: An initial review and analysis for the Seven Southeast Asian Studies (7SEAS) program, Atmos. Res., 122, 403–468, https://doi.org/10.1016/j.atmosres.2012.06.005, 2013.
Reid, J. S., Lagrosas, N. D., Jonsson, H. H., Reid, E. A., Sessions, W. R., Simpas, J. B., Uy, S. N., Boyd, T. J., Atwood, S. A., Blake, D. R., Campbell, J. R., Cliff, S. S., Holben, B. N., Holz, R. E., Hyer, E. J., Lynch, P., Meinardi, S., Posselt, D. J., Richardson, K. A., Salinas, S. V., Smirnov, A., Wang, Q., Yu, L., and Zhang, J.: Observations of the temporal variability in aerosol properties and their relationships to meteorology in the summer monsoonal South China Sea/East Sea: the scale-dependent role of monsoonal flows, the Madden–Julian Oscillation, tropical cyclones, squall lines and cold pools, Atmos. Chem. Phys., 15, 1745–1768, https://doi.org/10.5194/acp-15-1745-2015, 2015.
Reid, J. S., Xian, P., Holben, B. N., Hyer, E. J., Reid, E. A., Salinas, S. V., Zhang, J., Campbell, J. R., Chew, B. N., Holz, R. E., Kuciauskas, A. P., Lagrosas, N., Posselt, D. J., Sampson, C. R., Walker, A. L., Welton, E. J., and Zhang, C.: Aerosol meteorology of the Maritime Continent for the 2012 7SEAS southwest monsoon intensive study – Part 1: regional-scale phenomena, Atmos. Chem. Phys., 16, 14041–14056, https://doi.org/10.5194/acp-16-14041-2016, 2016.
Reyes-Rodríguez, G. J., Gioda, A., Mayol-Bracero, O. L., and Collett Jr., J.: Organic carbon, total nitrogen, and water-soluble ions in clouds from a tropical montane cloud forest in Puerto Rico, Atmos. Environ., 43, 4171–4177, https://doi.org/10.1016/j.atmosenv.2009.05.049, 2009.
Rinaldi, M., Decesari, S., Carbone, C., Finessi, E., Fuzzi, S., Ceburnis, D., O'Dowd, C. D., Sciare, J., Burrows, J. P., Vrekoussis, M., Ervens, B., Tsigaridis, K., and Facchini, M. C.: Evidence of a natural marine source of oxalic acid and a possible link to glyoxal, J. Geophys. Res.-Atmos., 116, D16204, https://doi.org/10.1029/2011JD015659, 2011.
Rogge, W. F., Mazurek, M. A., Hildemann, L. M., Cass, G. R., and Simoneit, B. R. T.: Quantification of urban organic aerosols at a molecular level: Identification, abundance and seasonal variation, Atmos. Environ. A-Gen., 27, 1309–1330, https://doi.org/10.1016/0960-1686(93)90257-y, 1993.
Rolph, G., Stein, A., and Stunder, B.: Real-time Environmental Applications and Display sYstem: READY, Environ. Modell. Softw., 95, 210–228, https://doi.org/10.1016/j.envsoft.2017.06.025, 2017.
Saltzman, E. S., Savoie, D. L., Zika, R. G., and Prospero, J. M.: Methane sulfonic acid in the marine atmosphere, J. Geophys. Res.-Oceans, 88, 10897–10902, https://doi.org/10.1029/JC088iC15p10897, 1983.
Seinfeld, J. H. and Pandis, S. N.: Atmospheric Chemistry and Physics, 3rd Edn., Wiley-Interscience, New York, NY, 2016.
Shen, X.: Aqueous Phase Sulfate Production in Clouds at Mt. Tai in Eastern China, PhD, Atmospheric Science, Colorado State University, Fort Collins, 193 pp., 2011.
Shingler, T., Dey, S., Sorooshian, A., Brechtel, F. J., Wang, Z., Metcalf, A., Coggon, M., Mülmenstädt, J., Russell, L. M., Jonsson, H. H., and Seinfeld, J. H.: Characterisation and airborne deployment of a new counterflow virtual impactor inlet, Atmos. Meas. Tech., 5, 1259–1269, https://doi.org/10.5194/amt-5-1259-2012, 2012.
Sorooshian, A., Varutbangkul, V., Brechtel, F. J., Ervens, B., Feingold, G., Bahreini, R., Murphy, S. M., Holloway, J. S., Atlas, E. L., Buzorius, G., Jonsson, H., Flagan, R. C., and Seinfeld, J. H.: Oxalic acid in clear and cloudy atmospheres: Analysis of data from International Consortium for Atmospheric Research on Transport and Transformation 2004, J. Geophys. Res.-Atmos., 111, D23S45, https://doi.org/10.1029/2005jd006880, 2006.
Sorooshian, A., Crosbie, E., Maudlin, L. C., Youn, J. S., Wang, Z., Shingler, T., Ortega, A. M., Hersey, S., and Woods, R. K.: Surface and airborne measurements of organosulfur and methanesulfonate over the Western United States and coastal areas, J. Geophys. Res.-Atmos., 120, 8535–8548, https://doi.org/10.1002/2015JD023822, 2015.
Stahl, C., Cruz, M. T., Bañaga, P. A., Betito, G., Braun, R. A., Aghdam, M. A., Cambaliza, M. O., Lorenzo, G. R., MacDonald, A. B., Hilario, M. R. A., Pabroa, P. C., Yee, J. R., Simpas, J. B., and Sorooshian, A.: Sources and characteristics of size-resolved particulate organic acids and methanesulfonate in a coastal megacity: Manila, Philippines, Atmos. Chem. Phys., 20, 15907–15935, https://doi.org/10.5194/acp-20-15907-2020, 2020.
Stefan, M. I., Hoy, A. R., and Bolton, J. R.: Kinetics and mechanism of the degradation and mineralization of acetone in dilute aqueous solution sensitized by the UV photolysis of hydrogen peroxide, Environ. Sci. Technol., 30, 2382–2390, https://doi.org/10.1021/es950866i, 1996.
Stein, A. F., Draxler, R. R., Rolph, G. D., Stunder, B. J. B., Cohen, M. D., and Ngan, F.: NOAA's HYSPLIT Atmospheric Transport and Dispersion Modeling System, B. Am. Meteorol. Soc., 96, 2059–2077, https://doi.org/10.1175/bams-d-14-00110.1, 2015.
Stockwell, C. E., Jayarathne, T., Cochrane, M. A., Ryan, K. C., Putra, E. I., Saharjo, B. H., Nurhayati, A. D., Albar, I., Blake, D. R., Simpson, I. J., Stone, E. A., and Yokelson, R. J.: Field measurements of trace gases and aerosols emitted by peat fires in Central Kalimantan, Indonesia, during the 2015 El Niño, Atmos. Chem. Phys., 16, 11711–11732, https://doi.org/10.5194/acp-16-11711-2016, 2016.
Straub, D. J., Lee, T., and Collett Jr., J. L.: Chemical composition of marine stratocumulus clouds over the eastern Pacific Ocean, J. Geophys. Res.-Atmos., 112, D04307, https://doi.org/10.1029/2006JD007439, 2007.
Straub, D. J., Hutchings, J. W., and Herckes, P.: Measurements of fog composition at a rural site, Atmos. Environ., 47, 195–205, https://doi.org/10.1016/j.atmosenv.2011.11.014, 2012.
Straub, D. J.: Radiation fog chemical composition and its temporal trend over an eight year period, Atmos. Environ., 148, 49–61, https://doi.org/10.1016/j.atmosenv.2016.10.031, 2017.
Sullivan, R. C. and Prather, K. A.: Investigations of the diurnal cycle and mixing state of oxalic acid in individual particles in Asian aerosol outflow, Environ. Sci. Technol., 41, 8062–8069, https://doi.org/10.1021/es071134g, 2007.
Talbot, R., Beecher, K., Harriss, R., and11 Cofer III, W.: Atmospheric geochemistry of formic and acetic acids at a mid-latitude temperate site, J. Geophys. Res.-Atmos., 93, 1638–1652, https://doi.org/10.1029/JD093iD02p01638, 1988.
Tan, Y., Carlton, A. G., Seitzinger, S. P., and Turpin, B. J.: SOA from methylglyoxal in clouds and wet aerosols: Measurement and prediction of key products, Atmos. Environ., 44, 5218–5226, https://doi.org/10.1016/j.atmosenv.2010.08.045, 2010.
Thomas, D. A., Coggon, M. M., Lignell, H., Schilling, K. A., Zhang, X., Schwantes, R. H., Flagan, R. C., Seinfeld, J. H., and Beauchamp, J. L.: Real-time studies of iron oxalate-mediated oxidation of glycolaldehyde as a model for photochemical aging of aqueous tropospheric aerosols, Environ. Sci. Technol., 50, 12241–12249, https://doi.org/10.1021/acs.est.6b03588, 2016.
Tsai, Y. I., Sopajaree, K., Chotruksa, A., Wu, H.-C., and Kuo, S.-C.: Source indicators of biomass burning associated with inorganic salts and carboxylates in dry season ambient aerosol in Chiang Mai Basin, Thailand, Atmos. Environ., 78, 93–104, https://doi.org/10.1016/j.atmosenv.2012.09.040, 2013.
Turekian, V. C., Macko, S. A., and Keene, W. C.: Concentrations, isotopic compositions, and sources of size-resolved, particulate organic carbon and oxalate in near-surface marine air at Bermuda during spring, J. Geophys. Res.-Atmos., 108, 4157, https://doi.org/10.1029/2002JD002053, 2003.
Turpin, B. J. and Lim, H.-J.: Species contributions to PM2.5 mass concentrations: Revisiting common assumptions for estimating organic mass, Aerosol Sci. Tech., 35, 602–610, https://doi.org/10.1080/02786820119445, 2001.
Wang, J., Ge, C., Yang, Z., Hyer, E. J., Reid, J. S., Chew, B.-N., Mahmud, M., Zhang, Y., and Zhang, M.: Mesoscale modeling of smoke transport over the Southeast Asian Maritime Continent: Interplay of sea breeze, trade wind, typhoon, and topography, Atmos. Res., 122, 486–503, https://doi.org/10.1016/j.atmosres.2012.05.009, 2013.
Wang, Y., Zhuang, G., Chen, S., An, Z., and Zheng, A.: Characteristics and sources of formic, acetic and oxalic acids in PM2.5 and PM10 aerosols in Beijing, China, Atmos. Res., 84, 169–181, https://doi.org/10.1016/j.atmosres.2006.07.001, 2007.
Wang, Y., Guo, J., Wang, T., Ding, A., Gao, J., Zhou, Y., Collett Jr., J. L., and Wang, W.: Influence of regional pollution and sandstorms on the chemical composition of cloud/fog at the summit of Mt. Taishan in northern China, Atmos. Res., 99, 434–442, https://doi.org/10.1016/j.atmosres.2010.11.010, 2011.
Xian, P., Reid, J. S., Atwood, S. A., Johnson, R. S., Hyer, E. J., Westphal, D. L., and Sessions, W.: Smoke aerosol transport patterns over the Maritime Continent, Atmos. Res., 122, 469–485, https://doi.org/10.1016/j.atmosres.2012.05.006, 2013.
Yang, F., Gu, Z., Feng, J., Liu, X., and Yao, X.: Biogenic and anthropogenic sources of oxalate in PM2.5 in a mega city, Shanghai, Atmos. Res., 138, 356–363, https://doi.org/10.1016/j.atmosres.2013.12.006, 2014.
Yao, L., Yang, L., Chen, J., Wang, X., Xue, L., Li, W., Sui, X., Wen, L., Chi, J., and Zhu, Y.: Characteristics of carbonaceous aerosols: Impact of biomass burning and secondary formation in summertime in a rural area of the North China Plain, Sci. Total Environ., 557–558, 520–530, https://doi.org/10.1016/j.scitotenv.2016.03.111, 2016.
Youn, J.-S., Crosbie, E., Maudlin, L., Wang, Z., and Sorooshian, A.: Dimethylamine as a major alkyl amine species in particles and cloud water: Observations in semi-arid and coastal regions, Atmos. Environ., 122, 250–258, https://doi.org/10.1016/j.atmosenv.2015.09.061, 2015.
Yuan, H., Wang, Y., and Zhuang, G.: MSA in Beijing aerosol, Chinese Sci. Bull., 49, 1020-1025, https://doi.org/10.1007/bf03184031, 2004.
Zhang, Q. and Anastasio, C.: Chemistry of fog waters in California's Central Valley – Part 3: concentrations and speciation of organic and inorganic nitrogen, Atmos. Environ., 35, 5629–5643, https://doi.org/10.1016/S1352-2310(01)00337-5, 2001.
Zhang, Q., Worsnop, D. R., Canagaratna, M. R., and Jimenez, J. L.: Hydrocarbon-like and oxygenated organic aerosols in Pittsburgh: insights into sources and processes of organic aerosols, Atmos. Chem. Phys., 5, 3289–3311, https://doi.org/10.5194/acp-5-3289-2005, 2005.
Ziemba, L. D., Griffin, R. J., Whitlow, S., and Talbot, R. W.: Characterization of water-soluble organic aerosol in coastal New England: Implications of variations in size distribution, Atmos. Environ., 45, 7319–7329, https://doi.org/10.1016/j.atmosenv.2011.08.022, 2011.