the Creative Commons Attribution 4.0 License.
the Creative Commons Attribution 4.0 License.
 | 02 Feb 2021
Measurement report: aerosol hygroscopic properties extended to 600 nm in the urban environment
Chuanyang Shen
Gang Zhao
Weilun Zhao
Ping Tian
Chunsheng Zhao
Submicron particles larger than 300 nm dominate the aerosol light extinction and mass concentration in the atmosphere. The water uptake ability of this size range greatly influences the particle mass, visibility degradation, and particle chemistry. However, most previous field measurements on aerosol hygroscopicity are limited within 350 nm. In this study, the size-resolved aerosol hygroscopic properties over an extended size range (50–600 nm) at 85 % relative humidity were investigated in Beijing winter from 27 November 2019 to 14 January 2020 using a humidity tandem differential mobility analyzer (HTDMA) instrument. The corresponding aerosol optical properties were also analyzed using the Mie scattering theory. Results show that the averaged probability distribution of growth factor (GF-PDF) is generally constituted by a more hygroscopic (MH) group and a less hygroscopic (LH) group (including hydrophobic). For the particles larger than 300 nm, there exists a large fraction of LH group particles, resulting in an unexpected low hygroscopicity. During the development of pollution, when particles are gradually aged and accumulated, the bulk hygroscopicity above 300 nm is enhanced significantly by the growth and expansion of the MH group. This result is supported by previous chemical composition analysis, and we give more direct and detailed evidence from the growth factor and mixing-state aspects. Our calculations indicate that the optical contribution of particles larger than 300 nm constitutes about two-thirds of the total aerosol extinction. The large hygroscopic variation in aerosols above 300 nm will influence the light degradation comparably with the increase in aerosol loading in low-visibility haze events. Our studies highlight that the hygroscopic properties above 300 nm are complex and vary greatly with different pollution stages. Therefore more field measurements and investigations need to be done in the future.
- Article
(2465 KB) - Full-text XML
- BibTeX
- EndNote


Aerosol particles can scatter and absorb solar radiation and act as cloud condensation nuclei in the atmosphere. Through these effects, they can influence the radiative balance of the Earth–atmosphere system (Twomey, 1974; Albrecht, 1989; Charlson et al., 1992; Penner et al., 2001; Lohmann and Feichter, 2005; Haywood and Boucher, 2000). They can also impact human life by degrading environmental visibility and respiratory health (Ibald-Mulli et al., 2002; Peters et al., 1997; Chang et al., 2009). All these effects can be largely enhanced by aerosol's hygroscopic property (Kreidenweis and Asa-Awuku, 2014), which is the ability to absorb water under elevated relative humidity (RH). The particle's water uptake property, which is mainly related to the water-soluble materials it contains, determines aerosol liquid water content, affects the multiphase chemistry and local photochemistry, and facilitates particle formation and aging processes (Wu et al., 2018). Thus, a thorough understanding of aerosol hygroscopicity is crucial to quantify all these effects.
So far, while many field measurements on aerosol hygroscopicity have been carried out worldwide using a hygroscopicity tandem differential mobility analyzer (HTDMA) (Massling et al., 2009; Park et al., 2009; Hersey et al., 2011; Kitamori et al., 2009; Martin et al., 2011), cloud condensation nuclei counter (CCNC) (Deng et al., 2013; Ma et al., 2016; Tao et al., 2018), and optical humidified measurements (f(RH)) (Carrico et al., 2000; Zieger et al., 2010; Yan et al., 2009; Fitzgerald et al., 1982; Kuang et al., 2015), detailed hygroscopic properties over large sizes (>300 nm) are still very scarce. CCNC can give an estimate of bulk aerosol hygroscopicity under different supersaturations. Because of the supersaturation limits, it mostly reveals a hygroscopicity property within 200 nm and cannot provide direct size-resolved or mixing-state information (Roberts and Nenes, 2005). The f(RH) measures the humidity-dependent scattering coefficient over the whole size range. It focuses more on the hygroscopicity of sizes that contribute more to the bulk optical properties (Kuang et al., 2018) and cannot give size information or mixing states either. HTDMA is a widely used instrument to obtain the size-resolved growth factor of aerosol particles under different RH and has been applied to many field measurements to obtain aerosol bulk hygroscopicity as well as mixing-state information. However, most of these field studies were limited within the size range of 300 nm (Swietlicki et al., 2008)
For the submicron aerosols in the urban environment, especially areas suffering from severe haze pollution and affected by intensive anthropogenic activities, the particles larger than 300 nm contribute significantly to the particle mass and surface concentration (Lundgren and Paulus, 2012; Sverdrup and Whitby, 1977), liquid water content (Bian et al., 2014), and optical properties (Ouimette and Flagan, 1982; Kuang et al., 2018). For the submicron particles, although the number distribution is dominated by particles smaller than 0.1 µm, most of the surface area is in the 0.1–0.5 µm size range (Seinfeld and Pandis, 2006). The aerosol mass distribution peaks at an even higher size range of about 0.2–1 µm. Moreover, light scattering is usually approximately proportional to aerosol volume or mass (Pinnick et al., 1980), which means that the light degradation by aerosol particles is also concentrated at a relatively larger accumulation size. Ma et al. (2012) demonstrated that the aerosol particles between 200 nm and 1 µm usually contribute more than 80 % to light extinction at 550 nm during summer on the North China Plain (NCP). Shen et al. (2018) also presented that in the fog processes, many of the small fog droplets (<6 µm) came from submicron particles larger than 300 nm, and these particles greatly influence the fog microphysics and visibility. In the pollution period, the enhanced particle growth by coagulation and condensation of vapors, aerosol size distribution will shift to larger diameters. The aerosol mass and optical extinction contributed by the larger accumulation-mode particles will also be increased. When exposed to a high RH, these factors can be further enhanced with the addition of water. Considering the dominant contribution of this part to aerosol optical properties, it is necessary to study the detailed hygroscopic properties over extended size range and investigate its variation during different pollution conditions.
Some previous studies have tried to derive the hygroscopicity in a larger accumulation size above 300 nm. However, there are no direct evidence and measurements supporting their assumptions or parameterization schemes. Kuang et al. (2017) calculated the equivalent aerosol hygroscopicity parameter κ from f(RH) curves (κf(RH)) measured at Wangdu on the NCP, and the results lied between 0.06 and 0.51, presenting a very large variation range. Because the light scattering is mostly contributed by particles at a larger accumulation size, κf(RH) can generally represent the hygroscopicity in this size range. Liu et al. (2014) also derived the hygroscopicity over a larger size range from 30 nm to 4 µm from chemical composition and found that κ values vary relatively less for particles between 250 nm and 1 µm than particles smaller than 250 nm. Chen et al. (2012) assumed that particles in each aerosol mode had the same hygroscopicity and then estimated size-resolved κ for aerosols with diameters from 3 nm to 10 µm based on the contribution of each mode to specific particle size. However, all these estimations are indirect methods and have some unproven assumptions.
Beijing, one of the biggest cities in China and the world, is a densely populated area with severe particle pollution. Representative of the urban environment, the consumption of fossil fuels is quite considerable, and a lot of pollutants are emitted into the atmosphere every day. Exacerbated by meteorological conditions, these pollutants are readily trapped in the local region, go through a series of physical and chemical processes, and finally evolve into severe haze events (Guo et al., 2014; Sun et al., 2014; Jiang et al., 2015; Ye et al., 2016; Su et al., 2018, 2020). Influenced by the particle pollution and strong hygroscopic growth of aerosol particles, visibility degradation is also a frequent and urgent environmental problem. Based on this condition, many field measurements focusing on the particles' microphysical properties, including hygroscopicity, were conducted in Beijing and the surrounding region. Massling et al. (2009) used a custom-made HTDMA to measure the hygroscopic properties of ambient particles in Beijing and reported the corresponding measurement results. The Haze in China (HaChi) campaign also investigated aerosol particles' various microphysical properties, including cloud condensation nuclei (CCN) activity, optical enhancement factor, and hygroscopic growth properties under high humidity (Deng et al., 2011; Liu et al., 2011, 2014; Chen et al., 2014; Shen et al., 2018). Wang et al. (2018) conducted statistical analysis and proposed parameterization of the hygroscopic growth of urban aerosol (50–350 nm) in Beijing from the long-term measurement. However, there are no direct measurements focusing on the size range larger than 350 nm.
In this study, we deployed an HTDMA instrument to our laboratory in Beijing to conduct aerosol hygroscopicity measurements from 27 November 2019 to 14 January 2020. Other particle microphysical properties, optical properties, and meteorology parameters were also monitored simultaneously. Three questions need to be answered here: (1) what are the basic characteristics of aerosol hygroscopicity over an extended size range in the urban environment, (2) how do the hygroscopic properties vary with pollution conditions, and (3) how does the variation influence the visibility degradation? In the following, Sect. 2 describes the data and methods used in this study; Sect. 3 presents the measurement results, including overall aerosol hygroscopicity and its daily variations; Sect. 4 shows the hygroscopic variation under different pollution conditions and potential impacts; and the last section presents the conclusions.
2.1 Measurement site
The measurement was conducted in the aerosol laboratory, which is located on the rooftop of a six-floor building on the campus of Peking University (39∘59′ N, 116∘18′ E). The sampling site is in the northwest of Beijing, surrounded by schools, residential buildings, and shopping centers. Moreover, there are two main streets: Zhongguancun North Street is located to the west, and Chengfu Road is to the south. Except for the road traffic, there are no large emission sources in the neighboring area. Aerosol particles here are representative of the urban environments. The site is in the GMT + 8 time zone. All times in the paper are reported as GMT +08:00.More details can be found in Zhao et al. (2018).
In the measurement, a PM10 impactor was used to remove aerosol particles with aerodynamic diameters larger than 10 µm. Then a dryer was used to decrease the RH to less than 30 %. Next, the dried poly-disperse particles were guided into a splitter with different instruments located downstream. From 27 November 2019 to 14 January 2020, aerosol number size distributions, size-resolved hygroscopicity, and optical properties including scattering and absorption coefficients were measured. Meteorological parameters like temperature, wind speed, wind direction, and RH were also monitored at this site.

Figure 1Frequency distribution of (a) aerosol number size distribution during the whole measurement period, (b) corresponding volume size distribution, and (c) size-resolved light extinction coefficient contribution calculated from Mie theory. The red lines in (a)–(c) represent the mean values. The lines with marks in (c) denote the hygroscopicity measurement by HTDMA in previous studies and our studies.
2.2 Instrumentation and data
A BMI humidified tandem differential mobility analyzer (BMI HTDMA, Model 3100) was mainly used in this study. The detailed instrument description and performance evaluation have been introduced in the previous publication (Lopez-Yglesias et al., 2014). Similar to other conventional HTDMA systems, this instrument mainly incorporates an upstream differential mobility analyzer (DMA1), a humidification system that offers humidified sheath air to the humidifier and downstream DMA to expose the particles to a prescribed RH, and a downstream DMA (DMA2) in series with a mixing condensation particle counter (BMI MCPC, Model 1720) to measure the particles' size distribution after water uptake. Unique features of this BMI HTDMA include a diffusion-based particle humidifier, a DMA design allowing selection of particles up to 2 µm diameter at only 5600 volts, and the ability to study the complete deliquescence and efflorescence cycle. It also offers processing software to do the corrections and data inversion, which transforms the raw measured counts to the particle's growth factor distribution.
During the measurement, the RH of the second DMA was set to be 85 %. The dry diameters selected by DMA1 were 50, 100, 200, 300, 400, 500, and 600 nm. In the calibration of the measurement system, ammonium sulfate particles were also tested to compare with the theoretical values. The calibration includes both the dry test and the RH test. The temperature and RH in the humidifier and DMA2 sheath were recorded in real time for a later check of system stability. For the best-working performance, the room was air-conditioned at 25 ∘C and circulated all the time.
The hygroscopic diameter growth factor (GF) is the ratio of the particle wet diameter at a given RH to the dry diameter:
Growth factor probability distribution function (GF-PDF, c(GF)) is normalized to unity. In order to simplify parameterization and better compare the aerosol hygroscopic properties among different measurements, the hygroscopicity parameter κ was also calculated in this study (Petters and Kreidenweis, 2007). It can be calculated from the following equation:
where σs∕a is the droplet surface tension, Mw is the molecular weight of water, ρw is the density of liquid water, R is the universal gas constant, and T is the absolute temperature.
The κ-PDF can also be derived from the GF-PDF. The volume-weighted mean growth factor is defined as the third-moment mean value of the GF-PDF, , and it can be directly used to calculate the total liquid water content of all particles at a specific size. The corresponding mean hygroscopic parameter κmean can be calculated from GFmean using Eq. (2). To better understand the mixing state of particles and group them in terms of hygroscopic properties, we classify the particles into a less hygroscopic group with GF lower than 1.2 and a more hygroscopic group with GF larger than 1.2. For each group, the number fraction, GFmean, and standard deviation σ can be determined from the GF-PDF.
Apart from HTDMA, the aerosol light scattering coefficients at three wavelengths (450, 525, and 635 nm) were measured using an Aurora 3000 nephelometer. The particle number size distribution (PNSD) was measured simultaneously by a BMI scanning electrical mobility sizer (BMI SEMS, Model 2100) and a TSI scanning mobility particle sizer (SMPS). The BMI SEMS measures PNSD with a time resolution of 10 min over the size range of 10–1000 nm. The SMPS has a time resolution of 5 min and covers the size from 10–600 nm. The black carbon (BC) mass concentrations were measured using an MA200 (Aethlabs, serial number 0083) at 1 min temporal resolution.
3.1 Overview of GF and κ distribution
The aerosol number size distributions during the whole measurement period are summarized in Fig. 1a. We also summarize some previous studies on urban aerosol hygroscopicity from HTDMA measurements and present statistical results in Fig. 1c. The reference can be found in Table 1. We can clearly see that in Beijing winter, the peak contribution to the surface area is 200–300 nm and to the mass is 300–400 nm. For optical light extinction coefficients at 550 nm, the peak diameter is around 400–500 nm. However, the focuses of previous HTDMA measurements are only around 50–300 nm. It is this dislocation that prompts us to conduct hygroscopicity measurements over an extended size range and investigate the potential impacts on aerosol optical properties.
Table 1Summary of previous HTDMA measurement of urban aerosol particles.
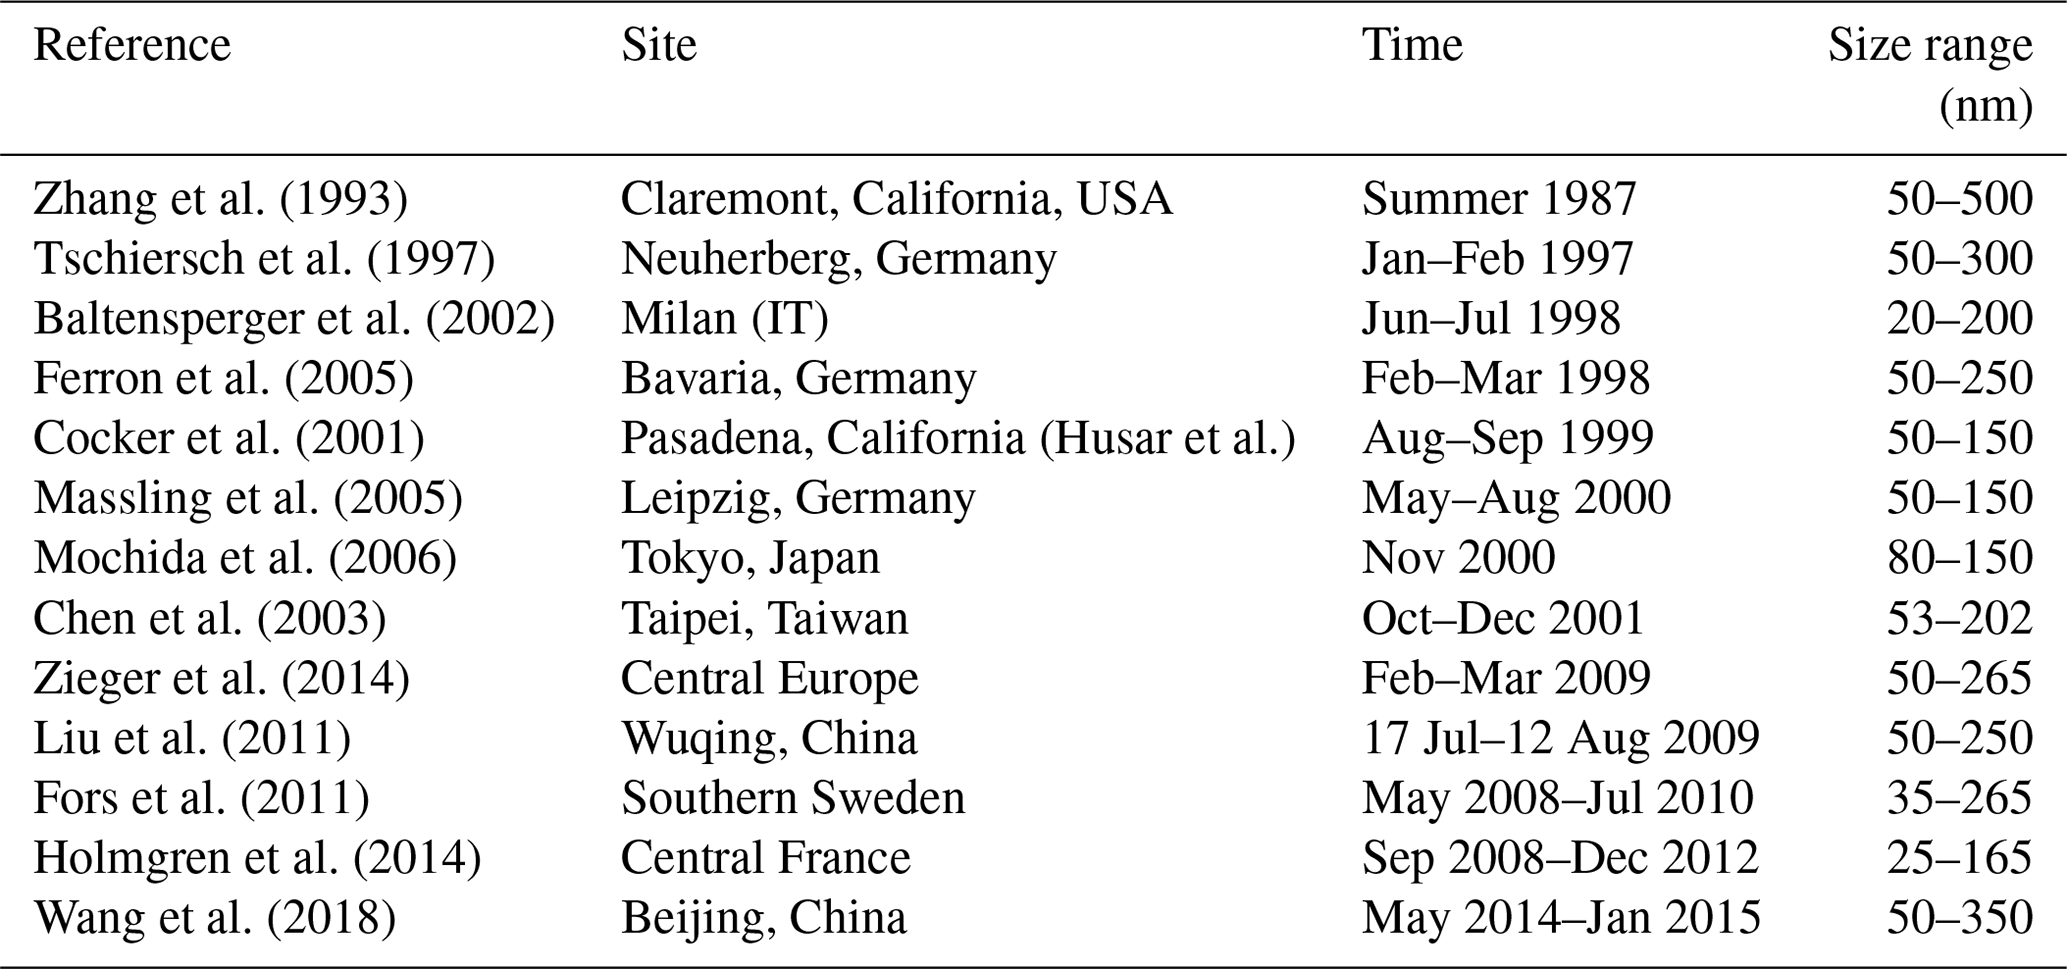
Figure 2 gives an overview of the average GF-PDF and the corresponding κ-PDF during the whole measurement period. It can be seen that the mean growth factor distributions for all sizes show a distinct bi-modal pattern, consisting of a less hygroscopic mode and a more hygroscopic mode. For particles of 50 nm, the less hygroscopic (LH) and more hygroscopic (MH) modes cannot be clearly distinguished from each other. In general, particles of this size are not readily hygroscopic. For the size range between 100 and 400 nm, there exists a dominant MH group and a minor but distinct LH group. The peak of the MH group shifts significantly from about 1.2–1.4 to 1.4–1.6 as the size increases, indicating that the water-soluble or water uptake materials in larger sizes have a relatively stronger hygroscopicity than the smaller sizes. In contrast, the peak of the LH group barely shifts. The number fraction of the LH group decreases with size when particles are smaller than 200 nm, whereas it increases with size when the size exceeds 200 nm. The spread (stand deviation) of the LH group has the same trend. For the particles larger than 400 nm, the LH group dominates the number fraction, resulting in the decrease in bulk hygroscopicity of large particles. Similar to the GF-PDF, κ-PDF also presents two modes corresponding to the LH and MH groups.
In general, our results are consistent with Wang et al. (2018) for the overlap region of 50–350 nm. We can also see a stronger fraction of the nearly hydrophobic group with size in lower- and moderate-pollution conditions in their study. This trend is captured by our results and further extended to a larger size above 350 nm. Massling et al. (2009) also reported a similar trend of increasing hydrophobic particles with size in winter. They also gave the size-resolved chemical composition across the submicron size range. For particles larger than 300 nm, there is an increased mass ratio of elemental carbon and undefined mass, which may correspond to this increased group of particles. The size-resolved κ in Liu et al. (2014) is different from our results in the overlap region because their measurements were done in summer, in which the emissions and particle photochemistry are quite different from those in winter. An apparent difference is the missing nearly hydrophobic group in accumulation-mode particles, which is the main cause of the decreased hygroscopicity above 300 nm in our study.

Figure 2Averaged probability distribution functions of (a) growth factor and (b) hygroscopicity parameter κ. The black lines in these two figures represent the ensemble mean values.
Table 2Summary of the HTDMA measurements of hygroscopic growth at 85 % RH.
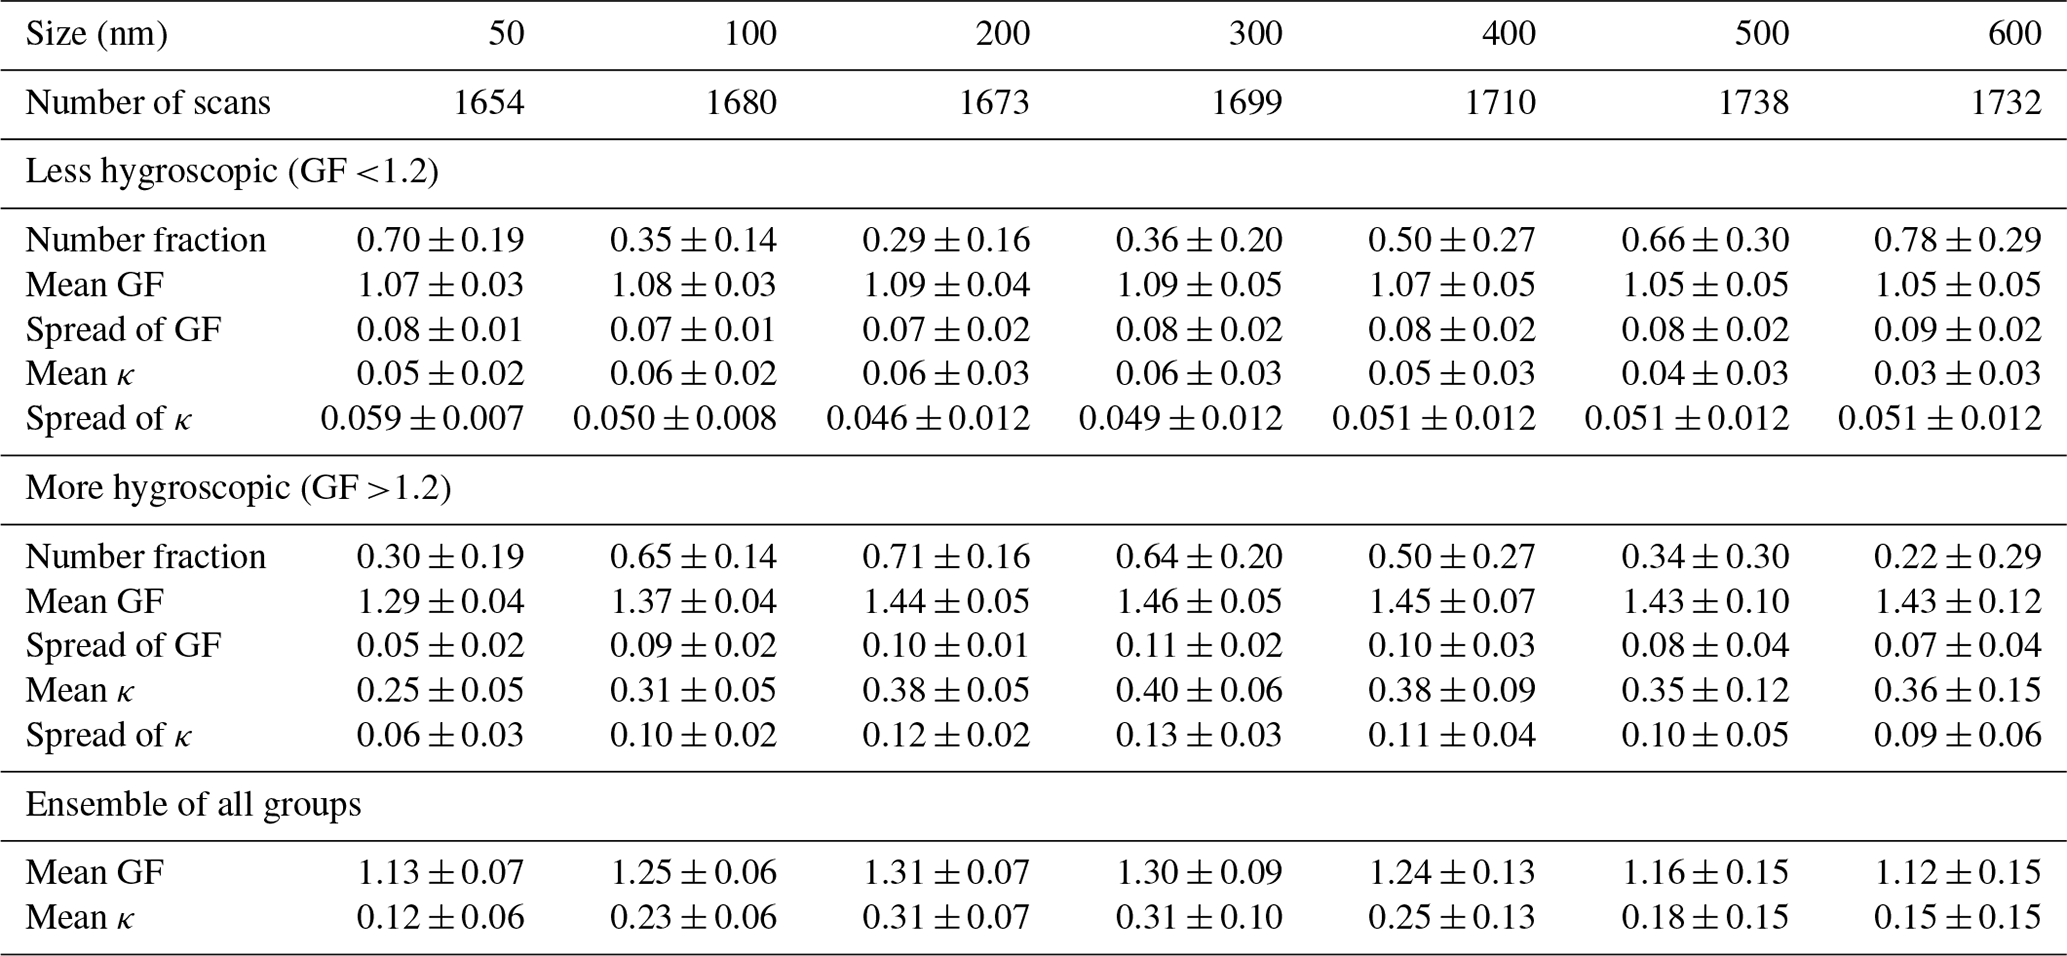
The statistics of the HTDMA measurement are summarized in Table 2. The number fraction, mean GF and mean κ, spread of GF, and κ for the LH and MH groups during the whole measurement period are calculated. Corresponding standard deviations are also presented in the table. The mean GF values for 50, 100, 200, 300, 400, 500, and 600 nm are 1.13 ± 0.07, 1.25 ± 0.06, 1.31 ± 0.07, 1.30 ± 0.08, 1.24 ± 0.12, 1.16 ± 0.14, and 1.12 ± 0.16, respectively. The number fraction of LH group particles reaches a trough at 200 nm and then increases with size. The ensemble mean κ peaks at 300 nm and then decreases with size, which is related to the increase in LH group number fraction.
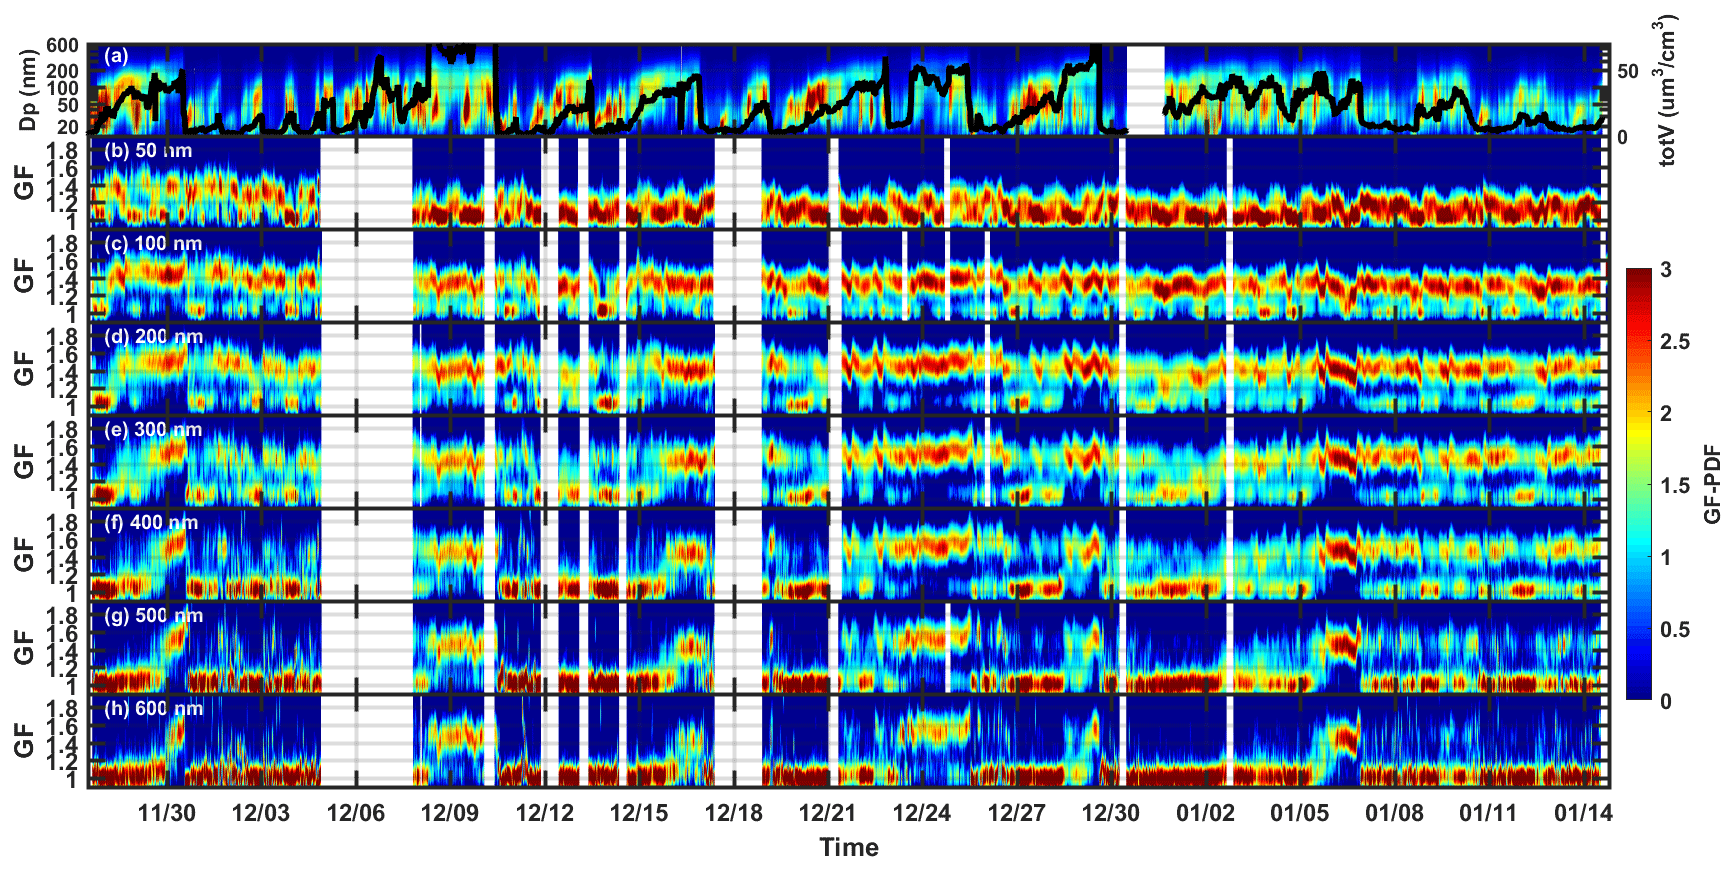
Figure 3Temporal evolutions of (a) particle number size distribution and integrated volume concentration (black line), (b)–(h) growth factor probability distributions over different sizes from 50–600 nm. The color contour in (a) denotes the particle number concentration (dn∕dlogDp (cm−3)) and in (b)–(h) denotes the growth factor probability distribution function. The y axis of (a) is particle diameter in log-scale.
3.2 Time series and diurnal variation
The time series of aerosol size distribution and growth factor distribution over different sizes are shown in Fig. 3. The black line in panel (a) is the time-dependent volume concentrations calculated from particle number size distribution. This value can generally represent the particle pollution level. As elucidated by Guo et al. (2014), the PM episodes in Beijing present a periodic cycle governed by meteorological conditions. This kind of cycle lasts from 3 d to 1 week, causing different degrees of pollution. Our measurement captured about six pollution cycles. Because the sampling was done at a fixed site, the complete cycle may go interrupted by transport or local physical or chemical processes. Nevertheless, the measured aerosol properties from 27 November 2019 to 14 January 2020 can still be representative of the typical winter conditions in Beijing. The blank area in the figure denotes missing data, which is caused by the instrument shutdown or measurement calibration.
From Fig. 3a, we can see that the particle number concentration usually has an abrupt increase at the beginning of a pollution cycle. Then the volume or mass concentration begins to develop and increase to a high level. During the clean period, the wind is often dominated by strong northwest or northeast winds because it can bring unpolluted air masses from the northern mountainous area. Polluted days are often accompanied by a weak southerly wind. Furthermore, high relative humidity tends to appear at the end of each pollution cycle, which may help to push the pollution level to a peak (Fig. 8).
For each pollution cycle, we can see from Fig. 3b–c that the GF-PDF of 50 and 100 nm particles does not have large variations. But for other sizes, an increase in growth factor along with the pollution development can be clearly seen from the GF-PDF contour. Different sizes have different lag time to respond to the evolution of pollution: the larger the size, the more time needed to change the hygroscopic properties.
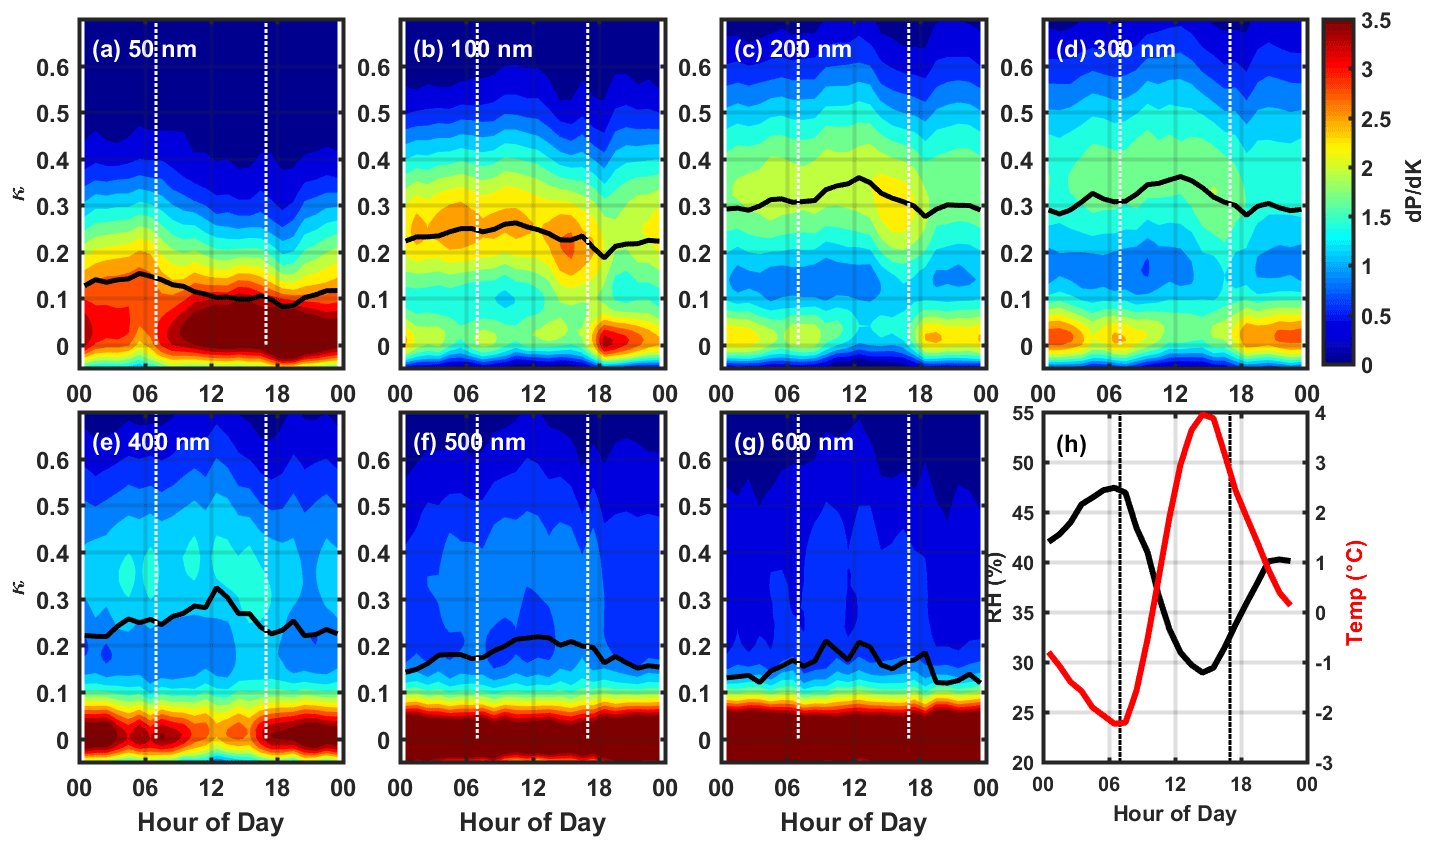
Figure 4Diurnal variations in aerosol hygroscopicity distribution function over different sizes from 50–600 nm. Panel (h) shows the mean diurnal temperature and relative humidity. The black lines in (a)–(g) are the mean hygroscopicity calculated from the average κ-PDF. The dotted vertical lines in all the figures denote the time of sunrise (∼ 07:00) and sunset (∼ 05:00).
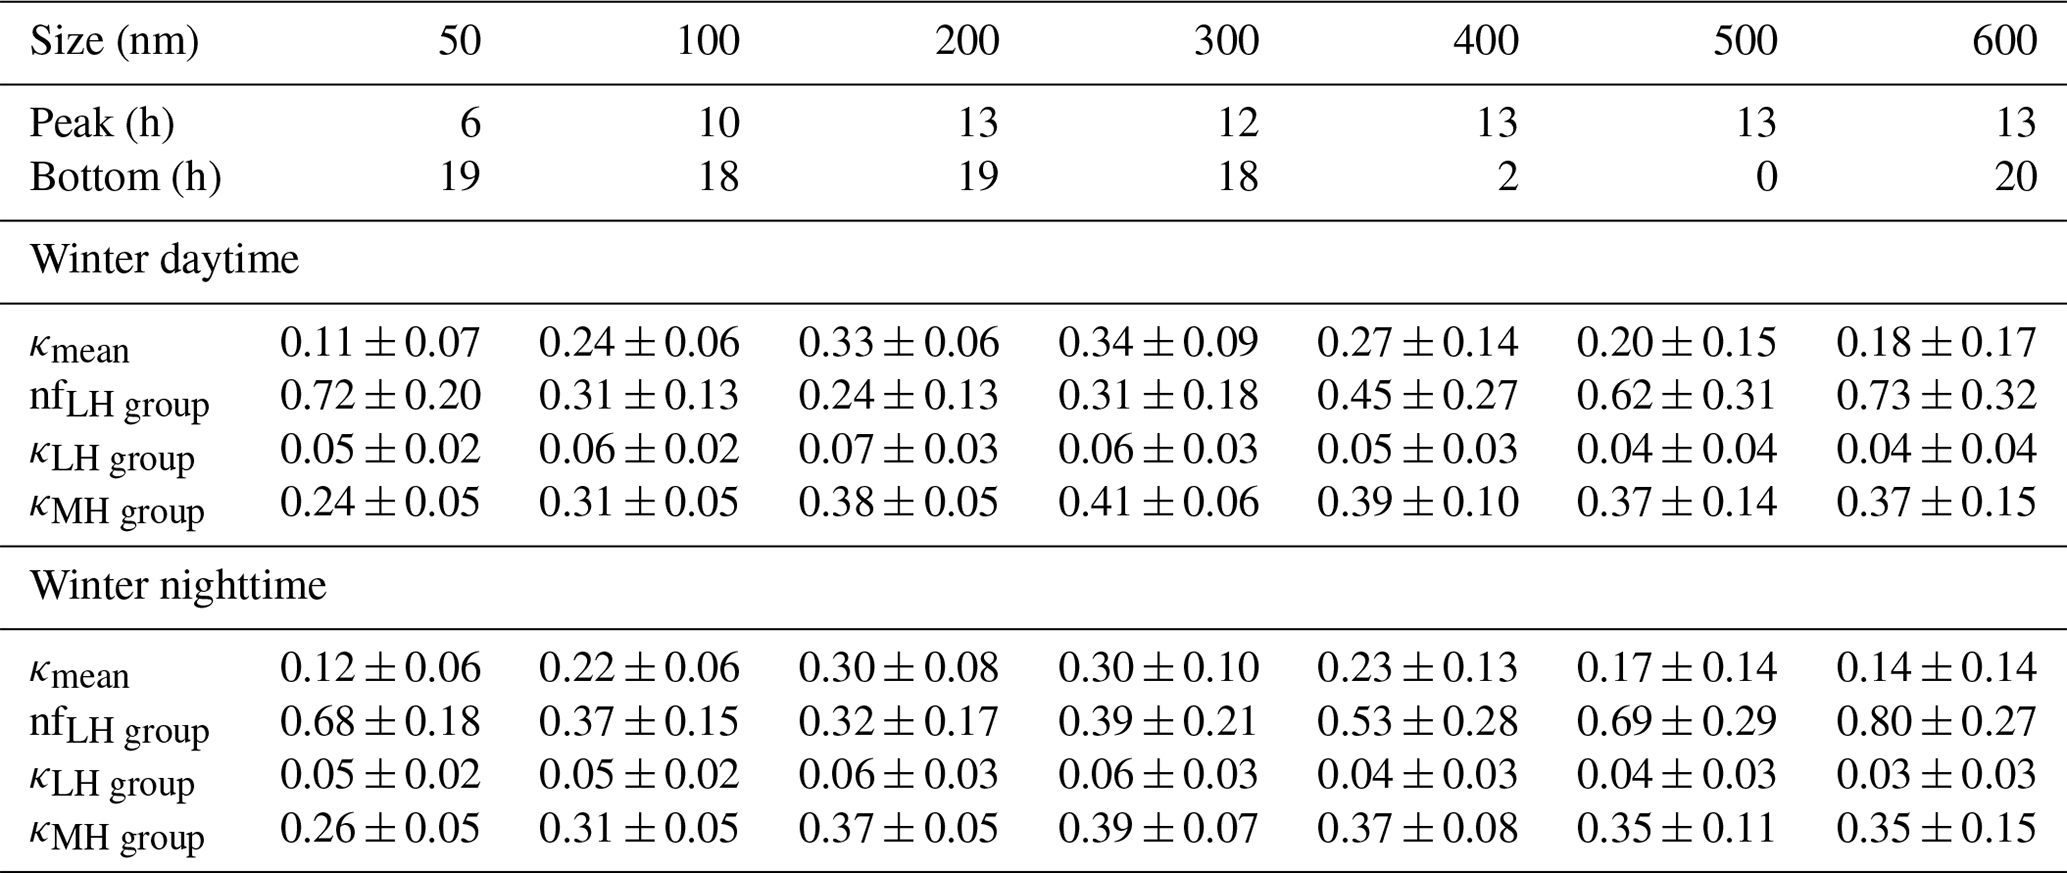
The average diurnal variations in GF-PDF for all the sizes are presented in Fig. 4. For better comparison, we mark the line between daytime and nighttime. During the measurement period, the time of sunrise was about 07:00, and the sunset was around 05:00. For particles of 50 nm, their hygroscopicity starts to decrease around sunrise and begins to increase around sunset. So the hygroscopicity parameter κ peaks at 06:00 and reaches a minimum at 19:00. For particles larger than 200 nm, the hygroscopicity in the daytime is about 10 %–50 % larger than that of nighttime.
For accumulation sizes, the number fraction of the LH group (nfLH) in the daytime is smaller than that in the nighttime. On one hand, the cause could be that more hydrophobic particles are generated or emitted in the night, and these particles include fresh BC or organic aerosols (Ma et al., 2011); on the other hand, more MH group particles could be formed in the daytime, or those aged particles in the night residual layer are mixed in the planetary boundary layer again (Liu et al., 2014). No diurnal variation is found in the peak of the LH group, indicating similar chemical compositions in the LH group. In contrast, the peak hygroscopic parameter κ for the MH group varied significantly with time of day, indicating that the chemical compositions in the MH group varied greatly at different times of day. It usually reaches a maximum around noon and starts to decrease in the afternoon. The black lines in Fig. 4a–g are the ensemble mean κ for each size. For particles larger than 50 nm, this value also peaks around noon, which may be the result of decreased nfLH and increased MH hygroscopicity. More statistical results about daytime and nighttime can be found in Table 3.
Table 3Diurnal variations in aerosol hygroscopic properties for different sizes.
4.1 Overview of GF and κ distribution
Guo et al. (2014) reported that particle pollution in Beijing is characterized by two distinct aerosol formation processes of nucleation and growth. During different aerosol formation processes, aerosol chemical compositions and corresponding hygroscopic properties may vary greatly. In order to investigate the evolution of particle hygroscopicity with different pollution levels, we group the data into three periods: (1) clean period in which the volume concentration is lower than 30 µm−3 cm−3, (2) transition period in which the particle volume concentration is larger than 30 but smaller than 40 µm−3 cm−3, (3) polluted period in which the volume concentration exceeds 40 µm−3 cm−3.

Figure 5Panels (a)–(c) are the growth factor probability distribution under different pollution conditions. Panels (d)–(f) are the corresponding mean number size distribution for LH and MH mode. For comparison, we also mark the mean number size distribution under transition stage in dashed lines in panel (f).
Figure 5 shows the GF-PDF and average size distribution under different pollution levels. From the clean to the transition period, the most apparent change is in the number concentration. The number concentrations of both the LH- and MH-mode particles have increased significantly. At the same time, the number fraction of the MH group has also been enhanced. When the air quality develops from transition to polluted level, the number concentration remains similar, but the MH group is greatly enhanced, not only in the number fraction but also in terms of the size range. The MH mode grows to the size of 600 nm, greatly squeezing the fraction of nearly hydrophobic-mode particles. From the statistical results in Table 4, the number fraction of less hygroscopic mode for 600 nm is 0.86 ± 0.22, 0.75 ± 0.29, and 0.39 ± 0.27 for the clean, transition, and pollution stage, respectively. For smaller particles, the variation in this value is not so distinct. Taking particles of 100 nm as an example, the nfLH for clean, transition and pollution stage is 0.36 ± 0.14, 0.33 ± 0.15, and 0.30 ± 0.13, respectively. The difference in nfLH among different stages increases with size.
Table 4Statistical results of aerosol hygroscopic properties under different pollution conditions.
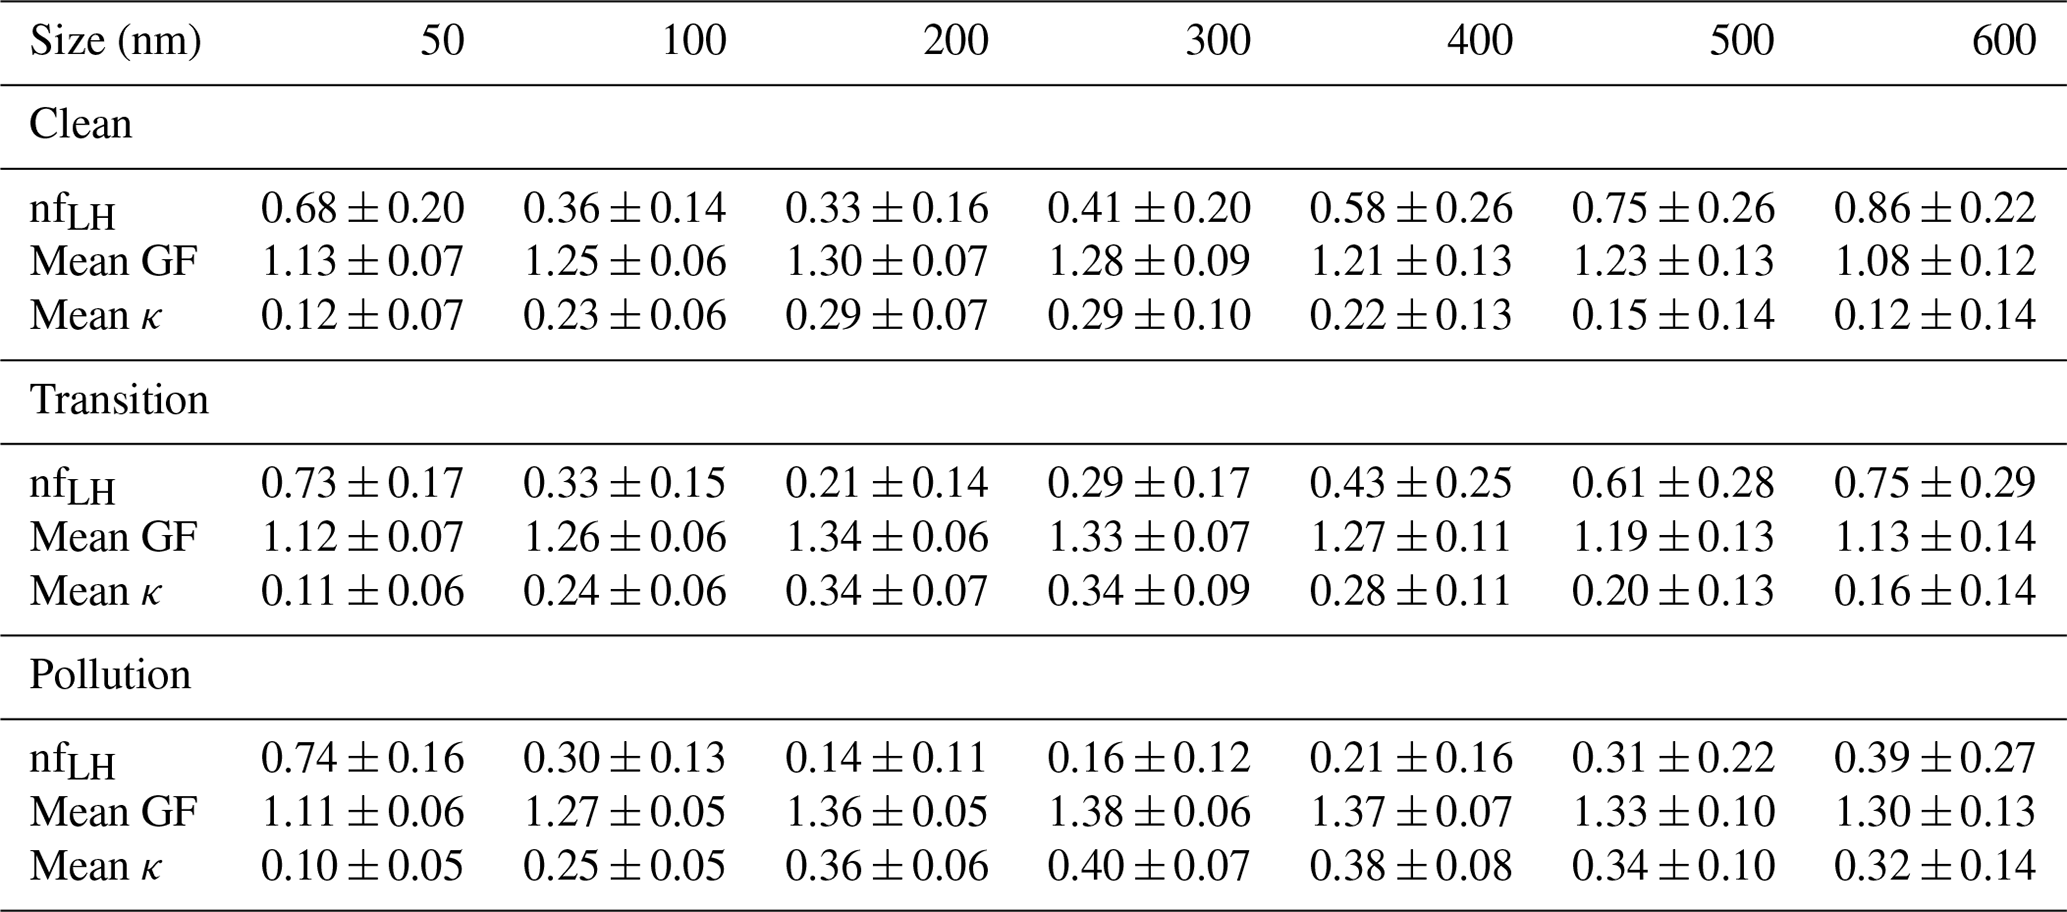
It needs to be noted that the great decrease in nfLH for large particles in the pollution period does not necessarily mean the decrease in absolute number concentration of LH-mode particles. From Fig. 5f, the number concentration of LH-mode particles remains similar to the transition stage. However, the total number concentration and corresponding mass concentration of large particles increase. These particles are grown from those smaller particles and are more aged in the environment. These processes are also called secondary aerosol formation. This part of particles contributes to the increase in the MH mode in a larger size and correspondingly total large-particle number concentration. With the evolution of pollution levels, this process will continue. Zheng et al. (2016) showed that the fraction of the secondary components in PM2.5 are enhanced with increasing PM2.5 mass concentration. Our measurement results give more direct evidence supporting this conclusion.
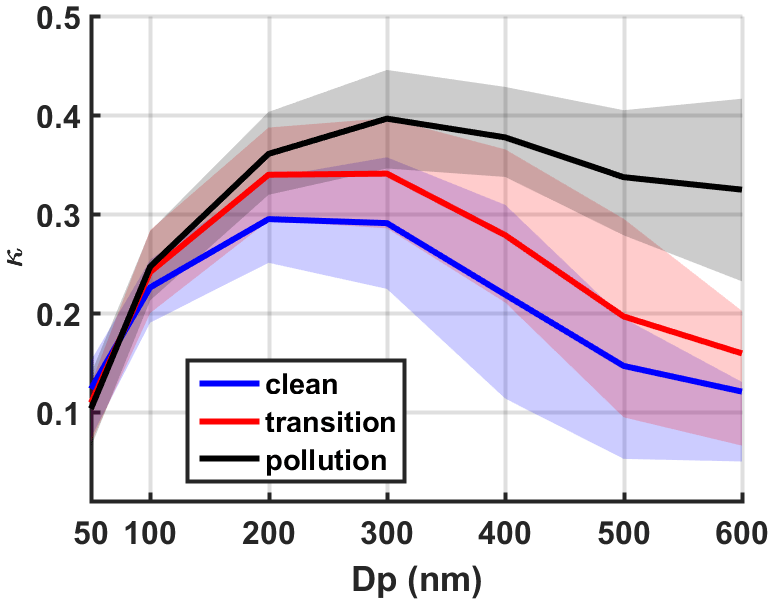
Figure 6Mean size-resolved κ under different pollution conditions. The upper and lower limit of semi-transparent patch is the 25 % and 75 % percentile.
For each size, we summarize the average hygroscopicity under different pollution conditions (Fig. 6). The results show that for particles smaller than 300 nm, the hygroscopicity variation is not very large. But for particles larger than 300 nm, particle hygroscopicity can vary significantly with different pollution levels, which correspond to different aging stages of urban aerosol particles. In conclusion, when urban aerosols in Beijing go through a series of aging processes, their hygroscopicity is enhanced, especially for larger accumulation particles.
4.2 The effects on visibility degradation
To better understand the meteorological, microphysical, and hygroscopic evolutions during the aging processes and the effects of hygroscopicity variation on visibility degradation, a 3 d pollution period from 27 November to 1 December 2019 is selected for the analysis. Figure 7 shows the overall situation of this pollution event. From local noon on 27 November, the wind speed began to decrease to below 3 m s−1. The synoptic situation of Beijing remained stagnant until the end of this pollution period, with an average wind speed of 1.04 m s−1. This meteorological situation indicated that the local emissions were the primary contribution of the surface air pollution, and the aging processes were not influenced too much by transport from other areas. In this respect, our measurement can represent the temporal evolution of aerosols in this urban region.
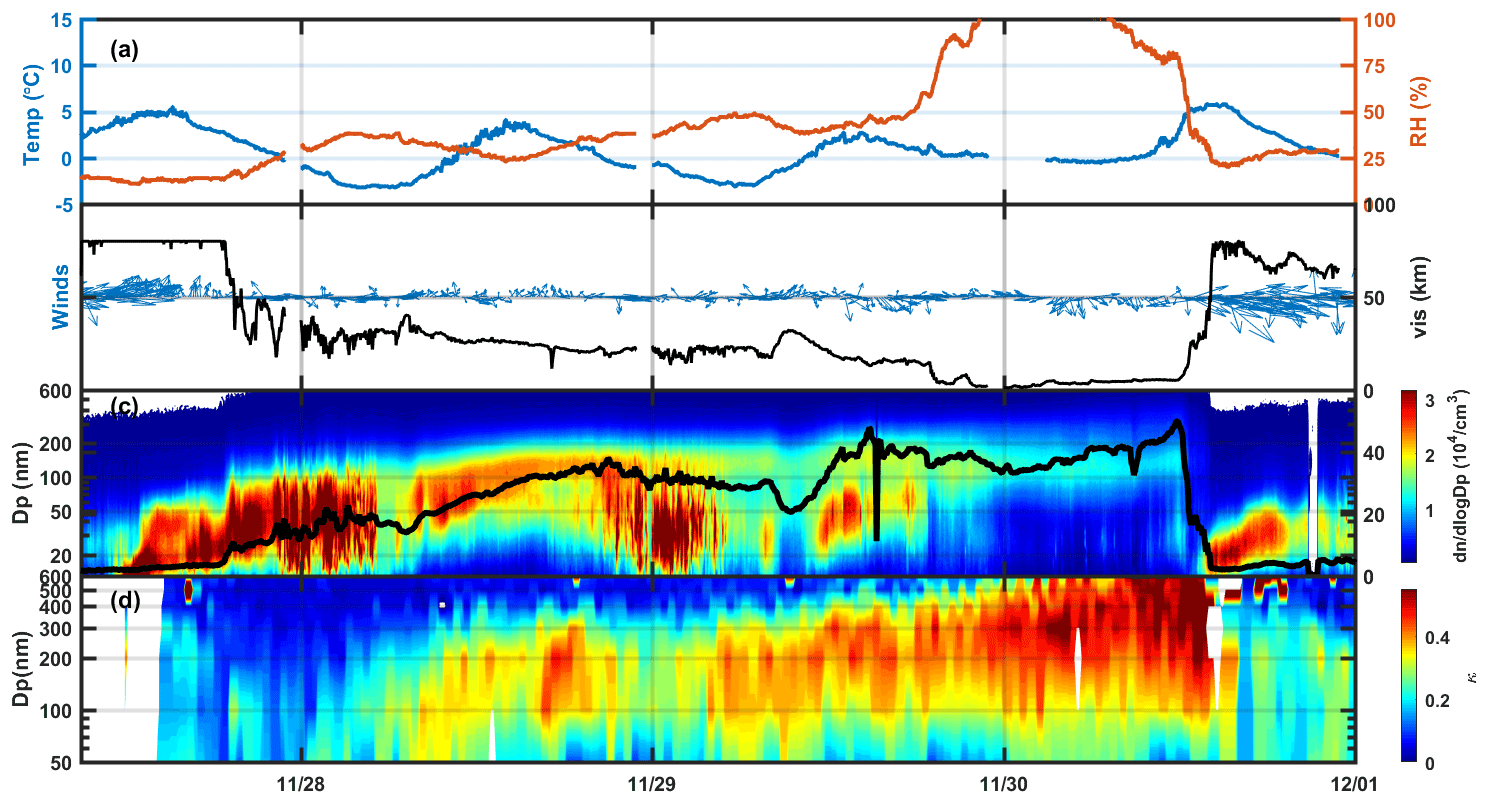
Figure 7A pollution cycle from 27 November to 1 December 2019. Panel (a) is the temporal evolution of temperature (blue line) and RH (orange line); (b) is the time series of visibility (black line) and winds. The length of the arrow indicates the wind speed, and the direction of the arrow indicates the wind direction. Panel (c) shows the time series of particle number size distribution, and the black line is the integrated volume concentration. The left axis is the log scale of particle diameters, and the right axis is for the volume concentration. Panel (d) is the size-resolved hygroscopicity parameter κ.
We can see from Fig. 7b–c that in the first 24 h, there was a considerable increase in aerosol number concentration for particles smaller than 100 nm, which corresponded to the aerosol nucleation. The visibility dropped down from the upper limit to around 30 km. In this stage, aerosol hygroscopicity was relatively low. In the transition stage, the mean particle size grew continuously, and the aerosol volume concentration also had a stable increase. At the same time, the aerosol became more hygroscopic in the accumulation size range between 100–300 nm. During this period, the visibility decreased slightly to 20 km. In the polluted stage, under the combined influence of the high relative humidity and large hygroscopicity enhancement, the visibility decreased considerably to below 10 km, causing the most severe haze event, even though the aerosol volume concentration remained similar to that in the transition stage.
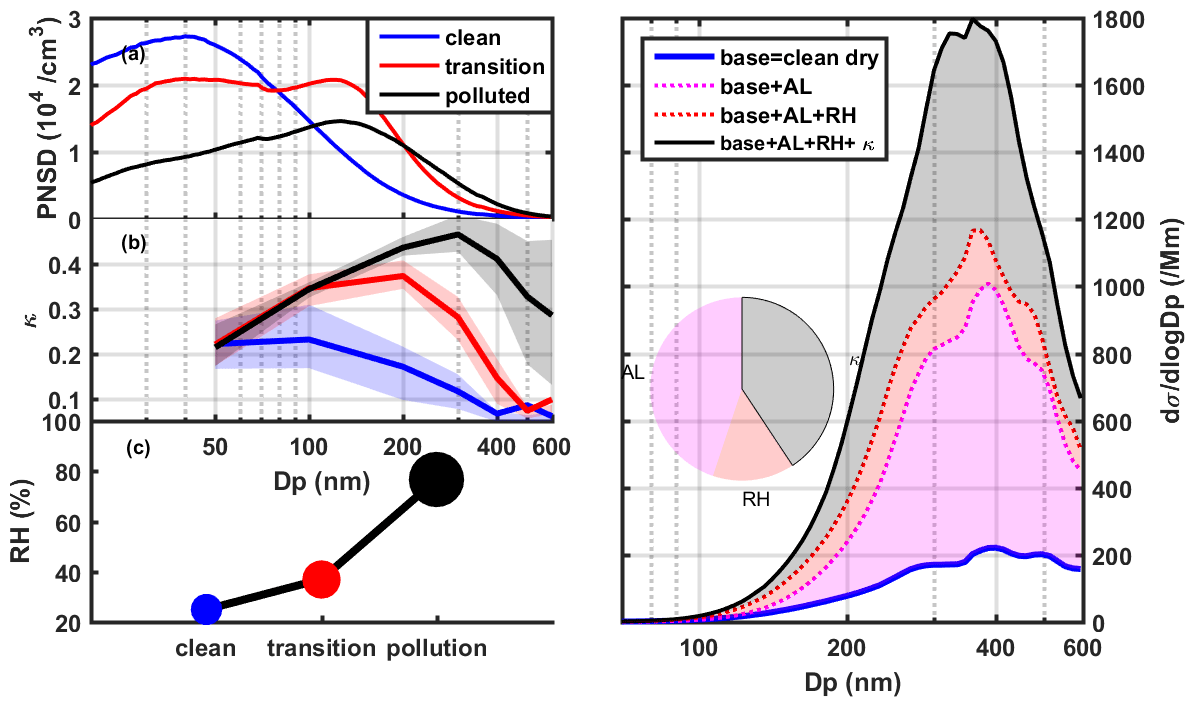
Figure 8Panel (a) is the mean PNSD under different pollution conditions. Panel (b) is the mean size-resolved κ under different pollution conditions. Panel (c) is the mean RH under different conditions. Panel (d) shows the effects of different factors (aerosol loading, RH, and κ variation) on the size-resolved light extinction. The areas of different colors are shown in the pie chart on the left.
In this haze formation process, RH, aerosol loading (AL), and hygroscopicity all contribute to visibility degradation. In order to quantify how much these factors took effect, we summarize the mean values of these factors in different stages, as shown in Fig. 8a–c. We can see that as the pollution developed, the number concentration of particles larger than 200 nm increased, while the small particles (<100 nm) decreased. The aerosol hygroscopicity was enhanced greatly, from a value below 0.2 to above 0.4 for particles larger than 300 nm. At the same time, the mean relative humidity also increased from 25 % to 77 %.
The visibility is closely related to aerosol light extinction (σ) through Koschmieder relation (Griffing, 1980; Husar et al., 2000; Carrico, 2003):
In this study, the particles are assumed to be spherical, and their size-dependent extinction behavior is computed from the Mie model using particle dry-size distribution, refractive indices, size-resolved hygroscopicity, and ambient RH. For each particle, we can determine its dry diameter and its wet diameter after hygroscopic growth. The refractive index (m) for the wet particle is classified between the BC core and coating materials, and the m of coating materials is computed as a volume-weighted average of water and dry non-absorbing materials. Then the light extinction for one particle can be calculated. The total aerosol light extinction can be integrated over all sizes given a measured PNSD. The detailed calculation description can be found in Chen et al. (2012). From this method, we can not only quantify the contribution from each size bin but also determine the role each factor (AL, RH, and κ) played in the low-visibility haze event. Figure 8d compares the size-resolved aerosol light extinction coefficient during the clean period (solid blue line) and the pollution period (solid black line). The blue line is considered to be the baseline, which corresponds to low aerosol loading, low hygroscopicity, and low RH values. When each of these factors is considered, we can obtain the following size-resolved light extinction, as shown in dotted lines. The dotted magenta line represents the condition with AL effect considered, which is calculated from the PNSD in the pollution stage but with the κ and RH in the clean stage. The dotted red line represents the condition when both AL and RH are considered. The shading between lines is the difference, indicating the contribution to the aerosol light extinction from each considered factor.
From Fig. 8, we can see that particles larger than 300 nm contribute more than half of the total light extinction. Under this condition, if the hygroscopicity properties and variations in this size range are not known, it would be hard to fully quantify and predict the visibility impairment caused by aerosol particles in the urban environment. As we have seen from Figs. 6 and 8b, the hygroscopicity variation is very large in this size range. From our calculation (pie chart in Fig. 8d), it would bring about 40 % of the total difference between the clean and pollution period, which is similar to the contribution of added aerosol loading. It is to be noted that all these three factors are coupled together to influence the haze formation, and the hygroscopicity variation would amplify the effect of added aerosol loading and increased ambient RH.
Submicron particles larger than 300 nm dominate the aerosol light extinction and mass concentration and constitute a large part of the aerosol surface concentration. Under the exposure to high RH, all these parameters will be enhanced with the addition of water and then greatly influence the particle mass, visibility degradation, particle chemistry, and haze formation. However, field measurements on aerosol hygroscopicity in previous studies are focused below the size of 350 nm. For larger particles, detailed descriptions of hygroscopicity characteristics and variations are scarce. Some studies tried to derive the hygroscopicity of a larger size range from other indirect methods like chemical composition or based on assumptions that accumulation-mode particles share the same hygroscopicity. Until now, no direct evidence has been provided to support these assumptions or parameterization schemes.
In this study, a comprehensive aerosol field measurement focusing on hygroscopicity properties and variations over an extended size range (50–600 nm) was conducted at a Beijing urban site in winter 2019. During the measurement, an HTDMA instrument was employed to measure hygroscopic growth factors of particles with dry diameters of 50, 100, 200, 300, 400, 500, and 600 nm at 85 % RH from 27 November 2019 to 14 January 2020. This in situ field measurement of atmospheric aerosols is representative of an urban environment and of great importance to better understanding the frequent low-visibility events over the North China Plain.
The measurement results show that the mean growth factor (GF) values for the sizes above were 1.13 ± 0.07, 1.25 ± 0.06, 1.31 ± 0.07, 1.30 ± 0.09, 1.24 ± 0.13, 1.16 ± 0.15, and 1.12 ± 0.15, respectively. The average GF-PDF presents a bi-modal structure including a less hygroscopic group and a more hygroscopic group. For the particles larger than 300 nm, there is a large fraction of nearly hydrophobic or less hygroscopic particles, which decreases the bulk hygroscopicity in this size range. However, during the polluted episode when the aerosol particles are fully aged, the ensemble mean hygroscopicity of larger particles will be enhanced significantly because of the growth and expansion of the MH group to this size range. Our measurements give direct evidence supporting the notion that the variation in the MH group brings the biggest change and uncertainty to the bulk hygroscopicity of particles larger than 300 nm. Our results are consistent with previous HTDMA studies in the overlap region (Massling et al., 2009; Wang et al., 2018; Liu et al., 2011) and the chemical composition studies during the pollution development (Guo et al., 2014; Zheng et al., 2016; Wu et al., 2018)
The significant variation in larger-particle hygroscopicity will contribute much to the variation in particle optical properties like light extinction coefficient. Size-resolved light extinction coefficients under different pollution conditions are calculated using Mie scattering theory. From our results, when coupled with increased RH, the influence of κ variation on light degradation could compete with the added aerosol loading in the haze development. Based on these results, we strongly recommend the simultaneous measurement of hygroscopic properties over a size range larger than 300 nm in future urban aerosol field studies.
The data processing software can be accessed by contacting software@brechtel.com.
The data used in this study can be obtained from this link: https://pan.baidu.com/s/1Sv9Zi3SJjBf0vhMRH2NNRA. It is also available from the authors upon request.
CS, GZ, WZ, and CZ discussed the results; PT offered his help in the experiment; CS wrote the manuscript.
The authors declare that they have no conflict of interest.
This research has been supported by the National Key Research and Development Program of China (grant no. 2016YFC020000: Task 5) and the National Natural Science Foundation of China (grant no. 41590872).
This paper was edited by Radovan Krejci and reviewed by two anonymous referees.
Albrecht, B. A.: Aerosols, Cloud Microphysics, and Fractional Cloudiness, Science, 245, 1227–1230, https://doi.org/10.1126/science.245.4923.1227, 1989.
Baltensperger, U., Streit, N., Weingartner, E., Nyeki, S., Prevot, A. S. H., Van Dingenen, R., Virkkula, A., Putaud, J. P., Even, A., ten Brink, H., Blatter, A., Neftel, A., and Gaggeler, H. W.: Urban and rural aerosol characterization of summer smog events during the PIPAPO field campaign in Milan, Italy, J. Geophys. Res.-Atmos., 107, 14, https://doi.org/10.1029/2001jd001292, 2002.
Bian, Y. X., Zhao, C. S., Ma, N., Chen, J., and Xu, W. Y.: A study of aerosol liquid water content based on hygroscopicity measurements at high relative humidity in the North China Plain, Atmos. Chem. Phys., 14, 6417–6426, https://doi.org/10.5194/acp-14-6417-2014, 2014.
Carrico, C. M., Rood, M. J., Ogren, J. A., Neusüß, C., Wiedensohler, A., and Heintzenberg, J.: Aerosol Optical properties at Sagres, Portugal during ACE-2, Tellus B, 52, 694–715, https://doi.org/10.1034/j.1600-0889.2000.00049.x, 2000.
Carrico, C. M.: Mixtures of pollution, dust, sea salt, and volcanic aerosol during ACE-Asia: Radiative properties as a function of relative humidity, J. Geophys. Res., 108, 8650, https://doi.org/10.1029/2003jd003405, 2003.
Chang, D., Song, Y., and Liu, B.: Visibility trends in six megacities in China 1973–2007, Atmos. Res., 94, 161–167, https://doi.org/10.1016/j.atmosres.2009.05.006, 2009.
Charlson, R. J., Schwartz, S. E., Hales, J. M., Cess, R. D., Coakley, J. A., Hansen, J. E., and Hofmann, D. J.: Climate Forcing by Anthropogenic Aerosols, Science, 255, 423–430, https://doi.org/10.1126/science.255.5043.423, 1992.
Chen, J., Zhao, C. S., Ma, N., Liu, P. F., Göbel, T., Hallbauer, E., Deng, Z. Z., Ran, L., Xu, W. Y., Liang, Z., Liu, H. J., Yan, P., Zhou, X. J., and Wiedensohler, A.: A parameterization of low visibilities for hazy days in the North China Plain, Atmos. Chem. Phys., 12, 4935–4950, https://doi.org/10.5194/acp-12-4935-2012, 2012.
Chen, J., Zhao, C. S., Ma, N., and Yan, P.: Aerosol hygroscopicity parameter derived from the light scattering enhancement factor measurements in the North China Plain, Atmos. Chem. Phys., 14, 8105–8118, https://doi.org/10.5194/acp-14-8105-2014, 2014.
Chen, L.-Y., Jeng, F.-T., Chen, C.-C., and Hsiao, T.-C.: Hygroscopic behavior of atmospheric aerosol in Taipei, Atmos. Environ., 37, 2069–2075, https://doi.org/10.1016/S1352-2310(03)00071-2, 2003.
Cocker, D. R., Whitlock, N. E., Flagan, R. C., and Seinfeld, J. H.: Hygroscopic properties of Pasadena, California aerosol, Aerosol Sci. Technol., 35, 637–647, https://doi.org/10.1080/02786820120653, 2001.
Deng, Z. Z., Zhao, C. S., Ma, N., Liu, P. F., Ran, L., Xu, W. Y., Chen, J., Liang, Z., Liang, S., Huang, M. Y., Ma, X. C., Zhang, Q., Quan, J. N., Yan, P., Henning, S., Mildenberger, K., Sommerhage, E., Schäfer, M., Stratmann, F., and Wiedensohler, A.: Size-resolved and bulk activation properties of aerosols in the North China Plain, Atmos. Chem. Phys., 11, 3835–3846, https://doi.org/10.5194/acp-11-3835-2011, 2011.
Deng, Z. Z., Zhao, C. S., Ma, N., Ran, L., Zhou, G. Q., Lu, D. R., and Zhou, X. J.: An examination of parameterizations for the CCN number concentration based on in situ measurements of aerosol activation properties in the North China Plain, Atmos. Chem. Phys., 13, 6227–6237, https://doi.org/10.5194/acp-13-6227-2013, 2013.
Ferron, G. A., Karg, E., Busch, B., and Heyder, J.: Ambient particles at an urban, semi-urban and rural site in Central Europe: hygroscopic properties, Atmos. Environ., 39, 343–352, https://doi.org/10.1016/j.atmosenv.2004.09.015, 2005.
Fierce, L., Onasch, T. B., Cappa, C. D., Mazzoleni, C., China, S., Bhandari, J., Davidovits, P., Fischer, D. A., Helgestad, T., Lambe, A. T., Sedlacek 3rd, A. J., Smith, G. D., and Wolff, L.: Radiative absorption enhancements by black carbon controlled by particle-to-particle heterogeneity in composition, P. Natl. Acad. Sci. USA, 117, 5196–5203, https://doi.org/10.1073/pnas.1919723117, 2020.
Fitzgerald, J. W., Hoppel, W. A., and Vietti, M. A.: The Size and Scattering Coefficient of Urban Aerosol Particles at Washington, DC as a Function of Relative Humidity, J. Atmos. Sci., 39, 1838–1852, https://doi.org/10.1175/1520-0469(1982)039<1838:TSASCO>2.0.CO;2, 1982.
Fors, E. O., Swietlicki, E., Svenningsson, B., Kristensson, A., Frank, G. P., and Sporre, M.: Hygroscopic properties of the ambient aerosol in southern Sweden – a two year study, Atmos. Chem. Phys., 11, 8343–8361, https://doi.org/10.5194/acp-11-8343-2011, 2011.
Griffing, G. W.: Relations between the prevailing visibility, nephelometer scattering coefficient and sunphotometer turbidity coefficient, Atmos. Environ., 14, 577–584, https://doi.org/10.1016/0004-6981(80)90089-X, 1980.
Guo, S., Hu, M., Zamora, M. L., Peng, J., Shang, D., Zheng, J., Du, Z., Wu, Z., Shao, M., Zeng, L., Molina, M. J., and Zhang, R.: Elucidating severe urban haze formation in China, P. Natl. Acad. Sci. USA, 111, 17373–17378, https://doi.org/10.1073/pnas.1419604111, 2014.
Haywood, J. and Boucher, O.: Estimates of the direct and indirect radiative forcing due to tropospheric aerosols: A review, Rev. Geophys., 38, 513–543, https://doi.org/10.1029/1999rg000078, 2000.
Hersey, S. P., Craven, J. S., Schilling, K. A., Metcalf, A. R., Sorooshian, A., Chan, M. N., Flagan, R. C., and Seinfeld, J. H.: The Pasadena Aerosol Characterization Observatory (PACO): chemical and physical analysis of the Western Los Angeles basin aerosol, Atmos. Chem. Phys., 11, 7417–7443, https://doi.org/10.5194/acp-11-7417-2011, 2011.
Holmgren, H., Sellegri, K., Hervo, M., Rose, C., Freney, E., Villani, P., and Laj, P.: Hygroscopic properties and mixing state of aerosol measured at the high-altitude site Puy de Dome (1465 m a.s.l.), France, Atmos. Chem. Phys., 14, 9537–9554, https://doi.org/10.5194/acp-14-9537-2014, 2014.
Husar, R. B., Husar, J. D., and Martin, L.: Distribution of continental surface aerosol extinction based on visual range data, Atmos. Environ., 34, 5067–5078, https://doi.org/10.1016/S1352-2310(00)00324-1, 2000.
Ibald-Mulli, A., Wichmann, H. E., Kreyling, W., and Peters, A.: Epidemiological Evidence on Health Effects of Ultrafine Particles, J. Aerosol Med., 15, 189–201, https://doi.org/10.1089/089426802320282310, 2002.
Jiang, C., Wang, H., Zhao, T., Li, T., and Che, H.: Modeling study of PM2.5 pollutant transport across cities in China's Jing–Jin–Ji region during a severe haze episode in December 2013, Atmos. Chem. Phys., 15, 5803–5814, https://doi.org/10.5194/acp-15-5803-2015, 2015.
Kitamori, Y., Mochida, M., and Kawamura, K.: Assessment of the aerosol water content in urban atmospheric particles by the hygroscopic growth measurements in Sapporo, Japan, Atmos. Environ., 43, 3416–3423, https://doi.org/10.1016/j.atmosenv.2009.03.037, 2009.
Kreidenweis, S. M. and Asa-Awuku, A.: Aerosol Hygroscopicity: Particle Water Content and Its Role in Atmospheric Processes, in: Treatise on Geochemistry, https://doi.org/10.1016/b978-0-08-095975-7.00418-6, Elsevier, Netherlands, 331–361, 2014.
Kuang, Y., Zhao, C. S., Tao, J. C., and Ma, N.: Diurnal variations of aerosol optical properties in the North China Plain and their influences on the estimates of direct aerosol radiative effect, Atmos. Chem. Phys., 15, 5761–5772, https://doi.org/10.5194/acp-15-5761-2015, 2015.
Kuang, Y., Zhao, C., Tao, J., Bian, Y., Ma, N., and Zhao, G.: A novel method for deriving the aerosol hygroscopicity parameter based only on measurements from a humidified nephelometer system, Atmos. Chem. Phys., 17, 6651–6662, https://doi.org/10.5194/acp-17-6651-2017, 2017.
Kuang, Y., Zhao, C. S., Zhao, G., Tao, J. C., Xu, W., Ma, N., and Bian, Y. X.: A novel method for calculating ambient aerosol liquid water content based on measurements of a humidified nephelometer system, Atmos. Meas. Tech., 11, 2967–2982, https://doi.org/10.5194/amt-11-2967-2018, 2018.
Liu, H. J., Zhao, C. S., Nekat, B., Ma, N., Wiedensohler, A., van Pinxteren, D., Spindler, G., Müller, K., and Herrmann, H.: Aerosol hygroscopicity derived from size-segregated chemical composition and its parameterization in the North China Plain, Atmos. Chem. Phys., 14, 2525–2539, https://doi.org/10.5194/acp-14-2525-2014, 2014.
Liu, P. F., Zhao, C. S., Göbel, T., Hallbauer, E., Nowak, A., Ran, L., Xu, W. Y., Deng, Z. Z., Ma, N., Mildenberger, K., Henning, S., Stratmann, F., and Wiedensohler, A.: Hygroscopic properties of aerosol particles at high relative humidity and their diurnal variations in the North China Plain, Atmos. Chem. Phys., 11, 3479–3494, https://doi.org/10.5194/acp-11-3479-2011, 2011.
Lohmann, U. and Feichter, J.: Global indirect aerosol effects: a review, Atmos. Chem. Phys., 5, 715–737, https://doi.org/10.5194/acp-5-715-2005, 2005.
Lopez-Yglesias, X. F., Yeung, M. C., Dey, S. E., Brechtel, F. J., and Chan, C. K.: Performance Evaluation of the Brechtel Mfg. Humidified Tandem Differential Mobility Analyzer (BMI HTDMA) for Studying Hygroscopic Properties of Aerosol Particles, Aerosol Sci. Tech., 48, 969–980, https://doi.org/10.1080/02786826.2014.952366, 2014.
Lundgren, D. A., and Paulus, H. J.: The Mass Distribution of Large Atmospheric Particles, JAPCA J. Air Waste Ma., 25, 1227–1231, https://doi.org/10.1080/00022470.1975.10470200, 2012.
Ma, N., Zhao, C. S., Nowak, A., Müller, T., Pfeifer, S., Cheng, Y. F., Deng, Z. Z., Liu, P. F., Xu, W. Y., Ran, L., Yan, P., Göbel, T., Hallbauer, E., Mildenberger, K., Henning, S., Yu, J., Chen, L. L., Zhou, X. J., Stratmann, F., and Wiedensohler, A.: Aerosol optical properties in the North China Plain during HaChi campaign: an in-situ optical closure study, Atmos. Chem. Phys., 11, 5959–5973, https://doi.org/10.5194/acp-11-5959-2011, 2011.
Ma, N., Zhao, C. S., Müller, T., Cheng, Y. F., Liu, P. F., Deng, Z. Z., Xu, W. Y., Ran, L., Nekat, B., van Pinxteren, D., Gnauk, T., Müller, K., Herrmann, H., Yan, P., Zhou, X. J., and Wiedensohler, A.: A new method to determine the mixing state of light absorbing carbonaceous using the measured aerosol optical properties and number size distributions, Atmos. Chem. Phys., 12, 2381–2397, https://doi.org/10.5194/acp-12-2381-2012, 2012.
Ma, N., Zhao, C., Tao, J., Wu, Z., Kecorius, S., Wang, Z., Größ, J., Liu, H., Bian, Y., Kuang, Y., Teich, M., Spindler, G., Müller, K., van Pinxteren, D., Herrmann, H., Hu, M., and Wiedensohler, A.: Variation of CCN activity during new particle formation events in the North China Plain, Atmos. Chem. Phys., 16, 8593–8607, https://doi.org/10.5194/acp-16-8593-2016, 2016.
Martin, M., Chang, R. Y.-W., Sierau, B., Sjogren, S., Swietlicki, E., Abbatt, J. P. D., Leck, C., and Lohmann, U.: Cloud condensation nuclei closure study on summer arctic aerosol, Atmos. Chem. Phys., 11, 11335–11350, https://doi.org/10.5194/acp-11-11335-2011, 2011.
Massling, A., Stock, M., and Wiedensohler, A.: Diurnal, weekly, and seasonal variation of hygroscopic properties of submicrometer urban aerosol particles, Atmos. Environ., 39, 3911–3922, https://doi.org/10.1016/j.atmosenv.2005.03.020, 2005.
Massling, A., Stock, M., Wehner, B., Wu, Z. J., Hu, M., Brüggemann, E., Gnauk, T., Herrmann, H., and Wiedensohler, A.: Size segregated water uptake of the urban submicrometer aerosol in Beijing, Atmos. Environ., 43, 1578–1589, https://doi.org/10.1016/j.atmosenv.2008.06.003, 2009.
Ouimette, J. R. and Flagan, R. C.: The extinction coefficient of multicomponent aerosols, Atmos. Environ., 16, 2405–2419, https://doi.org/10.1016/0004-6981(82)90131-7, 1982.
Park, K., Kim, J.-S., and Park, S. H.: Measurements of Hygroscopicity and Volatility of Atmospheric Ultrafine Particles during Ultrafine Particle Formation Events at Urban, Industrial, and Coastal Sites, Environ. Sci. Tech., 43, 6710–6716, https://doi.org/10.1021/es900398q, 2009.
Penner, J. E., Hegg, D., and Leaitch, R.: Unraveling the role of aerosols in climate change, Environ. Sci. Tech., 35, 332A–340A, https://doi.org/10.1021/es0124414, 2001.
Peters, A., Wichmann, H. E., Tuch, T., Heinrich, J., and Heyder, J.: Respiratory effects are associated with the number of ultrafine particles, Am. J. Resp. Crit. Care, 155, 1376–1383, https://doi.org/10.1164/ajrccm.155.4.9105082, 1997.
Petters, M. D. and Kreidenweis, S. M.: A single parameter representation of hygroscopic growth and cloud condensation nucleus activity, Atmos. Chem. Phys., 7, 1961–1971, https://doi.org/10.5194/acp-7-1961-2007, 2007.
Pinnick, R. G., Jennings, S. G., and Chýlek, P.: Relationships between extinction, absorption, backscattering, and mass content of sulfuric acid aerosols, J. Geophys. Res., 85, 405–4066, https://doi.org/10.1029/JC085iC07p04059, 1980.
Roberts, G. C. and Nenes, A.: A Continuous-Flow Streamwise Thermal-Gradient CCN Chamber for Atmospheric Measurements, Aerosol Sci. Tech., 39, 206–221, https://doi.org/10.1080/027868290913988, 2005.
Seinfeld, J. H. and Pandis, S. N.: Atmospheric Chemistry and Physics-From Air Pollution to Climate Change, 2nd Edn., John Wiley & Sons, Hoboken, NJ, 2006.
Shen, C., Zhao, C., Ma, N., Tao, J., Zhao, G., Yu, Y., and Kuang, Y.: Method to Estimate Water Vapor Supersaturation in the Ambient Activation Process Using Aerosol and Droplet Measurement Data, J. Geophys. Res.-Atmos., 123, 10606–10619, https://doi.org/10.1029/2018jd028315, 2018.
Su, T., Li, Z., and Kahn, R.: Relationships between the planetary boundary layer height and surface pollutants derived from lidar observations over China: regional pattern and influencing factors, Atmos. Chem. Phys., 18, 15921–15935, https://doi.org/10.5194/acp-18-15921-2018, 2018.
Su, T., Li, Z., Zheng, Y., Luan, Q., and Guo, J.: Abnormally shallow boundary layer associated with severe air pollution during the COVID-19 lockdown in China, Geophys. Res. Lett., 47, e2020GL090041, https://doi.org/10.1029/2020GL090041, 2020.
Sun, Y. L., Jiang, Q., Wang, Z. F., Fu, P. Q., Li, J., Yang, T., and Yin, Y.: Investigation of the sources and evolution processes of severe haze pollution in Beijing in January 2013, J. Geophys. Res.-Atmos., 119, 4380–4398, https://doi.org/10.1002/2014jd021641, 2014.
Sverdrup, G. M. and Whitby, K. T.: Determination of submicron atmospheric aerosol size distributions by use of continuous analog sensors, Environ. Sci. Technol., 11, 1171–1176, https://doi.org/10.1021/es60136a007, 1977.
Swietlicki, E., Hansson, H. C., Hämeri, K., Svenningsson, B., Massling, A., McFiggans, G., McMurry, P. H., Petäjä, T., Tunved, P., Gysel, M., Topping, D., Weingartner, E., Baltensperger, U., Rissler, J., Wiedensohler, A., and Kulmala, M.: Hygroscopic properties of submicrometer atmospheric aerosol particles measured with H-TDMA instruments in various environments–a review, Tellus B, 60, 432–469, https://doi.org/10.1111/j.1600-0889.2008.00350.x, 2008.
Tao, J., Zhao, C., Ma, N., and Kuang, Y.: Consistency and applicability of parameterization schemes for the size-resolved aerosol activation ratio based on field measurements in the North China Plain, Atmos. Environ., 173, 316–324, https://doi.org/10.1016/j.atmosenv.2017.11.021, 2018.
Tschiersch, J., Busch, B., and Fogh, C. L.: Measurements of concentration, size distribution and hygroscopicity of Munich winter aerosol, J. Aerosol. Sci., 1001, S209–S210, 1997.
Twomey, S.: Pollution and the planetary albedo, Atmos. Environ., 8, 1251–1256, https://doi.org/10.1016/0004-6981(74)90004-3, 1974.
Wang, Y., Wu, Z., Ma, N., Wu, Y., Zeng, L., Zhao, C., and Wiedensohler, A.: Statistical analysis and parameterization of the hygroscopic growth of the sub-micrometer urban background aerosol in Beijing, Atmos. Environ., 175, 184–191, https://doi.org/10.1016/j.atmosenv.2017.12.003, 2018.
Wu, Z., Wang, Y., Tan, T., Zhu, Y., Li, M., Shang, D., Wang, H., Lu, K., Guo, S., Zeng, L., and Zhang, Y.: Aerosol Liquid Water Driven by Anthropogenic Inorganic Salts: Implying Its Key Role in Haze Formation over the North China Plain, Environ. Sci. Technol. Lett., 5, 160–166, https://doi.org/10.1021/acs.estlett.8b00021, 2018.
Yan, P., Pan, X., Tang, J., Zhou, X., Zhang, R., and Zeng, L.: Hygroscopic growth of aerosol scattering coefficient: A comparative analysis between urban and suburban sites at winter in Beijing, Particuology, 7, 52–60, https://doi.org/10.1016/j.partic.2008.11.009, 2009.
Ye, X. X., Song, Y., Cai, X. H., and Zhang, H. S.: Study on the synoptic flow patterns and boundary layer process of the severe haze events over the North China Plain in January 2013, Atmos. Environ., 124, 129–145, https://doi.org/10.1016/j.atmosenv.2015.06.011, 2016.
Zhang, X. Q., McMurray, P. H., Hering, S. V., and Casuccio, G. S.: Mixing characteristics and water content of submicron aerosols measured in Los Angeles and at the grand canyon, Atmos. Environ. Pt. A, 27, 1593–1607, https://doi.org/10.1016/0960-1686(93)90159-V, 1993.
Zhao, G., Zhao, C., Kuang, Y., Bian, Y., Tao, J., Shen, C., and Yu, Y.: Calculating the aerosol asymmetry factor based on measurements from the humidified nephelometer system, Atmos. Chem. Phys., 18, 9049–9060, https://doi.org/10.5194/acp-18-9049-2018, 2018.
Zheng, J., Hu, M., Peng, J., Wu, Z., Kumar, P., Li, M., Wang, Y., and Guo, S.: Spatial distributions and chemical properties of PM2.5 based on 21 field campaigns at 17 sites in China, Chemosphere, 159, 480–487, https://doi.org/10.1016/j.chemosphere.2016.06.032, 2016.
Zieger, P., Fierz-Schmidhauser, R., Gysel, M., Ström, J., Henne, S., Yttri, K. E., Baltensperger, U., and Weingartner, E.: Effects of relative humidity on aerosol light scattering in the Arctic, Atmos. Chem. Phys., 10, 3875–3890, https://doi.org/10.5194/acp-10-3875-2010, 2010.
Zieger, P., Fierz-Schmidhauser, R., Poulain, L., Muller, T., Birmili, W., Spindler, G., Wiedensohler, A., Baltensperger, U., and Weingartner, E.: Influence of water uptake on the aerosol particle light scattering coefficients of the Central European aerosol, Tellus B, 66, 14, https://doi.org/10.3402/tellusb.v66.22716, 2014.