the Creative Commons Attribution 4.0 License.
the Creative Commons Attribution 4.0 License.
 | 14 Sep 2021
A mass-balance-based emission inventory of non-methane volatile organic compounds (NMVOCs) for solvent use in China
Ziwei Mo
Ru Cui
Huihua Cai
Brian C. McDonald
Junyu Zheng
Min Shao
Non-methane volatile organic compounds (NMVOCs) are important precursors of ozone (O3) and secondary organic aerosol (SOA), which play key roles in tropospheric chemistry. A huge amount of NMVOC emissions from solvent use are complicated by a wide spectrum of sources and species. This work presents a long-term NMVOC emission inventory of solvent use during 2000–2017 in China. Based on a mass (material) balance method, NMVOC emissions were estimated for six categories, including coatings, adhesives, inks, pesticides, cleaners, and personal care products. The results show that NMVOC emissions from solvent use in China increased rapidly from 2000 to 2014 then kept stable after 2014. The total emission increased from 1.6 Tg (1.2–2.2 Tg at 95 % confidence interval) in 2000 to 10.6 Tg (7.7–14.9 Tg) in 2017. The substantial growth is driven by the large demand for solvent products in both industrial and residential activities. However, increasing treatment facilities in the solvent-related factories in China restrained the continued growth of solvent NMVOC emissions in recent years. Rapidly developing and heavily industrialized provinces such as Jiangsu, Shandong, and Guangdong contributed significantly to the solvent use emissions. Oxygenated VOCs, alkanes, and aromatics were the main components, accounting for 42 %, 28 %, and 21 % of total NMVOC emissions in 2017, respectively. Our results and previous inventories are generally comparable within the estimation uncertainties (−27 %–52 %). However, there exist significant differences in the estimates of sub-categories. Personal care products were a significant and quickly rising source of NMVOCs, which were probably underestimated in previous inventories. Emissions from solvent use were growing faster compared with transportation and combustion emissions, which were relatively better controlled in China. Environmentally friendly products can reduce the NMVOC emissions from solvent use. Supposing all solvent-based products were substituted with water-based products, it would result in 37 %, 41 %, and 38 % reduction of emissions, ozone formation potential (OFP), and secondary organic aerosol formation potential (SOAP), respectively. These results indicate there is still large potential for NMVOC reduction by reducing the utilization of solvent-based products and implementation of end-of-pipe controls across industrial sectors.
- Article
(5692 KB) - Full-text XML
-
Supplement
(2098 KB) - BibTeX
- EndNote


Air pollution has caused wide public attention because of its adverse effect on human health (Nel, 2005). The high concentrations of ozone (O3) and fine particles (PM2.5) are the main reasons for heavy pollution episodes in urban areas (MEEPRC, 2019). As the precursors of O3 and secondary organic aerosol (SOA), non-methane volatile organic compounds (NMVOCs) become the key pollutants targeted for priority control (Hao and Xie, 2018; Nishanth et al., 2014). China is the hotspot of NMVOC emissions across the world. The total NMVOC emissions have increased rapidly in recent decades (Li et al., 2019; Simayi et al., 2019; Sun et al., 2018; S. X. Wang et al., 2014; Wei et al., 2011b; Wu et al., 2016). Reducing NMVOC emissions is of the utmost importance for tackling air pollution problems in megacities of China (Jin and Holloway, 2015; Yuan et al., 2013).
There are various anthropogenic sources of NMVOC emissions including industrial processes, fossil fuel combustion, biomass burning, traffic emissions, and solvent utilization (Li et al., 2015). Multiple emission inventories have been established to quantify NMVOC emissions for China (Li et al., 2019; Sun et al., 2018; Wei et al., 2011b). The total NMVOC emissions were estimated to increase from 19.4 Tg in 2005 to 23.2 Tg in 2015 (Wei et al., 2011b). A more recent inventory suggested that NMVOC emissions increased from 9.8 to 28.5 Tg between 1990 and 2017 (Li et al., 2019). The unprecedented increase in NMVOC emissions in China is largely attributed to the fast urban and industrial expansion. In particular, NMVOC emissions from solvent use sectors were reported to triple over the past three decades, becoming the largest emission source in China (Li et al., 2019).
Emission estimates for solvent use are challenging because of the wide spectral of stationary and fugitive sources. Compared with other key NMVOC sources such as transportation and fossil fuel combustion, NMVOC emissions from solvent use have larger uncertainties among different emission inventories. The estimated emissions were in the range of 1.9–5.8 Tg from solvent use while they were 4.9–6.1 Tg from transportation and 4.8–7.7 Tg from combustion for the year of 2005 (Bo et al., 2008; Li et al., 2019; Sun et al., 2018; S. X. Wang et al., 2014; Wei et al., 2008, 2011b). The large uncertainty in solvent use emissions results from different source categories and different emission factors (EFs) in these estimations. Specifically, coatings are identified as an emission category in solvent use sources. However, the sub-categories of coatings are inconsistent among different studies (Sun et al., 2018; Wu et al., 2016; Yin et al., 2015). It is unclear whether the emission inventories considered all of the industrial sectors associated with coatings. Adhesives are another important category of solvent use sources. Nevertheless, this category was missing in some emission inventories, or only shoe-making was considered among a number of sub-categories for adhesives (Bo et al., 2008; Sun et al., 2018; Wu et al., 2016; Yin et al., 2015). In addition, non-industrial solvent use such as pesticide or domestic solvents were usually not accounted for in the emission inventories (Bo et al., 2008; Fu et al., 2013). Apart from the differences in categories of solvent use, the emission factors used in different studies varied significantly. For example, the EFs differed several times for automobile coating (2.43–21.2 kg/vehicle) (Bo et al., 2008; Wu et al., 2016; Zhong et al., 2017). Emissions from domestic solvent use were always estimated by an emission factor with a unit of kilograms per capita. However, a recent study questioned the accuracy of using national population to estimate the solvent use emissions (Pearson, 2019).
Unlike the EF-based estimation, the mass balance or material balance (MB) approach provides reliable average emission estimates for specific sources in developing emission inventory for solvent use (U.S. EPA, 1995). This technique involves quantification of chemical material flows going into and out of a process, where the total discharges to the environment are estimated by input and output information based on the mass conservation principle. The MB technique was used to update NMVOC emission estimates for solvent products in the United States, which were validated by ambient NMVOC measurements (McDonald et al., 2018). The successful application of the MB technique for the solvent-related sources provides important support in developing more accurate emission inventories. Currently, there is still a lack of NMVOC emission inventories specialized in solvent use in China. In view of large discrepancies among different studies, re-evaluation of NMVOC emission estimates are needed for solvent use in China using the MB technique.
This study focuses on six categories of solvent products used in residential and industrial activities including coatings, inks, adhesives, pesticides, cleaners, and personal care products. The MB technique is adopted to estimate NMVOC emissions from these solvent products between 2000 and 2017 in China. Incorporating the source profiles, speciated NMVOC emissions for each solvent product are obtained. Estimated NMVOC emissions from solvent use in this study are compared with other studies and other sources. Finally, implications for NMVOC emission abatement in China are discussed in terms of ozone formation potential (OFP) and secondary organic formation potential (SOAP).
2.1 Emission estimation
Six types of organic solvent products are considered in this study, including coatings, inks, adhesives, pesticides, cleaners, and personal care products (Level 1). Coatings, inks, and adhesives are further classified based on application fields and/or technologies (Level 2) and solvent types (Level 3). Pesticides include herbicides, insecticides, bactericides, and other pesticides. Cleaners include laundry, dishwashing, surface cleaner, and industrial detergents. Personal care products are divided into four sub-categories: hair and body care, perfumes, skin care, and other cosmetics.
Organic compounds in solvent products have different volatilities, which can be characterized by effective saturation concentration C∗. Organic compounds can be classified into three categories according to the range of effective saturation concentration, namely high-volatility organic compounds (VOCs: µg m−3), intermediate-volatility organic compounds (IVOCs: to 3 × 10⁶ µg m−3) and semi-volatile organic compounds (SVOCs: C∗<0.3 µg m−3). Hence, the total NMVOCs in products are divided into VOCs and S/IVOCs, considering volatilization of VOCs and S/IVOCs respectively. The mass balance approach, also called material balance technique, is adopted to estimate NMVOCs emitted by organic solvent products, as detailed in McDonald et al. (2018). The total NMVOC emissions from solvent products are estimated using Eq. (1):
where En (g) is the total NMVOC emissions from all solvent products in a certain year n; Ai (g) is the consumption of product i; WVOC,i (g solvent g−1 product) is the average VOC content while is the average S/IVOC content in product i; VFVOC,i (g emitted g−1 dispensed VOC) and (g emitted g−1 dispensed I/SVOC) are volatilization fractions of VOCs and S/IVOCs for product i. Cn is the percentage of treatment facilities installed in the industrial sector in the year n; and ηavg is the average reduction coefficient induced by treatment facilities. Only end-of-pipe control of NMVOCs from industrial solvent use is considered in this study, while VOC treatment of residential emissions such as personal care products and daily cleaners is not implemented in residential and commercial buildings in China.
Product consumption data (Ai) are mainly collected from the official statistical yearbook. Consumption of adhesive is from the China Chemical Industry Yearbook (CPCIA, 2000–2016). However, formaldehyde-type adhesives are not reported in the yearbook in most cases. Considering that formaldehyde-type adhesive is mainly used in artificial board manufacturing, we assumed a linear relationship between formaldehyde-type adhesive consumption and the artificial board yield and estimated the missing data of formaldehyde-type adhesives based on this linear relationship (seeing Fig. S1). Consumption of ink, cleaner, and personal care are from the China Light Industry Yearbook (CNLIC, 2001–2018). It should be noted that consumption data for personal care products are not directly available in the yearbook but are estimated from dividing sales of the product by unit price. Consumption of coating are from the China Paint and Coating Industry Annual (CCIA, 2000–2017). There are four data sources collected for pesticide (Fig. S2); we choose the China Crop Protection Industry Yearbook (CCPIA, 2001–2017) and Duan (2018).
VOC content (WVOC) in products is derived from various domestic and international regulations or standards. Tables S1–S5 listed the Wvoc for different sub-categories of coatings, inks, adhesives, pesticides and cleaners, and personal care products, respectively. Taking architectural coatings as an example, the VOC content of solvent- and water-based coatings are obtained on two national standards (GB) for VOC emission restrictions in China – GB18582-2008 and GB24408-2009. Averages were used when several values are available from different regions of China and data sources. Those categories lacking Wvoc were approximated by the values from similar sources. S/IVOC content () is derived from ratios of VOCs and S/IVOCs to organic solvent. The equation of S/IVOC content is as follows:
where fVOC,i (g VOC g−1 solvent) and (g S/IVOC g−1 solvent) are fractions of organic solvents as VOCs and S/IVOCs in product i. The parameters of fVOC,i, , VFVOC,i, and in Eqs. (1) and (2) are taken from McDonald et al. (2018).
Monte Carlo analysis is applied to estimate uncertainty of annual emissions. We estimate the uncertainty by combining the coefficients of variation (CV, or the standard deviation divided by the mean) of the activity data and the VOC and S/IVOC content (Street et al., 2003). According to the accuracy and reliability of the activity data, five tiers for uncertainty in activity data were established by Wei et al. (2011a) as shown in Table S6. We set the uncertainty as ±30 % if data are directly from official statistics and ±80 % if activity data are estimated from other statistical information or reports. Uncertainty of WVOC is based on VOC content raw data (Tables S1–S5). Uncertainty of refers to that of WVOC. Specific classification of solvent use and various parameters are shown in Table S7.
2.2 Spatial allocation
Total NMVOC emissions of solvent use in China are allocated to provincial level based on a top-down approach. The proxy variables of cultivated land area, disposable income, sales value of different solvent products, and building area in different provinces are used for allocation (Table S8). There are limitations to using the proxy data to downscale from national to provincial emissions. For example, the sales value of the solvent products cannot fully represent the locations of solvent use processes. Some products might export from the manufacturing province to other provinces. This introduces the uncertainty in the spatial distribution of the solvent use VOC emissions. Note that local (provincial) statistics for all the solvent use products are still not comprehensively available in China. Nevertheless, direct estimates using local (provincial) statistics could reduce the errors from downscaling.
Then, the provincial emissions are calculated using Eq. (3).
where Em is the emissions from solvent use in province m; Ei is the emissions of solvent product i at the nation level; and Tm is the cultivated land area, disposable income, sales value, or building area completed in province m.
2.3 Estimation of speciated emissions, OFP, and SOAP
Speciated NMVOC emissions are calculated by allocating the source profiles to the corresponding emission sources. Source profiles of solvents use used in this study are obtained by combining domestic profiles (e.g., H. L. Wang et al., 2014; Yuan et al., 2010) and foreign profiles (McDonald et al., 2018), following the methods proposed by Li et al. (2014). Data sources and procedures of compiling the composite profiles of architectural coating, furniture coating, automobile coating, other coating, offset printing ink, letterpress printing ink, gravure printing ink, other printing ink, shoemaking adhesive, and herbicide are provided in Text S1 and Figs. S3–S12. For products lacking a domestic source profile, foreign source profiles were used.
The emissions of individual NMVOC species can be estimated by multiplying the total NMVOC emissions by the weight percentage of each species, as shown in Eq. (4).
where Ej is the emissions of species j from all sources, Ei is total NMVOC emissions from organic solvent product i, and fi,j is the weight percentage of species j in the emission of product i.
The OFP represents the maximum ozone contribution of NMVOC species, which can help identify the key reactive species and sources for ozone formation. The OFP of individual species can be calculated using Eq. (5).
where OFPj is the OFP of species j, Ej is the emissions of species j, and MIRj is the maximum incremental reactivity (MIR) of species j (Carter, 2010).
The SOAP indicates the SOA formation ability of different NMVOC species, which can be characterized by SOA yield (McDonald et al., 2018). Then, the SOAP of individual species can be calculated using Eq. (6).
where SOAPj is the SOAP of species j and YSOA,j is the SOA yield of species j. A list of the species and their MIR and SOA yield values used in this study can be found in Table S9.
3.1 Control of NMVOC emissions
The control on NMVOC emissions from solvent use were not widely implemented in China before 2010. To slow down the rapid growth in NMVOC emissions in China, the Action Plan for Air Pollution Prevention and Control issued by the State Council of China in 2013 explicitly proposed implementing control of NMVOC emissions from the solvent use industrial sources, including coatings but not the architectural coating, inks, industrial adhesives (woodworking, paper converting, shoemaking, fiber processing, packaging, and labeling), and industrial detergent considered in this study (Table S7). As the result, control measures are required to be installed for NMVOC-emitting industrial facilities related to solvent use in China. The percentage of solvent use industrial facilities with treatment devices (Cn in Eq. 1) has increased quickly in the recent years. Note that the NMVOC control technology is still developing and not mature in China. At this time, limited information is available to determine control technology by specific sectors and solvent products. The percentage of solvent use factories with treatment facilities was determined to be 50 % in 2015 based on detailed surveys filed in the centers of solvent product manufacturing in China – the Yangtze River Delta (YRD) (Lu et al., 2018; Yang et al., 2017) and Pearl River Delta (PRD) regions (Gao et al., 2015; Cai, 2016). Considering that exhaust gas treatment levels of different regions are close (MEEPRC, 2017), this value is adopted to represent the whole country. A drastic increase (by a factor of over 15) in the annual production values for the organic exhaust gas treatment industry was also recorded between 2013 and 2017 (EGPCCEPIA, 2008–2017). Due to 50 % of solvent use factories installing treatment facilities in 2015 and the fast growth of production values for organic exhaust gas treatment devices, we estimated the percentage of treatment facilities installed in the industrial solvent sector for other years, assuming slow (1 %), moderate (3.3 %), and fast (10 %–15 %) increase rates of the percentage before 2010, between 2010–2013, and after 2013, respectively (Fig. 1). We then used the estimated percentage with treatment facilities as Cn in Eq. (1).
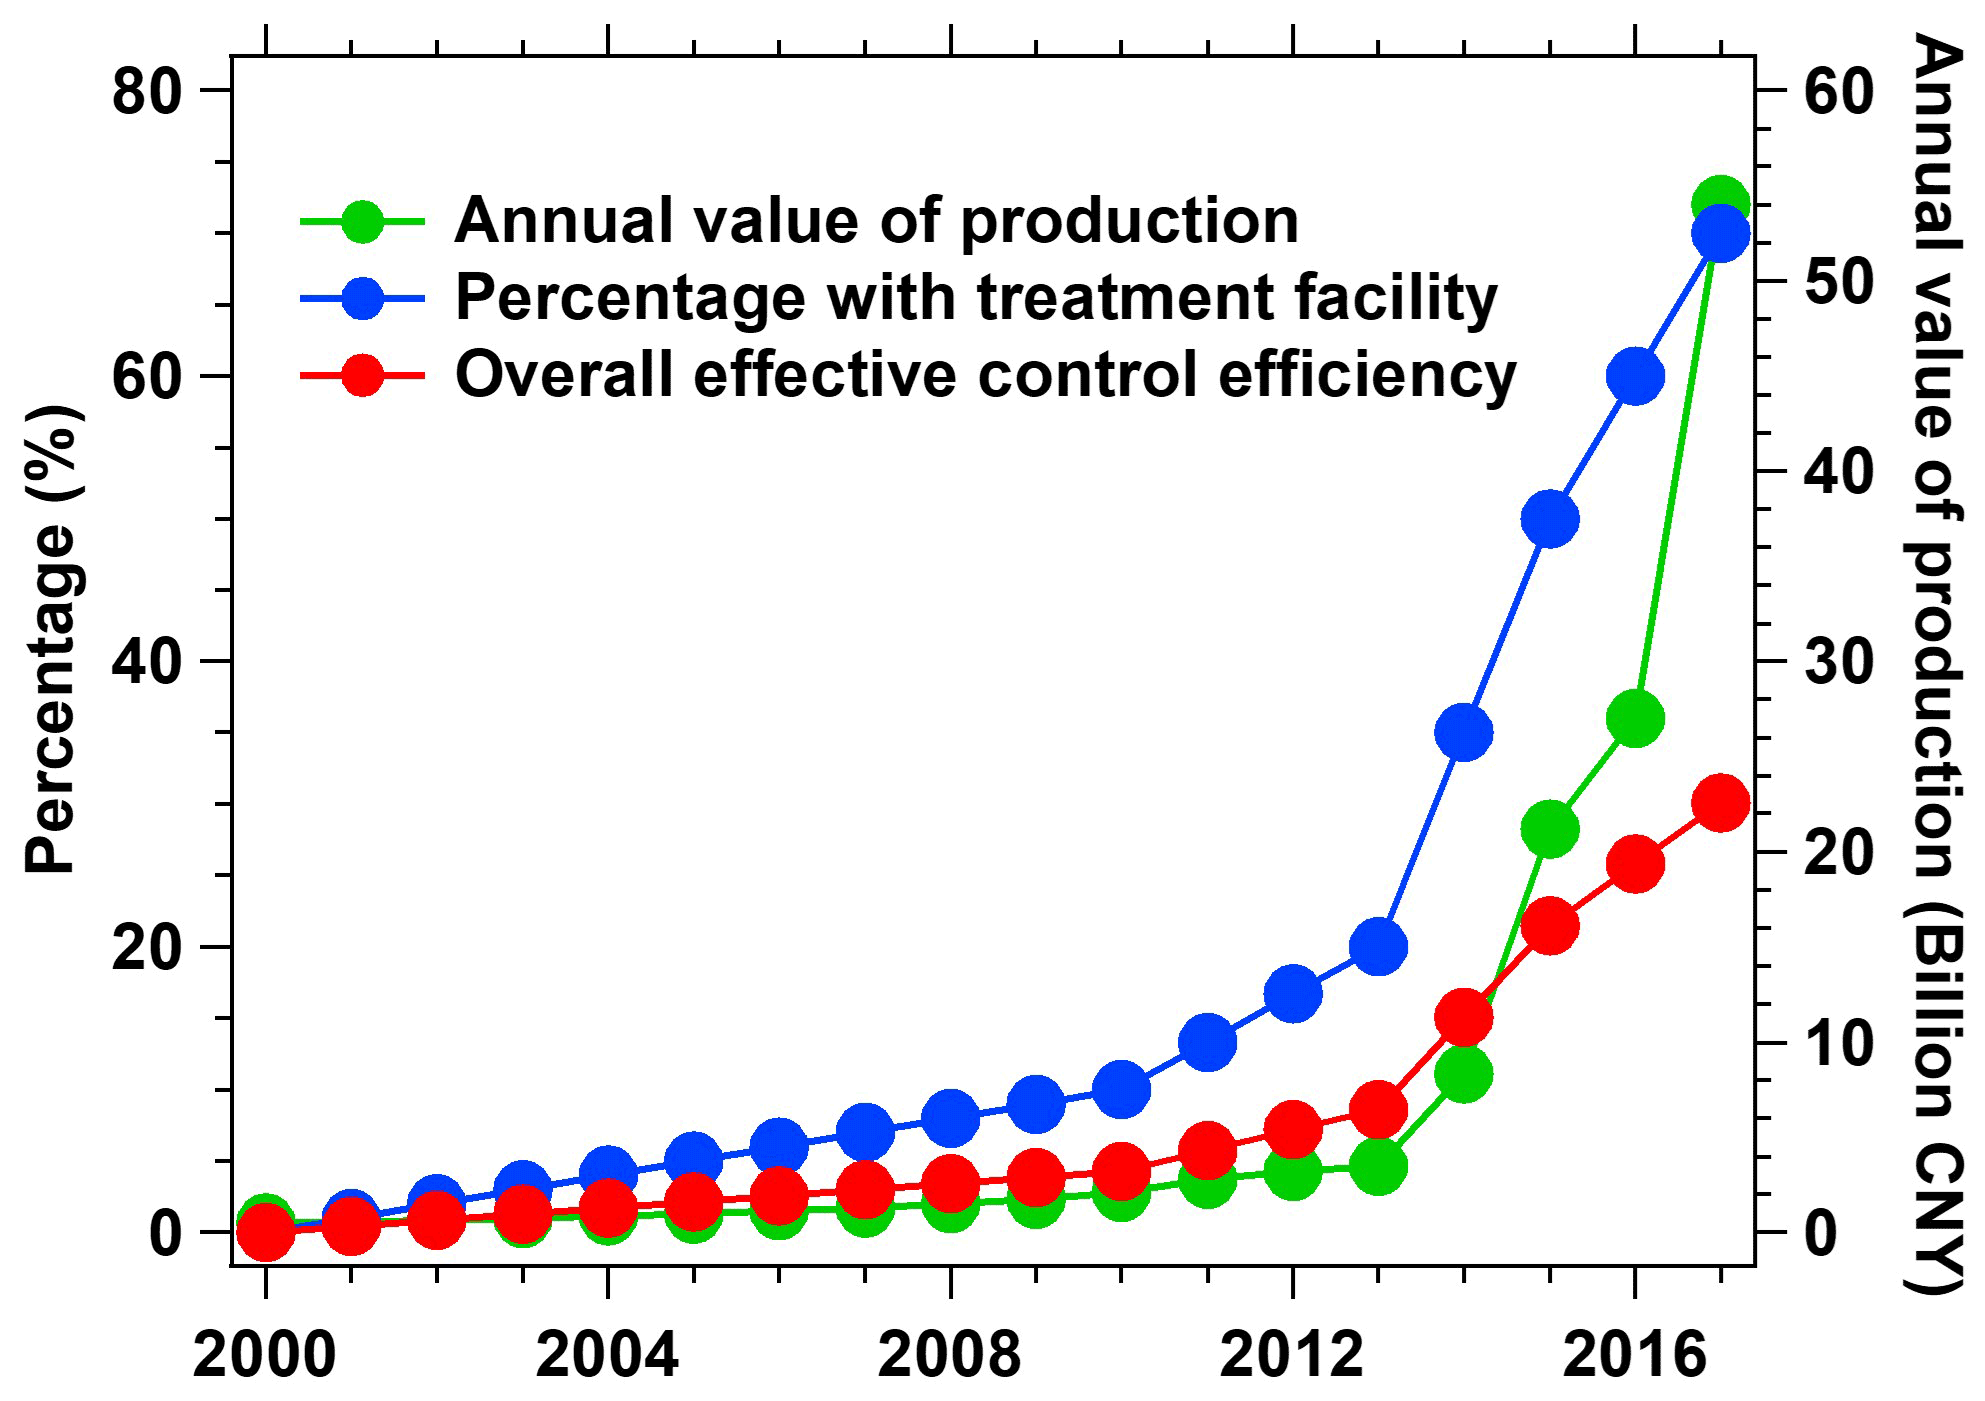
Figure 1The annual value of production for the organic exhaust gas treatment industry, percentage with treatment facility installed for solvent-relating factories, and the overall effective control efficiency for NMVOC emissions from industrial solvent use factories in China.
For the treatment facilities, the control efficiency varied significantly by adopted different technology, such as adsorption, absorption, catalytic combustion, photolysis, and plasma. Here, we determined averaged control efficiency (ηavg) based on the market shares of VOC control techniques (fn) and their control efficiency (ηn) (Table S10) using Eq. (7).
The market share of NMVOC control techniques and their control efficiency were collected from field surveys in the YRD and PRD regions (Lu et al., 2018; Cai, 2016). The average control efficiency was determined to be about 43 % based on the two surveys. Finally, the overall effective control efficiency (Cn×ηavg) for different years is shown in Fig. 1 and Table S11. The overall efficiency for industrial solvent use facilities increased moderately before 2010, with values of less than 5 %. It increased faster from 2013 at 9 % and reached 30 % in 2017.
3.2 Total NMVOC emissions
The estimated annual emissions of solvent NMVOCs in China between 2000 and 2017 are shown in Fig. 2 and Table S12. NMVOC emissions were found to continuously increase from 2000 to 2014 but reached a plateau afterwards. The total NMVOC emissions were estimated to be 1.6 Tg (1.2–2.2 Tg at 95 % confidence interval) in 2000, increasing (by a factor of 6.7) to 10.6 Tg (7.7–14.9 Tg) in 2017. We also considered another two scenarios to investigate the effect of control measures in the reduction of NMVOC emissions: emission without any control (scenario 1) and emission if control efficiency is compromised by 50 % (scenario 2), which represents widespread lack of maintenance in NMVOC treatment facilities and/or stopping running of treatment facilities to save costs. In both scenarios, continuous growth of NMVOC emissions from 2000 to 2017 was observed. NMVOC emissions in 2017 for the two scenarios were estimated to be 13.1 and 11.8 Tg, significantly higher than the estimates considering the real maintenance practice of NMVOC control (i.e., the best estimate). These results indicate the importance of NMVOC control measures in preventing the fast increase in NMVOC emissions from industrial solvent use. The overall effective control efficiency in industrial NMVOC emissions was estimated to be only 30 %, leaving significant room to further increase the overall control efficiency. This would be more easily achieved by adopting the NMVOC control techniques with better control efficiency (e.g., catalytic combustion), as most of the industrial NMVOC facilities already have treatment facilities (70 % in 2017).
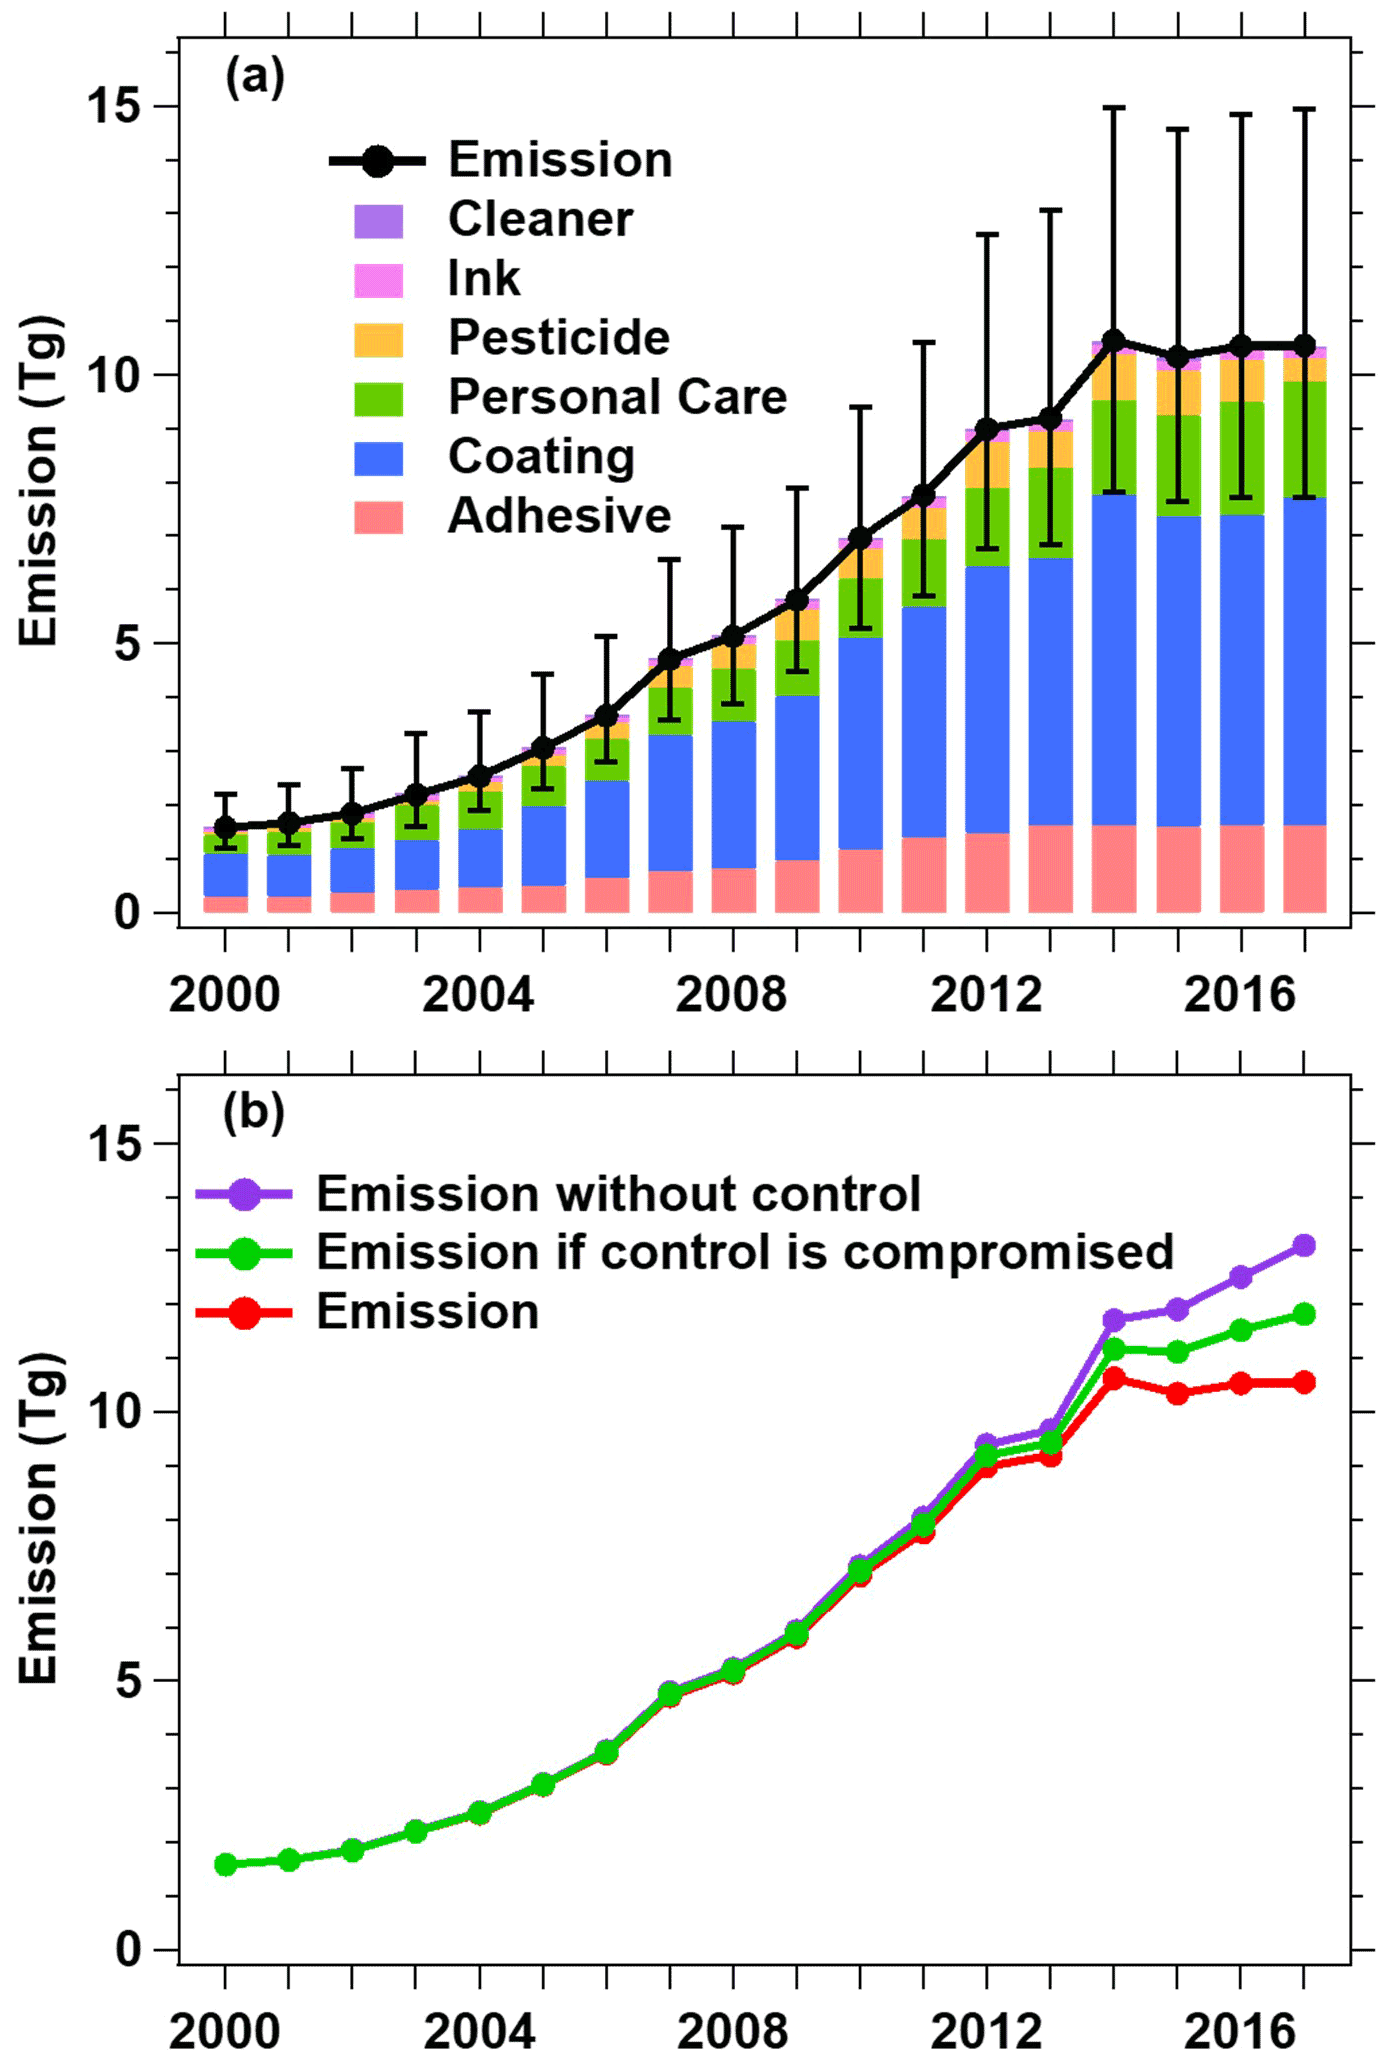
Figure 2(a) Annual NMVOC emissions from solvent use from 2000 to 2017 in China. (b) Three scenarios are considered: emission without control; emission if control is compromised considering the lack of manual maintenance of facility; emission considering the real maintenance practice of NMVOC control.
On the basis of the best estimate of NMVOC emissions, coating was the major contributor to the total solvent NMVOC emissions in most years (42 %–58 % of total emission during 2000–2017). The NMVOC emissions from coatings reached 6.1 Tg in 2017, an increase of 5.3 Tg (660 %) compared with those (0.8 Tg) in 2000. Personal care products (emitting 2.2 Tg NMVOCs in 2017) ranked second in the contributions to NMVOC emissions, which lacked comprehensive estimates in previous inventories. (Wu et al., 2016; Fu et al., 2013; Wei et al., 2008; Bo et al., 2008). Following were adhesives emissions, increasing from 0.3 Tg in 2000 to 1.6 Tg in 2017. It was commonly used in shoemaking and furniture manufacturing, which were fast-developing industries in China. Pesticides were also an important source of NMVOC emissions from solvent use, accounting for 3 %–10 % of total emissions. Apart from coatings, personal care products, adhesives, and pesticides, NMVOC emissions from inks and cleaning agents accounted for a small proportion (2 %–5 %) of total solvent NMVOC emissions. In particular, the production of cleaners was large in China, approaching 13 Tg in 2017. However, in view of the low solvent content of most cleaning agents and their treatment processes (e.g., most S/IVOCs entered the sewage system), NMVOC content is less than 1 % in the cleaning agent (0.005g VOC g−1 cleaning agent in 2017). Emissions from industrial solvent use were dominant (56 %) in 2017 due to the huge industrial demand for adhesives and coatings in China. About 82 % of NMVOCs from non-industrial sources were caused by architectural coatings and personal care products. In summary, coatings, personal care products, adhesives, and pesticides were four major NMVOC emission products, accounting for more than 95 % of total emissions, suggesting that these products are key solvent sources for NMVOC control in China.
3.3 Provincial emissions
Provincial emissions and their contributions by source in 2017 are shown in Fig. 3. Jiangsu, Shandong and Guangdong provinces contributed the most in China, emitting 1.3 Tg (12.2 % of solvent NMVOC emissions in China), 1.1 Tg (10.1 %), and 1.0 Tg (9.7 %) NMVOCs, respectively. Coatings dominated in the emissions of the three provinces, accounting for 65 %, 60 %, and 61 % of solvent NMVOC emissions in Jiangsu, Shandong, and Guangdong. Similarly, with coatings as the major contributor, Zhejiang, Henan, Hubei, Sichuan, Fujian, Hunan, and Anhui were also on the top 10 list of NMVOC emissions. These provinces are mainly located in the eastern and middle areas of China, where the economy is developing fast and industrial activities are densely distributed, which are driving factors for high NMVOC emissions. By contrast, Xinjiang, Gansu, Ningxia, Qinghai, and Xizang, located in the vast western inland areas with a sparse population and slower economic growth, generated no more than 0.1 Tg in 2017. In these slower developing provinces, personal care product and pesticide emissions comprised a relatively large part because of a lower contribution from industrial sectors. These features suggested that the NMVOC emissions in different provinces of China were significantly associated with the developments of urbanization and industrialization.
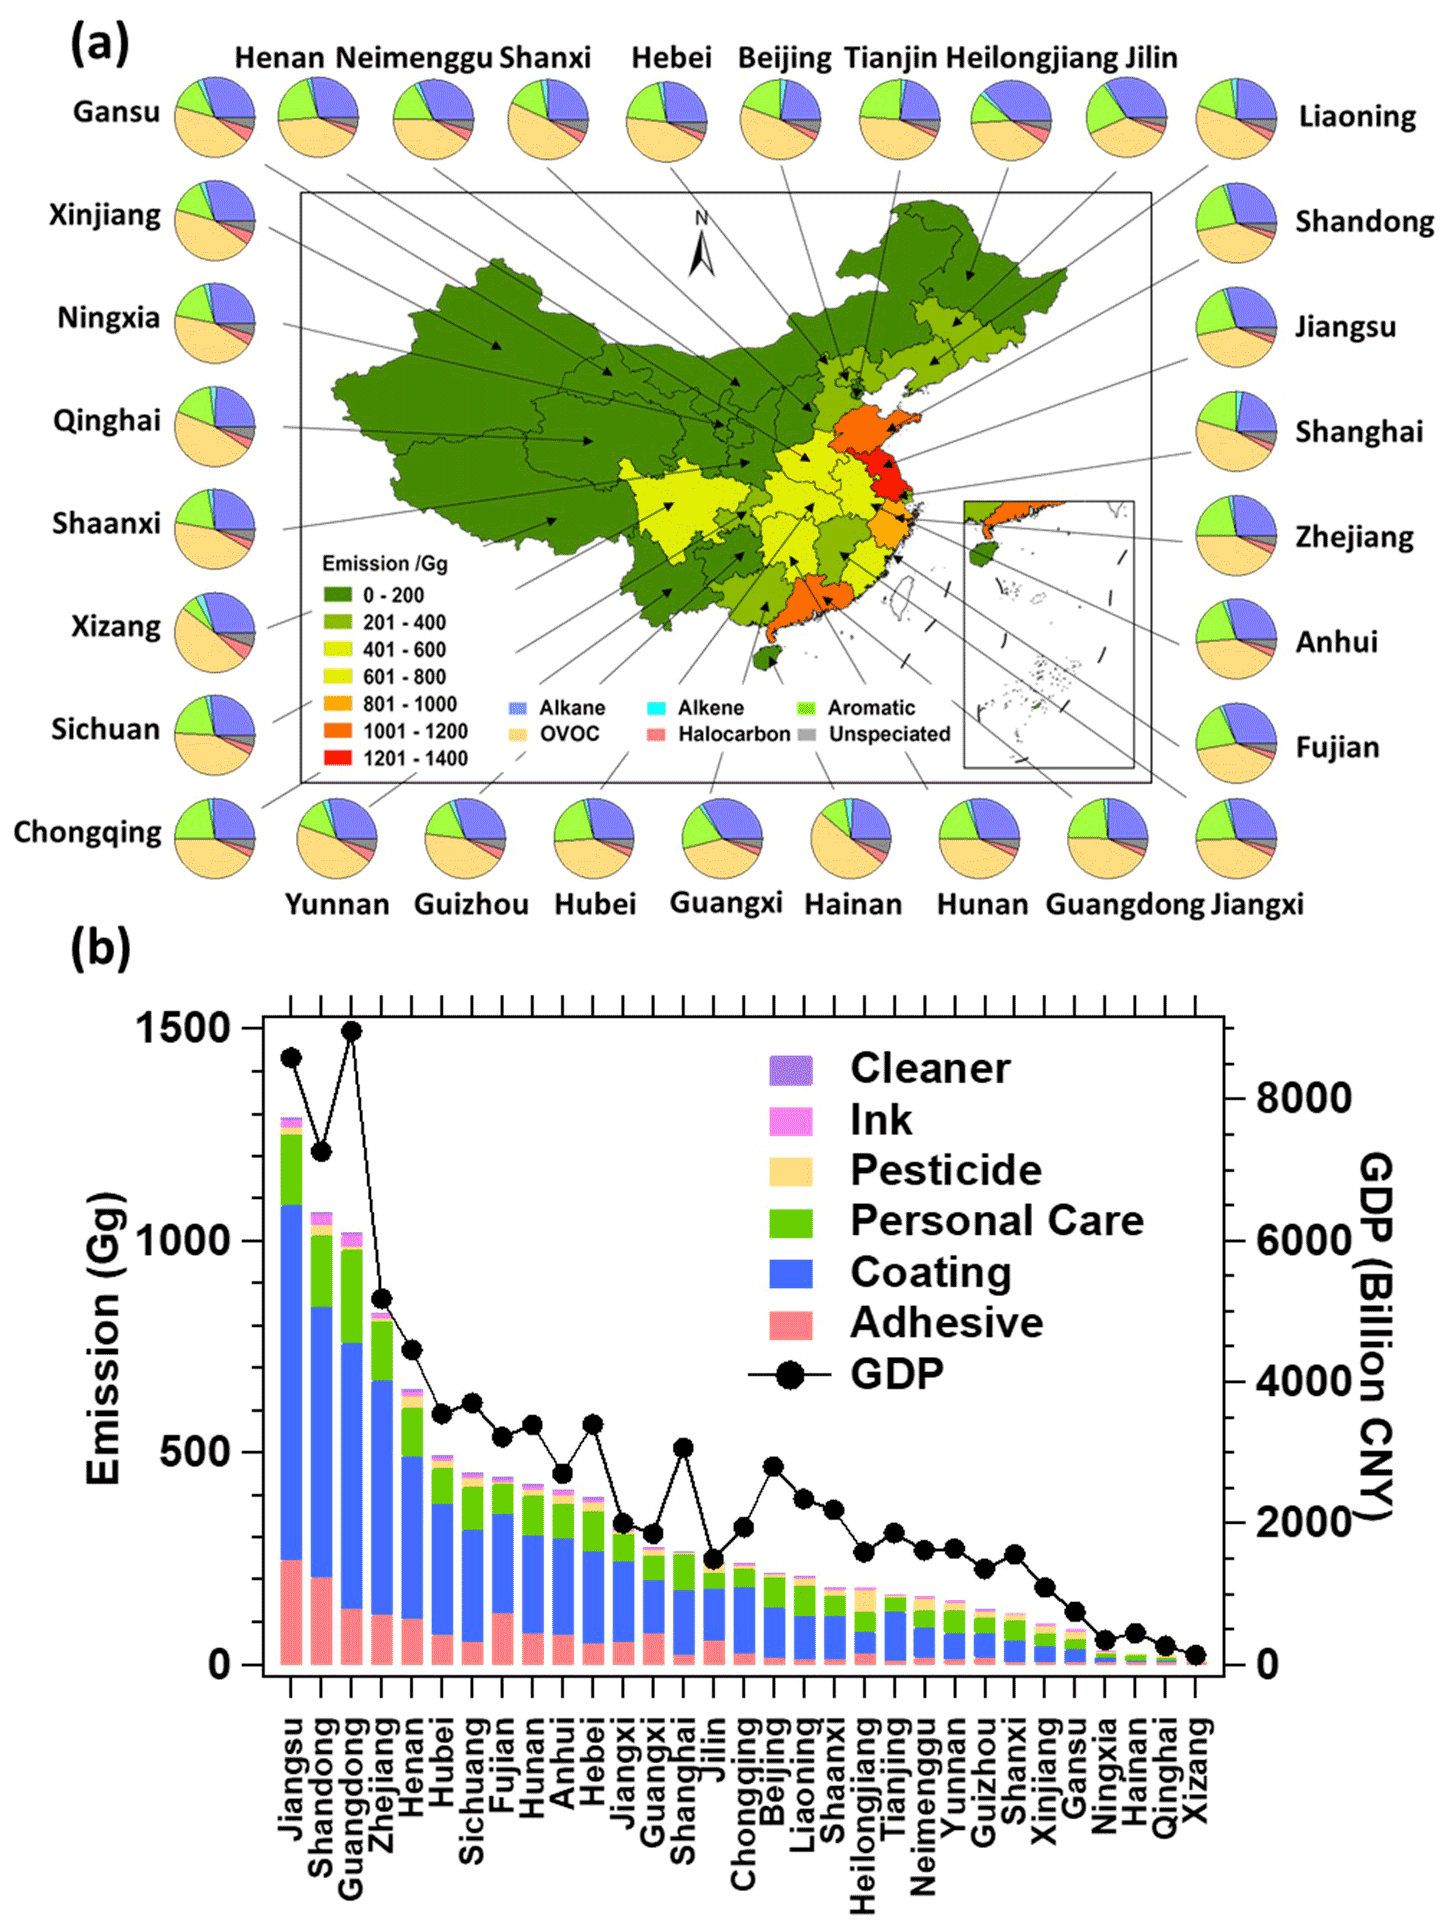
Figure 3(a) Spatial distributions of solvent use NMVOC emissions in China and (b) their source contributions in different provinces in 2017.
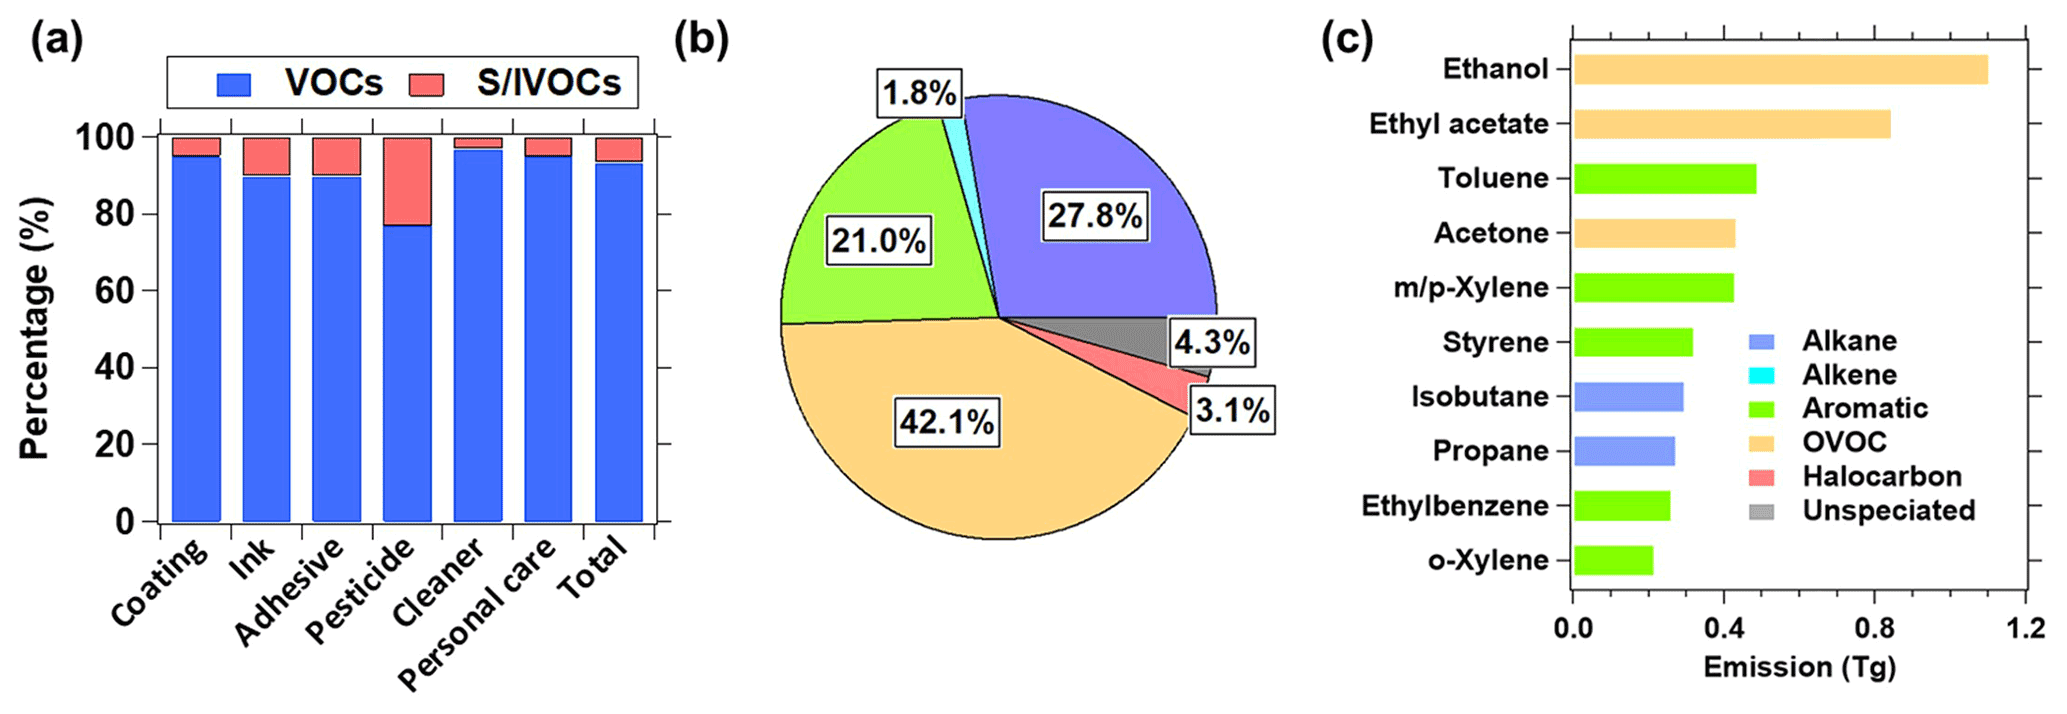
Figure 4(a) Contributions of VOCs and S/IVOCs, (b) NMVOC functional group pattern, and (b) the top 10 species in NMVOC emissions in 2017 from solvent use.
3.4 Speciated NMVOC emissions, OFP, and SOAP
The total NMVOC emissions can be divided into VOCs and S/IVOCs according to Eq. (1), contributing 93 % and 7 %, respectively (Fig. 4a). Among the solvent use products, pesticides emitted the largest contribution (23 %) of S/IVOCs, followed by inks (10 %), adhesives (10 %), coatings (5 %), personal care products (5 %), and cleaners (4 %). This was because of larger S/IVOC content ( %) in pesticides compared with other products (Table S7). As pesticide emissions were much smaller than those of coatings and adhesives (Fig. 2), total S/IVOC emissions were not significant (<10 % of total NMVOC emissions). Nevertheless, estimates of S/IVOC emissions exhibit large uncertainties because of the lack of local measurements of S/IVOC content in chemical products used in China. Of the total NMVOC emissions (10.6 Tg), oxygenated VOCs (OVOCs), and alkanes were the main components, accounting for 42 % and 28 %, respectively (Fig. 4b). They were followed by aromatics (21 %), halocarbons (3 %), and alkenes (2 %). The functional group contributions are generally similar among different provinces (Fig. 3a). The top three NMVOC groups were similar to those in a previous emission inventory, with OVOCs (more than 35 % of total emissions), aromatics (24 %), and alkanes (21 %) as the main NMVOC groups (Wei et al., 2008). The large amount of alkanes mainly came from coatings and adhesives (Fig. S13), contributing 1.3 and 1.0 Tg of total alkanes, respectively, in 2017. OVOCs were dominated by coatings (2.4 Tg) and personal care products (1.4 Tg). Of total aromatics emissions (4.4 Tg), nearly 88 % of the emissions were attributed to coatings. For the individual species (Fig. 4c), the top 10 species of emission were ethanol (1.1 Tg), ethyl acetate (0.8 Tg), toluene (0.5 Tg), acetone (0.4 Tg), -xylene (0.4 Tg), styrene (0.3 Tg), isobutane (0.3 Tg), propane (0.3 Tg), ethylbenzene (0.3 Tg), and o-xylene (0.2 Tg). As a common component of daily-used solvent products, ethanol was the largest emission species from personal care products and cleaner. This suggests that solvent use might be another important emission source of ethanol in urban areas in addition to vehicle emissions for the regions using ethanol-containing gasoline (Khare and Gentner, 2018; de Gouw et al., 2012).
Comparison of emissions, OFP, and SOAP in 2000 and 2017 are shown in Fig. 5 in terms of NMVOC groups and solvent use categories. NMVOC emissions from solvent use increased from 1.6 Tg in 2000 to 10.6 Tg in 2017 by a factor of 6.7. OFP and SOAP increased from 3.2 to 21.3 Tg (by a factor of 6.6) and from 0.06 Tg to 0.39 Tg (by a factor of 6.7), respectively. The similar growth factors among emissions, OFP, and SOAP indicate relatively small effects of emission structure and reactivity of NMVOCs. The largest group of OFP was aromatics, accounting for 54 % of total OFP in 2017 (Fig. 5a). OFP from OVOCs and alkanes took up only 27 % and 14 % respectively, though their emissions are higher. OFP of alkenes only contributed 4 %. As for SOAP, aromatics were also the main contributor (38 %). It was followed by alkanes (31 %), OVOCs (12 %), and alkenes (6 %). The differences in emissions, OFP, and SOAP contributions from NMVOC groups are due to differences in MIR and SOA yields of NMVOC species. Figure 5b shows OFP and SOAP from solvent use categories. Coatings are the major contributors to OFP and SOAP, accounting for 68 % and 58 % respectively in 2017. The contributions of adhesives and personal care products to OFP (14 %) and SOAP (16 % and 15 %) are similar. OFP and SOAP from ink, pesticide, and cleaner are less than other three categories, with the total not exceeding 10 %.
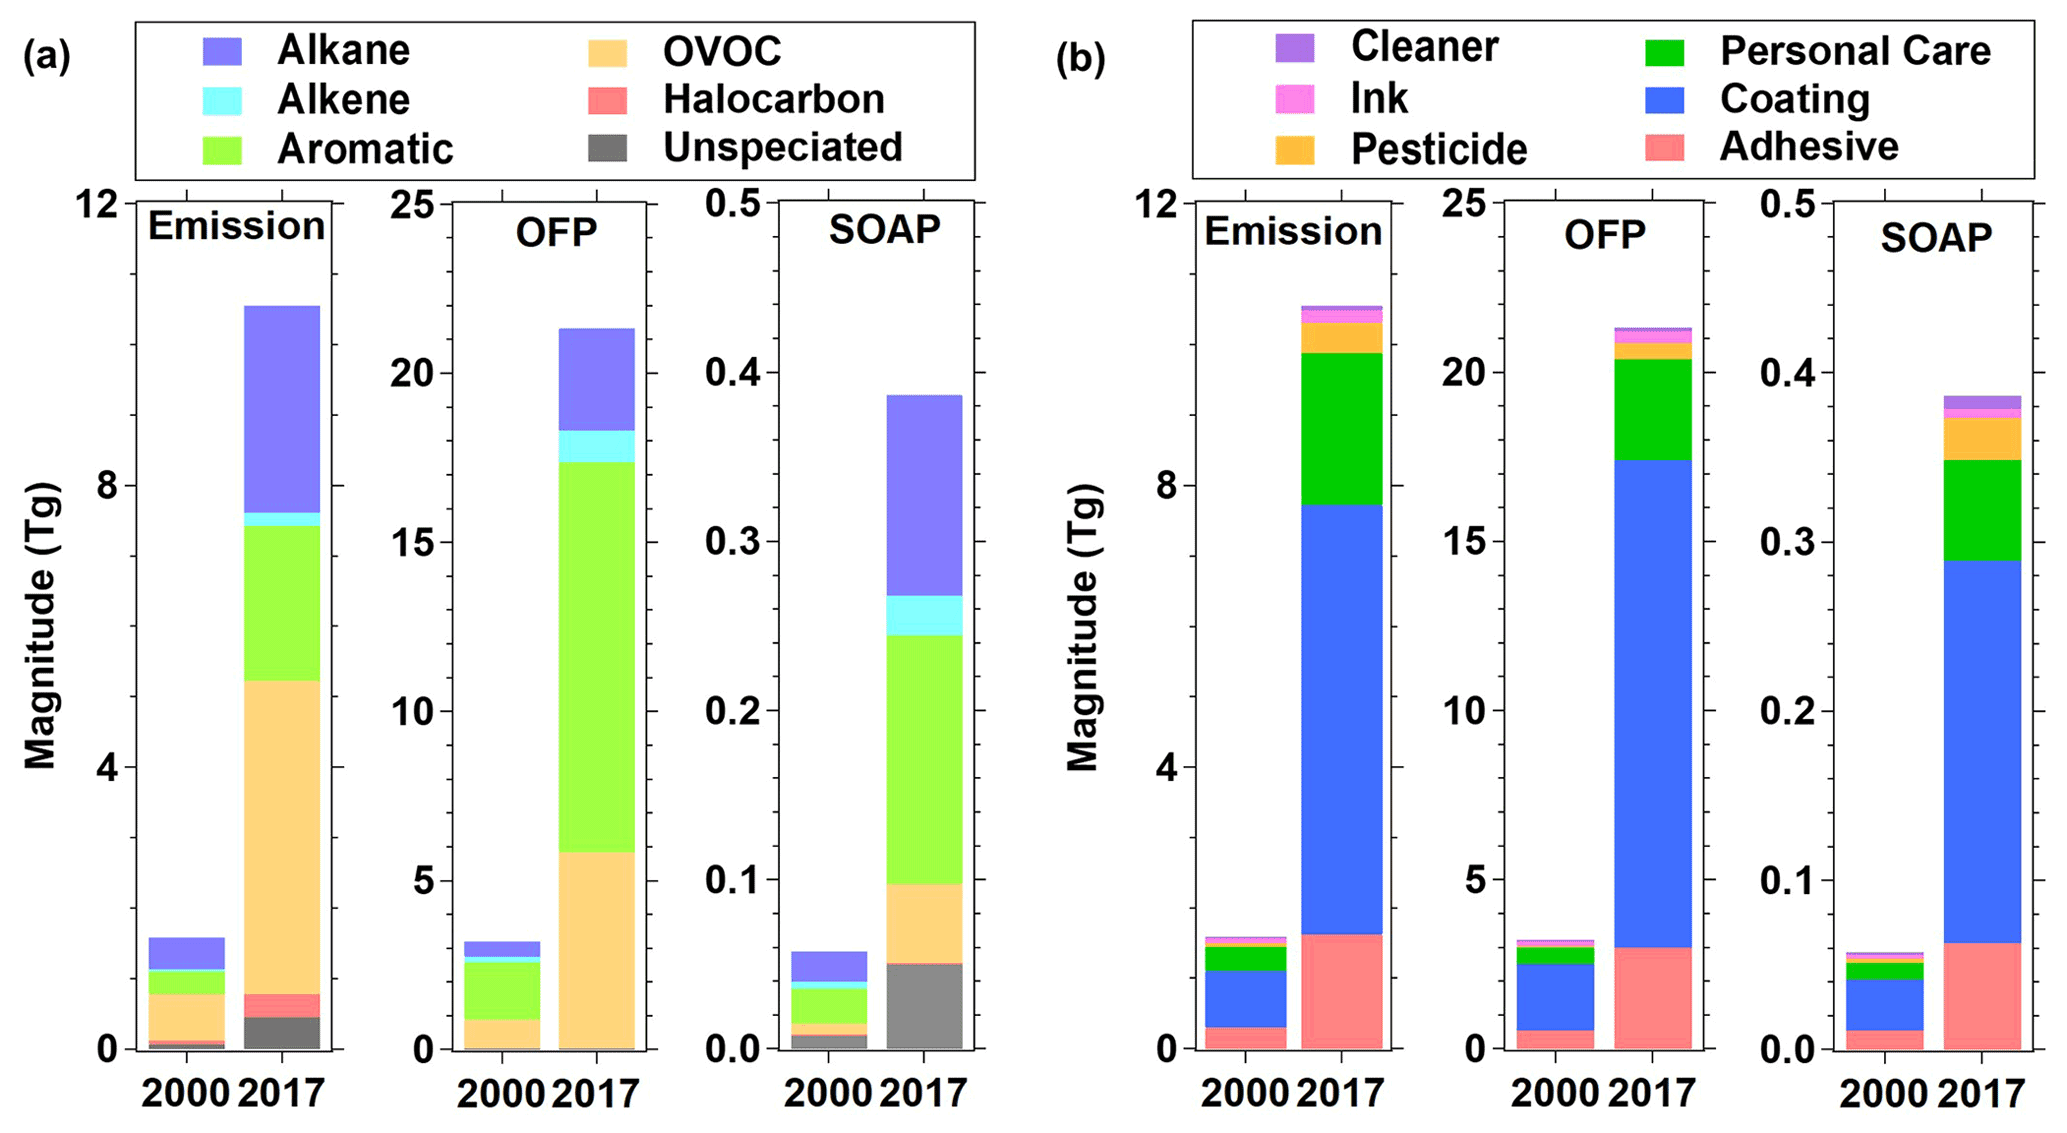
Figure 5Contributions from (a) different source categories and (b) different NMVOC groups to emissions, OFP, and SOAP of NMVOCs from solvent use in 2000 and 2017.
4.1 Comparison with other studies
The MB-based NMVOC emissions from solvent use in this study are compared with EF-based EIs in the literature (Fig. 6), including the Regional Emission inventory in Asia (REASv3.2) (Kurokawa and Ohara, 2020), Emission Database for Global Atmospheric Research (EDGARv4.3.2, 2021), MEIC (Li et al., 2019), Sun EI (Sun et al., 2018) and Wu EI (Wu and Xie, 2017; Wu et al., 2016). Our estimates peaked in 2014, as did those of REASv3.2, whose emissions, however, were much higher. The reason is mainly due to higher emission factors used in solvent use (SLV) and paint use (PAIN) estimates in REASv3.2. Some solvent source categories like pharmaceutical production and edible oil production (Wei et al., 2008) were not included because of the lack of estimation parameters such as Wvoc for these sources. However, their contributions are not significant (<5 %) to the total solvent use emissions (Wei et al., 2008). Emissions in EDGARv4.3.2 were significantly higher than ours in the early 2000s. However, with a much higher annual growth rate of 12 % in our work, emissions surpassed those in EDGARv4.3.2 after 2011. Different activity data were used in EDGARv4.3.2, which was the main reason for the nearly linear increase in solvent use emissions. Compared with the domestic long-term EIs in China, our results were much higher than Sun EI (from 1.6 Tg in 2000 to 5.0 Tg in 2015; 8 %) but very close to MEIC (from 2.3 Tg in 2000 to 11.9 Tg in 2017; 10 %). The reason for the lower emissions in Sun EI is because of lower EFs, for example, 80 g kg−1 in Sun EI compared with 620 g kg−1 in MEIC for architecture interior wall coating (Table S13). Adhesive emissions were not calculated in Sun EI, which was also an important difference. MEIC showed a continuously increasing trend after 2014 but a plateau of NMVOC emissions was found in this study. It is probably because MEIC did not consider the control of NMVOCs in recent years.

Figure 6Comparison of NMVOC emissions from solvent use between this study and previous estimates.
The single-year estimates of Bo et al. (2008) and Wu et al. (2016) were lower that of while Wei et al. (2008) was higher than our results. The reasons for the lower estimates in Bo et al. (2008) and Wu et al. (2016) were mainly due to not excluding the adhesive emissions and different methods used to estimate personal care emissions (Table S13). EFs of solvent-based adhesives and inks in Wei et al. (2008) were higher than estimation parameters in our work. Different types of activity levels and emission factors resulted in the large discrepancy in EIs. In general, different source categories, EFs, and activity data collectively contribute to the differences among the EIs (Table S13).
To further examine the emission differences, we compared the emission estimates between this study and another two EIs, MEIC and Sun EI, with available sub-categories of solvent use (Fig. 7). Coating emissions in this study agreed well with MEIC but were much higher than those of the Sun EI (Fig. 7a). This was attributed to the fact that coating emissions in Sun EI only considered architecture, vehicle, and home appliance coating but ignored other coating industries (can coating, magnet wire coating, ship painting). Ink emissions were much larger in MEIC, while similar results were found for Sun EI and this study (Fig. 7b). The reason is mainly because low-emission and high-emission inks were considered in both Sun EI and this study, resulting in much lower estimates than MEIC that adopted a high and universal emission factor. For adhesives, the estimated emissions in this study were higher than MEIC after 2006 (Fig. 7c). This might be attributed to different emission factors and increased consumption of formaldehyde-type adhesives, which is missing from the statistical yearbook. Note that adhesives were not included in Sun EI. Pesticide emissions showed a similar trend between Sun EI and this study but were lower than estimates in MEIC (Fig. 7d). There was a significant decrease in 2017 in our work due to the fact that the production of pesticides had decreased and export had increased (Fig. S2). For personal care products, this work estimated much larger emissions than MEIC and Sun EI (Fig. 7e). MEIC and Sun EI estimated domestic solvents emissions using emission factors with a unit of kilograms per capita and population data. Therefore, the emission trends of personal care products in MEIC and Sun EI followed the increasing pattern of China's population (Fig. 7e). In contrast, this study adopted consumption data of personal care and solvent content used in chemical products for estimation. The disposable income of households showed similar growth with our results of the emissions from personal care, suggesting more reasonable estimates in this study.
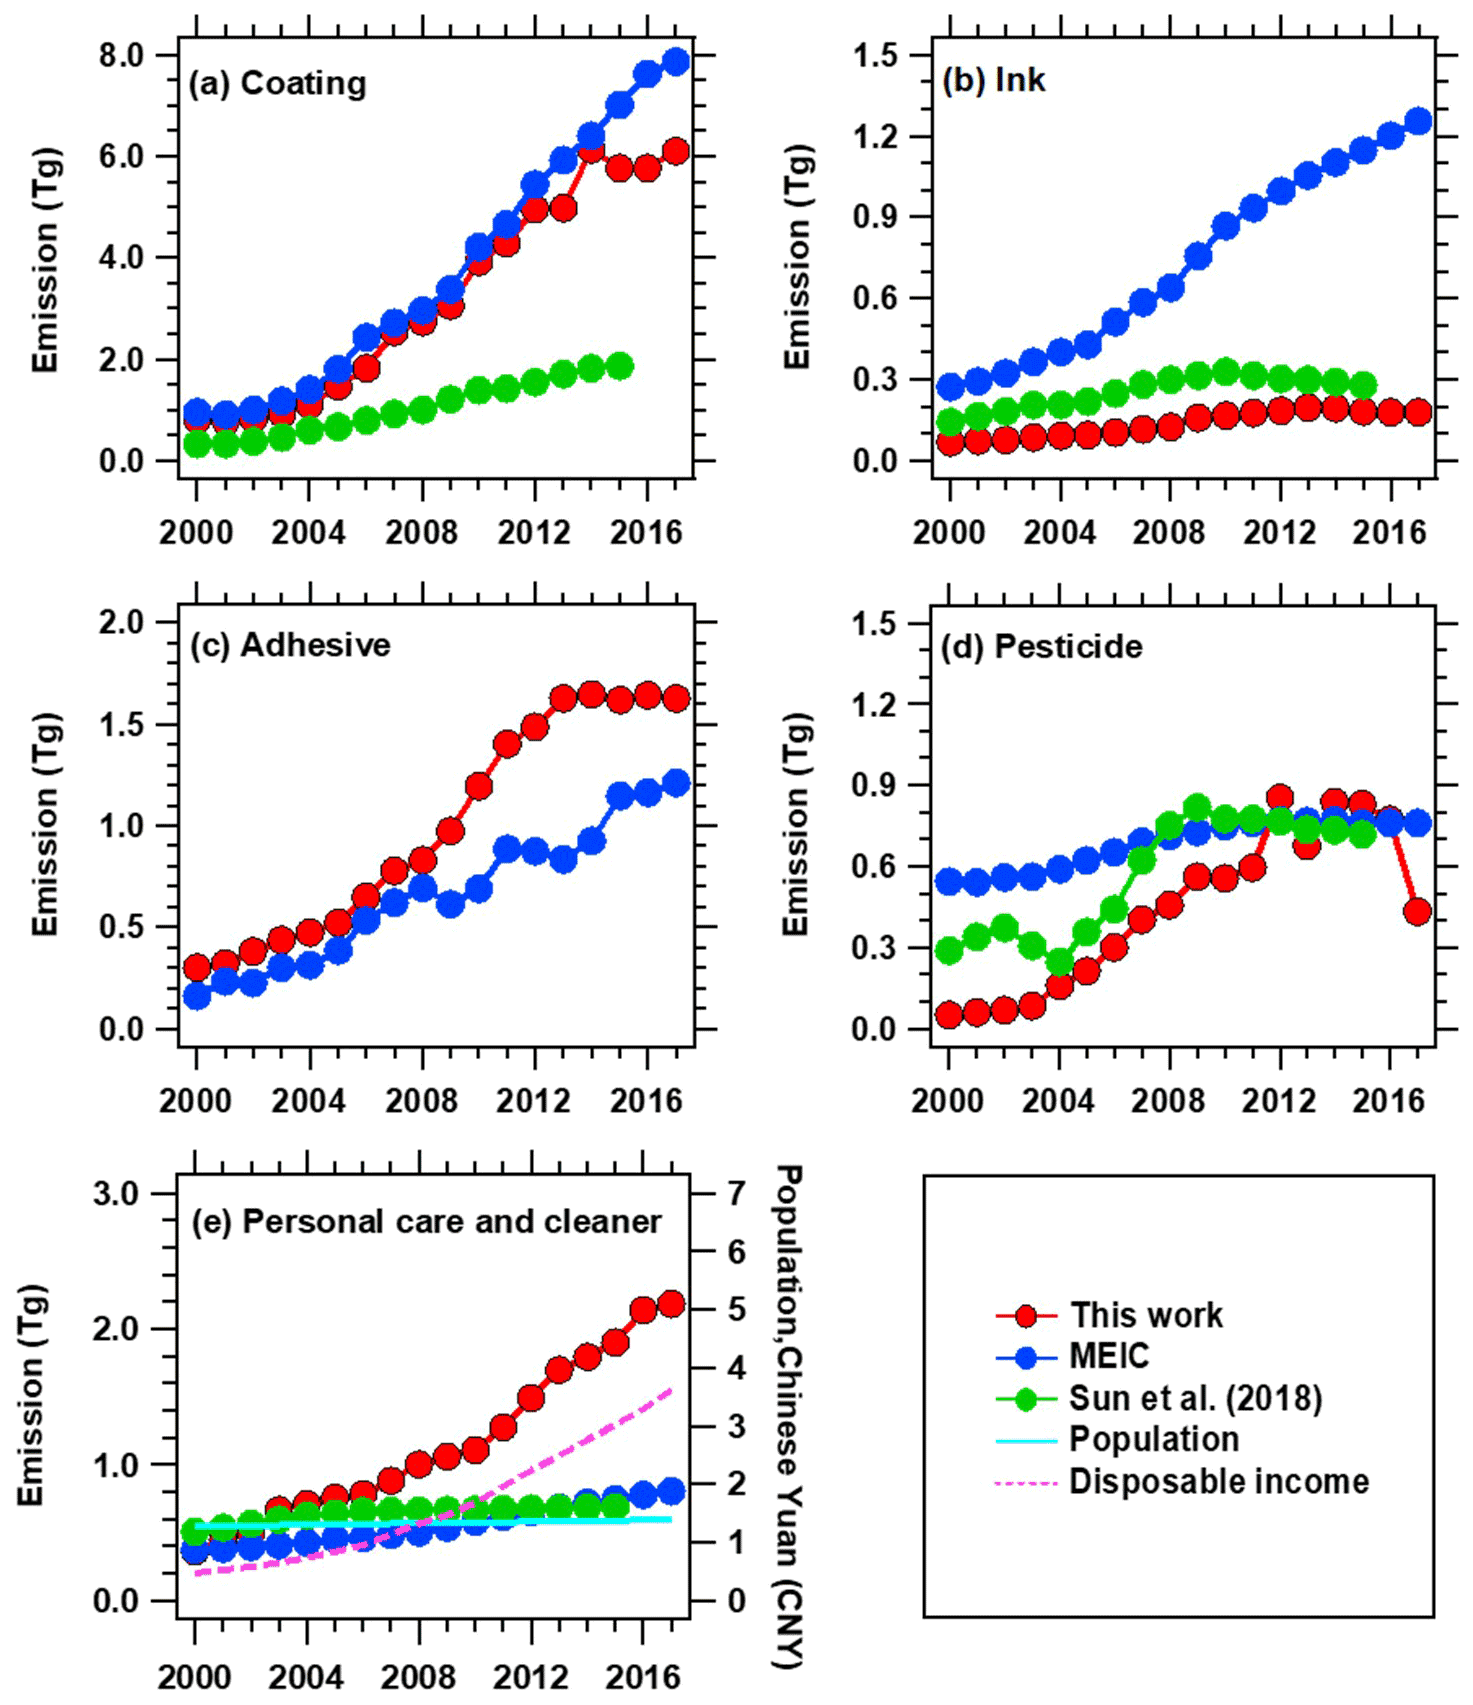
Figure 7Comparisons of emission estimates for (a) coatings, (b) inks, (c) pesticides, (d) adhesives, and (e) personal care products and cleaners (industrial detergents are not included in this figure) between this work and other studies (Li et al., 2019; Sun et al., 2018). Also shown are population (billion) and disposable income of households (1013 CNY).
4.2 Implications for NMVOC control
In order to reduce NMVOC emission from solvent use, water-based products, which are regarded as environmentally friendly, can substitute solvent-based products in China. Taking the 2017 data as an example, we assumed that all solvent-based products were replaced with water-based products and evaluated NMVOC emission reduction effect. Figure 8 shows the reduction of emissions, OFP, and SOAP after replacing solvent-based with water-based products. NMVOC emissions are reduced by 37 % from 10.6 to 6.7 Tg, while OFP and SOAP are reduced by 41 % from 21.3 to 12.6 Tg and 38 % from 0.39 to 0.24 Tg, respectively. In terms of species groups, the top three groups of NMVOC emission reduction are OVOCs (reduction of 1.5 Tg, 14 % of total emissions), aromatics (1.2 Tg, 11 %), and alkanes (1.0 Tg, 9 %). However, the top three groups of OFP and SOAP reduction are different from those of emissions. Aromatics (reducing 5.8 Tg, 27 % of total OFP), OVOCs (1.8 Tg, 8 %), and alkanes (1.0 Tg, 5 %) are the main groups of OFP reduction, while aromatics (reducing 0.08 Tg, 20 %), alkanes (0.04 Tg, 10 %), and OVOCs (0.01 Tg, 3 %) contribute most to SOAP reduction. Coatings contribute most to NMVOC emission, OFP, and SOAP reduction because of the dominant proportion (74 %) of solvent-based products in industrial coating. In contrast, the reductions of adhesives and inks emissions, OFP, and SOAP are minor due to the widespread use of low-VOC content products, accounting for 82 % of total adhesives and 65 % of inks. In general, replacing solvent-based with water-based products would benefit the NMVOC reductions with coatings and aromatics abatement being effective in OFP and SOAP reduction.
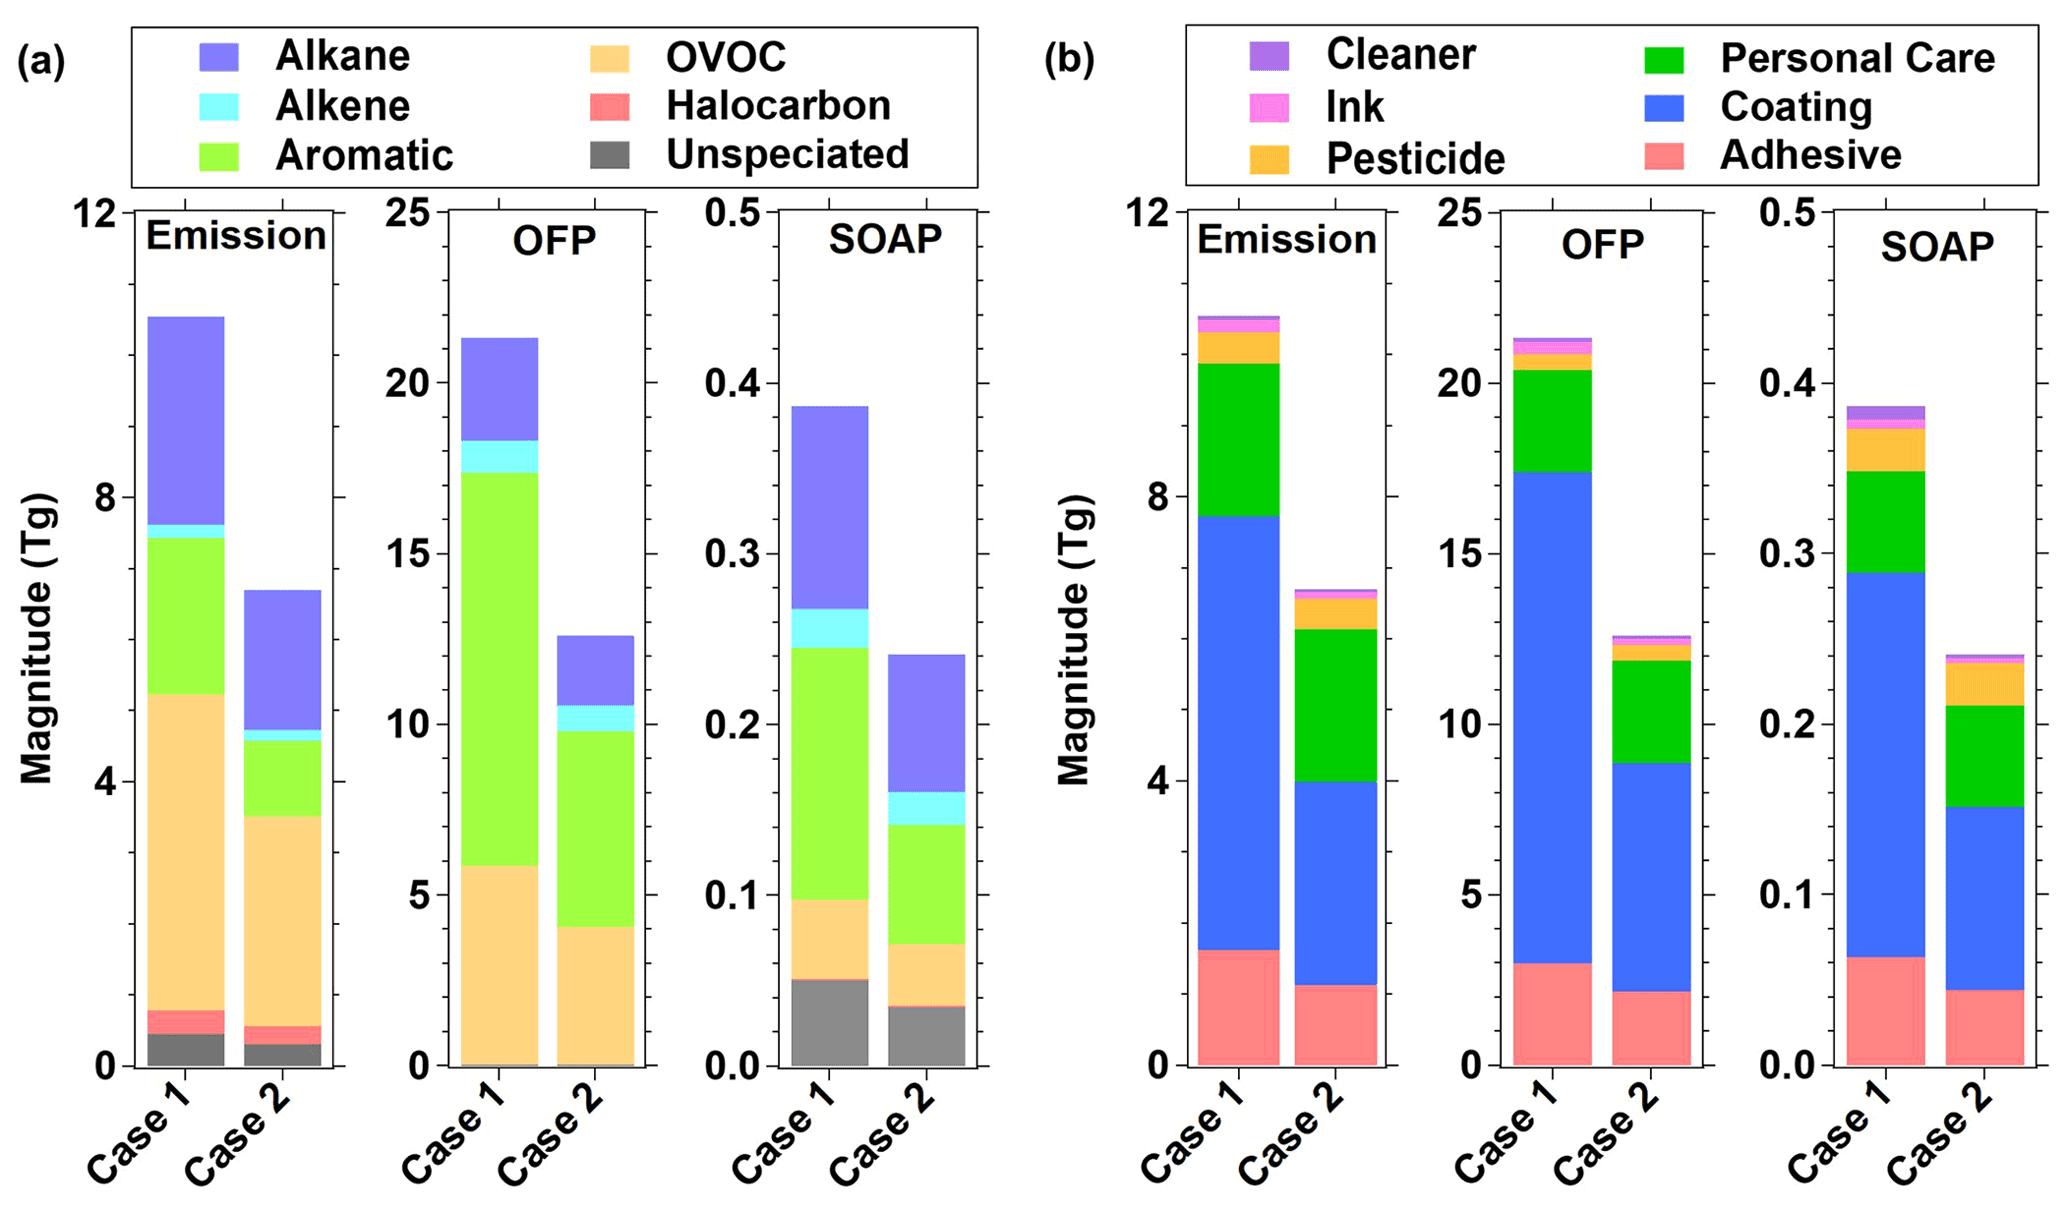
Figure 8Contributions from (a) different source categories and (b) different NMVOC groups to emissions, OFP, and SOAP. Case 1: emissions in 2017, Case 2: emissions in 2017 after solvent-based products were replaced with water-based products.
A NMVOC emission inventory including six categories of solvent products was developed for the period of 2000–2017, based on the mass balance method. Solvent use NMVOC emissions were estimated to increase from 1.6 Tg (1.2–2.2 Tg at 95 % confidence interval) in 2000 to 10.6 Tg (7.7–14.9 Tg) in 2017. However, emissions leveled off between 2014 and 2017. The control efficiency of industrial solvent NMVOCs was only 30 % in 2017, and there is still room for improvement in NMVOC control efficiency. Future emissions of NMVOCs from solvent use depend on product consumption, product solvent type, and overall control efficiency. The major sources of NMVOC emissions in solvent products were coatings, adhesives, and personal care products, together contributing more than 90 % of the total emissions. Industrial solvent emissions were dominant due to widespread use of adhesives and coatings across the industrial sectors. Personal care products and architectural coatings were major sources of non-industrial solvent emissions. The regional distribution of VOC emissions was highly associated with the level of economic development. Economically developed provinces in China contributed much more solvent NMVOCs than underdeveloped areas. Alkanes and OVOCs were the main species emitted from solvent use, followed by aromatics. They were mainly emitted from adhesives, coatings, and personal care products. The top 10 emission species were ethanol, ethyl acetate, toluene, acetone, -xylene, styrene, isobutane, propane, ethylbenzene, and o-xylene.
OFP and SOAP from solvent use were 21.3 and 0.39 Tg in 2017 respectively. Alkanes, alkenes, and aromatics were major contributors to OFP and SOAP. Compared with other solvent use categories, reducing coating emissions is more effective in controlling O3 and SOA pollution. Emissions from solvent use grew quickly (with an over 5-fold increase) during 2005–2013 and reached a plateau after 2014, which we attribute to the significant industrial expansion in China over the past decades, and effective control on solvent use in recent years (Fig. S13). In contrast, combustion and transportation exhibited a decline in the past decade, mainly because of the stringent control of NMVOCs from fuel combustion by industry and on-road vehicles.
There is more prominent emission reduction potential for solvent use than other sources. Substituting the high-VOC content solvent with low-solvent products is potentially an effective strategy. Assuming all solvent-based products were replaced with water-based products in 2017, emissions, OFP, and SOAP were reduced by 3.9 (37 % of total emissions), 8.7 (41 % of total OFP), and 0.15 (38 % of total SOAP) Tg, respectively. It is suggested that there is still potential for NMVOC emission reduction from solvent use in China.
Data are available from the authors upon request.
The supplement related to this article is available online at: https://doi.org/10.5194/acp-21-13655-2021-supplement.
BY and MS designed the research. ZM, RC, BY, HC, and BCM contributed to data collection. ZM and RC performed the data analysis, with contributions from BY, HC, BCM, ML, JZ, and MS. ZM, RC, and BY prepared the paper with contributions from other authors. All the authors reviewed the paper.
The authors declare that they have no conflict of interest.
Publisher's note: Copernicus Publications remains neutral with regard to jurisdictional claims in published maps and institutional affiliations.
This research has been supported by the National Key R&D Plan of China (grant nos. 2019YFE0106300, 2018YFC0213904), the National Natural Science Foundation of China (grant no. 41877302), the Guangdong Natural Science Funds for Distinguished Young Scholar (grant no. 2018B030306037), the Key-Area Research and Development Program of Guangdong Province (grant no. 2019B110206001), and the Guangdong Innovative and Entrepreneurial Research Team Program (grant no. 2016ZT06N263). This work was also supported by the Special Fund Project for Science and Technology Innovation Strategy of Guangdong Province (grant no. 2019B121205004). Meng Li was supported by NOAA (grant no. NA17OAR4320101).
This paper was edited by Chul Han Song and reviewed by three anonymous referees.
Bo, Y., Cai, H., and Xie, S. D.: Spatial and temporal variation of historical anthropogenic NMVOCs emission inventories in China, Atmos. Chem. Phys., 8, 7297–7316, https://doi.org/10.5194/acp-8-7297-2008, 2008.
Cai, H.: The progress of pollution control on stationary sources in Guangdong Province, Guangdong Polytechnic of Environmental Protection Engineering, Foshan, China, pp. 1–3, 2016.
Carter, W. P. L.: Updated maximum incremental reactivity scale and hydrocarbon bin reactivities for regulatory applications, available at: https://intra.engr.ucr.edu/~carter/SAPRC/MIR10.pdf (last access: 15 October 2020), 2010.
China Coating Industry Association: China Paint and Coatings Industry Annual, China Coating Industry Association, Beijing, China, 2000–2017.
China Crop Protection Industry Association: China Crop Protection Industry Yearbook China Crop Protection Industry Association, Beijing, China, 2001–2017.
China National Light Industry Council: China Light Industry Yearbook, China National Light Industry Council, Beijing, China, 2001–2018.
China Petroleum and Chemical Industry Association: China Chemical Industry Yearbook, China Chemical Information Center, Beijing, China, 2000–2016.
de Gouw, J. A., Gilman, J. B., Borbon, A., Warneke, C., Kuster, W. C., Goldan, P. D., Holloway, J. S., Peischl, J., Ryerson, T. B., Parrish, D. D., Gentner, D. R., Goldstein, A. H., and Harley, R. A.: Increasing atmospheric burden of ethanol in the United States, Geophys. Res. Lett., 39, L15803, https://doi.org/10.1029/2012gl052109, 2012.
Duan, Y. S: China's pesticide industry in 2017, Economic Analysis of China Petroleum and Chemical Industry, 47–49, 2018 (in Chinese).
EDGARv4.3.2: Emission Database for Global Atmospheric Research, available at: http://edgar.jrc.ec.europa.eu/overview.php?v=42, last access: 20 June 2021.
Exhaust Gas Purification Committee of China Environmental Protection Industry Association: Review on the development of organic exhaust gas treatment industry in China, China Environmental Protection Industry, 21–27, 2008–2017.
Fu, X., Wang, S. X., Zhao, B., Xing, J., Cheng, Z., Liu, H., and Hao, J. M.: Emission inventory of primary pollutants and chemical speciation in 2010 for the Yangtze River Delta region, China, Atmos. Environ., 70, 39–50, https://doi.org/10.1016/j.atmosenv.2012.12.034, 2013.
Gao, Z. J, Li, C., Zheng, J. Y., and Guo, H. X.: Evaluation of industrial VOCs treatment techniques by field measurement, Res. Environ. Sci., 28, 994–1000, 2015 (in Chinese).
Hao, Y. F. and Xie, S. D.: Optimal redistribution of an urban air quality monitoring network using atmospheric dispersion model and genetic algorithm, Atmos. Environ., 177, 222–233, https://doi.org/10.1016/j.atmosenv.2018.01.011, 2018.
Jin, X. M. and Holloway, T.: Spatial and temporal variability of ozone sensitivity over China observed from the Ozone Monitoring Instrument, J. Geophys. Res.-Atmos., 120, 7229–7246, https://doi.org/10.1002/2015jd023250, 2015.
Khare, P. and Gentner, D. R.: Considering the future of anthropogenic gas-phase organic compound emissions and the increasing influence of non-combustion sources on urban air quality, Atmos. Chem. Phys., 18, 5391–5413, https://doi.org/10.5194/acp-18-5391-2018, 2018.
Kurokawa, J. and Ohara, T.: Long-term historical trends in air pollutant emissions in Asia: Regional Emission inventory in ASia (REAS) version 3, Atmos. Chem. Phys., 20, 12761–12793, https://doi.org/10.5194/acp-20-12761-2020, 2020.
Li, J., Xie, S. D., Zeng, L. M., Li, L. Y., Li, Y. Q., and Wu, R. R.: Characterization of ambient volatile organic compounds and their sources in Beijing, before, during, and after Asia-Pacific Economic Cooperation China 2014, Atmos. Chem. Phys., 15, 7945–7959, https://doi.org/10.5194/acp-15-7945-2015, 2015.
Li, M., Zhang, Q., Streets, D. G., He, K. B., Cheng, Y. F., Emmons, L. K., Huo, H., Kang, S. C., Lu, Z., Shao, M., Su, H., Yu, X., and Zhang, Y.: Mapping Asian anthropogenic emissions of non-methane volatile organic compounds to multiple chemical mechanisms, Atmos. Chem. Phys., 14, 5617–5638, https://doi.org/10.5194/acp-14-5617-2014, 2014.
Li, M., Zhang, Q., Zheng, B., Tong, D., Lei, Y., Liu, F., Hong, C., Kang, S., Yan, L., Zhang, Y., Bo, Y., Su, H., Cheng, Y., and He, K.: Persistent growth of anthropogenic non-methane volatile organic compound (NMVOC) emissions in China during 1990–2017: drivers, speciation and ozone formation potential, Atmos. Chem. Phys., 19, 8897–8913, https://doi.org/10.5194/acp-19-8897-2019, 2019.
Lu, J. H., Dong, S. B., Li, W. J., Miu, X. P., and Gu, Z. Y.: Present Situation of VOCs Control Technologies for the Industrial Coating Process in Zhejiang Province, Environ, Protect, Sci,, 44, 113–117+121, 2018 (in Chinese).
McDonald, B. C., de Gouw, J. A., Gilman, J. B., Jathar, S. H., Akherati, A., Cappa, C. D., Jimenez, J. L., Lee-Taylor, J., Hayes, P. L., McKeen, S. A., Cui, Y. Y., Kim, S. W., Gentner, D. R., Isaacman-VanWertz, G., Goldstein, Allen H., Harley, R. A., Frost, G. J., Roberts, J. M., Ryerson, T. B., and Trainer, M.: Volatile chemical products emerging as largest petrochemical source of urban organic emissions, Science, 359, 760, https://doi.org/10.1126/science.aaq0524, 2018.
Ministry of Ecology and Environment of the People's Republic of China: Environmental Statistics annual Report in 2015, available at: http://www.mee.gov.cn/hjzl/sthjzk/sthjtjnb/201702/P020170223595802837498.pdf (last access: 10 September 2020), 2017.
Ministry of Ecology and Environment of the People's Republic of China: China's Ecological And Environmental Status Bullet in 2018, available at: http://www.mee.gov.cn/hjzl/sthjzk/zghjzkgb/201905/P020190619587632630618.pdf (last access: 10 September 2020), 2019.
Nel, A.: Air Pollution-Related Illness: Effects of Particles, Science, 308, 804, https://doi.org/10.1126/science.1108752, 2005.
Nishanth, T., Praseed, K. M., Kumar, M. K. Satheesh, and Valsaraj, K. T.: Influence of ozone precursors and PM10 on the variation of surface O3 over Kannur, India, Atmos. Res., 138, 112–124, https://doi.org/10.1016/j.atmosres.2013.10.022, 2014.
Pearson, J. K.: European solvent VOC emission inventories based on industry-wide information, Atmos. Environ., 204, 118–124, https://doi.org/10.1016/j.atmosenv.2019.02.014, 2019.
Simayi, M., Hao, Y. F, Li, J., Wu, R. R., Shi, Y. Q., Xi, Z. Y., Zhou, Y., and Xie, S. D.: Establishment of county-level emission inventory for industrial NMVOCs in China and spatial-temporal characteristics for 2010–2016, Atmos. Environ., 211, 194–203, https://doi.org/10.1016/j.atmosenv.2019.04.064, 2019.
Streets, D. G., Bond, T. C., Carmichael, G. R., Fernandes, S. D., Fu, Q., He, D., Klimont, Z., Nelson, S. M., Tsai, N. Y., Wang, M. Q., Woo, J. H., and Yarber, K. F.: An inventory of gaseous and primary aerosol emissions in Asia in the year 2000, J. Geophys. Res.-Atmos., 108, 8809, https://doi.org/10.1029/2002JD003093, 2003.
Sun, W., Shao, M., Granier, C., Liu, Y., Ye, C. S., and Zheng, J. Y.: Long-Term Trends of Anthropogenic SO2, NOx, CO, and NMVOCs Emissions in China, Earth's Future, 6, 1112–1133, https://doi.org/10.1029/2018ef000822, 2018.
United States Environmental Protection Agency (U.S. EPA): Compilation of Air Pollutant Emission Factors (AP-42), Research Triangle Park, North Carolina, available at: https://www.epa.gov/air-emissions-factors-and-quantification/ap-42-compilation-air-emissions-factors (last access: 10 November 2020), 1995.
Wang, H. L., Qiao, Y. Z., Chen, C. H., Lu, J., Dai, H. X., Qiao, L. P., Lou, S. R., Huang, C., Li, L., Jing, S. G, and Wu, J. P.: Source Profiles and Chemical Reactivity of Volatile Organic Compounds from Solvent Use in Shanghai, China, Aerosol Air Qual. Res., 14, 301–310, https://doi.org/10.4209/aaqr.2013.03.0064, 2014.
Wang, S. X., Zhao, B., Cai, S. Y., Klimont, Z., Nielsen, C. P., Morikawa, T., Woo, J. H., Kim, Y., Fu, X., Xu, J. Y., Hao, J. M., and He, K. B.: Emission trends and mitigation options for air pollutants in East Asia, Atmos. Chem. Phys., 14, 6571–6603, https://doi.org/10.5194/acp-14-6571-2014, 2014.
Wei, W., Wang, S. X., Chatani, S., Klimont, Z., Cofala, J., and Hao, J. M.: Emission and speciation of non-methane volatile organic compounds from anthropogenic sources in China, Atmos. Environ., 42, 4976–4988, https://doi.org/10.1016/j.atmosenv.2008.02.044, 2008.
Wei, W., Wang, S. X., and Hao, J. M.: Uncertainty analysis of emission inventory for volatile organic compounds from anthropogenic sources in China, Environ. Sci., 32, 305–312, 2011a (in Chinese).
Wei, W., Wang, S. X., Hao, J. M., and Cheng, S. Y.: Projection of anthropogenic volatile organic compounds (VOCs) emissions in China for the period 2010–2020, Atmos. Environ., 45, 6863–6871, https://doi.org/10.1016/j.atmosenv.2011.01.013, 2011b.
Wu, R. and Xie, S.: Spatial Distribution of Ozone Formation in China Derived from Emissions of Speciated Volatile Organic Compounds, Environ. Sci. Technol., 51, 2574–2583, https://doi.org/10.1021/acs.est.6b03634, 2017.
Wu, R. R., Bo, Y., Li, J., Li, L. Y., Li, Y. Q., and Xie, S. D.: Method to establish the emission inventory of anthropogenic volatile organic compounds in China and its application in the period 2008–2012, Atmos. Environ., 127, 244–254, https://doi.org/10.1016/j.atmosenv.2015.12.015, 2016.
Yang, Q., Huang, C., Lu, B., Jing, B. L., Xia, Y., Tang, W., Lu, Q., Lu, J., Xu, C., and Gu, Z. Y.: Air pollutant emission inventory based on local emission source surveys in Hangzhou, China, Acta Scientiae Circumstantiae, 37, 3240–3254, 2017 (in Chinese).
Yin, S., Zheng, J., Lu, Q., Yuan, Z., Huang, Z., Zhong, L., and Lin, H.: A refined 2010-based VOC emission inventory and its improvement on modeling regional ozone in the Pearl River Delta Region, China, Sci. Total Environ., 514, 426–438, https://doi.org/10.1016/j.scitotenv.2015.01.088, 2015.
Yuan, B., Shao, M., Lu, S. H., and Wang, B.: Source profiles of volatile organic compounds associated with solvent use in Beijing, China, Atmos. Environ., 44, 1919–1926, https://doi.org/10.1016/j.atmosenv.2010.02.014, 2010.
Yuan, B., Hu, W. W., Shao, M., Wang, M., Chen, W. T., Lu, S. H., Zeng, L. M., and Hu, M.: VOC emissions, evolutions and contributions to SOA formation at a receptor site in eastern China, Atmos. Chem. Phys., 13, 8815–8832, https://doi.org/10.5194/acp-13-8815-2013, 2013.
Zhong, Z., Sha, Q., Zheng, J., Yuan, Z., Gao, Z., Ou, J., Zheng, Z., Li, C., and Huang, Z.: Sector-based VOCs emission factors and source profiles for the surface coating industry in the Pearl River Delta region of China, Sci. Total Environ., 583, 19–28, https://doi.org/10.1016/j.scitotenv.2016.12.172, 2017.