the Creative Commons Attribution 4.0 License.
the Creative Commons Attribution 4.0 License.
 | 10 Sep 2021
Characteristics of surface energy balance and atmospheric circulation during hot-and-polluted episodes and their synergistic relationships with urban heat islands over the Pearl River Delta region
Ifeanyichukwu C. Nduka
Chi-Yung Tam
Jianping Guo
This study analyzed the nature, mechanisms and drivers for hot-and-polluted episodes (HPEs) in the Pearl River Delta, China. Numerical model simulations were conducted for the summer and autumn of 2009–2011. A total of eight HPEs were identified, mainly occurring in August and September. K-means clustering was applied to group the HPEs into three clusters based on their characteristics and mechanisms. We found three HPEs were driven by weak subsidence and convection induced by approaching tropical cyclones (TC-HPE) and two HPEs were controlled by calm (stagnant) conditions (ST-HPE) with low wind speed in the lower atmosphere, whereas the remaining three HPEs were driven by the combination (hybrid) of both aforementioned systems (HY-HPE). A positive synergistic effect between the HPE and urban heat island (UHI; ∼ 1.1 ∘C increase) was observed in TC-HPE and ST-HPE, whereas no discernible synergistic effect was found in HY-HPE. Total aerosol radiative forcing (TARF) caused a reduction in temperature (0.5–1.0 ∘C) in TC-HPE and ST-HPE but an increase (0.5 ∘C) in HY-HPE.
- Article
(1889 KB) - Full-text XML
-
Supplement
(1613 KB) - BibTeX
- EndNote


Air pollution and heat waves have been identified as major atmospheric environmental disasters (Khafaie et al., 2016; Xia et al., 2018). Air pollution can vary at spatial scales ranging from local to global (Shi et al., 2020; M. Y. Wang et al., 2019; Y. Wang et al., 2019; Yang et al., 2019; Yim et al., 2009, 2014, 2010, 2015). Studies have reported the significant effects of air pollution on human health (Chen et al., 2017; Gu et al., 2018; Liu et al., 2017), ecosystems and biodiversity (Lovett et al., 2009; Nowak et al., 2015; Yim et al., 2019b) and weather and climate (Guo et al., 2016, 2018; Liu et al., 2018, 2019, 2020).
Heat waves are generally defined as extended periods of elevated temperatures across the globe varying in frequency, intensity and duration. Previous studies have revealed the significant impacts of heat waves on human health and mortality (Matusick et al., 2018) and natural systems (Unal et al., 2013). More seriously, heat wave events are likely to occur more frequently in future years as a consequence of climate change (Murari and Ghosh, 2019; Silva et al., 2016; Wang et al., 2018). Despite their large spatial heterogeneity, air pollution and heat waves have been shown to share several common underlying meteorological drivers (Founda and Santamouris, 2017; Papanastasiou et al., 2014; Zhang et al., 2017). Although great advances have been made in the study of either air pollution or heat waves, few studies have comprehensively investigated hot-and-polluted episodes (HPEs), in which extreme temperature and air pollution occur simultaneously, causing an even more serious impact on human health due to their synergic effect (Pinheiro et al., 2014; Qian et al., 2010; Scortichini et al., 2018). Before this effect can be comprehensively assessed, fully understanding the driving mechanisms underlying the formation and remediation of HPEs is imperative.
The processes responsible for HPE formation and intensity vary case by case (Fan et al., 2011; Katsouyanni et al., 1993; Ordóñez et al., 2010; Yim, 2020). For instance, Yim (2020) analyzed the atmospheric conditions in 3D during these events and found that HPEs were mostly associated with a reduction in both vertical and horizontal wind velocities. By contrast, Fan et al. (2011) illustrated that approaching tropical cyclones, which may cause subsidence, weak vertical diffusion and poor horizontal transport, were the mechanism responsible for the HPEs. To obtain a complete picture of all possible mechanisms of HPEs, a multi-episodic study is therefore warranted.
The surface energy balance, which modifies and demarcates turbulent energy fluxes, has been well illustrated to influence heat waves (Founda and Santamouris, 2017; Li et al., 2015; Li and Bou-Zeid, 2013; Miralles et al., 2014). For instance, Miralles et al. (2014) found that soil desiccation led to the modification of turbulent heat fluxes through the changes of latent and sensible heat fluxes. Li and Bou-Zeid (2013) and Li et al. (2015) demonstrated the effect of built-up and vegetated surfaces on the demarcation and modification of turbulent energy. However, the interaction between surface characteristics and atmospheric conditions during HPEs, which may exhibit synergies, has yet to be completely understood. The role of surface characteristics in HPE formation and development merits further investigation.
Studies are limited in China and few and far between in the Pearl River Delta (PRD) region. Previous HPE-related studies in China have been focused mostly on summertime O3 mechanisms and characteristics (Gong and Liao, 2019; Lam et al., 2005; N. Li et al., 2018; Shu et al., 2020), while others have focused on atmospheric drivers for, and interactions between, air pollution and mortality. However, other studies analyzed the atmospheric boundary layer characteristics over PRD using measurements and numerical models to identify boundary layer conditions that could result in HPEs (Fan et al., 2008, 2011; Yim, 2020). Thus far, there has been limited research on HPE mechanisms in China, particularly in the PRD region, which has been rapidly and substantially urbanized in recent years (Li et al., 2016). The urbanization has a significant impact on the regional climate and air quality through modification of the ecosystem, land surface, atmospheric and energy processes (Mirzaei and Haghighat, 2010; Y. Wang et al., 2019, 2020; Xie et al., 2016; Yim et al., 2019c; Yu et al., 2014). Mirzaei and Haghighat (2010) identified the ways urbanization modified the surface cover, climate and energy processes, including the conversion of more surfaces into urban impervious surfaces; alteration of the local winds; humidity, temperature and precipitation patterns; and changes in demarcation in turbulent energy fluxes within the surface and boundary layer. Furthermore, PRD is susceptible to events associated with the monsoon and tropical cyclone activities that may cause HPEs (Fan et al., 2011; H. Li et al., 2018), making the PRD region an ideal location for assessing HPEs.
This study identified all the HPEs that occurred during 2009–2011 and analyzed their associated thermodynamic and circulation characteristics. Representative episodes were examined for a possible synergistic relationship between the urban/vegetated land covers and the HPEs within the PRD region (see Sect. S1 and Fig. S2 in the Supplement for details on land cover characteristics and delineation of urban and vegetated surfaces). This is expected to contribute to advancing knowledge regarding the factors responsible for the evolution and sustenance of HPEs as well as the relationship between HPEs and surface characteristics.
2.1 Observations
This study used meteorological and air quality measurements for model validation and HPE identification. Hourly air temperature at 2 m above ground (T2) for the study was obtained from Hong Kong Observatory (HKO). Hourly mean concentration of coarse particulate matter (PM10) and ozone (O3) concentrations was obtained from the Environmental Protection Department (EPD; https://cd.epic.epd.gov.hk/EPICDI/air/station/?lang=en, last access: 14 September 2019). Hourly data were used for model validation, whereas daily maximum and mean values were calculated based on the hourly data for HPE identification.
2.2 HPE selection
The concept of hot polluted episodes that refer to an episode with coincident high temperature and air pollution level has been investigated previously (Chan et al., 2012; Katsouyanni et al., 1993; Ordóñez et al., 2010; Yim, 2020); however, most of the studies have been focused on their compounding impact on health (Chan et al., 2012) or the impact of the excess temperature on air pollution levels (Ordóñez et al., 2010). Only few studies (Fan et al., 2011; Yim, 2020) have considered the mechanisms responsible for their co-occurrence. While Yim (2020) focused on high temperature and PM2.5 pollution in Hong Kong, this study focused on high temperature and high PM10 and O3 in the PRD region. Similar to Yim (2020), this study identified a HPE based on daily maximum temperature and daily mean of PM10 and O3. PM10 was used in this study because of the lack of PM2.5 data in the study period, which was June to October in 2009–2011. This study period was selected because these months represent a period in a year with the highest daily maximum temperature, which when combined with days with poor air quality, forms a HPE.
The HPE identification took into account the methods for the traditional heat wave definition (occurrence for an extended period and threshold) and a health impact study requiring the use of a critical value (Chan et al., 2012; Y. Wang et al., 2019). Thresholds for temperature, PM10 and O3 were set as the mean of 50th percentiles of the variables of all stations, i.e., 31.3 ∘C, 31 and 24 µg/m3, respectively. The thresholds represented the middle value of their distributions without the interference of outliers in the distribution. Hence, a HPE was identified if the following conditions are fulfilled simultaneously:
-
The daily maximum temperature of Hong Kong Observatory (HKO) station (22∘18′0′′ N, 114∘10′2′′ E) exceeds the temperature threshold for 3 consecutive days.
-
Daily means of PM10 and O3 exceed their thresholds for 3 consecutive days.
Daily maximum air temperature data obtained from the HKO station were used for the HPE identification for three reasons. First, the temperature difference among urban stations was marginal such that one urban station should be fine to represent the overall temperature of urban areas in Hong Kong. Second, the HKO station is in the downtown area of Hong Kong and thus serves as a representative urban station in Hong Kong. Third, the critical temperature was chosen for the HPE identification because epidemiological studies have reported the risk of health impact above a critical temperature (28.4 ∘C) which is lower than our temperature criteria, meaning that the health impact during our identified HPEs should be expected to be more adverse. While population is concentrated in urban areas, using the HKO station was considered adequate in this study.
The daily mean data for O3 and PM10 used for HPE identification were obtained from 14 air quality stations within Hong Kong. These were operated by the Hong Kong Environmental Protection Department during the study period. Hong Kong air quality stations were used as proxies to identify HPEs in the PRD region because there were insufficient data for the stations in the region during the study period. The PRD regional air quality monitoring network's annual and quarterly report between 2013 and 2018 showed that air quality in Hong Kong was always better than or similar to the other stations in the region (Pearl River Delta Regional Air Quality Monitoring Report, 2021).
2.3 Model description and setup
This study employed the Weather Research and Forecasting model (Skamarock and Klemp, 2008) with Chemistry (WRF-Chem) version 3.7.1 (Grell et al., 2005), which is a nonhydrostatic, mesoscale numerical model coupling both meteorology and chemistry. This model downscaled the meteorology and air quality in three domains at a downscaling ratio of 3 (Fig. S1a): domain 1 (D1; 27 km) covering the whole of China, domain 2 (D2; 9 km) covering southern China and domain 3 (D3; 3 km) covering the PRD region. The detailed model configuration is provided in Sect. S1. The initial condition data used were provided by NCEP Final Analysis (https://rda.ucar.edu/datasets/ds083.2/#metadata/detailed.html?_do=y, last access: 14 September 2019) with a 1∘ × 1∘ resolution, while the boundary condition was updated every 6 h from FNL data. The emissions data for Hong Kong were provided by the Hong Kong Environmental Protection Department (HKEPD), and the emissions within PRD except Hong Kong were provided by Zheng et al. (2009). The emissions outside the PRD region were based on the INTEX-B 2006 regional emission inventory (Zhang et al., 2009). Biogenic emissions were based on Guenther et al. (2006), and shipping emissions were based on Streets et al. (2003).
We performed a series of WRF-Chem simulations for each HPE. The performance of the model was evaluated against observations, which was detailed in Sect. S2.2. For each HPE, two sets of WRF-Chem simulations were conducted with a 2 d spin-up period. Two additional days were included before and after the HPEs in each simulation run. This setting was used to identify and calculate variations in the variables before, during and after HPEs. The first set of simulations turned on the aerosol–radiation feedback option (CTRL), while the second turned off the option (NOFB). The difference between the two sets of simulations was attributable to the effect of aerosols on radiation fluxes during a HPE. The model results for all the CTRL episodic simulations were separated into groups using k-means clustering, and a representative of each group was characterized based on the mechanisms responsible for its formation. The mechanisms of thermodynamic and circulation patterns of HPEs and the synergistic relationship between HPEs and the urban heat island (UHI) effect were then discussed in detail.
2.4 HPE clustering
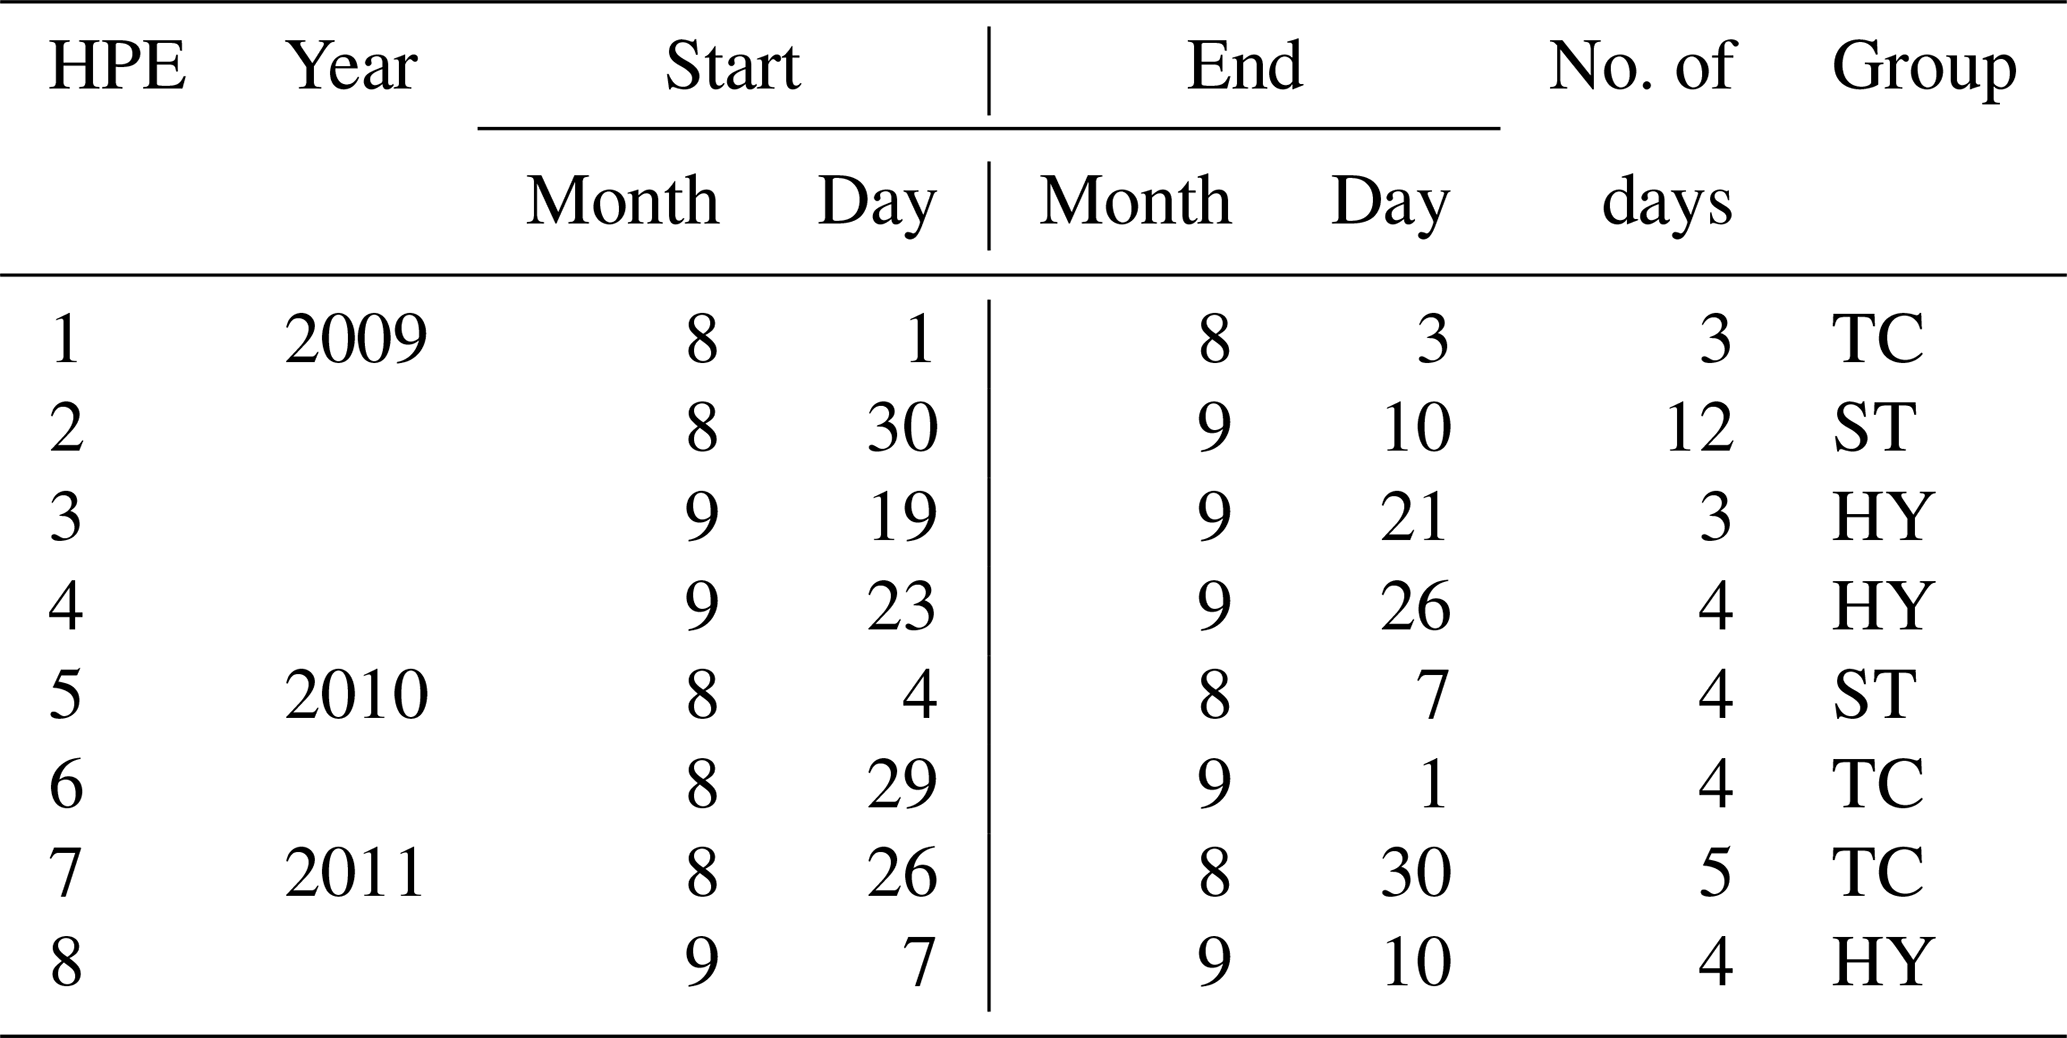
Based on our identification method, eight HPEs were identified (Table 1). To enhance our understanding of atmospheric conditions in each HPE, cluster analysis was performed of meteorological variables (Stefanon et al., 2012; Tan et al., 2019) such as T2, sea level pressure (SLP), specific humidity at 2 m, wind components (u, v) at 10 m, incoming solar radiation at the surface and geopotential height (GPH) at 500 hPa, which could group these variables from different times into clusters having the same meteorological conditions. A modified k-means clustering algorithm (Hartigan and Wong, 1979) function in NCAR command language (NCL) with its center set at random and iterations set at 1 000 000 was applied for all the aforementioned meteorological variables.
3.1 HPE identification and classification
Due to the different durations of HPEs, mean diurnal variations of the variables for the study domain during the three periods (before, during and after) from the model results were analyzed. The dissimilarity was optimized at three clusters showing the number of groups that the HPEs could be grouped into. The results of the cluster analysis indicate that the HPEs were classified based on their formation and characteristics into tropical cyclone (TC-HPE), stagnant (ST-HPE) and hybrid (HY-HPE), and they are discussed below. The weather conditions of the TC-HPE were characterized by lower SLP and GPH but higher T2 and specific humidity. The TC-HPE typically occurred when a tropical cyclone was approaching the PRD region. A representative episode (TC-HPErep), occurring from 29 August to 1 September 2010, was selected to further explain the weather conditions, along with weather charts provided by the Hong Kong Observatory (HKO; see Fig. S4). In this episode, the tropical storm Lionrock passed through the PRD region. Its passage caused stagnation and expansion of the high-pressure system in the lower atmosphere over the north of the region. This led to an increase in T2 over the region. Midday T2 in Hong Kong rose from 32 ∘C on 29 August to 34 ∘C on 31 August, which broadly corroborated our previous studies (Yim et al., 2019b) that showed that tropical cyclones within 1100 km of the region can cause HPEs.
Table 1HPEs for the study period. Eight HPEs were identified and classified into three HPE groups: stagnant (ST), tropical cyclone (TC) and hybrid (HY).
The second group, ST-HPE, was found to be characterized by higher temperature and lower specific humidity in the PRD region, as demonstrated by the representative HPE (ST-HPErep) occurring from 4 to 7 August 2010 (see Fig. S5). This group represents a slow-moving weather system formed by a low-pressure system covering most of China and the Philippine Sea. This is in contrast to previous studies that have reported a strong association between high-pressure systems and air stagnation. However, when Freychet et al. (2017) assessed the dynamical processes for heat wave formation over eastern China, they found that a low-pressure system along with northerly flow within the region often led to heat convergence and an extreme high temperature episode. The ST-HPErep was observed to have a region-wide slow-moving weather condition characterized by a wide low-pressure system that covered most of East Asia for a few days.
The third group, HY-HPE, has a unique profile that was defined by Karremann et al. (2016). This group consisted of more than one dominant synoptic condition during an episode. A representative HY-HPE (HY-HPErep), occurring from 7 to 10 September 2011, was compared with corresponding HKO charts (see Fig. S6). The result confirmed the co-occurrence of more than one large-scale weather system during the HPE. The result of their characterization demonstrated that different pressure centers, synoptic conditions or their combination can be juxtaposed during a weather event and that their gradient will determine the weather condition of a region.
3.2 HPE characterization
This section mainly analyzes the formation mechanism for each HPE group. Due to the similarities of the members in each group, we discuss the air quality, energy and circulation characteristics of one representative HPE from each group.
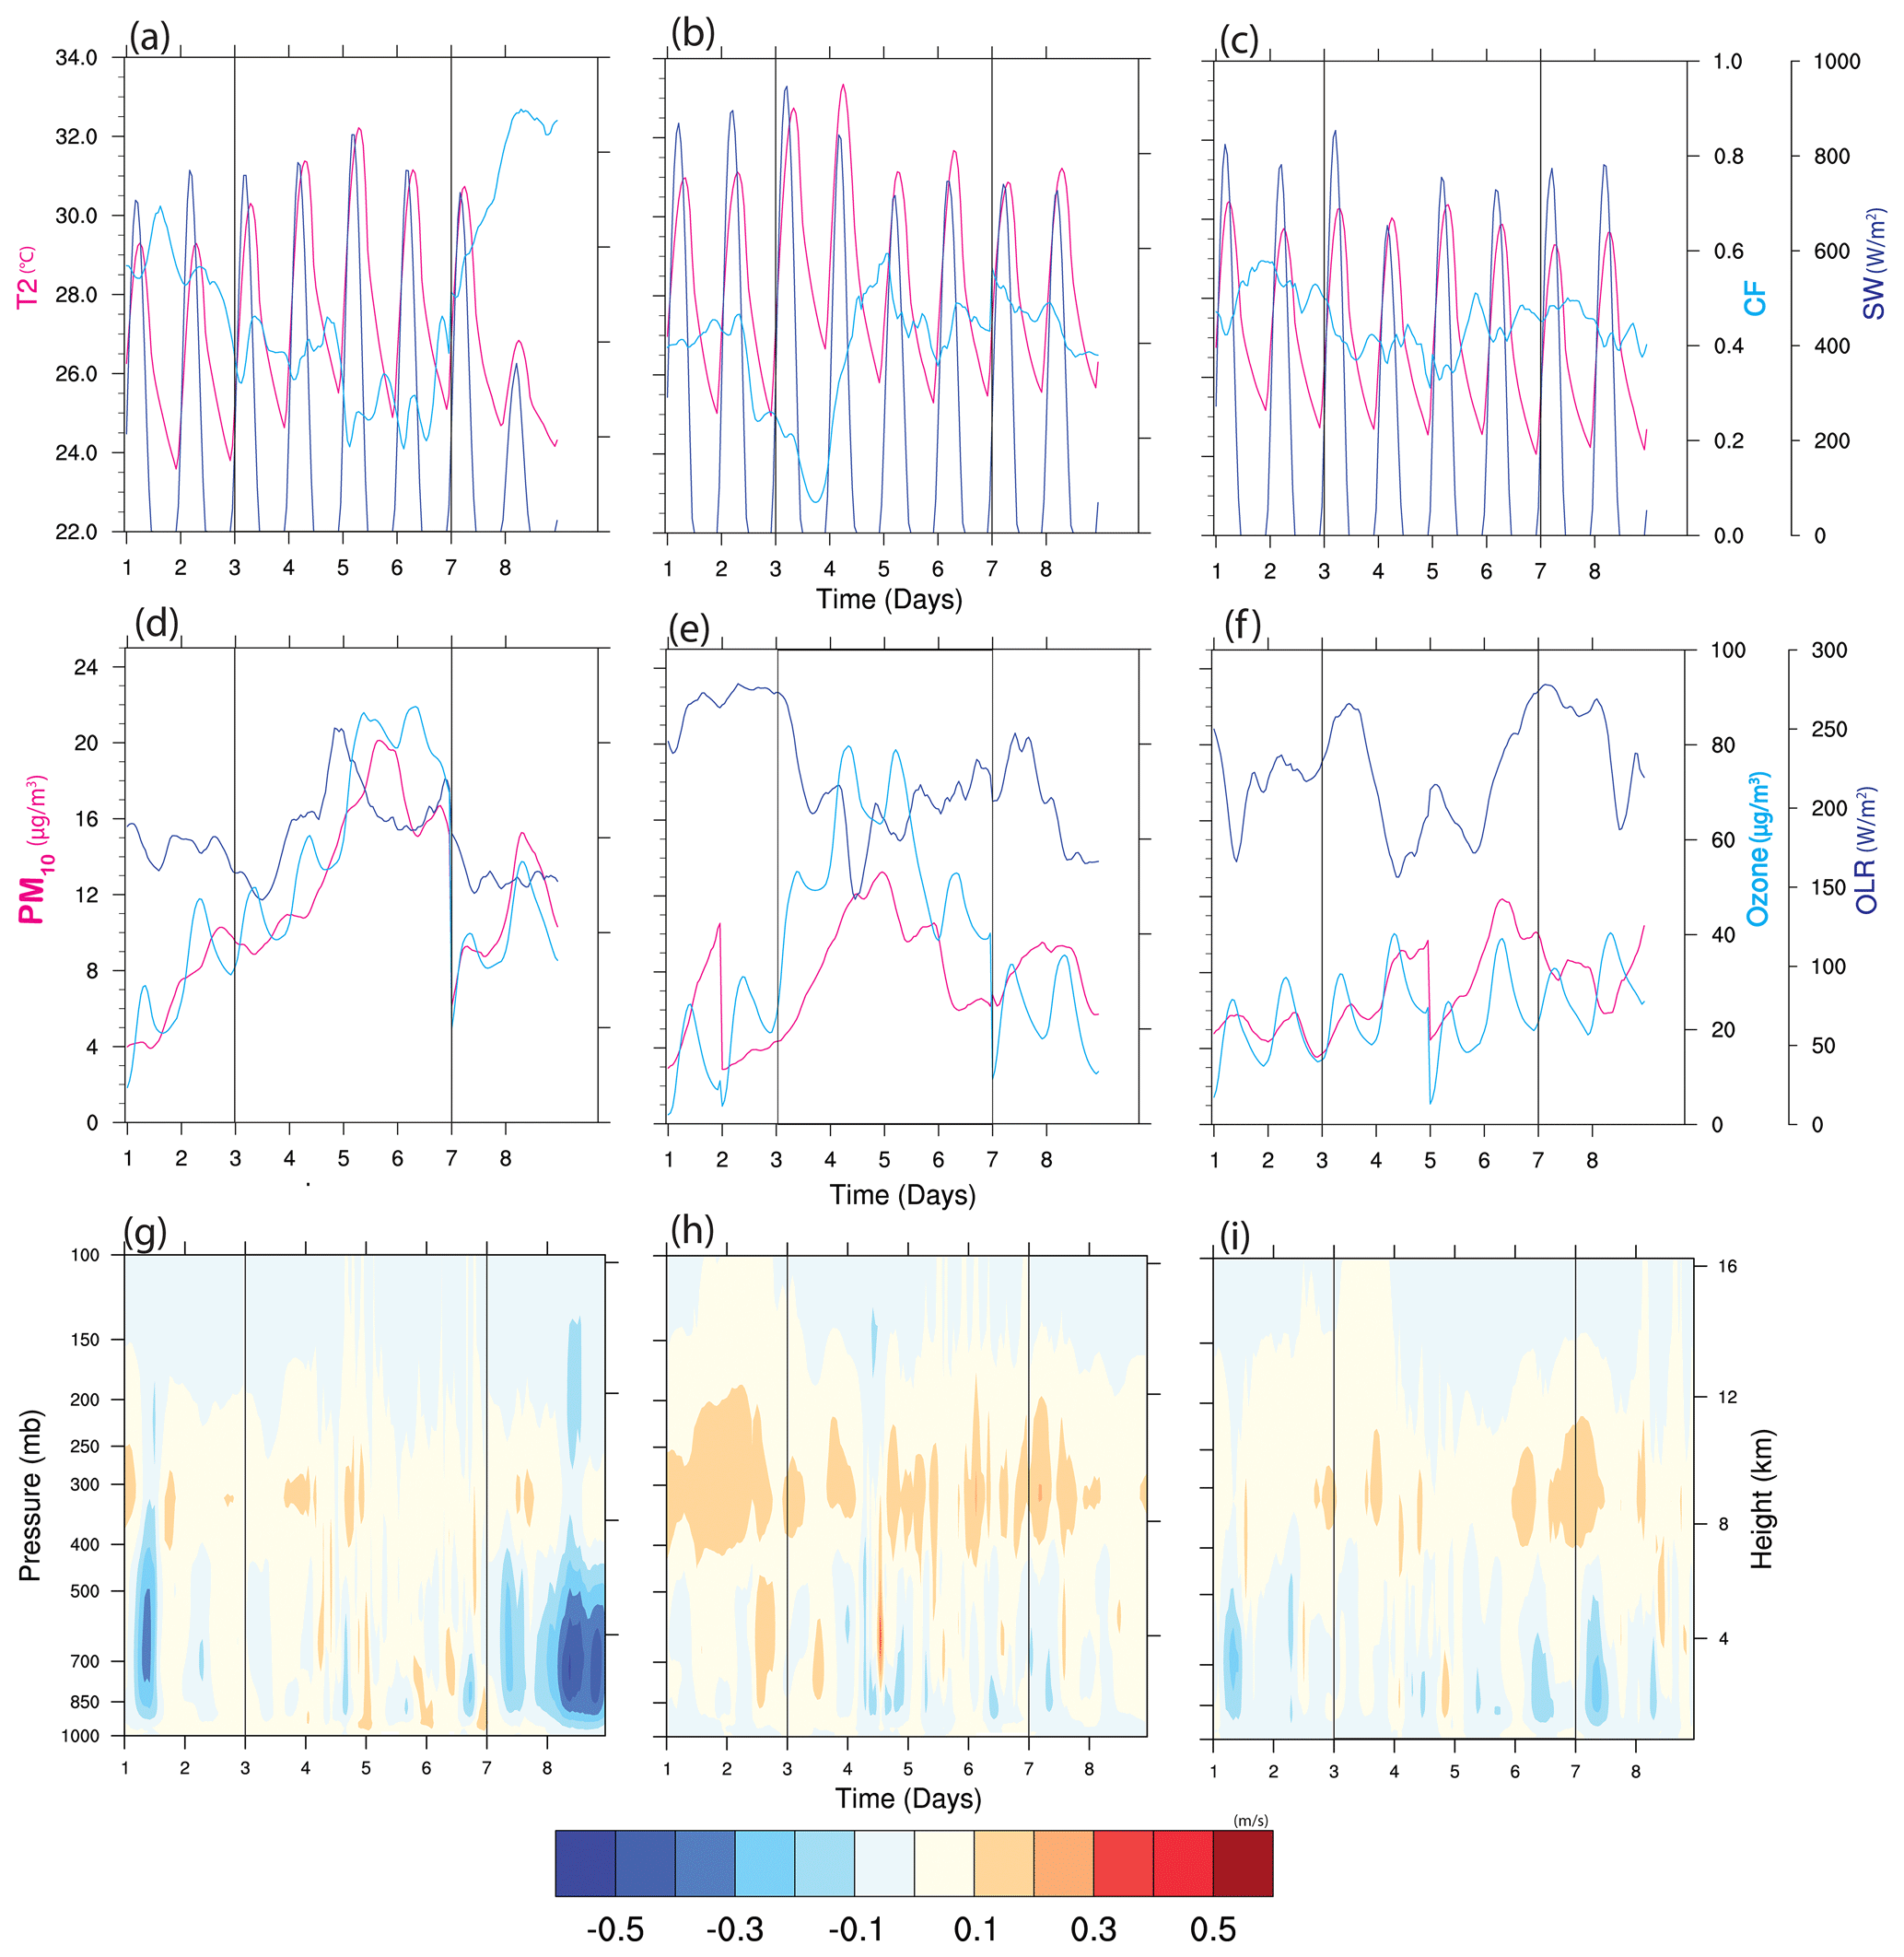
Figure 1The model (CTRL) domain-averaged results for air temperature at 2 m (T2; magenta), cloud fraction (CF; cyan) and incoming shortwave radiation (blue) at ground level for (a) TC-HPE, (b) ST-HPE and (c) HY-HPE and PM10 (magenta), O3 (cyan) and outgoing longwave radiation (OLR) at the top of the atmosphere (blue) for (d) TC-HPErep, (e) ST-HPErep and (f) HY-HPErep. Time series of vertical velocity (color shading) for (g) TC-HPErep, (h) ST-HPErep and (i) HY-HPErep. Positive vertical velocity means downward motion, whereas negative vertical velocity means upward motion. Black boxes represent the period of HPEs. Days 1 and 2 were before the HPEs, days 3–6 were during the HPEs and days 7 and 8 were after the HPEs.
3.2.1 TC-HPE
Figure 1a depicts the time series for domain-averaged hourly T2 during the TC-HPE representative HPE. During the TC-HPErep, T2 increased on day 3 [onset (∼ 30.2 ∘C)], reached a peak (∼ 32.7 ∘C) on day 5 and decreased on day 7 (∼ 30.8 ∘C). Figure 1g shows the height–time cross-section of vertical velocity. Positive vertical velocity means downward motion, whereas negative vertical velocity means upward motion. In the lower atmosphere, the positive and even relatively small negative vertical velocity values during the TC-HPErep indicate a weak subsidence of air masses resulting from an approaching tropical cyclone (Luo et al., 2018; Yim et al., 2019a). As shown in Fig. 1a, the cloud fraction was maintained at approximately 0.40 at the onset of the TC-HPErep and reduced to 0.20 at 08:00 on day 5. The reduction in cloud fraction was due to weak convection. These clear-sky conditions caused a significant increase in incoming shortwave radiation, leading to a remarkable increase in T2 due to greater direct exposure to solar radiation at the surface. Figure 1d shows that the outgoing longwave radiation (OLR) also increased up to 250 W/m2 at 08:00 on day 5. The situation changed by the end of day 6 due to the increased upward motion, as indicated by the large negative vertical velocity shown in Fig. 1g. A greater amount of convective activity led to an increase in cloud fraction (up to 0.30) and thus a reduction in SW radiation. Consequently, T2 decreased, signaling the end of the HPE.
During TC-HPErep, the weak vertical motions led to an accumulation of PM10, as shown in Fig. 1d. The PM10 concentration rose from approximately 10 µg/m3 on day 3 to >24 µg/m3 on day 5. This change can be attributed to the northerly wind during the episode, as shown in Fig. S7a. Enhanced northerly wind has been found to significantly enhance transboundary air pollution in the region (Hou et al., 2019; Luo et al., 2018; Tong et al., 2018b; Yim et al., 2019a). During the TC-HPErep, O3 accumulation also occurred. The increase in insolation due to lower cloud fraction and accumulation of pollutants, some of which are precursors of O3 formation, led to the increase in midday O3 concentration from approximately 60 µg/m3 on day 3 to approximately 90 µg/m3 on day 6. The result also demonstrated that the diurnal variation in O3 concentration was maintained but the mean concentration increased significantly as the TC-HPErep got hotter and more polluted before falling at the end of the episode.
3.2.2 ST-HPE
Figure 1b depicts the evolution of the ST-HPErep. T2 increased on day 3 [onset (∼ 32.7 ∘C)], reached a peak (∼ 33.3 ∘C) on day 4 and then decreased until the end of day 6 (∼ 32.1 ∘C). The ST-HPErep was distinguished by a 5 m/s wind speed in the lower atmosphere from day 1 to 4, as shown in Fig. S7b. The wind speed reduced to approximately 2 m/s on day 3, which led to an intense accumulation of heat and a 1.7 ∘C increase in T2. The subsequent increase in wind speed after day 4 (>5 m/s) coincided with the decrease in T2 until the end of day 6, which marked the end of this episode. Vertical movement during this event, as shown in Fig. 1h, ranged from −0.1 to 0.2 m/s. The strong subsidence observed on days 2 and 3 in the middle and lower atmosphere contributed to the stable atmosphere because the cloud fraction (shown in Fig. 1b) was lower (∼ 0.20 on day 2 and ≤ 0.1 on day 3). On day 4, the convective motion (−0.1 m/s) contributed to a steady increase in cloud fraction to 0.5. Consequently, the increase in cloud cover cut off insolation (down to approximately 850 W/m2 on day 4 and approximately 680 W/m2 on day 5, as shown in Fig. 1b). However, the cloud could retain most of the heat on day 4 as the OLR displayed in Fig. 1e decreased from 210 W/m2 on day 3 to 165 W/m2 on day 4, while the T2 increased by 0.6 ∘C. T2 reduced thereafter by 2.3 ∘C due to the amount of persistent high cloud, which blocked incoming shortwave radiation and cut off the source of heat. This episode persisted until the end of the ST-HPErep (day 6).
The calm wind condition also contributed to the deterioration in air quality, as shown in Fig. 1e. The increase in the concentration of PM10 to 20 µg/m3 from days 4 to 6 was accentuated by the change in wind direction to north/northeast, as shown in Fig. S7e. This result was consistent with a number of findings (Hou et al., 2019; Luo et al., 2018; Tong et al., 2018a, b; Yim et al., 2019b) showing that a northerly wind is usually associated with air pollution in the region as a result of transboundary air pollution. The increase in O3 concentration displayed in Fig. 1e is attributable to the increase in precursors and the amount of incoming shortwave radiation available. The diurnal variation in the time series of O3 is also indicative of this cumulative trend.
3.2.3 HY-HPE
Compared with the other two groups, HY-HPE did not show an obvious increase in daily T2 during the episode. As shown in Fig. 1c, the HY-HPErep (days 3–6) had a mean daily maximum T2 of approximately 30.0 ∘C, with a variation of only ±0.3 ∘C. The HY-HPErep showed a relatively large change in horizontal wind speed at the lower troposphere (Fig. S7c) from <5 m/s on days 1 to 3 to a higher wind speed (≥8 m/s) from days 4 to 8. Similar to the other two groups, Fig. 1i shows a weak subsidence in this episode due to weak vertical velocity (from −0.2 to 0.2 m/s), which was accompanied by weak downward motion (except on day 5). The increased horizontal wind speed from day 4 contributed to the temperature regime of the HY-HPErep by offsetting the heat buildup due to the weak vertical motion. This led to marginal variations in the diurnal temperature between pre-, mid- and post-HPE days.
The changes in air quality during this episode were influenced primarily by the horizontal wind direction and speed. This is exemplified by the effect of the prevailing wind speed and direction on the relatively lower concentration of PM10 (about 15 µg/m3 at its peak; see Fig. S7i and f). The prevailing easterly wind suggests a marginal effect of transboundary air pollution in HY-HPE; the increase in air pollutant level was thus due to local emissions. The subsequent increase in wind speed resulted in a dispersion and reduction in the PM10 concentration. However, as the wind direction switched to the north (day 6), PM10 concentration began to rise due to increases in transboundary air pollution. Changes in O3 concentration followed the same pattern due to the availability of precursors and the influence of wind speed and direction. Consequently, HY-HPE was unable to accumulate heat, PM10 and O3 concentration despite the weak convection.
3.3 Synergistic relationship
We examined the synergistic relationship between UHIs and HPEs during these episodes. This was achieved by scrutinizing the daily midday height–time series of potential temperatures, which have been found to be a suitable variable for diagnosing differences in boundary layer characteristics because it provides insight into its vertical and thermal structures (Miralles et al., 2014; Ramamurthy et al., 2017). The effects of land cover on the evolution and sustenance of the HPE were analyzed by examining UHI intensities during the HPEs. The UHI intensities were quantified as the difference between the average urban and rural grids (as shown in Fig. S2). The rural grids are the average of all the vegetated land use land cover categorizations shown in Fig. S2. Quantification of potential temperature and sensible and latent heat fluxes was also carried out using the same method. The effect of the air quality on the HPEs was also examined, largely through analyzing the effect of total aerosol radiative forcing (TARF).
3.3.1 TC-HPE
Figure 2a shows the T2 difference between urban and vegetated areas during TC-HPErep. The results indicate a remarkable 4.2 to 5.5 ∘C difference in T2 between the two types of land cover due to the UHI effect during the HPE, while the pre- and post-HPE UHI effect had a lower range of 2.2 to 4.2 ∘C, indicating the contribution of the HPE to the UHI effect. Figure 2d depicts the difference between the potential temperature over urban and vegetated land covers in the PRD region at midday. The temporal distribution in potential temperature shows an increasing trend in the lower atmosphere (≥ 1.8 ∘C from days 4 to 6) and upward expansion in height for warm air beyond 1.2 km (0.3 ∘C on day 5). Persistent daily heating from incoming solar radiation provided energy that precipitated a rise in temperature, thereby entrapping and accumulating heat during the TC-HPErep. For the TC-HPErep, the T2 difference ranged from 0.5 to > 1.5 ∘C, showing that TC-HPE provided extra heat to the surface, which enabled the urban areas to warm up to a greater extent than normal. This result indicates that the UHI effect was enhanced during the TC-HPE.
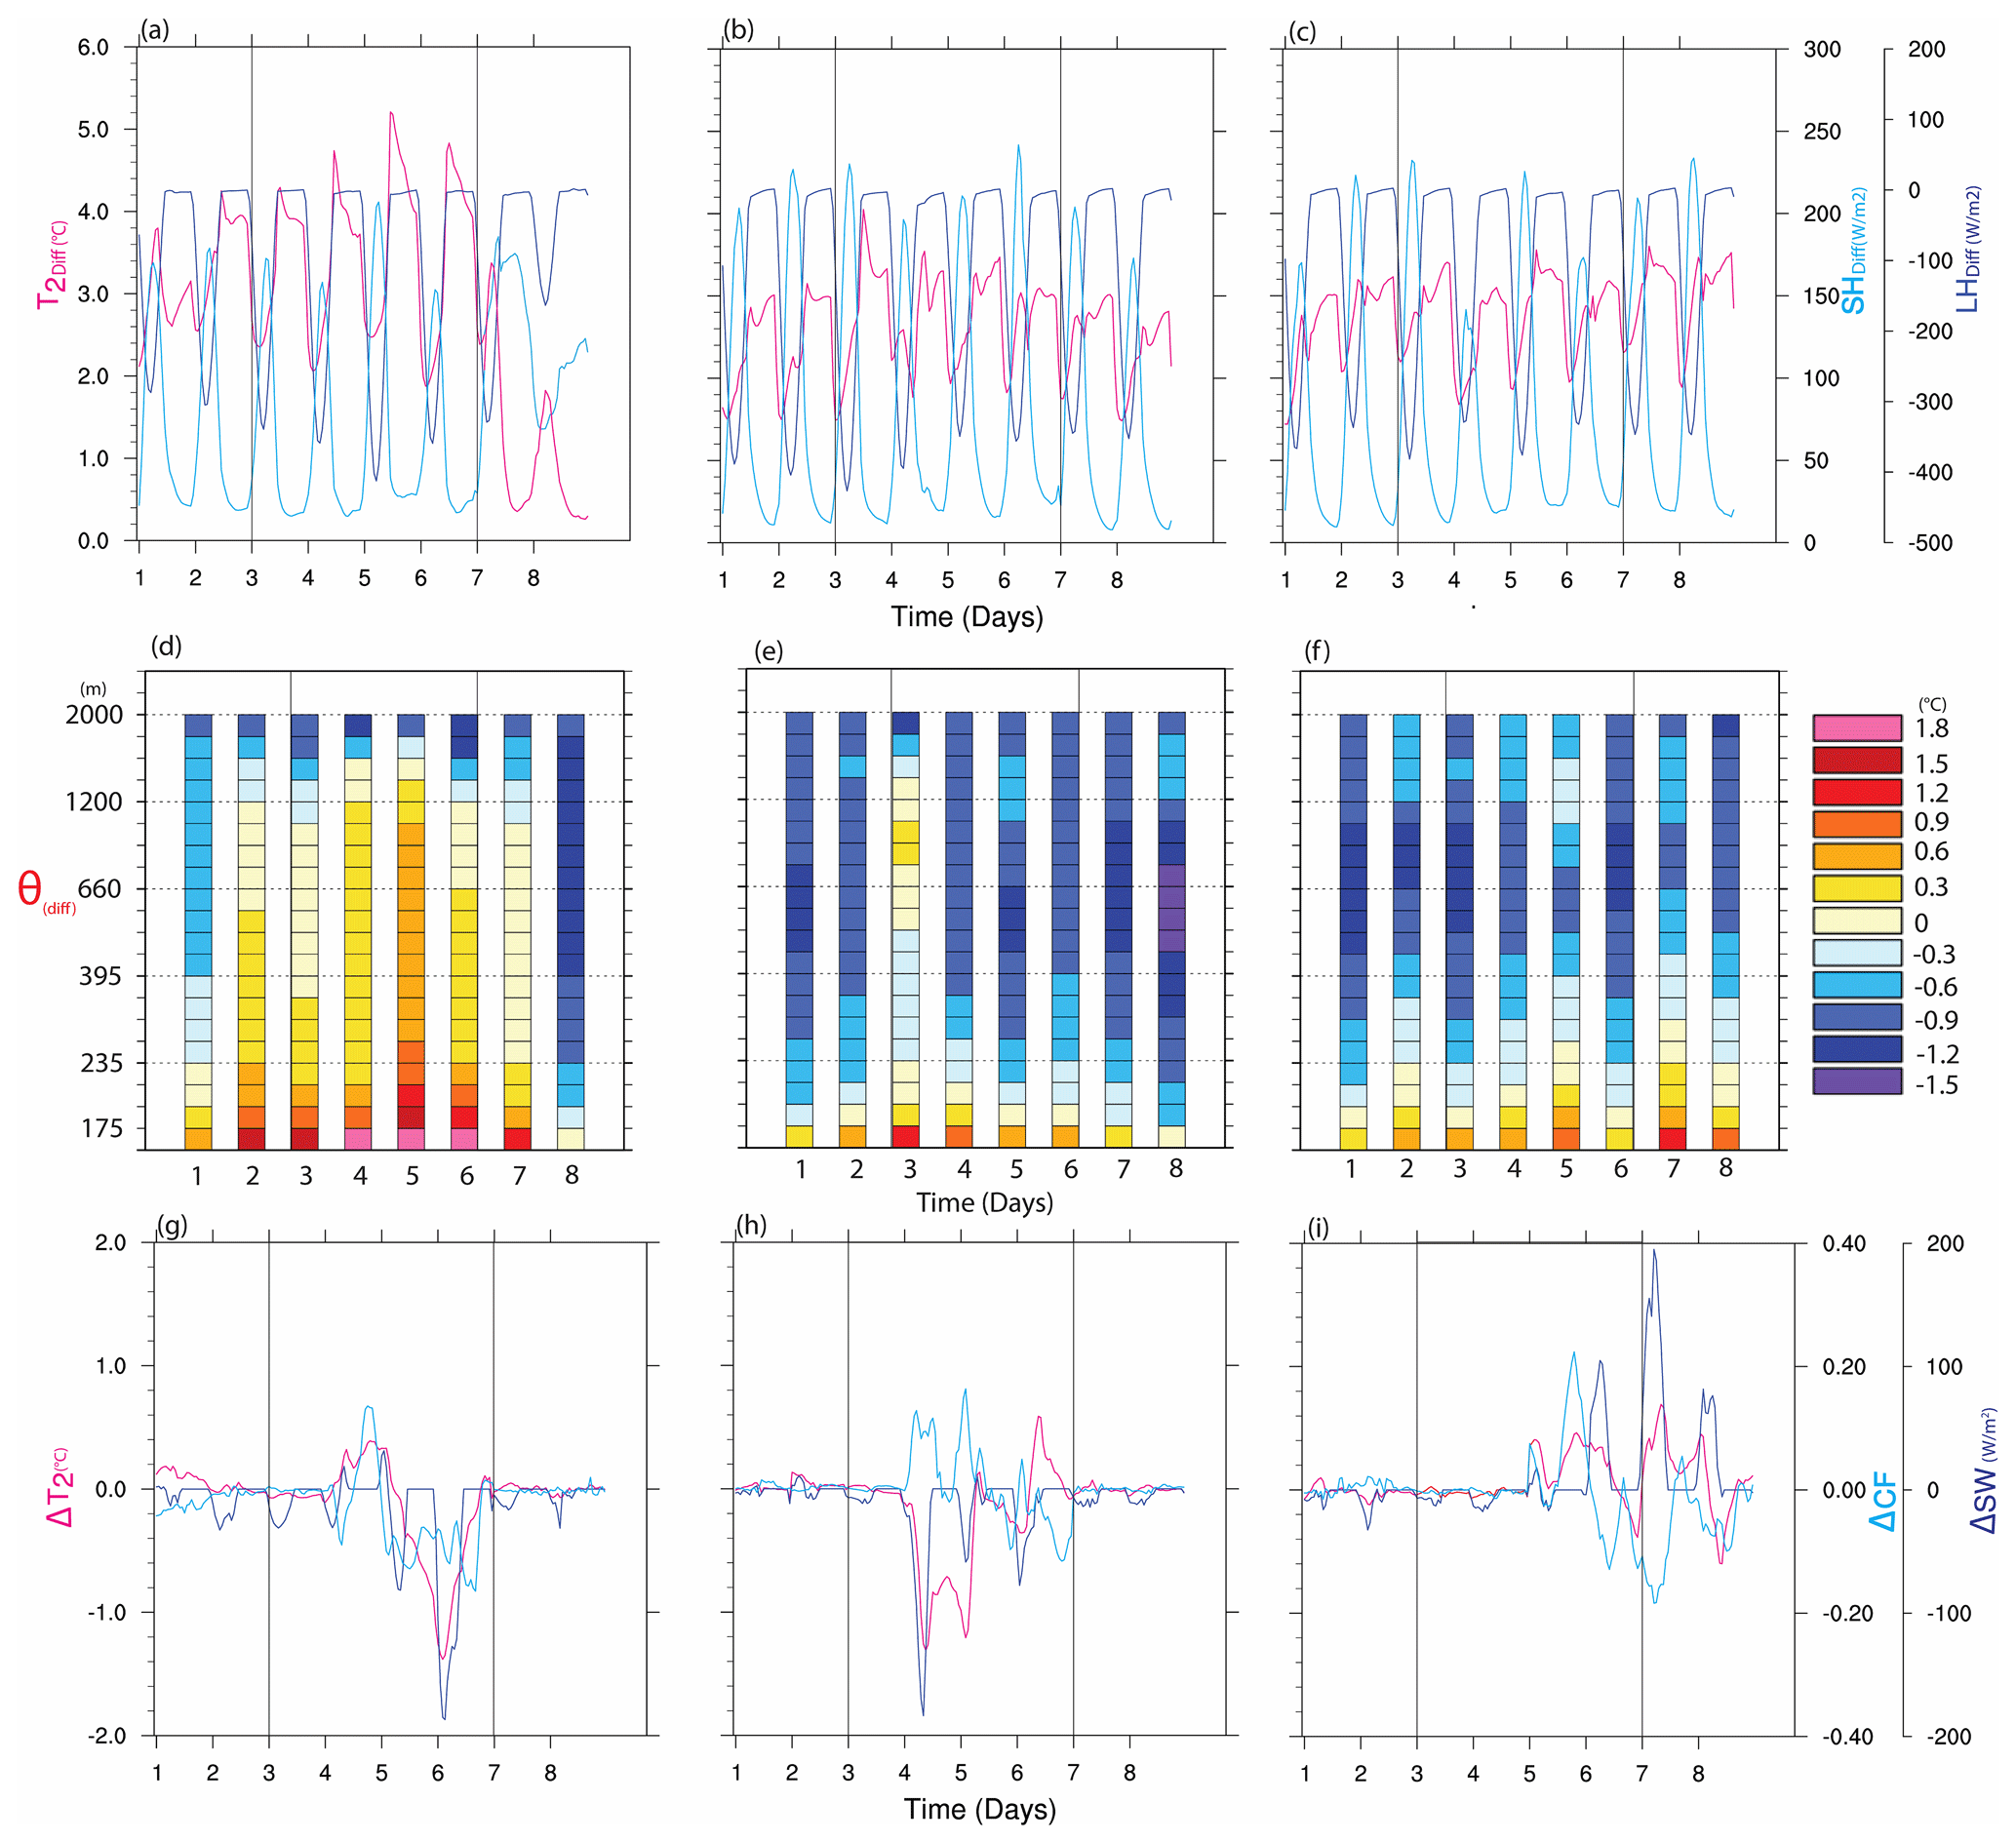
Figure 2The model (CTRL) domain-averaged results showing (a–c) difference of T2 (T2(diff)), sensible heat (SH; SH(diff)), and latent heat (LH; LH(diff)) between urban and vegetated grids for TC-HPErep, ST-HPErep and HY-HPErep; (d–f) vertical profile of potential temperature difference θ (θ(diff)) for TC-HPErep, ST-HPErep and HY-HPErep at midday for the PRD region; (g–i) the changes of T2 (ΔT2), CF (ΔCF) and incoming shortwave radiation SW (ΔSW) at the surface induced by total aerosol radiative forcing for TC-HPErep, ST-HPErep and HY-HPErep.
The effect of surface moisture availability, surface energy retention and transfer for both urban and vegetated surfaces was investigated by analyzing latent and sensible heat fluxes (Fig. 2a). The largest absolute latent heat difference between the two types of land cover was between 350 and 400 W/m2. This illustrates the impact of the limited vegetation in the city. This is buttressed by the 130–200 W/m2 difference, respectively in the amount of sensible heat for both types of land cover. Although both the latent and sensible heat fluxes shared similar incoming shortwave radiation, the continued increase in the temperature can be attributed to the continued desiccation of the urban areas, leading to faster buildup of heat and increase in temperature, even as the cloud cover continued to decrease until day 6, marking the end of the episode.
TARF caused an initial increase in T2 but then a significant reduction in T2 (> 1.0 ∘C) on day 6 when the PM10 increased to a peak. Figures 1d and 2g show that when PM10 was increased but below 10 µg/m3, the TARF caused a reduction in cloud fraction and thus an increase in T2. The reduction in cloud fraction due to TARF may be due to the aerosol–cloud interaction in which aerosols served as cloud condensation nuclei, and thus more cloud droplets were formed with a smaller radius, and the cloud fraction hence decreased (Liu et al., 2020). Nevertheless, when the PM10 level exceeded 10 µg/m3, the aerosol–radiation interaction (aerosol scattering and absorption) may become dominant, causing a reduction in the amount of solar radiation reaching the ground level due to the blockage effect of aerosols and thus a temperature reduction.
3.3.2 ST-HPE
Figure 2b shows the difference in T2 between the two land covers in the ST-HPErep. The T2 in urban areas was higher by a range of approximately 3.0–4.1 ∘C during the ST-HPErep. There was also approximately 0.2 to 1.0 ∘C difference in T2 between the ST-HPErep period and its pre- and post-HPE periods. Figure 2e shows that heat accumulated at the onset of ST-HPErep began to decay during the episode. The heat accumulation led to a maximum difference of about 1.5 ∘C on day 3, which was the first day of the ST-HPErep and the day with the highest incoming solar radiation and lowest cloud cover. This contrasts with the pre- and post-HPE periods which had a minimal difference in their cloud fraction during the episode, hence highlighting the importance of incoming solar radiation to the HPE. The sensible and latent heat fluxes shown Fig. 2b indicate that the heat buildup for this episode started before the onset of this HPE, as they continuously increased (decreased) for sensible (latent) heat. However, the changes in the cloud fraction from day 4 and 5 led to the retention of the accumulated heat and subsequent attenuation of temperature and sensible and latent heat differences. The potential temperature difference also shows a positive synergy during the ST-HPErep by maintaining a positive difference throughout the episode, even though it progressively weakened over time. These results indicate that the UHI effect was accentuated during the ST-HPErep, leading to a larger temperature difference between urban and vegetated surfaces.
The results of the effect of TARF on T2, SWin and CF for ST-HPE indicate that TARF caused marginal changes during the pre- and post-ST-HPE periods (Fig. 2h). Like the TC-HPErep, the TARF effect led to a reduction in approximately 1.5 ∘C when the PM10 reached a peak on days 4 and 5. The cloud fraction (Fig. 1b) also increased significantly during this period, thus contributing to the decrease in T2. As explained in the TC-HPErep, the reduction in T2 could be mainly due to effect of aerosol–radiation interaction. The TARF effect on T2 by day 6 led to a 0.5 ∘C increase; this was due to the slight increase of PM10 concentration (the total level was lower than 8 µg/m3) on that day that reduced the cloud fraction.
3.3.3 HY-HPE
HP-HPErep did not show any significant difference in UHI intensity between the pre-, mid- and post-HPE periods. Figure 2c shows a similar magnitude (3.0–3.5 ∘C) during pre- and post-HPE periods. The daily variation did not display any obvious signs of heat retention in the atmosphere, indicating that there was no heat accumulation during this episode. The potential temperature shown in Fig. 1c indicates that heat generated from heating the surface by the incoming solar radiation could not be entrained due to its increased wind speed and weak vertical motions, thereby making it difficult to accumulate heat, an observed pre-requisite for HPE and UHI synergistic effect. There was therefore no synergistic relationship between UHI and HPE during the HY-HPE.
The effect of TARF on T2 and OLR in the HY-HPErep, as displayed in Fig. 2i, shows a variation of −0.5 to 0.5 ∘C in temperature across the pre-, mid-, and post-HPE periods. The pre-HPE period shows marginal changes for CF, SWin and T2; however, variations began to be apparent from day 5. For instance, on the afternoon of day 5, the PM10 started to increase and reached a peak early on day 6. The cloud fraction increased in response to the increase in PM10, as did SWin and then T2. These changes became marginal late on day 6. Nevertheless, PM10 still maintained a relatively high level, and the cloud fraction reduced once more, allowing more solar radiation to reach the ground, causing an increase in T2.
In this study, eight HPEs during 2009–2011 were identified. We found that TC-HPE was influenced by incoming solar radiation and subsidence, and ST-HPE was influenced by low wind speed and reduction in cloud cover, while HY-HPE was influenced by weak vertical transport and increased wind speed. Consequently, TC-HPE and ST-HPE had a positive synergetic relationship (∼ 1.1 ∘C) between UHI and HPE because their characteristic meteorological conditions (weak subsidence, low wind speeds and reduced cloud cover) accentuated insolation, heat storage and heat entrainment, while HY-HPE had no discernable relationship. TARF was found to contribute significantly to the temperature variations during the HPEs, leading to significant cooling effects on the HPEs (0.5–1 ∘C), except when upward vertical transport prevailed, particularly during the daytime.
This study provided further insight into the nature of HPEs at both regional and local level by analyzing their modes of formation and thermodynamic characteristics and by investigating the contributions of land use and land cover (LULC) changes to the nature of HPEs. These findings can aid policymakers in redesigning and renewing our urban environments to alleviate the UHI effect, global warming and air pollution. Especially the impact of aerosol radiative forcing during the HPEs will improve our understanding of the mechanisms responsible for the co-occurrence of unusually high temperature and poor air quality in the PRD region, showing enormous implications for regional climate and health. The next phase of our study will focus on the regional-scale implications of the effect of HPEs on human health, the relative contribution of aerosol–radiation and aerosol–cloud interactions and the combined effect of LULC and aerosols on our climate.
This study was limited by access to more recent air quality emission data; hence the study was conducted for the 2009–2011 period. The use of data from only the Hong Kong area as a proxy for the region was because of the lack of air quality data from the rest of the study area. Also, as mentioned in Sect. 2.2, PM10 was used in this study because of the inadequacy of PM2.5 data in the study period.
The in situ meteorology data are provided by the Hong Kong Observatory at http://www.hko.gov.hk/cis/climat_e.htm (Climatological Information Services, 2021), while the in situ air quality data are provided by the Hong Kong Environmental Protection Department at https://cd.epic.epd.gov.hk/EPICDI/air/station/?lang=en (Environmental Protection Interactive Centre, 2021).
The supplement related to this article is available online at: https://doi.org/10.5194/acp-21-13443-2021-supplement.
SHLY and ICN designed the study. ICN did all calculations with support from SHLY and CYT. ICN wrote the paper with support and editing from SHLY, JG and CYT.
The authors declare that they have no conflict of interest.
The views expressed in this paper are those of the authors and do not necessarily reflect the views or policies of the Hong Kong government or any of its agencies or parastatals.
This work is supported by the Early Career Scheme of Research Grants Council of Hong Kong (grant no. CUHK24301415). The in situ meteorology and air quality observations are provided by the Hong Kong Observatory (http://www.hko.gov.hk/cis/climat_e.htm) and Hong Kong Environmental Protection Department (https://cd.epic.epd.gov.hk/EPICDI/air/station/?lang=en).
This research has been supported by the Early Career Scheme of Research Grants Council of Hong Kong (grant no. CUHK24301415).
This paper was edited by Zhanqing Li and reviewed by three anonymous referees.
Chan, E. Y. Y., Goggins, W. B., Kim, J. J., and Griffiths, S. M.: A study of intracity variation of temperature-related mortality and socioeconomic status among the Chinese population in Hong Kong, J. Epidemiol. Commun. H., 66, 322–327, https://doi.org/10.1136/jech.2008.085167, 2012.
Chen, X., Shao, S., Tian, Z., Xie, Z., and Yin, P.: Impacts of air pollution and its spatial spillover effect on public health based on China's big data sample, J. Clean. Prod., 142, 915–925, https://doi.org/10.1016/j.jclepro.2016.02.119, 2017.
Climatological Information Services: Climatological Database, available at: https://www.hko.gov.hk/en/cis/climat.htm, last access: 21 May 2021.
Environmental Protection Interactive Centre: Inquire and Download Air Quality Monitoring Data, available at: https://cd.epic.epd.gov.hk/EPICDI/air/station/?lang=en, last access: 21 May 2021.
Fan, S., Wang, B., Tesche, M., Engelmann, R., Althausen, A., Liu, J., Zhu, W., Fan, Q., Li, M., Ta, N., Song, L., and Leong, K.: Meteorological conditions and structures of atmospheric boundary layer in October 2004 over Pearl River Delta area, Atmos. Environ., 42, 6174–6186, https://doi.org/10.1016/j.atmosenv.2008.01.067, 2008.
Fan, S. J., Fan, Q., Yu, W., Luo, X. Y., Wang, B. M., Song, L. L., and Leong, K. L.: Atmospheric boundary layer characteristics over the Pearl River Delta, China, during the summer of 2006: measurement and model results, Atmos. Chem. Phys., 11, 6297–6310, https://doi.org/10.5194/acp-11-6297-2011, 2011.
Founda, D. and Santamouris, M.: Synergies between Urban Heat Island and Heat Waves in Athens (Greece), during an extremely hot summer (2012), Sci. Rep., 7, 10973, https://doi.org/10.1038/s41598-017-11407-6, 2017.
Freychet, N., Tett, S., Wang, J., and Hegerl, G.: Summer heat waves over Eastern China: dynamical processes and trend attribution, Environ. Res. Lett., 12, 024015, https://doi.org/10.1088/1748-9326/aa5ba3, 2017.
Gong, C. and Liao, H.: A typical weather pattern for ozone pollution events in North China, Atmos. Chem. Phys., 19, 13725–13740, https://doi.org/10.5194/acp-19-13725-2019, 2019.
Grell, G. A., Peckham, S. E., Schmitz, R., McKeen, S. A., Frost, G., Skamarock, W. C., and Eder, B.: Fully coupled “online” chemistry within the WRF model, Atmos. Environ., 39, 6957–6975, https://doi.org/10.1016/j.atmosenv.2005.04.027, 2005.
Gu, Y., Wong, T. W., Law, C. K., Dong, G. H., Ho, K. F., Yang, Y., and Yim, S. H. L.: Impacts of sectoral emissions in China and the implications: air quality, public health, crop production, and economic costs, Environ. Res. Lett., 13, 084008, https://doi.org/10.1088/1748-9326/aad138, 2018.
Guenther, A., Karl, T., Harley, P., Wiedinmyer, C., Palmer, P. I., and Geron, C.: Estimates of global terrestrial isoprene emissions using MEGAN (Model of Emissions of Gases and Aerosols from Nature), Atmos. Chem. Phys., 6, 3181–3210, https://doi.org/10.5194/acp-6-3181-2006, 2006.
Guo, J., Deng, M., Lee, S. S., Wang, F., Li, Z., Zhai, P., Liu, H., Lv, W., Yao, W., and Li, X.: Delaying precipitation and lightning by air pollution over the Pearl River Delta. Part I: Observational analyses, J. Geophys. Res.-Atmos., 121, 6472–6488, https://doi.org/10.1002/2015JD023257, 2016.
Guo, J., Liu, H., Li, Z., Rosenfeld, D., Jiang, M., Xu, W., Jiang, J. H., He, J., Chen, D., Min, M., and Zhai, P.: Aerosol-induced changes in the vertical structure of precipitation: a perspective of TRMM precipitation radar, Atmos. Chem. Phys., 18, 13329–13343, https://doi.org/10.5194/acp-18-13329-2018, 2018.
Hartigan, J. A. and Wong, M. A.: Algorithm AS 136: A K-Means Clustering Algorithm, J. R. Stat. Soc. C-Appl., 28, 100–108, https://doi.org/10.2307/2346830, 1979.
Hou, X., Chan, C. K., Dong, G. H., and Yim, S. H. L.: Impacts of transboundary air pollution and local emissions on PM2.5 pollution in the Pearl River Delta region of China and the public health, and the policy implications, Environ. Res. Lett., 14, 034005, https://doi.org/10.1088/1748-9326/aaf493, 2019.
Karremann, M. K., Liberato, M. L. R., Ordóñez, P., and Pinto, J. G.: Characterization of synoptic conditions and cyclones associated with top ranking potential wind loss events over Iberia, Atmos. Sci. Lett., 17, 354–361, https://doi.org/10.1002/asl.665, 2016.
Katsouyanni, D. K., Pantazopoulou, A., Touloumi, G., Tselepidaki, I., Moustris, K., Asimakopoulos, D., Poulopoulou, G., and Trichopoulos, D.: Evidence for Interaction between Air Pollution and High Temperature in the Causation of Excess Mortality, Arch. Environ. Health, 48, 235–242, https://doi.org/10.1080/00039896.1993.9940365, 1993.
Khafaie, M. A., Yajnik, C. S., Salvi, S. S., and Ojha, A.: Critical review of air pollution health effects with special concern on respiratory health, J. Air Poll. Health, 1, 123–136, 2016.
Lam, K. S., Wang, T. J., Wu, C. L., and Li, Y. S.: Study on an ozone episode in hot season in Hong Kong and transboundary air pollution over Pearl River Delta region of China, Atmos. Environ., 39, 1967–1977, https://doi.org/10.1016/j.atmosenv.2004.11.023, 2005.
Li, D. and Bou-Zeid, E.: Synergistic Interactions between Urban Heat Islands and Heat Waves: The Impact in Cities Is Larger than the Sum of Its Parts, J. Appl. Meteorol. Clim., 52, 2051–2064, https://doi.org/10.1175/JAMC-D-13-02.1, 2013.
Li, D., Sun, T., Liu, M., Yang, L., Wang, L., and Gao, Z.: Contrasting responses of urban and rural surface energy budgets to heat waves explain synergies between urban heat islands and heat waves, Environ. Res. Lett., 10, 054009, https://doi.org/10.1088/1748-9326/10/5/054009, 2015.
Li, H., Wang, B., Fang, X., Zhu, W., Fan, Q., Liao, Z., Liu, J., Zhang, A., and Fan, S.: Combined effect of boundary layer recirculation factor and stable energy on local air quality in the Pearl River Delta over southern China, J. Air Waste Manage., 68, 685–699, https://doi.org/10.1080/10962247.2018.1439125, 2018.
Li, M., Song, Y., Mao, Z., Liu, M., and Huang, X.: Impacts of thermal circulations induced by urbanization on ozone formation in the Pearl River Delta region, China, Atmos. Environ., 127, 382–392, https://doi.org/10.1016/j.atmosenv.2015.10.075, 2016.
Li, N., He, Q., Greenberg, J., Guenther, A., Li, J., Cao, J., Wang, J., Liao, H., Wang, Q., and Zhang, Q.: Impacts of biogenic and anthropogenic emissions on summertime ozone formation in the Guanzhong Basin, China, Atmos. Chem. Phys., 18, 7489–7507, https://doi.org/10.5194/acp-18-7489-2018, 2018.
Liu, M., Huang, Y., Ma, Z., Jin, Z., Liu, X., Wang, H., Liu, Y., Wang, J., Jantunen, M., Bi, J., and Kinney, P. L.: Spatial and temporal trends in the mortality burden of air pollution in China: 2004–2012, Environ. Int., 98, 75–81, https://doi.org/10.1016/j.envint.2016.10.003, 2017.
Liu, Z., Yim, S. H. L., Wang, C., and Lau, N. C.: The Impact of the Aerosol Direct Radiative Forcing on Deep Convection and Air Quality in the Pearl River Delta Region, Geophys. Res. Lett., 45, 4410–4418, https://doi.org/10.1029/2018GL077517, 2018.
Liu, Z., Ming, Y., Wang, L., Bollasina, M., Luo, M., Lau, N.-C., and Yim, S. H.-L.: A Model Investigation of Aerosol-Induced Changes in the East Asian Winter Monsoon, Geophys. Res. Lett., 46, 10186–10195, https://doi.org/10.1029/2019GL084228, 2019.
Liu, Z., Ming, Y., Zhao, C., Lau, N. C., Guo, J., Bollasina, M., and Yim, S. H. L.: Contribution of local and remote anthropogenic aerosols to a record-breaking torrential rainfall event in Guangdong Province, China, Atmos. Chem. Phys., 20, 223–241, https://doi.org/10.5194/acp-20-223-2020, 2020.
Lovett, G. M., Tear, T. H., Evers, D. C., Findlay, S. E. G., Cosby, B. J., Dunscomb, J. K., Driscoll, C. T., and Weathers, K. C.: Effects of air pollution on ecosystems and biological diversity in the eastern United States, Ann. N.Y. Acad. Sci., 1162, 99–135, https://doi.org/10.1111/j.1749-6632.2009.04153.x, 2009.
Luo, M., Hou, X., Gu, Y., Lau, N.-C., and Yim, S. H.-L.: Trans-boundary air pollution in a city under various atmospheric conditions, Sci. Total Environ., 618, 132–141, https://doi.org/10.1016/j.scitotenv.2017.11.001, 2018.
Matusick, G., Ruthrof, K. X., Kala, J., Brouwers, N. C., Breshears, D. D., and Hardy, G. E. S. J.: Chronic historical drought legacy exacerbates tree mortality and crown dieback during acute heatwave-compounded drought, Environ. Res. Lett., 13, 095002, https://doi.org/10.1088/1748-9326/aad8cb, 2018.
Miralles, D. G., Teuling, A. J., van Heerwaarden, C. C., and Vilà-Guerau de Arellano, J.: Mega-heatwave temperatures due to combined soil desiccation and atmospheric heat accumulation, Nat. Geosci., 7, 345–349, https://doi.org/10.1038/ngeo2141, 2014.
Mirzaei, P. A. and Haghighat, F.: Approaches to study Urban Heat Island – Abilities and limitations, Build. Environ., 45, 2192–2201, https://doi.org/10.1016/j.buildenv.2010.04.001, 2010.
Murari, K. K. and Ghosh, S.: Future Heat Wave Projections and Impacts, in: Climate Change Signals and Response: A Strategic Knowledge Compendium for India, edited by: Venkataraman, C., Mishra, T., Ghosh, S., and Karmakar, S., Springer Singapore, Singapore, 91–107, https://doi.org/10.1007/978-981-13-0280-0_6, 2019.
Nowak, D. J., Jovan, S., Branquinho, C., Augusto, S., Ribeiro, M. C., and Kretsch, C. E.: Biodiversity, air quality and human health, in: Connecting global priorities: biodiversity and human health: a state of knowledge review, 63–74, Chap. 4, World Health Organization, Geneva, Switzerland, 2015.
Ordóñez, C., Elguindi, N., Stein, O., Huijnen, V., Flemming, J., Inness, A., Flentje, H., Katragkou, E., Moinat, P., Peuch, V.-H., Segers, A., Thouret, V., Athier, G., van Weele, M., Zerefos, C. S., Cammas, J.-P., and Schultz, M. G.: Global model simulations of air pollution during the 2003 European heat wave, Atmos. Chem. Phys., 10, 789–815, https://doi.org/10.5194/acp-10-789-2010, 2010.
Panastasiou, D. K., Melas, D., and Kambezidis, H. D.: Heat waves characteristics and their relation to air quality in Athens, Global Nest J., 16, 919–928, https://doi.org/10.30955/gnj.001530, 2014.
Pearl River Delta Regional Air Quality Monitoring Report/Environmental Protection Department: available at: https://www.epd.gov.hk/epd/english/resources_pub/publications/m_report.html, last access: 21 May 2021.
Pinheiro, S. de L. L. de A., Saldiva, P. H. N., Schwartz, J., and Zanobetti, A.: Isolated and synergistic effects of PM10 and average temperature on cardiovascular and respiratory mortality, Rev. Saúde Pública, 48, 881–888, https://doi.org/10.1590/S0034-8910.2014048005218, 2014.
Qian, Z., He, Q., Lin, H.-M., Kong, L., Zhou, D., Liang, S., Zhu, Z., Liao, D., Liu, W., Bentley, C. M., Dan, J., Wang, B., Yang, N., Xu, S., Gong, J., Wei, H., Sun, H., Qin, Z., and HEI Health Review Committee: Part 2. Association of daily mortality with ambient air pollution, and effect modification by extremely high temperature in Wuhan, China, Res. Rep. Health Eff. Inst., 91–217, 2010.
Ramamurthy, P., González, J., Ortiz, L., Arend, M., and Moshary, F.: Impact of heatwave on a megacity: an observational analysis of New York City during July 2016, Environ. Res. Lett., 12, 054011, https://doi.org/10.1088/1748-9326/aa6e59, 2017.
Scortichini, M., De Sario, M., De'Donato, F. K., Davoli, M., Michelozzi, P., and Stafoggia, M.: Short-Term Effects of Heat on Mortality and Effect Modification by Air Pollution in 25 Italian Cities, Int. J. Environ. Res. Public Health, 15, 1771, https://doi.org/10.3390/ijerph15081771, 2018.
Shi, C., Nduka, I. C., Yang, Y., Huang, Y., Yao, R., Zhang, H., He, B., Xie, C., Wang, Z., and Yim, S. H. L.: Characteristics and meteorological mechanisms of transboundary air pollution in a persistent heavy PM2.5 pollution episode in Central-East China, Atmos. Environ., 223, 117239, https://doi.org/10.1016/j.atmosenv.2019.117239, 2020.
Shu, L., Wang, T., Han, H., Xie, M., Chen, P., Li, M., and Wu, H.: Summertime ozone pollution in the Yangtze River Delta of eastern China during 2013–2017: Synoptic impacts and source apportionment, Environ. Pollut., 257, 113631, https://doi.org/10.1016/j.envpol.2019.113631, 2020.
Silva, R. A., West, J. J., Lamarque, J.-F., Shindell, D. T., Collins, W. J., Dalsoren, S., Faluvegi, G., Folberth, G., Horowitz, L. W., Nagashima, T., Naik, V., Rumbold, S. T., Sudo, K., Takemura, T., Bergmann, D., Cameron-Smith, P., Cionni, I., Doherty, R. M., Eyring, V., Josse, B., MacKenzie, I. A., Plummer, D., Righi, M., Stevenson, D. S., Strode, S., Szopa, S., and Zengast, G.: The effect of future ambient air pollution on human premature mortality to 2100 using output from the ACCMIP model ensemble, Atmos. Chem. Phys., 16, 9847–9862, https://doi.org/10.5194/acp-16-9847-2016, 2016.
Skamarock, W. C. and Klemp, J. B.: A time-split nonhydrostatic atmospheric model for weather research and forecasting applications, J. Comput. Phys., 227, 3465–3485, https://doi.org/10.1016/j.jcp.2007.01.037, 2008.
Stefanon, M., D'Andrea, F., and Drobinski, P.: Heatwave classification over Europe and the Mediterranean region, Environ. Res. Lett., 7, 014023, https://doi.org/10.1088/1748-9326/7/1/014023, 2012.
Streets, D. G., Bond, T. C., Carmichael, G. R., Fernandes, S. D., Fu, Q., He, D., Klimont, Z., Nelson, S. M., Tsai, N. Y., Wang, M. Q., Woo, J.-H., and Yarber, K. F.: An inventory of gaseous and primary aerosol emissions in Asia in the year 2000, J. Geophys. Res., 108, 8809, https://doi.org/10.1029/2002JD003093, 2003.
Tan, P.-N., Steinbach, M., Karpatne, A., and Kumar, V.: Introduction to data mining, 2nd Edn., Pearson, NY, 2019.
Tong, C. H. M., Yim, S. H. L., Rothenberg, D., Wang, C., Lin, C.-Y., Chen, Y. D., and Lau, N. C.: Assessing the impacts of seasonal and vertical atmospheric conditions on air quality over the Pearl River Delta region, Atmos. Environ., 180, 69–78, https://doi.org/10.1016/j.atmosenv.2018.02.039, 2018a.
Tong, C. H. M., Yim, S. H. L., Rothenberg, D., Wang, C., Lin, C.-Y., Chen, Y. D., and Lau, N. C.: Projecting the impacts of atmospheric conditions under climate change on air quality over the Pearl River Delta region, Atmos. Environ., 193, 79–87, https://doi.org/10.1016/j.atmosenv.2018.08.053, 2018b.
Unal, Y. S., Tan, E., and Mentes, S. S.: Summer heat waves over western Turkey between 1965 and 2006, Theor. Appl. Climatol., 112, 339–350, https://doi.org/10.1007/s00704-012-0704-0, 2013.
Wang, M. Y., Yim, S. H. L., Wong, D. C., and Ho, K. F.: Source contributions of surface ozone in China using an adjoint sensitivity analysis, Sci. Total Environ., 662, 385–392, https://doi.org/10.1016/j.scitotenv.2019.01.116, 2019.
Wang, M. Y., Yim, S. H. L., Dong, G. H., Ho, K. F., and Wong, D. C.: Mapping ozone source-receptor relationship and apportioning the health impact in the Pearl River Delta region using adjoint sensitivity analysis, Atmos. Environ., 222, 117026, https://doi.org/10.1016/j.atmosenv.2019.117026, 2020.
Wang, Y., Nordio, F., Nairn, J., Zanobetti, A., and Schwartz, J. D.: Accounting for adaptation and intensity in projecting heat wave-related mortality, Environ. Res., 161, 464–471, https://doi.org/10.1016/j.envres.2017.11.049, 2018.
Wang, Y., Chan, A., Lau, G. N.-C., Li, Q., Yang, Y., and Yim, S. H. L.: Effects of urbanization and global climate change on regional climate in the Pearl River Delta and thermal comfort implications, 39, 2984–2997, https://doi.org/10.1002/joc.5996, 2019.
Wang, Y., Yim, S. H. L., Yang, Y., and Morin, C. W.: The effect of urbanization and climate change on the mosquito population in the Pearl River Delta region of China, Int. J. Biometeorol., 64, 501–512, https://doi.org/10.1007/s00484-019-01837-4, 2020.
Xia, Y., Guan, D., Meng, J., Li, Y., and Shan, Y.: Assessment of the pollution–health–economics nexus in China, Atmos. Chem. Phys., 18, 14433–14443, https://doi.org/10.5194/acp-18-14433-2018, 2018.
Xie, M., Zhu, K., Wang, T., Feng, W., Gao, D., Li, M., Li, S., Zhuang, B., Han, Y., Chen, P., and Liao, J.: Changes in regional meteorology induced by anthropogenic heat and their impacts on air quality in South China, Atmos. Chem. Phys., 16, 15011–15031, https://doi.org/10.5194/acp-16-15011-2016, 2016.
Yang, Y., Yim, S. H. L., Haywood, J., Osborne, M., Chan, J. C. S., Zeng, Z., and Cheng, J. C. H.: Characteristics of Heavy Particulate Matter Pollution Events Over Hong Kong and Their Relationships With Vertical Wind Profiles Using High-Time-Resolution Doppler Lidar Measurements, J. Geophys. Res.-Atmos., 124, 9609–9623, https://doi.org/10.1029/2019JD031140, 2019.
Yim, S. H. L.: Development of a 3D Real-Time Atmospheric Monitoring System (3DREAMS) Using Doppler LiDARs and Applications for Long-Term Analysis and Hot-and-Polluted Episodes, Remote Sens., 12, 1036, https://doi.org/10.3390/rs12061036, 2020.
Yim, S. H. L., Fung, J. C. H., Lau, A. K. H., and Kot, S. C.: Air ventilation impacts of the “wall effect” resulting from the alignment of high-rise buildings, Atmos. Environ., 43, 4982–4994, https://doi.org/10.1016/j.atmosenv.2009.07.002, 2009.
Yim, S. H. L., Fung, J. C. H., and Lau, A. K. H.: Use of high-resolution MM5/CALMET/CALPUFF system: SO2 apportionment to air quality in Hong Kong, Atmos. Environ., 44, 4850–4858, https://doi.org/10.1016/j.atmosenv.2010.08.037, 2010.
Yim, S. H. L., Fung, J. C. H., and Ng, E. Y. Y.: An assessment indicator for air ventilation and pollutant dispersion potential in an urban canopy with complex natural terrain and significant wind variations, Atmos. Environ., 94, 297–306, https://doi.org/10.1016/j.atmosenv.2014.05.044, 2014.
Yim, S. H. L., Lee, G. L., Lee, I. H., Allroggen, F., Ashok, A., Caiazzo, F., Eastham, S. D., Malina, R., and Barrett, S. R. H.: Global, regional and local health impacts of civil aviation emissions, Environ. Res. Lett., 10, 034001, https://doi.org/10.1088/1748-9326/10/3/034001, 2015.
Yim, S. H. L., Gu, Y., Shapiro, M. A., and Stephens, B.: Air quality and acid deposition impacts of local emissions and transboundary air pollution in Japan and South Korea, Atmos. Chem. Phys., 19, 13309–13323, https://doi.org/10.5194/acp-19-13309-2019, 2019a.
Yim, S. H. L., Hou, X., Guo, J., and Yang, Y.: Contribution of local emissions and transboundary air pollution to air quality in Hong Kong during El Niño-Southern Oscillation and heatwaves, Atmos. Res., 218, 50–58, https://doi.org/10.1016/j.atmosres.2018.10.021, 2019b.
Yim, S. H. L., Wang, M., Gu, Y., Yang, Y., Dong, G., and Li, Q.: Effect of Urbanization on Ozone and Resultant Health Effects in the Pearl River Delta Region of China, J. Geophys. Res.-Atmos., 124, 11568–11579, https://doi.org/10.1029/2019JD030562, 2019c.
Yu, M., Carmichael, G. R., Zhu, T., and Cheng, Y.: Sensitivity of predicted pollutant levels to anthropogenic heat emissions in Beijing, Atmos. Environ., 89, 169–178, https://doi.org/10.1016/j.atmosenv.2014.01.034, 2014.
Zhang, H., Wang, Y., Park, T.-W., and Deng, Y.: Quantifying the relationship between extreme air pollution events and extreme weather events, Atmos. Res., 188, 64–79, https://doi.org/10.1016/j.atmosres.2016.11.010, 2017.
Zhang, Q., Streets, D. G., Carmichael, G. R., He, K. B., Huo, H., Kannari, A., Klimont, Z., Park, I. S., Reddy, S., Fu, J. S., Chen, D., Duan, L., Lei, Y., Wang, L. T., and Yao, Z. L.: Asian emissions in 2006 for the NASA INTEX-B mission, Atmos. Chem. Phys., 9, 5131–5153, https://doi.org/10.5194/acp-9-5131-2009, 2009.
Zheng, J., Zhang, L., Che, W., Zheng, Z., and Yin, S.: A highly resolved temporal and spatial air pollutant emission inventory for the Pearl River Delta region, China and its uncertainty assessment, Atmos. Environ., 43, 5112–5122, https://doi.org/10.1016/j.atmosenv.2009.04.060, 2009.