the Creative Commons Attribution 4.0 License.
the Creative Commons Attribution 4.0 License.
 | 02 Sep 2021
Measurement report: Cloud condensation nuclei activity and its variation with organic oxidation level and volatility observed during an aerosol life cycle intensive operational period (ALC-IOP)
Shan Zhou
Sonya Collier
Jianzhong Xu
Cloud condensation nuclei (CCN) spectrum and the CCN activated fraction of size-resolved aerosols (SR-CCN) were measured at a rural site on Long Island during the Department of Energy (DOE) aerosol life cycle intensive operational period (ALC-IOP) from 15 July to 15 August 2011. During the last week of the ALC-IOP, the dependence of the activated fraction on aerosol volatility was characterized by sampling downstream of a thermodenuder (TD) operated at temperatures up to 100 ∘C. Here we present aerosol properties, including aerosol total number concentration, CCN spectrum, and the CCN hygroscopicity, for air masses of representative origins during the ALC-IOP. The hygroscopicity of organic species in the aerosol is derived from CCN hygroscopicity and chemical composition. The dependence of organic hygroscopicity on the organic oxidation level (e.g., atomic O:C ratio) agrees well with theoretical predictions and results from previous laboratory and field studies. The derived κorg and O:C ratio first increase as TD temperature increases from 20 ∘C (i.e., ambient temperature) to 50 or 75 ∘C and then decrease as TD temperature further increases to 100 ∘C. The initial increases of O:C and κorg with TD temperature below 50 ∘C are likely due to evaporation of more volatile organics with relatively lower O:C and hygroscopicity such as primary organic aerosol. At the high TD temperatures, the decreases of O:C and κorg indicate that evaporated organics were more oxygenated and had lower molecular weights. These trends are different from previous laboratory experiments and field observations, which reported that organic O:C increased monotonically with increasing TD temperature, whereas κorg decreased with the TD temperature. One possible reason is that previous studies were either focused on laboratory-generated secondary organic aerosol (SOA) or based on field observations at locations more dominated by SOA.
- Article
(928 KB) - Full-text XML
-
Supplement
(246 KB) - BibTeX
- EndNote


As a critical element in cloud formation, atmospheric aerosols indirectly influence the global energy budget by affecting the atmospheric boundary structure and changing clouds' lifetimes and coverage. For example, an increase in cloud condensation nuclei (CCN) concentration leads to smaller cloud droplet sizes and higher cloud albedo at the same liquid water path (i.e., first indirect effect; Twomey, 1977). Additionally, smaller cloud droplets suppress precipitation, causing increases in cloud lifetime and coverage (i.e., second indirect effect; Albrecht, 1989). Presently, the aerosol indirect effects remain the most uncertain components in simulated radiative forcing since the pre-industrial era (Pachauri et al., 2014). This considerable uncertainty is due to an incomplete understanding of the aerosol–cloud interactions and the perturbation of aerosol properties due to anthropogenic emissions (Rosenfeld et al., 2014).
Quantifying the aerosol indirect effects requires the knowledge of aerosol particles' ability to form cloud droplets at atmospherically relevant supersaturations (i.e., CCN activity). Under a given supersaturation, whether a particle can activate and form a cloud droplet depends on its size and hygroscopicity parameter (Andreae and Rosenfeld, 2008a; Petters and Kreidenweis, 2007; Wang et al., 2008). The hygroscopicity parameter describes the tendency of particles to uptake water. It is a function of thermodynamic properties, including molar volume, activity coefficient, and surface activity of the chemical species inside the aerosol particles (McFiggans et al., 2006). The number of inorganic species in ambient aerosol particles is quite limited, and their hygroscopicities are well understood (Petters and Kreidenweis, 2007). On the other hand, atmospheric aerosol often consists of a large number of organic species (Zhang et al., 2007; Setyan et al., 2012). These organic species collectively dominate the composition of submicron particles, which make up the majority of CCN. The hygroscopicity parameters of these organic species may depend on water solubility, molecular weight, oxidation level, surface activity, mixing state, and/or phase state (Kuwata et al., 2013; Lambe et al., 2011; Mei et al., 2013a; Ovadnevaite et al., 2017; Wang et al., 2019), and they can exhibit a wide range of values from zero for hydrophobic chemical species to ∼0.3 for some low-molecular-weight water-soluble organics (e.g., Petters et al., 2009; Moore et al., 2012; Lathem et al., 2013).
Earlier studies show that the simulated CCN concentration can be strongly correlated to the hygroscopicity of organics in the particles (e.g., McFiggans et al., 2006; Mei et al., 2013b) in addition to particle size distribution (Dusek et al., 2006), mixing state (Lance et al., 2013; Mei et al., 2013b; Wang et al., 2010), and volume fraction of organics in particles (Wang et al., 2008). The high sensitivity of simulated CCN concentration to organic hygroscopicity is more prevalent during the pre-industrial era when anthropogenic sulfate concentration was lower, and organics represented a substantially larger fraction of the submicron aerosol mass (Mei et al., 2013b; Liu and Wang, 2010). As a result, neglecting the variation in organic hygroscopicity can lead to substantial bias in aerosol indirect forcing estimation (i.e., the change in radiation flux due to the increased aerosol concentration since the pre-industrial era) (Liu and Wang, 2010). These results highlight the importance of understanding organic hygroscopicity variability and accurately representing it in climate models. Earlier studies show that organic hygroscopicity for CCN activation generally increases with oxidation level (Duplissy et al., 2011; Lambe et al., 2011; Massoli et al., 2010; Mei et al., 2013a, b; Thalman et al., 2017), suggesting a promising approach to efficiently parameterize the overall hygroscopicity of a large number of organic species in aerosol particles. Wang et al. (2019) show that for secondary organic aerosol (SOA) the observed increasing organic hygroscopicity with oxidation level is likely due to the following two reasons. First, SOA particles formed from smaller precursor molecules are more oxidized and have lower average molecular weights. Second, fragmentation reactions during oxidation reduce average organic molecule weight, leading to increased hygroscopicity. At present, field measurements of organic hygroscopicity and its variation with oxidation level are still quite limited. The formation of SOA strongly depends on the volatility of organic species. There have been very few studies on the variation of hygroscopicity with both oxidation level and volatility of organics, especially for ambient aerosols (Cerully et al., 2015; Kuwata et al., 2011).
Here, we report aerosol hygroscopicity, mixing state, and organic hygroscopicity derived from size-resolved CCN activated fraction and chemical composition measured at a rural site on Long Island during the aerosol life cycle intensive operational period (ALC-IOP). Aerosol properties are presented in Sect. 3.1 for representative air mass types, which are classified based on the analysis of air mass back-trajectories (Zhou et al., 2016). The hygroscopicity of activated aerosol particles is presented for each air mass type, and the influence from the characteristic emission sources and atmospheric processing is discussed. In Sect. 3.2, the hygroscopicity of organic species in the aerosol is derived from particle hygroscopicity and chemical composition. The variation of organic hygroscopicity with air mass type is presented. The relationship between organic hygroscopicity and oxidation level is examined, and the relationship is compared with results from earlier studies. Finally, in Sect. 3.3, the variation of organic hygroscopicity with volatility and oxidation level is studied using the measurements downstream of a thermal denuder operated at temperatures ranging from ambient temperature to 100 ∘C.
2.1 Measurements and the site
The aerosol life cycle intensive operational period (ALC-IOP), a field study sponsored by the Department of Energy (DOE), took place at Brookhaven National Laboratory (BNL; 40.871∘ N, 72.89∘ W) on Long Island, New York, from 15 July to 15 August 2011. Aerosol properties at this location were influenced by complex interaction among anthropogenic, biogenic, and marine emissions with the extent of atmospheric processing, which also depended on air mass trajectories and atmospheric transport time. The measurements related to this study include CCN activated fraction of size-classified particles, CCN spectrum, aerosol size distribution, and size-resolved chemical composition of non-refractory submicron aerosols (NR-PM1). Measurements included both ambient aerosols and those processed by a digitally controlled thermodenuder (TD) to examine the variation of aerosol properties with volatility (Zhou et al., 2016). All of the above measurements were taken at the ground level and are reported at ambient conditions, and local time (UTC−4) is used throughout this study.
2.2 Size-resolved CCN activated fraction, CCN spectrum, and aerosol size distribution
The CCN activated fraction was measured using a size-resolved CCN counter system (SR-CCN). The SR-CCN is detailed in Mei et al. (2013a, b) and is briefly described here. Ambient aerosol particles are first dried to below 20 % relative humidity (RH), brought to a steady-state charge distribution in a Kr-85 aerosol neutralizer (model 3077, TSI), and subsequently classified by a differential mobility analyzer (DMA, model 3081, TSI). The total number and CCN concentrations of the size-classified aerosol are then simultaneously characterized by a condensation particle counter (CPC, model 3071, TSI) and a CCN counter (CCN-100, DMT), respectively (Roberts and Nenes, 2005; Lance et al., 2006; Rose et al., 2008). During the ALC-IOP, the DMA's aerosol sample flow and sheath flow were maintained at 0.8 and 8 L min−1, respectively. The total flow of CPC was reduced to 0.5 L min−1 within an in-line critical orifice, and the sample flow of the CCN counter was maintained at 0.3 L min−1. The measurement sequence is illustrated in Fig. S1 in the Supplement. The longitudinal temperature gradient of the CCN counter was stepped through 4, 4.5, 5.5, 6.5, 8, 10, 12, and 18 ∘C (Fig. S1b). Based on calibrations using ammonium sulfate particles, the corresponding supersaturations (S) derived from κ-Köhler theory (using a constant van 't Hoff factor of 2.5) were 0.12 %, 0.15 %, 0.20 %, 0.25 %, 0.32 %, 0.41 %, 0.50 %, and 0.79 %, respectively. The supersaturation was maintained inside the CCN counter at each value for approximately 9 min. The classified particle diameter (by the DMA) was scanned between 60 and 250 nm four times (128 s per scan) (Wang and Flagan, 1990). The CCN counter was stepped through the temperature gradients in a sawtooth pattern (Fig. S1b) and provided measurements at the above eight S values approximately every 80 min. Before 23 July, the CCN counter was operated with the first seven supersaturation set points. The aerosol size distribution was derived by inverting the particle concentration measured by the CPC using a routine described in Collins et al. (2002). A similar procedure was also applied to measured CCN concentration to obtain size-resolved CCN concentration. The ratio of the above two concentrations provided size-resolved CCN activated fractions (E). In addition to size-resolved CCN activated fraction, CCN concentration spectrum was measured using a second CCN counter also operated at a flow rate of 0.3 L min−1 and at seven supersaturations of 0.11 %, 0.13 %, 0.17 %, 0.23 %, 0.32 %, 0.40 % and 0.48 %, corresponding to longitudinal temperature gradients of 4.3, 4.8, 5.5, 6.5, 7.9, 10, and 12 ∘C, respectively. The temperature gradient was stepped through the eight values every 32 min, as shown in Fig. S1a.
The measurement of the CCN concentration spectrum was carried out for ambient aerosol during the entire ALC-IOP. Before 10 August, the SR-CCN sampled ambient aerosol only. From 10 to 15 August 2011, the SR-CCN was operated downstream of the TD (custom). The design and operation of the TD were improved by Fierz et al. (2007) and were also discussed by Zhou et al. (2016). During this period, the DMA inside SR-CCN was scanned between 80 and 250 nm four times (66 s per scan) at each supersaturation set point. Every 40 min, the measurements were stepped through seven supersaturations, similar to the measurement sequence before August 10, except without the set point at 0.41 % (i.e., the temperature gradient of 10 ∘C). From 10 to 15 August, the temperature setting of the TD was cycled through 50, 75, and 100 ∘C. The TD was operated with an automated switching valve to allow for measurements of ambient aerosol particles (bypass (BP) mode) for 20 min and then processed by the TD (TD mode) for 20 min. A complete cycle included ambient aerosol measurements and TD-processed measurements at 50 ∘C (or 75 or 100 ∘C) alternatively.
The number size distribution of ambient aerosol was measured with a custom-made scanning mobility particle spectrometer (SMPS) during the entire ALC-IOP. The SMPS consists of a Kr-85 neutralizer (model 3077A, TSI Inc), a DMA (model 3080, TSI Inc.), and a CPC (model 3771, TSI, Inc.). The SMPS was operated for the mobility diameter range of 10–610 nm with a time resolution of 120 s. The number size distribution of ambient aerosol measured by the SMPS was inverted using the routine described in Collins et al. (2002), which explicitly accounts for multiply charged particles.
2.3 Volatility-resolved chemical composition of submicron aerosols
The mass concentrations of NR-PM1 organic and inorganic (nitrate, sulfate, ammonium, chloride) species and their volatility distributions were measured by combining the high-resolution time-of-flight aerosol mass spectrometer (HR-ToF-AMS, Aerodyne Research Inc., from now on AMS for short) (DeCarlo et al., 2006) with the TD. The AMS sampled ambient aerosols and those processed by the TD alternately during the entire ALC-IOP. Positive matrix factorization (PMF) analysis of the AMS organic matrix resolved three distinct organic aerosol (OA) factors, including (1) a fresher, semivolatile oxygenated organic aerosol (SV-OOA; ; 63 % of OA mass), representing SOA formed through the interactions between local biogenic VOCs and anthropogenic emissions in transported urban plumes from the New York metropolitan region; (2) a regional, more aged, low-volatility OOA (LV-OOA; ; 29 %) influenced by aqueous-phase processing; and (3) a nitrogen-enriched OA (NOA; ; ; 8 %) likely composed of amine salts formed from acid–base reactions in industrial emissions (Zhou et al., 2016). The volatilities of the OA were determined based on their thermal profiles. Details of the AMS operation, data reduction and processing, PMF analysis, and data interpretation are available in Zhou et al. (2016).
3.1 Overview of aerosol properties in different air masses
The back-trajectories of air masses arriving at the site were classified into five clusters (Zhou et al., 2016). The 72 h back trajectories of air masses were shown on the map (Fig. 1a in Zhou et al., 2016). Because the aerosols that originated from the North Atlantic Ocean area likely had a substantial contribution from sea spray particles that could not be quantitatively measured by the AMS, the analysis of CCN activity and its relationship with the aerosol composition are focused on the other four clusters, which are briefly described here. The air mass of cluster 1 had a relatively long-range (LR) transportation influence from the northwest Canadian forest (LRNW, 15.1 % of all trajectories). The air mass of cluster 2 was mainly from the northwest (NW, 21.6 %) region. Cluster 3 included air mass circulating along the south-southwest, with some passing over Philadelphia and Washington metropolitan areas (SSW, 26.4 %). Cluster 4 represents the air mass passing over the polluted west New York City metro area (W, 14.8 %).
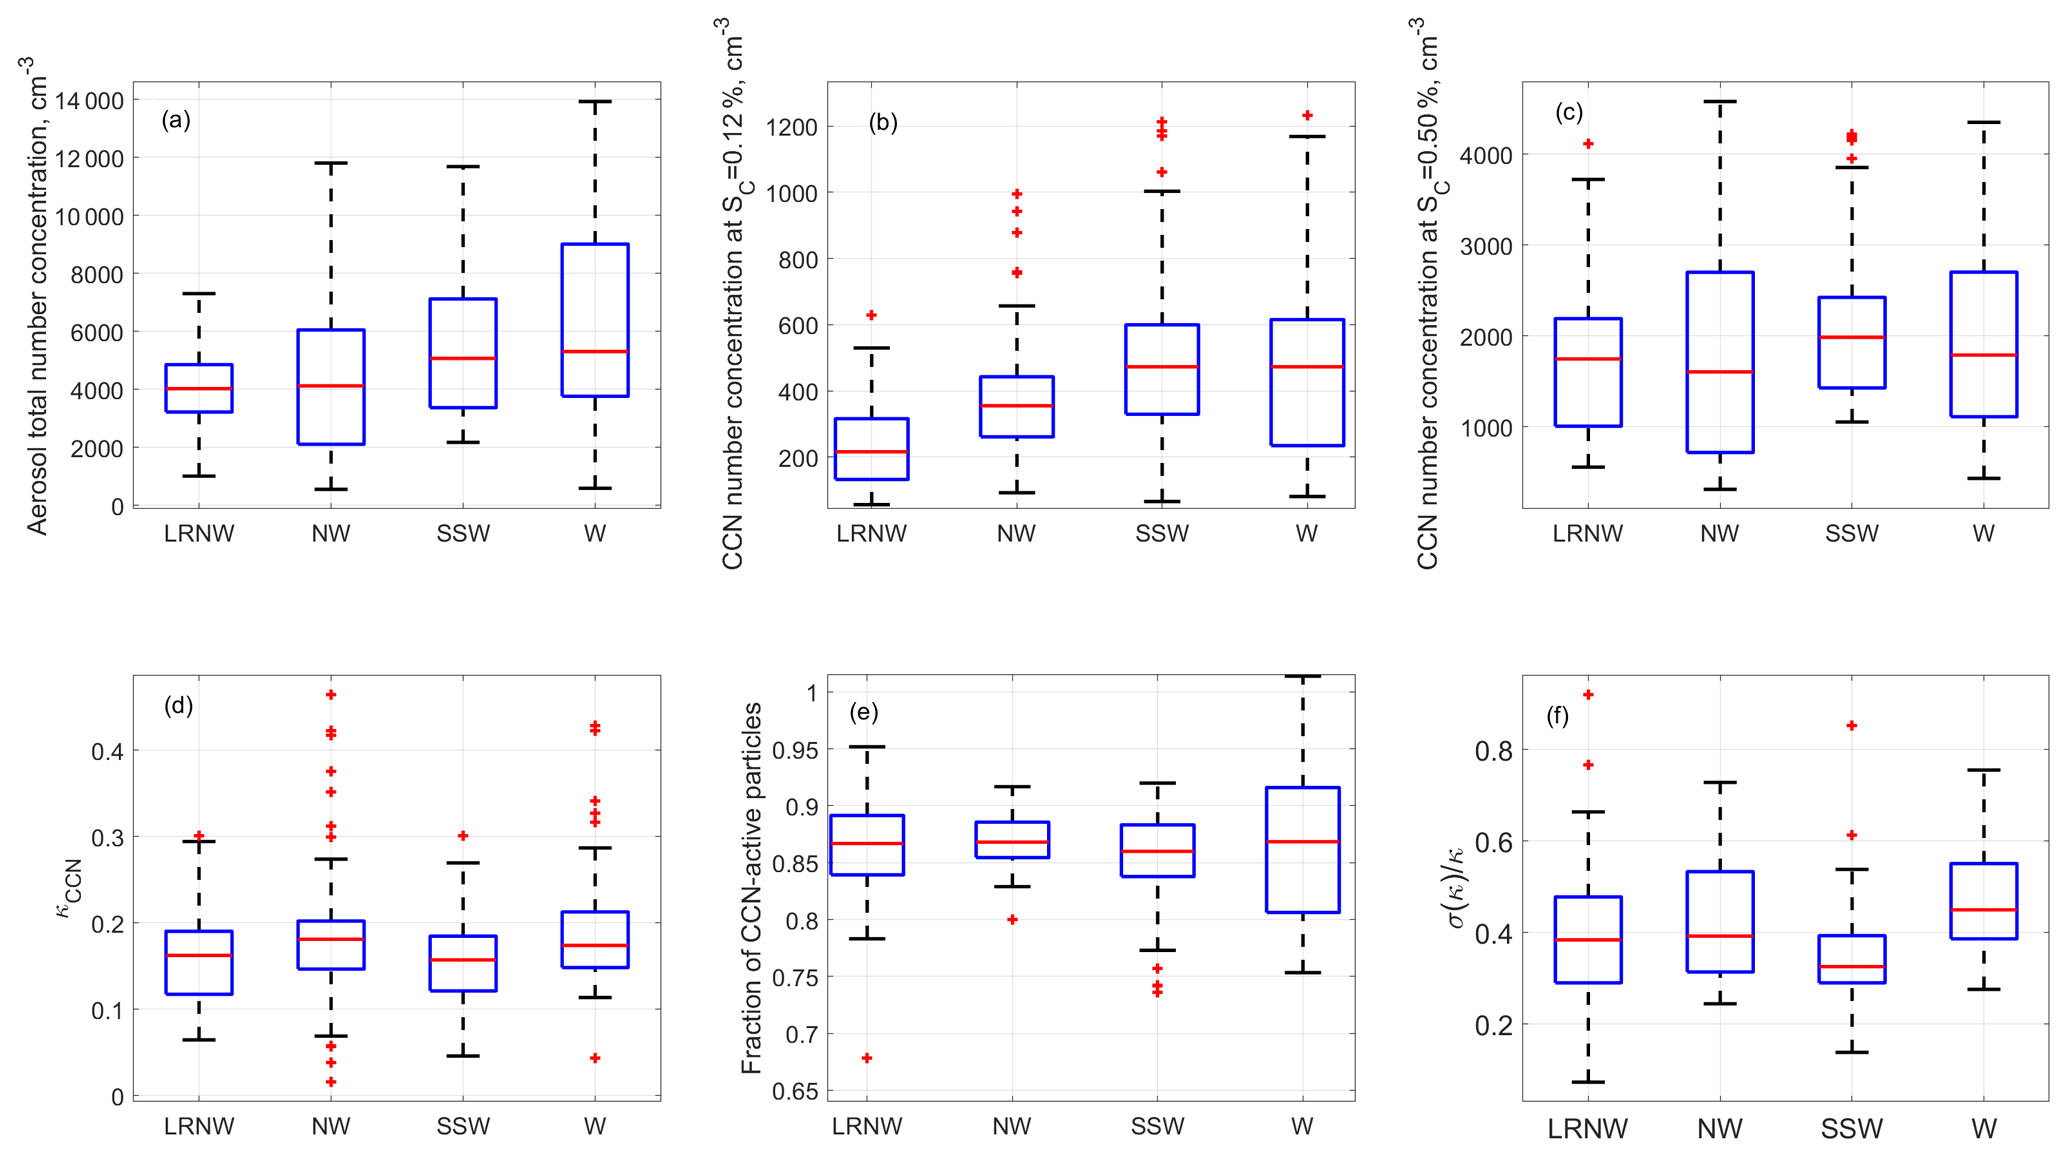
Figure 1The averaged aerosol properties were observed for each air mass cluster at the BNL site from 15 July to 9 August 2012. (a) Aerosol total number concentration; (b) CCN concentrations measured at supersaturations of 0.12 % and (c) 0.50 %; the derived properties for the CCN active particles ranging from 80 to 250 nm; (d) overall aerosol hygroscopicity; (e) maximum activation fraction; and (f) dispersion of size-selected CCN active particles. The ends of the whiskers represent the minimum and maximum of data except for the outlines (red cross), which are defined as points outside of ±2.7σ. The bottom and the top of the box are the 25th and 75th percentiles; the line inside the box is the 50th percentile.
Figure 1a shows the total aerosol number concentration, integrated from the aerosol size distribution ranging from 10 to 610 nm measured by the SMPS, and Fig. 1b and c present the measured CCN concentrations at two supersaturations of 0.12 % and 0.50 %, respectively. The CCN concentration at a supersaturation of 0.12 % is dominated by accumulation mode particles, whereas both Aitken mode and accumulation mode particles contribute to the CCN at 0.50 % supersaturation. The highest total number concentration was observed when the air mass was from the west (i.e., W cluster) followed by the air masses from SSW, mainly due to the strong anthropogenic emissions in the New York metropolitan and Boston metropolitan areas. Figure 1b indicates that the air masses in W and SSW clusters also had the highest average accumulation mode number concentration, consistent with the influence of urban emissions in Pennsylvania and New York metropolitan areas. This trend also agrees with aerosol mass loading measured by the AMS (Zhou et al., 2016).
In contrast, the 25 %–75 % percentiles of CCN concentrations at 0.5 % supersaturation ranged from 1000 to 2500 cm−3 for all clusters, indicating no clear trend with air mass observed for CCN concentration at 0.5 %. These results suggest different CCN spectrum profiles (i.e., the dependence of CCN concentration on supersaturation) for aerosols from different regions.
Particle hygroscopicity is derived from the size-resolved CCN activated fraction following the approach detailed in Mei et al. (2013a, b). In brief, the characteristic critical supersaturation (S∗) of the size-selected CCN is defined as the supersaturation at which the activated fraction reaches 50 % of the maximum activation fraction (E). The value of 1−E represents the number fraction of non-CCN (e.g., particles consisting of non-hygroscopic species only) for the size-selected particles. The median hygroscopicity of the CCN (κCCN) is given by
where represents the molecular weight of water, σw is the surface tension of pure water, ρw is the density of water, R is the gas constant, and T is the absolute temperature. The dispersion of CCN hygroscopicity (Fig. 1f) is defined as , where σ(κ) and are the standard deviation and the average of the CCN hygroscopicity, respectively. The value of reflects the heterogeneity in hygroscopicity and composition of the activated particles. A lower suggests more homogeneous particle composition as in internally mixed aerosols.
The statistics of κCCN for particles ranging from 88 to 192 nm are shown for each of the four air mass clusters in Fig. 1d. While κCCN shows a wide range of values from near zero to 0.5, the 25 %–75 % percentiles of the κCCN values do not exhibit any significant differences among the four clusters and are between ∼0.1 and ∼0.2. The median value of κCCN is ∼0.15 for all four clusters, substantially below 0.3 suggested for continental aerosol (Andreae and Rosenfeld, 2008b). The median E value is ∼87 % for the four clusters, suggesting aerosols observed had a relatively minor contribution from freshly emitted non-hygroscopic particles. The W and NW clusters have the largest and the smallest variabilities in E values (as shown in Fig. 1e), respectively. The E values indicate that aerosols in the long-range transported NW air masses (i.e., LRNW cluster) were not all internal mixtures and included some contribution of freshly emitted non-hygroscopic aerosol particles. Statistically, the SSW aerosols show the lowest hygroscopicity dispersion (Fig. 1f), suggesting that CCN had similar chemical composition and were likely more aged at given sizes. The variety of aerosol sources along the LRNW trajectory paths likely contribute to the relatively large variability of the aerosol hygroscopicity dispersion for the cluster.
3.2 Relationship between κorg and organic oxidation level
The relationship between the hygroscopicity of organic species in the aerosol particles (κorg) and the average oxidation level (i.e., atomic O:C ratio) is examined using the ALC-IOP measurements. On average, aerosols observed during the IOP were neutralized, and BC represented a negligible fraction of the total submicron aerosol volume (1.9 %). It is expected that sea salt had a minor contribution to the submicron aerosol composition for air masses of the four clusters. Here we assume submicron aerosols consisted of ammonium sulfate, ammonium nitrate, and organics. The organic hygroscopicity κorg is therefore derived by subtracting the contribution of the sulfate and nitrate from the CCN hygroscopicity κCCN:
where xi is the volume fraction of species i at the exact particle size of κCCN. Furthermore, κ values are 0.67 and 0.61 for (NH4)2SO4 and NH4NO3, respectively. To increase the signal-to-noise ratio and reduce the uncertainty in derived κorg (Mei et al., 2013b), we average and over periods during which particle composition showed minimal variations and was dominated by organics. The criteria used to identify these periods include average xorg above 60 % and are detailed in Mei et al. (2013b). A total of 47 such periods are identified. During 35 of the 47 periods, air mass showed consistent cluster type, and the periods are denoted as one of four clusters. The size-resolved κorg at particle diameters ranging from 103 to 181 nm is first derived using Eq. (2) for the 35 periods and then averaged for each of the four cluster types. Size-resolved organic O:C ratios at the same diameter range are calculated from AMS measurements. The aerodynamic aerosol size measured by AMS was converted to the aerosol mobility size (Mei et al., 2013a, b). The variation of the average κorg with the corresponding O:C ratio is shown in Fig. 2. The uncertainty of derived κorg is derived following the same approach detailed in Mei et al. (2013b), which is based on error propagation and the uncertainties of the variables in Eq. (2). The uncertainty in derived O:C was estimated as 10 % (Zhou et al., 2016). Figure 2 shows that the average κorg generally increases with the O:C ratio, and the variation follows the trend reported by an earlier laboratory study (Lambe et al., 2011) but with a slightly different offset in the derived κorg. Note that the O:C ratios from Lambe et al. (2011) were scaled by a factor of 1.27 to account for changes in the method of calculating the O:C ratio (Canagaratna et al., 2015). During the ALC-IOP, organic aerosol observed mainly was secondary. Wang et al. (2019) shows that, for SOA, organic hygroscopicity is not limited by water solubility and is mainly controlled by the molecular weight of the organic species. The variation of κorg with O:C can be predicted while the volatility of SOA is known. The variation of cluster average κorg with O:C agreed with those predicted by Wang et al. (2019) for log10C∗ values between −5 to −1, a typical range for ambient SOA. Here C∗ (µg m−3) is the organic volatility.
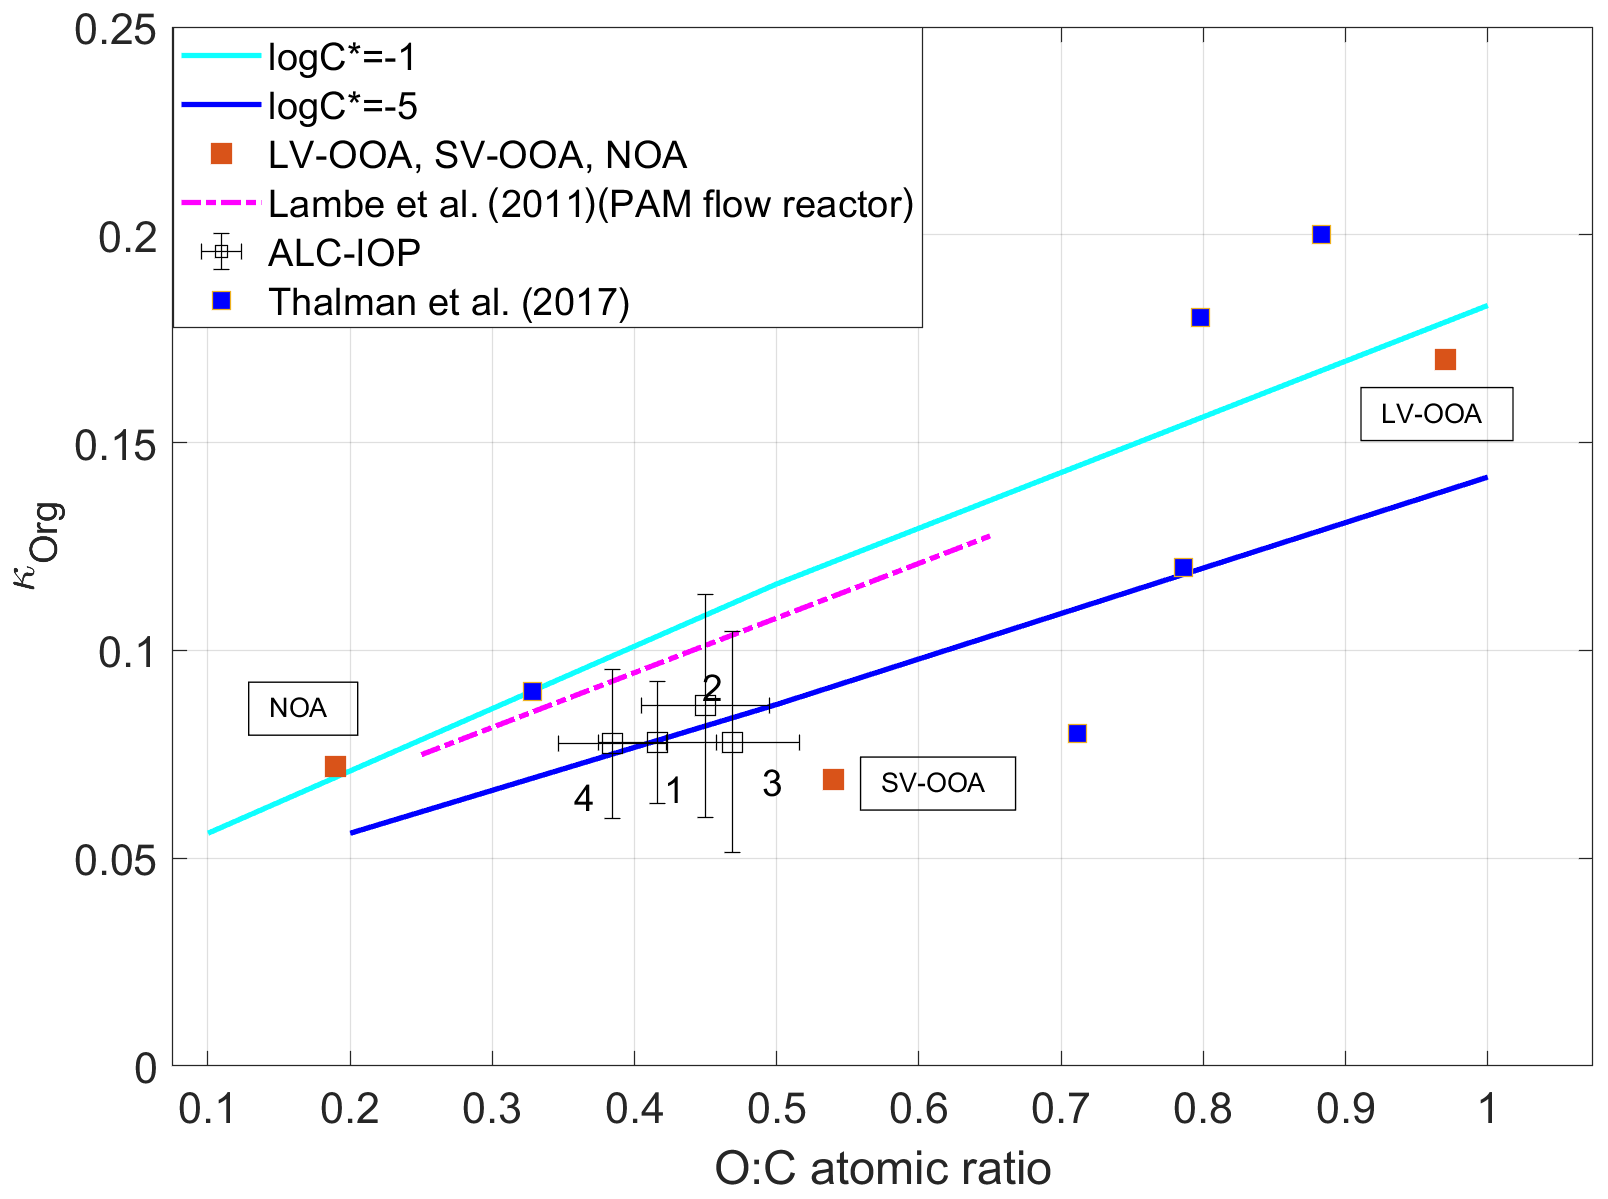
Figure 2Derived κorg as a function of O:C atomic ratio for four clusters, and the κorg values of SOA positive matrix factorization (PMF) factors (LV-OOA, SV-OOA, NOA) derived from measurements during the ALC-IOP. Also shown with the predicted variation for organics with a mean logC∗ equals to −1 and −5, and the κorg values of SOA PMF factors from measurements during GoAmazon 2014/5 (Thalman et al., 2017), and the relationship between κorg and O:C for SOA derived from a laboratory study (Lambe et al., 2011).
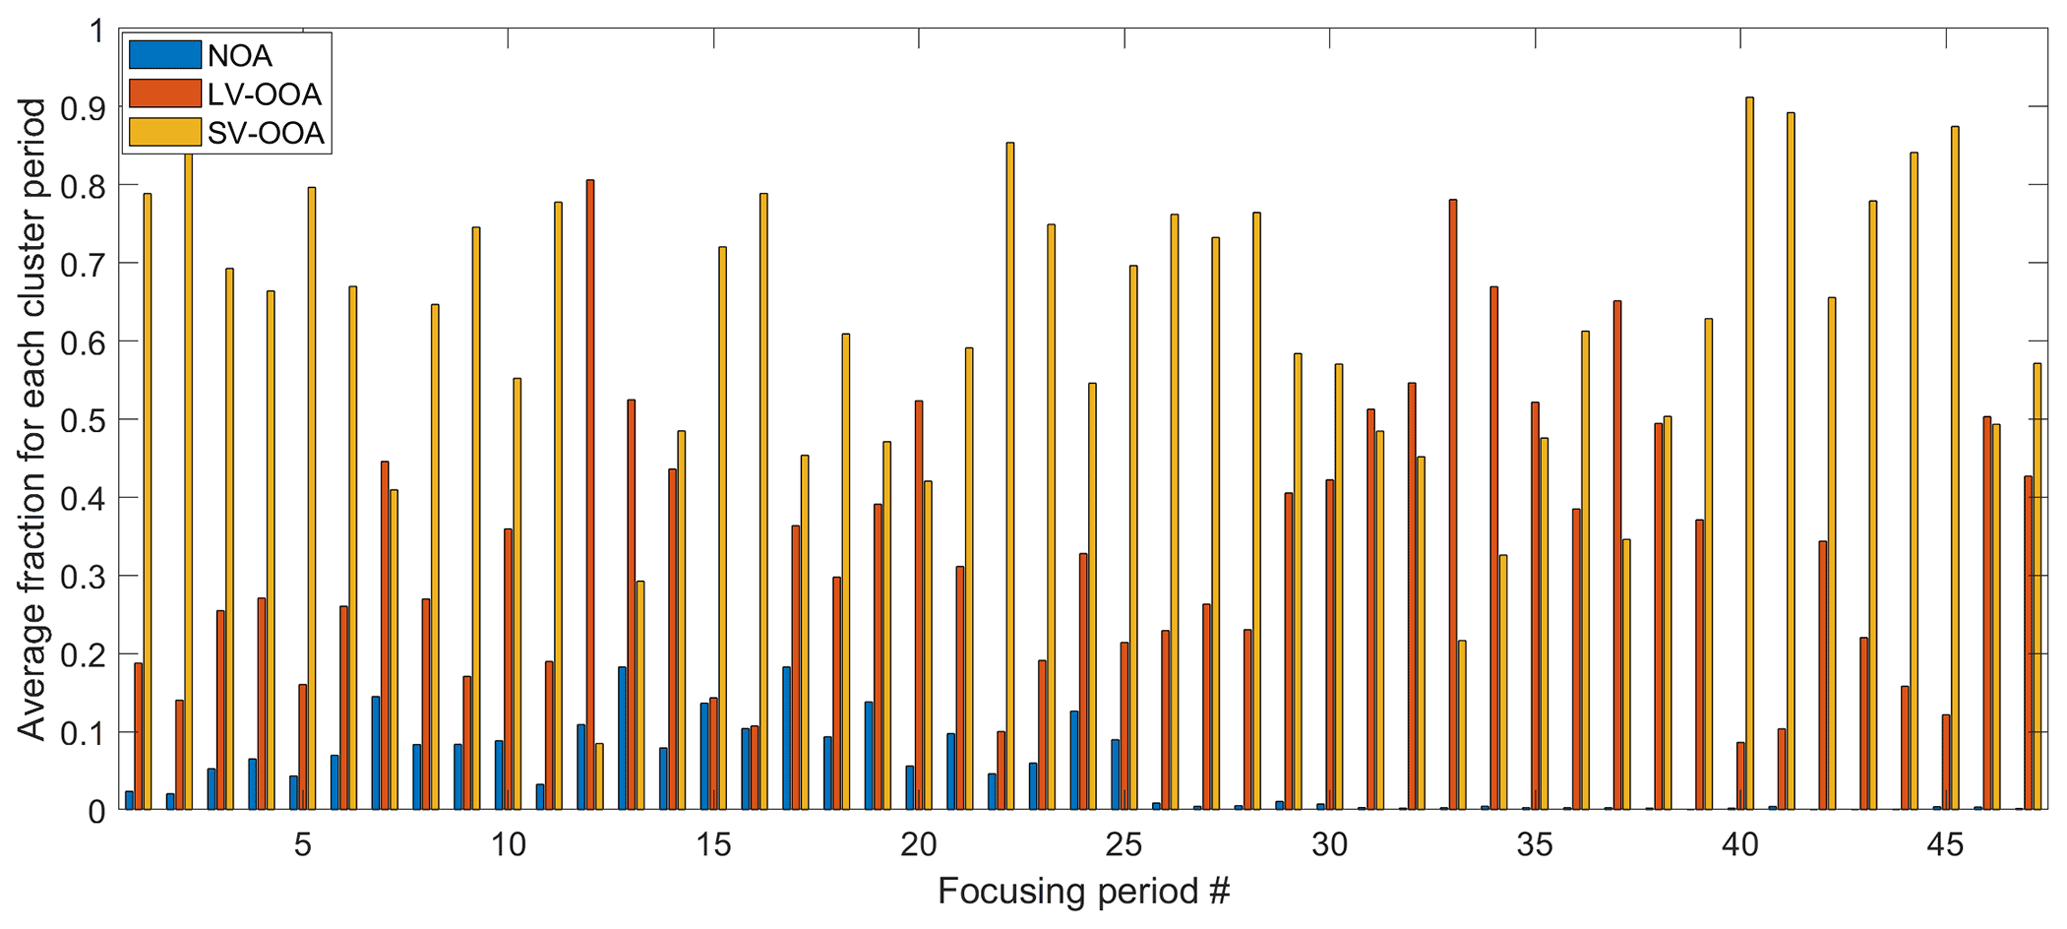
The organic species were classified into three bulk SOA factors based on the PMF analysis, including a fresh semivolatile oxygenated organic aerosol (SV-OOA), which contributed 63 % of OA mass and was strongly influenced by urban plumes transported from the W and SSW regions; a regional and more aged low-volatility oxygenated organic aerosol (LV-OOA), which was influenced by aqueous-phase processing; and a nitrogen-enriched OA (NOA), which likely composed of amine salts formed from acid–base reactions in industrial emissions (Zhou et al., 2016). The mass fractions of the three factors for each of the 47 periods are shown in Fig. 3. Among those periods, 10 and 14 of them were strongly influenced by the air masses from the NW and SSW, respectively. The LRNW air mass cluster dominated eight periods, and the W air mass cluster dominated three periods. The rest of the periods were strongly influenced by air mass from North Atlantic Ocean and are not included in the further analysis in Fig. 2. The first 25 periods are before 2 August 2011, and NOA substantially contributed to the aerosol mass concentration. The fraction of NOA during the remaining periods (after 2 August 2011, from periods 26–47) is less than 2 % and negligible. For the same air mass cluster type, LV-OOA fractions are generally higher during the periods after 2 August 2011, when the site experienced more cloudy conditions and precipitation. The elevated LV-OOA fraction is likely due to a more substantial influence by aqueous-phase processing (Zhou et al., 2016).
The three PMF factors are associated with different emission sources and atmospheric processes (Zhang et al., 2011; Zhou et al., 2016). Hygroscopicities of the three organic factors (κLV−OOA, κSV−OOA, and κNOA) were retrieved using multilinear regression of κorg to the volume fractions of the organic factors (Thalman et al., 2017). This regression is based on the Levenberg–Marquardt algorithm and yields the hygroscopicities for LV-OOA, SV-OOA, and NOA as 0.170, 0.069, and 0.072, respectively. The O:C ratios of LV-OOA, SV-OOA, and NOA calculated using the Improved Ambient (IA) method (Canagaratna et al., 2015) are 0.97, 0.54, and 0.19, respectively. The retrieved κLV−OOA, κSV−OOA, and κNOA show a general increasing trend with increasing O:C ratio (Fig. 2, purple squares), in agreement with those derived from an earlier field study (Thalman et al., 2017) and predicted by Wang et al. (2019). We note κSV−OOA is lower than the model prediction and the SOA hygroscopicity at the same O:C ratio reported by Lambe et al. (2011). One possible explanation is that the SV-OOA was mainly composed of organic compounds formed through oxidation of urban emissions and thus was enriched with oxidized yet relatively hydrophobic hydrocarbons (Zhou et al., 2016). As hydrocarbon-like organic aerosol (HOA) is typically hydrophobic, the inclusion of HOA likely leads to a κSV−OOA value below the predicted and reported SOA hygroscopicity (Lambe et al., 2011; Wang et al., 2019).
3.3 Volatility-resolved hygroscopicity of activated aerosol particles
The bulk volumetric fractions of major species, including sulfate, nitrate, and organics, and the O:C ratio are shown in Fig. 4 as a function of time from 10 to 15 August for ambient aerosol and those processed by the TD at 50, 75, and 100 ∘C. During the week, nitrate had a negligible contribution to aerosol composition (i.e., less than 5 % in volume). Because sulfate is non-volatile at temperatures below 100 ∘C and some semivolatile organics were evaporated inside the TD, ammonium sulfate fraction increases with TD temperature. The variation of organic hygroscopicity with volatility is examined using measurements during four periods. Period 1 is from 11 August, 08:00, to 11 August, 19:10; period 2 is from 11 August 2011, 19:10:00, to 12 August 2011, 08:40:00; period 3 is from 12 August 2011, 08:40, to 13 August 2011, 17:10:00; and period 4 is from 14 August 2011, 06:40:00, to 14 August 2011, 22:32:00. These periods are chosen because of the high organic volume fraction (i.e., greater than 65 %; Mei et al., 2013a, b) and relatively constant particle composition and volatility. Aerosol properties, including particle hygroscopicity and species volume fractions, are averaged for the four periods to minimize the signal-to-noise ratio. The derivation of the particle hygroscopicity parameters κCCN and κorg for each period follows the same approach described in Sect. 3.1 and 3.2, except that species volume fractions (i.e., and ) are based on the bulk measurements due to the operation mode change in the TD period.
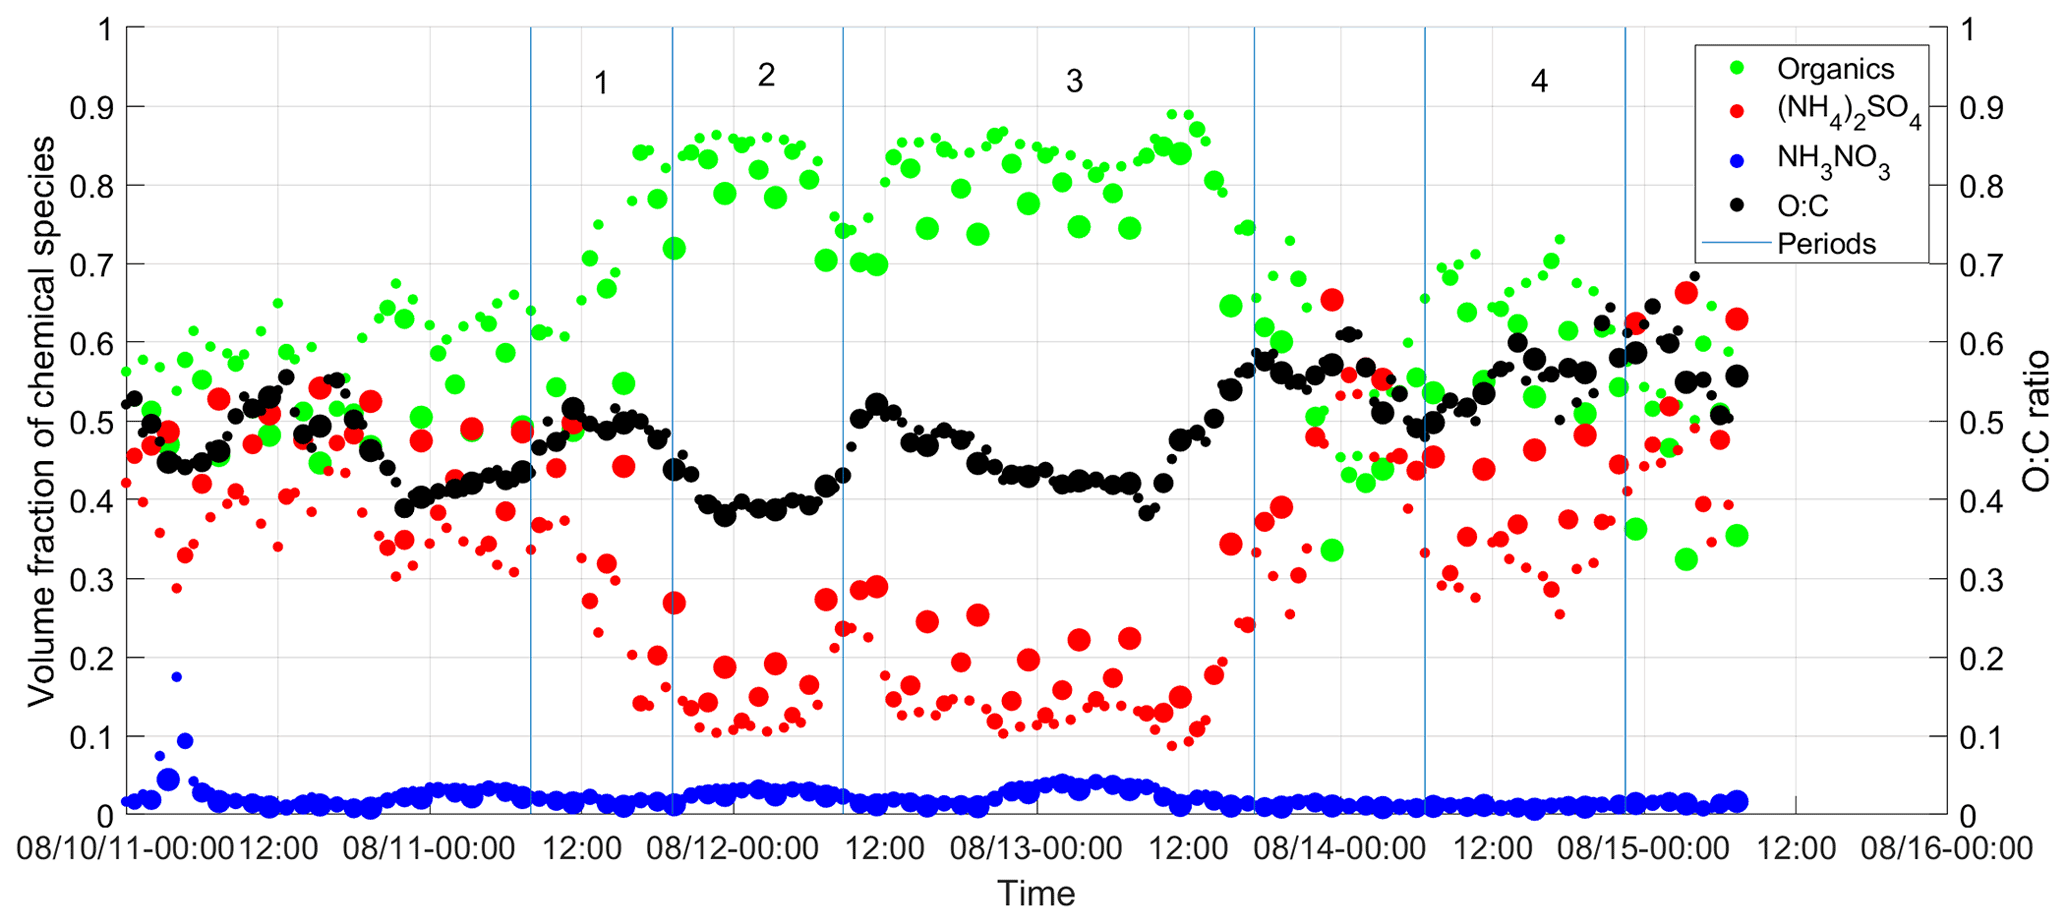
Figure 4Time series of the volume fractions of organics, (NH4)2SO4, and NH4NO3 observed at the BNL site from 10 to 15 August 2012. Note that the increase of the symbol size represents the TD temperature increase from the ambient temperature to 100 ∘C. The green dot represents the organic species. The red dot represents ammonium sulfate. The blue dot represents ammonium nitrate. The black dot represents the O:C ratio. Periods 1, 2, 3 were influenced by the air mass from LRNW, and period 4 was dominated by SSW air mass.
As shown in Fig. 5a, κCCN increases with increasing TD temperature, mainly due to the increased volume fraction of the ammonium sulfate. The TD processed aerosol particles with a higher inorganic fraction (period 1 and 4) exhibited a more significant change of CCN hygroscopicity () compared to the other two periods () with the increase of TD temperature (Fig. 5c). The derived κorg first increases as TD temperature increases from 20 ∘C (i.e., ambient temperature) to 50 or 75 ∘C and then decreases as TD temperature further increases to 100 ∘C. The O:C ratio shows a similar trend except during period 1, when O:C decreased monotonically with TD temperature due to the contribution of NOA. The variations of κorg and O:C with TD temperature setting observed during ALC-IOP are different from previous laboratory experiments and field observations, which reported that organic O:C generally increased with increasing TD temperature (Huffman et al., 2009; Kuwata et al., 2011), whereas κorg decreased monotonically with TD temperature (Asa-Awuku et al., 2009; Cain and Pandis, 2017; King et al., 2009; Kuwata et al., 2011). The heating inside the TD can lead to both evaporation and reaction (e.g., oligomerization) of particle-phase organic species. Whereas oligomerization is not expected to influence O:C appreciably, it leads to lower κorg values due to the increase of molecular weight.
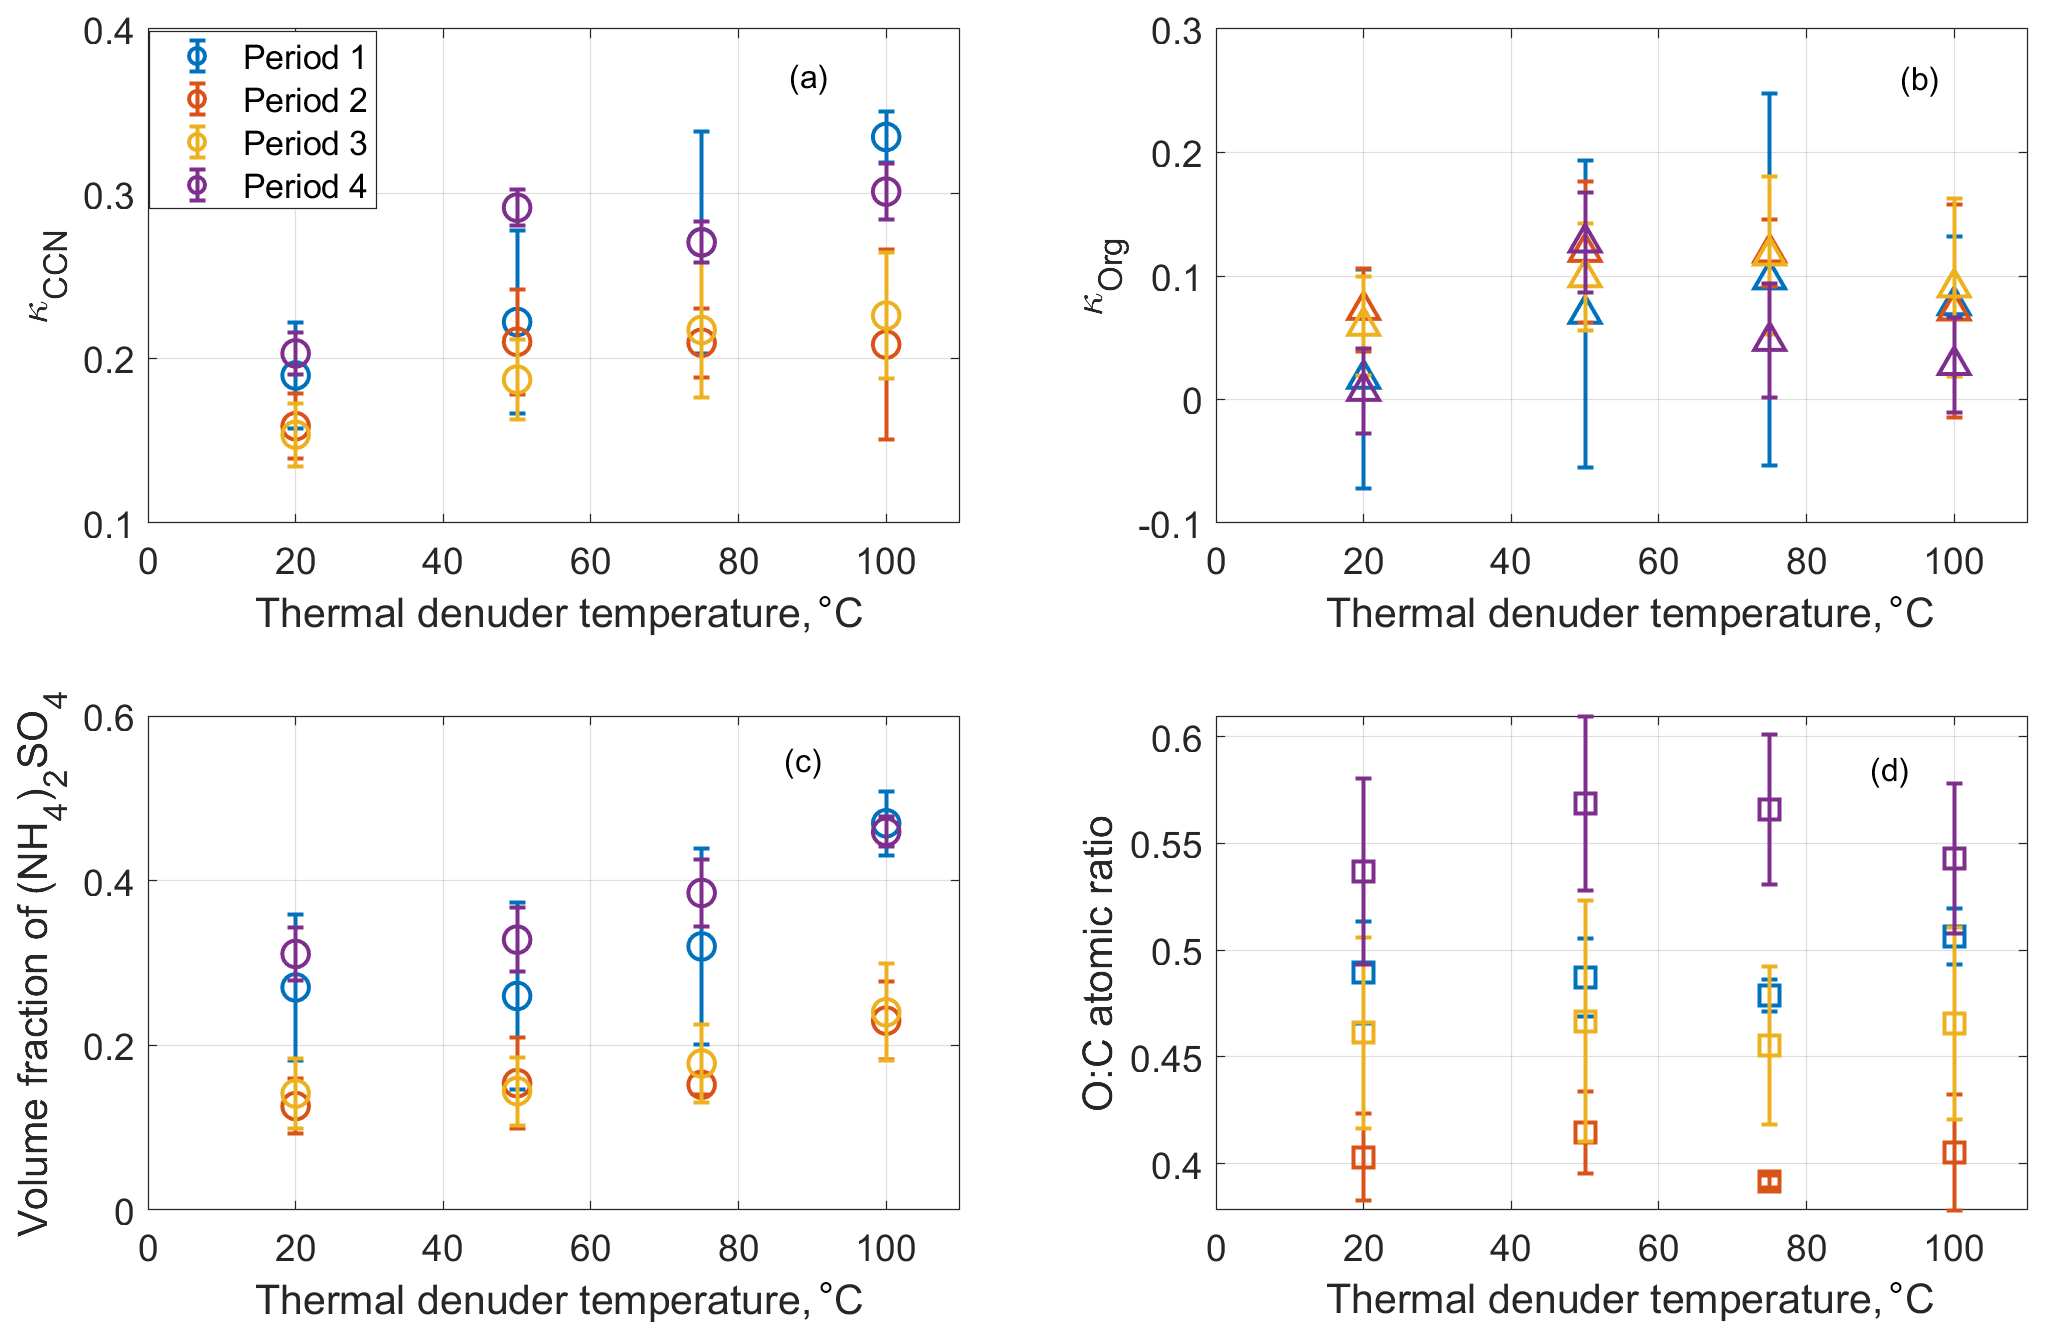
Figure 5Averaged aerosol hygroscopicity(κCCN) (a), the derived κorg (b), the volume fraction of (NH4)2SO4 (c), and O:C ratio (d) as a function of the thermal denuder temperature. The error bar represents the standard deviation of the measurand values during each period.
Therefore, oligomerization likely played a relatively minor role when processed by the TD temperature at 50 ∘C. The initial increases of O:C and κorg at TD temperature below 50 ∘C is likely due to the evaporation of more volatile organics with relatively lower O:C and hygroscopicity, such as primary OA. The evaporation of primary OA can also explain the difference in the dependences of κorg with TD temperature as previous studies were either focused on laboratory-generated SOA (Asa-Awuku et al., 2009; Cain and Pandis, 2017; King et al., 2009; Kuwata et al., 2011) or based on field observations at locations dominated by SOA (Cerully et al., 2015; Saha et al., 2017). The initial increase of O:C and κorg could also be partially due to the evaporation of SOA with lower O:C. As κorg of SOA mainly depends on molecular weight, the simultaneous increases of O:C and κorg would indicate evaporation of more volatile secondary organics with relatively large molecule weight and low O:C. At the upper TD temperature range (i.e., above 50 and 75 ∘C), the decrease of O:C indicates the evaporation of more oxygenated organics. Because the addition of oxygenated functional groups reduces the volatility of organic species, we observed the organics with relatively high O:C ratio evaporated at a high TD temperature in this study. This phenomenon is only expected when the evaporated organics have a smaller molecular weight (i.e., molecule size) compared to those remaining in the particle phase, consistent with the decreasing κorg. While we have no direct evidence, oligomerization at high temperature may also contribute to the decreasing of κorg. The variations of κorg and O:C with TD temperature setting depends on the distributions of oxidation level, molecular size, and volatility of organic species in the particle phase, which can lead to contrasting trends at different temperature ranges. These distributions can vary substantially with aerosol type and sampling location, leading to different trends in the variation of κorg and O:C with the TD temperature setting.
This work focuses on the CCN activity and its variations with organic oxidation level (O:C ratio) and volatility using measurements at the Brookhaven National Laboratory from 15 July to 15 August 2011, during ALC-IOP. Aerosol properties, including aerosol total number concentration, CCN spectrum, and the CCN hygroscopicity, are examined for four air mass clusters, representing different ambient aerosol emission sources, transformation pathways, and atmospheric processes. Aerosols originated from the Pennsylvania metropolitan and New York metropolitan areas contained more CCN active particles than aerosols in LRNW and NW air mass clusters. The 25th–75th percentiles of the CCN hygroscopicity (κCCN) are between ∼0.1 and ∼0.2 and show minor differences among the clusters. The median value of κCCN is ∼0.15 for all four clusters, substantially below 0.3 suggested for continental aerosols. Organic hygroscopicity κorg was derived from κCCN and aerosol chemical composition. The variation of the cluster average κorg with O:C ratio generally follows the trend reported by an earlier laboratory study (Lambe et al., 2011) and those predicted based on organic molecular weight and volatility (Wang et al., 2019). The organic aerosols observed during ALC-IOP were previously classified into three SOA factors using PMF analysis (Zhou et al., 2016). Hygroscopicities of the three factors (κLV−OOA, κSV−OOA, and κNOA) are retrieved using multilinear regression of κorg to the volume fractions of the organic factors (Thalman et al., 2017). The retrieved κLV−OOA, κSV−OOA, and κNOA show a general increasing trend with an increasing O:C ratio, in agreement with those derived from the earlier field study (Thalman et al., 2017) and predicted by Wang et al. (2019). From 10 to 15 August, the CCN activities of both ambient aerosol and those processed by a TD were measured. The derived κorg shows an initial increase as TD temperature increases from 20 ∘C (i.e., ambient temperature) to 50 or 75 ∘C and then decreases as TD temperature further increases to 100 ∘C. The O:C ratio follows a similar trend with the TD temperature setting. The variations of κorg and O:C with TD temperature observed during ALC-IOP are different from previous laboratory experiments, which reported that organic O:C consistently increased with increasing TD temperature (Huffman et al., 2009; Kuwata et al., 2011), whereas κorg decreased with TD temperature (Cain and Pandis, 2017). Field studies, however, observed more complex relationships between O:C and TD temperature, as some reported a monotonous increase of O:C for less volatile OA while others found a lack of correlation between O:C and OA volatility. The initial increases of O:C and κorg at TD temperature below 50 ∘C are likely due to the evaporation of more volatile organics with relatively lower O:C hygroscopicity, such as primary OA. Above ∼50 ∘C, evaporated organics are more oxygenated and have a lower molecular weight (i.e., molecule size) compared to those remaining in the particle phase.
All the raw data are archived by the ARM Data Center (https://iop.archive.arm.gov/arm-iop/2011/isp/alc/dubey-pass3/?ticket=ST-36228-pqUtESm07RiCgSaYrRVam-jpyYUsso, last access: June 2020, Springston et al., 2020) and freely available for the user community. The CCN processed data in the study are available upon reasonable request to Jian Wang (jian@wustl.edu). The other data are available from the ARM data archive: https://www.arm.gov/research/campaigns/osc2011aerosolife (last access: June 2020, Zhang and Xu, 2020).
The supplement related to this article is available online at: https://doi.org/10.5194/acp-21-13019-2021-supplement.
JW and FM designed the research. FM, QZ, JX, and JW carried out the measurements. FM, SZ, SC, JW led the analyses, and FM led the writing, with major input from JW and further input from all other authors.
The authors declare that they have no conflict of interest.
Publisher's note: Copernicus Publications remains neutral with regard to jurisdictional claims in published maps and institutional affiliations.
This study was funded by the US DOE Atmospheric Radiation Measurement (ARM) and the Atmospheric System Research (ASR) program (grant nos. DE-FG02-11ER65293, DE-SC0007178, DE-SC0020259, and DE-SC0021017) and used data from the ARM Climate Research Facility (a DOE Office of Science User Facility). Shan Zhou was partially funded by the Donald G. Crosby Fellowship and the Fumio Matsumura Memorial Fellowship at UC Davis. We acknowledge the US Department of Energy Atmospheric Radiation Measurement program and Brookhaven National Laboratory for logistics support.
This study was funded by the US DOE Atmospheric Radiation Measurement (ARM) and the Atmospheric System Research (ASR) Program (grant nos. DE-FG02-11ER65293, DE-SC0007178, DE-SC0020259, and DE-SC0021017) and used data from the ARM Climate Research Facility (a DOE Office of Science User Facility). Shan Zhou was partially funded by the Donald G. Crosby Fellowship and the Fumio Matsumura Memorial Fellowship at UC Davis.
This paper was edited by Sachin S. Gunthe and reviewed by two anonymous referees.
Albrecht, B. A.: Aerosols, cloud microphysics, and fractional cloudiness, Science, 245, 1227–1230, 1989.
Andreae, M. and Rosenfeld, D. J. E.-S. R.: Aerosol–cloud–precipitation interactions. Part 1. The nature and sources of cloud-active aerosols, J. Earth-Sci. Rev., 89, 13–41, 2008a.
Andreae, M. O. and Rosenfeld, D.: Aerosol-cloud-precipitation interactions. Part 1. The nature and sources of cloud-active aerosols, Earth-Sci. Rev., 89, 13–41, https://doi.org/10.1016/j.earscirev.2008.03.001, 2008b.
Asa-Awuku, A., Engelhart, G. J., Lee, B. H., Pandis, S. N., and Nenes, A.: Relating CCN activity, volatility, and droplet growth kinetics of β-caryophyllene secondary organic aerosol, Atmos. Chem. Phys., 9, 795–812, https://doi.org/10.5194/acp-9-795-2009, 2009.
Cain, K. P. and Pandis, S. N.: A technique for the measurement of organic aerosol hygroscopicity, oxidation level, and volatility distributions, Atmos. Meas. Tech., 10, 4865–4876, https://doi.org/10.5194/amt-10-4865-2017, 2017.
Canagaratna, M. R., Jimenez, J. L., Kroll, J. H., Chen, Q., Kessler, S. H., Massoli, P., Hildebrandt Ruiz, L., Fortner, E., Williams, L. R., Wilson, K. R., Surratt, J. D., Donahue, N. M., Jayne, J. T., and Worsnop, D. R.: Elemental ratio measurements of organic compounds using aerosol mass spectrometry: characterization, improved calibration, and implications, Atmos. Chem. Phys., 15, 253–272, https://doi.org/10.5194/acp-15-253-2015, 2015.
Cerully, K. M., Bougiatioti, A., Hite Jr., J. R., Guo, H., Xu, L., Ng, N. L., Weber, R., and Nenes, A.: On the link between hygroscopicity, volatility, and oxidation state of ambient and water-soluble aerosols in the southeastern United States, Atmos. Chem. Phys., 15, 8679–8694, https://doi.org/10.5194/acp-15-8679-2015, 2015.
Collins, D. R., Flagan, R. C., and Seinfeld, J. H.: Improved inversion of scanning DMA data, Aerosol Sci. Technol., 36, 1–9, 2002.
DeCarlo, P. F., Kimmel, J. R., Trimborn, A., Northway, M. J., Jayne, J. T., Aiken, A. C., Gonin, M., Fuhrer, K., Horvath, T., Docherty, K., Worsnop, D. R., and Jimenez, J. L.: Field-Deployable, High-Resolution, Time-of-Flight Aerosol Mass Spectrometer, Anal. Chem., 78, 8281–8289, 2006.
Duplissy, J., DeCarlo, P. F., Dommen, J., Alfarra, M. R., Metzger, A., Barmpadimos, I., Prevot, A. S. H., Weingartner, E., Tritscher, T., Gysel, M., Aiken, A. C., Jimenez, J. L., Canagaratna, M. R., Worsnop, D. R., Collins, D. R., Tomlinson, J., and Baltensperger, U.: Relating hygroscopicity and composition of organic aerosol particulate matter, Atmos. Chem. Phys., 11, 1155–1165, https://doi.org/10.5194/acp-11-1155-2011, 2011.
Dusek, U., Frank, G., Hildebrandt, L., Curtius, J., Schneider, J., Walter, S., Chand, D., Drewnick, F., Hings, S., and Jung, D. J. S.: Size matters more than chemistry for cloud-nucleating ability of aerosol particles, J. Science, 312, 1375–1378, 2006.
Fierz, M., Vernooij, M. G. C., and Burtscher, H.: An improved low-flow thermodenuder, J. Aerosol Sci., 38, 1163–1168, https://doi.org/10.1016/j.jaerosci.2007.08.006, 2007.
Huffman, J., Docherty, K., Mohr, C., Cubison, M., Ulbrich, I., Ziemann, P., Onasch, T., and Jimenez, J.: Chemically-resolved volatility measurements of organic aerosol from different sources, Environ. Sci. Technol., 43, 5351–5357, 2009.
King, S. M., Rosenoern, T., Shilling, J. E., Chen, Q., and Martin, S. T.: Increased cloud activation potential of secondary organic aerosol for atmospheric mass loadings, Atmos. Chem. Phys., 9, 2959–2971, https://doi.org/10.5194/acp-9-2959-2009, 2009.
Kuwata, M., Chen, Q., and Martin, S. T.: Cloud condensation nuclei (CCN) activity and oxygen-to-carbon elemental ratios following thermodenuder treatment of organic particles grown by alpha-pinene ozonolysis, Phys. Chem. Chem. Phys., 13, 14571–14583, https://doi.org/10.1039/c1cp20253g, 2011.
Kuwata, M., Shao, W., Lebouteiller, R., and Martin, S. T.: Classifying organic materials by oxygen-to-carbon elemental ratio to predict the activation regime of Cloud Condensation Nuclei (CCN), Atmos. Chem. Phys., 13, 5309–5324, https://doi.org/10.5194/acp-13-5309-2013, 2013.
Lambe, A. T., Onasch, T. B., Massoli, P., Croasdale, D. R., Wright, J. P., Ahern, A. T., Williams, L. R., Worsnop, D. R., Brune, W. H., and Davidovits, P.: Laboratory studies of the chemical composition and cloud condensation nuclei (CCN) activity of secondary organic aerosol (SOA) and oxidized primary organic aerosol (OPOA), Atmos. Chem. Phys., 11, 8913–8928, https://doi.org/10.5194/acp-11-8913-2011, 2011.
Lance, S., Medina, J., Smith, J. N., and Nenes, A.: Mapping the operation of the DMT Continuous Flow CCN counter, Aerosol Sci. Technol., 40, 242–254, 2006.
Lance, S., Raatikainen, T., Onasch, T. B., Worsnop, D. R., Yu, X.-Y., Alexander, M. L., Stolzenburg, M. R., McMurry, P. H., Smith, J. N., and Nenes, A.: Aerosol mixing state, hygroscopic growth and cloud activation efficiency during MIRAGE 2006, Atmos. Chem. Phys., 13, 5049–5062, https://doi.org/10.5194/acp-13-5049-2013, 2013.
Lathem, T. L., Beyersdorf, A. J., Thornhill, K. L., Winstead, E. L., Cubison, M. J., Hecobian, A., Jimenez, J. L., Weber, R. J., Anderson, B. E., and Nenes, A.: Analysis of CCN activity of Arctic aerosol and Canadian biomass burning during summer 2008, Atmos. Chem. Phys., 13, 2735–2756, https://doi.org/10.5194/acp-13-2735-2013, 2013.
Liu, X. H. and Wang, J. A.: How important is organic aerosol hygroscopicity to aerosol indirect forcing?, Environ. Res. Lett., 5, 044010, https://doi.org/10.1088/1748-9326/5/4/044010, 2010.
Massoli, P., Lambe, A. T., Ahern, A. T., Williams, L. R., Ehn, M., Mikkila, J., Canagaratna, M. R., Brune, W. H., Onasch, T. B., Jayne, J. T., Petaja, T., Kulmala, M., Laaksonen, A., Kolb, C. E., Davidovits, P., and Worsnop, D. R.: Relationship between aerosol oxidation level and hygroscopic properties of laboratory generated secondary organic aerosol (SOA) particles, Geophys. Res. Lett., 37, L24801, https://doi.org/10.1029/2010GL045258, 2010.
McFiggans, G., Artaxo, P., Baltensperger, U., Coe, H., Facchini, M. C., Feingold, G., Fuzzi, S., Gysel, M., Laaksonen, A., Lohmann, U., Mentel, T. F., Murphy, D. M., O'Dowd, C. D., Snider, J. R., and Weingartner, E.: The effect of physical and chemical aerosol properties on warm cloud droplet activation, Atmos. Chem. Phys., 6, 2593–2649, https://doi.org/10.5194/acp-6-2593-2006, 2006.
Mei, F., Hayes, P. L., Ortega, A. M., Taylor, J. W., Allan, J. D., Gilman, J. B., Kuster, W. C., de Gouw, J. A., Jimenez, J. L., and Wang, J.: Droplet activation properties of organic aerosols observed at an urban site during CalNex-LA, J. Geophys. Res., 118, 2903–2917, https://doi.org/10.1002/jgrd.50285, 2013a.
Mei, F., Setyan, A., Zhang, Q., and Wang, J.: CCN activity of organic aerosols observed downwind of urban emissions during CARES, Atmos. Chem. Phys., 13, 12155–12169, https://doi.org/10.5194/acp-13-12155-2013, 2013b.
Moore, R. H., Cerully, K., Bahreini, R., Brock, C. A., Middlebrook, A. M., and Nenes, A.: Hygroscopicity and composition of California CCN during summer 2010, J. Geophys. Res., 117, D00V12, https://doi.org/10.1029/2011JD017352, 2012.
Ovadnevaite, J., Zuend, A., Laaksonen, A., Sanchez, K. J., Roberts, G., Ceburnis, D., Decesari, S., Rinaldi, M., Hodas, N., Facchini, M. C., Seinfeld, J. H., and O'Dowd, C.: Surface tension prevails over solute effect in organic-influenced cloud droplet activation, Nature, 546, 637–641, https://doi.org/10.1038/nature22806, 2017.
Pachauri, R. K., Allen, M. R., Barros, V. R., Broome, J., Cramer, W., Christ, R., Church, J. A., Clarke, L., Dahe, Q., Dasgupta, P., Dubash, N. K., Edenhofer, O., Elgizouli, I., Field, C. B., Forster, P., Friedlingstein, P., Fuglestvedt, J., Gomez-Echeverri, L., Hallegatte, S., Hegerl, G., Howden, M., Jiang, K., Jimenez Cisneroz, B., Kattsov, V., Lee, H., Mach, K. J., Marotzke, J., Mastrandrea, M. D., Meyer, L., Minx, J., Mulugetta, Y., O'Brien, K., Oppenheimer, M., Pereira, J. J., Pichs-Madruga, R., Plattner, G. K., Pörtner, H. O., Power, S. B., Preston, B., Ravindranath, N. H., Reisinger, A., Riahi, K., Rusticucci, M., Scholes, R., Seyboth, K., Sokona, Y., Stavins, R., Stocker, T. F., Tschakert, P., van Vuuren, D., and van Ypserle, J. P.: Climate Change 2014: Synthesis Report. Contribution of Working Groups I, II and III to the Fifth Assessment Report of the Intergovernmental Panel on Climate Change, edited by: Pachauri, R. and Meyer, L., Geneva, Switzerland, IPCC, 151 pp., ISBN 978-92-9169-143-2, 2014.
Petters, M. D. and Kreidenweis, S. M.: A single parameter representation of hygroscopic growth and cloud condensation nucleus activity, Atmos. Chem. Phys., 7, 1961–1971, https://doi.org/10.5194/acp-7-1961-2007, 2007.
Petters, M. D., Kreidenweis, S. M., Prenni, A. J., Sullivan, R. C., Carrico, C. M., Koehler, K. A., and Ziemann, P. J.: Role of molecular size in cloud droplet activation, Geophys. Res. Lett., 36, L22801, https://doi.org/10.1029/2009gl040131, 2009.
Roberts, G. C. and Nenes, A.: A continuous-flow streamwise thermal-gradient CCN chamber for atmospheric measurements, Aerosol Sci. Technol., 39, 206–221, 2005.
Rose, D., Gunthe, S. S., Mikhailov, E., Frank, G. P., Dusek, U., Andreae, M. O., and Pöschl, U.: Calibration and measurement uncertainties of a continuous-flow cloud condensation nuclei counter (DMT-CCNC): CCN activation of ammonium sulfate and sodium chloride aerosol particles in theory and experiment, Atmos. Chem. Phys., 8, 1153–1179, https://doi.org/10.5194/acp-8-1153-2008, 2008.
Rosenfeld, D., Sherwood, S., Wood, R., and Donner, L.: Climate effects of aerosol-cloud interactions, Science, 343, 379–380, 2014.
Saha, P. K., Khlystov, A., Yahya, K., Zhang, Y., Xu, L., Ng, N. L., and Grieshop, A. P.: Quantifying the volatility of organic aerosol in the southeastern US, Atmos. Chem. Phys., 17, 501–520, https://doi.org/10.5194/acp-17-501-2017, 2017.
Setyan, A., Zhang, Q., Merkel, M., Knighton, W. B., Sun, Y., Song, C., Shilling, J. E., Onasch, T. B., Herndon, S. C., Worsnop, D. R., Fast, J. D., Zaveri, R. A., Berg, L. K., Wiedensohler, A., Flowers, B. A., Dubey, M. K., and Subramanian, R.: Characterization of submicron particles influenced by mixed biogenic and anthropogenic emissions using high-resolution aerosol mass spectrometry: results from CARES, Atmos. Chem. Phys., 12, 8131–8156, https://doi.org/10.5194/acp-12-8131-2012, 2012.
Springston, S., Sedlacek, A., Lee, Y.-N., Lee, S., Mei, F., Zhang, Q., Wang, J., Kuang, C., Jensen, M., Hallar, G., Gregory, L., and Dubey, M.: 2011 Aerosol Life Cycle IOP data, available at: https://iop.archive.arm.gov/arm-iop/2011/isp/alc/dubey-pass3/?ticket=ST-36228-pqUtESm07RiCgSaYrRVam-jpyYUsso, last access: June 2020.
Thalman, R., de Sá, S. S., Palm, B. B., Barbosa, H. M. J., Pöhlker, M. L., Alexander, M. L., Brito, J., Carbone, S., Castillo, P., Day, D. A., Kuang, C., Manzi, A., Ng, N. L., Sedlacek III, A. J., Souza, R., Springston, S., Watson, T., Pöhlker, C., Pöschl, U., Andreae, M. O., Artaxo, P., Jimenez, J. L., Martin, S. T., and Wang, J.: CCN activity and organic hygroscopicity of aerosols downwind of an urban region in central Amazonia: seasonal and diel variations and impact of anthropogenic emissions, Atmos. Chem. Phys., 17, 11779–11801, https://doi.org/10.5194/acp-17-11779-2017, 2017.
Twomey, S.: Influence of Pollution on Shortwave Albedo of Clouds, J. Atmos. Sci., 34, 1149–1152, 1977.
Wang, J., Lee, Y.-N., Daum, P. H., Jayne, J., and Alexander, M. L.: Effects of aerosol organics on cloud condensation nucleus (CCN) concentration and first indirect aerosol effect, Atmos. Chem. Phys., 8, 6325–6339, https://doi.org/10.5194/acp-8-6325-2008, 2008.
Wang, J., Cubison, M. J., Aiken, A. C., Jimenez, J. L., and Collins, D. R.: The importance of aerosol mixing state and size-resolved composition on CCN concentration and the variation of the importance with atmospheric aging of aerosols, Atmos. Chem. Phys., 10, 7267–7283, https://doi.org/10.5194/acp-10-7267-2010, 2010.
Wang, J., Shilling, J. E., Liu, J., Zelenyuk, A., Bell, D. M., Petters, M. D., Thalman, R., Mei, F., Zaveri, R. A., and Zheng, G.: Cloud droplet activation of secondary organic aerosol is mainly controlled by molecular weight, not water solubility, Atmos. Chem. Phys., 19, 941–954, https://doi.org/10.5194/acp-19-941-2019, 2019.
Wang, S. C. and Flagan, R. C.: Scanning Electrical Mobility Spectrometer, Aerosol Sci. Technol., 13, 230–240, 1990.
Zhang, Q. and Xu, J.: Aerodyne HR-Tof_AMS data, available at: https://iop.archive.arm.gov/arm-iop/2011/isp/alc/zhang-ams/?ticket=ST-36227-CifU9meHS0UYpy4UAEI6bxCAbMgsso, last access: June 2020.
Zhang, Q., Jimenez, J. L., Canagaratna, M. R., Allan, J. D., Coe, H., Ulbrich, I., Alfarra, M. R., Takami, A., Middlebrook, A. M., Sun, Y. L., Dzepina, K., Dunlea, E., Docherty, K., DeCarlo, P. F., Salcedo, D., Onasch, T., Jayne, J. T., Miyoshi, T., Shimono, A., Hatakeyama, S., Takegawa, N., Kondo, Y., Schneider, J., Drewnick, F., Borrmann, S., Weimer, S., Demerjian, K., Williams, P., Bower, K., Bahreini, R., Cottrell, L., Griffin, R. J., Rautiainen, J., Sun, J. Y., Zhang, Y. M., and Worsnop, D. R.: Ubiquity and dominance of oxygenated species in organic aerosols in anthropogenically-influenced Northern Hemisphere midlatitudes, Geophys. Res. Lett., 34, L13801, https://doi.org/10.1029/2007GL029979, 2007.
Zhang, Q., Jimenez, J. L., Canagaratna, M. R., Ulbrich, I. M., Ng, N. L., Worsnop, D. R., and Sun, Y.: Understanding atmospheric organic aerosols via factor analysis of aerosol mass spectrometry: a review, J. Analytical Bioanalytical Chemistry, 401, 3045–3067, 2011.
Zhou, S., Collier, S., Xu, J., Mei, F., Wang, J., Lee, Y. N., Sedlacek III, A. J., Springston, S. R., Sun, Y., and Zhang, Q.: Influences of upwind emission sources and atmospheric processing on aerosol chemistry and properties at a rural location in the Northeastern US, J. Geophys. Res.-Atmos., 121, 6049–6065, 2016.