the Creative Commons Attribution 4.0 License.
the Creative Commons Attribution 4.0 License.
 | 31 Aug 2021
Technical note: Evaluation of profile retrievals of aerosols and trace gases for MAX-DOAS measurements under different aerosol scenarios based on radiative transfer simulations
Steffen Beirle
Pinhua Xie
Thomas Wagner
Jin Xu
Ang Li
Steffen Dörner
Bo Ren
Xiaomei Li
Ground-based Multi-AXis Differential Optical Absorption Spectroscopy (MAX-DOAS) is a state-of-the-art remote sensing technique for deriving vertical profiles of trace gases and aerosols. However, MAX-DOAS profile inversions under aerosol pollution scenarios are challenging because of the complex radiative transfer and limited information content of the measurements. In this study, the performances of two inversion algorithms were evaluated for various aerosol pollution scenarios based on synthetic slant column densities (SCDs) derived from radiative transfer simulations. Compared to previous studies, in our study, much larger ranges of aerosol optical depth (AOD) and NO2 vertical column densities (VCDs) are covered. One inversion algorithm is based on optimal estimation; the other uses a parameterized approach. In this analysis, three types of profile shapes for aerosols and NO2 were considered: exponential, Boltzmann, and Gaussian. First, the systematic deviations of the retrieved aerosol profiles from the input profiles were investigated. For most cases, the AODs of the retrieved profiles were found to be systematically lower than the input values, and the deviations increased with increasing AOD. In particular for the optimal estimation algorithm and for high AOD, these findings are consistent with the results in previous studies. The assumed single scattering albedo (SSA) and asymmetry parameter (AP) have a systematic influence on the aerosol retrieval. However, for most cases the influence of the assumed SSA and AP on the retrieval results are rather small (compared to other uncertainties). For the optimal estimation algorithm, the agreement with the input values can be improved by optimizing the covariance matrix of the a priori uncertainties. Second, the aerosol effects on the NO2 profile retrieval were tested. Here, especially for the optimal estimation algorithm, a systematic dependence on the NO2 VCD was found, with a strong relative overestimation of the retrieved results for low NO2 VCDs and an underestimation for high NO2 VCDs. In contrast, the dependence on the aerosol profiles was found to be rather low. Interestingly, the results for both investigated wavelengths (360 and 477 nm) were found to be rather similar, indicating that the differences in the radiative transfer between both wavelengths have no strong effect. In general, both inversion schemes can retrieve the near-surface values of aerosol extinction and trace gas concentrations well.
- Article
(9390 KB) - Full-text XML
-
Supplement
(7472 KB) - BibTeX
- EndNote


In recent years, several large-scale aerosol pollution incidents in China (Hu et al., 2014; Huang et al., 2014; Wang et al., 2014; Zhang and Cuo, 2015) have drawn increasing attention due to their effects on atmospheric visibility and health. Atmospheric aerosols also exert direct and indirect effects on global climate change and radiative balance (Seinfeld and Pandis, 1998; IPCC, 2007). The physical and chemical properties and the spatial–temporal distributions of aerosols can both affect remote sensing measurements of trace gases in the atmosphere (Seinfeld and Pandis, 1998; Quinn et al., 1998; Bond et al., 2001; Sheridan et al., 2001). Measuring the optical properties of aerosols, understanding the role of aerosols in atmospheric processes, and assessing the effects of aerosols on remote sensing observations of trace gases are important goals in the study of atmospheric pollution.
The ground-based Multi-AXis Differential Optical Absorption Spectroscopy (MAX-DOAS) technique can be performed with a relatively simple setup and very low power consumption in the ultraviolet (UV) and visible (Vis) spectral range to synchronously measure the vertical distributions of aerosol optical extinction and concentrations of several trace gases (e.g., NO2, SO2, HCHO, HONO, and CHOCHO) in the troposphere (Hönninger and Platt, 2002; Hönninger et al., 2004; Wittrock et al., 2004; Wagner et al., 2004; Frieß et al., 2006). Spectra of scattered sunlight are measured at different elevation angles (EAs) by the MAX-DOAS instrument. The spectra are analyzed by the DOAS technique (Platt and Stutz, 2008), which makes use of the characteristic “fingerprint” absorptions of the different trace gases with respect to a reference spectrum taken for zenith. The results of the spectral fitting process are the so-called differential slant column densities (DSCDs) of the trace gases and the oxygen collision complex (O2–O2 or O4), with the DSCD defined as the difference between the trace gas concentration integrated along the effective light path and the corresponding integrated trace gas concentration in the zenith sky reference spectrum. The MAX-DOAS technique basically utilizes the EA dependence of differential absorption structures of O4 to derive the vertical distribution of the aerosol extinction (Wagner et al., 2004; Frieß et al., 2006). The vertical profiles and vertical column densities (VCDs) of trace gases can be retrieved from the EA dependence of DSCDs using also the result of the aerosol profile inversion from MAX-DOAS (Irie et al., 2008a, 2009; Li et al., 2010; Clémer et al., 2010; Hartl and Wenig, 2013; Hendrick et al., 2014; Vlemmix et al., 2015; Frieß et al., 2006).
Recent research on MAX-DOAS has focused on the following aspects: (1) profile inversion algorithms (Hönninger and Platt, 2002; Wagner et al., 2004; Frieß et al., 2006, 2011; Clémer et al., 2010; Hay, 2010; Vlemmix et al., 2011; Yilmaz, 2012; Hartl and Wenig, 2013; Holla, 2013; Wang et al., 2013a, b; Zielcke, 2015; Bösch et al., 2018; Beirle et al., 2019; Friedrich et al., 2019; Frieß et al., 2019); (2) long-term observation of trace gases and aerosols (e.g., Irie et al., 2008a; Roscoe et al., 2010; Li et al., 2013; Ma et al., 2013; Pinardi et al., 2013; Hendrick et al., 2014; Kanaya et al., 2014; Wang et al., 2014; Chan et al., 2015; Tian et al., 2018, 2019; Wang et al., 2017a); (3) cloud identification and data correction (Gielen et al., 2014; Wagner et al., 2014, 2016; Wang et al., 2014); and (4) satellite and model data validation (e.g., Halla et al., 2011; Ma et al., 2013; Pinardi et al., 2013; Chan et al., 2015; De Smedt et al., 2015; Vlemmix et al., 2015; Jin et al., 2016; Drosoglou et al., 2017; Wang et al., 2017b; Boersma et al., 2018; Liu et al., 2018). In this study, we focus on the first aspect. At present, algorithms for the retrieval of vertical profiles from MAX-DOAS measurements can be separated into optimal estimation methods (OEMs) (Rodgers, 2000) and parameterized algorithms, which describe the shapes of atmospheric profiles with a limited set (usually two to three) of parameters. In Frieß et al. (2019), different MAX-DOAS inversion schemes have been compared for synthetic input data for aerosol optical depths (AODs) of up to 1 (plus a fog and two cloud scenarios). Given the importance and complexity of the aerosol effects on the atmospheric radiative transfer, it is also important to study the impact of heavy aerosol loads on the MAX-DOAS inversion algorithm.
Here, we compare the aerosol and trace gas profiles retrieved from MAX-DOAS by two inversion algorithms (PriAM and MAPA; for details see below) with the input values (used as input for the DSCD simulations) for different aerosol scenarios. We also investigate the effects of the aerosol extinction and optical properties, including single scattering albedo (SSA) and the asymmetry parameter (AP), on the aerosols profiles retrieved by PriAM in the UV and Vis.
This paper is organized as follows. Section 2 briefly describes the basic settings for the aerosol and NO2 profile inversions and for the tests of the profile comparisons. The analysis strategy of this study is presented in Sect. 2.1. The model scenarios and radiative transfer model (RTM) settings are specified in Sect. 2.2. The two profile retrieval algorithms (PriAM and MAPA v. 0.98) are described in Sect. 2.3. The effects of aerosols on the profile retrievals are discussed in Sect. 3.
2.1 Analysis strategy
The analysis strategy of this study is depicted in Fig. 1. A set of atmospheric scenario variations of (orange box on the left side), including the viewing geometries, single scattering albedos, and asymmetry parameters, was used to simulate the SCDs of traces gases and O4, which will be described in detail in Sect. 2.2. The first step was to quantitatively evaluate the effect of different aerosol loads on the aerosol inversion (the upper part of Fig. 1). For that purpose the simulated O4 DSCDs were used as input for the aerosol profile retrievals. The retrieved and input aerosol profiles were then compared in order to characterize the effect of the aerosol properties (in particular the AODs) on the retrieved aerosol profiles. The second step was to quantitatively evaluate the effect of different aerosol loads on the trace gas inversion (the bottom half of Fig. 1). For the trace gas retrievals, we apply two retrieval strategies where either the retrieved (S1, red box in the lower half of Fig. 1) or the input (S2, red box in the lower half of Fig. 1) aerosol profile is used.
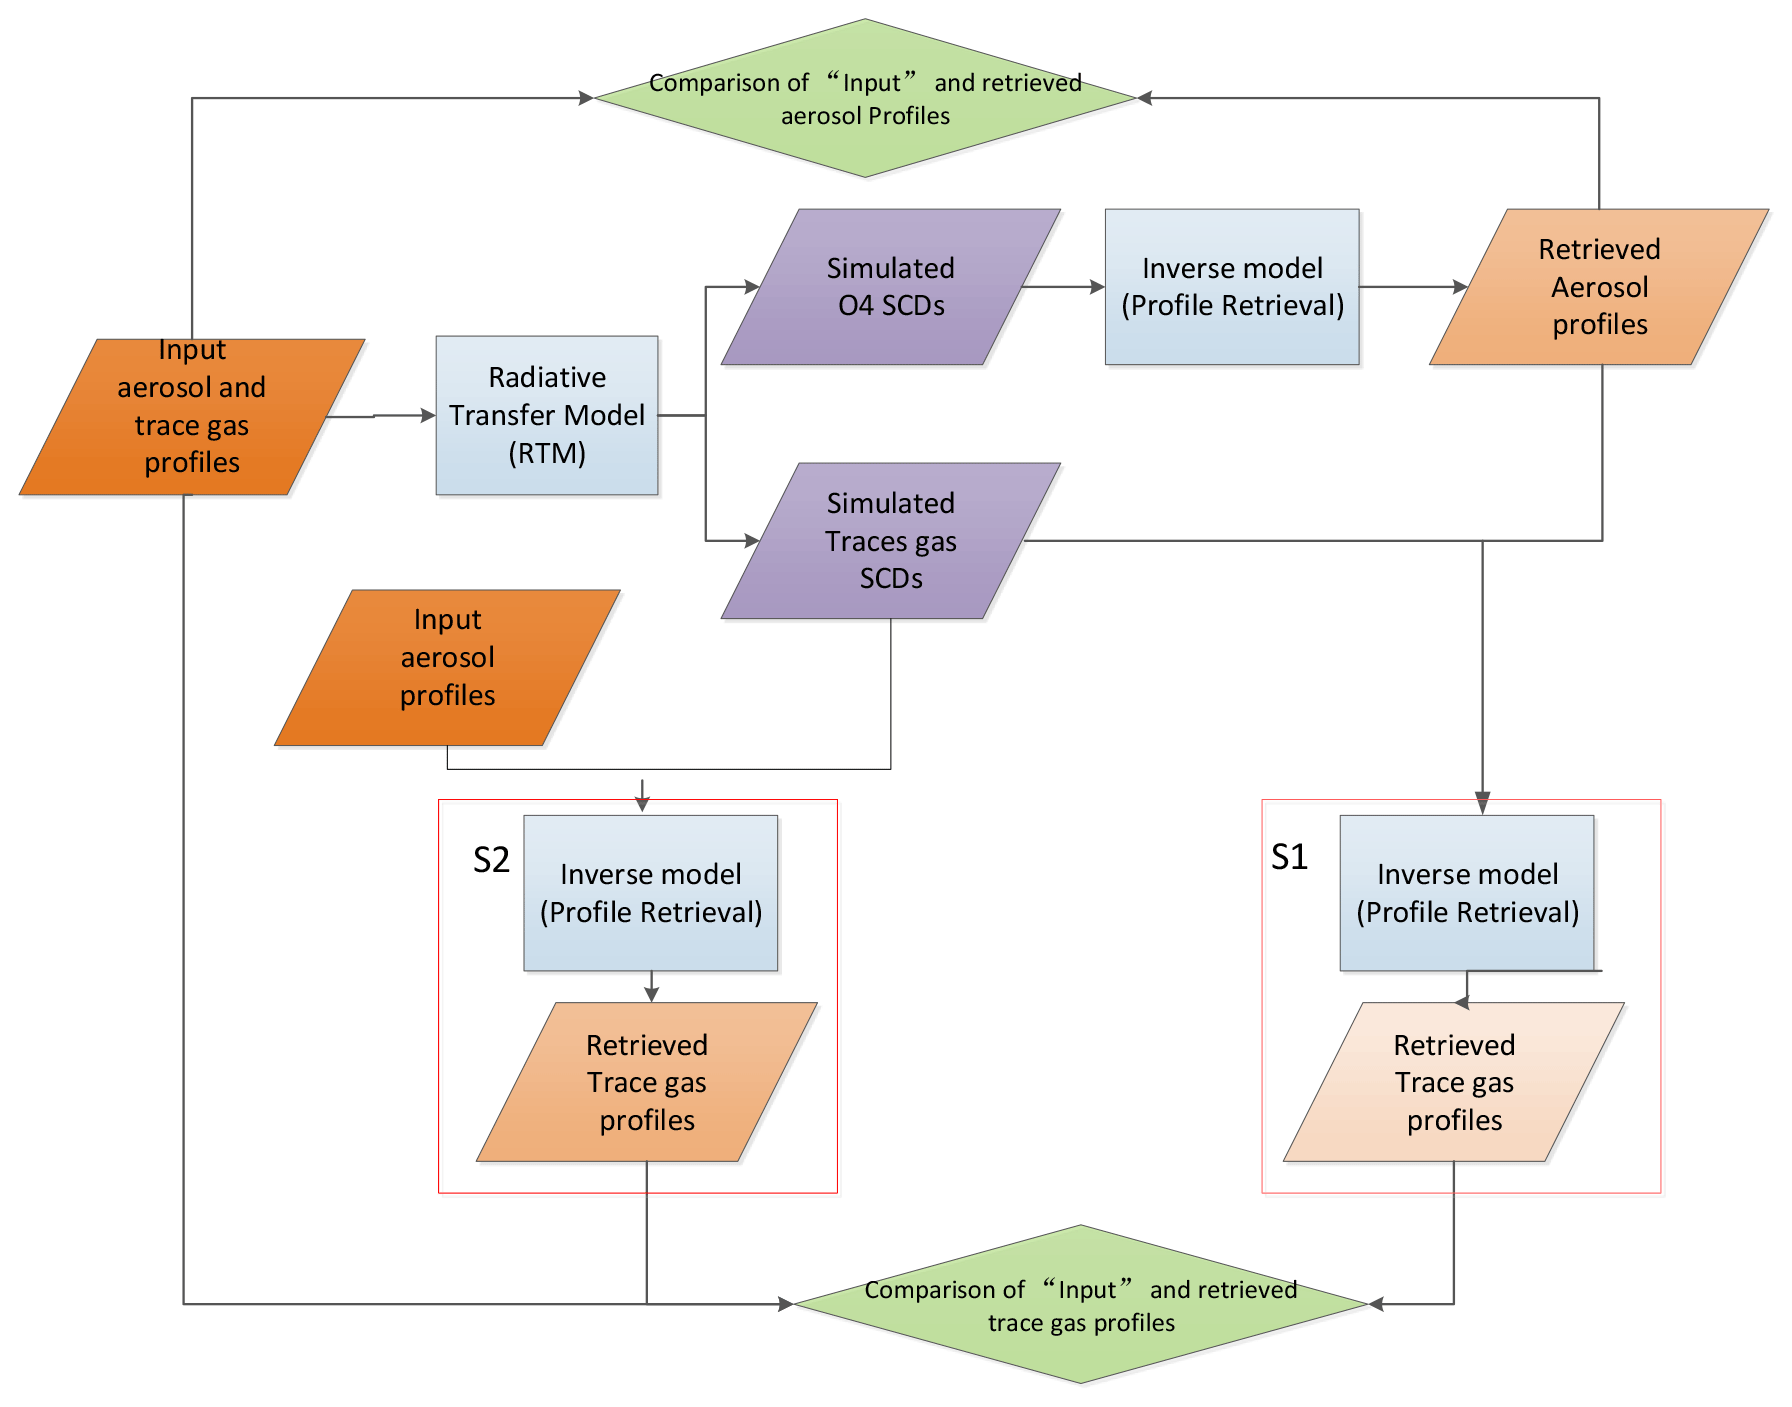
Figure 1Flow diagram depicting the strategy used for the analysis of the effects of high aerosol loads on the retrieval of aerosol and trace gas profiles.
2.2 RTM parameters
Before the effects of different aerosol loads on the retrieval of aerosol and trace gas profiles were analyzed, some basic parameters were prescribed for simulating the O4 and trace gas SCDs for the “assumed input profiles” in the RTM. In this study, the SCIAMACHY radiative transfer model (SCIATRAN) (version 2.2; Rozanov et al., 2005) is used in the forward model calculations. Here it is important to note that while SCIATRAN is also used in PriAM, in the MAPA algorithm a different RTM (McArtim; Deutschmann et al., 2011) is used. The differences of the simulated O4 DSCDs by both models are discussed in Sect. 3.1.2.
SCIATRAN models radiative transfer processes in the terrestrial atmosphere and ocean in the spectral range from the ultraviolet to the thermal infrared, including all significant radiative transfer processes, e.g., the Rayleigh scattering, scattering by aerosol and cloud particles, and absorption by gaseous components and aerosols (Rozanov et al., 2014). The RTM used in this section was SCIATRAN version 2.2. The Monte Carlo Atmospheric Radiative Transfer Inversion Model (McArtim) is a full spherical Monte Carlo model without polarization (Deutschmann et al., 2011). In a recent intercomparison activity within the project FRM4DOAS (https://frm4doas.aeronomie.be/, last access: 29 September 2020), in general very good agreement (deviations up to a few percent) between McArtim and SCIATRAN version 2.2 was found, with the largest deviations for cases with fog or shallow box profiles (Frieß et al., 2018). It should also be noted that the agreement between McArtim and SCIATRAN v3.0 is better than with SCIATRAN v2.2. The differences between O4 DSCDs simulated by SCIATRAN and McArtim are further investigated in Sect. 3.1.2.
Retrievals based on synthetic SCDs for various viewing geometries in the UV and Vis were performed. The dependencies on the retrieval parameters and settings, different measurement viewing geometries, and different aerosol and trace gas profile shapes were identified by comparison of the results to those of the standard settings. As standard settings, we chose wavelengths of 360 and 477 nm and elevation angles of 1, 2, 3, 4, 5, 6, 8, 15, 30, and 90∘ (the same as the settings in the CINDI-2 campaign; Kreher et al., 2020). In the real atmosphere, a large variability of aerosol and trace gas profiles exists. However, we had to limit our profile shapes to typical profile shapes which occur in the atmosphere. In this study, three different profile shapes were used, which are exponential, Boltzmann, and Gaussian profile shapes:
- a.
Exponential profiles are typical if the emissions mainly occur at the surface. During transport to higher layers, the concentration systematically decreases with altitude. The scale height depends on the atmospheric lifetime and the vertical transport time. The description for exponential functions of altitude z is as follows:
with scale height hE.
- b.
Boltzmann profiles represent situations for which a layer is quickly mixed (compared to the lifetime of the species) and there is a barrier for further upwards transport above that layer. Such situations typically occur for well mixed boundary layers. The description for Boltzmann functions of altitude z is as follows:
with effective profile height hB.
- c.
Gaussian profiles describe elevated layers in our study. Such profiles represent situations with long-range transport of pollutants, which typically occurs above the boundary layer. Elevated profiles might also occur for aerosols and trace gases which are secondarily formed, while air is transported upwards. The description for Gaussian functions of altitude z is as follows:
) with peak height hG and the full width at half maximum (FWHM) σ.
The normalization factors AE, AB, and AG are determined by numerical integration from 0 to 4 km altitude such that the integrals of fE, fB, and fG equal 1, respectively. The value above 4 km altitude is set to 0.
For RTM calculations, vertical profiles of the aerosol extinction ε and NO2 concentration c are generated by multiplying f with the respective a priori column:
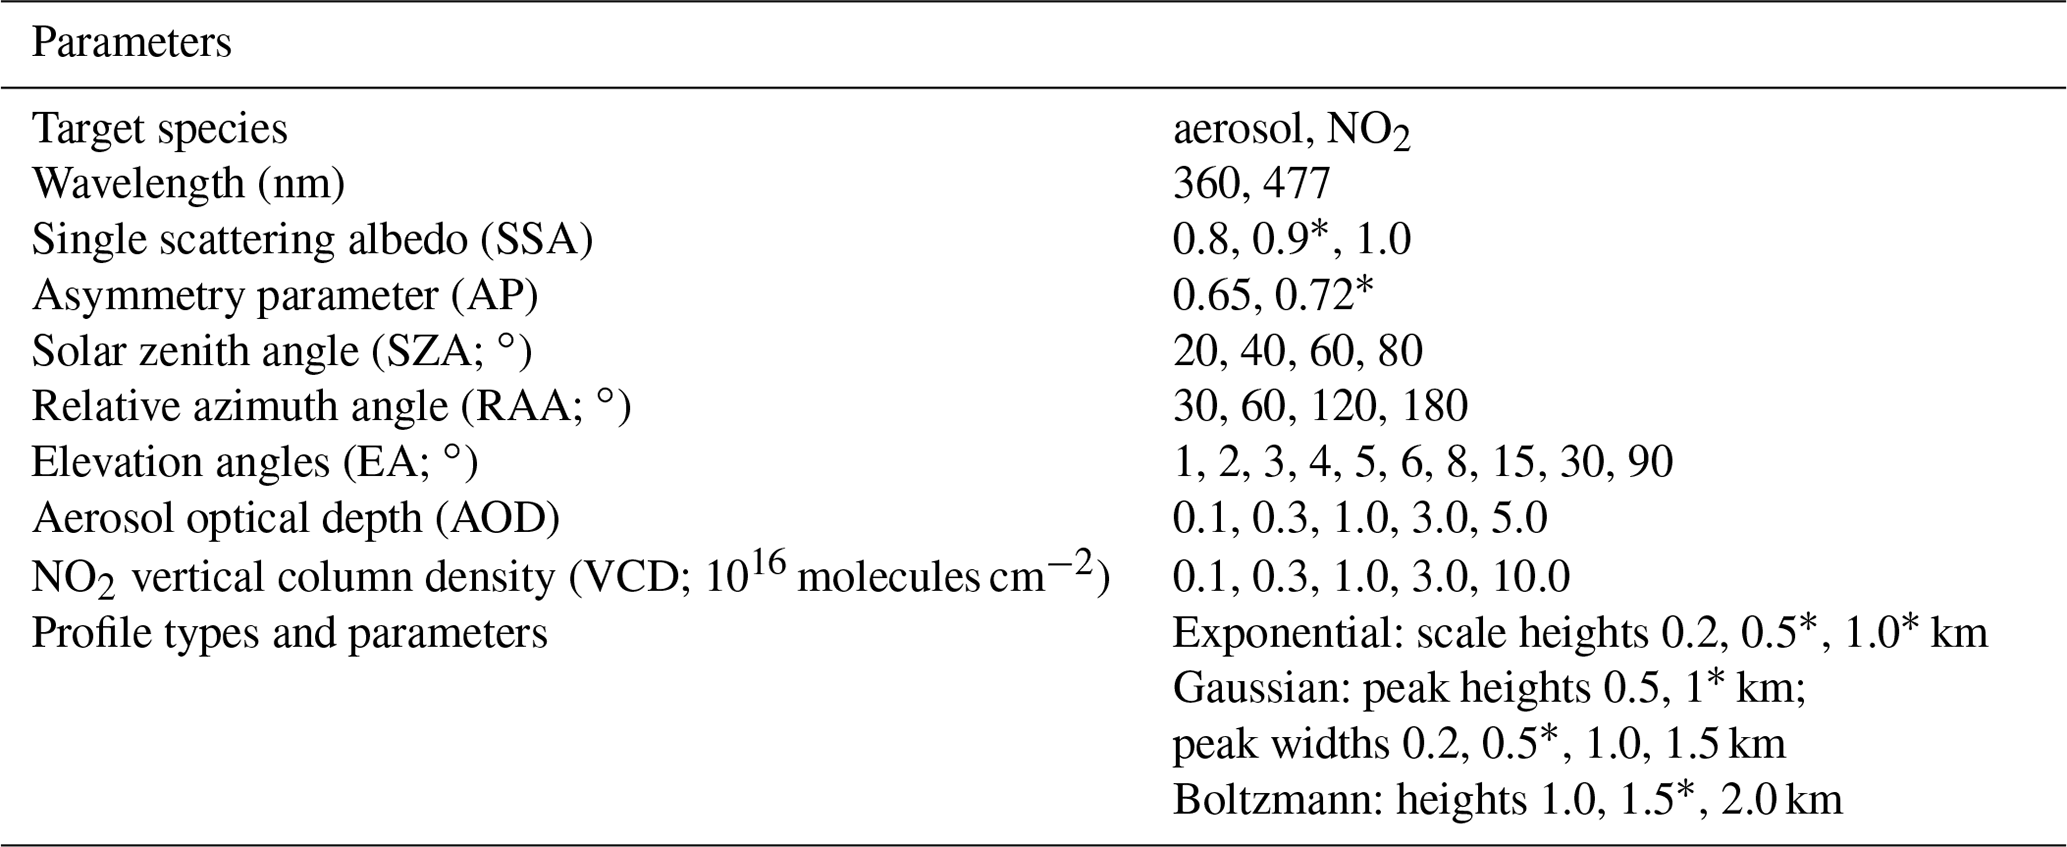
Figure S1 in the Supplement displays the corresponding vertical profiles for the different shapes. Table 1 lists the parameters used for the RTM, including solar and viewing geometry, a priori AOD and VCD, and parameters for the different profile shapes. The profile shape scenarios are introduced in detail in Sect. 3.1.
Table 1Parameter settings used in the RTM. Default values are indicated by ∗.
2.3 Description of the retrieval algorithms
The retrieval algorithms used in the comparison were PriAM and MAPA, as listed in Table 2.

2.3.1 PriAM algorithm
The PriAM profile inversion algorithm of aerosol extinction and trace gas concentration developed by the Anhui Institute of Optics and Fine Mechanics, Chinese Academy of Sciences (AIOFM, CAS), in cooperation with the Max Planck Institute for Chemistry (MPIC) (Wang et al., 2013a, b; Frieß et al., 2016), is based on the nonlinear optimal estimation method using the Levenberg–Marquardt-modified Gauss–Newton numerical iteration procedure (Rodgers, 2000). PriAM uses the radiative transfer model (RTM) SCIATRAN version 2.2 (Rozanov et al., 2005) to calculate the weighting functions and other simulated quantities. PriAM consists of a two-step inversion procedure. In the first step, aerosol extinction profiles are retrieved from the dependence of the O4 DSCDs on elevation angle. The single scattering albedo and asymmetry parameters have to be prescribed for the aerosol retrieval, e.g., based on other auxiliary measurements. Subsequently, profiles of the trace gas number density are retrieved from the respective DSCDs in each MAX-DOAS elevation angle sequence (Wang et al., 2017). In order to avoid negative concentrations in the retrieved results (which are not possible in the actual atmosphere), the retrievals are performed in logarithmic space. Here it should be noted that since the distribution probabilities of the retrieved profiles around the a priori profiles become asymmetric due to the inversion in logarithmic space, the sensitivity of the inversion to large values is greater than the sensitivity in linear space (Wang et al., 2020). PriAM can retrieve trace gas and aerosol profiles on any arbitrary vertical grid. In this study, vertical layers with 200 m resolution in the altitude range below 4.0 km were used.
2.3.2 MAPA algorithm
The Mainz profile algorithm (MAPA) is a parameter-based inversion method using a Monte Carlo (MC) approach developed by the Max Planck Institute for Chemistry (MPIC) (Beirle et al., 2019). Here we use MAPA v0.991, which is basically the same algorithm as described in Beirle et al. (2019) (v0.98), with only slight differences in the flagging procedure.
The radiative transfer model used in MAPA (McArtim; Deutschmann et al., 2011) for calculating each parameter in the lookup tables (LUTs) is a full spherical Monte Carlo model. MAPA also comprises a two-step inversion procedure. First, the aerosol profile is retrieved based on O4 DSCDs. In this step, other input parameters include the errors of the O4 DSCD and the O4 VCD and information about the viewing geometry (elevation angle (EA), solar zenith angle (SZA), and relative azimuth angle (RAA)). Next, the trace gas profiles are retrieved based on the aerosol profiles derived in step 1 and the trace gas DSCDs (and their errors). Three parameters (layer height, profile shape, and integrated column (AOD or VCD)) of the aerosol and trace gas profiles are derived in the inversion. The final profiles are weighted averages of the best matching profiles for the given trace gas DSCDs. The details of MAPA can be found in Beirle et al. (2019). It is worth noting that the maximum AOD in MAPA is 3, since higher AODs were not included in the RTM lookup table; therefore, only aerosol scenarios with AOD ≤ 3 were included in this study for MAPA.
In order to simulate the effects of different aerosol loads on the MAX-DOAS profile inversion algorithms, the aerosol and trace gas profiles were set up with five AOD and five VCD values as presented in Table 1 and different height parameters as shown in Table 1. The fitting error for all O4 DSCDs is set as 0.03 × 1043 molecules2 cm−5 and that for NO2 DSCDs to 1 % of the NO2 DSCDs in the PriAM and MAPA retrievals.
In order to limit the number of investigated profiles, first a sensitivity study with PriAM was carried out for the selected profile shapes in Table 1 (these best represent the variety of realistic profile shapes). Based on the result shown in Figs. S2 to S4, it turned out that one height parameter is mostly representative of the parameterization with Gaussian and Boltzmann profiles. For the exponential profiles, two height parameters were chosen because for both height parameters systematically different results were obtained: when the scale heights of the exponential profiles are low, the retrieved profiles are close to the input profiles. But for high scale height, the retrieval underestimates the scale height of the exponential profiles.
The settings of the four chosen profile shapes are listed in Table 1. The four profiles are exponential profiles with scale heights of 0.5 and 1.0 km, respectively, Gaussian profiles with the peak height at 1.0 km and FWHM of 0.5 km, and Boltzmann profiles with a height of 1.5 km.
A similar sensitivity study was also performed for the trace gas profiles. The results of the sensitivity analysis (Figs. S5 to S7) for NO2 profiles are consistent with the findings for the aerosol profiles. Thus the settings of the NO2 profile shapes for all further tasks are the same as for the aerosol profile in Table 1.
3.1 Aerosol results
In this section, the effect of different AODs on the retrieval of aerosol profiles is presented for a scenario with SZA = 60∘, RAA = 120∘, SSA = 0.9, and AP = 0.72. Note that similar results were found for different scenarios for both PriAM and MAPA. The effects of the different SZAs (20, 40, 60, 80∘) and RAAs (30, 60, 120, 180∘) are basically the same. But here it is important to note that in the real atmosphere, very different phase functions might occur, and especially for small RAA, stronger systematic deviations might occur. Here, only the result for SZA = 60∘ and RAA = 120∘ was shown. In addition, the effects of SSA and AP are further explored in Sect. 3.1.4.
3.1.1 Aerosol profile comparison of PriAM and MAPA
Figure 2 shows the comparison of the input aerosol profiles and the corresponding profiles retrieved by PriAM and MAPA for the different profile shapes and AOD scenarios. Note the relative and absolute deviations between the retrieved and input aerosol profiles are shown in Figs. S8 and S9, respectively. The results reveal that both PriAM and MAPA can retrieve the four different profile shapes well overall (Fig. 2). Similar results were derived for the aerosol retrievals at 360 and 477 nm. However, also absolute deviations are found, which increase as the AOD increases. The magnitudes of the absolute deviations between the retrieved and input aerosol profiles for PriAM were smaller than for MAPA at AOD < 1.0. For the exponential profiles with scale heights of 1.0 km, the magnitudes of the absolute deviations between the retrieved and input aerosol profiles were the smallest among the four profile shapes. The derived profiles for exponential profiles with scale heights of 0.5 km were in better agreement for PriAM than for MAPA. The maximum magnitudes of the absolute deviations primarily occurred at heights < 1.0 km. Here it is interesting to note that the parameterization used in MAPA does not include pure exponential profiles but only combined profiles with a (shallow) box profile at the bottom and an exponential profile on top. This limitation can explain the large magnitudes of the absolute deviations for MAPA retrievals, especially at low altitudes. For the Boltzmann-shaped profiles, the height around which the maximum magnitudes of the absolute deviations for PriAM and MAPA often occurred was 1.0 km, but for AOD > 1.0, the magnitudes of the absolute deviations for PriAM in the 200 m layer were greater than for MAPA. In brief, the concentrations of the 200–400 m layer retrieved by PriAM were moderately larger than those of the input profiles for AOD > 1.0. Thus, better agreement for the Boltzmann profiles was found for MAPA than for PriAM. For the Gaussian-shaped profiles, both PriAM and MAPA could retrieve the lifted layer well. The width of the lifted layer retrieved by MAPA was close to the truth, although the aerosol extinction was underestimated. PriAM underestimated the width of the lifted layer, but the aerosol extinction was closer to the input value (Fig. 2). The height at which the maximum magnitudes of the absolute deviations for the Gaussian-shaped profiles mainly occurred was 1.5 km. The relative deviations between the retrieved and input aerosol profiles for different AOD scenarios are similar for the same retrieval algorithm, with the magnitude of the relative deviations for AOD > 1.0 obviously greater than for AOD < 1.0. But the magnitude of the relative deviation does not increase with the increase in AOD.
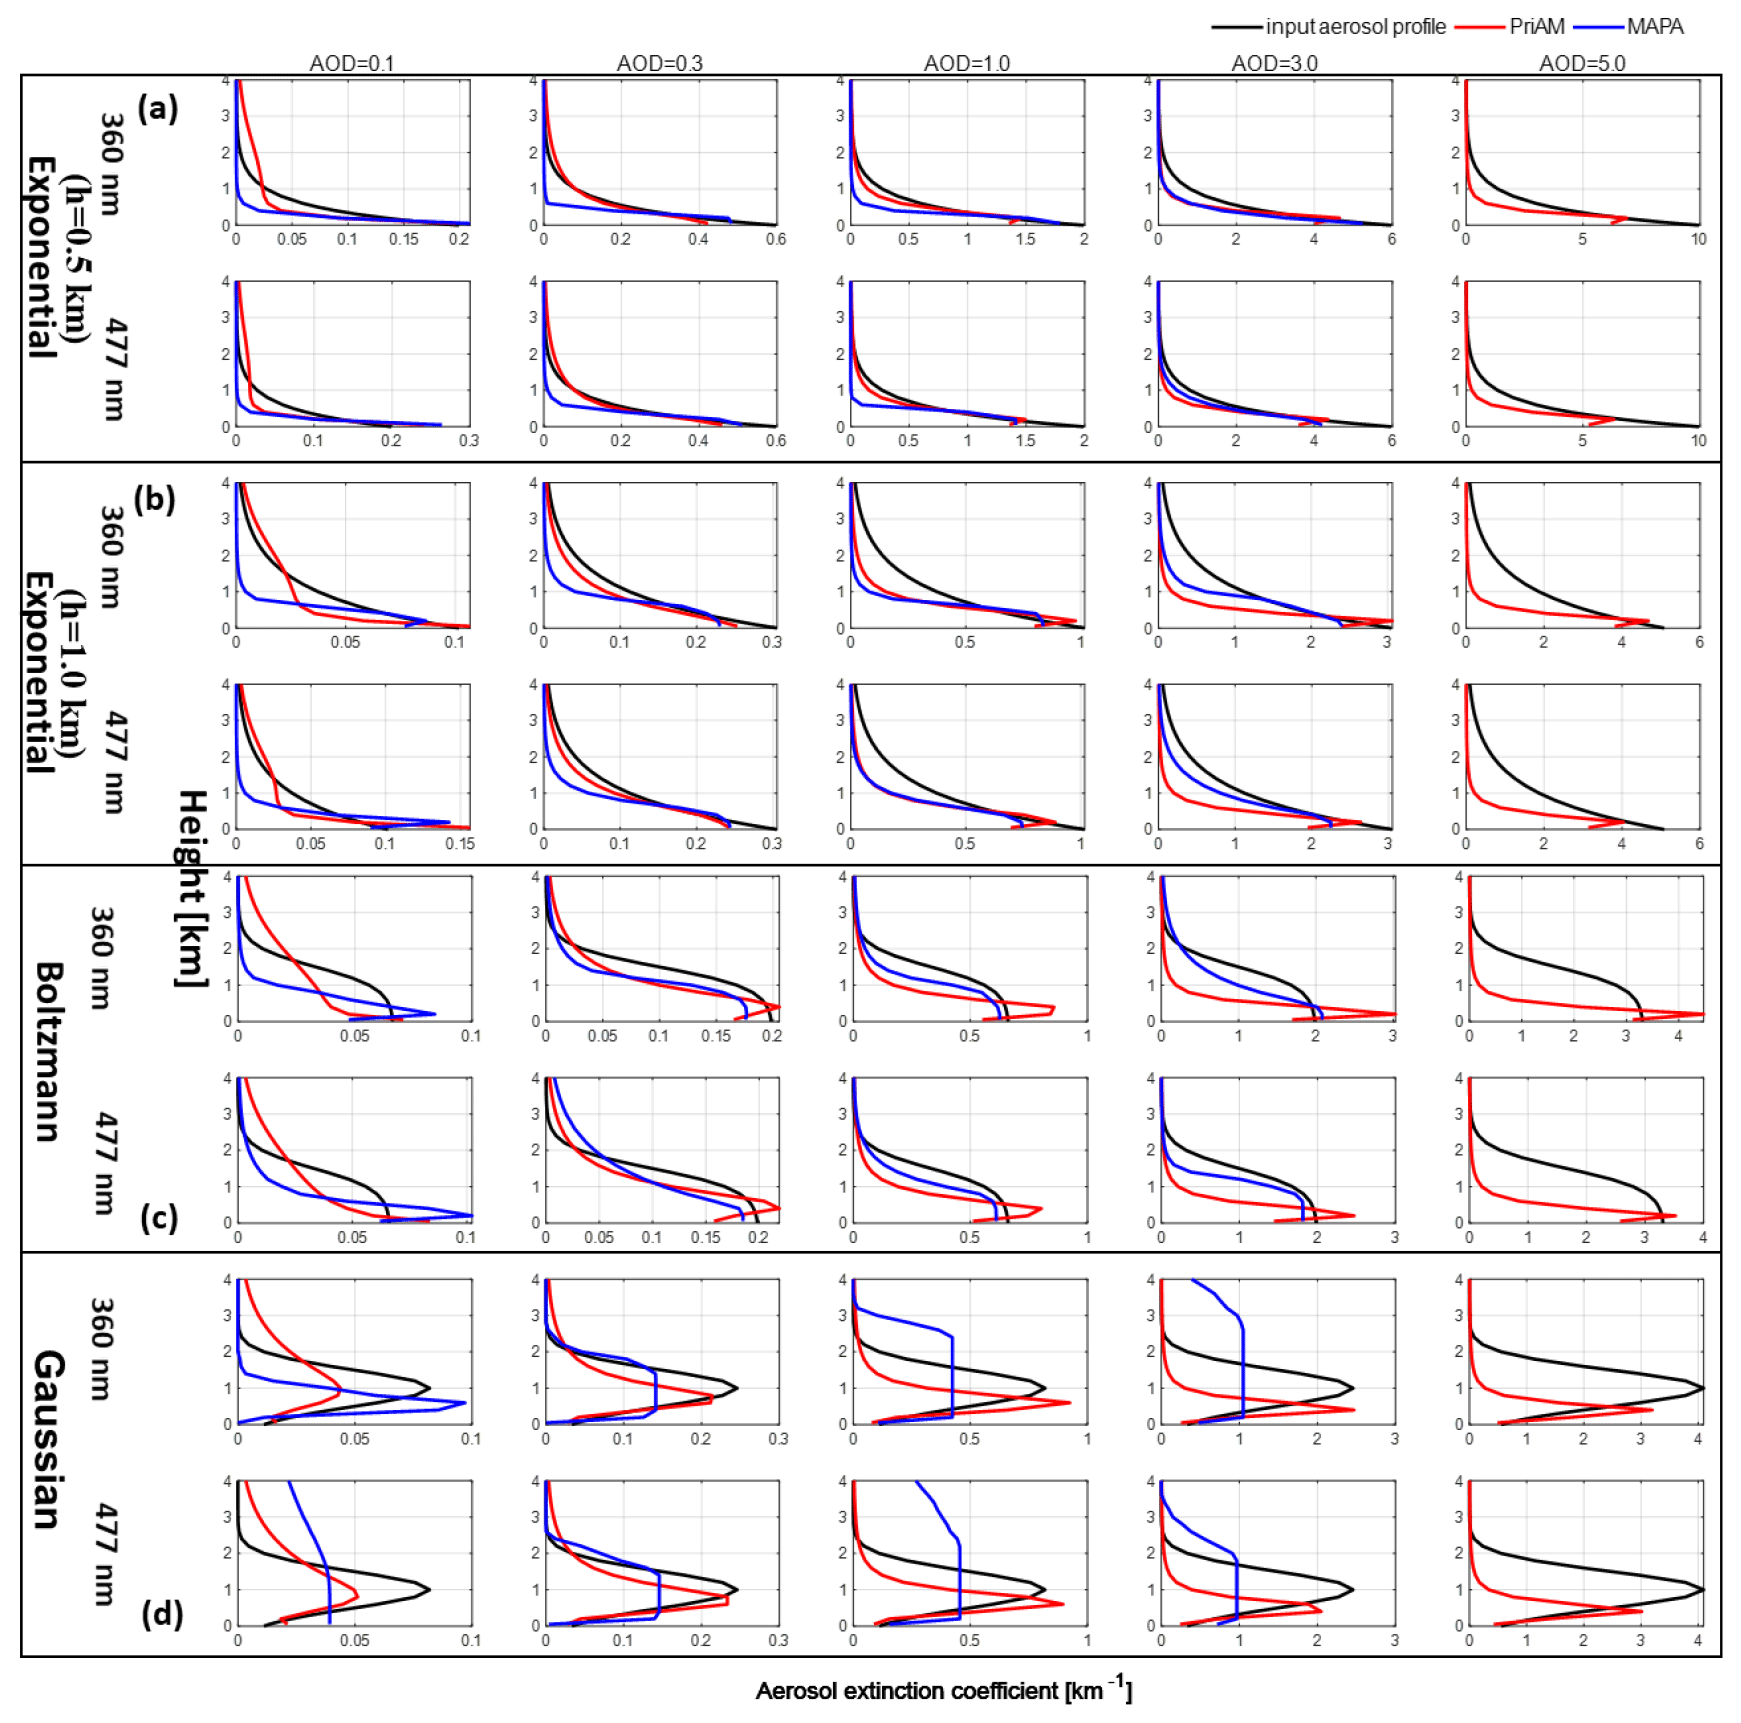
Figure 2Comparison of the aerosol profiles retrieved by PriAM and MAPA for 360 nm (first line) and 477 nm (second line) and the corresponding input aerosol profiles for (a) exponential shape with h = 0.5 km, (b) exponential shape with h= 1.0 km, (c) Boltzmann shape, and (d) Gaussian shape. The red and blue curves indicate the results from PriAM and MAPA, respectively. The corresponding relative deviations and absolute deviations are shown in Figs. S8 and S9, respectively. Note that MAPA by default flags cases where the retrieved AOD exceeds 3; thus the high aerosol scenarios are missing for MAPA.
3.1.2 Differences of the O4 SCDs simulated by SCIATRAN and McArtim
PriAM and MAPA use different RT models, which might partly explain systematic differences. In order to quantify the impact of the differences between SCIATRAN and McArtim, O4 DSCDs calculated by McArtim are compared to those calculated by SCIATRAN for selected cases.
Because the aerosol properties used in the MAPA LUT (SSA = 0.95 and AP = 0.68) are different from those used for the simulations of the O4 DSCDs by SCIATRAN (SSA = 0.90 and AP = 0.72), two sets of O4 DSCDs for SSA and AP (SSA = 0.90 or 0.95 and AP = 0.72 or 0.68) were simulated by McArtim.
The comparison results for the O4 DSCDs (Fig. S10) show that differences between the SCIATRAN and McArtim simulations using the same SSA and AP of 0.9 and 0.72, respectively, are up to 9 %. If also different aerosol properties were used, these differences increased further.
In the next step, the differences of the retrieval results for the different input DSCDs are investigated. The corresponding results are shown in Fig. S11. Interestingly, it is found that the exact choice of the aerosol optical properties only has a small influence on the results.
Using McArtim for the calculation of synthetic DSCDs, i.e., consistent RTM in the forward model and inversion, results in much better agreement, in particular for low AOD. Thus, the large relative deviations for MAPA seen in Fig. 7 are partly explained by the differences in RTM. For the Gaussian profiles, the larger differences at high AODs occur due to the obvious overestimation of the width of the lifted layer.
3.1.3 Sensitivity study of the a priori profile and the a priori profile covariance matrix
In order to improve the profile inversion accuracy for high AODs, the influence of the a priori profile and the a priori profile covariance matrix (Sa) was examined for PriAM. Here it should be noted that an exponential shape with an AOD of 0.2 and a scale height of 1.0 km was used as the universal a priori profile in this study. In order to investigate the importance of the a priori profile for the aerosol profile retrieval, the influence of the a priori profile was analyzed by changing the a priori profile to different aerosol profile shapes. Also, in addition to an AOD of 0.2, a second AOD value of 2.0 is used. The a priori profiles used in the sensitivity test are presented in Fig. 3. Here it should be noted that either the exponential profile shapes (universal a priori profile in PriAM in this study) or the same profile shapes (Boltzmann or Gaussian) as the input profiles are also used as a priori profiles (referred to as “corresponding a priori profiles” in the following). The comparison of the retrieved profiles using the different a priori profiles with the input profiles is shown in Fig. 4. It is found that the inversion results of the aerosol profile were slightly improved by changing the a priori profiles to the corresponding profile shapes and that for the high AOD scenarios the inversion results were further improved by increasing the AOD of the corresponding a priori profile (Fig. 4). However, increasing the AOD of the universal (exponential) a priori profile exhibited only little effect on the inversion results of the Boltzmann and Gaussian shapes. It is worth noting that when the input aerosol extinction coefficient was small, the use of a priori profiles with high AOD often yielded unrealistic results.
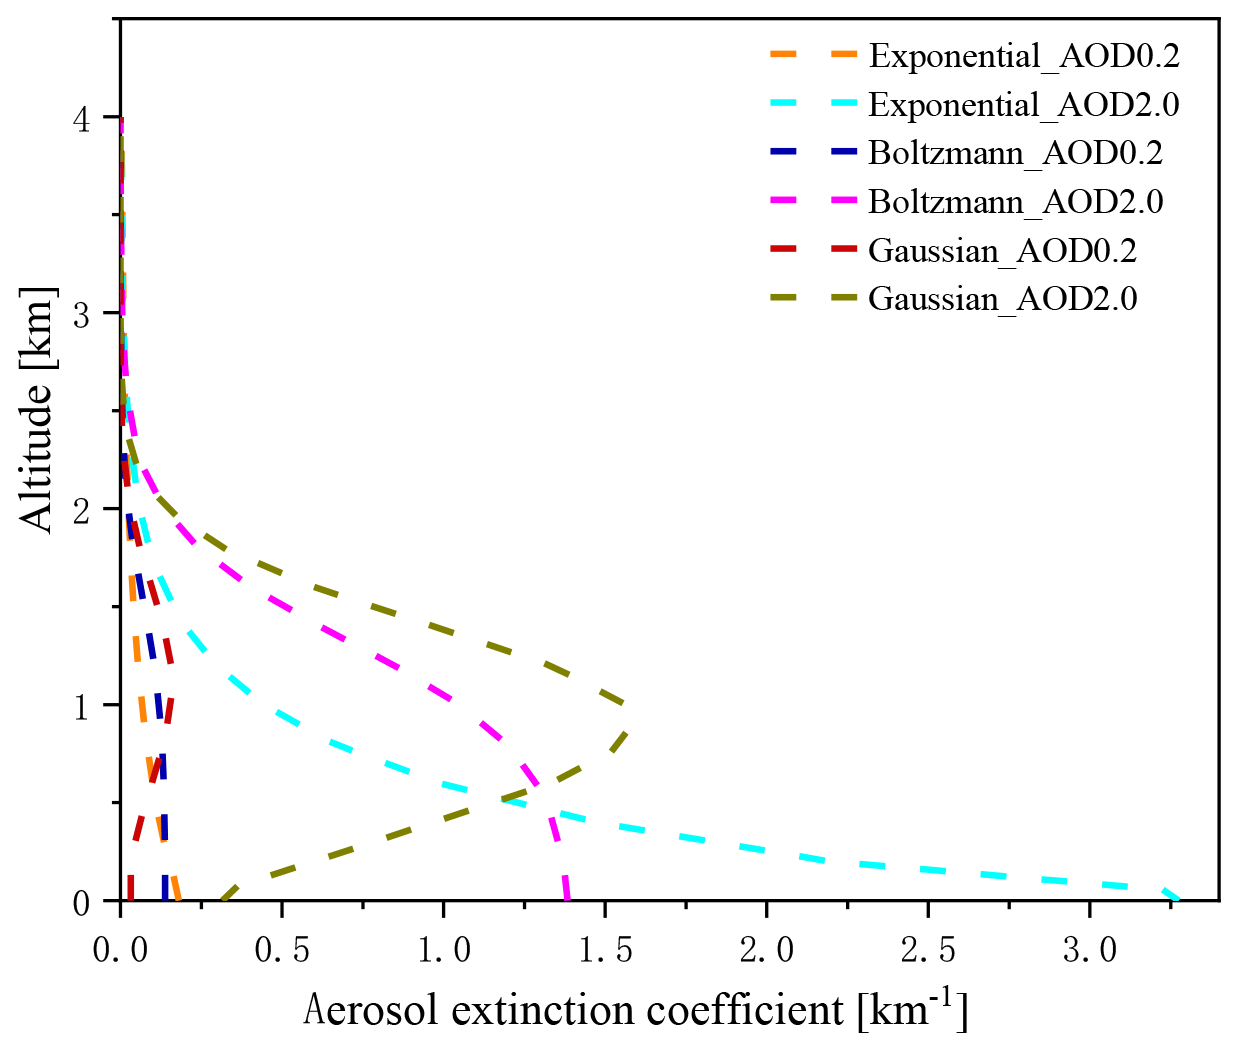
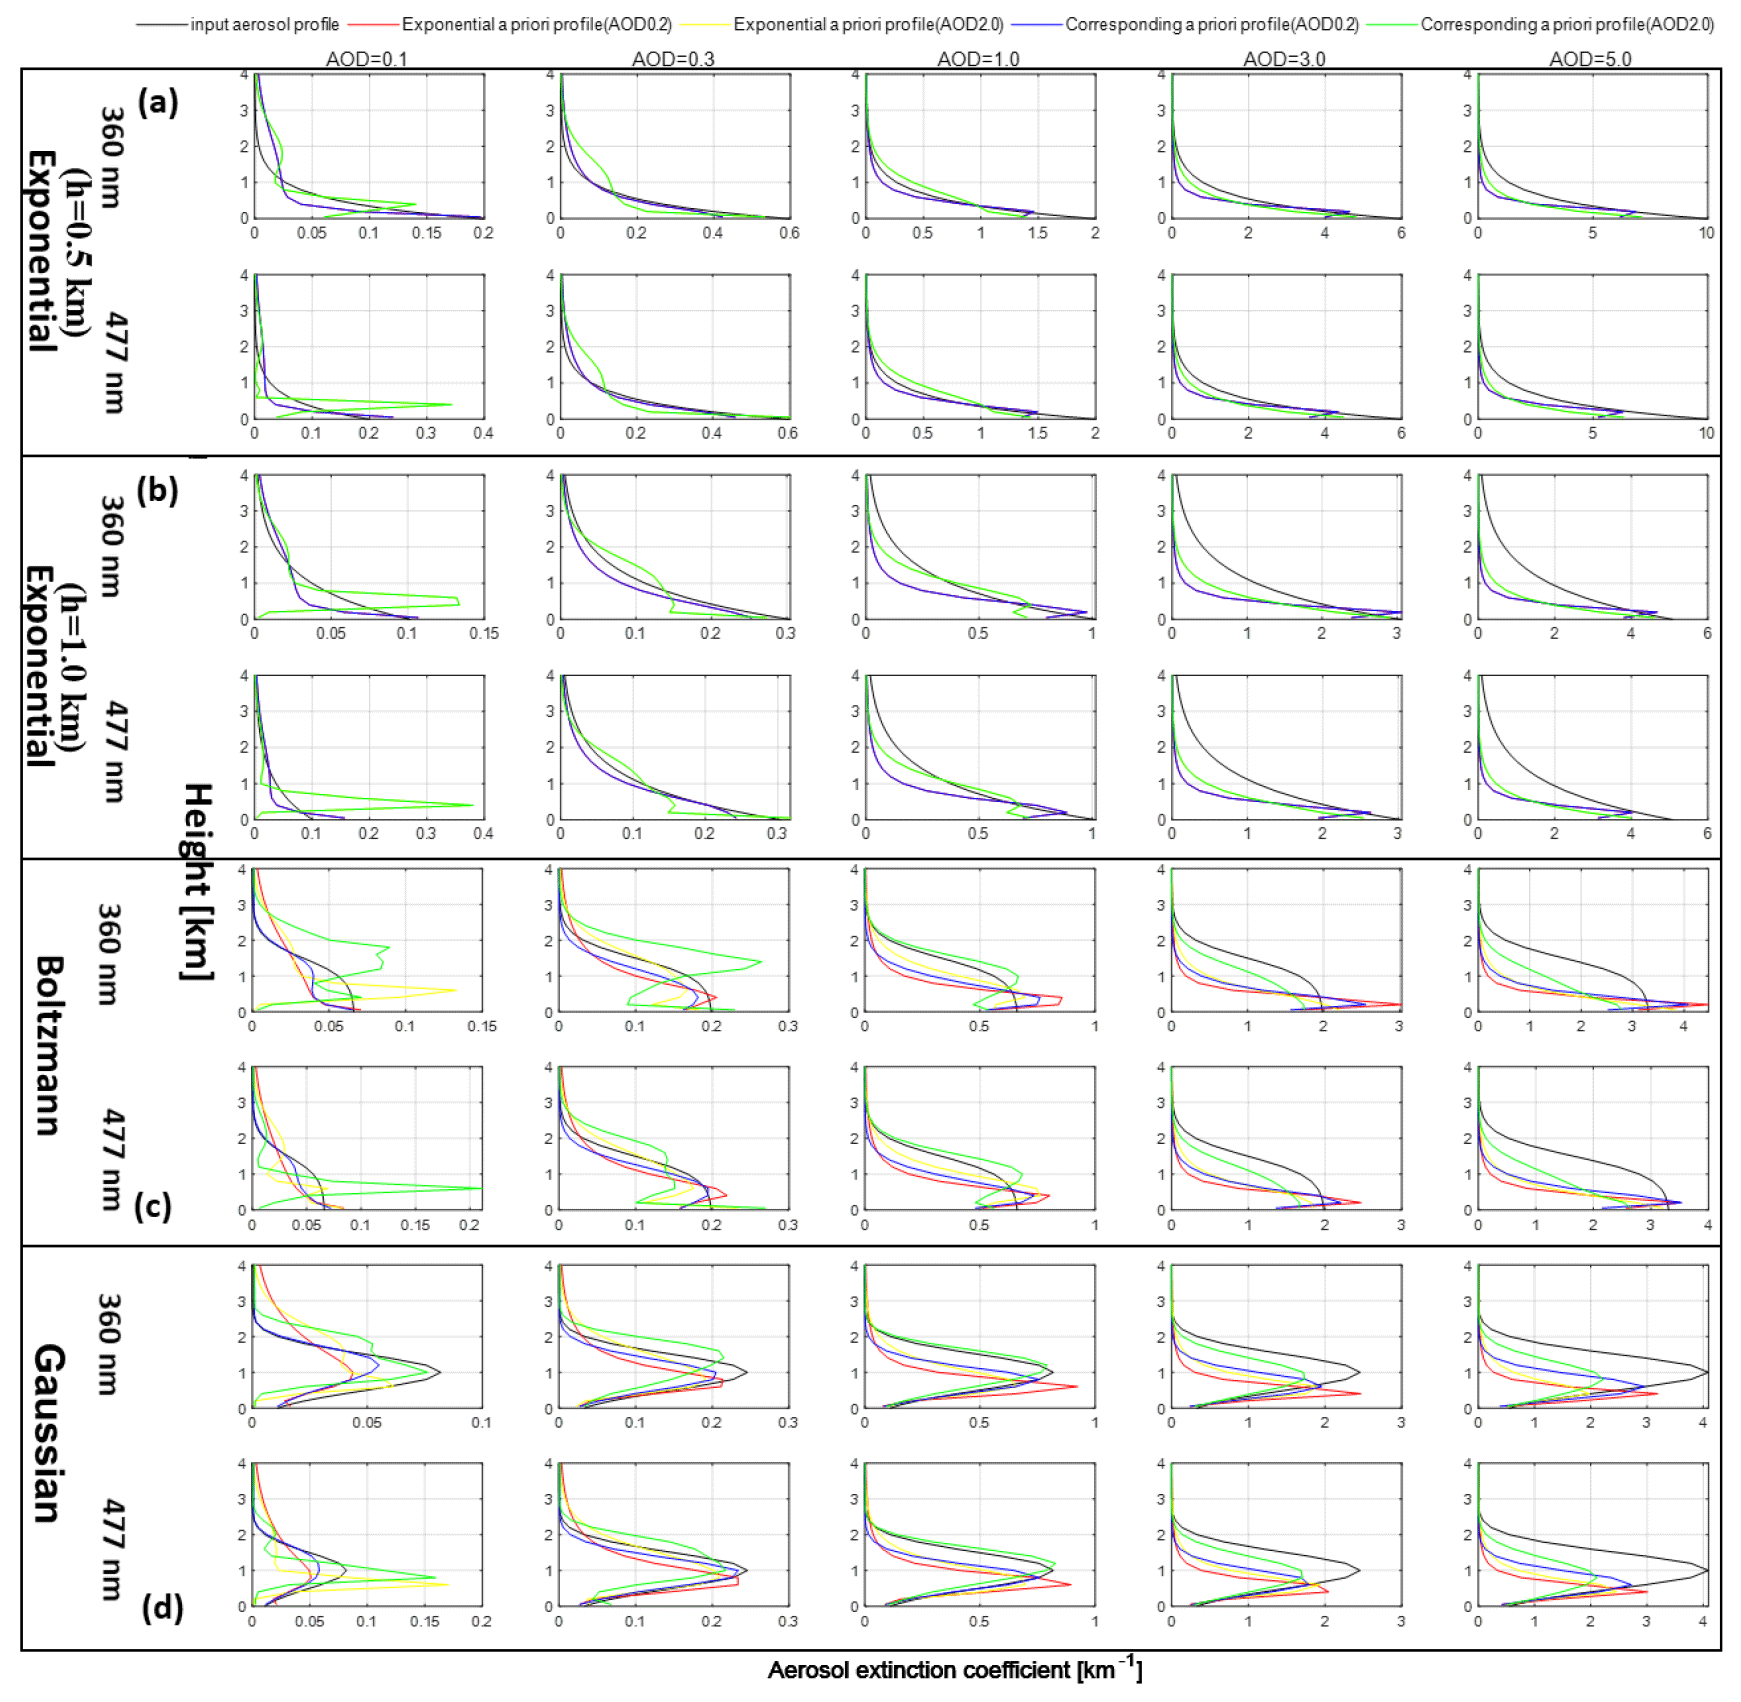
Figure 4Comparison of the PriAM inversion results with different alternative a priori profiles and the results for the universal a priori (exponential shape with AOD 0.2). The first line in every panel denotes the results for 360 nm, and the second line denotes the results for 477 nm. Colors indicate the shapes and AODs shown at the top. “Corresponding a priori profile” means that the same profile type as the simulated profiles is also used as the a priori profile.
We also investigated the retrieval results in a perfect scenario in which the a priori profile agrees with the input profile. The results are presented in Fig. 5. The results show that the retrieved aerosol profiles are basically the same as the input profiles, and the relative deviation is less than 0.05 % (Fig. S14 of the Supplement). This sensitivity study shows that (a) PriAM is implemented in a proper way and (b) improved retrieval results can be obtained with improved a priori profiles. This provides a possibility for real measurements to obtain more accurate aerosol profiles if independent information on the a priori profiles is available, e.g., from lidar observations and sun photometers.
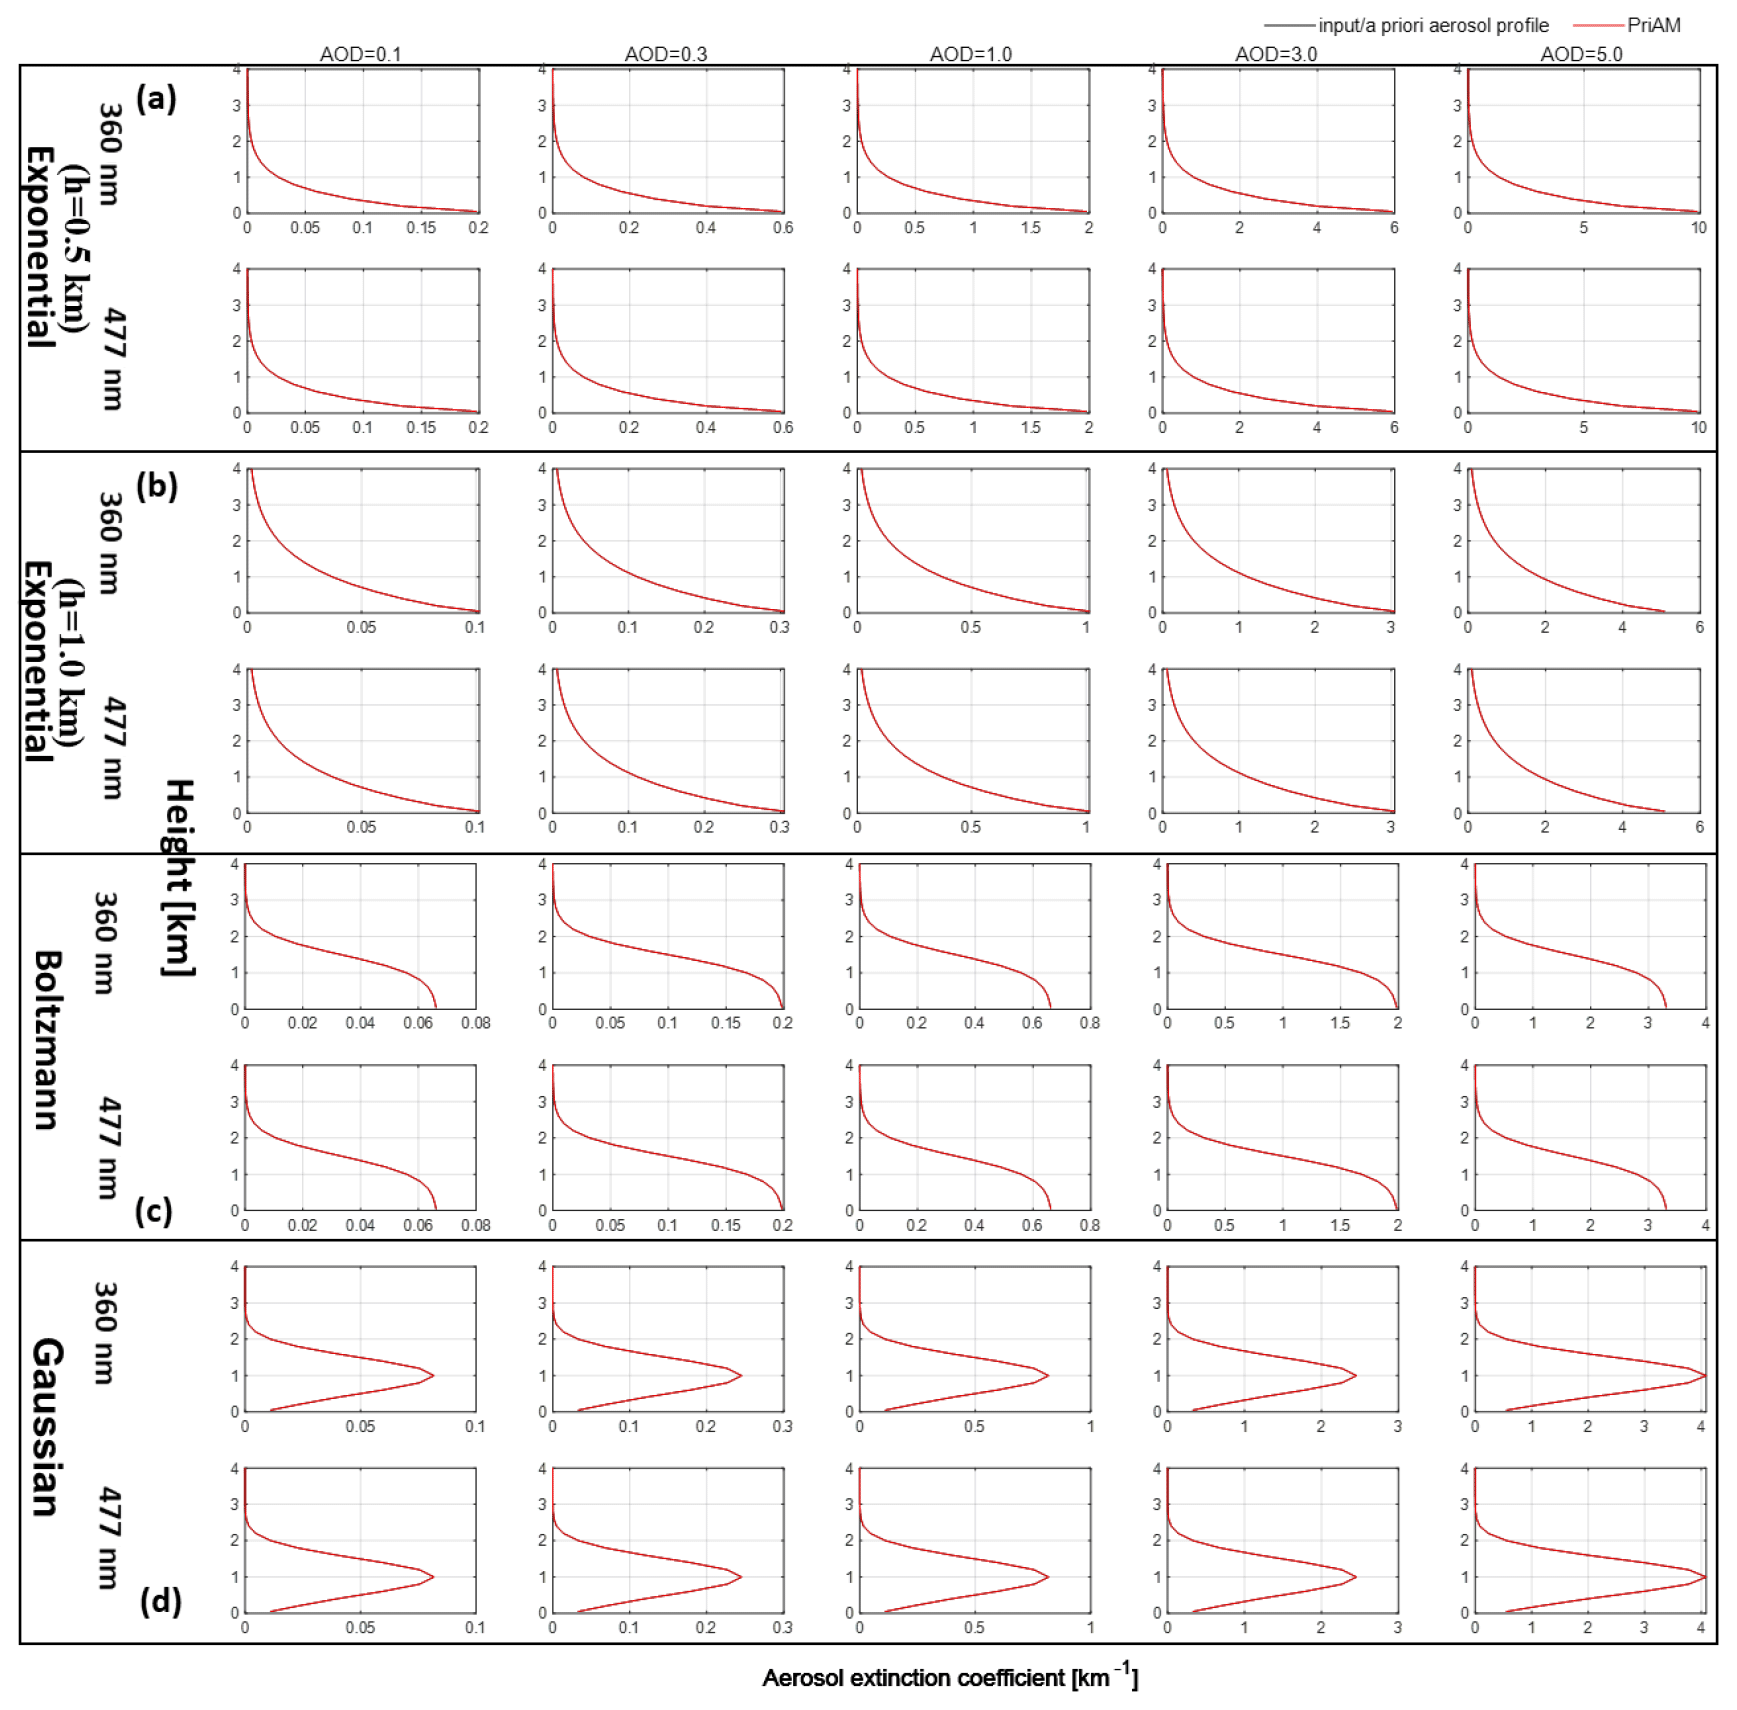
Figure 5Comparison of the input aerosol profiles and the PriAM inversion results if the exact a priori profiles are used as input profiles. The first line in every panel denotes the results for 360 nm, and the second line denotes the results for 477 nm. The black and red curves indicate the input (the same as the a priori profile) and retrieved aerosol profiles by PriAM, respectively.
The Sa is the covariance matrix of the a priori profile (N × N), and its diagonal elements are the square of the a priori state uncertainties with the off-diagonal elements calculated from the Gaussian function with the correlation length of 0.5 km (Frieß et al., 2006). The universal a priori settings of Sa in this study were such that the diagonal elements decreased exponentially with height. As a consequence, the smaller the Sa values, the more the inversion results depend on the prior state vector. The diagonal elements of Sa for the aerosol profile were set as the square of the a priori profile uncertainty. The standard settings for the a priori profile uncertainty were 10 % of the a priori profile. To describe this ratio, a new symbol (Sa_ratio) is introduced (see Table 4). The effect of different Sa values on the retrieval of the four aerosol profiles was studied, and the results for an AOD of 5.0 are shown in Fig. 6. (The profile results show that the deviation magnitudes of absolute deviations (Fig. S9) between the retrieved and input profile increase with the increase of the AOD, so a high AOD of 5.0 was selected to show the impact for an extreme case.) The four Sa_ratio values were set to 6 %, 10 %, 20 %, and 50 %. For the exponential profiles with a scale height of 0.5 km, the correlation coefficient between the retrieved and input aerosol profiles decreased with increasing Sa. But the correlation coefficient could be improved by increasing the Sa values for other profiles (exponential profiles with a scale height of 1.0 km, Gaussian and Boltzmann aerosol profile shapes). In particular, the retrieved surface extinctions and scale heights could be improved by increasing the Sa. This is due to the fact that the biases towards the a priori profiles are reduced with increasing Sa values. When the Sa values were too large, however, the retrieved aerosol profiles in the upper layer (approximately above 2.0 km) were more unstable. The highest correlation coefficient was found when the diagonal elements of Sa were set to the square of 20 % of the a priori profile for the Boltzmann profiles and exponential profiles with a scale height of 1.0 km at AOD of 5.0, with the smallest root-mean-square deviation (RMSD) of 0.54 and 0.50 (averaged of 360 and 477 nm for each shape), respectively. For the Gaussian profile, the correlation coefficient was highest with the diagonal elements of Sa in 50 % of the a priori profile. The smallest averaged RMSD of 0.55 was also found for this scenario, with values of 0.58 at 360 nm and 0.52 at 477 nm, respectively.
Table 3List of SSA and AP values used for the sensitivity studies (for the standard retrievals, SSA = 0.9 and AP = 0.72 were used).
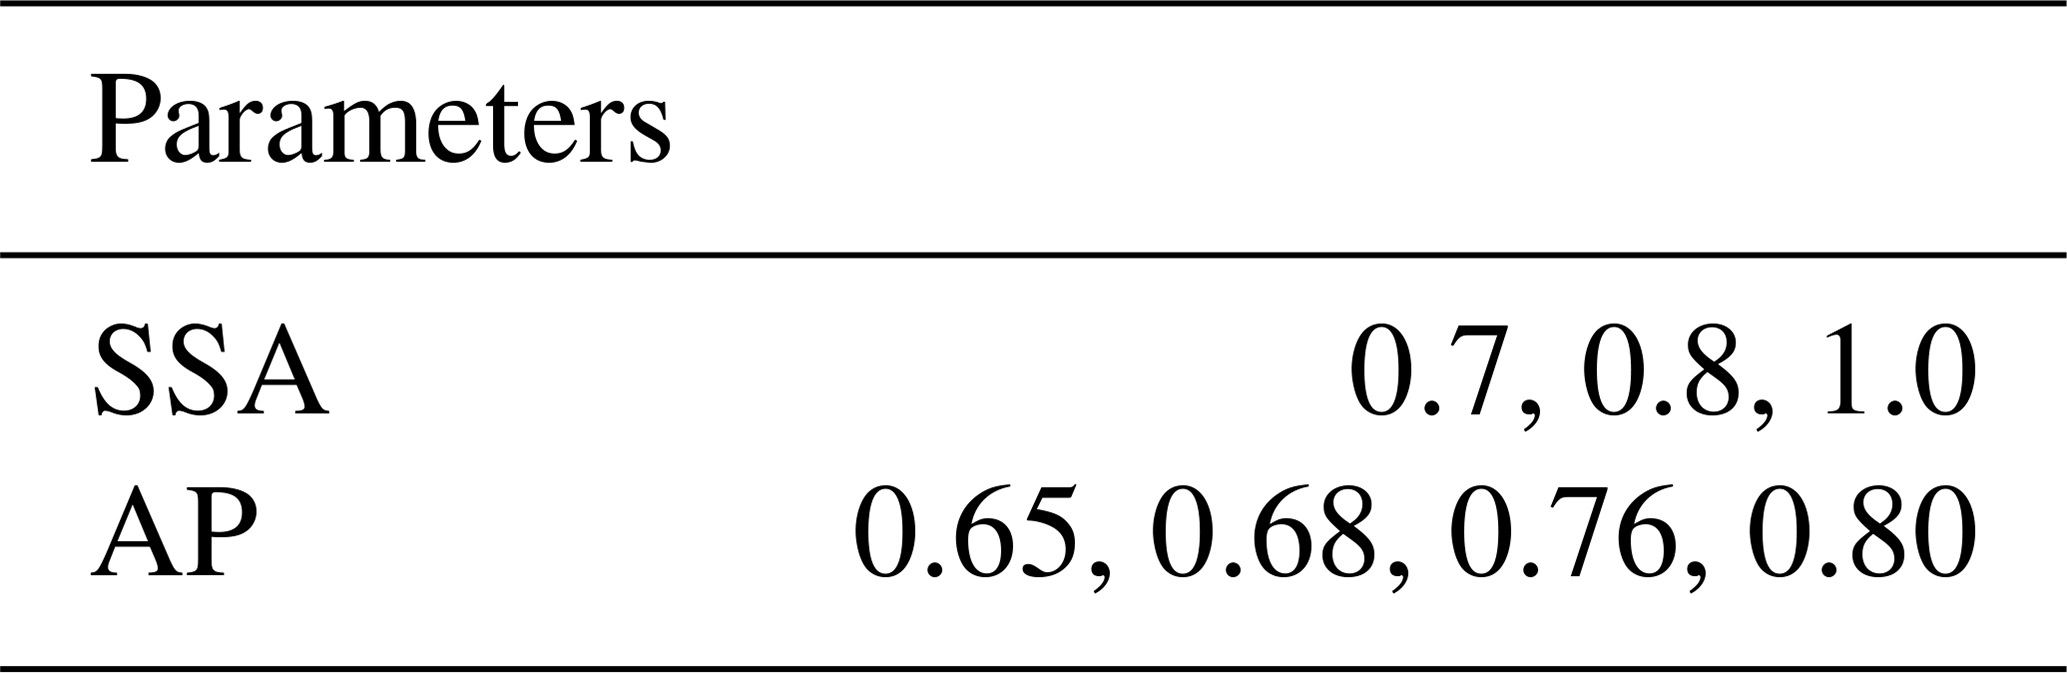
Table 4Parameter settings used in the general PriAM retrieval for aerosol and NO2 profiles.
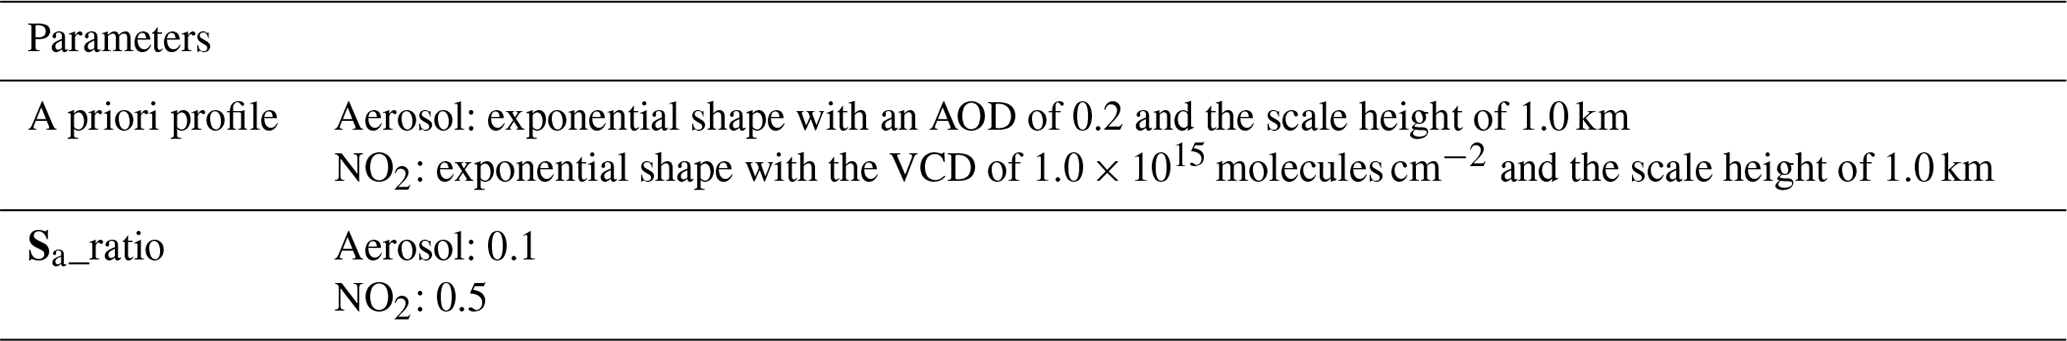
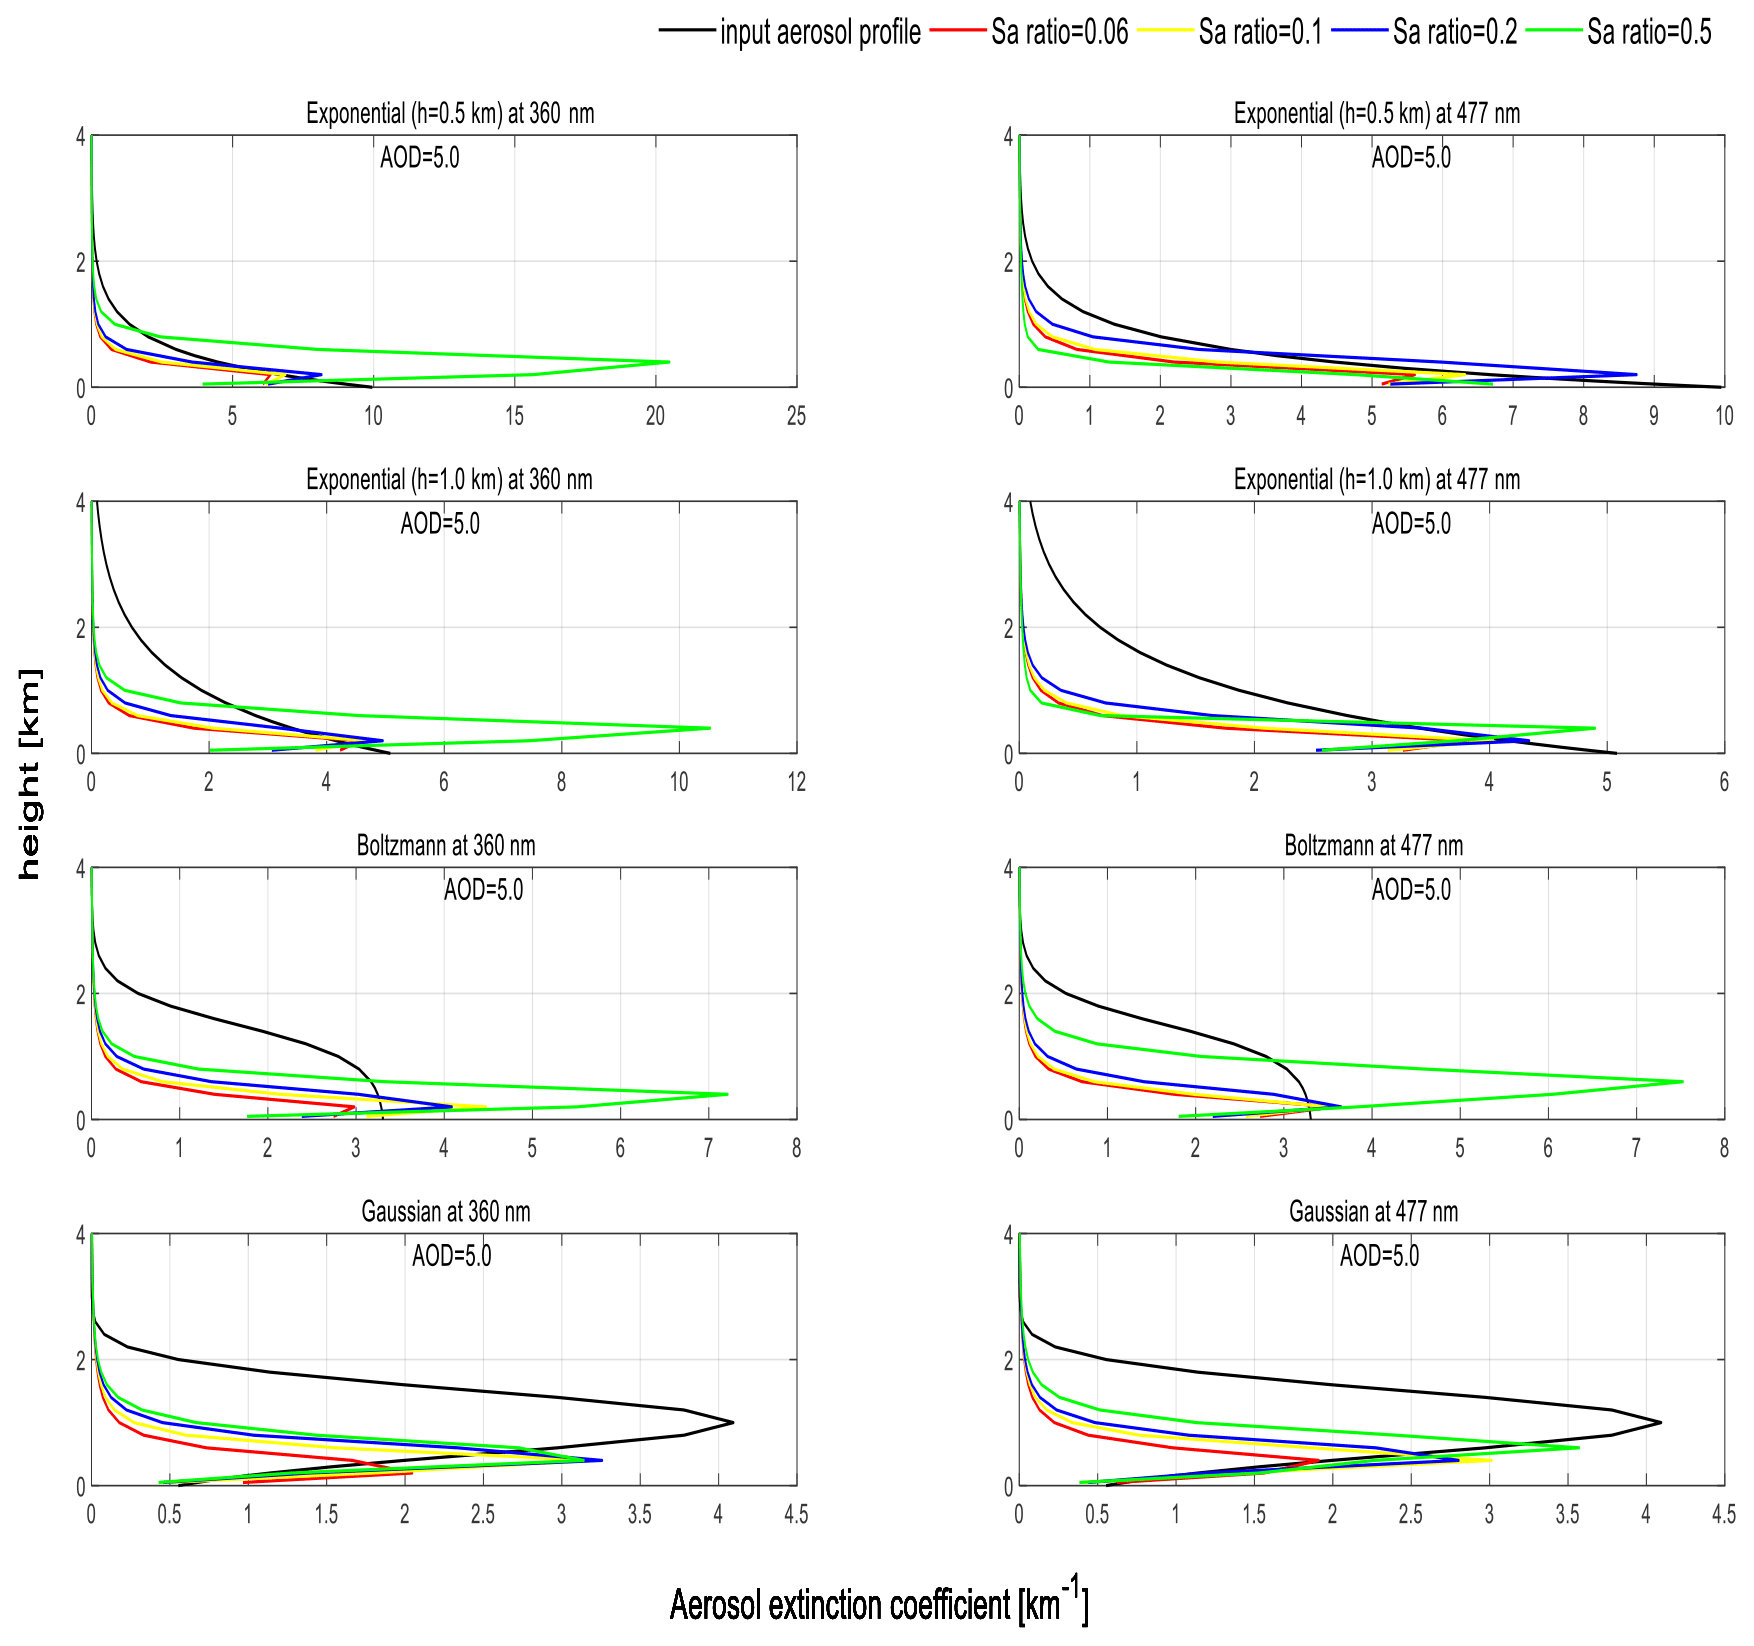
Figure 6Results for three aerosol profile shapes retrieved by PriAM for an AOD of 5.0 using different values of the a priori profile covariance matrix (Sa).
3.1.4 Comparison of retrieved and input O4 DSCD for PriAM and MAPA
The modeled O4 DSCDs corresponding to the aerosol profiles retrieved by PriAM and MAPA were compared to the input O4 DSCDs simulated by the RTM. The comparison results are shown in Fig. 7 for the different aerosol profile shapes and the five AOD values for 360 and 477 nm. Note that only the results for AOD ≤ 3.0 were derived from MAPA. Also the slopes, intercepts, and correlation coefficients are shown in Fig. 7. The correlation coefficients (r2 values) were > 0.99 for both the PriAM and MAPA results. Also the slopes are very close to unity. Therefore, it can be concluded that the discrepancies of the retrieved aerosol profiles from the input profiles were not caused by failed convergences of the retrievals but must be related to systematic performances of the inversion algorithms in solving the ill-conditioned problem or RTM differences.
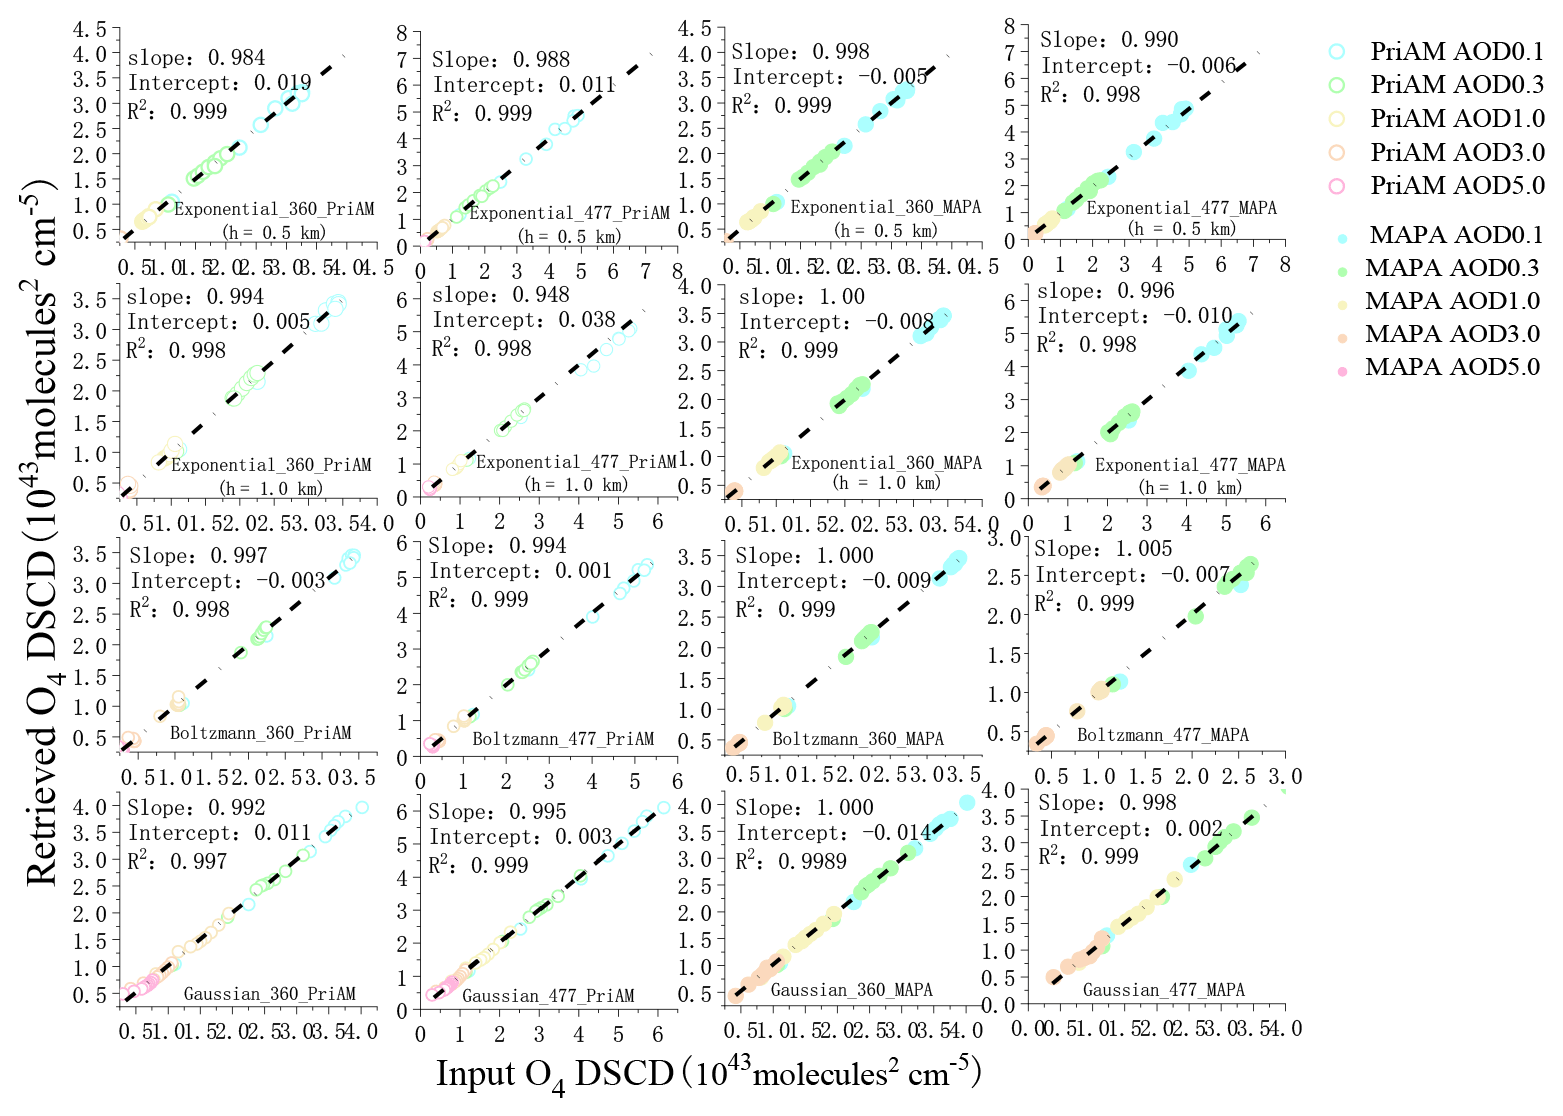
Figure 7Correlation plots between the retrieved O4 DSCDs and the input O4 DSCDs for PriAM and MAPA The open and closed circles denote the retrieved O4 DSCDs from PriAM and MAPA, respectively. The colors refer to the AOD shown on the top right.
3.1.5 AOD comparison of PriAM and MAPA
Figure 8 shows the deviations of the AODs retrieved by PriAM and MAPA with the input AODs for the four selected aerosol profiles and five AOD values at the wavelength of 360 and 477 nm. Both PriAM and MAPA underestimate in general the input AODs at these two wavelengths. For the exponential aerosol profiles with a scale height of 0.5 km, the magnitude of the relative deviations of the retrieved AODs by PriAM and MAPA compared to the input AODs is less than 20 % for most AODs. In contrast, much worse agreement is found for the exponential profiles with a scale height of 1.0 km. The magnitude of the relative deviations between the retrieved and input profiles is > 20 % and is similar for PriAM and MAPA. The main reason is that the retrieved scale height for an exponential profile of 1.0 km by PriAM and MAPA is significantly lower than the input profile. In particular for low AOD, the AODs retrieved by PriAM are closer to the input AODs than those retrieved by MAPA. Part of the systematic underestimation of the MAPA AODs for exponential profiles is probably caused by the differences of the RTM (SCIATRAN v2.2) and settings (SSA = 0.9, AP = 0.72) used for the simulation of the input O4 DSCDs and for the MAPA algorithm (McArtim; SSA = 0.95, AP = 0.68); see Fig. S11. Another reason might be, as mentioned in Sect. 3.1.2, the limitation to accurately describe purely exponential profile shapes. The different incorporated methods for providing the a priori information is also a potential reason for the differences between the two retrieval algorithms. Prescribed a priori profiles and a priori covariances are used in PriAM, while a priori assumptions are incorporated in MAPA in the form of prescribed profile shapes by the chosen parameterization.

Figure 8Comparison between the retrieved AODs and input AODs for PriAM and MAPA for the four aerosol profile shapes listed in Table 1.
For the Boltzmann and Gaussian profile shapes, the relative deviations between the retrieved and the input AODs increased with increasing AODs for both PriAM and MAPA. The largest magnitude of the relative deviations is > 50 % for large AODs.
3.1.6 Effect of single scattering albedo and asymmetry parameter used in the inversion of the retrieved aerosol profiles
The effects of single scattering albedo (SSA) and asymmetry parameter (AP) used in the forward model of the aerosol profile inversion by PriAM were examined. First, a single aerosol profile was used to simulate the O4 DSCDs for different SSA (0.8, 0.9, 1.0) and AP (0.68, 0.72) values (see Table 1). Next, the simulated O4 DSCDs were used to retrieve the aerosol extinction profiles by PriAM using the “correct” SSA and AP values (hence, the same values that were applied in the corresponding O4 DSCD simulations). The retrieved aerosol profiles for all SSA and AP values are shown in Fig. 9. These results reveal that especially for low AODs, the retrieved aerosol extinction profiles are very consistent for these scenarios. The relative and absolute deviations of the resulting aerosol extinction profiles to the input profiles are presented in Figs. S16 and S17. The results are consistent with those presented in Figs. 2 and S9. It is worth noting that the magnitude of the relative deviation for the Boltzmann aerosol profiles retrieved for SSA = 0.9 and AP = 0.72 was smaller than for the other scenarios. In the next step, the effect of incorrect SSA and AP values (Table 3) on the aerosol profile inversion was studied using the PriAM standard settings with SSA = 0.9 and AP = 0.72 for the simulation of the O4 DSCDs. The comparison of the retrieved profiles from the profiles with the incorrect SSA and AP values is presented in Fig. 10. It was found that when the SSA was smaller than the input value, the retrieved extinction profiles were larger than the input profiles and vice versa. It is worth noting that the result at 0 km is found to be opposite. For the AP, the opposite dependency was found. The effect of incorrect SSA and AP values on the aerosol profiles retrieved by PriAM increased with increasing AOD, with the absolute deviations of the extinction coefficient increasing from 0.01 to 1.5 km−1 as the AOD increased from 0.1 to 5.0.
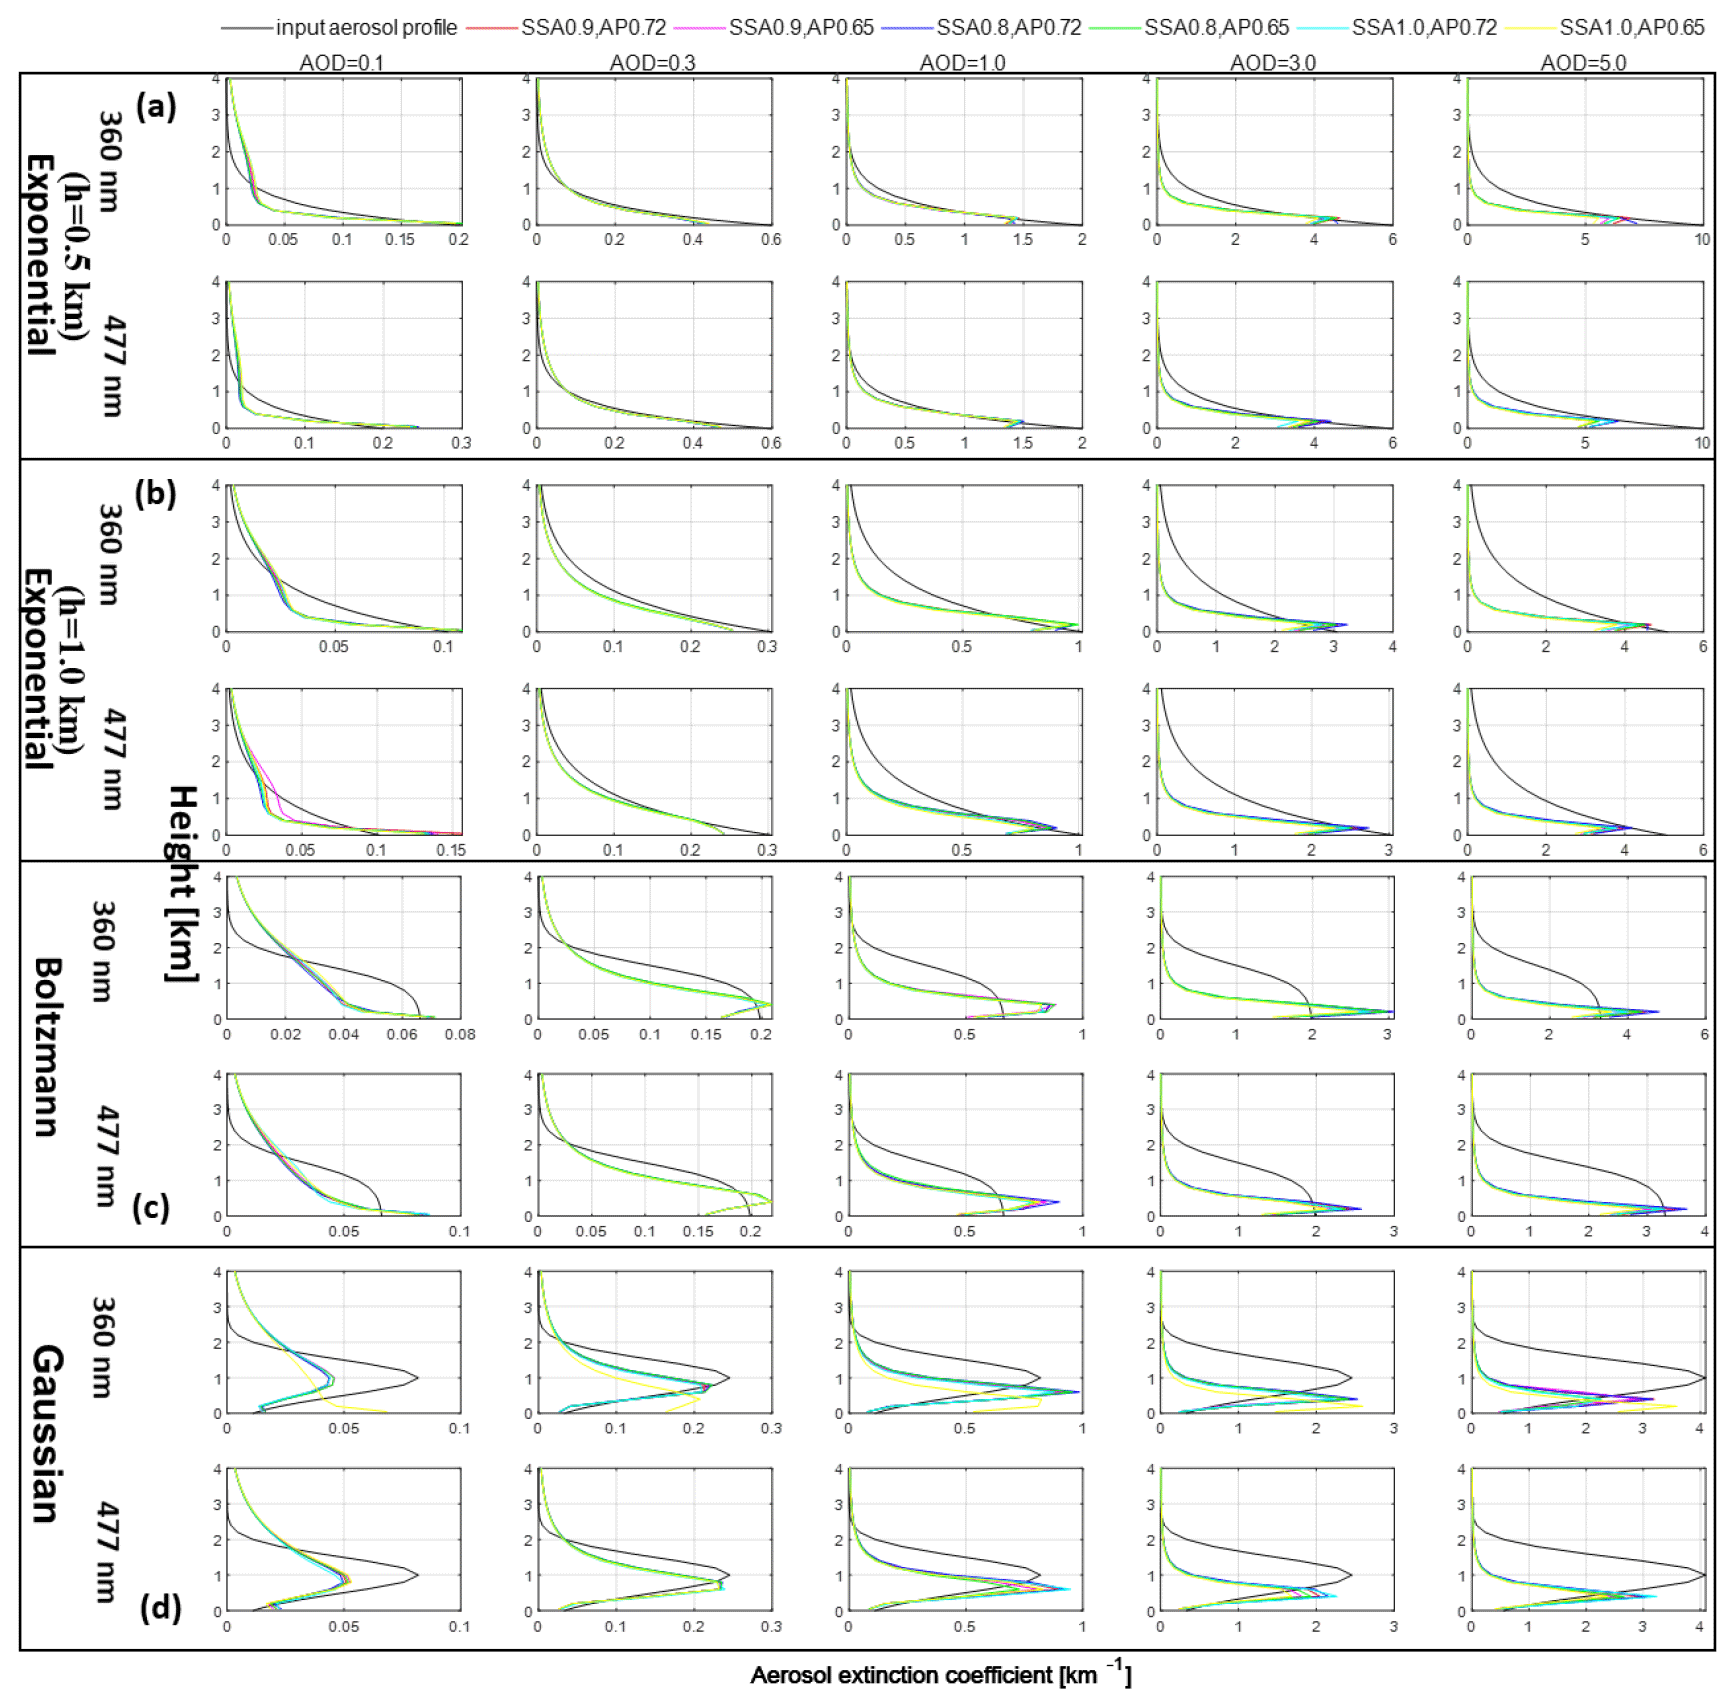
Figure 9Retrieved aerosol profiles by PriAM using different SSA and AP for (a) exponential shape with h = 0.5 km, (b) exponential shape with h = 1.0 km, (c) Boltzmann shape, and (d) Gaussian shape. For these inversions, the same SSA and AP were used for the simulations of the O4 DSCDs and for the PriAM inversions. The first line in every panel denotes the results for 360 nm, and the second line denotes the results for 477 nm. The colors refer to the corresponding SSA and AP values shown at the top.
3.2 NO2 results
First, the effects of different aerosol extinction profiles on the trace gas profile inversion for five NO2 VCDs (0.1 × 10¹⁶, 0.3 × 10¹⁶, 1.0 × 10¹⁶, 3.0 × 10¹⁶, and 10.0 × 10¹⁶ molecules cm−2) were examined using aerosol profiles with four AODs (0.3, 1.0, 3.0, and 5.0) (AOD = 5.0 was not included for MAPA). Two strategies (either the retrieved (S1) or the input (S2) aerosol profiles served as input for the retrievals of the NO2 profiles) were employed to retrieve the NO2 profiles (see Sect. 2.1). Here, as for the aerosol inversions, the scenario with SZA = 60∘, RAA = 120∘, SSA = 0.9, and AP = 0.72 was also used. For the NO2 profiles, the exponential profile shape with a VCD of 1.0 × 10¹⁶ molecules cm−2 was utilized as the universal a priori profile for PriAM.
3.2.1 Comparison of NO2 profiles retrieved by PriAM and MAPA
Figures S20 and S21 show the relative and absolute deviations of four typical NO2 profiles retrieved by PriAM and MAPA using S1 with the input NO2 profiles for the Boltzmann aerosol profile shapes with three AODs (0.3, 1.0, and 3.0) and five VCD values. And the comparison result is shown in Fig. 11. The results reveal that the magnitude of absolute deviations between the NO2 profiles retrieved by both PriAM and MAPA and the input NO2 profiles is similar and relatively small, despite the differences in level of agreement of the aerosol inversion. For the same aerosol conditions, the magnitude of the absolute deviations between the retrieved NO2 profiles and the input values increases with increasing NO2 VCDs. However, the magnitude of the relative deviations stays constant (Fig. S20). It is worth noting that the magnitude of the relative deviations between the retrieved NO2 profiles and the input values for low NO2 VCDs was significantly higher than for high NO2 VCDs for an AOD of 3.0. For the same aerosol conditions, the systematic deviations between the retrieved NO2 profiles and the input values increase with increasing NO2 VCDs, while the magnitude of the relative deviations increases slightly with the increase of AOD for the same NO2 VCD. The largest deviation magnitudes between the retrieved NO2 profiles and the input NO2 profile for the exponential NO2 profiles with a scale height of 0.5 km were mainly found below 1.0 km. The largest deviation magnitudes between the retrieved NO2 profile and the input NO2 profile appeared below 2.0 km for the other three profile shapes, with the maximum deviation magnitude occurring at 1.0 and 0.2 km. The reason for this finding is that the sensitivity above 1.0 km gradually decreases with increasing AOD, making it impossible to correctly retrieve the NO2 values at high altitudes. The smoothing effect of PriAM overestimates the NO2 concentrations around 500 m to compensate for the underestimation of the NO2 concentrations above 1.0 km. In other words, PriAM yields another solution for the ill-conditioned problem in order to achieve convergence between the retrieved and measured SCDs under the control of the a priori profile and its covariance.
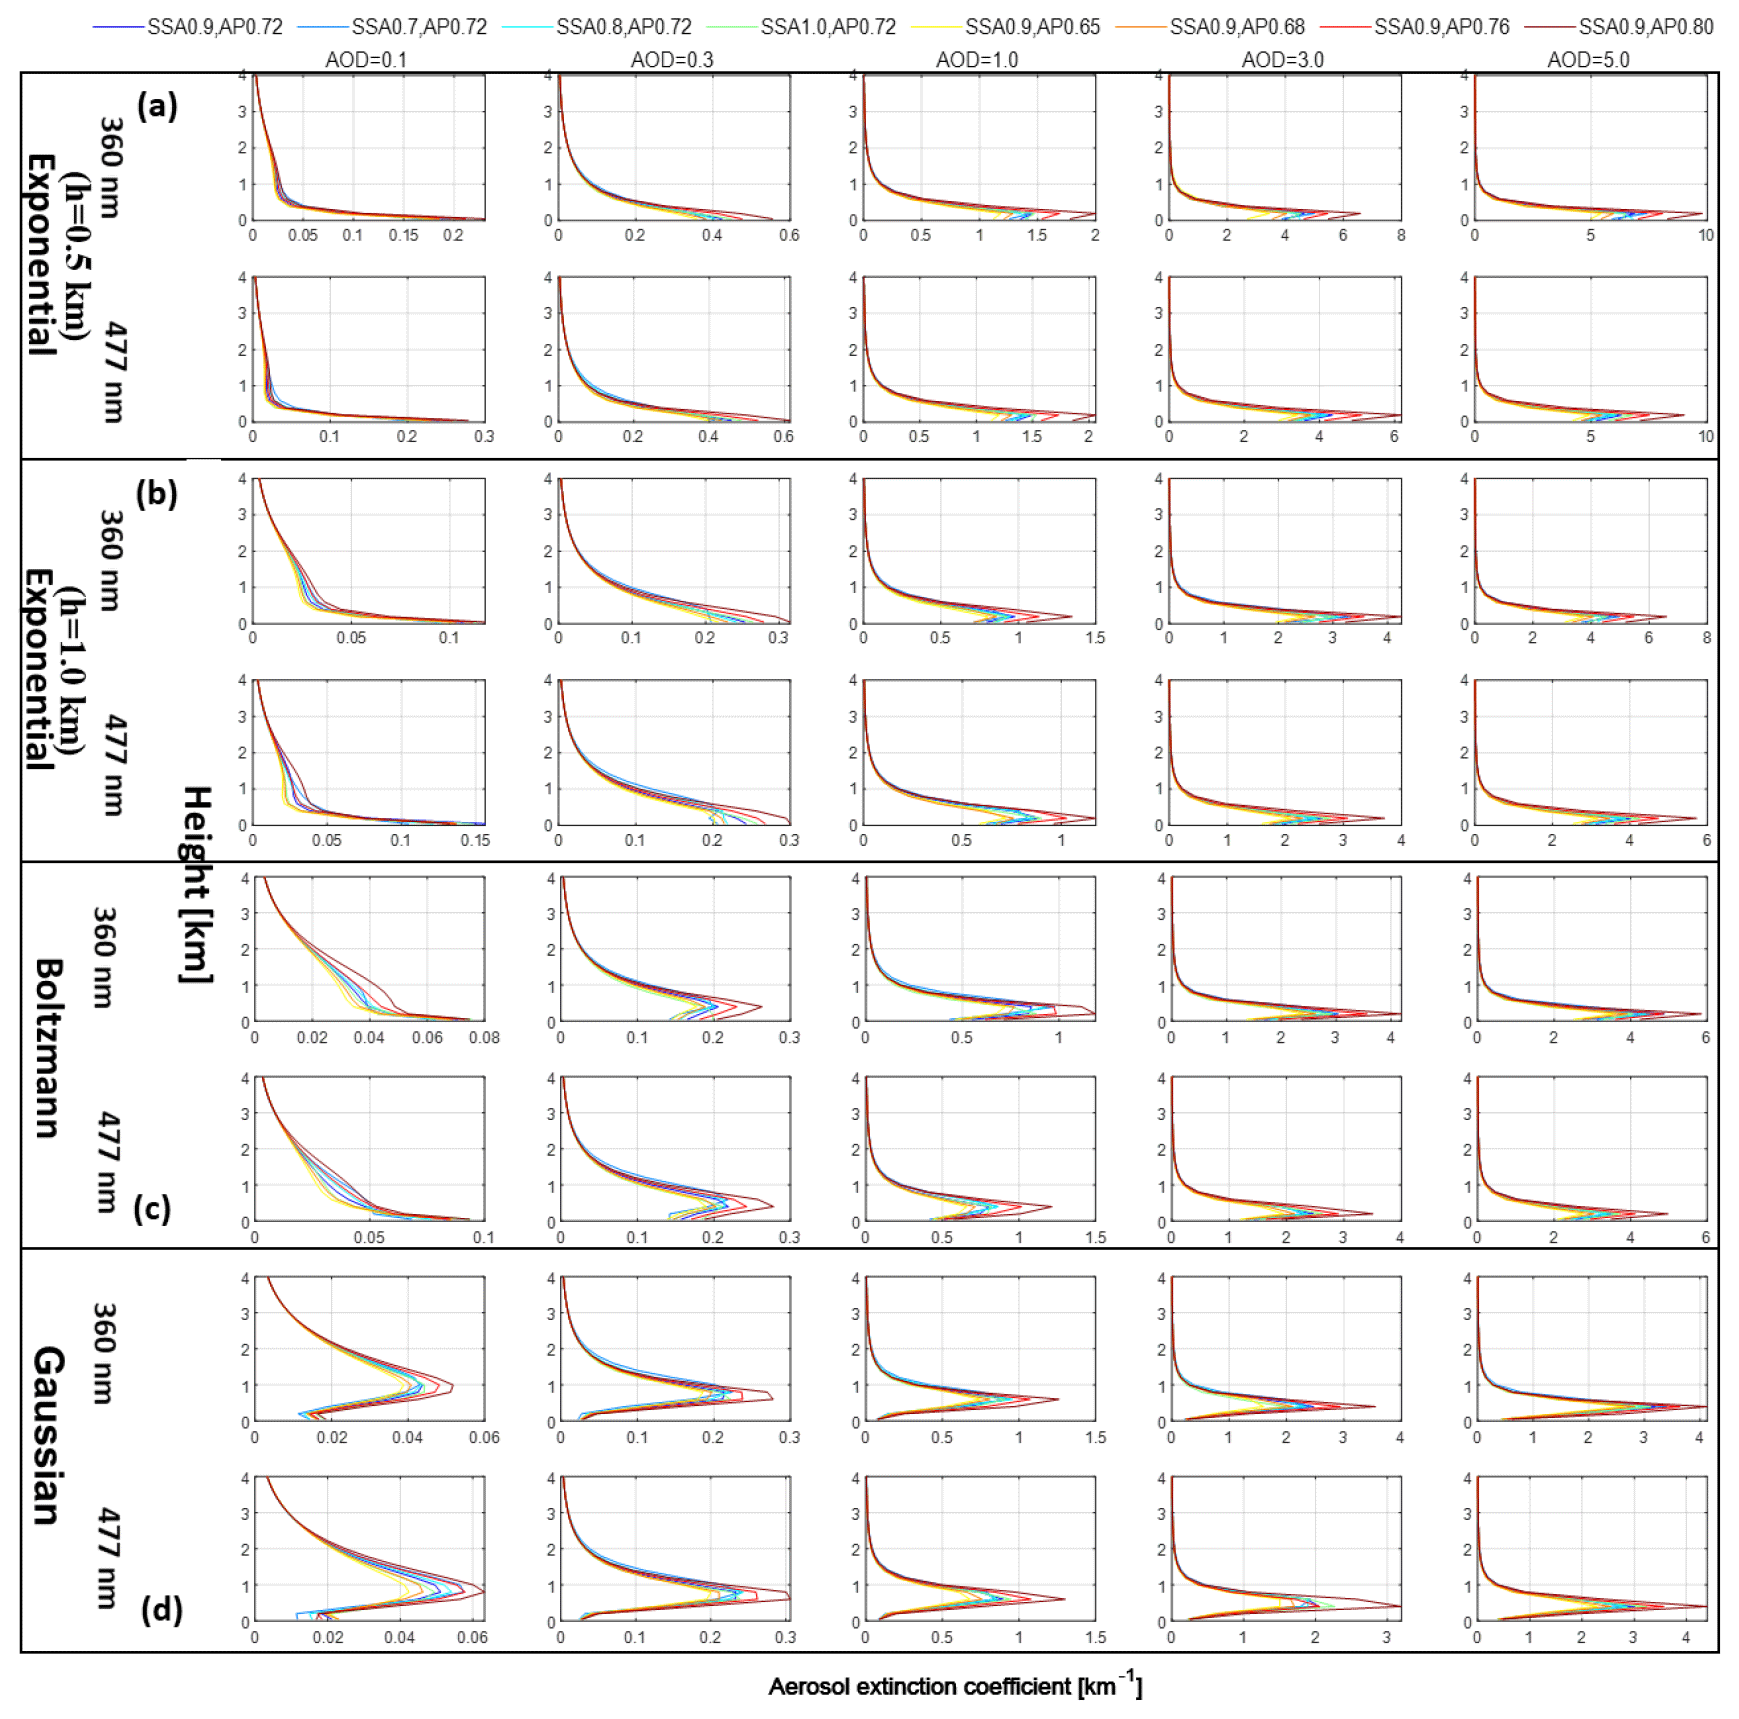
Figure 10The retrieved profiles using incorrect SSA and AP values from the retrieved profiles with the correct SSA and AP values for (a) exponential shape with h = 0.5 km, (b) exponential shape with h = 1.0 km, (c) Boltzmann shape, and (d) Gaussian shape. The colors refer to the SSA and AP values shown at the top.

Figure 11Retrieved NO2 profiles by PriAM and MAPA for scenario S1 (see text) for aerosol profiles with three selected AODs (0.3, 1.0, and 3.0) and five NO2 VCDs for of (a) exponential shape with h = 0.5 km, (b) exponential shape with h = 1.0 km, (c) Boltzmann shape, and (d) Gaussian shape. The solid and dotted colored lines refer to the AODs and algorithms shown at the top.
In the real atmosphere, the profiles of aerosols and NO2 are often quite different. Therefore, the effect of four typical aerosol profile shapes on the retrieval of Boltzmann NO2 profiles by PriAM and MAPA using S1 with three AODs (0.3, 1.0, and 3.0) and five VCD values was further studied. The results showed that the relative and absolute deviations (Figs. S22 and S23) between the Boltzmann NO2 profiles retrieved for the four aerosol profile shapes and the input NO2 profiles were basically the same, which means that the influence of the aerosol profile shapes on the retrieval of the NO2 profiles is small.
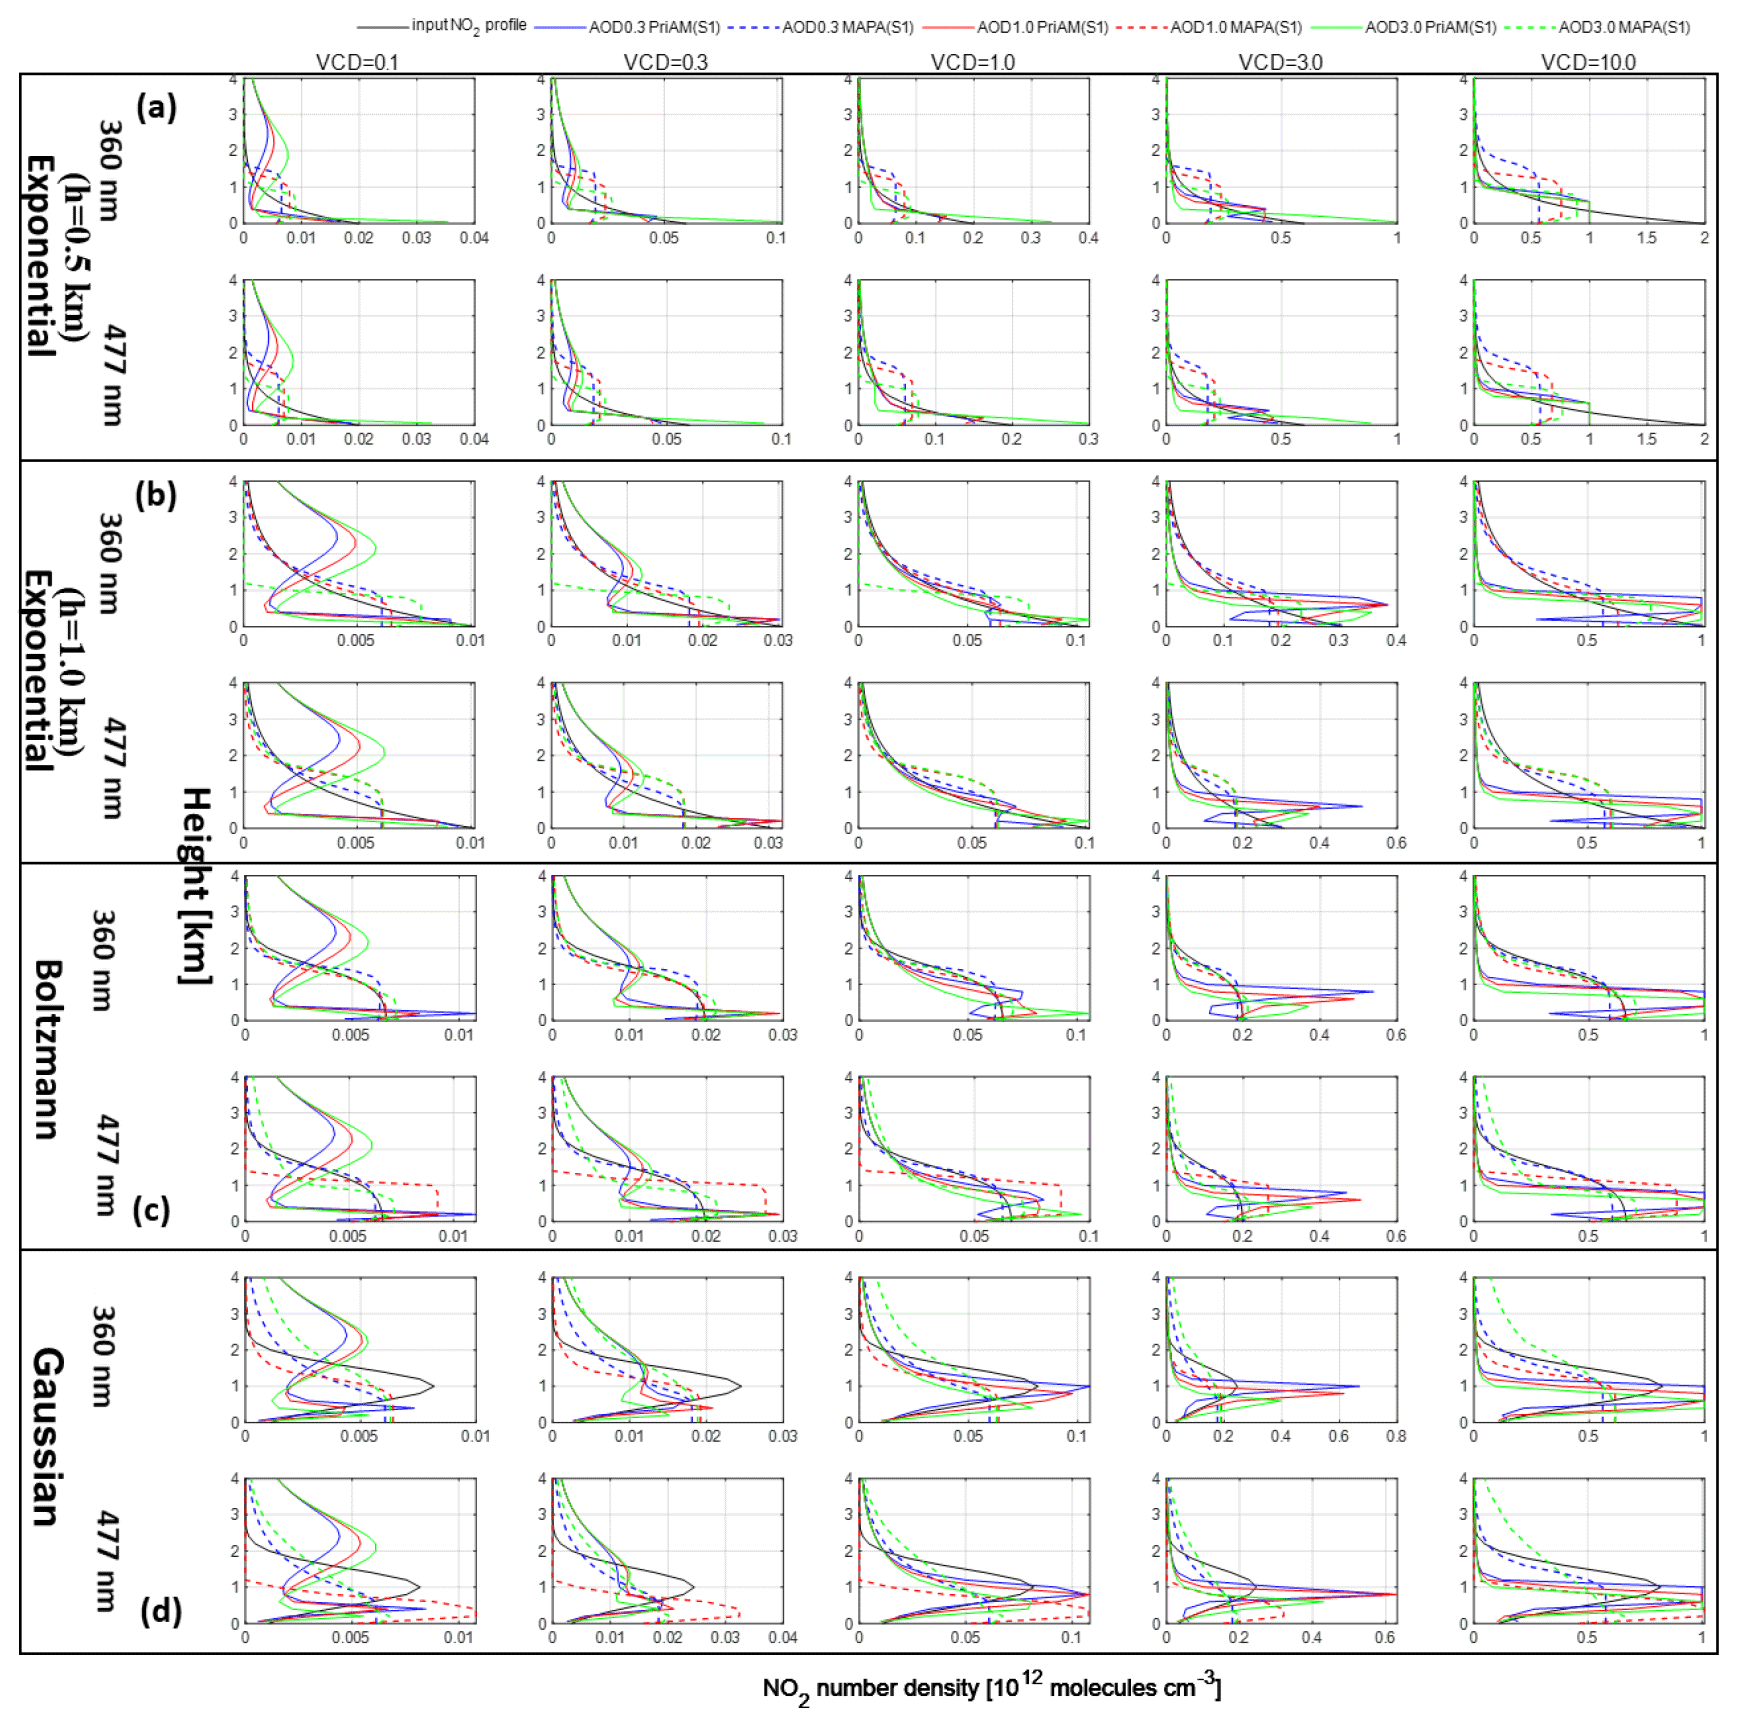
Figure 12Retrieved NO2 profiles by PriAM and MAPA for Boltzmann NO2 input profiles for scenario S1 (see text) and for three aerosol profile shapes (a exponential shape with h = 0.5 km, b exponential shape with h = 1.0 km, c Boltzmann shape, and d Gaussian shape) with three selected AODs (0.3, 1.0, and 3.0) and five NO2 VCDs. The solid and dotted colored lines refer to the AODs and algorithms shown at the top.
The NO2 profiles for the five VCDs retrieved for scenarios S1 and S2 by PriAM were further compared with the input NO2 profiles for the four AOD conditions (0.3, 1.0, 3.0, and 5.0) (Fig. 13). The magnitude of the absolute deviations between the retrieved NO2 profiles using S1 and the input values was smaller than for scenario S2, mainly because the retrieved scale heights for the S1 inversions were closer to the input scale height (Fig. S25 in the Supplement). An interesting phenomenon was the occurrence of some singular values (outliers which deviate from the true values in some layers) in the upper layers of the retrieved profiles for low NO2 VCDs (mainly for NO2 VCD < 1 × 10¹⁶ molecules cm−2). The NO2 profiles retrieved for scenario S1 were more stable than the profiles for scenario S2, with fewer singular values. When the AOD was large but the NO2 VCD was small, the magnitude of the absolute deviations of the NO2 number density at high altitudes was rather large, mainly because the lack of upper-level information for the NO2 profiles made the inversion results more dependent on the a priori profile. When the VCD increased, although the box air mass factor (AMF) at high altitudes was small, the NO2 number density at high altitudes also contributed to the SCDs due to the high NO2 VCD. Thus, when the AOD was large, the value at high altitudes of the NO2 profile can be better retrieved for increased NO2 VCDs.
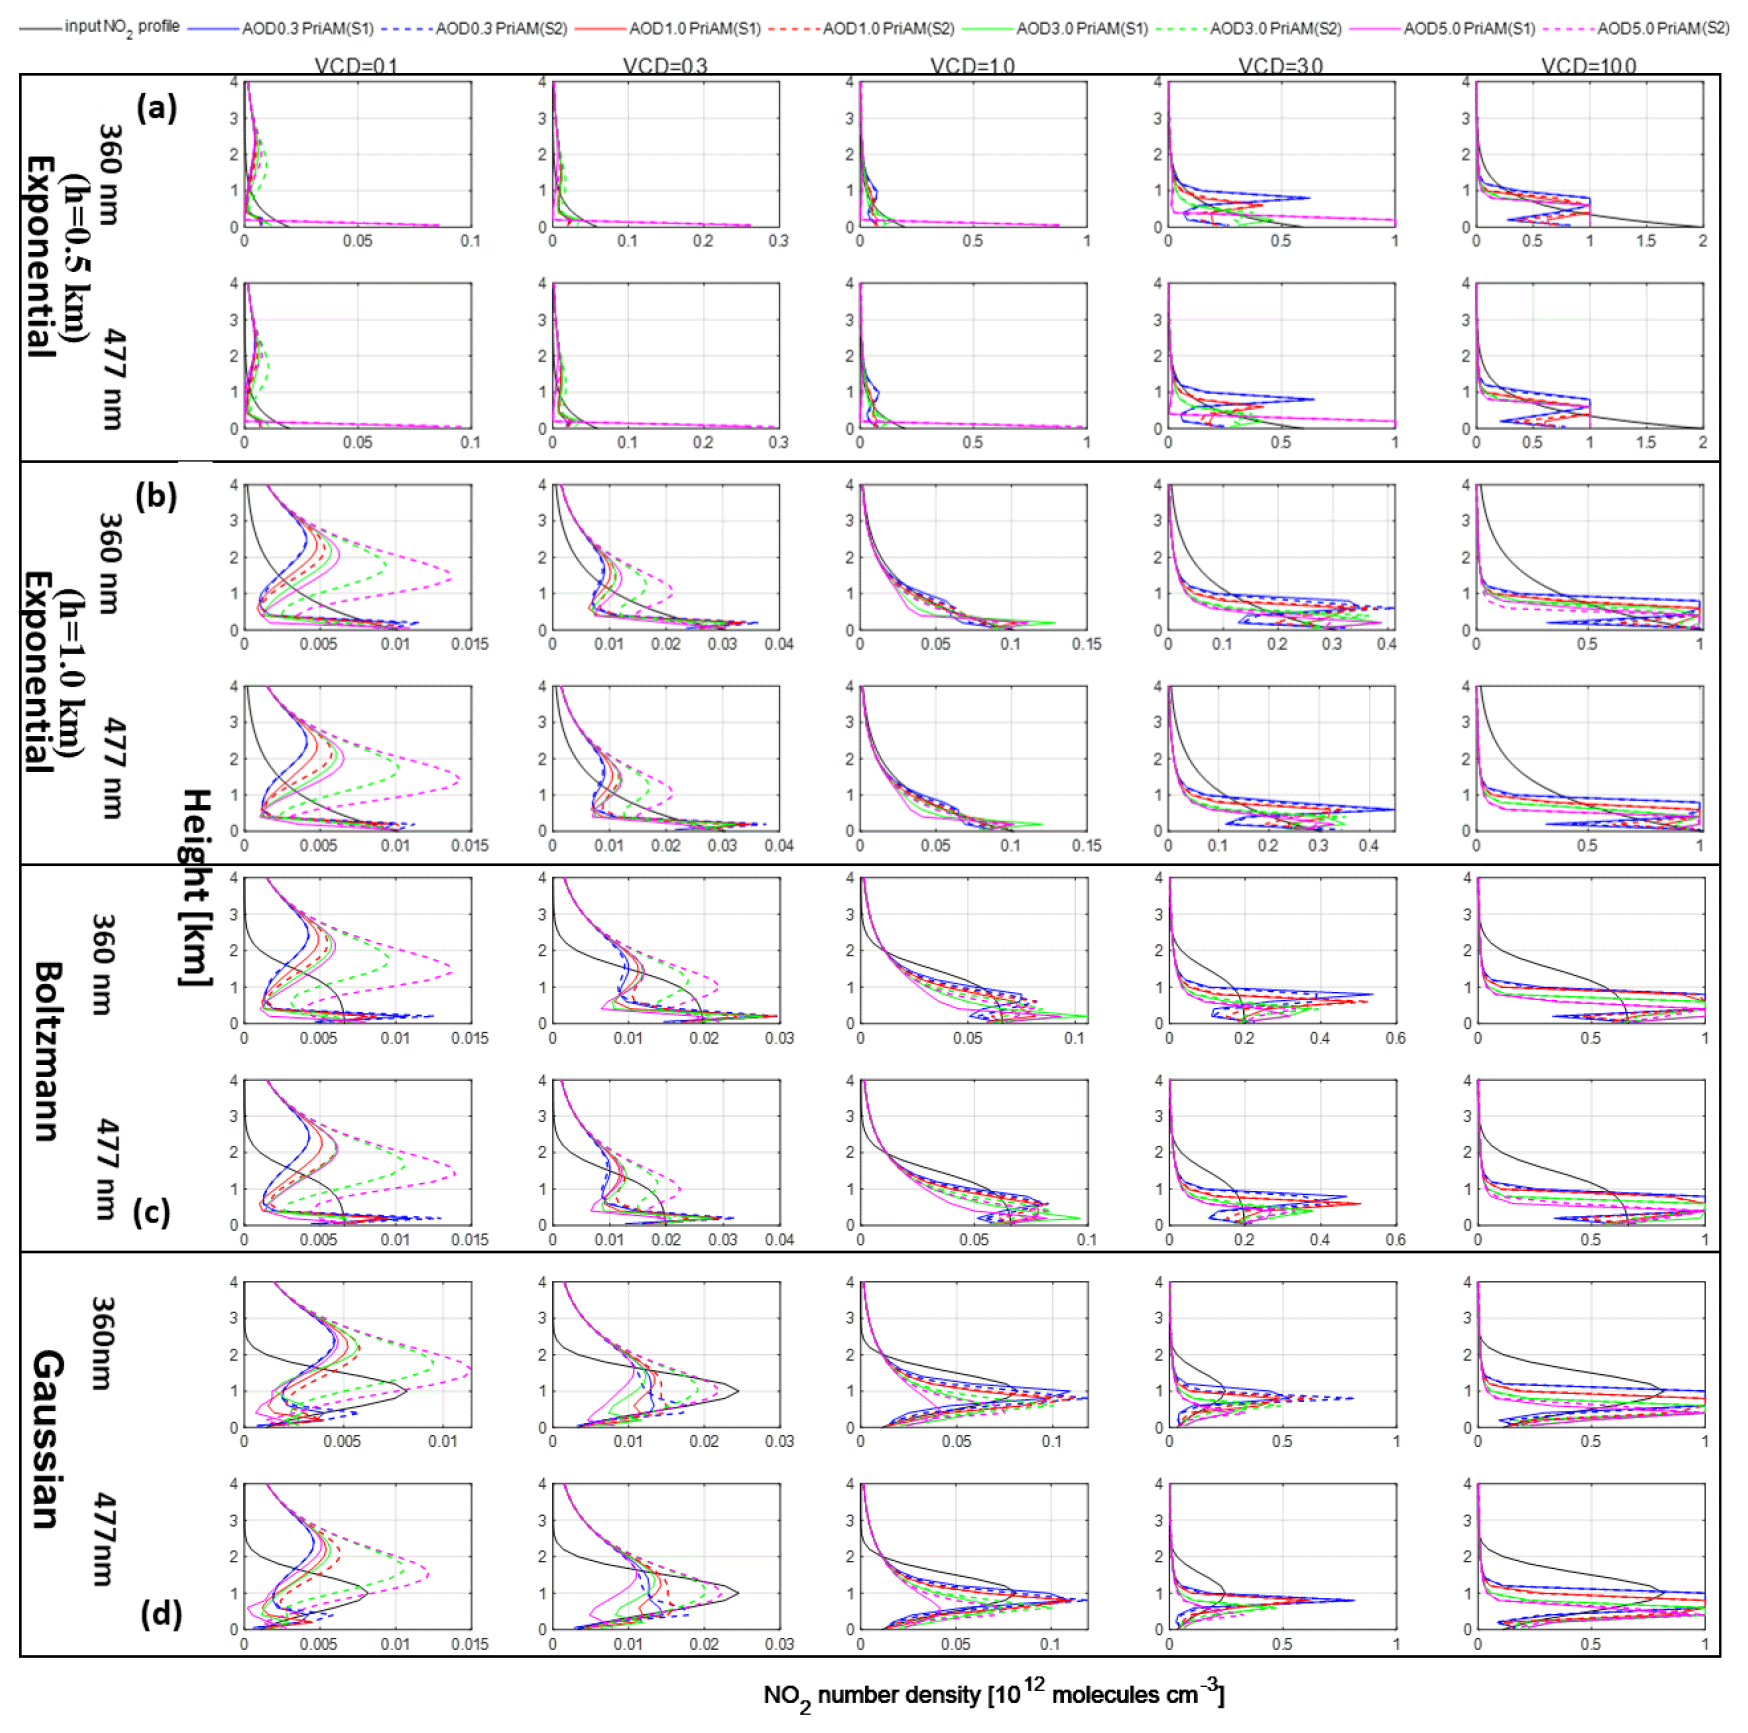
Figure 13Retrieved NO2 profiles by PriAM for scenarios S1 and S2 and input NO2 profiles for four AODs (0.3, 1.0, 3.0, and 5.0) and five VCDs for (a) exponential shape with h = 0.5 km, (b) exponential shape with h = 1.0 km, (c) Boltzmann shape, and (d) Gaussian shape. The first line in each panel denotes the results for 360 nm, and the second line denotes the results for 477 nm. The solid and dotted colored lines refer to the AODs and strategies shown at the top.
The smaller the covariance matrix of the a priori profile (Sa), the more the retrieved profile depends on the a priori profile, which determines the degree to which the retrieved profile deviates from the a priori profile. As the standard value of the Sa diagonal elements for retrieval of NO2 profiles, we used the square of 50 % of the a priori profile. And an a priori profile of exponential shape is used for the NO2 retrieval (shown in Fig. 14), which may cause the great difference between the retrieved and input NO2 profile, especially for the Gaussian and Boltzmann NO2 profiles. In order to reduce the occurrence of single outliers in the upper layer of the NO2 profile, the Sa was reduced, thus making the retrieved profile more dependent on the a priori profile. The effect of the Sa reduction on the retrieval of the four NO2 profile types was examined for AODs of 0.3 and 5.0 (Fig. 15). The Sa reduction increased the stability of the NO2 profile retrievals for low NO2 VCDs while simultaneously increasing the retrieved scale height. The increase of Sa for high AOD conditions did not improve the inversion results but instead increased the occurrence of single outliers. For low NO2 VCDs, the overestimation of the NO2 profile above 2.0 km can be explained by the higher values of the a priori profile at the upper layers because when the AOD is large, the information content for the NO2 distribution at upper layers is very sparse, and the inversion results mainly depend on the a priori profile.
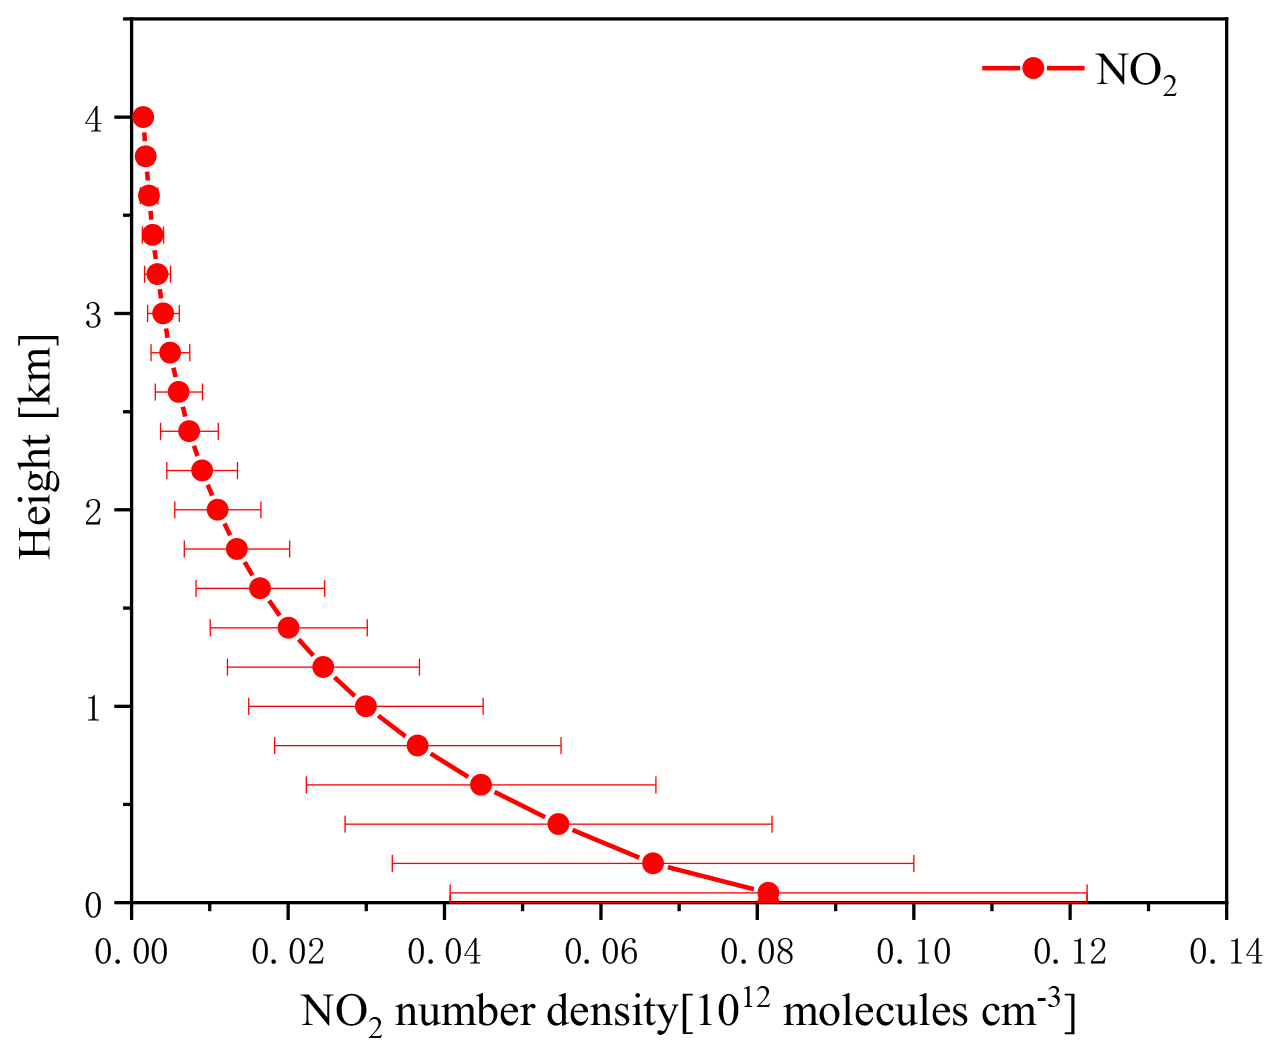
Figure 14The a priori NO2 profiles used by PriAM for the NO2 retrieval in this study. The error bars represent the a priori uncertainty.
We also investigated the retrieval results if exactly the a priori profiles were used as input profiles. The results are presented in Fig. 16. In contrast to the aerosol inversion, here for some scenarios, substantial differences are found, which in general increase with increasing NO2 VCD and AOD. The smallest deviations are found for exponential and Boltzmann profiles, whereas for Gaussian profiles, larger differences are found. The magnitude of the relative deviation increases from 20 % to 50 %, with the NO2 VCD increasing from 1 × 10¹⁴ to 10 × 1016 molecules cm−2 (Fig. S28). It is important to note that the relative deviations for the retrieved NO2 profile using both the aerosol and NO2 a priori profiles as input profiles are less than those if only the aerosol a priori profile is used as the input profile (PriAM by S2). This finding also provides guidance for gas inversions in the real atmosphere; if the aerosol and gas profiles can be provided as the a priori profile by other monitoring techniques, the inversion results of MAX-DOAS will be more accurate.

Figure 15Retrieved NO2 profiles by PriAM for Sa of 0.1 and 0.5 and AOD of 0.3 and 5.0, along with the input NO2 profiles for (a) exponential shape with h = 0.5 km, (b) exponential shape with h = 1.0 km, (c) Boltzmann shape, and (d) Gaussian shape. The first line in each panel denotes the results for 360 nm, and the second line denotes the results for 477 nm. The solid and dotted colored lines refer to the AODs and Sa shown at the top.
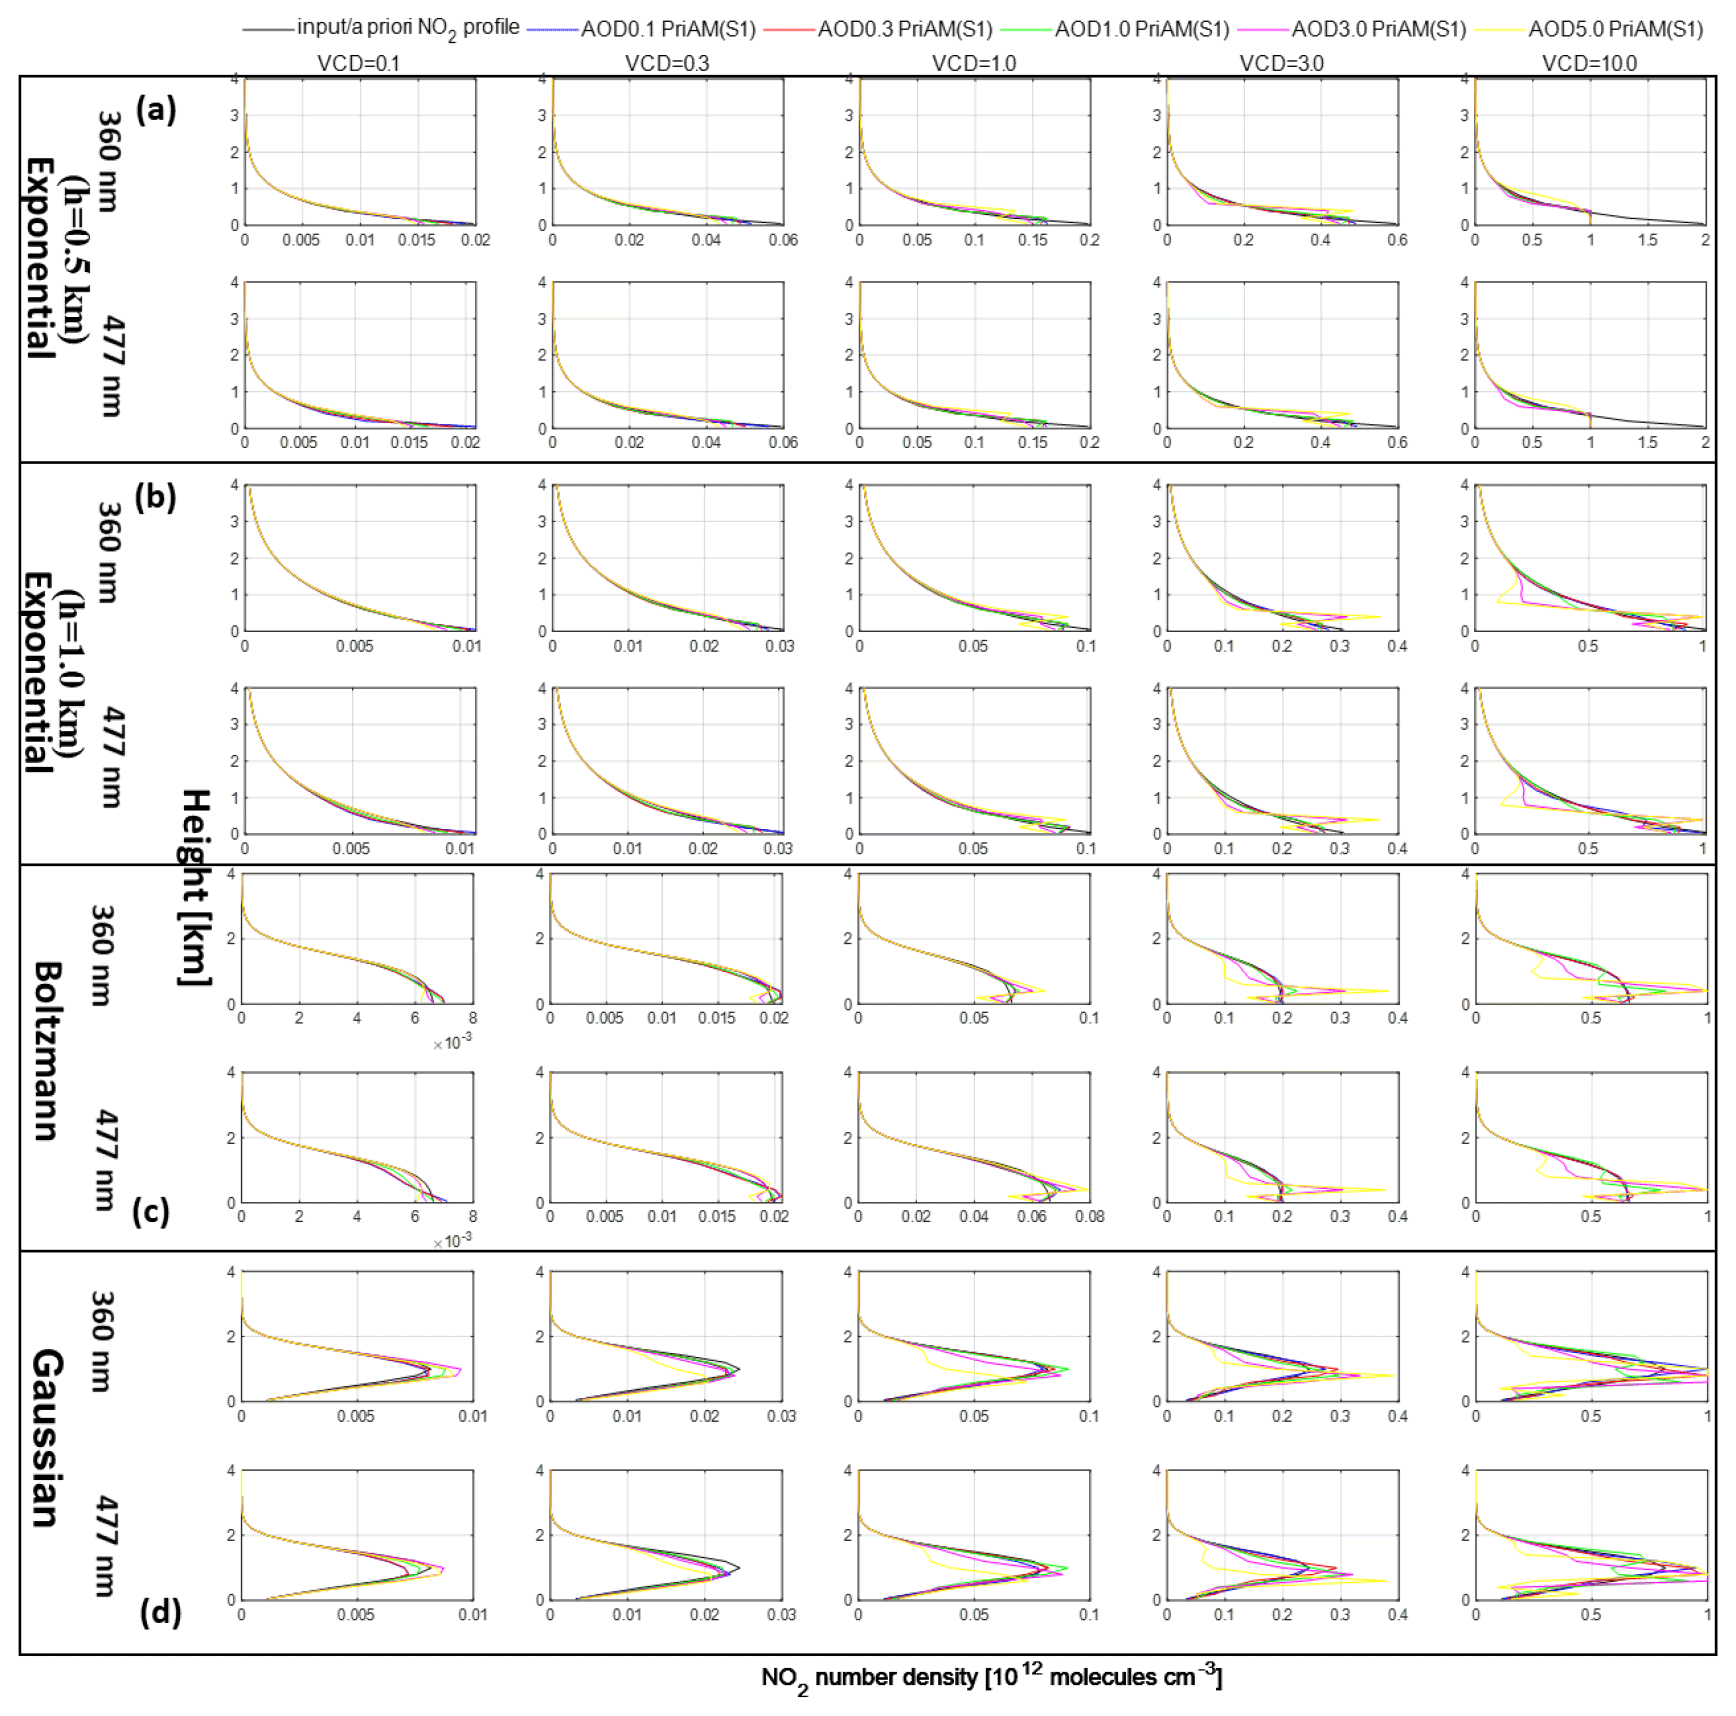
Figure 16Retrieved NO2 profiles by PriAM if exactly the a priori profiles for aerosols and NO2 are used as input profiles (for scenario S1; see text) for aerosol profiles with five AODs (0.1, 0.3, 1.0, 3.0, and 5.0) and five NO2 VCDs for of (a) exponential shape with h = 0.5 km, (b) exponential shape with h = 1.0 km, (c) Boltzmann shape, and (d) Gaussian shape. The solid colored lines refer to the AODs and algorithms shown at the top.
3.2.2 Comparison of the retrieved NO2 DSCD by PriAM and MAPA and the input NO2 DSCD for scenario (S1)
The NO2 DSCDs retrieved by PriAM and MAPA for scenario S1 were compared with the input NO2 DSCDs for four AOD scenarios and five VCDs, as shown in Fig. 17. The correlations between the NO2 DSCDs retrieved by PriAM and the input values were similar, and for both algorithms, values very close to 1.0 were found. Also for the slopes, values close to 1.0 were found.

Figure 17Correlation plots between the retrieved NO2 DSCDs by PriAM and MAPA versus the input NO2 DSCDs for three AOD scenarios and five VCDs for scenario S1. The colors refer to the VCD values and algorithms shown at the top.
3.2.3 Comparison of the NO2 VCDs retrieved by PriAM and MAPA
The NO2 VCDs retrieved by PriAM and MAPA were compared with the input NO2 VCDs for three AOD scenarios and five VCDs, as shown in Fig. 18. The NO2 VCDs were retrieved for PriAM for scenarios S1 and S2 and for MAPA for scenario S1. The VCDs retrieved by MAPA were closer to the input VCDs than those retrieved by PriAM. The retrievals of NO2 VCDs by MAPA and PriAM were only slightly affected by the AOD. However, especially for PriAM, a strong and systematic dependence of the relative deviations on the NO2 VCD was found for all profile shapes. While for small NO2 VCDs the retrieved VCDs systematically overestimate the true NO2 VCDs (by up to 60 % for PriAM), for large NO2 VCDs a systematic underestimation is observed (up to −20 %). For Gaussian and Boltzmann profiles, the deviations are larger than for the exponential profiles. The best agreement is found for NO2 VCDs around 1 × 10¹⁶ molecules cm−2. Here it should, however, be noted that while for low NO2 VCDs the magnitude of the relative deviations is large, the magnitude of the absolute deviations is rather small.
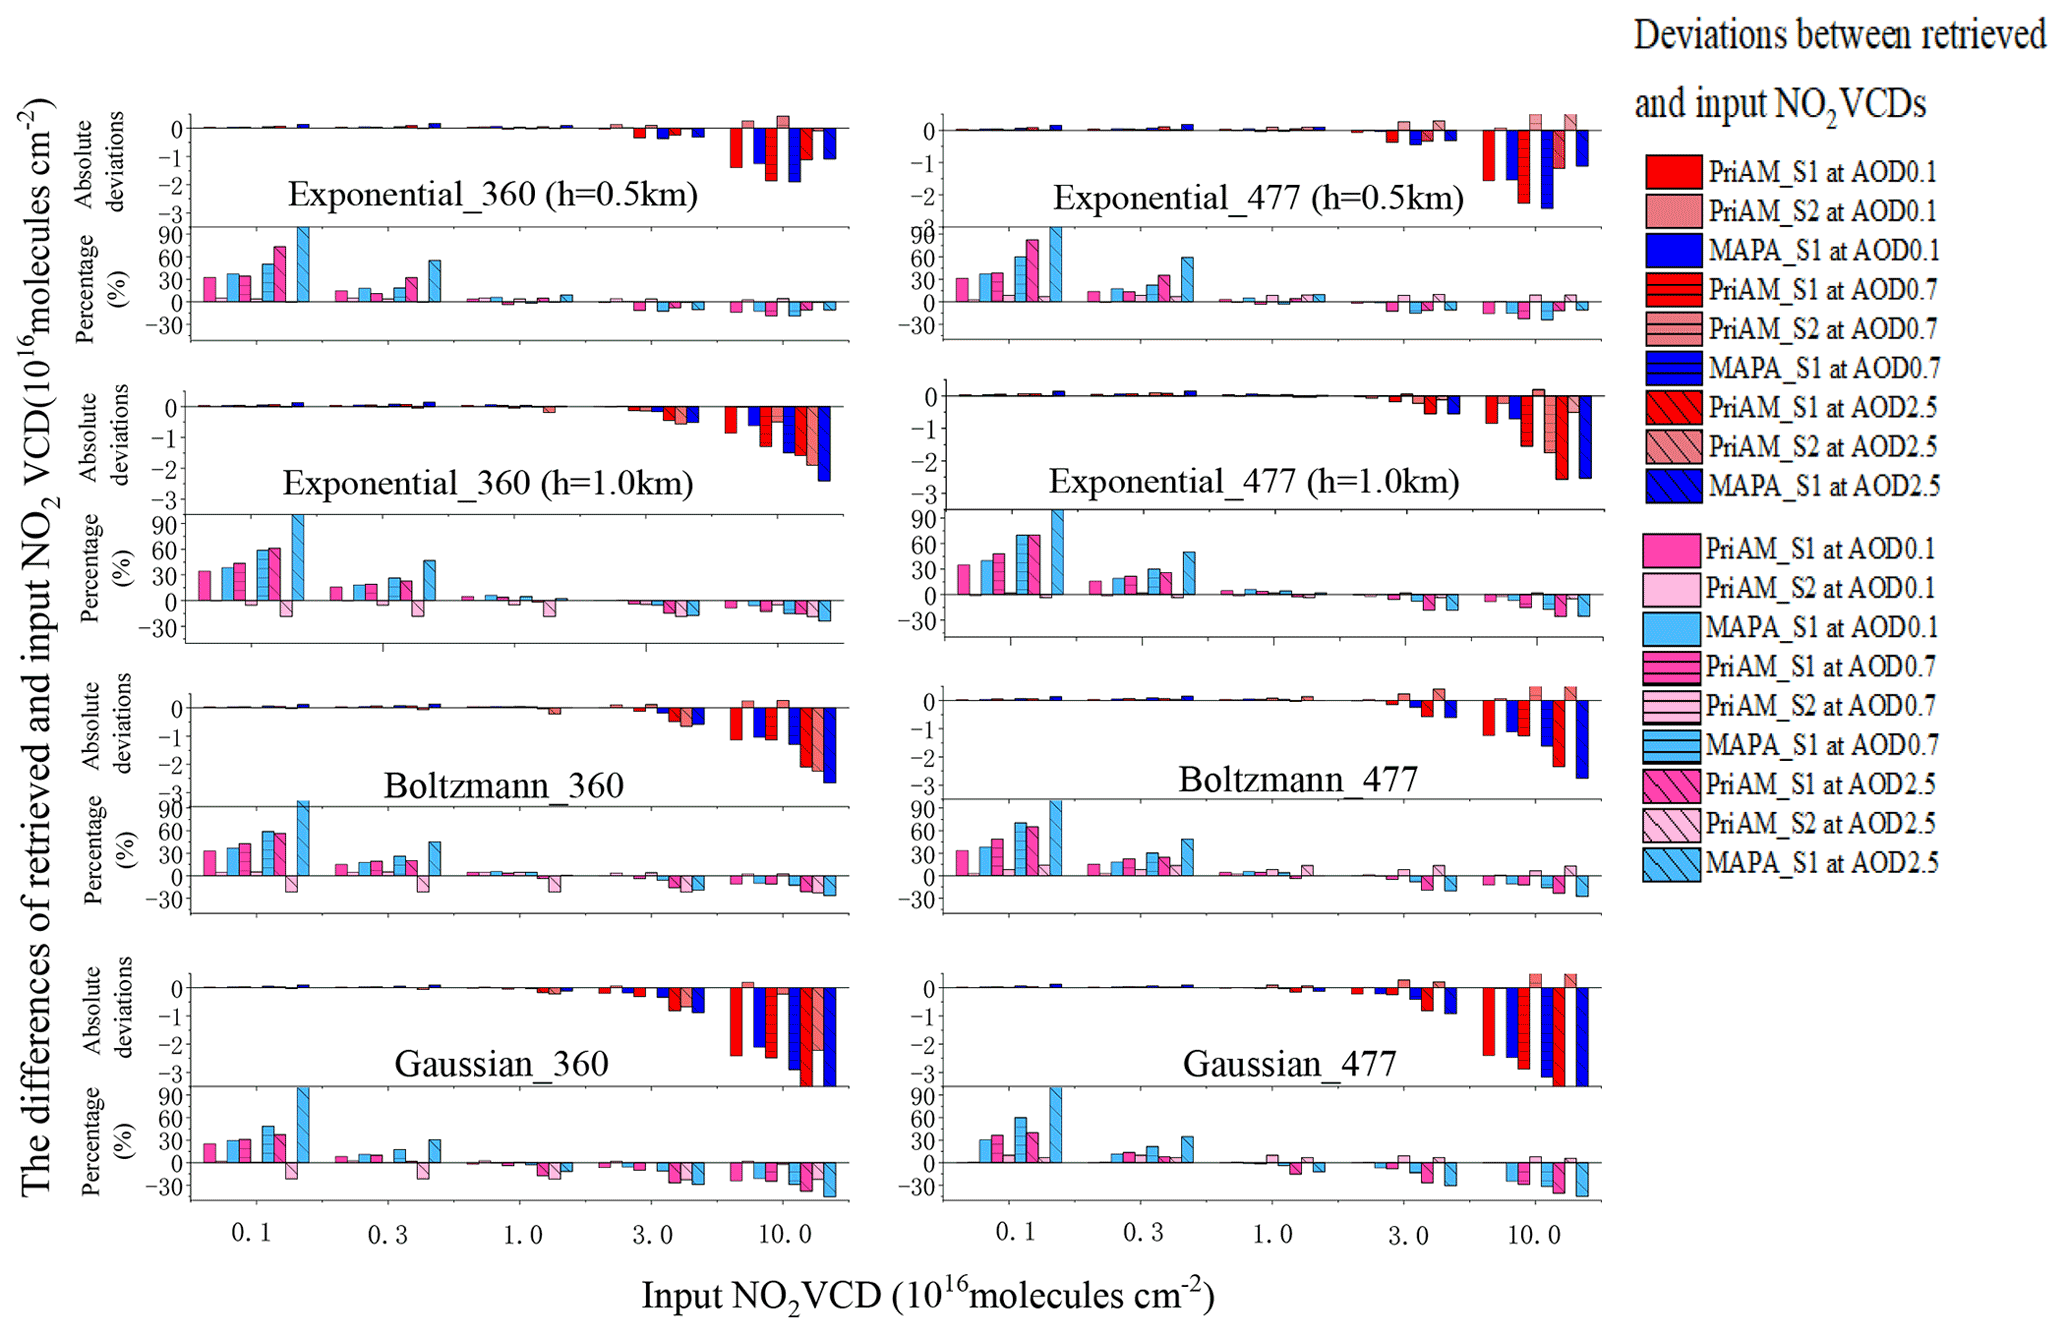
Figure 18Absolute and relative deviations between the retrieved and input NO2 VCDs for PriAM (S1 and S2) and MAPA (S1) for three AOD scenarios and five VCDs. The colors and shapes refer to the deviations of the retrieved and input NO2 VCDs of the different algorithms at different AODs shown on the right.
3.3 Discussion
In this section we discuss the most important findings of our investigations and compare them to the results from earlier studies. In particular Bösch et al. (2018) and Frieß et al. (2019) investigated the sensitivity of the MAX-DOAS inversion results using synthetic data. But compared to this study, they used fewer scenario profile shapes (Bösch et al., 2018), or they restricted their investigations to a set of profiles with fixed combinations of shapes and vertically integrated quantities (VCDs and AOD). Most importantly, in this study, we cover a larger range of VCDs and AODs, including especially high values (AODs up to 5 and NO2 VCDs up to 1016 molecules cm−2), while previous studies used maximum NO2 VCDs of 2 × 10¹⁶ and 3.5 × 10¹⁶ molecules cm−2, respectively and maximum AODs of 1. Also our study investigates the trace gas retrievals for a minimum NO2 VCD of 0.1 × 10¹⁶ molecules cm−2. Using these wide ranges of VCDs and AODs revealed new effects and/or confirmed earlier findings in more detail. The most important findings are given as follows.
-
With increasing AOD, the retrieved AODs systematically underestimate the true AODs. The underestimation reaches values of > 40 % and > 50 % for AODs of 3 and 5, respectively. The largest underestimation is found for Gaussian profiles, while for exponential profiles with a scale height of 0.5 km, the smallest underestimation is found. These results confirm results from previous studies with similar findings (e.g., Irie et al., 2008a; Bösch et al., 2018; Frieß et al., 2019; Tirpitz et al., 2021). However, in this study, the range of AODs and the variety of profile shapes are much larger, which allows for a more detailed interpretation of the results. Interestingly, the underestimation is systematically smaller for MAPA compared to PriAM, which indicates that only a part of the underestimation can be attributed to the missing sensitivity of MAX-DOAS measurements towards higher altitudes. In most cases, the larger effect for optical estimation (OE) algorithms is probably due to the smoothing effect.
-
Another important finding of this study is that the NO2 profiles are not very sensitive to the aerosol profiles, confirming similar findings by Frieß et al. (2019).
-
Further, it was found that the influence of the assumed asymmetry parameter and single scattering albedo typically has a minor effect on the retrieval results. This is an important result because usually the optical properties of aerosols are not well known. However, for aerosol inversions, the errors can still be up to 25 %. Thus it is still important to use reasonable values for both parameters to minimize the remaining uncertainties. For the NO2 inversion the influence of the asymmetry parameter and single scattering albedo is smaller, similar to that found by Hong et al. (2017).
-
Another important finding of this study is that the NO2 VCDs either systematically overestimate (for low NO2 VCDs) or underestimate (for high NO2 VCDs) the true NO2 VCDs. Interestingly, these results are rather insensitive to the shape or the AOD of the respective aerosol profiles. The underestimation for high NO2 VCDs is a new finding which has not been reported so far. It is probably caused by nonlinearities in the radiative transport for strong NO2 absorptions. It can reach deviations of more than −30 % for an NO2 VCD of 1016 molecules cm−2. A tendency of an overestimation for small NO2 VCDs was already observed (for OE algorithms) by Frieß et al. (2019) but not discussed in detail. Our results clearly indicate that the overestimation systematically increases towards small NO2 VCDs (with deviations > 50 % for an NO2 VCD of 0.1 × 10¹⁶ molecules cm−2). Here it is interesting to note that similar results are found for different profile shapes. This finding is probably caused by the fact that the trace gas VCD is mostly constrained by measurements at high elevation angles and the fact that the trace gas SCDs for these elevation angles only weakly depend on the profile shape.
Overall, the reason for the underestimation of the retrieved NO2 VCD for low NO2 VCDs is not yet fully understood. However, for the OE algorithm it might be caused by the influence of the a priori profile on the retrieval result. Interestingly, in this study a similar underestimation was also found for the parameterized algorithm (which was not observed by Frieß et al., 2019). This finding is currently unexplained but might be caused by the different radiative transfer models used for the generation of the synthetic data (SCIATRAN) and in the MAPA inversion algorithm (McArtim). This aspect should be further investigated in future studies.
Interestingly, an overestimation of the true NO2 VCDs (derived from direct sun observations) by the retrieved NO2 VCDs from MAX-DOAS observations was also reported by Tirpitz et al. (2021) for low NO2 VCDs (but not for HCHO VCDs).
-
Another important finding of our investigations confirms the results from earlier studies (e.g., Wang et al., 2017; Bösch et al., 2018). Changing the covariance matrix also changes the retrieval results from the OE retrieval as it results in different weighting of a priori profile and measurements in the inversion.
Given that severe air pollution often occurs during autumn and winter in China, the effects of different aerosol conditions on the accuracy of MAX-DOAS profile retrieval were studied. The effects of aerosols on MAX-DOAS retrievals of aerosols and NO2 profiles were examined by assuming a series of aerosol scenarios with three aerosol profile shapes (exponential, Boltzmann, and Gaussian) with AODs and VCDs ranging from 0.1 to 5.0 at two wavelengths (360 and 477 nm). In addition, a series of NO2 scenarios was assumed with the same profile shapes and various VCD values (from 0.1 × 10¹⁶ to 10.0 × 10¹⁶ molecules cm−2). Compared to previous studies (e.g., Bösch et al., 2018; Frieß et al., 2019), our input profiles cover a much larger range of AODs and NO2 VCDs and also more profile shapes and more combinations between them.
In a first step, the effects of the assumed single scattering albedo (SSA) and asymmetric parameter (AP) on the aerosol profile inversion were investigated. It was found that the retrieved aerosol extinction profiles are very consistent if the same SSA and AP values are used for the simulations of the O4 DSCDs and the PriAM inversions. If incorrect SSA and AP values were used, the retrieved extinction coefficients were smaller than the input values in the case of too low of AP or too high SSA assumed in the profile inversion and vice versa (with opposite behavior for the surface values). However, for most cases, the deviations caused by wrongly assumed AP and SSA were found to be rather small compared to other uncertainties. The maximum relative deviation was generally found to be around 1.0 km, with values of about 25 %.
Next, the differences of the PriAM and MAPA profile retrievals from the input profiles for different aerosol conditions were examined. We found that both algorithms have systematic deficiencies in retrieving the four profile shapes. In particular at low (above 0.2 km) and high (above 1.5 km) altitudes, often deviations from the true values are found, while for altitudes in between, the best agreement is found. The algorithms can reasonably retrieve the four aerosol profile shapes of AODs < 1.0 for two wavelengths, but for AODs > 1.0, the retrieved values systematically underestimate the true AODs. The smallest magnitude of the relative deviations (typically < 20 %) was found for exponential profile shapes, with a scale height of 0.5 km. A large magnitude of the relative deviations (up to > 50 %) is found for the other profile shapes, especially for high AODs. Such a systematic underestimation has also been found in several previous studies (e.g., Irie et al., 2008a; Frieß et al., 2016; Bösch et al., 2018; and Tirpitz et al., 2021). The systematic deviation between MAX-DOAS and sun photometers is partly caused by the missing sensitivity of MAX-DOAS observations to higher altitudes and the smoothing effect, especially for optimal estimation algorithms (e.g., Tirpitz et al., 2021). In general, the relative deviations of the MAPA results depend less on the AOD than the PriAM results. For MAPA, part of the differences between input and retrieved AODs can be explained by the differences in the RTM model. It should also be noted that for the Gaussian profiles, both PriAM and MAPA could retrieve the lifted layer. However, PriAM underestimated the width of the lifted layer and the extinction coefficient at the peak, while MAPA overestimated the width of the lifted layer and significantly underestimated the aerosol extinctions at the peak.
Then, for PriAM, the effect of using different a priori profiles and a priori profile covariance matrices (Sa) was studied. The results showed that the retrieval results of the aerosol profiles were slightly improved when the same a priori profile shape as the input profile shape was used. The main reason is probably that the corresponding a priori bias was reduced. In addition, the inversion results were more consistent with the input profiles when the AOD of the a priori profile was increased for high AOD scenarios. The effect of the Sa value for the four aerosol shapes was investigated for the extreme scenario with an AOD of 5.0. It was found that the correlation coefficient could be improved by increasing the Sa values for all aerosol profile shapes, mainly because of improved values of the retrieved surface extinction and scale height.
Also the modeled O4 DSCDs corresponding to the aerosol profiles retrieved by PriAM and MAPA were compared to O4 DSCDs simulated by the RTM for the input aerosol profiles. The averaged correlation coefficients of the modeled and simulated O4 DSCDs were > 0.99 for both PriAM and MAPA, indicating that a possible non-convergence of the profile retrievals is not a reason for the systematic discrepancies of retrieved profiles from the input profiles.
In the next part, the effects of the aerosol retrieval on the NO2 profile retrieval were studied for PriAM and MAPA. Two strategies were utilized to retrieve the NO2 profiles, in which either the retrieved or the input aerosol profiles served as input for the retrievals of the NO2 profiles in strategy 1 (S1) and strategy 2 (S2), respectively. Strategy S1 was applied both to PriAM and MAPA, while strategy S2 was only applied to PriAM.
From these studies, several conclusions could be drawn: the relative deviations of the retrieved NO2 VCDs do only slightly depend on the AOD or the shape of the aerosol profiles. In contrast, especially for PriAM, a systematic dependence on the NO2 VCD was found. For low NO2 VCDs, the retrieved NO2 VCDs largely underestimate the true NO2 VCDs by up to 60 %, while for high NO2 VCDs a systematic underestimation up to −30 % is found. Here it should be noted that in spite of the large relative deviations for low NO2 VCDs, the absolute deviations are rather small. The underestimation of the true NO2 VCD for high NO2 VCDs by the retrieved profiles has not been reported before. It is probably caused by nonlinearities in the radiative transport for strong NO2 absorptions. The increase of the Sa values did not improve the inversion results for high AODs but instead led to the occurrence of single outliers in some layers.
We also performed a consistency check of the optimal estimation algorithm using exactly the a priori profiles as input profiles. For the aerosol retrieval, almost the exact input profiles were retrieved (differences < 0.05 %), indicating that there are no inconsistencies in the algorithm. However, for the trace gas profiles, no such perfect agreement was found, especially towards scenarios with high AODs and NO2 VCDs, indicating the more complex dependencies of trace gas retrievals compared to aerosol retrievals. Here it is important to note that the relative deviations for the retrieved NO2 profile using both the aerosol and NO2 a priori profiles as input profiles are smaller than those for scenarios for which only the aerosol a priori profile is used as input profile.
Finally it should be mentioned that the results of this study are very similar for both selected wavelengths (360 and 477 nm), indicating that the differences in the radiative transfer between both wavelengths have no strong effect on the MAX-DOAS profile retrievals.
Underlying research data are available upon request from the first author according to the reader's needs (xtian@aiofm.ac.cn).
The software packages and code for the SCIAMACHY radiative transfer model (SCIATRAN) can be downloaded at https://www.iup.uni-bremen.de/sciatran/ (Rozanov et al., 2014).
The supplement related to this article is available online at: https://doi.org/10.5194/acp-21-12867-2021-supplement.
XT, YW, SB, PX, and TW contributed to the design of the research. SB performed the MAPA profile inversions and calculated the input profiles. SD converted the O4 data format to the MAPA input data format. BR and XL processed the SCIATRAN data. XT performed the data analyses and wrote the manuscript. JX and AL supervised this study and provided suggestions for the manuscript. PX and YW revised the manuscript. TW and SB developed the manuscript.
The authors declare that they have no conflict of interest.
Publisher's note: Copernicus Publications remains neutral with regard to jurisdictional claims in published maps and institutional affiliations.
This study was supported by the National Natural Science Foundation of China (grant nos. 41530644, U19A2044, 41975037, and 4210050475), the Natural Science Foundation of Anhui Province (grant nos. 2008085QD183 and 2008085QD182), and the Open Fund of Key Laboratory of Environmental Optics and Technology, Chinese Academy of Sciences (grant no. 2005DP173065-2019-04).
This paper was edited by Jerome Brioude and reviewed by two anonymous referees.
Beirle, S., Dörner, S., Donner, S., Remmers, J., Wang, Y., and Wagner, T.: The Mainz profile algorithm (MAPA), Atmos. Meas. Tech., 12, 1785–1806, https://doi.org/10.5194/amt-12-1785-2019, 2019.
Boersma, K. F., Eskes, H. J., Richter, A., De Smedt, I., Lorente, A., Beirle, S., van Geffen, J. H. G. M., Zara, M., Peters, E., Van Roozendael, M., Wagner, T., Maasakkers, J. D., van der A, R. J., Nightingale, J., De Rudder, A., Irie, H., Pinardi, G., Lambert, J.-C., and Compernolle, S. C.: Improving algorithms and uncertainty estimates for satellite NO2 retrievals: results from the quality assurance for the essential climate variables (QA4ECV) project, Atmos. Meas. Tech., 11, 6651–6678, https://doi.org/10.5194/amt-11-6651-2018, 2018.
Bond, D. W., Zhang, R., Tie, X., Brasseur, G., Huffines, G., Orville, R. E., and Boccippio, D. J.: NOx production by lightning over the continental United States, J. Geophys. Res.-Atmos., 106, 27701–27710, 2001.
Bösch, T., Rozanov, V., Richter, A., Peters, E., Rozanov, A., Wittrock, F., Merlaud, A., Lampel, J., Schmitt, S., de Haij, M., Berkhout, S., Henzing, B., Apituley, A., den Hoed, M., Vonk, J., Tiefengraber, M., Müller, M., and Burrows, J. P.: BOREAS – a new MAX-DOAS profile retrieval algorithm for aerosols and trace gases, Atmos. Meas. Tech., 11, 6833–6859, https://doi.org/10.5194/amt-11-6833-2018, 2018.
Chan, K. L., Hartl, A., Lam, Y. F., Xie, P. H., Liu, W. Q., Cheung, H. M., Lampel, J., Pohler, D., Li, A., Xu, J., Zhou, H. J., Ning, Z., and Wenig, M. O.: Observations of tropospheric NO2 using ground based MAX-DOAS and OMI measurements during the Shanghai World Expo 2010, Atmos. Environ., 119, 41–58, 2015.
Clémer, K., Van Roozendael, M., Fayt, C., Hendrick, F., Hermans, C., Pinardi, G., Spurr, R., Wang, P., and De Mazière, M.: Multiple wavelength retrieval of tropospheric aerosol optical properties from MAXDOAS measurements in Beijing, Atmos. Meas. Tech., 3, 863–878, https://doi.org/10.5194/amt-3-863-2010, 2010.
De Smedt, I., Stavrakou, T., Hendrick, F., Danckaert, T., Vlemmix, T., Pinardi, G., Theys, N., Lerot, C., Gielen, C., Vigouroux, C., Hermans, C., Fayt, C., Veefkind, P., Müller, J.-F., and Van Roozendael, M.: Diurnal, seasonal and long-term variations of global formaldehyde columns inferred from combined OMI and GOME-2 observations, Atmos. Chem. Phys., 15, 12519–12545, https://doi.org/10.5194/acp-15-12519-2015, 2015.
Deutschmann, T., Beirle, S., Frieß, U., Grzegorski, M., Kern, C., Kritten, L., Platt, U., Prados-Román, C., Pukite, J., Wagner, T., Bodo, W., and Pfeilsticker, K.: The Monte Carlo atmospheric radiative transfer model McArtim: Introduction and validation of Jacobians and 3D features, J. Quant. Spectrosc. Ra., 112, 1119–1137, 2011.
Drosoglou, T., Bais, A. F., Zyrichidou, I., Kouremeti, N., Poupkou, A., Liora, N., Giannaros, C., Koukouli, M. E., Balis, D., and Melas, D.: Comparisons of ground-based tropospheric NO2 MAX-DOAS measurements to satellite observations with the aid of an air quality model over the Thessaloniki area, Greece, Atmos. Chem. Phys., 17, 5829–5849, https://doi.org/10.5194/acp-17-5829-2017, 2017.
Feingold, G., Cotton, W. R., Kreidenweis, S. M., and Davis, J. T.: Impact of giant cloud condensation nuclei on drizzle formation in marine stratocumulus: Implications for cloud radiative properties, J. Atmos. Sci., 56, 4100–4117, 1999.
Friedrich, M. M., Rivera, C., Stremme, W., Ojeda, Z., Arellano, J., Bezanilla, A., García-Reynoso, J. A., and Grutter, M.: NO2 vertical profiles and column densities from MAX-DOAS measurements in Mexico City, Atmos. Meas. Tech., 12, 2545–2565, https://doi.org/10.5194/amt-12-2545-2019, 2019.
Frieß, U., Monks, P. S., Remedios, J. J., Rozanov, A., Sinreich, R., Wagner, T., and Platt, U.: MAX-DOAS O4 measurements: A new technique to derive information on atmospheric aerosols: 2. Modeling studies, J. Geophys. Res., 111, D14203, https://doi.org/10.1029/2005JD006618, 2006.
Frieß, U., Sihler, H., Sander, R., Pöhler, D., Yilmaz, S., and Platt, U.: The vertical distribution of BrO and aerosols in the Arctic: Measurements by active and passive differential optical absorption spectroscopy, J. Geophys. Res., 116, D00R04, https://doi.org/10.1029/2011JD015938, 2011.
Frieß, U., Klein Baltink, H., Beirle, S., Clémer, K., Hendrick, F., Henzing, B., Irie, H., de Leeuw, G., Li, A., Moerman, M. M., van Roozendael, M., Shaiganfar, R., Wagner, T., Wang, Y., Xie, P., Yilmaz, S., and Zieger, P.: Intercomparison of aerosol extinction profiles retrieved from MAX-DOAS measurements, Atmos. Meas. Tech., 9, 3205–3222, https://doi.org/10.5194/amt-9-3205-2016, 2016.
Frieß, U., Beirle, S., Bösch, T., Friedrich, M.M., Hendrick, F., Piters, A., Richter, A., van Roozendael, M., Spinei, E., Tirpitz, J.-L., Vlemmix, T., and Wagner, T.: Comparison of algorithms for the retrieval of aerosol and trace gas vertical profiles using synthetic MAX-DOAS Data, Results from the FRM4DOAS Project, presentation at the 2nd CINDI-2 Workshop, Mutters (Austria), 14–15 March 2018, available at: https://frm4doas.aeronomie.be/ProjectDir/2nd-CINDI2-WS/Friess_-_FRM4DOAS_Round_Robin.pdf (last access: 26 August 2021), 2018.
Frieß, U., Beirle, S., Alvarado Bonilla, L., Bösch, T., Friedrich, M. M., Hendrick, F., Piters, A., Richter, A., van Roozendael, M., Rozanov, V. V., Spinei, E., Tirpitz, J.-L., Vlemmix, T., Wagner, T., and Wang, Y.: Intercomparison of MAX-DOAS vertical profile retrieval algorithms: studies using synthetic data, Atmos. Meas. Tech., 12, 2155–2181, https://doi.org/10.5194/amt-12-2155-2019, 2019.
Gielen, C., Van Roozendael, M., Hendrick, F., Pinardi, G., Vlemmix, T., De Bock, V., De Backer, H., Fayt, C., Hermans, C., Gillotay, D., and Wang, P.: A simple and versatile cloud-screening method for MAX-DOAS retrievals, Atmos. Meas. Tech., 7, 3509–3527, https://doi.org/10.5194/amt-7-3509-2014, 2014.
Halla, J. D., Wagner, T., Beirle, S., Brook, J. R., Hayden, K. L., O'Brien, J. M., Ng, A., Majonis, D., Wenig, M. O., and McLaren, R.: Determination of tropospheric vertical columns of NO2 and aerosol optical properties in a rural setting using MAX-DOAS, Atmos. Chem. Phys., 11, 12475–12498, https://doi.org/10.5194/acp-11-12475-2011, 2011.
Hartl, A. and Wenig, M. O.: Regularisation model study for the least-squares retrieval of aerosol extinction time series from UV/VIS MAX-DOAS observations for a ground layer profile parameterisation, Atmos. Meas. Tech., 6, 1959–1980, https://doi.org/10.5194/amt-6-1959-2013, 2013.
Hay, T.: MAX-DOAS measurements of bromine explosion events in McMurdo Sound, Antarctica, PhD thesis, University of Canterbury, 2010.
Hendrick, F., Müller, J.-F., Clémer, K., Wang, P., De Mazière, M., Fayt, C., Gielen, C., Hermans, C., Ma, J. Z., Pinardi, G., Stavrakou, T., Vlemmix, T., and Van Roozendael, M.: Four years of ground-based MAX-DOAS observations of HONO and NO2 in the Beijing area, Atmos. Chem. Phys., 14, 765–781, https://doi.org/10.5194/acp-14-765-2014, 2014.
Holla, R.: Reactive Halogen Species above Salt Lakes and Salt Pans, PhD thesis, University of Heidelberg, 2013.
Hong, H., Lee, H., Kim, J., Jeong, U., Ryu, J., and Lee, D. S.: Investigation of Simultaneous Effects of Aerosol Properties and Aerosol Peak Height on the Air Mass Factors for Space-Borne NO2 Retrievals, Remote Sens.-Basel, 9, 208, https://doi.org/10.3390/rs9030208, 2017.
Hönninger, G. and Platt, U.: The role of BrO and its vertical distribution during surface ozone depletion at Alert, Atmos. Environ., 36, 2481–2489, 2002.
Hönninger, G., von Friedeburg, C., and Platt, U.: Multi axis differential optical absorption spectroscopy (MAX-DOAS), Atmos. Chem. Phys., 4, 231–254, https://doi.org/10.5194/acp-4-231-2004, 2004.
Hu, J. L., Wang, Y. G., Ying, Q., and Zhang, H. L.: Spatial and temporal variability of PM2.5 and PM10 over the North China Plain and the Yangtze River Delta, China, Atmos. Environ., 95, 598–609, 2014.
Huang, R. J., Zhang, Y. L., Bozzetti, C., Ho, K. F., Cao, J. J., Han, Y. M., Daellenbach, K. R., Slowik, J. G., Platt, S. M., Canonaco, F., Zotter, P., Wolf, R., Pieber, S. M., Bruns, E. A., Crippa, M., Ciarelli, G., Piazzalunga, A., Schwikowski, M., Abbaszade, G., Schnelle-Kreis, J., Zimmermann, R., An, Z. S., Szidat, S., Baltensperger, U., El Haddad, I., and Prevot, A. S. H.: High secondary aerosol contribution to particulate pollution during haze events in China, Nature, 514, 218–222, 2014.
IPCC: Climate change 2007: the physical science basis, Contribution of Working Group I to the Fourth Assessment Report of the Intergovernmental Panel on Climate Change, Cambridge University Press, Cambridge, UK and New York, NY, USA, 2007.
Irie, H., Kanaya, Y., Akimoto, H., Iwabuchi, H., Shimizu, A., and Aoki, K.: First retrieval of tropospheric aerosol profiles using MAX-DOAS and comparison with lidar and sky radiometer measurements, Atmos. Chem. Phys., 8, 341–350, https://doi.org/10.5194/acp-8-341-2008, 2008a.
Irie, H., Kanaya, Y., Akimoto, H., Tanimoto, H., Wang, Z., Gleason, J. F., and Bucsela, E. J.: Validation of OMI tropospheric NO2 column data using MAX-DOAS measurements deep inside the North China Plain in June 2006: Mount Tai Experiment 2006, Atmos. Chem. Phys., 8, 6577–6586, https://doi.org/10.5194/acp-8-6577-2008, 2008b.
Irie, H., Kanaya, Y., Akimoto, H., Iwabuchi, H., Shimizu, A., and Aoki, K.: Dual-wavelength aerosol vertical profile measurements by MAX-DOAS at Tsukuba, Japan, Atmos. Chem. Phys., 9, 2741–2749, https://doi.org/10.5194/acp-9-2741-2009, 2009.
Jin, J. L., Ma, J. Z., Lin, W. L., Zhao, H. R., Shaiganfar, R., Beirle, S., and Wagner, T.: MAX-DOAS measurements and satellite validation of tropospheric NO2 and SO2 vertical column densities at a rural site of North China, Atmos. Environ., 133, 12–25, 2016.
Kanaya, Y., Irie, H., Takashima, H., Iwabuchi, H., Akimoto, H., Sudo, K., Gu, M., Chong, J., Kim, Y. J., Lee, H., Li, A., Si, F., Xu, J., Xie, P.-H., Liu, W.-Q., Dzhola, A., Postylyakov, O., Ivanov, V., Grechko, E., Terpugova, S., and Panchenko, M.: Long-term MAX-DOAS network observations of NO2 in Russia and Asia (MADRAS) during the period 2007–2012: instrumentation, elucidation of climatology, and comparisons with OMI satellite observations and global model simulations, Atmos. Chem. Phys., 14, 7909–7927, https://doi.org/10.5194/acp-14-7909-2014, 2014.
Kreher, K., Van Roozendael, M., Hendrick, F., Apituley, A., Dimitropoulou, E., Frieß, U., Richter, A., Wagner, T., Lampel, J., Abuhassan, N., Ang, L., Anguas, M., Bais, A., Benavent, N., Bösch, T., Bognar, K., Borovski, A., Bruchkouski, I., Cede, A., Chan, K. L., Donner, S., Drosoglou, T., Fayt, C., Finkenzeller, H., Garcia-Nieto, D., Gielen, C., Gómez-Martín, L., Hao, N., Henzing, B., Herman, J. R., Hermans, C., Hoque, S., Irie, H., Jin, J., Johnston, P., Khayyam Butt, J., Khokhar, F., Koenig, T. K., Kuhn, J., Kumar, V., Liu, C., Ma, J., Merlaud, A., Mishra, A. K., Müller, M., Navarro-Comas, M., Ostendorf, M., Pazmino, A., Peters, E., Pinardi, G., Pinharanda, M., Piters, A., Platt, U., Postylyakov, O., Prados-Roman, C., Puentedura, O., Querel, R., Saiz-Lopez, A., Schönhardt, A., Schreier, S. F., Seyler, A., Sinha, V., Spinei, E., Strong, K., Tack, F., Tian, X., Tiefengraber, M., Tirpitz, J.-L., van Gent, J., Volkamer, R., Vrekoussis, M., Wang, S., Wang, Z., Wenig, M., Wittrock, F., Xie, P. H., Xu, J., Yela, M., Zhang, C., and Zhao, X.: Intercomparison of NO2, O4, O3 and HCHO slant column measurements by MAX-DOAS and zenith-sky UV–visible spectrometers during CINDI-2, Atmos. Meas. Tech., 13, 2169–2208, https://doi.org/10.5194/amt-13-2169-2020, 2020.
Li, X., Brauers, T., Shao, M., Garland, R. M., Wagner, T., Deutschmann, T., and Wahner, A.: MAX-DOAS measurements in southern China: retrieval of aerosol extinctions and validation using ground-based in-situ data, Atmos. Chem. Phys., 10, 2079–2089, https://doi.org/10.5194/acp-10-2079-2010, 2010.
Li, X., Brauers, T., Hofzumahaus, A., Lu, K., Li, Y. P., Shao, M., Wagner, T., and Wahner, A.: MAX-DOAS measurements of NO2, HCHO and CHOCHO at a rural site in Southern China, Atmos. Chem. Phys., 13, 2133–2151, https://doi.org/10.5194/acp-13-2133-2013, 2013.
Liu, F., van der A, R. J., Eskes, H., Ding, J., and Mijling, B.: Evaluation of modeling NO2 concentrations driven by satellite-derived and bottom-up emission inventories using in situ measurements over China, Atmos. Chem. Phys., 18, 4171–4186, https://doi.org/10.5194/acp-18-4171-2018, 2018.
Ma, J. Z., Beirle, S., Jin, J. L., Shaiganfar, R., Yan, P., and Wagner, T.: Tropospheric NO2 vertical column densities over Beijing: results of the first three years of ground-based MAX-DOAS measurements (2008–2011) and satellite validation, Atmos. Chem. Phys., 13, 1547–1567, https://doi.org/10.5194/acp-13-1547-2013, 2013.
Pinardi, G., Van Roozendael, M., Abuhassan, N., Adams, C., Cede, A., Clémer, K., Fayt, C., Frieß, U., Gil, M., Herman, J., Hermans, C., Hendrick, F., Irie, H., Merlaud, A., Navarro Comas, M., Peters, E., Piters, A. J. M., Puentedura, O., Richter, A., Schönhardt, A., Shaiganfar, R., Spinei, E., Strong, K., Takashima, H., Vrekoussis, M., Wagner, T., Wittrock, F., and Yilmaz, S.: MAX-DOAS formaldehyde slant column measurements during CINDI: intercomparison and analysis improvement, Atmos. Meas. Tech., 6, 167–185, https://doi.org/10.5194/amt-6-167-2013, 2013.
Platt, U. and Stutz, J.: Differential Optical Absorption Spectroscopy, Springer, Berlin, Heidelberg, https://doi.org/10.1007/978-3-540-75776-4, 2008.
Quinn, P. K., Coffman, D. J., Kapustin, V. N., Bates, T. S., and Covert, D. S.: Aerosol optical properties in the marine boundary layer during the First Aerosol Characterization Experiment (ACE 1) and the underlying chemical and physical aerosol properties, J. Geophys. Res.-Atmos., 103, 16547–16564, 1998.
Rodgers, C. D.: Inverse methods for atmospheric sounding, theory and practice, Series on Atmospheric, Oceanic and Planetary Physics, World Scientific, London, 2000.
Roscoe, H. K., Van Roozendael, M., Fayt, C., du Piesanie, A., Abuhassan, N., Adams, C., Akrami, M., Cede, A., Chong, J., Clémer, K., Friess, U., Gil Ojeda, M., Goutail, F., Graves, R., Griesfeller, A., Grossmann, K., Hemerijckx, G., Hendrick, F., Herman, J., Hermans, C., Irie, H., Johnston, P. V., Kanaya, Y., Kreher, K., Leigh, R., Merlaud, A., Mount, G. H., Navarro, M., Oetjen, H., Pazmino, A., Perez-Camacho, M., Peters, E., Pinardi, G., Puentedura, O., Richter, A., Schönhardt, A., Shaiganfar, R., Spinei, E., Strong, K., Takashima, H., Vlemmix, T., Vrekoussis, M., Wagner, T., Wittrock, F., Yela, M., Yilmaz, S., Boersma, F., Hains, J., Kroon, M., Piters, A., and Kim, Y. J.: Intercomparison of slant column measurements of NO2 and O4 by MAX-DOAS and zenith-sky UV and visible spectrometers, Atmos. Meas. Tech., 3, 1629–1646, https://doi.org/10.5194/amt-3-1629-2010, 2010.
Rozanov, A., Rozanov, V., Buchwitz, M., Kokhanovsky, A., and Burrows, J. P.: SCIATRAN 2.0 – A new radiative transfer model for geophysical applications in the 175–2400 nm spectral region, in: Atmospheric Remote Sensing: Earth's Surface, Troposphere, Stratosphere and Mesosphere – I, Adv. Space Res., 39, 1015–1019, 2005.
Rozanov, V. V., Rozanov, A. V., Kokhanovsky, A. A., and Burrows, J. P.: Radiative transfer through terrestrial atmosphere and ocean: Software package SCIATRAN, J. Quant. Spectrosc. Ra., 133, 13–71, 2014.
Seinfeld, J. H. and Pandis, S. N.: Atmospheric chemistry and physics: From air pollution to climate change, 2nd Edn., John Wiley and Sons, Hoboken, NJ, 2006.
Sheridan, P. J., Delene, D. J., and Ogren, J. A.: Four years of continuous surface aerosol measurements from the Department of Energy's Atmospheric Radiation Program Southern Great Plains Cloud and Radiation Testbed site, J. Geophys. Res., 106, 20735–20747, 2001.
Tian, X., Xie, P. H., Xu, J., Li, A., Wang, Y., Qin, M., and Hu, Z. K.: Long-term observations of tropospheric NO2, SO2 and HCHO by MAX-DOAS in Yangtze River Delta area, China, J. Environ. Sci., 71, 207–221, 2018.
Tirpitz, J.-L., Frieß, U., Hendrick, F., Alberti, C., Allaart, M., Apituley, A., Bais, A., Beirle, S., Berkhout, S., Bognar, K., Bösch, T., Bruchkouski, I., Cede, A., Chan, K. L., den Hoed, M., Donner, S., Drosoglou, T., Fayt, C., Friedrich, M. M., Frumau, A., Gast, L., Gielen, C., Gomez-Martín, L., Hao, N., Hensen, A., Henzing, B., Hermans, C., Jin, J., Kreher, K., Kuhn, J., Lampel, J., Li, A., Liu, C., Liu, H., Ma, J., Merlaud, A., Peters, E., Pinardi, G., Piters, A., Platt, U., Puentedura, O., Richter, A., Schmitt, S., Spinei, E., Stein Zweers, D., Strong, K., Swart, D., Tack, F., Tiefengraber, M., van der Hoff, R., van Roozendael, M., Vlemmix, T., Vonk, J., Wagner, T., Wang, Y., Wang, Z., Wenig, M., Wiegner, M., Wittrock, F., Xie, P., Xing, C., Xu, J., Yela, M., Zhang, C., and Zhao, X.: Intercomparison of MAX-DOAS vertical profile retrieval algorithms: studies on field data from the CINDI-2 campaign, Atmos. Meas. Tech., 14, 1–35, https://doi.org/10.5194/amt-14-1-2021, 2021.
Vlemmix, T., Piters, A. J. M., Berkhout, A. J. C., Gast, L. F. L., Wang, P., and Levelt, P. F.: Ability of the MAX-DOAS method to derive profile information for NO2: can the boundary layer and free troposphere be separated?, Atmos. Meas. Tech., 4, 2659–2684, https://doi.org/10.5194/amt-4-2659-2011, 2011.
Vlemmix, T., Hendrick, F., Pinardi, G., De Smedt, I., Fayt, C., Hermans, C., Piters, A., Wang, P., Levelt, P., and Van Roozendael, M.: MAX-DOAS observations of aerosols, formaldehyde and nitrogen dioxide in the Beijing area: comparison of two profile retrieval approaches, Atmos. Meas. Tech., 8, 941–963, https://doi.org/10.5194/amt-8-941-2015, 2015.
Wagner, T., Dix, B., von Friedeburg, C., Friess, U., Sanghavi, S., Sinreich, R., and Platt, U.: MAX-DOAS O4 measurements: A new technique to derive information on atmospheric aerosols–Principles and information content, J. Geophys. Res., 109, D22205, https://doi.org/10.1029/2004JD004904, 2004.
Wagner, T., Apituley, A., Beirle, S., Dörner, S., Friess, U., Remmers, J., and Shaiganfar, R.: Cloud detection and classification based on MAX-DOAS observations, Atmos. Meas. Tech., 7, 1289–1320, https://doi.org/10.5194/amt-7-1289-2014, 2014.
Wagner, T., Beirle, S., Remmers, J., Shaiganfar, R., and Wang, Y.: Absolute calibration of the colour index and O4 absorption derived from Multi AXis (MAX-)DOAS measurements and their application to a standardised cloud classification algorithm, Atmos. Meas. Tech., 9, 4803–4823, https://doi.org/10.5194/amt-9-4803-2016, 2016.
Wang, T., Hendrick, F., Wang, P., Tang, G., Clémer, K., Yu, H., Fayt, C., Hermans, C., Gielen, C., Müller, J.-F., Pinardi, G., Theys, N., Brenot, H., and Van Roozendael, M.: Evaluation of tropospheric SO2 retrieved from MAX-DOAS measurements in Xianghe, China, Atmos. Chem. Phys., 14, 11149–11164, https://doi.org/10.5194/acp-14-11149-2014, 2014.
Wang, Y., Li, A., Xie, P. H., Chen, H., Xu, J., Wu, F. C., Liu, J. G., and Liu, W. Q.: Retrieving vertical profile of aerosol extinction by multi-axis differential optical absorption spectroscopy, Acta Phys. Sin., 62, 180705-1–180705-12, 2013a.
Wang, Y., Li, A., Xie, P.H., Chen, H., Mou, F. S., Xu, J., Wu, F. C., Zeng, Y., Liu, J. G., and Liu, W. Q.: Measuring tropospheric vertical distribution and vertical column density of NO2 by multi-axis differential optical absorption spectroscopy, Acta Phys. Sin., 62, 200705-1–200705-14, 2013b.
Wang, Y., Wagner, T., Li, A., Xie, P. H., Wu, D. X., Chen, H., Mou, F. S., Zhang, J., Xu, J., Wu, F. C., Liu, W. Q., and Zeng, Y.: Research of classification of cloud and aerosol using multi-axis differential optical absorption spectroscopy, Acta Phys. Sin., 63, 110708, https://doi.org/10.7498/aps.63.110708, 2014.
Wang, Y., Lampel, J., Xie, P., Beirle, S., Li, A., Wu, D., and Wagner, T.: Ground-based MAX-DOAS observations of tropospheric aerosols, NO2, SO2 and HCHO in Wuxi, China, from 2011 to 2014, Atmos. Chem. Phys., 17, 2189–2215, https://doi.org/10.5194/acp-17-2189-2017, 2017a.
Wang, Y., Beirle, S., Lampel, J., Koukouli, M., De Smedt, I., Theys, N., Li, A., Wu, D., Xie, P., Liu, C., Van Roozendael, M., Stavrakou, T., Müller, J.-F., and Wagner, T.: Validation of OMI, GOME-2A and GOME-2B tropospheric NO2, SO2 and HCHO products using MAX-DOAS observations from 2011 to 2014 in Wuxi, China: investigation of the effects of priori profiles and aerosols on the satellite products, Atmos. Chem. Phys., 17, 5007–5033, https://doi.org/10.5194/acp-17-5007-2017, 2017b.
Wang, Y., Apituley, A., Bais, A., Beirle, S., Benavent, N., Borovski, A., Bruchkouski, I., Chan, K. L., Donner, S., Drosoglou, T., Finkenzeller, H., Friedrich, M. M., Frieß, U., Garcia-Nieto, D., Gómez-Martín, L., Hendrick, F., Hilboll, A., Jin, J., Johnston, P., Koenig, T. K., Kreher, K., Kumar, V., Kyuberis, A., Lampel, J., Liu, C., Liu, H., Ma, J., Polyansky, O. L., Postylyakov, O., Querel, R., Saiz-Lopez, A., Schmitt, S., Tian, X., Tirpitz, J.-L., Van Roozendael, M., Volkamer, R., Wang, Z., Xie, P., Xing, C., Xu, J., Yela, M., Zhang, C., and Wagner, T.: Inter-comparison of MAX-DOAS measurements of tropospheric HONO slant column densities and vertical profiles during the CINDI-2 campaign, Atmos. Meas. Tech., 13, 5087–5116, https://doi.org/10.5194/amt-13-5087-2020, 2020.
Wang, Y. S., Yao, L., Wang, L. L., Liu, Z. R., Ji, D. S., Tang, G. Q., Zhang, J. K., Sun, Y., Hu, B., and Xin, J. Y.: Mechanism for the formation of the January 2013 heavy haze pollution episode over central and eastern China, Science China: Earth Sciences, 57, 14–25, https://doi.org/10.1007/s11430-013-4773-4, 2014.
Wittrock, F., Oetjen, H., Richter, A., Fietkau, S., Medeke, T., Rozanov, A., and Burrows, J. P.: MAX-DOAS measurements of atmospheric trace gases in Ny-Ålesund – Radiative transfer studies and their application, Atmos. Chem. Phys., 4, 955–966, https://doi.org/10.5194/acp-4-955-2004, 2004.
Yilmaz, S.: Retrieval of Atmospheric Aerosol and Trace Gas Vertical Profiles using Multi-Axis Differential Optical Absorption Spectroscopy, PhD thesis, University of Heidelberg, 2012.
Zhang, Y. L. and Cao, F.: Fine particulate matter (PM2.5) in China at a city level, Sci. Rep., 5, 14884, https://doi.org/10.1038/srep14884, 2015.
Zielcke, J.: Observations of reactive bromine, iodine and chlorine species in the Arctic and Antarctic with Differential Optical Absorption Spectroscopy, PhD thesis, https://doi.org/10.11588/heidok.00018932, 2015.