the Creative Commons Attribution 4.0 License.
the Creative Commons Attribution 4.0 License.
 | 19 Aug 2021
Variability in black carbon mass concentration in surface snow at Svalbard
David Cappelletti
Elena Barbaro
Cristiano Varin
Jean-Charles Gallet
Krzysztof Markowicz
Anna Rozwadowska
Mauro Mazzola
Stefano Crocchianti
Luisa Poto
Paolo Laj
Carlo Barbante
Black carbon (BC) is a significant forcing agent in the Arctic, but substantial uncertainty remains to quantify its climate effects due to the complexity of the different mechanisms involved, in particular related to processes in the snowpack after deposition. In this study, we provide detailed and unique information on the evolution and variability in BC content in the upper surface snow layer during the spring period in Svalbard (Ny-Ålesund). A total of two different snow-sampling strategies were adopted during spring 2014 (from 1 April to 24 June) and during a specific period in 2015 (28 April to 1 May), providing the refractory BC (rBC) mass concentration variability on a seasonal variability with a daily resolution (hereafter seasonal/daily) and daily variability with an hourly sampling resolution (hereafter daily/hourly) timescales. The present work aims to identify which atmospheric variables could interact with and modify the mass concentration of BC in the upper snowpack, which is the snow layer where BC particles affects the snow albedo. Atmospheric, meteorological and snow-related physico-chemical parameters were considered in a multiple linear regression model to identify the factors that could explain the variations in BC mass concentrations during the observation period. Precipitation events were the main drivers of the BC variability during the seasonal experiment; however, in the high-resolution sampling, a negative association has been found. Snow metamorphism and the activation of local sources (Ny-Ålesund was a coal mine settlement) during the snowmelt periods appeared to play a non-negligible role. The statistical analysis suggests that the BC content in the snow is not directly associated to the atmospheric BC load.
- Article
(1062 KB) - Full-text XML
-
Supplement
(950 KB) - BibTeX
- EndNote


In the last 2 decades, the Arctic region has been exposed to dramatic changes in terms of atmospheric temperature rise, sea ice decrease and increase in air mass transport from lower latitudes, bringing warmer and humid air masses containing pollutants and anthropogenic-derived compounds (Law and Stohl, 2007; Comiso et al., 2008; Screen and Simmonds, 2010; Eckhardt et al., 2013; Schmale et al., 2018; Maturilli et al., 2019). Long-range transport and local emissions of combustion-generating aerosols like black carbon (BC) can influence the radiative budget of the Arctic atmosphere and especially the impacts of atmospheric aging on the mixing state of BC particles (Eleftheriadis et al., 2009; Bond et al., 2013; Zanatta et al., 2018). When deposited over snow, numerous aerosol species directly increase the quantity of solar radiation absorbed by the snowpack, thus favoring snow-aging processes and the decrease in the snow albedo (Hansen and Nazarenko, 2004; Flanner et al., 2007; Hadley and Kirchstetter, 2012; Skiles et al., 2018; Skiles and Painter, 2019).
Among these light-absorbing aerosols, black carbon (BC) particles are the most effective in absorbing the visible and near-infrared solar radiation. These primarily emitted insoluble, refractory and carbonaceous particles originate from natural and anthropogenic sources, such as open fires or diesel engine exhausts. Currently, the anthropogenic emissions are higher compared to the natural ones (Moosmüller et al., 2009; Bond et al., 2013). In 2000, the energy production sector (including fossil fuels and solid residential fuels combustion) generated approximately 59 % of the total global BC emissions, while the remaining came from biomass burning (Bond et al., 2013). BC particles are characterized by a mass size distribution peaking around 100–250 nm (or mass equivalent diameter), e.g., 240 nm in the Svalbard area in spring (Bond et al., 2013; Laborde et al., 2013; Zanatta et al., 2016; Motos et al., 2019). The impact of BC particles absorbing the incoming solar radiation has indeed a non-negligible role in the Arctic region, which is already threatened by a twofold temperature increase compared to the mid-latitude areas, the so-called “Arctic amplification” (Bond et al., 2013; Cohen et al., 2014; Serreze and Barry, 2011). BC has an atmospheric lifetime of about 7 d and has been directly targeted in important international mitigation agreements (AMAP, 2015). Theoretical and experimental results showed that the cryosphere is affected both by the BC-induced warming of the atmosphere and by direct and indirect BC effects on the snow once deposited over it (Flanner, 2013),
Atmospheric BC measurements in the Arctic regions are still rare, despite an extraordinary effort done by the international scientific community to evaluate the sources, transport paths, concentration and climate impact (Eleftheriadis et al., 2009; Pedersen et al., 2015; Ferrero et al., 2016; Ruppel et al., 2017; Osmont et al., 2018; Zanatta et al., 2018; Laj et al., 2020). BC mass concentrations can be directly measured, by using incandescent or thermal techniques, and indirectly measured, by absorption measurements using an appropriate mass absorption cross section (Petzold, 2013). Various terms, such as refractory black carbon (rBC), for incandescent measurements, elemental carbon (EC), using thermal techniques, or equivalent black carbon (eBC), based on optical techniques, are used. Forsström et al. (2009) reported measurements performed in Arctic snow in the past and new measurements of EC in snow surface using filters and a thermo-optical method. The geographical and seasonal eBC variability was investigated in the Arctic region by Doherty et al. (2010). Other BC measurement in snow samples from the Arctic region can be found in Aamaas et al. (2011), Forsström et al. (2013), Pedersen et al. (2015), Gogoi et al. (2016), Khan et al. (2017) and Mori et al. (2019). Intercomparison of different techniques agree within an uncertainty factor of 2 at Alert (Sharma et al., 2017), Ny-Ålesund and Barrow (Sinha et al., 2017).
A complex combination of processes are involved in the BC particles transfer from the atmosphere to the surface snow. Via a modeling approach, Liu et al. (2011) found that approximately 50 % of BC's total burden in the Arctic atmosphere is removed through wet deposition-related processes. Yasunari et al. (2013) estimated the intensity of BC dry deposition on the Himalayan glaciers; they found that the surface roughness and the surface wind speed are critical parameters in order to retrieve realistic results. In a recent study, Jacobi et al. (2019) confirmed the previous estimates suggesting that approximately 60 % of the BC particles are deposited on the surface snow via wet deposition in spring in the Svalbard Arctic area. Models are still not fully able to describe the actual deposition and transport processes in Svalbard, resulting in underestimation of the BC concentration in the snowpack (Eckhardt et al., 2015; Stohl et al., 2013). Although wet deposition is suggested to be the main driver of BC concentration in the snow, little is known about other environmental processes potentially affecting the BC particles concentration once deposited, i.e., physical post-depositional processes.
In this study, we present two unique experiments performed in a clean area close to the town of Ny-Ålesund (Svalbard) at the Gruvebadet Aerosol Laboratory (78.91734∘ N, 11.89535∘ E; 40 m a.s.l.), during spring 2014 and 2015. Daily and hourly time resolution samplings were performed on the snow surface to investigate which atmospheric variables could directly or indirectly modify the BC mass concentration in the surface snow once deposited. The daily sampling lasted for approximately 85 d to assess the intra-seasonal variability covering the transition from a cold period (April) to the melting period in late June. The hourly time resolution experiment was performed to investigate the existence of potential processes affecting the BC concentration over the diurnal cycle.
2.1 Study area
Both experiments were conducted in the proximity of the Ny-Ålesund research station (78.5526∘ N, 11.5519∘ E; 25 m a.s.l.), located on the Spitsbergen Island in the Svalbard archipelago. Along the west coast, Svalbard is characterized by a maritime climate with an annual average temperature of −3.9 ∘C in Ny-Ålesund (between 1994 and 2017; Maturilli et al., 2019). On average, the snowpack starts building up in September and melts away at the end of May (Førland et al., 2011; Kohler et al., 2004). In addition, Ny-Ålesund has become one of the reference locations for conducting Arctic climate studies focusing on atmospheric composition and physics. Long-term monitoring of atmospheric aerosols is performed at the Gruvebadet station (Feltracco et al., 2019, 2020, 2021a, b; Moroni et al., 2018; Ferrero et al., 2016; Bazzano et al., 2015; Moroni et al., 2015; Zangrando et al., 2013; Scalabrin et al., 2012, Turetta et al., 2021) and at the Zeppelin observatory (475 m a.s.l.; Eleftheriadis et al., 2009; Tunved et al., 2013; Lupi et al., 2016, and references therein).
2.2 Snow sampling
There are no standardized methods for sampling, filtering and analytical protocols for detecting atmospheric carbon deposited in snow, even if a few protocols have been developed (Ingersoll et al., 2009; Gallet et al., 2018; Meinander et al., 2020). In the present work, two different sampling strategies were adopted regarding the thickness of the sampled layer and the temporal sampling frequency.
Snow samples were collected during two field campaigns. The first campaign was carried out in spring 2014, from 1 April to 24 June for a total of 85 d; it consists of daily sampling, and it is hereafter referred to as the “85 d experiment”. The second campaign was conducted in spring 2015 from 28 April to 1 May. During these 3 d, measurements were collected with hourly sampling. This second campaign is hereafter referred to as the “3 d experiment”. Snow samples were collected about 1 km northwest of Ny-Ålesund (Fig. 1). The area is a dedicated clean site for aerosols and snow sampling, with no fuel engine traffic. The wind at the site is usually blowing from east to west, and rarely from north to south, minimizing the emissions of the town reaching the sampling area. The main wind pattern during the experiment is presented in Figs. 1 and 2. The samples for both experiments were kept frozen until the lab analyses. The samples were collected using neck nylon gloves to avoid any contamination.
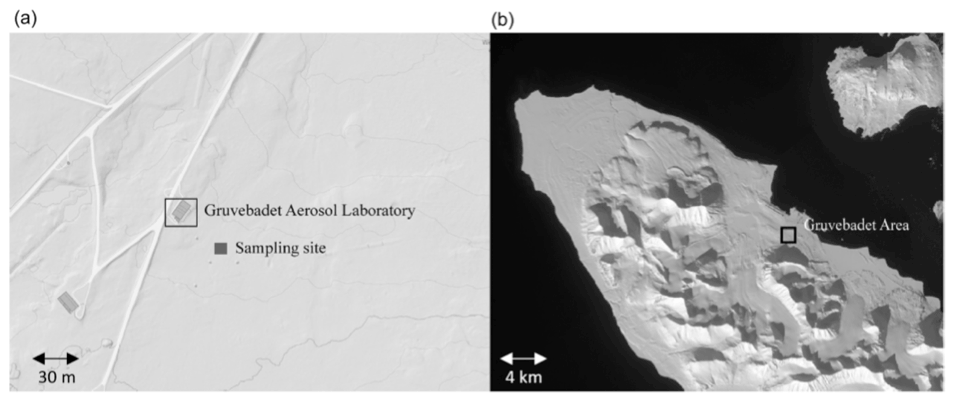
Figure 1(a) Experimental sampling site location (dark gray rectangle) in the proximity of the Gruvebadet Aerosol Laboratory. (b) Gruvebadet area (black square) close to the Ny-Ålesund research village. Source: Spolaor et al. (2019); maps from https://toposvalbard.npolar.no/(last access: 15 July 2021). The red arrow points to the north.
The two experiments aim to capture the rBC mass concentration on a daily basis in the surface snow (upper 10 cm) during the seasonal change and on an hourly basis on a thinner surface snow layer (upper 3 cm) during a daily cycle. Although wet and dry deposition are the main sources of BC in the Arctic snow, the aim of our experiments was to evaluate if other atmospheric parameters could contribute to the snow surface rBC mass concentration variability.
In the 85 d experiment, the first 10 cm of surface snow were collected on a daily basis (at approximately 11:00 Greenwich mean time, GMT, + 2) in the same area, using a 5 cm diameter and 10 cm long Teflon tube. The samples were collected following a straight line, leaving about 15 cm between the sampling points to minimize the spatial variability. The collected snow was homogenized in a pre-cleaned plastic bag and then, without melting, 50 mL was transferred into a vial (Falcon™ 50 mL conical centrifuge tubes) for BC, coarse-mode particles number (mix of soil, mineral coarse-mode and possibly coal coarse mode) concentration and electrical conductivity analyses. The 85 d experiment was designed with the aim to investigate the BC presence in the upper snow layer, where most of the snow–radiation interaction takes place and where BC particles' presence can decrease the snow albedo (Doherty et al., 2010). Snow albedos increased rapidly and asymptotically as the snow depth increased. Visible albedos reached 0.9 for a snow depth of only 5 cm (Perovich et al., 2007). Moreover, this sampling strategy allowed us to evaluate the variation in BC on a seasonal basis and to capture the impacts of wind, precipitation or melting.
During the 3 d experiment, the first 3 cm of surface snow were collected on an hourly basis in pre-cleaned vials in a delimited area of 2×2 m, using the same sampling tools as above (Spolaor et al., 2019). In this case, the samples were collected following a straight line, leaving about 5 cm between the sampling points. The aim of the 3 d experiment was to investigate the potential daily cycle of surface BC concentration; therefore, we foresaw that small variations could derive from the impact of the daily variation in short-wave radiation (SWR) and subsequently induced snow metamorphism at the surface of the snowpack, often at centimeter scale. To avoid dilution of the signal, we reduced the vertical sampling thickness to 3 cm to enhance our chances of observing variation in the rBC mass concentration, if such a variation exists.
The temperature at the surface of the snowpack (at 7 cm for the 85 d and at 3 cm for the 3 d experiment) was always measured. The daily variability with an hourly sampling resolution (hereafter daily/hourly) snow accumulation was determined by measuring the emerging part of four poles placed around the sampling area. The average standard deviation calculated from the four poles provides us with a reasonable estimate of the variability in snow accumulation or depletion within the sampling area. The standard deviation obtained ranges from 2 to 4 cm for the entire period, indicating a limited spatial variability.
2.3 Atmospheric optical measurements
2.3.1 Aethalometer (AE-31)
In this study, the equivalent BC (eBC) concentration in the boundary layer (around 3 m a.s.l) was measured by an AE-31 Aethalometer (Gundel et al., 1983) during the 3 d campaign. The device is equipped with seven wavelengths (370, 470, 520, 590, 660, 880 and 950 nm). It determines the attenuation coefficient by using the light attenuation ratio through a sensing spot and a referenced clean spot, both on a quartz fiber filter substrate. The sampling and reference spots surface areas are 0.5 cm2, while the volumetric flow rate is 4 L min−1. The flow rate was calibrated with a tetraCal (BGI Instruments by Mesa Labs, Inc.) volumetric airflow before and after the field campaign. A 5 min temporal resolution was used for data acquisition. However, due to the low background concentration in the Arctic, the signal-to-noise ratio is high, so that data were hourly averaged. The data presented in this study were processed according to the methodology of Segura et al. (2014). For this purpose, the multiple scattering and filter loading effect (Weingartner et al., 2003) was corrected with new values of the mass absorption cross section (MAC) and multiple scattering factor (C=3.1), as reported by Zanatta et al. (2018). The MAC value was derived using observations and observationally constrained Mie calculations in spring at the Zeppelin Arctic station (Svalbard; 78∘ N). Zanatta et al. (2018) estimated the MAC at 550 nm (9.8 m2 g−1) and at 880 nm (6.95 m2 g−1), which we used to estimate MAC at 520 nm (10.2 m2 g−1).
2.3.2 Particle soot absorption photometer (PSAP)
During the 85 d sampling period, the aerosol absorption coefficient was also measured by means of a three-wavelength PSAP (this instrument was not available during the 3 d experiment period). It measures the variation in light transmission through a filter where particles are continuously deposited with constant airflow. A second filter identical to the first one remains clean and is used as a reference to take into account possible variations in the light source, i.e., a three-color LED (blue, green and red with wavelength centered around 470, 530 and 670 nm, respectively). The correction developed by Bond et al. (1999) was applied to consider the filter loading effect. The complete eBC mass concentration time series for the 85 d experiment was retrieved using the Aethalometer (first period) and the PSAP (second period), with an overlapping period with simultaneous measurements of 5 d. For the retrieved eBC mass concentration from the two instruments to be equal during the overlapping period, the PSAP eBC was calculated by dividing the absorption measurements (at 530 nm) with a MAC equal to 7.25 m2 g−1 (keeping the AE-31 data as a reference). Daily averages were calculated from the 1 min data to compare with the rBC daily data obtained from the snow.
2.4 Surface snow measurements
2.4.1 Coarse-mode particles number concentration
The snow samples were melted at room temperature before the online coarse-mode particles and conductivity measurements (the water was pumped from the vials by a 12-channel peristaltic pump; Ismatec, type ISM942). The total conductivity of the melted snow was measured in parallel with a simple conductivity micro cell. The number concentration of the coarse-mode particles in the surface snow was measured with a Klotz ABAKUS® laser sensor particle counter. This instrument optically counts the total number of particles and measures each particle's size in a liquid constantly flowing through a laser beam cavity (LDS of the Klotz ABAKUS® laser sensor particle counter). The measurements size range of the instrument is from 0.8 to about 80 µm, with 32 dimensional bins (Table S1 in the Supplement) not overlapping with that of the single particle soot photometer (SP2). Only the 32nd bin has a dimensional range above 15.5 µm, i.e., of 80 µm. The data were recorded by a LabVIEW®-based software obtaining a sufficient number of data points in order to have a standard deviation less than 5 % of the mean value. The particle number concentration was calculated using the constant water flow value.
2.4.2 rBC measurement – SP2
The rBC mass concentration and mass size distribution were measured following the methods described in Lim et al. (2014). The snow samples were melted at room temperature prior to the analyses. The vials with the melted snow were sonicated for 10 min at room temperature. The samples were nebulized before the injection in the Apex Q desolvating system (Elemental Scientific Inc., Omaha, USA). The nebulization efficiency was evaluated daily by injecting Aquadag solutions with different mass concentrations, ranging from 0.1 to 100 ng g−1 and obtaining an average value of 61 %, that was used to correct all the BC mass concentrations reported in this paper. More details on the method can be found in Lim et al. (2014) and in Wendl et al. (2014).
The SP2 data were analyzed using the Igor-based toolkit from Martin Gysel (Laboratory of Atmospheric Chemistry, Paul Scherrer Institute, Switzerland). The large number of signals derived from every single particle is elaborated, achieving rBC mass and number concentrations and size distributions.
2.5 Meteorological parameters
Meteorological parameters, in addition to the atmospheric and snow ancillary measurements, were used in the statistical exercise to study the variability in rBC mass concentration in surface snow samples as a function of the atmospheric conditions. BC particles are deposited on the snowpack following a combination of wet and dry deposition. However, once deposited on/in the snowpack, other processes can potentially induce a significant variability in the surface BC content. The wind direction and its velocity can modify the BC distribution in the upper snowpack due to snow mobilization. The solar radiation and relative humidity may enhance snow sublimation and surface hoar formation, thus modifying the relative BC concentration in the upper snow layer by removing or adding water mass to the snow surface.
Air temperature and relative humidity at 2 m height have been retrieved from a meteorological station located about 800 m north of the sampling site, using a ventilated Pt 100 thermocouple by Thies Clima and a HMT337 HUMICAP® sensor by Vaisala, respectively. Wind speed and direction at 10 m height were obtained from a combined wind sensor by Thies Clima (see Maturilli et al., 2013). At about 50 m distance, the radiation measurements for the Baseline Surface Radiation Network (BSRN) provide, among others, the downward solar radiation detected by a Kipp&Zonen CMP22 pyranometer (Maturilli et al., 2015). Both meteorological and surface radiation measurements are available in a 1 min time resolution via the PANGAEA data repository (Maturilli et al., 2020). The daily/hourly mean values of the meteorological parameters were used in the statistical analyses of the 85 d or 3 d experiment and in Figs. 2 and 3 (the physico-chemical parameters from the snow samples are punctual values).
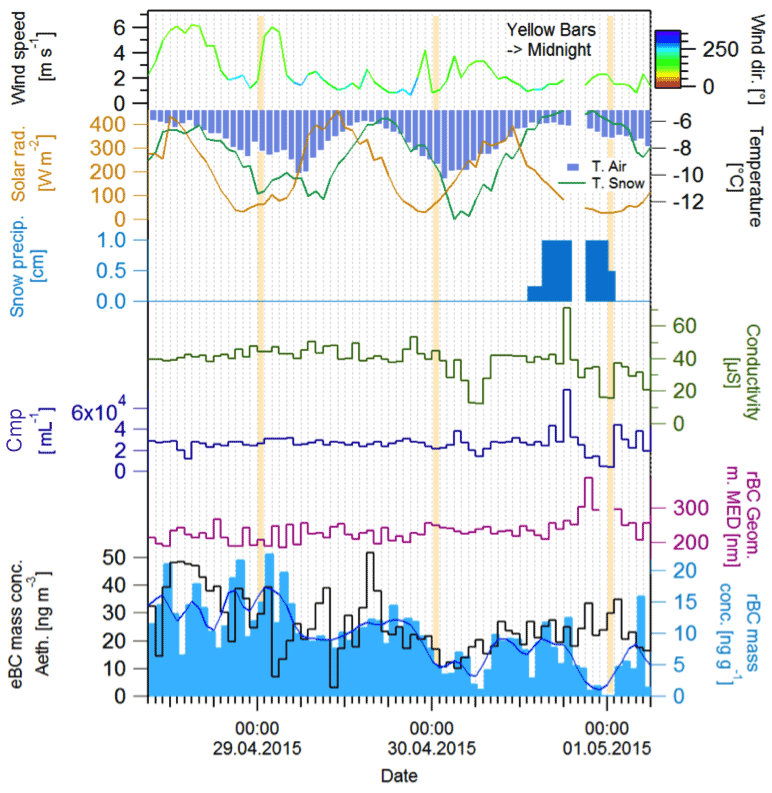
Figure 2The 85 d experiments' daily snow samples of rBC mass concentration (light blue) and eBC mass concentration in the atmosphere (black), geometric mean mass equivalent diameter (purple), number of coarse-mode particles (Cmp – blue) and total conductivity (green). Meteo/snow parameters used in the statistical exercise are wind speed (color coded for wind direction), solar radiation (orange line), air and surface snow temperatures (blue bars and green line, respectively), amount of fresh snow (snow precipitation; light blue bars) and the snow accumulation (neg. accumulation; the values where multiplied by −1 in order to show the similar trend of the snow lost and of the air/snow temperature during the melting period at the end of the campaign).
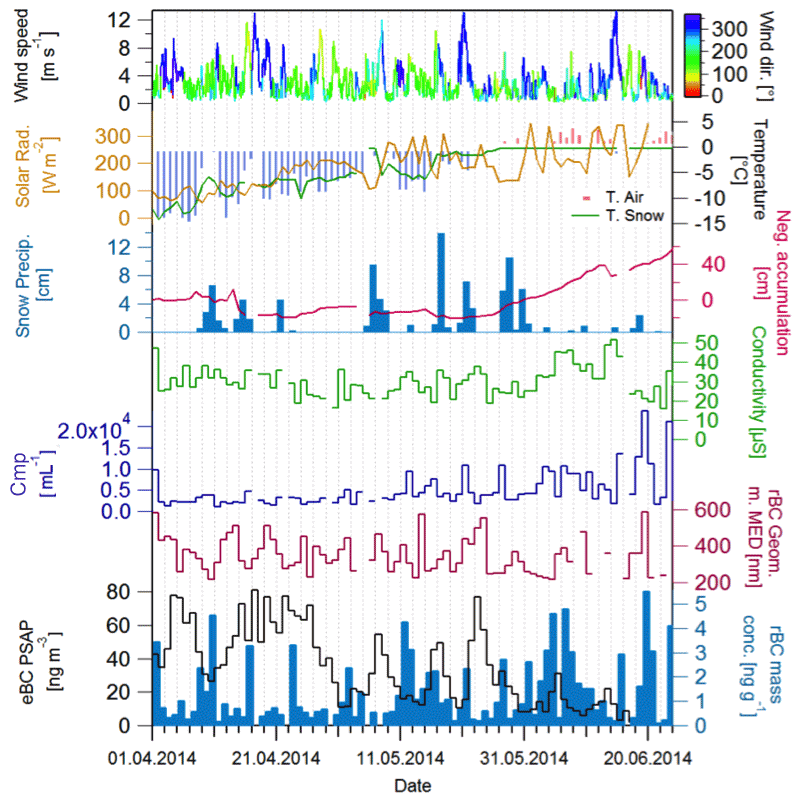
Figure 3The 3 d experiments snow samples with the hourly rBC mass concentration and smoothed line (light blue bars), atmospheric eBC mass concentration in the atmosphere (black), geometric mean mass equivalent diameter (purple) the number concentration of coarse-mode particles (Cmp – blue) and the total conductivity (green). Meteo/snow parameters used in the statistical exercise are wind speed (color coded for wind direction), solar radiation (orange line), air and surface snow temperature (blue bars and green line, respectively) and amount of fresh snow (snow precipitation; light blue bars). The yellow bars are centered on the midnight hours for the 3 sampling days.
2.6 Parameters considered in the statistical analysis
The snowpack evolution is primarily driven by meteorological parameters, which are responsible for adding/removing mass to the annual snowpack. Wind can affect the snowpack evolution in the following ways: (1) by snow redistribution, (2) favoring the ablation\sublimation and (3) lifting particles from nearby sources and areas. Surface snow and air temperatures are two fundamental parameters required to fully understand the varying conditions of the snowpack. In our study, the temperature variables are proxies for the melting episodes and for the presence of liquid water potentially affecting the concentration of impurities. The air and snow temperatures do not have a direct effect in the rBC concentration in surface snow, but they are fundamental indicators to identify the spring warming events (T>0 ∘C; also called rain on snow, ROS, events) that yield the snowmelt. Moreover, air and snow temperature could be relevant to evaluate possible snow metamorphism and the response of the upper snowpack to the meteorological conditions. Snow and air temperatures can be used during the 3 d experiment for evaluating the daily scale frequency and be helpful for investigating the daily scale variability of rBC in the surface snow.
The SWR is not expected to be directly linked to the surface mass concentration of rBC; however, the surface process could affect it indirectly by favoring sublimation (water mass removal) and hoar formation (water mass addition) during the colder parts of the day (night/early morning). The relative humidity (RH) gives an idea of the amount of water present in the atmosphere, and the high RH might favor the deposition of BC suspended by the formation of water droplets through the cloud condensation nuclei. This parameter is especially significant for the selected sampling location nearby the shore. Indeed, RH values close to or higher than 90 % could be associated to fog or low cloud conditions and not directly to wet or dry precipitation. The last meteorological parameter considered is the precipitation amount. This aspect is important for understanding the wet deposition processes able to transfer BC particles from the atmosphere to the snow surface.
The additional selected parameters are (1) the atmospheric eBC mass concentration, to investigate the possible link between eBC particles present in the atmosphere and the rBC in snow surface, (2) the coarse-mode particles that could have a similar transport pathways to the black carbon and give an idea of the amount of total impurities deposition and (3) the total water conductivity, an indirect measurement of the salinity content of the snow. It is important to note that the eBC and the rBC mass concentrations are not the same physical quantities; the former is obtained from an absorption measurement assuming a constant MAC, whereas the second is obtained via a laser-induced incandescence method with an SP2 empirically calibrated with a reference material (Petzold et al., 2013). Considering the location of the sampling site (<1 km from the coastline), the contribution of the ocean emissions to the snowpack chemical composition is significant. We considered the total conductivity as being an indication of sea spray deposition and to investigate common deposition patterns and/or similarities to the behavior of BC (although BC is not emitted from ocean surface). The conductivity was also considered to determine if there was a large sea spray aerosol event which could potentially affect the SP2 measurements (see the Supplement).
2.7 Statistical analysis
Multiple linear regression was carried out to evaluate the relationship between the observed surface snow rBC mass concentration and the selected set of covariates consisting of the meteorological and snow physico-chemical parameters that could have a direct effect on controlling snowpack dynamics, as well on the BC concentration, as discussed in Sect. 2.6. All the atmospheric parameters described in the previous section (wind, snow and air temperature, incoming solar radiation, relative humidity and snow precipitation amount) were initially considered as covariates to be included in the multiple linear regression. However, wind speed and direction, as well as the atmospheric stability, expressed as vertical wind speed, were removed because preliminary statistical analyses indicate that none of them is associated with the observed variations in snow rBC mass concentrations. This does not mean that such parameters do not play a role in controlling the BC concentration, but rather that no statistically significant associations were found with the data collected in our study and, thus, these parameters were no longer considered in the statistical analyses discussed below.
Multiple linear regression models were fitted on the logarithm scale because the distribution of rBC concentrations in both experiments is characterized by a significant skewness. Coarse-mode particle number concentrations and conductivity were also log transformed to linearize their relationships with log(rBC). The regression model fitted on the two experiments is as follows:
In the above model, “dust” indicates coarse-mode particles number concentrations, “temp” is the snow temperature at 7 cm depth for the 85 d experiment (daily resolution) and at 2 cm dept for the 3 d experiment (hourly resolution), “snow” is a binary indicator for the presence of solid precipitation, “swr” is solar incoming short-wave radiation, “cond” is the conductivity, and ϵ is a zero-mean normal error. Graphical inspection of residuals plots and normal probability plots confirmed that, after the logarithm transformations, the regression models meet the assumptions of linearity, constant error variance (called homoscedasticity in the statistical literature) and normal errors. The statistical analyses were performed with the statistical language R (R Core Team, 2020).
3.1 Seasonal BC variability in surface snow
3.1.1 Atmospheric eBC and atmospheric condition
During the experimental period, the atmospheric eBC concentration ranged between 80 and <5 ng m−3 (Fig. 2), with an average of 34±23 ng m−3. The highest concentrations were measured at the beginning of the campaign, especially from 15 to 27 April, followed by a general decreasing trend characterized by the presence of several concentration peaks (on 8, 17 and 24 May) potentially due to Eurasian fires, as already suggested from Feltracco et al. (2020; Fig. S1). The ammonia daily concentration time series (the only available biomass burning tracer for that period in the area) measured at the Zeppelin station is plotted together with the Gruvebadet atmospheric BC measurements in Fig. S3. Biomass burning is a significant source of atmospheric ammonia (Andreae and Merlet, 2001), often affecting the Arctic region (Moroni et al., 2020). As shown in Fig. S3, both time series have a similar behavior at the very beginning of the campaign, from 3 to 8 April, and during the period between 7 and 21 May. This suggests that the BC detected in the atmosphere could originate from biomass burning episodes during these two time periods. During the 85 d sampling period, wind was characterized by the following median values (25th and 75th percentiles) for direction and speed: 205∘ (152∘, 257∘) and 2.7 (1.9, 3.7) m s−1, respectively; therefore, mostly coming from southwest (Fig. 2). Daily air temperature at 3 m increased during the campaign from −15 to about +5 ∘C (Fig. 2), following the seasonal variation of incoming solar energy, i.e., from 100 to 300 W m−2, with an average of 185±75 W m−2 (Fig. 2; orange line). The snow precipitation episodes are presented as daily accumulated values (Fig. 2; blue bars) ranging from 0 to 12 cm.
3.1.2 Surface snow conditions
Over the 85 d experiment, the snow rBC mass concentration varies from 0.2 to 6 ng g−1 (Fig. 2), with an average of 1.4±1.3 ng g−1, in agreement with results available in the literature (Mori et al., 2019; Jacobi et al., 2019; Aamaas et al., 2011). An increasing trend can be observed for the rBC mass concentration in the surface snow across the sampling period. The median of the rBC mass equivalent diameter in the snow is 313±35 nm (Fig. 2), similar to what has been obtained in other studies (e.g., Schwarz et al., 2013). The rBC mass equivalent diameter shows high variability, ranging from 200 to 500 nm. However, since the rBC concentrations were low, the evaluation of the geometric mean of the particles diameter for the biggest sizes, above 300 to 400 nm, has been considered as qualitative information due to the high signal noise.
The number of coarse-mode particles (Fig. 2; blue line) shows a constant concentration in the first half of the campaign (1 April–11 May; average concentration of 3435±1824 particles per milliliter), whereas it increases in the second half (12 May to 27 June; average concentration of 7782±5683 particles per milliliter), especially after the 1 June (1 to 27 June; average concentration of 9352±6741 particles per milliliter), which is in concomitance with the onset of the snow melting period. The conductivity (Fig. 2; green line) also shows an increasing trend at the end of the sampling campaign when snow is melting, with an overall average value of 30±8 µS. The spatial variability in rBC, calculated in the same manner as proposed by Spolaor et al. (2019) for other species, was obtained from six surface snow samples collected in the four corners of the sampling area and two surface snow samples in the center right before the beginning of the experiment. The following rBC mass concentrations were obtained: (a) 3.95 ng g−1, (b) 4.92 ng g−1, (c) 4.20 ng g−1, (d) 3.10 ng g−1, (e) 3.82 ng g−1 and (f) 3.58 ng g−1, resulting in a rBC spatial variability of 16 % in the surface snow of the considered sampling area.
3.1.3 Statistical results
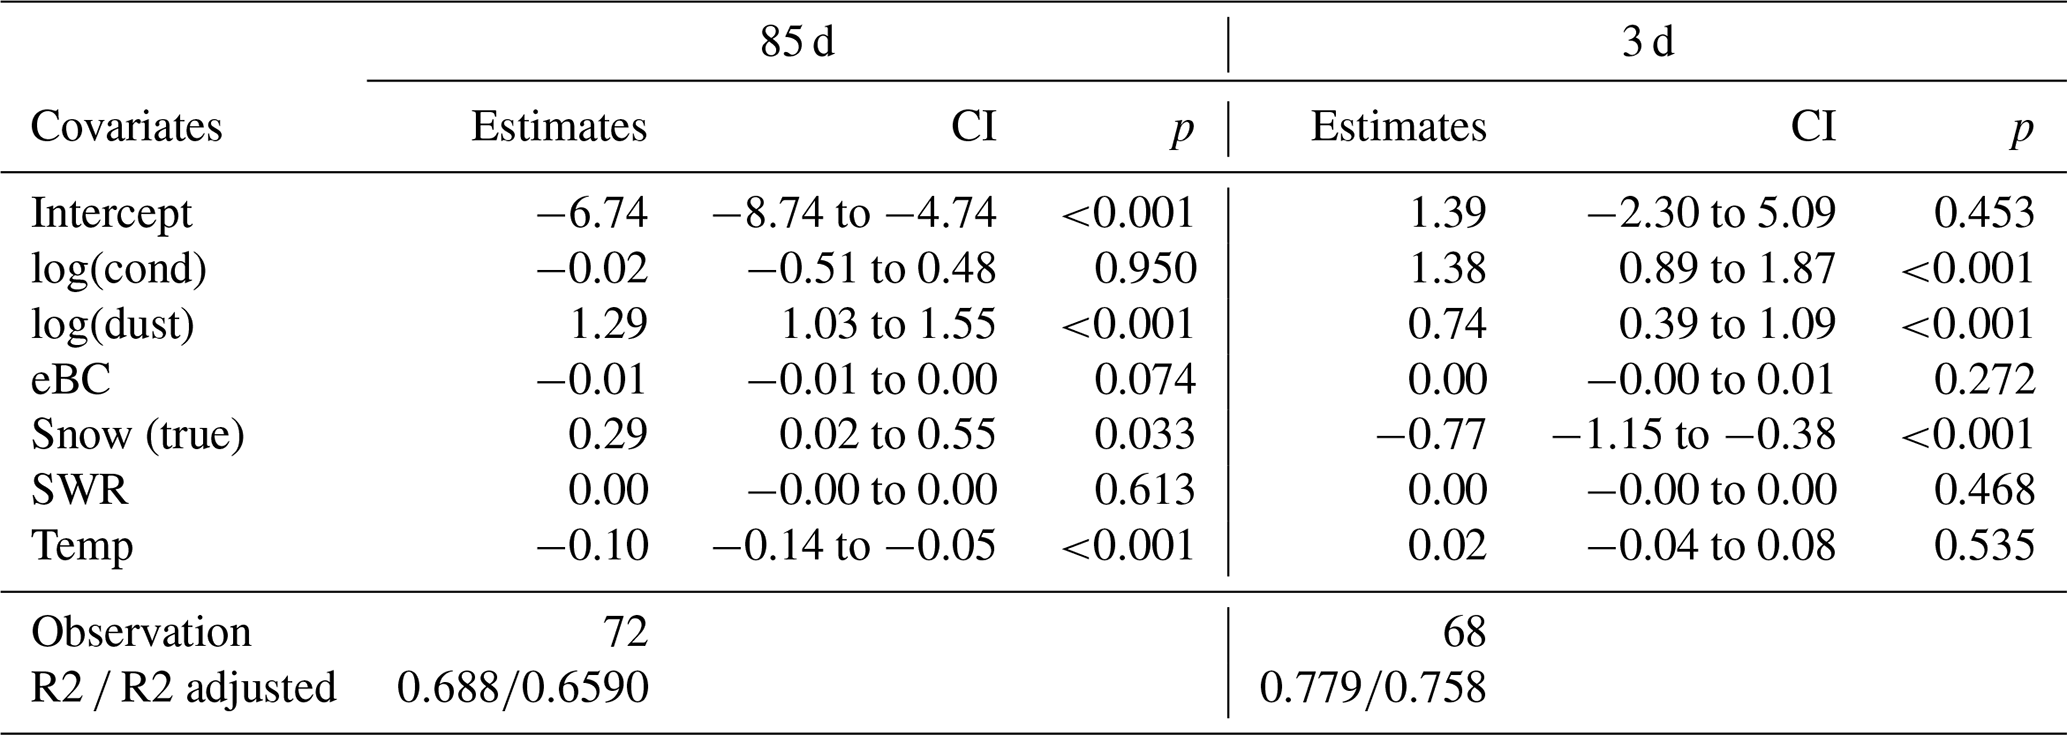
The fitted multiple linear regression model for the 85 d experiment data explains the 69 % of the variance in the logarithm of the snow rBC mass concentration (R2=0.69). The fitted model indicates the presence of strongly statistically significant associations of the (log transformed) snow rBC mass concentration with the coarse-mode particles number concentration (p<0.001) and the snow temperature (p<0.001). A weaker association is found with the occurrence of snow precipitation (p=0.03). The statistical associations of rBC mass concentration with the other covariates considered in the model are non-significant. See Table 1 for the estimated coefficients and the corresponding p values.
Table 1Estimated coefficients, 95 % confidence intervals and the corresponding p values for the covariates of the multiple linear regression model fitted to the 85 and the 3 d experiments. The last rows of the table report the number of observations, the multiple coefficient of determination (R2) and its adjusted version.
In order to interpret the statistical results, the description of the 85 d campaign is split into two periods identified as the transition from the cold to the melting state. The first period occurred before the end of May, and the rBC mass concentration often increases with snowfall episodes (9–11 and 17 April; 17, 22 and 27–28 May; 1 June), as suggested by previous studies, with exceptions for 24 April and 7 May. Over the sampling period, a weakly statistically significant positive association (p=0.03) was found between snow rBC mass concentration in surface snow and the occurrence of snow precipitation. BC wet deposition processes are estimated to remove 50 %–60 % of the total atmospheric BC burden in the Arctic (Liu et al., 2011; Jacobi et al., 2019). In our study, the wet deposition impacts could be partially masked due to the sampling frequency and the wind snow. In Kongsfjord, a strong wind is often present during the precipitation events (Fig. 2). Consequently, the freshly deposited snow is frequently removed from the surface before being able to sample it. Interestingly, our observations show that, on a daily scale, the precipitation episodes are not clearly related to a decrease in the atmospheric eBC mass concentration (Fig. 2). A possible explanation is that the precipitation amounts were small, so that the precipitation events did not significantly alter the atmospheric BC reservoir.
In the second period, from the beginning of June, the atmospheric temperature increases, causing the snowmelt season onset. At the beginning of June, the snow rBC mass concentration increases up to approximately 5 ng g−1, and a simultaneous increase was detected in the coarse-mode particles number concentration (peaks between 4 and 7 June). As suggested in previous studies, the surface melting process could explain the observed increase in rBC and coarse-mode particle concentrations. However, we also have to consider that rBC can be dry deposited, as it has been recently suggested (up to 50 %–60 %; Liu et al., 2011; Jacobi et al., 2019). Very few field validation data exist for estimating the amount of dry deposition at the snow surface, and this process is often used as ancillary information since most models underestimate the BC in the Arctic snowpack compared to field measurements.
Our data support the hypothesis related to the local sources' activation in enhancing the dry deposition impacts in an old mining town such as Ny-Ålesund. Especially during poor snow cover conditions, as during the snowmelt season, coarse-mode particles as residuals of carbon extraction mining activities are available for wind lift\suspension (Vecchiato et al., 2018). The possible effect of local sources' activation is further supported by a recent analysis of the Brøggerbreen glacier and Ny-Ålesund annual snowpack. This analysis shows the presence of retene (an organic compound frequently used to track the presence of coal), most likely due to local sources (Vecchiato et al., 2018).
The simultaneous increase in rBC mass and coarse-mode particle number concentrations during the second part of the experiment (e.g., visible between 3 and 7–8 June) could be explained via similar post-depositional processes, namely snowmelt and sublimation. The episodes of snow surface melting can significantly affect the snow particulate content, and we hypothesize that the hydrophobicity of pure BC particles, and of several species in the coarse-mode particles, might affect its physical location in the snowpack (in the literature, the response of the BC particles is still debated). The hydrophobicity of the particles can cause the surface concentration to increase while losing water mass through percolation. This could lead into a positive feedback process, i.e., the increase in BC concentration can thus enhance snow sublimation (water evaporation), resulting in a further increase in BC concentration in surface snow and so on.
In this study, the estimated statistical association between snow rBC mass concentration and the daily snow temperature is negative and strongly significant (p<0.001). During the 85 d experiment, we can distinguish two events where the temperature appeared to play a role in the BC concentration. Both of them show an increase in rBC mass concentration during melting/refreezing episodes, which is in agreement with other studies (Aamaas et al., 2011; Xu et al., 2006; Doherty et al., 2013, 2016). The first event occurred between 5 to 12 May and the second event after 20 May, when the proper snowmelt began (Fig. 2). The first event was characterized by a rapid rise in the daily air temperature (from −6 to −1 ∘C) in concomitance to a snow precipitation event, followed by a rapid temperature decrease to −6 ∘C. The surface snow (10 cm) mirrored this behavior, first rising from −6 to 0 ∘C, and then cooling down to −6 ∘C. During this warm event, the upper snow strata underwent a melting episode with surface water percolation (although limited), causing the surface BC concentration to increase. The second event started approximately on 20 May and lasted until the end of the experiment (Fig. 2). During this period, the atmospheric temperature increased constantly, and the snowpack consequently started to melt. Moreover, surface BC concentration increased almost continuously from 25 May to its maximum observed on 6 June. Afterward, the upper snow rBC mass concentration tended to decrease following the rapid snowpack decline.
3.2 Diurnal variation in rBC in surface snow
3.2.1 Surface snow/atmospheric aerosol content and atmospheric conditions
The 3 d experiment was performed at the end of April 2015, during the Arctic spring. The samples were collected on an hourly basis over 3 d, achieving a high-resolution sampling frequency. The atmospheric concentration of eBC ranged from 2 to 50 ng m−3, decreasing during the sampling period and not showing any particular diurnal pattern (Fig. 3). The mean value of the atmospheric eBC mass concentration is 34±23 ng m−3, similar to the average of the 85 d experiment.
The surface snow rBC mass concentration undergoes a daily timescale change in the surface concentration, showing up to twofold hourly increases (Fig. 3; bottom panel; smoothed dark blue line). rBC mass concentrations of approximately 15 ng g−1 were measured in the snow samples from the beginning of the sampling to the end of the second day. Later, from the beginning of the third day until the end of experiment, rBC mass concentrations show an average concentration of about 5 ng g−1 (Fig. 3). The average value over the whole sampling period is 9±5 ng g−1 (approximately 6 times higher than during the 85 d experiment). The rBC mass size distribution was characterized by a median value of the geometric means of about 230±32 nm, significantly lower than that which was measured during the 85 d, and still in agreement with previous studies (Sinha et al., 2018; Schwarz et al., 2013). The concentrations of EC and organic carbon (OC) measured in parallel snow samples (not of the same volume) are reported and described in Fig. S4; the interpretation of the differences between the rBC and the EC measurements in snow samples was beyond this paper's objectives.
The number concentration of coarse-mode particles remains stable in the first half of the experiment, until the end of April, and shows an average value over the 3 d of 26642±9261 per number of cubic milliliters. The water conductivity shows a similar behavior, and it is characterized by an average of 39±9 µS (30 % higher than during the 85 d experiment).
All the measured snow impurities show two common features (see the Supplement and Fig. S4); first, a decrease in the absolute values detected between 04:00 and 08:00 on 30 April, despite the absence of precipitation or any other particular meteorological episode (Fig. 3); second, the impact of the snow precipitation event from approximately 16:00 to midnight of 30 April, where the concentrations of aerosols in the snow slightly increased at the very beginning, whereas it decreased at the end of the event. Only the BC core diameter remained above average when the other aerosol snow content decreased (up to approximately 400 nm of mass equivalent diameter), consequently returning to the average value. The spatial variability in BC, calculated as proposed by Spolaor et al. (2019) for other species, was obtained by the analysis of five surface snow samples, collected in the four corners of the sampling area and one in the center and the following concentrations were obtained: (a) 10.17 ng g−1, (b) 10.64 ng g−1, (c) 7.04 ng g−1, (d) 11.98 ng g−1 and (e) 11.91 ng g−1, thus resulting in a spatial variability of 19 %. Clear-sky conditions where observed for the duration of the sampling period, except for the snowfall occurring at the end of the third day.
3.2.2 Statistical results
The multiple linear regression model for the 3 d experiment explains the 78 % of the snow rBC mass concentration variance, a percentage higher than the 85 d experiment, likely due to the more stable atmospheric conditions and the greater interaction with the atmosphere of the upper 3 cm of the snowpack compared with the depth resolution used during the seasonal experiment. Similarly, for the 85 d experiment, we evaluate (Fig. S4) the 10 d back-trajectory during the 3 d of the experiment. The result suggests that the air masses arriving in Ny-Ålesund during the experiment mainly originated from the Arctic Ocean.
The fitted multiple linear regression model indicates a statistically significant association between the logarithm of the rBC mass concentration in the snow and the logarithm of the conductivity (p<0.001), the logarithm of the number concentration of coarse-mode particles (p<0.001) and the occurrence of snow precipitation (p<0.001). The estimated coefficients of the covariates are reported in Table 1. In Fig. 4, the 95 % and 90 % confidence intervals for the estimated coefficients of regression models fitted to two experiments (85 d and the 3 d) are displayed. Since the covariates considered in the two experiments have quite different unit scales, Fig. 4 shows the confidence intervals for the standardized covariates. The standardization simplifies the comparison among the estimated effects of the different covariates and between the two experiments, in this way allowing a visual comparison of the estimated statistical associations between the logarithm of the snow rBC mass concentration and the considered parameters.
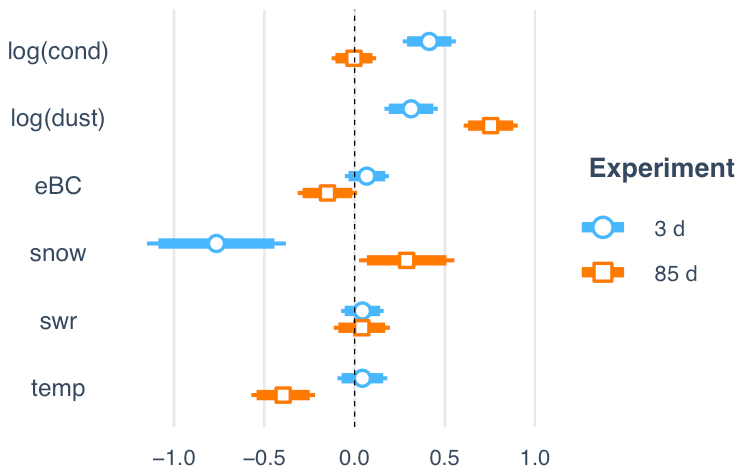
Figure 4Estimated coefficients of the standardized covariates of the multiple linear regression models fitted to the 3 and 85 d experiments. The segments correspond to 95 % confidence intervals about the corresponding estimated coefficients. The internal thicker segments correspond to 90 % confidence intervals. Intervals that do not include zero correspond to statistically significant covariates. If a confidence interval consists of positive values, then there is a significant positive association between the corresponding covariate and the logarithm of the snow rBC mass concentration conditionally to the remaining covariates and vice versa; if the confidence interval consists of negative values, then the association is negative. The abbreviations used in the plot are as follows: log(cond) – logarithm of the water conductivity time series; log(dust) – logarithm of the coarse-mode particles number concentration time series; eBC – equivalent black carbon atmospheric concentration; snow – presence of snow precipitation episodes; swr – short-wave radiation; temp – the snow temperature. The plot is produced with the R package (R Core Team, 2020) jtools (Long, 2020).
The association between the logarithm of the coarse-mode particles number concentration and the logarithm of the snow rBC mass concentration is positive and strongly significant (p<0.001), similar to what is observed for the 85 d experiment, confirming the similar behavior of these types of particles in the surface snowpack (3 cm). The association between the logarithm of conductivity and the logarithm of the snow rBC mass concentration is positive and strongly significant (p<0.001). Snow conductivity is mostly influenced by the presence of sea salt ions (mainly coming from sea spray aerosol, considering the location of the experimental site) in the snow samples. Sea spray aerosol is not considered a source of rBC, and a direct effect of the sea spray emission on the rBC snow concentration is considered negligible here. However the positive association between rBC and conductivity can be explained by the fact that both sea spray aerosol and BC particles (as well dust) undergo a similar dry deposition process (when concentration increase) favored by the stable atmospheric condition that occurred during the experiment (with the exception of the snow event during the third day) and from the similar physical removal process (concentration decrease) from the snow surface. Considering that we are exploring the rBC concentration change in the upper 3 cm, we explore the possible existence of a daily cycle. The BC particles are known to be non-volatile and not photochemically active; therefore the decrease\increase in their concentration observed during the experiment can only be driven by physical process such as wind erosion and snow deposition. However, an additional process that might drive the rBC concentration change in the upper snowpack is the condensation of water vapor on the top of the snow crystals and the formation of surface hoar, as well as the sublimation. The formation of surface hoar has the effect of adding “water” mass without BC particles in the snow surface, causing a relative rBC dilution, while sublimation has the effect of removing water mass, causing a relative concentration increase. Surface hoar and sublimation depend mainly on the temperature and solar radiation, two parameters that exhibit the diurnal cycle (Fig. 4). From the statistical analysis, no associations were found on rBC with the incoming solar radiation (at an hourly resolution) and the snow temperature during the sampling period. These results indicate that the rBC mass concentration in the surface snow does not undergo to diurnal changes, and this process is negligible in controlling the rBC snow surface concentration.
The occurrence of snow precipitation is negatively associated with the logarithm of the rBC mass concentration in the snow (p<0.001). As previously remarked, the aerosol scavenging intensity is not measurable with snow sampling strategies based on the sampling of a constant snow thickness from the surface (3 cm in this case). We tentatively explain the negative relation observed in this study with the high-frequency sampling and are able to follow the evolution of the BC particles scavenged during a snow episode (from 15:00 to 00:00 on 30 April 2015). The beginning of the precipitation episodes appeared to remove the highest amount of BC particles, leaving the atmosphere cleaner, as reflected by the lower BC mass concentration revealed in subsequent samples. The snow collected at 18:00 on 30 April showed a higher amount of rBC and the highest coarse-mode particle number concentration and conductivity. In the next few hours, from 21:00 to 00:00, the snow precipitation was depleted in terms of aerosol content and rBC mass concentration.
The seasonal and daily experiments (85 and 3 d long, respectively) suggest that the rBC concentration in the upper snow layer is not only driven by a cumulative process, as it happens when the entire annual snowpack is evaluated, but is a rather more complex process involving atmospheric, meteorological and snowpack conditions. Our results, based on a multiple linear regression model, suggest that the amount of BC in the surface snow is not associated to the BC atmospheric load. This finding suggests that, despite the potentially high atmospheric BC concentrations (as in the case of long-range transport of biomass burning plumes), this parameter does not seem to be the primary driver of the variations in the surface snow rBC over the experiment periods. In both experiments, the coarse-mode particles are positively associated with the snow BC mass concentration, suggesting that the BC and coarse-mode particles deposition undergo similar deposition and, in some cases, to post-depositional processes in the upper snowpack. Specifically, before the beginning of the melting season, the wet deposition episodes appeared to have major impacts, whereas the activation of common local sources favoring the wind suspension from uncovered areas enhancing the intensity of dry deposition processes might lead to an accelerated snow melting.
Our results also suggest that, in order to explain the observed BC mass concentration variability during seasonal and diurnal time ranges, processes other than wet and dry depositions should be considered. Surface melting episodes enrich the BC content in the surface layer not because of an enhanced deposition but mainly because of water mass loss. In particular, the snow mass loss is stronger during the snowmelt season, where an increase in the rBC concentration could significantly alter the snow albedo and further enhance the radiative absorption; hence, promoting a positive feedback. The proposed processes and the rBC concentration determined in Ny-Ålesund could be influenced by local emissions, particularly at the beginning and at the end of the snow season when the snowpack does not cover the surface homogeneously. However, the process described by our results could occur in other Arctic sites, although with different magnitudes and impacts.
The remarkable diurnal and daily variability, as well as the complex interdependent mechanisms affecting the rBC mass concentration in the Arctic surface snow, make the results of albedo-based radiative impact model of the active layer a potential source of erroneous conclusions; the impacts of long-distance biomass burning episodes might be overestimated, whereas the impact of local sources and dry deposited impurities during the melting season might be underestimated. Additional empirical studies are, therefore, necessary in order to improve our understanding of the involved physical mechanisms and to better constrain modeling studies.
Meteorological and surface radiation data are available at the PANGAEA database (https://doi.org/10.1594/PANGAEA.913988; Maturilli, 2020). The data for the precipitation amount at Ny-Ålesund can be accessed via the eKlima database of MET Norway. The BC data are available upon request.
The supplement related to this article is available online at: https://doi.org/10.5194/acp-21-12479-2021-supplement.
AS, EB, DC and MB conceived the experiments. AS, EB, DC and LP collected the samples. MB measured the samples. KM and MM provided the atmospheric eBC concentrations. SC and DC provided the back-trajectories analyses. CV performed the statistical analyses, with input from MB and AS. MB prepared the paper, mainly with input from AS, JCG and DC (in Sect. 2 from AS, KM and MM), and all co-authors contributed to interpreting the results and reviewing and editing the paper.
The authors declare that they have no conflict of interest.
Publisher’s note: Copernicus Publications remains neutral with regard to jurisdictional claims in published maps and institutional affiliations.
This work is part of the doctoral thesis (“Science and Management of Climate Change”) of Michele Bertò at the Ca' Foscari University, Venice, that was partly funded with the Early Human Impact European Research Council (ERC) project. Thanks to Giuseppe Pellegrino, for helping collect the samples. Thanks to Jacopo Gabrieli and the technicians of the Ca'Foscari University, Venice, for the precious help in building up the coarse-mode particles and conductivity measurement apparatus. We acknowledge the use of data and imagery from LANCE FIRMS operated by the NASA Goddard Space Flight Center Earth Science Data and Information System (ESDIS), with funding provided by NASA headquarters. We want to thank Paolo Laj and the LGGE (Laboratoire de glaciologie et de géophysique de l'environnement, Grenoble, France), for lending us the SP2, and Marco Zanatta, for transferring the SP2 know-how on instrumental functioning and data analyses. Thanks to Martin Gysel-Beer, Paul Scherrer Institute, for the Igor-based SP2 toolkit for SP2 data analyses. We thank Marion Maturilli and the Alfred Wegener Institute for providing us with the meteorological data. Thanks to Giorgio Bertò for checking and correcting the language of this paper.
This research has been supported by the Ministero dell'Istruzione, dell'Università e della Ricerca (AMIS) and the Horizon 2020 (ERA-PLANET; grant no. 689443).
This paper was edited by Matthias Tesche and reviewed by two anonymous referees.
Aamaas, B., Bøggild, C. E., Stordal, F., Berntsen, T., Holmèn, K., and Strùm, J.: Elemental carbon deposition to Svalbard snow from Norwegian settlements and long-range transport, Tellus B, 63, 340–351, https://doi.org/10.1111/j.1600-0889.2011.00531.x, 2011.
Arctic monitoring and assessment programme (AMAP): Work Plan 2015–2017, Working Paper, Arctic Monitoring and Assessment Programme (AMAP), available at: https://oaarchive.arctic-council.org/handle/11374/1443 (last access: 6 May 2020), 2015.
Andreae, M. O. and Merlet, P.: Emission of trace gases and aerosols from biomass burning, Global Biogeochem. Cy., 15, 955–966, https://doi.org/10.1029/2000GB001382, 2001.
Bazzano, A., Ardini, F., Becagli, S., Traversi, R., Udisti, R., Cappelletti, D., and Grotti, M.: Source assessment of atmospheric lead measured at Ny-Ålesund, Svalbard, Atmos. Environ., 113, 20–26, https://doi.org/10.1016/j.atmosenv.2015.04.053, 2015.
Bond, T. C., Anderson, T. L., and Campbell, D.: Calibration and Intercomparison of Filter-Based Measurements of Visible Light Absorption by Aerosols, Aerosol Sci. Technol., 30, 582–600, https://doi.org/10.1080/027868299304435, 1999.
Bond, T. C., Doherty, S. J., Fahey, D. W., Forster, P. M., Berntsen, T., DeAngelo, B. J., Flanner, M. G., Ghan, S., Kärcher, B., Koch, D., Kinne, S., Kondo, Y., Quinn, P. K., Sarofim, M. C., Schultz, M. G., Schulz, M., Venkataraman, C., Zhang, H., Zhang, S., Bellouin, N., Guttikunda, S. K., Hopke, P. K., Jacobson, M. Z., Kaiser, J. W., Klimont, Z., Lohmann, U., Schwarz, J. P., Shindell, D., Storelvmo, T., Warren, S. G., and Zender, C. S.: Bounding the role of black carbon in the climate system: A scientific assessment: Black carbon in the climate system, J. Geophys. Res.-Atmos., 118, 5380–5552, https://doi.org/10.1002/jgrd.50171, 2013.
Cohen, J., Screen, J. A., Furtado, J. C., Barlow, M., Whittleston, D., Coumou, D., Francis, J., Dethloff, K., Entekhabi, D., Overland, J., and Jones, J.: Recent Arctic amplification and extreme mid-latitude weather, Nat. Geosci., 7, 627–637, https://doi.org/10.1038/ngeo2234, 2014.
Comiso, J. C., Parkinson, C. L., Gersten, R., and Stock, L.: Accelerated decline in the Arctic sea ice cover, Geophys. Res. Lett., 35, L01703, https://doi.org/10.1029/2007GL031972, 2008.
Doherty, S. J., Warren, S. G., Grenfell, T. C., Clarke, A. D., and Brandt, R. E.: Light-absorbing impurities in Arctic snow, Atmos. Chem. Phys., 10, 11647–11680, https://doi.org/10.5194/acp-10-11647-2010, 2010.
Doherty, S. J., Grenfell, T. C., Forsström, S., Hegg, D. L., Warren, S. G., and Brandt, R.: Observed vertical redistribution of black carbon and other light-absorbing particles in melting snow, J. Geophys. Res., 118, 5553–5569, https://doi.org/10.1002/jgrd.50235, 2013.
Doherty, S. J., Hegg, D. A., Quinn, P. K., Johnson, J. E., Schwarz, J. P., Dang, C., and Warren, S. G.: Causes of variability in light absorption by particles in snow at sites in Idaho and Utah, J. Geophys. Res.-Atmos., 121, 4751–4768, https://doi.org/10.1002/2015JD024375, 2016.
Eckhardt, S., Hermansen, O., Grythe, H., Fiebig, M., Stebel, K., Cassiani, M., Baecklund, A., and Stohl, A.: The influence of cruise ship emissions on air pollution in Svalbard – a harbinger of a more polluted Arctic?, Atmos. Chem. Phys., 13, 8401–8409, https://doi.org/10.5194/acp-13-8401-2013, 2013.
Eckhardt, S., Quennehen, B., Olivié, D. J. L., Berntsen, T. K., Cherian, R., Christensen, J. H., Collins, W., Crepinsek, S., Daskalakis, N., Flanner, M., Herber, A., Heyes, C., Hodnebrog, Ø., Huang, L., Kanakidou, M., Klimont, Z., Langner, J., Law, K. S., Lund, M. T., Mahmood, R., Massling, A., Myriokefalitakis, S., Nielsen, I. E., Nøjgaard, J. K., Quaas, J., Quinn, P. K., Raut, J.-C., Rumbold, S. T., Schulz, M., Sharma, S., Skeie, R. B., Skov, H., Uttal, T., von Salzen, K., and Stohl, A.: Current model capabilities for simulating black carbon and sulfate concentrations in the Arctic atmosphere: a multi-model evaluation using a comprehensive measurement data set, Atmos. Chem. Phys., 15, 9413–9433, https://doi.org/10.5194/acp-15-9413-2015, 2015.
Eleftheriadis, K., Vratolis, S., and Nyeki, S.: Aerosol black carbon in the European Arctic: Measurements at Zeppelin station, Ny-Ålesund, Svalbard from 1998–2007, Geophys. Res. Lett., 36, L02809, https://doi.org/10.1029/2008GL035741, 2009.
Feltracco, M., Barbaro, E., Kirchgeorg, T., Spolaor, A., Turetta, C., Zangrando, R., Barbante, C., and Gambaro, A.: Free and combined L- and D-amino acids in Arctic aerosol, Chemosphere, 220, 412–421, https://doi.org/10.1016/j.chemosphere.2018.12.147, 2019.
Feltracco, M., Barbaro, E., Tedeschi, S., Spolaor, A., Turetta, C., Vecchiato, M., Morabito, E., Zangrando, R., Barbante, C., and Gambaro, A.: Interannual variability of sugars in Arctic aerosol: Biomass burning and biogenic inputs, Sci. Total Environ., 706, 136089, https://doi.org/10.1016/j.scitotenv.2019.136089, 2020.
Feltracco, M., Barbaro, E., Spolaor, A., Vecchiato, M., Callegaro, A., Burgay, F., Vardè, M., Maffezzoli, N., Dallo, F., Scoto, F., Zangrando, R., Barbante, C., and Gambaro, A.: Year-round measurements of size-segregated low molecular weight organic acids in Arctic aerosol, Sci. Total Environ., 763, 142954, https://doi.org/10.1016/j.scitotenv.2020.142954, 2021a.
Feltracco, M., Barbaro, E., Hoppe, C. J., Wolf, K. K., Spolaor, A., Layton, R., Keuschnig, C., Barbante, C., Gambaro, A., and Larose, C.: Airborne bacteria and particulate chemistry capture Phytoplankton bloom dynamics in an Arctic fjord, Atmos. Environ., 256, 118458, https://doi.org/10.1016/j.atmosenv.2021.118458, 2021b.
Ferrero, L., Cappelletti, D., Busetto, M., Mazzola, M., Lupi, A., Lanconelli, C., Becagli, S., Traversi, R., Caiazzo, L., Giardi, F., Moroni, B., Crocchianti, S., Fierz, M., Močnik, G., Sangiorgi, G., Perrone, M. G., Maturilli, M., Vitale, V., Udisti, R., and Bolzacchini, E.: Vertical profiles of aerosol and black carbon in the Arctic: a seasonal phenomenology along 2 years (2011–2012) of field campaigns, Atmos. Chem. Phys., 16, 12601–12629, https://doi.org/10.5194/acp-16-12601-2016, 2016.
Flanner, M. G.: Arctic climate sensitivity to local black carbon, J. Geophys. Res.-Atmos., 118, 1840–1851, https://doi.org/10.1002/jgrd.50176, 2013.
Flanner, M. G., Zender, C. S., Randerson, J. T., and Rasch, P. J.: Present-day climate forcing and response from black carbon in snow, J. Geophys. Res.-Atmos., 112, D11202, https://doi.org/10.1029/2006JD008003, 2007.
Førland, E. J., Benestad, R., Hanssen-Bauer, I., Haugen, J. E., and Skaugen, T. E.: Temperature and Precipitation Development at Svalbard 1900–2100, Adv. Meteorol., 2011, 14, https://doi.org/10.1155/2011/893790, 2011.
Forsström, S., Ström, J., Pedersen, C. A., Isaksson, E., and Gerland, S.: Elemental carbon distribution in Svalbard snow, J. Geophys. Res.-Atmos., 114, D19112, https://doi.org/10.1029/2008JD011480, 2009.
Forsström, S., Isaksson, E., Skeie, R. B., Ström, J., Pedersen, C. A., Hudson, S. R., Berntsen, T. K., Lihavainen, H., Godtliebsen, F., and Gerland, S.: Elemental carbon measurements in European Arctic snowpacks, J. Geophys. Res.-Atmos., 118, 13614–13627, https://doi.org/10.1002/2013JD019886, 2013.
Gallet, J. C., Björkman, M., Larose, C., Luks, B.., Martma, T., and Zdanowics, C. (Eds): Protocols and recommendations for the measurement of snow physical properties, and sampling of snow for black carbon, water isotopes, major ions and micro-organisms, Norwegian Polar Institute, Kortrapport/Brief Report no. 046, ISBN 978-82-7666-415-7, awailable at: https://www.npolar.no/ (last access: 23 March 2021), 2018.
Gogoi, M. M., Babu, S. S., Moorthy, K. K., Thakur, R. C., Chaubey, J. P., and Nair, V. S.: Aerosol black carbon over Svalbard regions of Arctic, Polar Sci., 10, 60–70, https://doi.org/10.1016/j.polar.2015.11.001, 2016.
Gundel, L. A., Dod, R. L., Rosen, H., and Novakov, T.: Relationship between optical attenuation and black carbon concentration for ambient and source particles, Lawrence Berkeley Lab., CA, USA, available at: https://www.osti.gov/biblio/5653266 (last access: 7 May 2020), 1983.
Hadley, O. L. and Kirchstetter, T. W.: Black-carbon reduction of snow albedo, Nat. Clim. Change, 2, 437–440, https://doi.org/10.1038/nclimate1433, 2012.
Hansen, J. and Nazarenko, L.: Soot climate forcing via snow and ice albedos, P. Natl. Acad. Sci. USA, 101, 423–428, https://doi.org/10.1073/pnas.2237157100, 2004.
Ingersoll, G. P., Campbell, D., Alisa Mast, M., Clow, D. W., Nanus, L., and Frakes, B.: Snowpack Chemistry Monitoring Protocol for the Rocky Mountain Network, Narrative and Standard Operating Procedures, United States Geological Service (USGS), Administrative Report, Reston, Virginia, 2009.
Jacobi, H.-W., Obleitner, F., Da Costa, S., Ginot, P., Eleftheriadis, K., Aas, W., and Zanatta, M.: Deposition of ionic species and black carbon to the Arctic snowpack: combining snow pit observations with modeling, Atmos. Chem. Phys., 19, 10361–10377, https://doi.org/10.5194/acp-19-10361-2019, 2019.
Khan, A. L., Dierssen, H., Schwarz, J. P., Schmitt, C., Chlus, A., Hermanson, M., Painter, T. H., and McKnight, D. M.: Impacts of coal coarse mode from an active mine on the spectral reflectance of Arctic surface snow in Svalbard, Norway, J. Geophys. Res.-Atmos., 122, 1767–1778, https://doi.org/10.1002/2016JD025757, 2017.
Kohler, J. and Aanes, R.: Effect of Winter Snow and Ground-Icing on a Svalbard Reindeer Population: Results of a Simple Snowpack Model, Arctic Alpine Res., 36, 333–341, https://doi.org/10.1657/1523-0430(2004)036[0333:EOWSAG]2.0.CO;2, 2004.
Laborde, M., Crippa, M., Tritscher, T., Jurányi, Z., Decarlo, P. F., Temime-Roussel, B., Marchand, N., Eckhardt, S., Stohl, A., Baltensperger, U., Prévôt, A. S. H., Weingartner, E., and Gysel, M.: Black carbon physical properties and mixing state in the European megacity Paris, Atmos. Chem. Phys., 13, 5831–5856, https://doi.org/10.5194/acp-13-5831-2013, 2013.
Laj, P., Bigi, A., Rose, C., Andrews, E., Lund Myhre, C., Collaud Coen, M., Lin, Y., Wiedensohler, A., Schulz, M., Ogren, J. A., Fiebig, M., Gliß, J., Mortier, A., Pandolfi, M., Petäja, T., Kim, S.-W., Aas, W., Putaud, J.-P., Mayol-Bracero, O., Keywood, M., Labrador, L., Aalto, P., Ahlberg, E., Alados Arboledas, L., Alastuey, A., Andrade, M., Artíñano, B., Ausmeel, S., Arsov, T., Asmi, E., Backman, J., Baltensperger, U., Bastian, S., Bath, O., Beukes, J. P., Brem, B. T., Bukowiecki, N., Conil, S., Couret, C., Day, D., Dayantolis, W., Degorska, A., Eleftheriadis, K., Fetfatzis, P., Favez, O., Flentje, H., Gini, M. I., Gregorič, A., Gysel-Beer, M., Hallar, A. G., Hand, J., Hoffer, A., Hueglin, C., Hooda, R. K., Hyvärinen, A., Kalapov, I., Kalivitis, N., Kasper-Giebl, A., Kim, J. E., Kouvarakis, G., Kranjc, I., Krejci, R., Kulmala, M., Labuschagne, C., Lee, H.-J., Lihavainen, H., Lin, N.-H., Löschau, G., Luoma, K., Marinoni, A., Martins Dos Santos, S., Meinhardt, F., Merkel, M., Metzger, J.-M., Mihalopoulos, N., Nguyen, N. A., Ondracek, J., Pérez, N., Perrone, M. R., Petit, J.-E., Picard, D., Pichon, J.-M., Pont, V., Prats, N., Prenni, A., Reisen, F., Romano, S., Sellegri, K., Sharma, S., Schauer, G., Sheridan, P., Sherman, J. P., Schütze, M., Schwerin, A., Sohmer, R., Sorribas, M., Steinbacher, M., Sun, J., Titos, G., Toczko, B., Tuch, T., Tulet, P., Tunved, P., Vakkari, V., Velarde, F., Velasquez, P., Villani, P., Vratolis, S., Wang, S.-H., Weinhold, K., Weller, R., Yela, M., Yus-Diez, J., Zdimal, V., Zieger, P., and Zikova, N.: A global analysis of climate-relevant aerosol properties retrieved from the network of Global Atmosphere Watch (GAW) near-surface observatories, Atmos. Meas. Tech., 13, 4353–4392, https://doi.org/10.5194/amt-13-4353-2020, 2020.
Law, K. S. and Stohl, A.: Arctic Air Pollution: Origins and Impacts, Science, 315, 1537–1540, https://doi.org/10.1126/science.1137695, 2007.
Lim, S., Faïn, X., Zanatta, M., Cozic, J., Jaffrezo, J.-L., Ginot, P., and Laj, P.: Refractory black carbon mass concentrations in snow and ice: method evaluation and inter-comparison with elemental carbon measurement, Atmos. Meas. Tech., 7, 3307–3324, https://doi.org/10.5194/amt-7-3307-2014, 2014.
Liu, J., Fan, S., Horowitz, L. W., and Levy, H.: Evaluation of factors controlling long-range transport of black carbon to the Arctic, J. Geophys. Res.-Atmos., 116, D04307, https://doi.org/10.1029/2010JD015145, 2011.
Long, J. A.: jtools: Analysis and Presentation of Social Scientific Data, available at: https://cran.r-project.org/package=jtools (last access: 22 June 2021), 2020.
Lupi, A., Busetto, M., Becagli, S., Giardi, F., Lanconelli, C., Mazzola, M., Udisti, R., Hansson, H.-C., Henning, T., Petkov, B., Ström, J., Krejci, R., Tunved, P., Viola, A. P., and Vitale, V.: Multi-seasonal ultrafine aerosol particle number concentration measurements at the Gruvebadet observatory, Ny-Ålesund, Svalbard Islands, Rend. Lincei, 27, 59–71, https://doi.org/10.1007/s12210-016-0532-8, 2016.
Maturilli, M., Herber, A., and König-Langlo, G.: Climatology and time series of surface meteorology in Ny-Ålesund, Svalbard, Earth Syst. Sci. Data, 5, 155–163, https://doi.org/10.5194/essd-5-155-2013, 2013.
Maturilli, M., Herber, A., and König-Langlo, G.: Surface radiation climatology for Ny-Ålesund, Svalbard (78.9∘ N), basic observations for trend detection, Theor. Appl. Climatol., 120, 331–339, https://doi.org/10.1007/s00704-014-1173-4, 2015.
Maturilli, M., Hanssen-Bauer, I., Neuber, R., Rex, M., and Edvardsen, K.: The Atmosphere Above Ny-Ålesund: Climate and Global Warming, Ozone and Surface UV Radiation, in: The Ecosystem of Kongsfjorden, Svalbard, edited by: Hop, H. and Wiencke, C., 23–46, Springer International Publishing, Cham, 2019.
Maturilli, M.: Basic and other measurements of radiation and continuous meteorological observations at station Ny-Ålesund (April, May 2014 and April, May, June 2015), reference list of 10 datasets, Alfred Wegener Institute – Research Unit Potsdam, PANGAEA [data set], https://doi.org/10.1594/PANGAEA.913988, 2020.
Meinander, O., Heikkinen, E., Aurela, M., and Hyvärinen, A.: Sampling, Filtering, and Analysis Protocols to Detect Black Carbon, Organic Carbon, and Total Carbon in Seasonal Surface Snow in an Urban Background and Arctic Finland (>60∘ N), Atmosphere, 11, 923, https://doi.org/10.3390/atmos11090923, 2020.
Moosmüller, H., Chakrabarty, R. K., and Arnott, W. P.: Aerosol light absorption and its measurement: A review, J. Quant. Spectrosc. Radiat. Transf., 110, 844–878, https://doi.org/10.1016/j.jqsrt.2009.02.035, 2009.
Mori, T., Goto-Azuma, K., Kondo, Y., Ogawa-Tsukagawa, Y., Miura, K., Hirabayashi, M., Oshima, N., Koike, M., Kupiainen, K., Moteki, N., Ohata, S., Sinha, P. R., Sugiura, K., Aoki, T., Schneebeli, M., Steffen, K., Sato, A., Tsushima, A., Makarov, V., Omiya, S., Sugimoto, A., Takano, S., and Nagatsuka, N.: Black Carbon and Inorganic Aerosols in Arctic Snowpack, J. Geophys. Res.-Atmos., 124, 13325–13356, https://doi.org/10.1029/2019JD030623, 2019.
Moroni, B., Becagli, S., Bolzacchini, E., Busetto, M., Cappelletti, D., Crocchianti, S., Ferrero, L., Frosini, D., Lanconelli, C., Lupi, A., Maturilli, M., Mazzola, M., Perrone, M. G., Sangiorgi, G., Traversi, R., Udisti, R., Viola, A., and Vitale, V.: Vertical Profiles and Chemical Properties of Aerosol Particles upon Ny-Ålesund (Svalbard Islands), Adv. Meteorol., 2015, e292081, https://doi.org/10.1155/2015/292081, 2015.
Moroni, B., Arnalds, O., Dagsson-Waldhauserová, P., Crocchianti, S., Vivani, R., and Cappelletti, D.: Mineralogical and Chemical Records of Icelandic Coarse mode Sources Upon Ny-Ålesund (Svalbard Islands), Front. Earth Sci., 6, 187, https://doi.org/10.3389/feart.2018.00187, 2018.
Moroni, B., Ritter, C., Crocchianti, S., Markowicz, K., Mazzola, M., Becagli, S., Traversi, R., Krejci, R., Tunved, P., and Cappelletti, D.: Individual particle characteristics, optical properties and evolution of an extreme long-range transported biomass burning event in the European Arctic (Ny-Ålesund, Svalbard Islands), J. Geophys. Res.-Atmos., 125, e2019JD031535, https://doi.org/10.1029/2019JD031535, 2020.
Motos, G., Schmale, J., Corbin, J. C., Modini, Rob. L., Karlen, N., Bertò, M., Baltensperger, U., and Gysel-Beer, M.: Cloud droplet activation properties and scavenged fraction of black carbon in liquid-phase clouds at the high-alpine research station Jungfraujoch (3580 m a.s.l.), Atmos. Chem. Phys., 19, 3833–3855, https://doi.org/10.5194/acp-19-3833-2019, 2019.
Osmont, D., Wendl, I. A., Schmidely, L., Sigl, M., Vega, C. P., Isaksson, E., and Schwikowski, M.: An 800-year high-resolution black carbon ice core record from Lomonosovfonna, Svalbard, Atmos. Chem. Phys., 18, 12777–12795, https://doi.org/10.5194/acp-18-12777-2018, 2018.
Pedersen, C. A., Gallet, J.-C., Ström, J., Gerland, S., Hudson, S. R., Forsström, S., Isaksson, E., and Berntsen, T. K.: In situ observations of black carbon in snow and the corresponding spectral surface albedo reduction, J. Geophys. Res.-Atmos., 120, 1476–1489, https://doi.org/10.1002/2014JD022407, 2015.
Perovich, D.: Light reflection and transmission by a temperate snow cover, J. Glaciol., 53, 201–210, https://doi.org/10.3189/172756507782202919, 2007
Petzold, A., Ogren, J. A., Fiebig, M., Laj, P., Li, S.-M., Baltensperger, U., Holzer-Popp, T., Kinne, S., Pappalardo, G., Sugimoto, N., Wehrli, C., Wiedensohler, A., and Zhang, X.-Y.: Recommendations for reporting “black carbon” measurements, Atmos. Chem. Phys., 13, 8365–8379, https://doi.org/10.5194/acp-13-8365-2013, 2013.
R Core Team: R: A language and environment for statistical computing. R Foundation for Statistical Computing, Vienna, Austria, available at: https://www.R-project.org/ (last access: 22 June 2021), 2020.
Ruppel, M. M., Soares, J., Gallet, J.-C., Isaksson, E., Martma, T., Svensson, J., Kohler, J., Pedersen, C. A., Manninen, S., Korhola, A., and Ström, J.: Do contemporary (1980–2015) emissions determine the elemental carbon deposition trend at Holtedahlfonna glacier, Svalbard?, Atmos. Chem. Phys., 17, 12779–12795, https://doi.org/10.5194/acp-17-12779-2017, 2017.
Scalabrin, E., Zangrando, R., Barbaro, E., Kehrwald, N. M., Gabrieli, J., Barbante, C., and Gambaro, A.: Amino acids in Arctic aerosols, Atmos. Chem. Phys., 12, 10453–10463, https://doi.org/10.5194/acp-12-10453-2012, 2012.
Schmale, J., Arnold, S. R., Law, K. S., Thorp, T., Anenberg, S., Simpson, W. R., Mao, J., and Pratt, K. A.: Local Arctic Air Pollution: A Neglected but Serious Problem, Earths Future, 6, 1385–1412, https://doi.org/10.1029/2018EF000952, 2018.
Schwarz, J. P., Gao, R. S., Perring, A. E., Spackman, J. R., and Fahey, D. W.: Black carbon aerosol size in snow, Sci. Rep., 3, 1–5, https://doi.org/10.1038/srep01356, 2013.
Screen, J. A. and Simmonds, I.: The central role of diminishing sea ice in recent Arctic temperature amplification, Nature, 464, 1334–1337, https://doi.org/10.1038/nature09051, 2010.
Segura, S., Estellés, V., Titos, G., Lyamani, H., Utrillas, M. P., Zotter, P., Prévôt, A. S. H., Močnik, G., Alados-Arboledas, L., and Martínez-Lozano, J. A.: Determination and analysis of in situ spectral aerosol optical properties by a multi-instrumental approach, Atmos. Meas. Tech., 7, 2373–2387, https://doi.org/10.5194/amt-7-2373-2014, 2014.
Serreze, M. C. and Barry, R. G.: Processes and impacts of Arctic amplification: A research synthesis, Global Planet. Change, 77, 85–96, https://doi.org/10.1016/j.gloplacha.2011.03.004, 2011.
Sharma, S., Leaitch, W. R., Huang, L., Veber, D., Kolonjari, F., Zhang, W., Hanna, S. J., Bertram, A. K., and Ogren, J. A.: An evaluation of three methods for measuring black carbon in Alert, Canada, Atmos. Chem. Phys., 17, 15225–15243, https://doi.org/10.5194/acp-17-15225-2017, 2017.
Sinha, P. R., Kondo, Y., Koike, M., Ogren, J., Jefferson, A., Barrett, T., Sheesley, R., Ohata, S., Moteki, N., Coe, H., Liu, D., Irwin, M., Tunved, P., Quinn, P. K., and Zhao, Y.: Evaluation of ground-based black carbon measurements by filter-based photometers at two Arctic sites, J. Geophys. Res., 122, 3544–3572, https://doi.org/10.1002/2016JD025843, 2017.
Sinha, P. R., Kondo, Y., Goto-Azuma, K., Tsukagawa, Y., Fukuda, K., Koike, M., Ohata, S., Moteki, N., Mori, T., Oshima, N., Førland, E. J., Irwin, M., Gallet, J.-C., and Pedersen, C. A.: Seasonal Progression of the Deposition of Black Carbon by Snowfall at Ny-Ålesund, Spitsbergen: Deposition of Black Carbon in Spitsbergen, J. Geophys. Res.-Atmos., 123, 997–1016, https://doi.org/10.1002/2017JD028027, 2018.
Skiles, S. M. and Painter, T. H.: Toward Understanding Direct Absorption and Grain Size Feedbacks by Coarse mode Radiative Forcing in Snow With Coupled Snow Physical and Radiative Transfer Modeling, Water Resour. Res., 55, 7362–7378, https://doi.org/10.1029/2018WR024573, 2019.
Skiles, S. M., Flanner, M., Cook, J. M., Dumont, M., and Painter, T. H.: Radiative forcing by light-absorbing particles in snow, Nat. Clim. Change, 8, 964–971, https://doi.org/10.1038/s41558-018-0296-5, 2018.
Spolaor, A., Barbaro, E., Cappelletti, D., Turetta, C., Mazzola, M., Giardi, F., Björkman, M. P., Lucchetta, F., Dallo, F., Pfaffhuber, K. A., Angot, H., Dommergue, A., Maturilli, M., Saiz-Lopez, A., Barbante, C., and Cairns, W. R. L.: Diurnal cycle of iodine, bromine, and mercury concentrations in Svalbard surface snow, Atmos. Chem. Phys., 19, 13325–13339, https://doi.org/10.5194/acp-19-13325-2019, 2019.
Stohl, A., Klimont, Z., Eckhardt, S., Kupiainen, K., Shevchenko, V. P., Kopeikin, V. M., and Novigatsky, A. N.: Black carbon in the Arctic: the underestimated role of gas flaring and residential combustion emissions, Atmos. Chem. Phys., 13, 8833–8855, https://doi.org/10.5194/acp-13-8833-2013, 2013.
Tunved, P., Ström, J., and Krejci, R.: Arctic aerosol life cycle: linking aerosol size distributions observed between 2000 and 2010 with air mass transport and precipitation at Zeppelin station, Ny-Ålesund, Svalbard, Atmos. Chem. Phys., 13, 3643–3660, https://doi.org/10.5194/acp-13-3643-2013, 2013.
Turetta, C., Feltracco, M., Barbaro, E., Spolaor, A., Barbante, C., and Gambaro, A.: A Year-Round Measurement of Water-Soluble Trace and Rare Earth Elements in Arctic Aerosol: Possible Inorganic Tracers of Specific Events, Atmosphere, 12, 694, https://doi.org/10.3390/atmos12060694, 2021.
Vecchiato, M., Barbaro, E., Spolaor, A., Burgay, F., Barbante, C., Piazza, R., and Gambaro, A., Fragrances and PAHs in snow and seawater of Ny-Ålesund (Svalbard): Local and long-range contamination, Environ. Pollut., 242, 1740–1747, https://doi.org/10.1016/j.envpol.2018.07.095, 2018.
Weingartner, E., Saathoff, H., Schnaiter, M., Streit, N., Bitnar, B., and Baltensperger, U.: Absorption of light by soot particles: determination of the absorption coefficient by means of aethalometers, J. Aerosol Sci., 34, 1445–1463, https://doi.org/10.1016/S0021-8502(03)00359-8, 2003.
Wendl, I. A., Menking, J. A., Färber, R., Gysel, M., Kaspari, S. D., Laborde, M. J. G., and Schwikowski, M.: Optimized method for black carbon analysis in ice and snow using the Single Particle Soot Photometer, Atmos. Meas. Tech., 7, 2667–2681, https://doi.org/10.5194/amt-7-2667-2014, 2014.
Xu, B., Yao, T., Liu, X., and Wang, N.: Elemental and organic carbon measurements with a two-step heating gas chromatography system in snow samples from the Tibetan Plateau, Ann. Glaciol., 43, 257–262, https://doi.org/10.3189/172756406781812122, 2006.
Yasunari, T. J., Tan, Q., Lau, K.-M., Bonasoni, P., Marinoni, A., Laj, P., Ménégoz, M., Takemura, T., and Chin, M.: Estimated range of black carbon dry deposition and the related snow albedo reduction over Himalayan glaciers during dry pre-monsoon periods, Atmos. Environ., 78, 259–267, https://doi.org/10.1016/j.atmosenv.2012.03.031, 2013.
Zanatta, M., Gysel, M., Bukowiecki, N., Müller, T., Weingartner, E., Areskoug, H., Fiebig, M., Yttri, K. E., Mihalopoulos, N., Kouvarakis, G., Beddows, D., Harrison, R. M., Cavalli, F., Putaud, J. P., Spindler, G., Wiedensohler, A., Alastuey, A., Pandolfi, M., Sellegri, K., Swietlicki, E., Jaffrezo, J. L., Baltensperger, U., and Laj, P.: A European aerosol phenomenology-5: Climatology of black carbon optical properties at 9 regional background sites across Europe, Atmos. Environ., 145, 346–364, https://doi.org/10.1016/j.atmosenv.2016.09.035, 2016.
Zanatta, M., Laj, P., Gysel, M., Baltensperger, U., Vratolis, S., Eleftheriadis, K., Kondo, Y., Dubuisson, P., Winiarek, V., Kazadzis, S., Tunved, P., and Jacobi, H.-W.: Effects of mixing state on optical and radiative properties of black carbon in the European Arctic, Atmos. Chem. Phys., 18, 14037–14057, https://doi.org/10.5194/acp-18-14037-2018, 2018.
Zangrando, R., Barbaro, E., Zennaro, P., Rossi, S., Kehrwald, N. M., Gabrieli, J., Barbante, C., and Gambaro, A.: Molecular Markers of Biomass Burning in Arctic Aerosols, Environ. Sci. Technol., 47, 8565–8574, https://doi.org/10.1021/es400125r, 2013.