the Creative Commons Attribution 4.0 License.
the Creative Commons Attribution 4.0 License.
 | 11 Aug 2021
Preconditioning of overcast-to-broken cloud transitions by riming in marine cold air outbreaks
Andrew S. Ackerman
Ann M. Fridlind
Marine cold air outbreaks (CAOs) commonly form overcast cloud decks that transition into broken cloud fields downwind, dramatically altering the local radiation budget. In this study, we investigate the impact of frozen hydrometeors on these transitions. We focus on a CAO case in the NW Atlantic, the location of the multi-year flight campaign ACTIVATE (Aerosol Cloud meTeorology Interactions oVer the western ATlantic Experiment). We use MERRA-2 (Modern-Era Retrospective analysis for Research and Applications, version 2) reanalysis fields to drive large eddy simulations with mixed-phase two-moment microphysics in a Lagrangian framework. We find that transitions are triggered by substantial rain (rainwater paths >25 g m−2), and only simulations that allow for aerosol depletion result in sustained breakups, as observed. Using a range of diagnostic ice nucleating particle concentrations, Ninp, we find that increasing ice progressively accelerates transitions, thus abbreviating the overcast state. Ice particles affect the cloud-topped boundary layer evolution, primarily through riming-related processes prior to substantial rain, leading to (1) a reduction in cloud liquid water, (2) early consumption of cloud condensation nuclei, and (3) early and light precipitation cooling and moistening below cloud. We refer to these three effects collectively as “preconditioning by riming”. Greater boundary layer aerosol concentrations available as cloud condensation nuclei (CCN) delay the onset of substantial rain. However, cloud breakup and low CCN concentration final stages are found to be inevitable in this case, due, primarily, to liquid water path buildup. An ice-modulated cloud transition speed suggests the possibility of a negative cloud–climate feedback. To address prevailing uncertainties in the model representation of mixed-phase processes, the magnitude of ice formation and riming impacts and, thereby, the strength of an associated negative cloud–climate feedback process, requires further observational evaluation by targeting riming hot spots with in situ imaging probes that allow for both the characterization of ice particles and abundance of supercooled droplets.
- Article
(5816 KB) - Full-text XML
- BibTeX
- EndNote


Planetary boundary layer (PBL) clouds are common over the world's oceans, where they often substantially enhance the reflection of sunlight from otherwise dark ocean surfaces, while less affecting the emission of terrestrial radiation owing to typically modest differences between cloud-top and surface temperatures (e.g., Hartmann et al., 1992; L'Ecuyer et al., 2019). Marine cold air outbreaks (CAOs) are associated with a particular form of PBL cloud. At mid-latitudes, they commonly occur in post-frontal conditions of extratropical synoptic systems during winter and its shoulder seasons (Kolstad et al., 2009; Fletcher et al., 2016). The rapid advection of cold air masses over a relatively warm ocean surface induces extremely large surface heat fluxes of O(102–103 W m−2), while the PBL is capped by strong subsidence at rates of O(101–102 mm s−1) (Papritz et al., 2015; Papritz and Spengler, 2017). Both surface fluxes and subsidence rates exceed conditions in commonly studied PBL systems (e.g., Roberts et al., 2012; Myers and Norris, 2013) by an order of magnitude or more. Liquid and also ice condensate rapidly increase, often initially as cloud streets that lead to near-overcast cloud decks with roll-like structures. Further downwind, the overcast cloud deck generally breaks apart into an open cellular structure (Brümmer, 1999; Pithan et al., 2019). Understanding the transition from the overcast-to-broken state is crucial to authentically capture observed CAO radiative effects (McCoy et al., 2017) in Earth system models and numerical weather predictions. Prior studies have demonstrated deficits in current models in terms of their ability to represent CAOs (e.g., Abel et al., 2017; Field et al., 2014), which can result in substantial deviations from satellite-inferred radiative effects (Rémillard and Tselioudis, 2015).
Transitions from overcast to broken cloud decks have been primarily studied in the context of stratocumulus-to-cumulus (SCT) or closed-to-open cell transitions. To better understand the controlling mechanisms, in situ observations have been collected (e.g., Albrecht et al., 1995, 2019), satellite-based retrievals have been compiled (e.g., Sandu et al., 2010; Eastman and Wood, 2016; Mohrmann et al., 2019; Christensen et al., 2020), and high-resolution simulations have been performed (e.g., Wyant et al., 1997; Wang et al., 2010; Sandu and Stevens, 2011). The classic SCT theory indicates that transitions are governed by progressive PBL deepening and decoupling arising from advection towards warmer waters and subsequently growing surface fluxes (Bretherton and Wyant, 1997; Sandu and Stevens, 2011). Other factors, like downwelling longwave radiation (Sandu and Stevens, 2011) and the intensity of large-scale subsidence (van der Dussen et al., 2016), further modify SCTs. In this study, we address precipitation-induced transitions – a mechanism well-studied for warm cloud transitions from closed to open cells. Precipitation stabilizes the PBL through evaporation of rain and drizzle below cloud, leading to a modulation from a stratiform to a more convective regime (Paluch and Lenschow, 1991; Stevens et al., 1998). Studies that have considered the interactions between precipitation and aerosol that serve as cloud condensation nuclei (CCN; e.g., Yamaguchi et al., 2017; Goren et al., 2019) have demonstrated that (1) precipitation formation requires microphysical collision and collection processes between cloud droplets, and also raindrops, effectively reducing the number of CCN in the PBL, and (2) reduced CCN distribute the cloud condensate over fewer droplets, accelerating raindrop formation. Together, these two effects may lead to a positive feedback that is irreversible in typical meteorological and aerosol scenarios and represent a notable permutation of classic SCT theory. Observations confirm the (local) relation of precipitation and ultra-clean conditions (i.e., low CCN concentrations) by comparing neighboring closed and open cells (Terai et al., 2014), sampling the same air mass before and after the transition (Sarkar et al., 2020; Eastman and Wood, 2016), or inferring processes via satellite imagery upwind from ground-based aerosol observations (Wood et al., 2017) or aircraft observations (Ahn et al., 2017).
CAOs typically produce mixed-phase clouds that – however formed – are a particular source of uncertainty in climate projections (McCoy et al., 2015). To better understand mixed-phase clouds, many studies have simulated relatively quiescent Arctic clouds and explored their response to various meteorological conditions (e.g., Young et al., 2018) or microphysical compositions (e.g., Eirund et al., 2019). Other studies focused on cloud–aerosol interactions to highlight the presence of clouds despite the low CCN concentration environment in higher latitudes (Stevens et al., 2018) and to show how seeding from ship emissions might affect mixed-phase cloud properties (Possner et al., 2017). Understanding sources and sinks of ice nuclei is another area of ongoing research (e.g., Solomon et al., 2015). Several field campaigns have obtained measurements during CAOs, such as M-PACE (Mixed-Phase Arctic Cloud Experiment; Shupe et al., 2008) and ACCACIA (Aerosol–Cloud Coupling And Climate Interactions in the Arctic; Young et al., 2016). In these rapidly evolving mixed-phase clouds that develop high liquid and ice water contents, microphysical processes may potentially be amplified compared with more quiescent conditions. Observational evidence indicates an active riming process in areas of high liquid water content (e.g., Fridlind and Ackerman, 2018) that can also coincide with locally reduced droplet number concentrations (e.g., Huang et al., 2017). In turn, riming – a process that collects droplets and, thus, reduces condensation nuclei by number – has the potential to transition high CCN concentration states away from a regime that is considered potentially stable (Baker and Charlson, 1990).
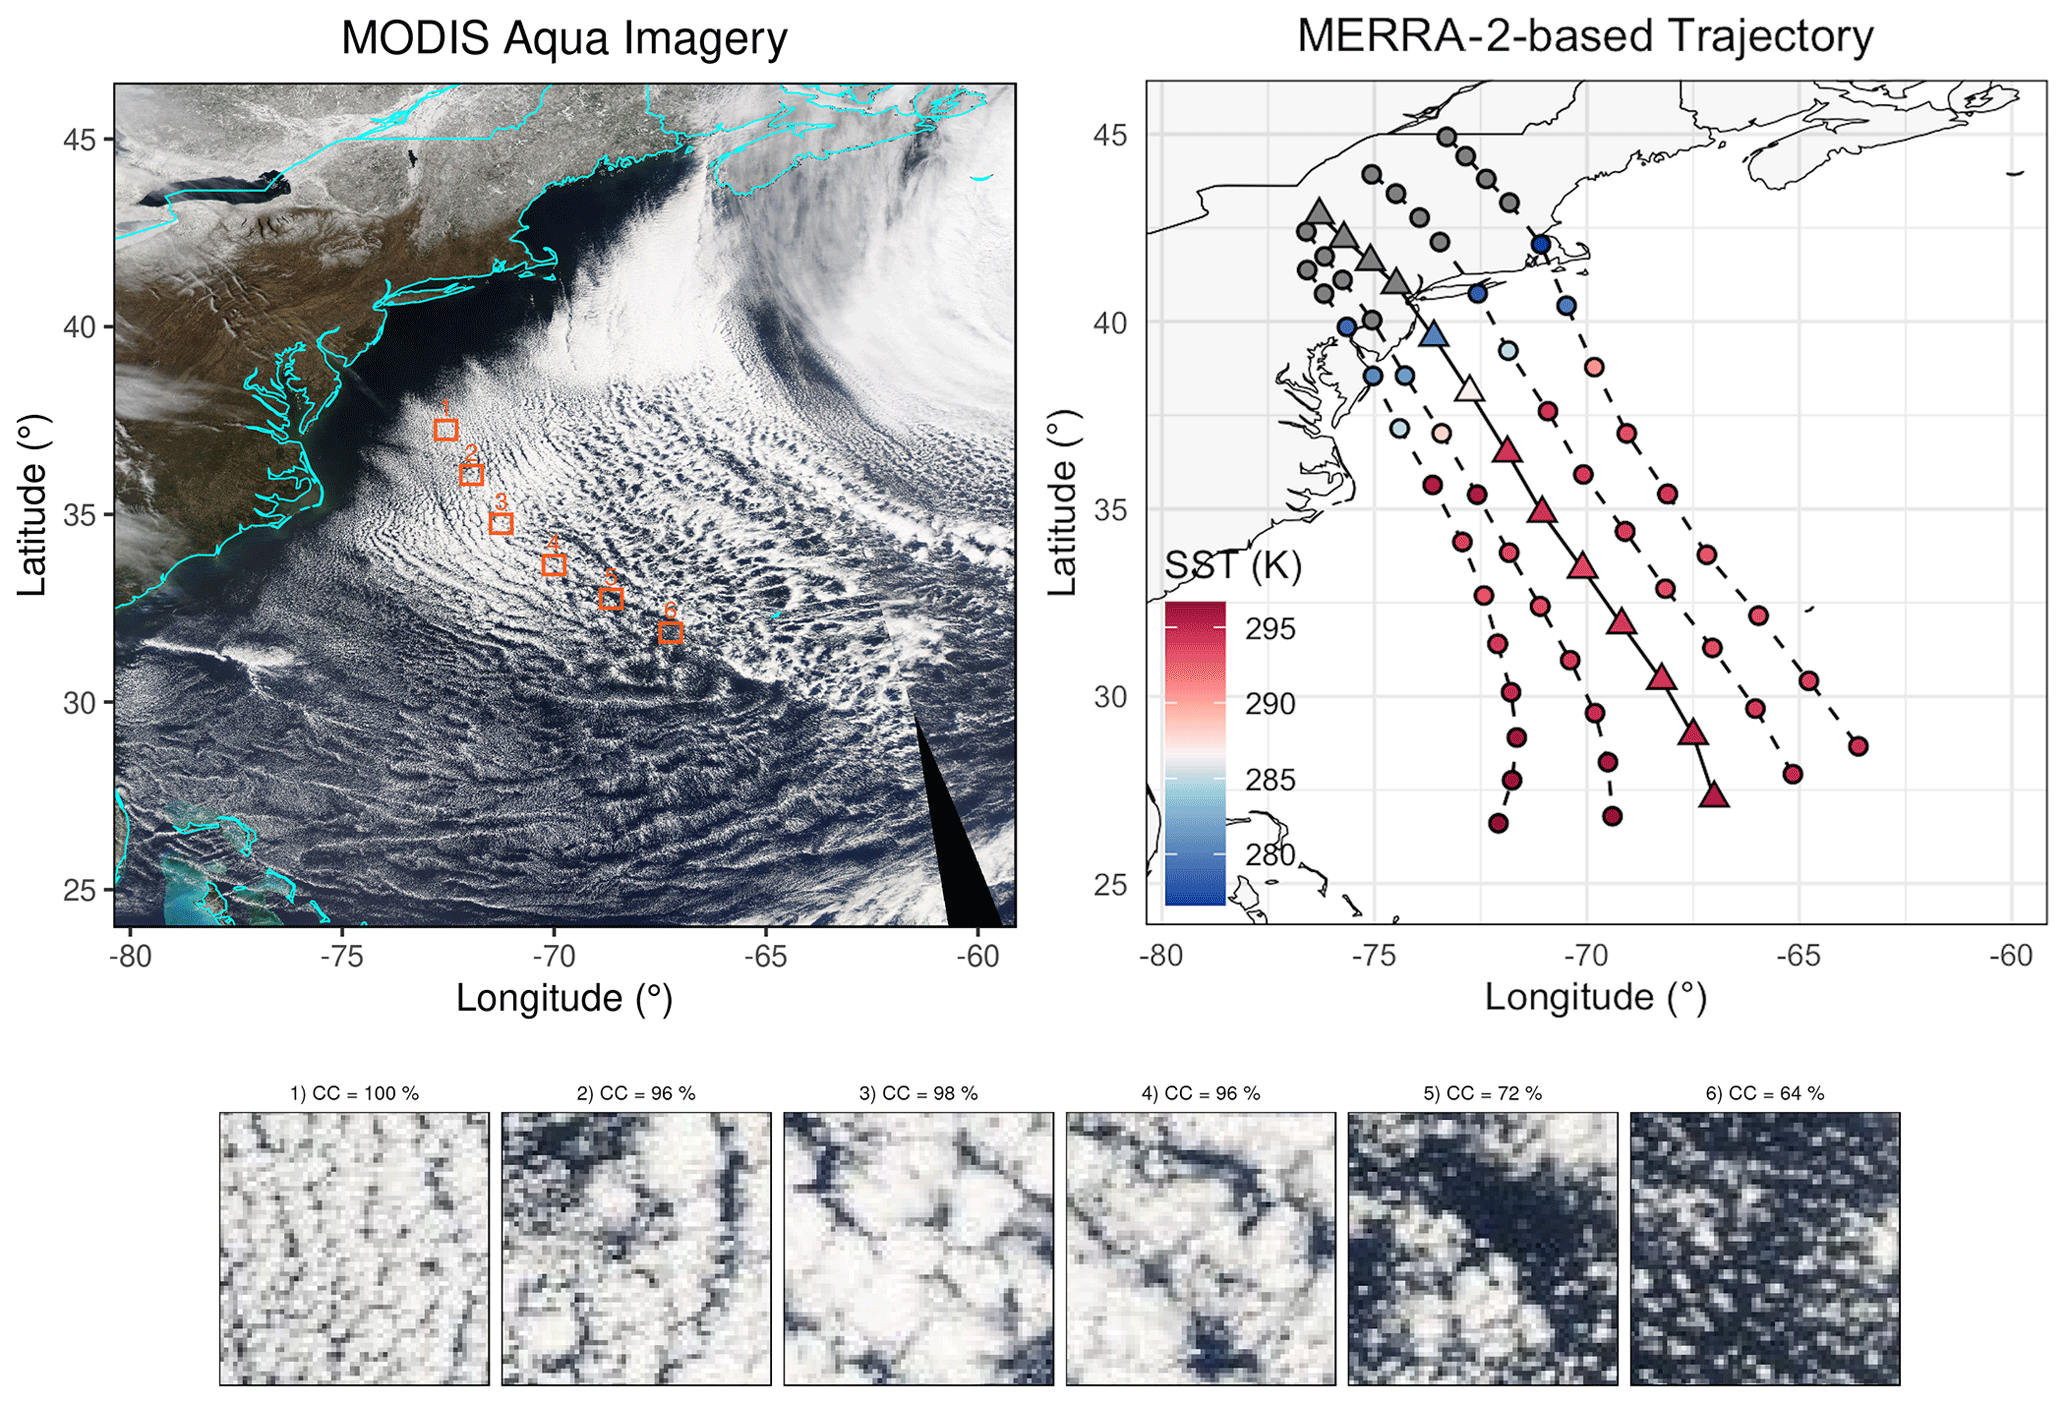
Figure 1(a) Cold air outbreak on 17 March 2008 as seen from MODIS Aqua (courtesy of NASA Worldview). (b) Near-surface trajectories from MERRA-2, shown in 3 h steps, spanning ∼24 h (or ∼1500 km). Large triangles and the solid line mark the trajectory used for simulations, while circles and dashed lines indicate neighboring trajectories. (c) Detailed (0.5∘)2 regions (marked in Fig. 1a). Titles report cloud cover determined from MYD06 data as the portion of (1 km)2 pixels, with a cloud optical thickness greater then or equal to 2.5.
This study concerns the role of frozen hydrometeors in CAO closed-to-broken cloud transitions. The reduction in liquid water path that results from the competition for condensate when ice is present could retard a rain-induced transition. On the other hand, simulations of mixed-phase clouds and increased ice number concentrations suggest a more rapid decay of optically thick clouds owing to intensified snowfall that cools and moistens layers below cloud through sublimation or melting and evaporation (e.g., Eirund et al., 2019). A general increase in precipitation in the presence of ice, as found in cumulus clouds (Knight et al., 1974) and across various cloud types (Field and Heymsfield, 2015), could be expected to further support a more rapid breakup. Therefore, we pose the question of whether ice could slow or hasten transitions from overcast to broken clouds in CAOs. To address this question, we select a case in the NW Atlantic, the study area of the multi-year campaign ACTIVATE (Aerosol Cloud meTeorology Interactions oVer the western ATlantic Experiment; Sorooshian et al., 2019) that dedicates its resources during wintertime and shoulder seasons to CAOs and should allow the evaluation of the generality of results found here. We assume the Lagrangian perspective in large eddy simulations by using a domain that follows the PBL flow, guided by input from MERRA-2 (Modern-Era Retrospective analysis for Research and Applications, version 2) reanalysis. We diagnose characteristic events for each simulation, that is, the start and end of an overcast state and the onset of substantial precipitation. We then examine how adding ice processes impacts the timing of those events. We note that our investigation differs from the Eirund et al. (2019) study of idle Arctic stratocumulus organization in the following two respects: (1) our meteorological context of a CAO in which the mean winds are not only not still but gale force and (2) our focus on CCN depletion, which is critical to the downwind cloud transition here.
In the following, we briefly describe the selected CAO case (Sect. 2.1), the large eddy simulation (LES) code (Sect. 2.2), and the setup of our simulations (Sect. 2.3).
2.1 A cold air outbreak in the NW Atlantic
This study focuses on a CAO that occurred between 17 and 19 March 2008 in the NW Atlantic (Fig. 1a), following the passage of a cold front as part of an eastward-traveling low-pressure system. This CAO constitutes a shoulder season event and was selected on the basis of weather state analysis of satellite imagery (George Tselioudis, personal communication, 2020). The location and timing of this case are favorable as they align with the ongoing ACTIVATE campaign. Historically, shoulder seasons host fewer CAOs compared to winter months (Fletcher et al., 2016). Using the cold air outbreak index θskin−θ800 hPa, in which θ is potential temperature, we detected values of up to ∼10 K on 17 March. This maximum nears the 95th percentile of indices collected during winter months in this region (Fletcher et al., 2016).
2.2 Eddy-resolving simulations
We use the DHARMA (Distributed Hydrodynamic Aerosol and Radiative Modeling Application) LES (Ackerman et al., 2004; Zhou et al., 2018), with periodic boundary conditions and a translating coordinate system, that follows the PBL mean horizontal wind. Subgrid fluxes are parameterized using a dynamic Smagorinsky turbulence model (Kirkpatrick et al., 2006). Aerosol available for activation as CCN is represented as a single lognormal mode (geometric mean diameter =0.05 nm; standard deviation =1.4; hygroscopicity parameter =0.55) with a prognostic number concentration. Mixed-phase cloud microphysics is represented based on a two-moment scheme (Morrison et al., 2009) with autoconversion and self-collection, following Seifert and Beheng (2001), rain accretion, self-collection, breakup, and fall speed, following Seifert (2008), and rain represented as a gamma size distribution with a shape parameter of 3. Activation of aerosol using a prognostic supersaturation value after microphysical relaxation follows Morrison and Grabowski (2008). Ice formation is treated as in Ovchinnikov et al. (2014), with the mechanistic equivalent of a diagnostic ice nucleating particle number concentration in the immersion mode, Ninp. Ice nucleation occurs wherever temperatures are below −5 ∘C, supercooled liquid is present, and ice particle number concentrations are below specified Ninp; here we consider values of 1, 4, and 16 L−1. In practice, this represents the wide range of ice formation that might be expected from varying degrees of heterogeneous nucleation and unrepresented ice multiplication, as discussed further below. For simulations without ice, we use the shorthand notation ice0. In our simulations, ice is represented as three species, namely cloud ice, graupel, and snow. When presenting ice mixing ratios, qi, all three categories are summed.
The domain spans 5 km vertically, with a uniform spacing of 20 m up to 3.5 km and progressively thicker layers above, using 200 layers in total. The upper 1 km acts as sponge to dampen gravity waves. Horizontally, the domain spans (21.6 km)2, with a horizontal mesh of 150 m. The grid was determined from various combinations (each with similar aspect ratio), ascertaining that the next higher resolution and also the next higher domain size result in equivalent PBL evolution of the baseline setup (described further below). To obtain a crude characterization of uncertainty from turbulent noise, we run an ensemble of simulations for the baseline setup of ice0, which we effectively assume as being representative of other setup variations. Here ensembles are run by varying the seed to the pseudo random number generator applied to initial fields of water vapor and potential temperature.
Initial thermodynamic conditions are taken from extracted MERRA-2 profiles (see Sect. 2.3). Initial aerosol number concentration is set to 200 mg−1 below the inversion (roughly guided by Nd derived from MODIS imagery) and to 50 mg−1 above (after Abel et al., 2017) in the baseline experiment. We examine sensitivities of this setup in Sect. 3. We use an aerosol surface source of 70 (roughly following Clarke et al., 2006 and using the average wind speed of the lowest layer in extracted profiles). For radiative transfer, we use 385 ppm (parts per million) CO2. From a 30 km deep profile, we integrate above 5 km to obtain the overlying water vapor (0.004 g cm−2) and ozone (5×1017 cm−2), and we select a representative overlying isothermal layer temperature (130 K) to match the downwelling longwave radiation profile calculated at the domain top from the full profile. We nudge horizontal mean temperature and moisture above the main inversion (defined throughout as the mean height of the maximum vertical gradient of potential temperature), with strength linearly increasing from 0 to 500 m above the inversion and with a time constant of 1 h at full strength. Aerosol number concentrations are nudged to 50 mg−1 above the dynamically defined mean inversion, and wind profiles are nudged above 500 m the surface (each with a time constant of 0.5 h). The diurnal cycle of shortwave radiation is treated using a local time (LT) of 04:00 LT at simulation start. We note that reported cloud cover is computed as the fraction of (150 m)2 columns, with optical thickness exceeding 2.5 (treating all hydrometeors as geometric scatterers, where ice optical properties are set as in Fridlind et al., 2012); the domain mean cloud droplet number concentration (Nc) is weighted by cloud water to avoid requiring a definition of cloud water (except where indicated otherwise). Table 1 summarizes the setup.
Stevens et al. (2002)Toon et al. (1989)Businger et al. (1971)(Kirkpatrick et al., 2006)Morrison et al. (2009)Seifert and Beheng (2001)Seifert (2008)Morrison and Grabowski (2008)Ovchinnikov et al. (2014)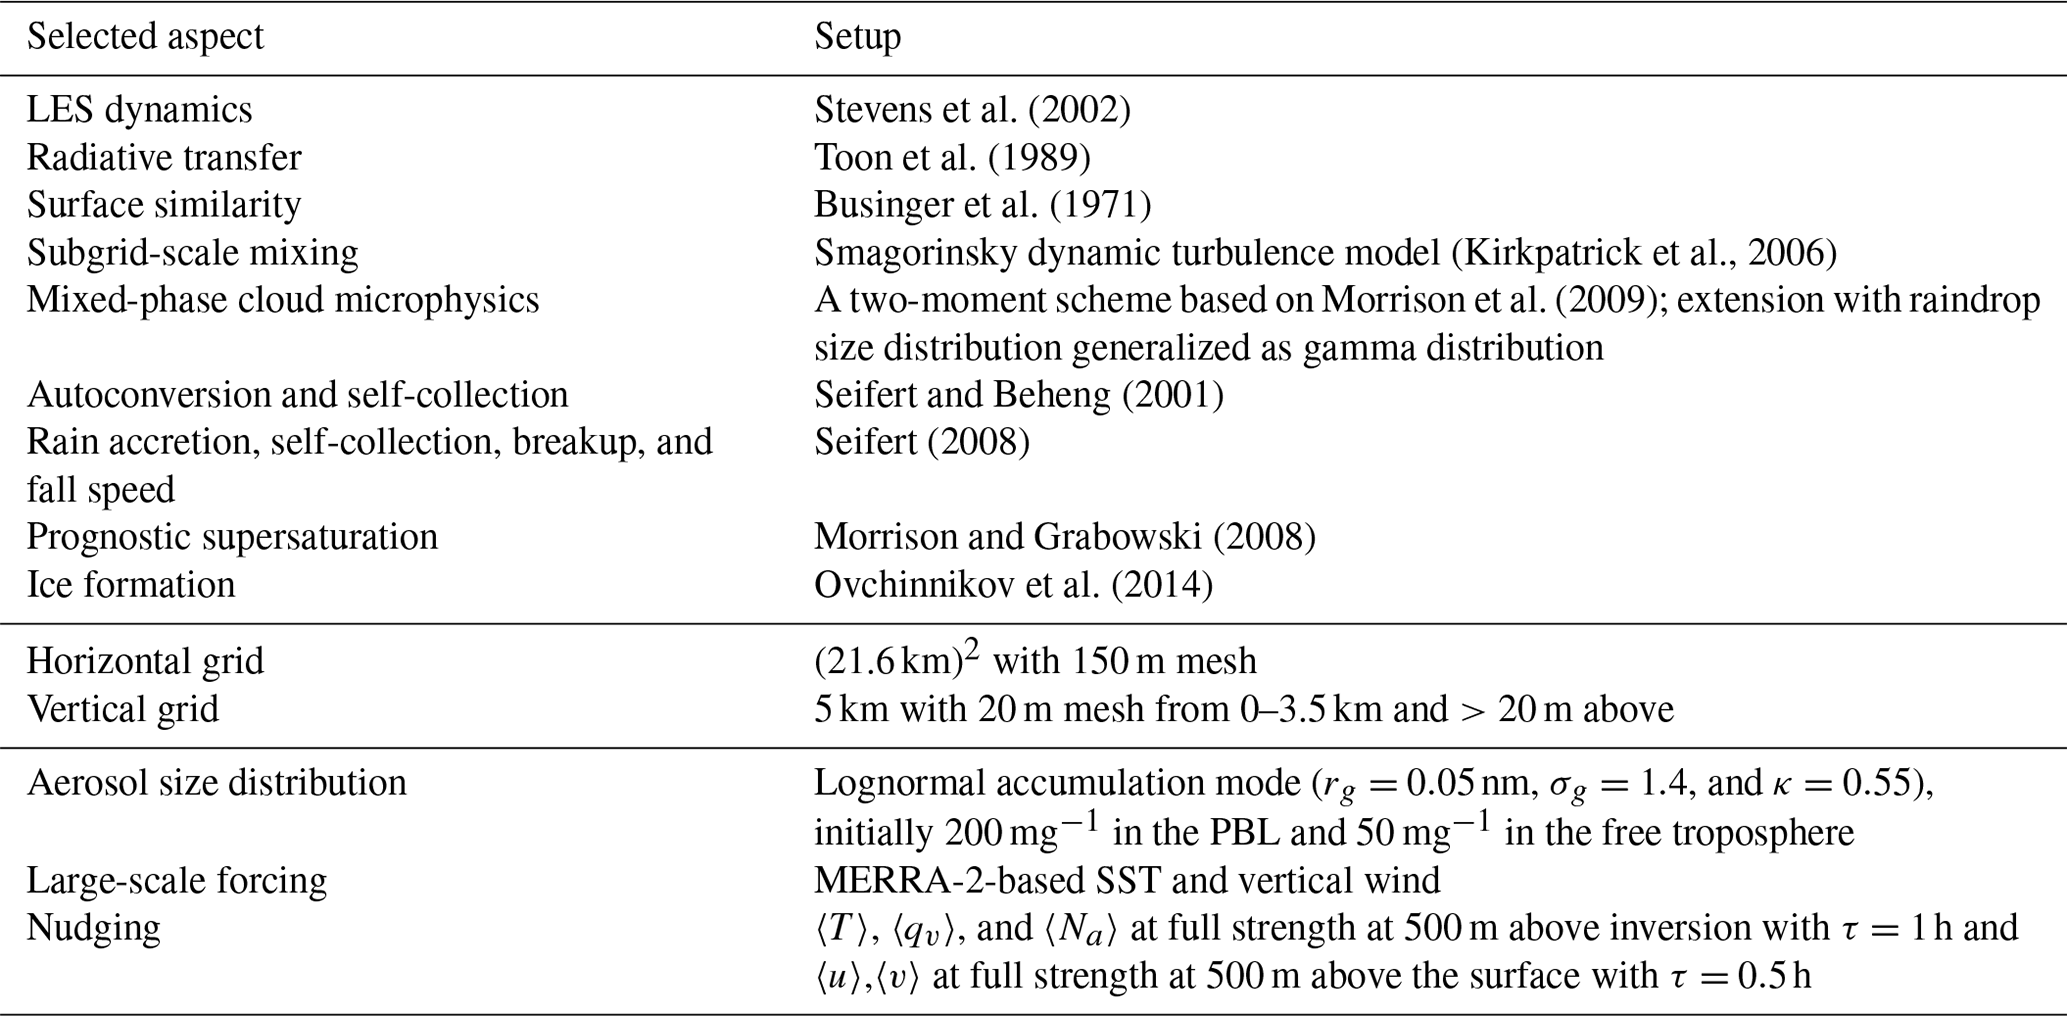
2.3 Boundary conditions from MERRA-2 reanalysis
To drive the LES with a domain that follows the PBL horizontal flow, we extract trajectories from MERRA-2 (Gelaro et al., 2017) using the horizontal wind at 250 m altitude. To intercept observed roll-like structures (Fig. 1a), we first trace the trajectory from 33.4∘ N, 70.1∘ W, and 18:00 UTC forward and backward (amounting to 24 h over ocean surface; Fig. 1b); results also shown for four neighboring initial points (displaced by intervals of 1∘ N and 1∘ E). From MERRA-2 4D fields (3 h fields of ∼50 km horizontal resolution and ∼72 vertical layers between 1000 and 0 hPa), we extract horizontally interpolated, vertical profiles of meteorological variables (temperature, specific humidity, and wind) per discrete time step. Repeating this extraction with ERA5 fields (1 h fields of ∼31 km horizontal resolution and ∼137 vertical levels; Hersbach et al., 2020), we found similar trajectories (not shown); primarily, profiles of large-scale vertical wind appear smoother in MERRA-2. Sea surface temperature (SST) was also extracted from MERRA-2 and represented as a piecewise linear evolution along the trajectory, with values of 287, 294, and 296.3 K at 0, 3, and 24 h, respectively.
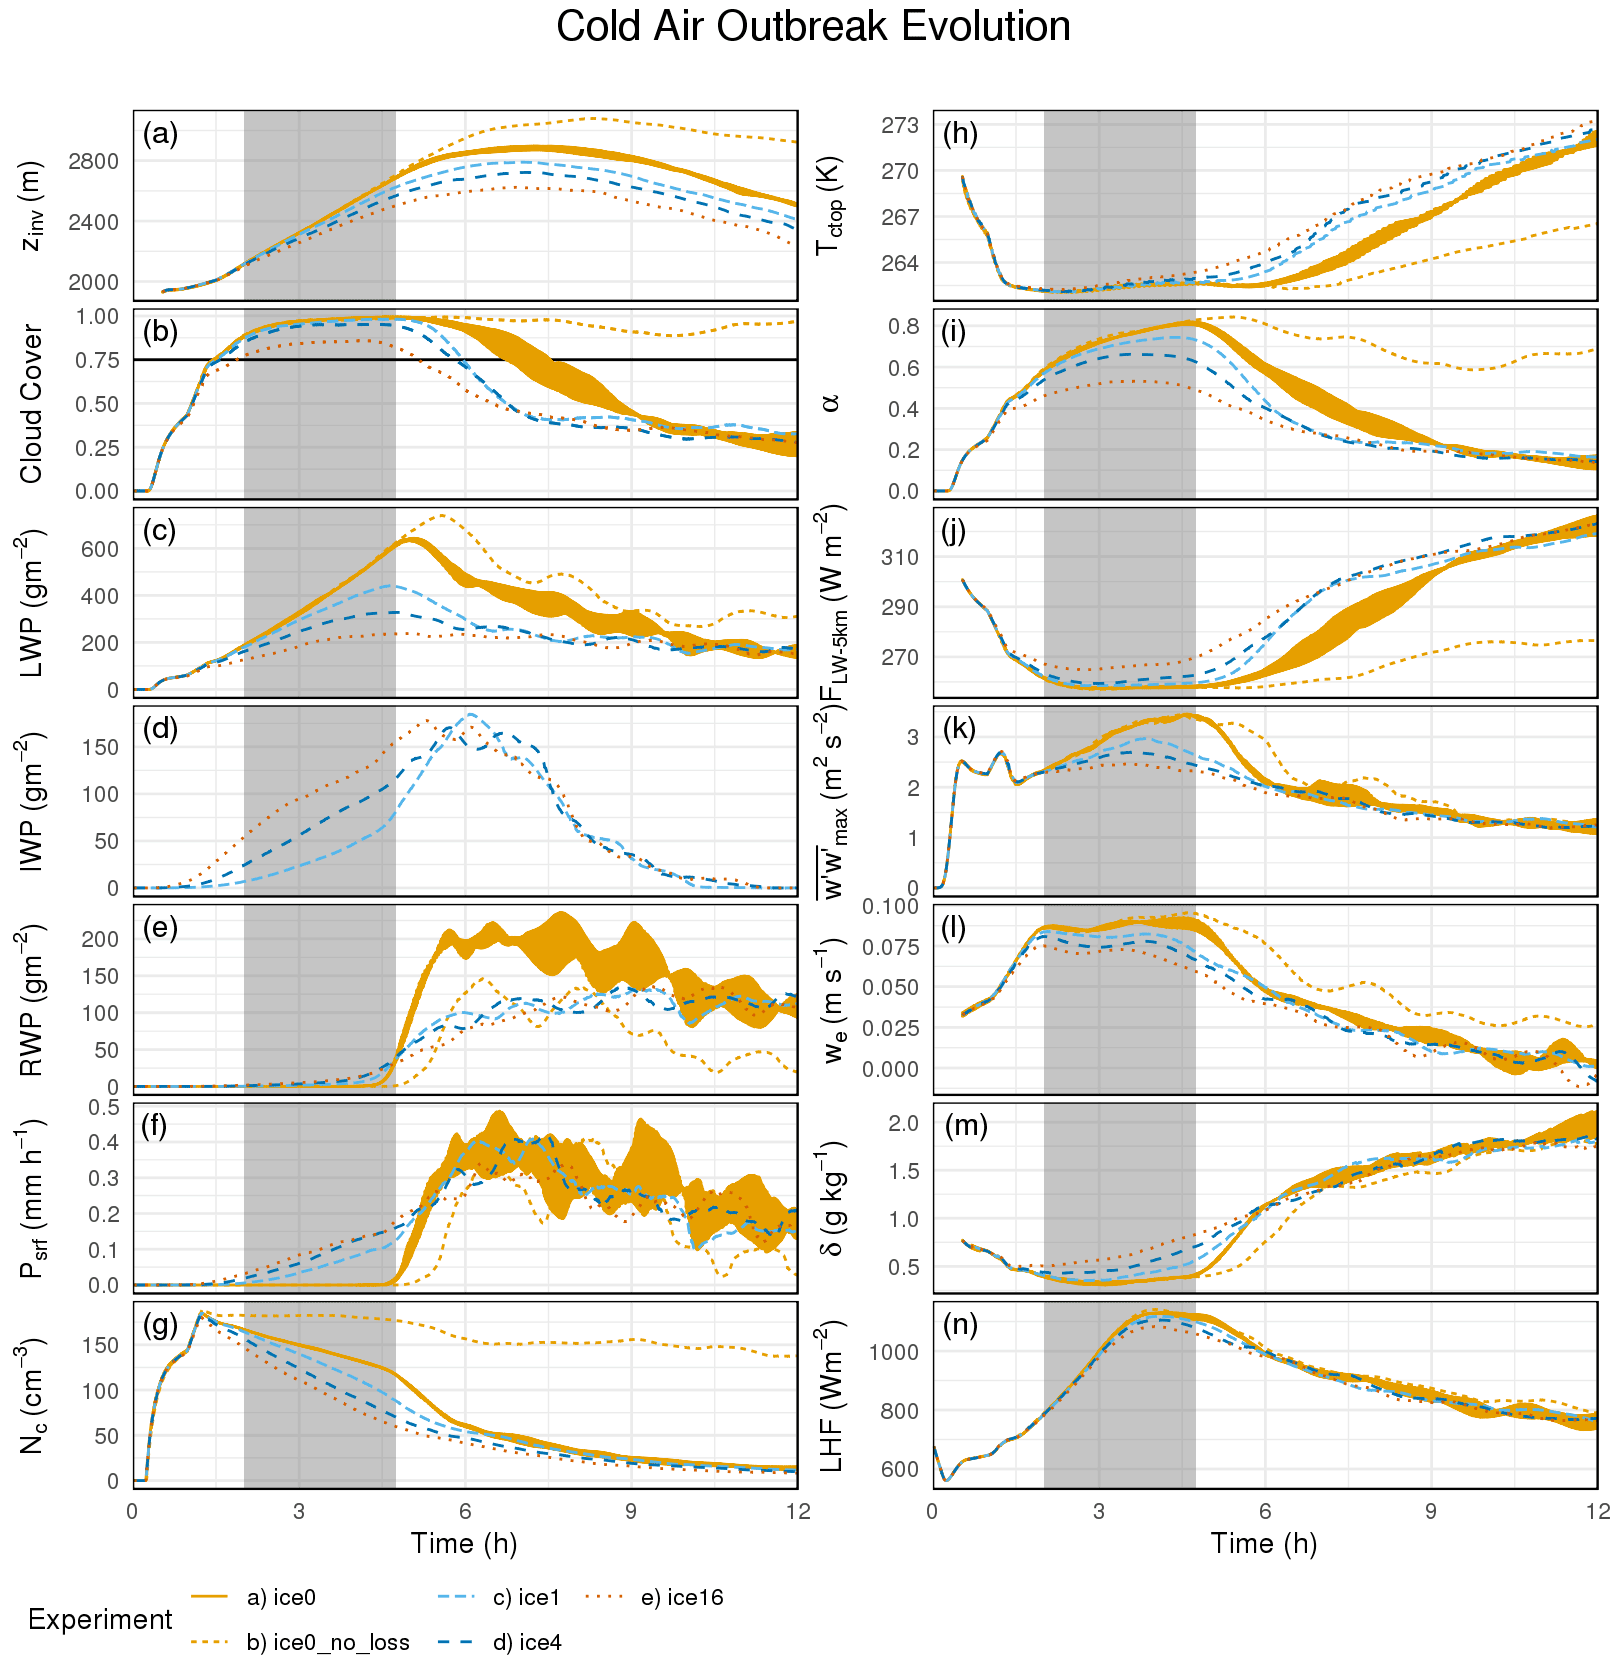
Figure 2Time-evolving (a) inversion height, (b) cloud cover, (c) total liquid water path (including cloud water and rain), (d) ice water path (including cloud ice, graupel, and snow), (e) rainwater path, (f) surface precipitation rate, (g) in-cloud droplet number concentration, (h) cloud-top temperature, (i) pseudo albedo, (j) outgoing longwave radiation at the top of the domain (5 km), (k) domain maximum column-averaged vertical wind variances, (l) cloud-top entrainment rate, (m) PBL stratification (see text), and (n) surface latent heat flux of four simulations of varying Ninp (shown in the legend with the notation iceN, meaning Ninp=N L−1, and also described in the text). Variables are defined in Sect. 2.2. All values are box averaged over the (a) lagged 1 h window and domain mean, unless otherwise indicated. Gray areas mark the period introduced in Sect. 3 as preconditioning by riming. For ice0, we show the spread over an ensemble of three simulations obtained by changing the pseudo random seed used in initialization of meteorological fields.
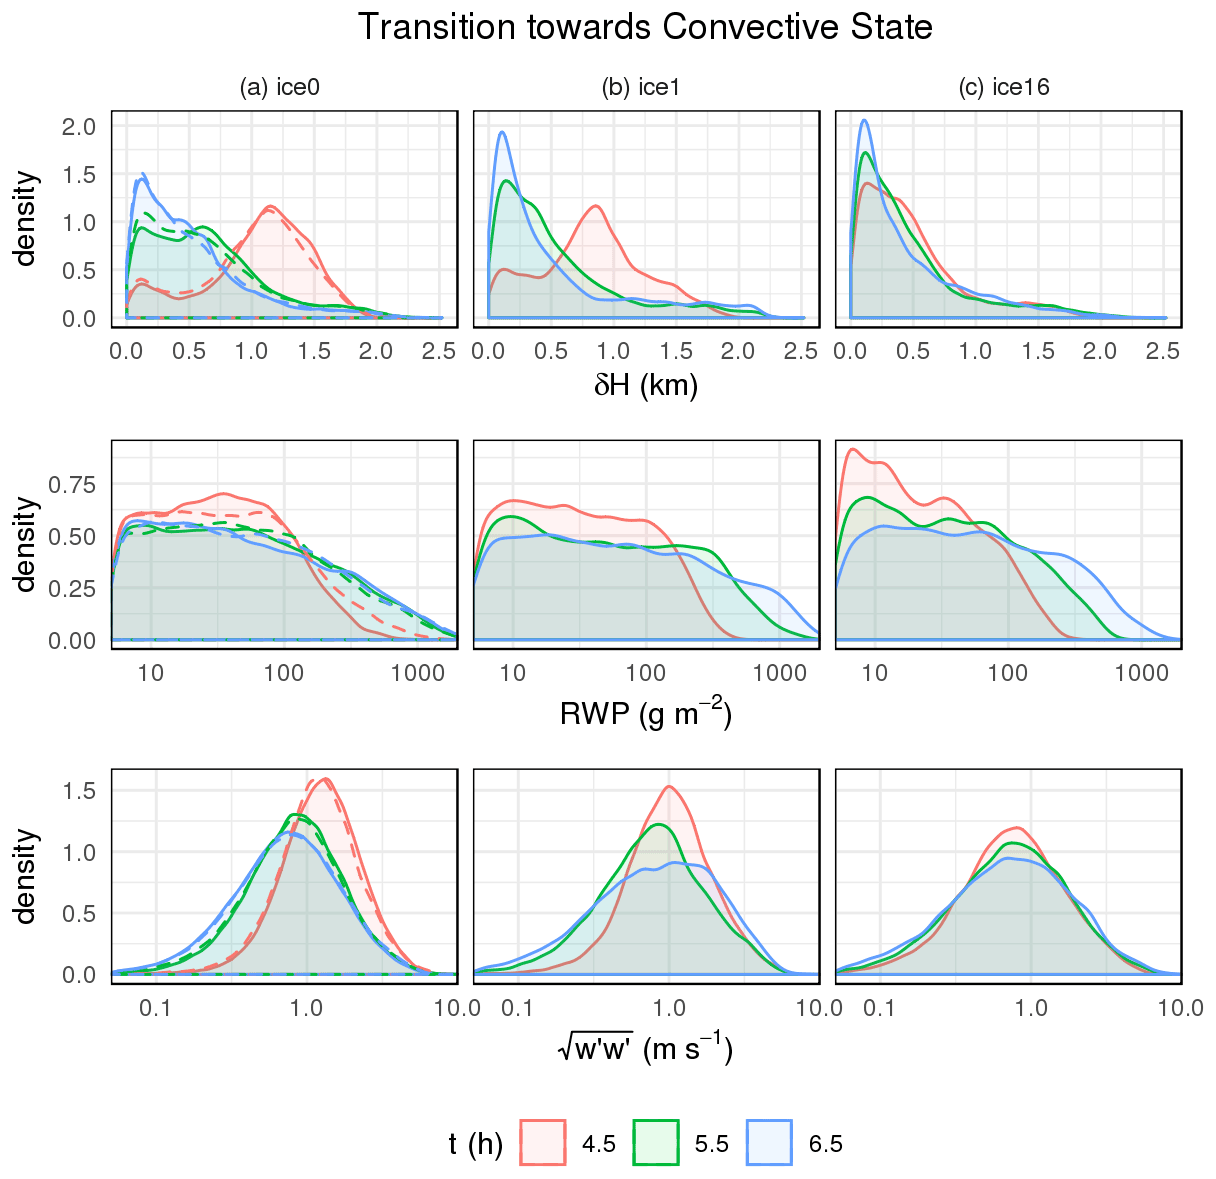
Figure 3Statistics of cloud vertical extent (or geometric thickness), (where H is the height above ground), column-average absolute vertical wind speed, , and rainwater path from cloudy columns within 3D domains for three time steps since the onset of precipitation for simulations with (a) ice0, (b) , and (c) . Note the logarithmic x axes for rainwater path and . For ice0, we show statistics for an ensemble of three simulations. Dashed lines in the left column refer to a simulation with quadrupled domain horizontal area (see text).
Satellite imagery of the observed case (Fig. 1a) shows the close succession of cloud streets and rolls that typically form shortly after leaving the continent and the open cellular structures downwind, bounding a relatively narrow region (or short phase in the Lagrangian sense of traveling with the PBL flow) of overcast clouds, here defined as cloud cover above 75 %, as in Christensen et al. (2020). Alternatively, we also consider a cloud cover threshold of 50 % (equivalent to Sandu et al., 2010). MODIS data in Fig. 1c provides an impression of cloud cover. To demonstrate key mechanisms of the transition from the overcast-to-broken cloud field, we first analyze simulations without ice (Sect. 3.1). By including frozen hydrometeors, we then explore its modification of this transition – in particular the impact of ice on the transition timing (Sect. 3.2). By changing the levels of Ninp (Sect. 3.3) and the initial Na (Sect. 3.4), we investigate the robustness of the identified impacts to microphysical controls.
3.1 Simulation without ice
In this subsection, we demonstrate that the onset of substantial rain (here defined as a rainwater path exceeding 25 g m−2) during the overcast phase creates a turning point that leads to the breakup of the cloud deck (i.e., a cloud cover dropping below 75 %). We further emphasize that aerosol removal through microphysical collision processes is a necessary ingredient for cloud breakup, as also found in warm stratocumulus transitions (Yamaguchi et al., 2017).
Figure 2 provides an overview of the evolution of experiments without ice (shown for an ensemble of three simulations) and also with varying Ninp that we examine in the following subsections. We show various metrics that characterize the state of the PBL and its condensate (Fig. 2a–g, k, and m), variables related to radiative properties (Fig. 2h–j), the interaction with the free troposphere (FT; Fig. 2l), and changing boundary conditions (Fig. 2n).
Without ice (ice0), the PBL rapidly deepens with the initial transit from the continent (Fig. 2a), from roughly 2 km at cloud onset to maximum depths greater than 2.5 km, before more gradually becoming shallower after 7–8 h. Prior to the onset of substantial rain (marked by a dot in Fig. 2e, roughly ending a period highlighted by a gray background throughout Fig. 2), supercooled liquid rapidly increases as the cloud deck fills in after ∼1.5 h (Fig. 2b) and thickens, reaching a domain mean peak of ∼600 g m−2 (Fig. 2c). Meanwhile, droplet number concentration decreases monotonically from a peak value only ∼1 h after cloud formation (Fig. 2g); as illustrated further below, PBL total aerosol Na+c (activated and unactivated CCN; not shown) gradually diminishes initially from rapid entrainment of FT air with reduced aerosol concentrations and later from collision–coalescence active in regions of high liquid water mixing ratio qc (see further details below). Progressively more cloud condensate distributed over fewer droplets initiates substantial rain after ∼4.5 h (Fig. 2e). Partial evaporation of rain below cloud contributes to the stratification of the PBL (Fig. 2m), reducing vertical mixing within the PBL (Fig. 2k; depriving the cloud layer of moisture and aerosol from the surface layer) and slowing entrainment (Fig. 2l; which reduces cloud layer drying and aerosol dilution to some degree). After 6 h, the spread within the ensemble becomes noisier due to somewhat stochastic precipitation events.
To examine the overcast-to-broken cloud structural transition, Fig. 3 shows cloud geometric extent, rainwater path, and in-cloud vertical motion calculated from 3D domains for hourly snapshots from 4.5 h (the moment of substantial rain onset in all simulations) to 6.5 h (a post-transitional state). In the ice0 simulation (solid lines in the left panels), the cloud vertical structure transitions from a stratiform state at 4.5 h (Fig. 3a; shown as a red curve) where most clouds have a geometric thickness of ∼1.2 km towards a convective state (shown in green and then blue), where most clouds are geometrically thinner than 1 km and sporadic convection creates few instances of larger vertical extent, as observed in open cells by Wood et al. (2011). The precipitation-induced breakup of the overcast cloud deck is generally consistent with the findings of Stevens et al. (1998); Savic-Jovcic and Stevens (2008) and Wang and Feingold (2009) in warm clouds and Abel et al. (2017) and Eirund et al. (2019) in mixed-phase clouds.
In contrast to stratocumulus simulations (e.g., Yamaguchi et al., 2017), our results are notably insensitive to increasing the domain size. For a domain size that is 4 times larger, (43.2 km)2, domain mean time series are scarcely impacted (not shown), and structural statistics also show little change (Fig. 3a; dashed vs. solid lines). We presume that roll-like structures (shown at the rain onset in Fig. 4; top panel) serve as a regular pattern for cloud condensate and rainwater, and this regularity may explain the lack of domain size dependence. In the baseline setup (Fig. 4; bottom panels), roll-like structures are more apparent in the larger domain at 4.5 h. They are preceded by more numerous, smaller cells (at 1 and 2 h) and are followed by an assortment of progressively fewer bright and more frequent dim cloud elements (5.5, 6.5, and 9 h), illustrating the commonality of geometrically thinner clouds after the rain onset.
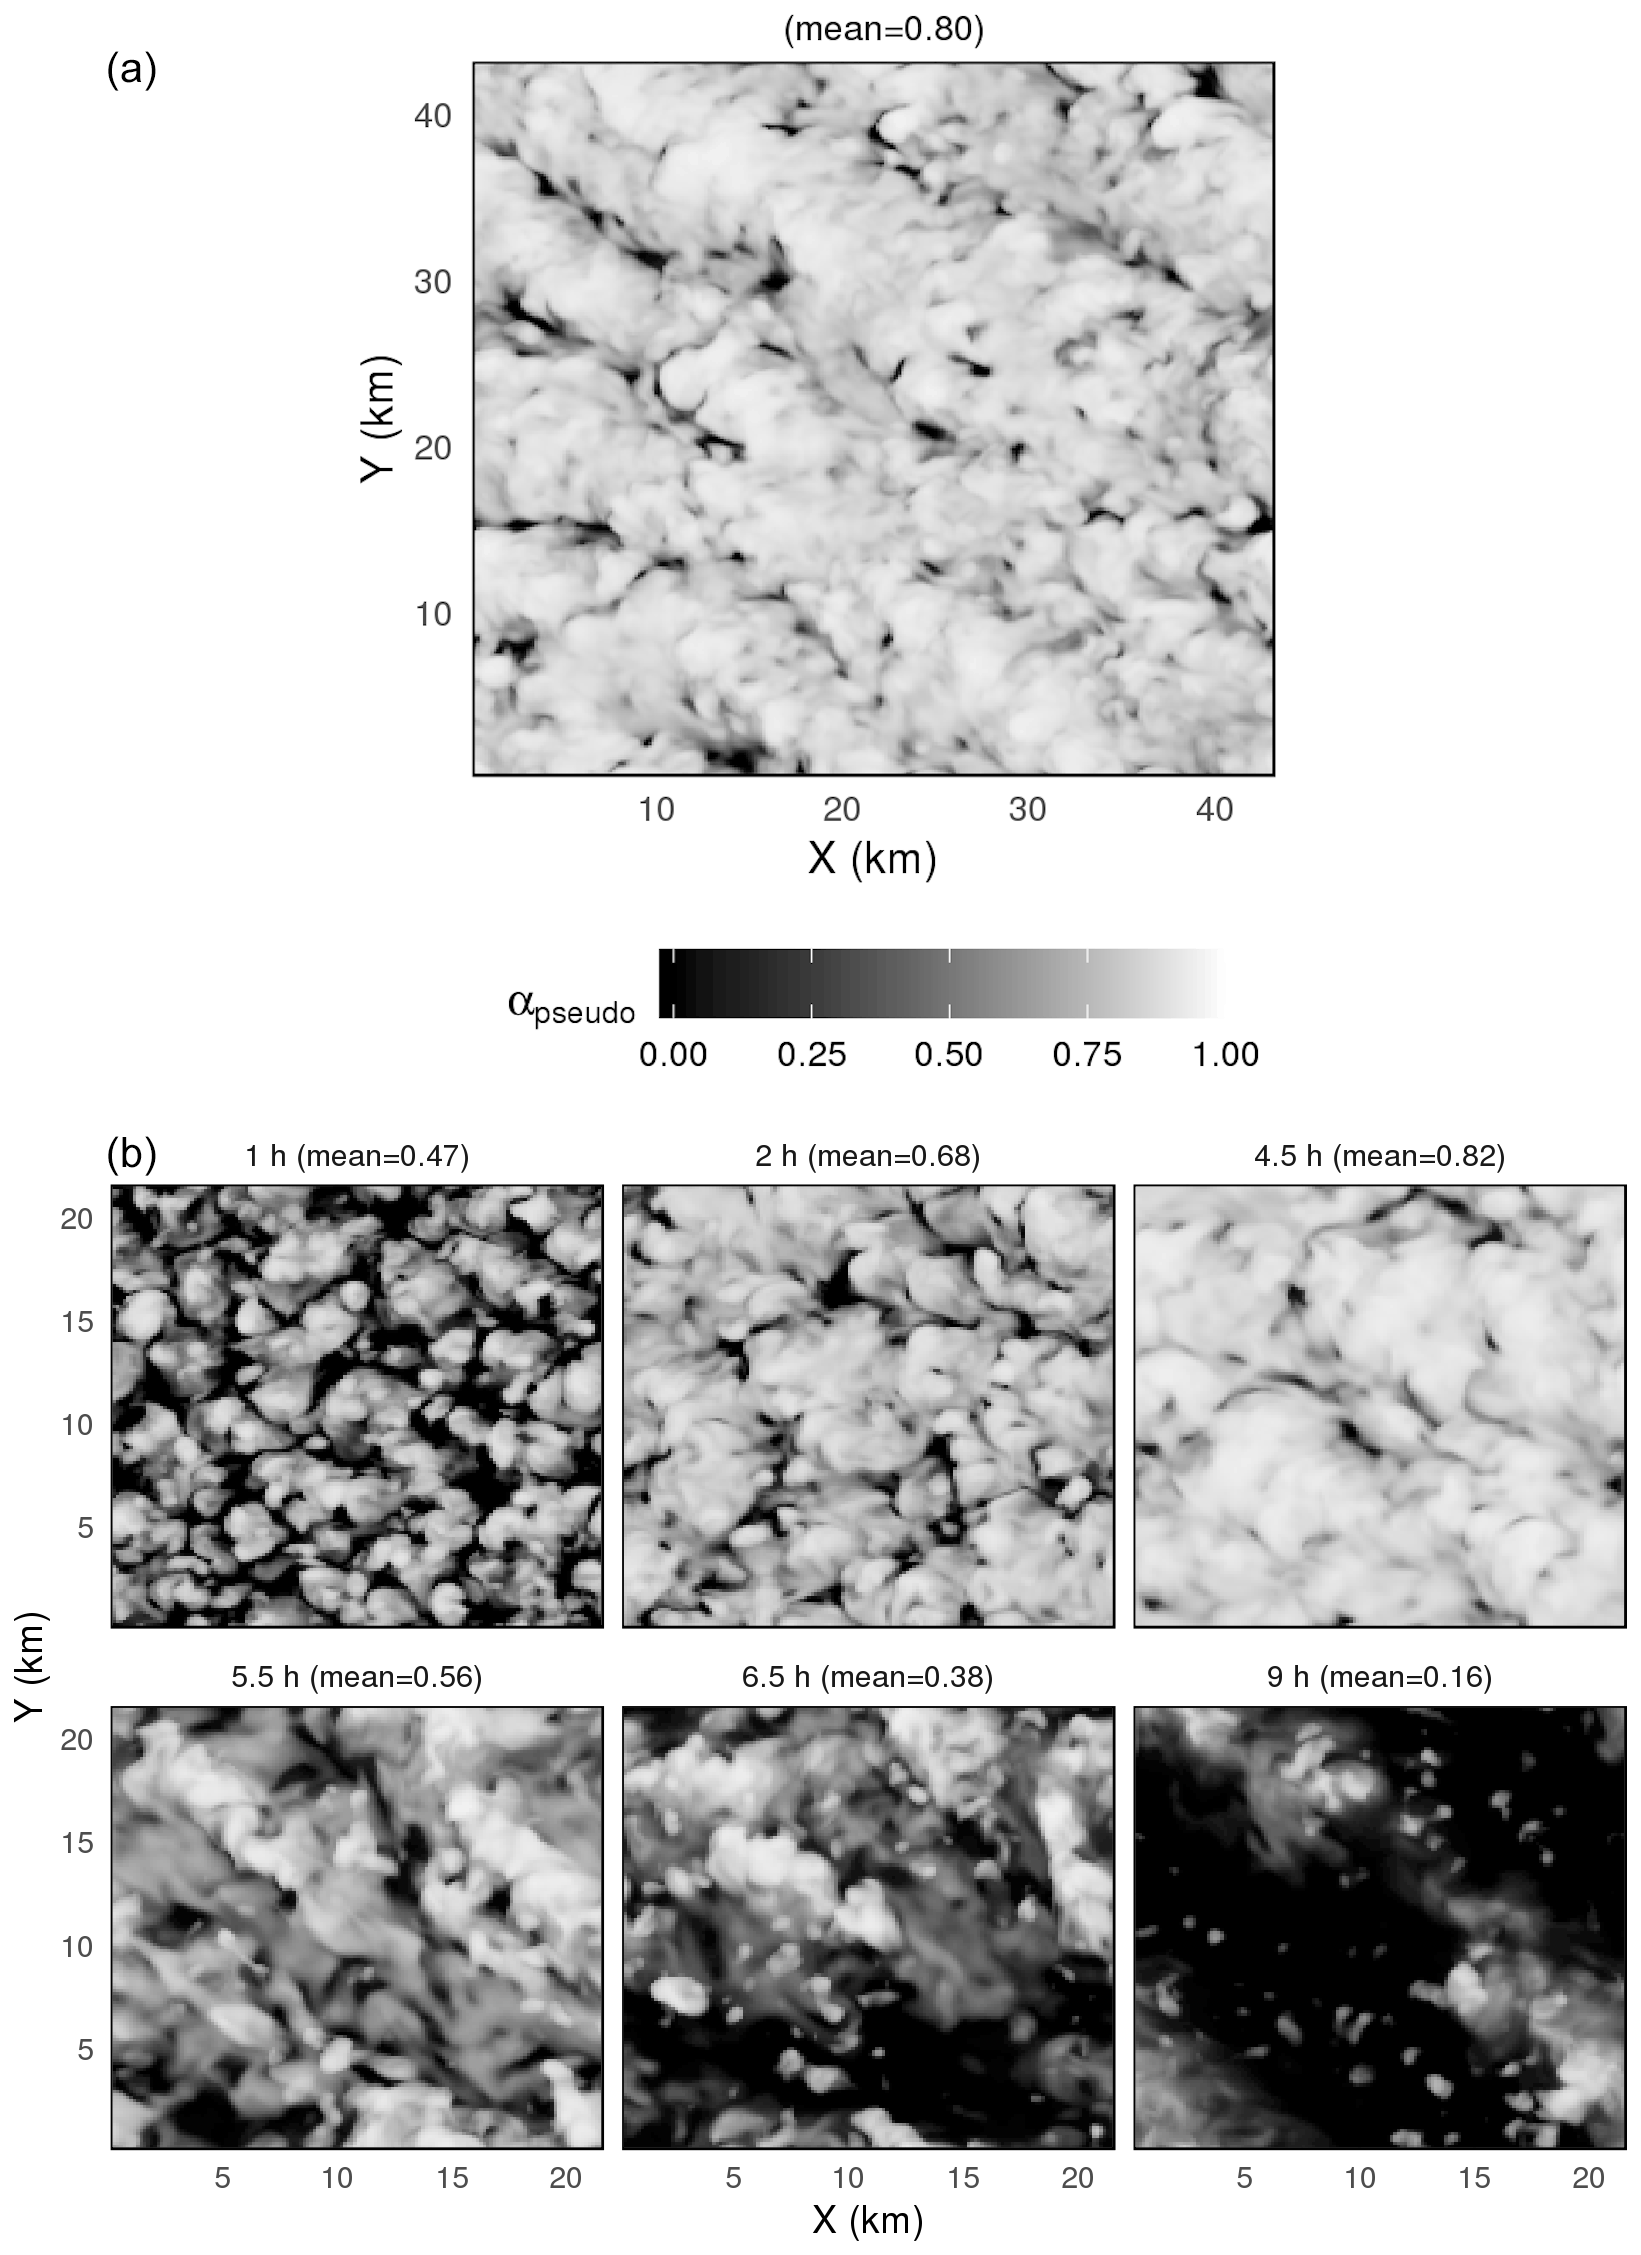
Figure 4Pseudo albedo of ice0 at 4.5 h simulated time, shown for a domain 4 times larger in area than the baseline experimental setup (top) and at various times (indicated by panel titles) for the baseline setup (bottom).
We find a narrowing probability density function (PDF) tail towards sparser occurrences of the largest cloud geometric extent and, simultaneously, a thickening PDF tail towards increasing occurrences of the greatest rainwater paths in convective elements. This is a result of increased stabilization caused by more buoyant downdrafts above cloud base (as per Stevens et al., 1998) and rain evaporation below cloud base, leading to a buildup of moisture in the lowest layers that continue to be fed by large surface fluxes of sensible heat and moisture. Conditional instability in the moistened sub-cloud layer triggers cumuliform convection. When rising, these parcels possess lifting condensation levels of low altitude (not shown). This stabilization of the PBL with increasing precipitation is associated with overall dramatic weakening of in-cloud vertical motion (note the logarithmic scales in Fig. 3a; bottom panel). Steadily declining Na+c and slowed vertical motion both, additionally, promote rain formation (Ovchinnikov et al., 2013) in convective events that then further reduce aerosol concentrations, thus constituting a positive feedback. The cloud deck without ice breaks apart 5–6 h after its formation (Fig. 2b), using our metric (75 % cloud cover). We note that this threshold is somewhat arbitrary; lowering the overcast definition to >50 % cloud fraction would correspond to diagnosing longer overcast periods and a greater difference across simulations, as discussed further below.
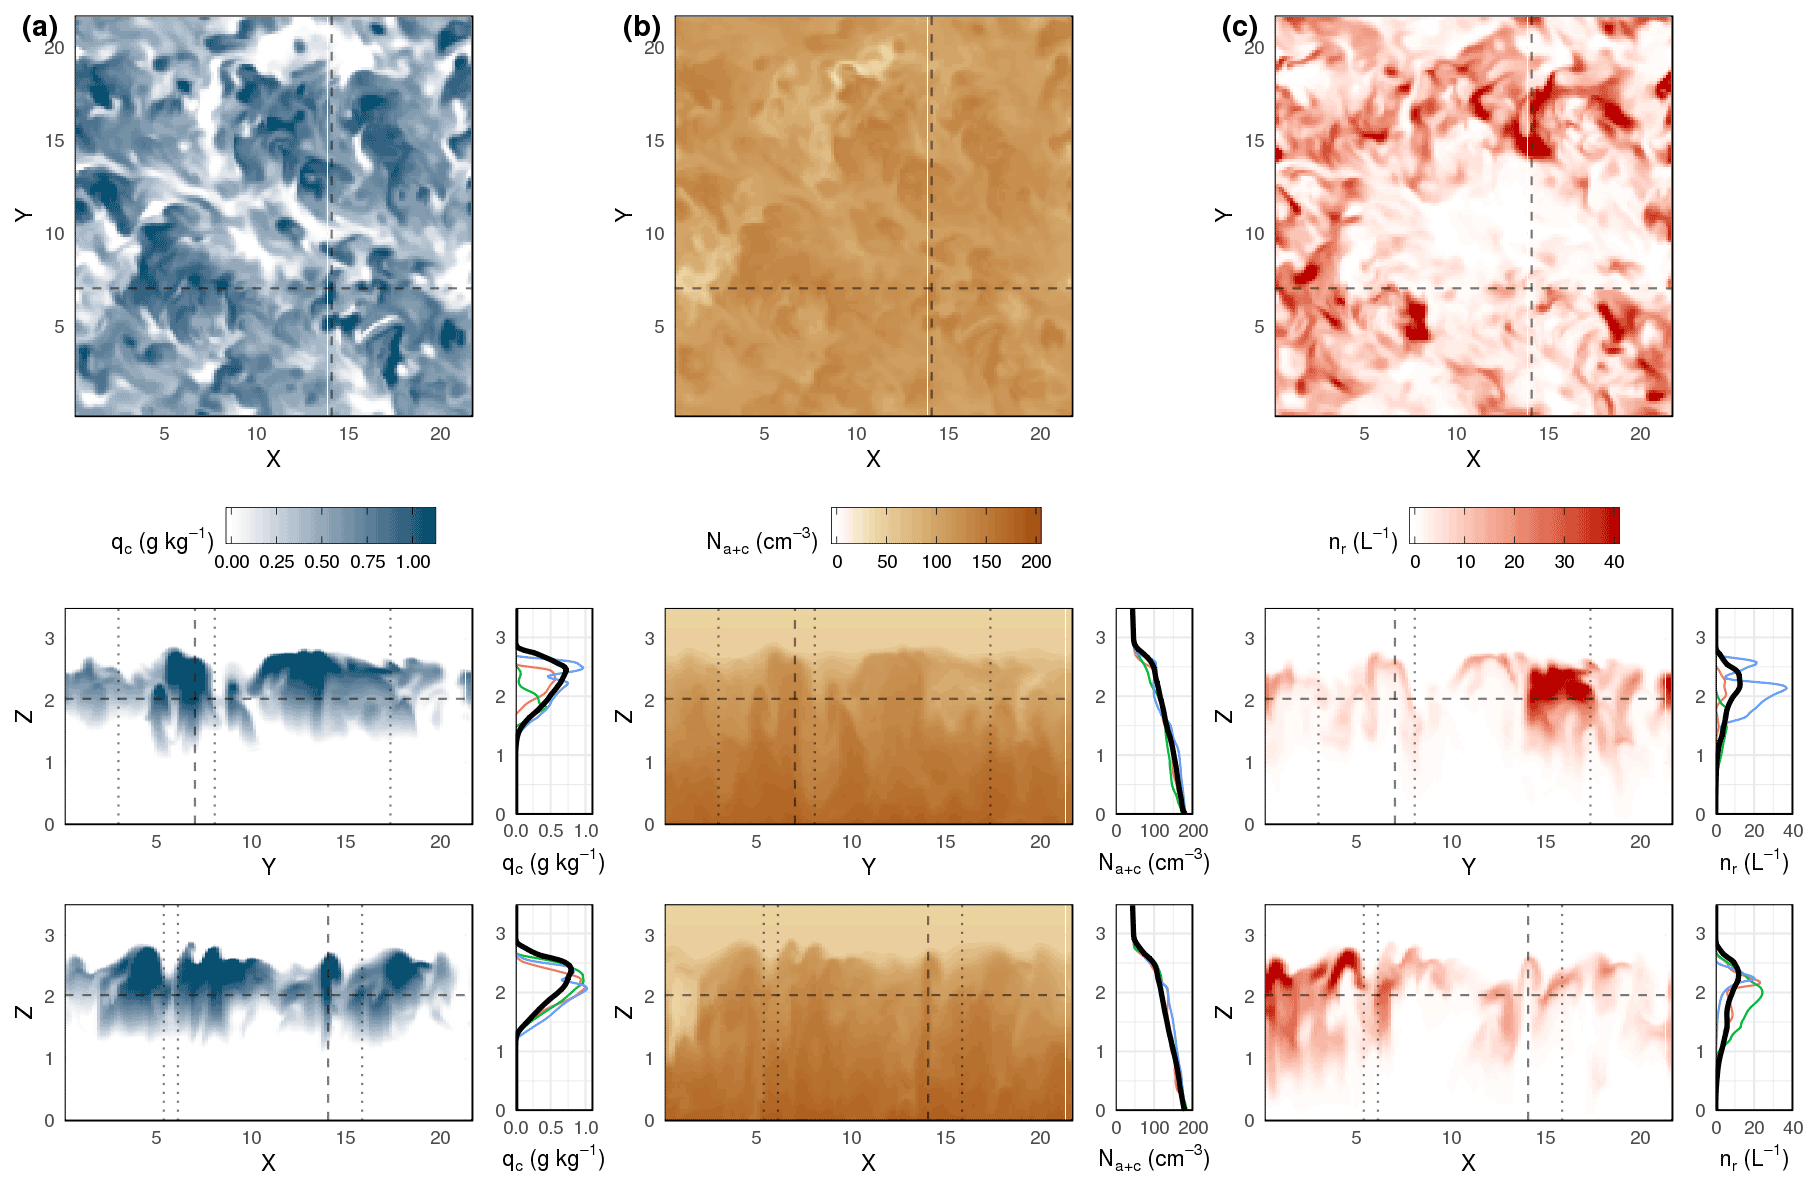
Figure 5Horizontal and vertical transects (stacked vertically; coherent shading) of the following variables (from left to right) of the experiment ice0 at time 4.5 h: cloud water mixing ratio, activated plus interstitial aerosol concentrations, and raindrop concentrations. Shading resolves the 5th to 99th percentiles (capping values beyond the plotted range). Long dashed lines mark transect locations. Short dashed lines in the vertical transects mark selected profiles that are shown in colors in the plot to their right; the black curve shows the respective transect average.
Figure 5 presents cross sections of qc, activated and unactivated aerosol Na+c, and raindrop number concentration Nr of the 3D domain at onset of substantial rain. All quantities are marked by ample spatial heterogeneity. Compared against initial Na+c vertical profiles (see Sect. 2.2), lower altitudes within the PBL maintain their original values, while upper portions experience a reduction by 50 cm−3 (about 50 mg−1), indicating weak PBL mixing.
In order to find out which processes dominate the temporal variability in Na+c in the PBL, Fig. 6 provides a PBL-averaged budget of Na+c changes from specific sources and sinks. In the absence of ice, early Na+c reduction primarily results from entrainment of lesser FT aerosol concentrations and, together with collision–coalescence, the PBL Na+c loss rate is steady at ∼15 over several hours prior to substantial rain (Fig. 6a). Once substantial rainwater builds up, drop–droplet collection removes aerosol at rapidly increasing rates that peak at ∼50 . The evaporation of raindrops reintroduces CCN (one per drop) into the PBL, but this rate is far outweighed by microphysical consumption (not shown).
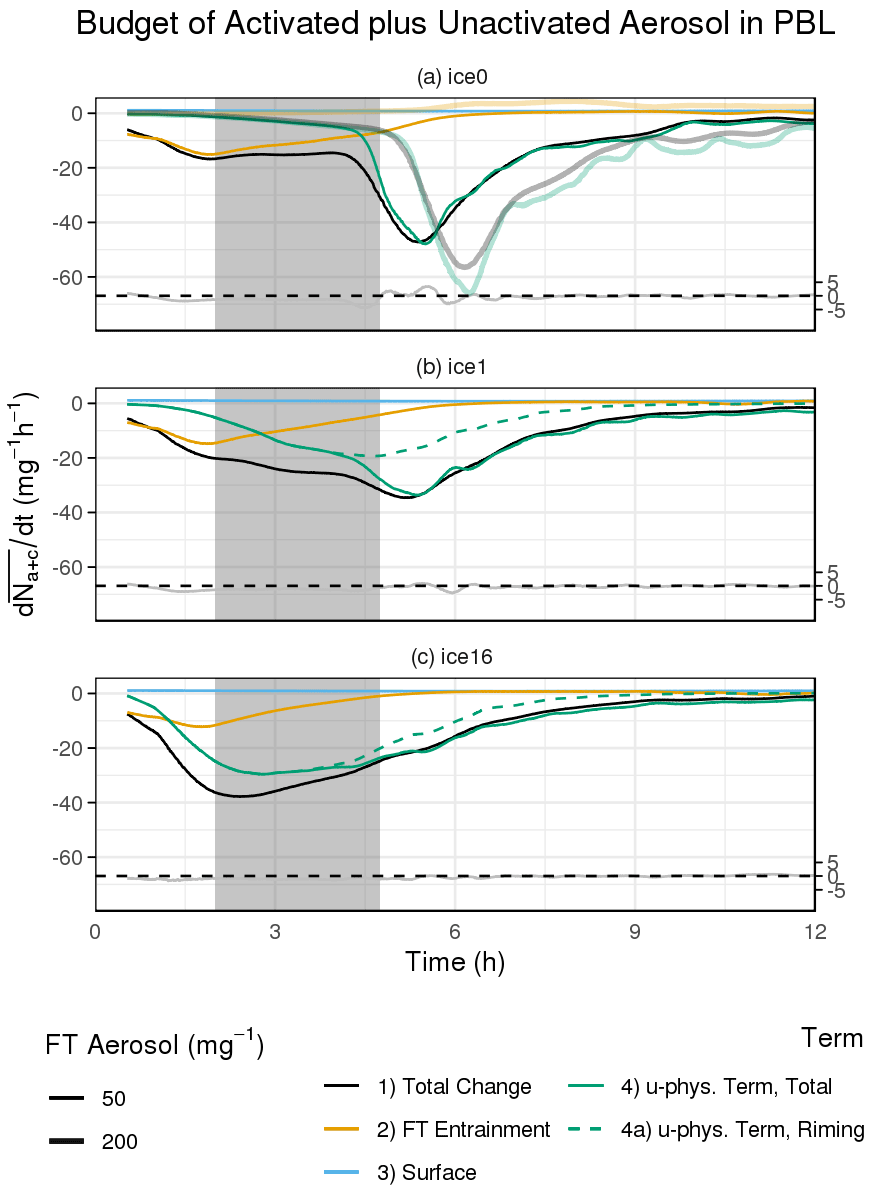
Figure 6Budget of the temporal change in activated plus unactivated aerosol averaged over the PBL (actual change shown in black) and contributions from FT entrainment, surface source, and microphysical processes (in colors) for simulations with (a) ice0, (b) , and (c) . Thick, semi-transparent lines in panel (a) show an experiment with 200 mg−1 FT aerosol concentration, which matches the initial PBL concentration. Dashed green lines in panels (b–c) distinguish riming-related loss. Residuals of summed terms minus actual change are shown in gray (tied to the right y axis); zero difference is marked by a dashed black line.
Increasing the aerosol concentrations in the FT from 50 mg−1 to initial concentrations in the PBL removes an early aerosol sink (shown as thicker, semi-transparent lines in Fig. 6a), offsetting some microphysical aerosol loss but only slightly delaying the onset of substantial rain. In this case, the FT acts as a relatively small CCN source (see the thick, semi-transparent yellow line). Then, the PBL transitions, which is comparable to lower FT levels (not shown).
To demonstrate the importance of the collisional loss of activated aerosol for the cloud transition, we run another configuration in which aerosol concentration is fixed at 200 mg−1, shown as ice0_no_loss in Fig. 2. The resulting permanently high levels of Nc (Fig. 2g) promote longer liquid water path (LWP) growth (Fig. 2c) and delay the onset of substantial rain (Fig. 2e). Owing to lower rainwater path (RWP) and reduced evaporation cooling and moistening below cloud, the PBL becomes stratified a bit more slowly (Fig. 2m) and remains somewhat better mixed (Fig. 2l); these effects would likely be greater if they were not offset by a substantial deepening of the PBL associated with longwave cooling (not shown) at a sustained cloud cover above 80 % (i.e., no breakup according to our definition), as seen in Fig. 2b. Switching off autoconversion results in a solid cloud deck, with LWP plateauing at 1000 g m−2 after 9 h (not shown). As found by Yamaguchi et al. (2017) for subtropical warm stratocumulus, this case study illustrates the dependence of closed-to-open cell transitions on the microphysical consumption of activated aerosol in CAOs.
This study does not exhaustively examine all variables connected to PBL dynamics (e.g., Yang and Geerts, 2006). To understand if the timing of the breakup is related to the diurnal solar cycle, we switched off solar radiation. Even though cloud-top cooling intensifies by 10 %–20 %, we find insignificant responses when comparing against a simulated ensemble of the baseline setup (not shown).
3.2 Shortened overcast period in mixed-phase clouds
A priori, it is unclear how the addition of ice might change the aerosol-mediated overcast-to-broken cloud transition of CAOs (as elaborated in Sect. 1). Under the weak to moderately supercooled conditions in this case (cloud-top temperatures are always warmer than ; Fig. 2h), we expect primary ice formation to be dominated by immersion ice nucleating particles (INPs; e.g., de Boer et al., 2011). However, INP measurements are generally subject to order of magnitude uncertainties (e.g., Kanji et al., 2017), the environmental INP spatiotemporal variability is greater than that (e.g., DeMott et al., 2010), and even greater uncertainties in predicted ice concentrations arise from incomplete understanding of secondary ice formation processes (e.g., Korolev et al., 2020; Korolev and Leisner, 2020). To provide a simple framework for approximately representing within-cloud ice formation, we follow the Ovchinnikov et al. (2014) approach of specifying a fixed diagnostic immersion INP concentration, Ninp, which we vary in a sequence of simulations (see Sect. 2.2). In practice, this Ninp is intended to represent the sum of highly uncertain primary and secondary ice formation processes.
We first fix (ice1) and compare with ice0 to examine the role of modest ice in these transitions. With modest ice formation, we find almost no change in the onset time of substantial rain, but we find a subsequent overcast period that is shortened by about half (Fig. 2b). We next illustrate that three effects – acting prior to the substantial rain onset and all connected to riming – cause an accelerated breakup downwind. We refer to following three effects collectively as the “preconditioning by riming”. The addition of modest ice formation leads to the following changes:
-
Reduction in the liquid water path (by ∼200 g m−2 down to ∼400 g m−2; Fig. 2c) from ice depositional growth and riming (shown in Fig. 8 as a green dashed line and examined further below), leading to a peak ice water path ∼150 g m−2 (Fig. 2d) mostly consisting of snow and, to a lesser extent, graupel, and cloud ice (shown at the bottom of Fig. 7).
-
More rapid reduction in Nc (Fig. 2g) through intense riming (another collisional process that consumes activated aerosol; green dashed line in Fig. 6b), where both qc and ice water mixing ratio qi (including snow, graupel, and cloud ice) are at least moderate (examined further below in Fig. 7), leading to greater loss rates of activated aerosol before substantial rain onset (sustained up to ∼20 ), compared to ice0 (cf. Fig. 6a and b).
-
Earlier precipitation (prior to the onset of substantial rain) in the form of riming-grown ice crystals (Fig. 2f at the surface and Fig. 7 at cloud base by precipitation type), foremost snow particles, that either sublimate directly or first melt and then evaporate below cloud, leading to a moistening and cooling in these layers.
Figure 7 shows time–height plots of qc, qi, rainwater mixing ratio qr, and overlaid microphysical aerosol loss rates for three experiments. In comparison to ice0 (Fig. 7a), aerosol loss in ice1 (Fig. 7b) strengthens earlier (between 2 and 4.5 h) and vertically overlaps with altitudes of moderate to high qc and moderate qi (between 1.5 and 2.5 km).

Figure 7Time–height projections of horizontally averaged cloud water (top), cloud ice (second from the top), and rainwater mixing ratios (third from the top), shown for three simulations (by row). Overlaid, in colored contours, are aerosol consumption rates from microphysical collisions involving cloud droplets. Blue lines mark the mean lifting condensation levels, using the lowest layer for calculations. Vertical lines highlight three characteristic times during PBL evolution. Magenta lines in cloud water and ice panels mark where the maximum supersaturation of the specific layer (with respect to liquid and ice, respectively) is zero. The bottom panels show cloud base precipitation rates, Pcb, resolved by type (line color).
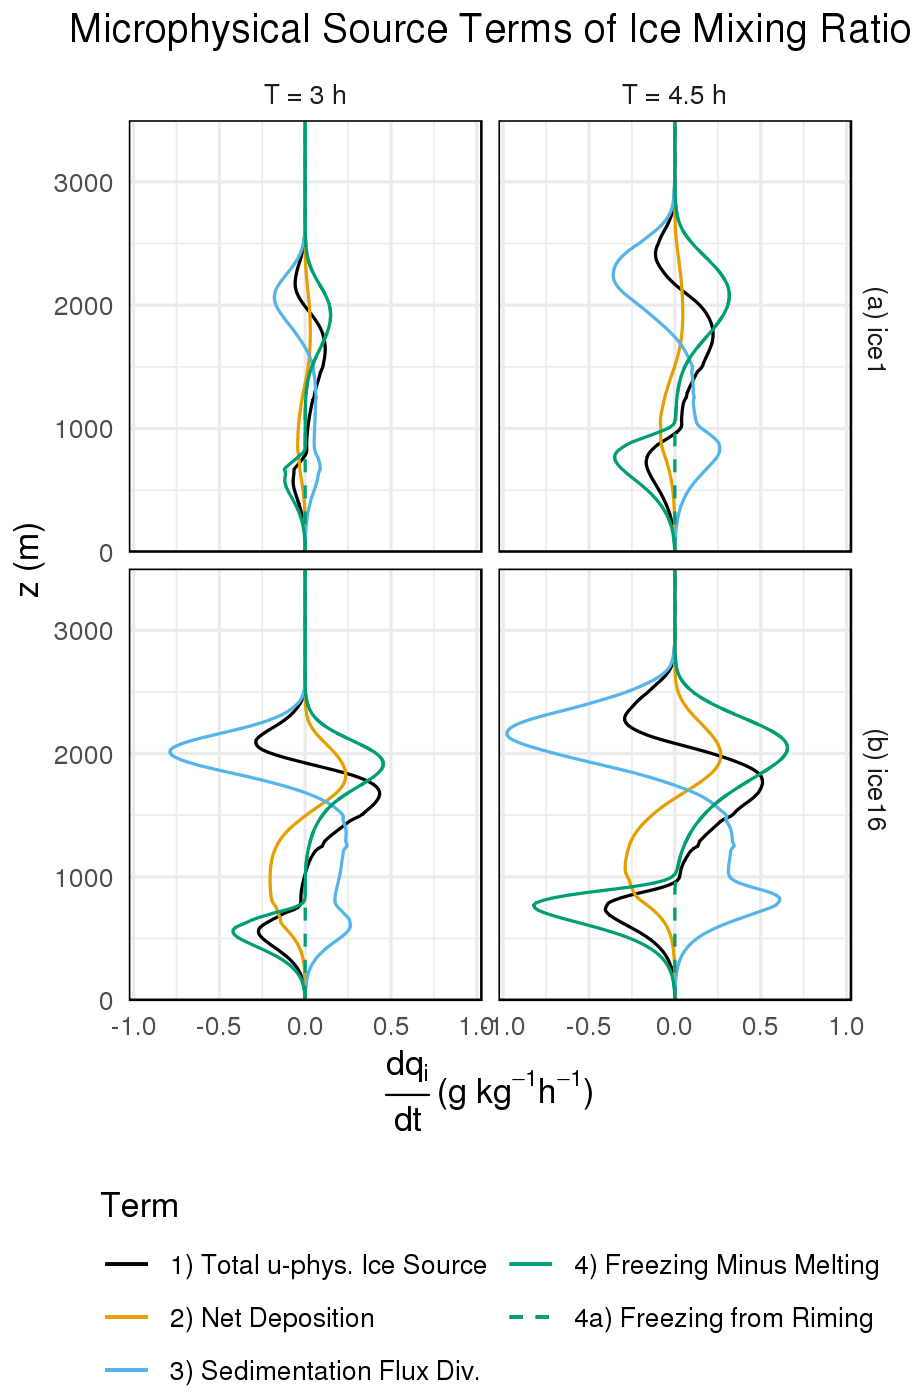
Figure 8Profiles of ice mixing ratio instantaneous source terms at two selected times for ice1 and ice16 simulations. Black lines mark the overall net microphysical source, and solid colored lines resolve the individual microphysical source terms, that is, net deposition, sedimentation flux divergence, and freezing minus melting. The latter term is further refined to isolate riming (green dashed line), which effectively comprises all freezing by mass at supercooled temperatures.
To highlight the mass-related impact of riming, Fig. 8 shows profiles of microphysical source terms of ice mixing ratio for selected times. In ice1 (top panel), the transfer between water and ice phase (freezing minus melting; shown as solid green line) is the main source between 1.5 and 2.5 km and a major sink below 1 km altitude. Riming (shown as a dashed green line) effectively comprises all direct transfer from water to ice phase. By comparison, riming is at least twice as strong at producing ice mass than depositional growth.
The combination of (1) and (2) leaves the onset time of substantial rain nearly unchanged (Fig. 2e) and produces similar precipitation rates (both liquid and frozen) at the surface shortly after substantial rain onset (Fig. 2f), reducing both LWP and Nc, resulting in comparable LWP/Nc ratios across simulations that likely relate to comparable rates of cloud-base precipitation (Comstock et al., 2004, or in terms of rainwater paths here) that then simultaneously exceed the 25 g m−2 threshold. However, substantial rain contribution to Na+c consumption is delayed in ice1 until nearly ∼4.5 h (Fig. 6b).
The combined effect of (2) and (3), however, contributes to the stratification of the PBL before substantial rain onset (Fig. 2m). This stratification modulates the PBL dynamics early towards a convective state, indicated by a greater frequency of thin clouds and the presence of a few thick clouds, already at substantial rain onset (cf. solid red lines in Fig. 3a and b; top panels), which also weakens in-cloud vertical winds earlier (Fig. 3a and b; bottom panels). Compared to ice0, the cloud deck breaks apart ∼1 h sooner (Fig. 2b), by our definition. Using an alternative cloud cover threshold of 50 %, the breakup would be ∼2 h sooner (Fig. 2b). At average horizontal PBL wind speeds, breakup by an hour earlier translates into a downwind distance of ∼75 km covered with less reflective cloud decks.
The dropping LWP levels, following the appearance of rimed snow at the surface, qualitatively agrees with CAO observations in Young et al. (2016). The magnitude in LWP decline is also similar to that observed during transitioning CAOs by Shupe et al. (2008) and Abel et al. (2017), though the latter study had more than 2 orders of magnitude greater ice number concentrations at breakup (with local maxima exceeding 100 L−1).
3.3 Shortening of the overcast period in a concentration-dependent manner
Observations of ice concentrations at similar temperature ranges (e.g., 250–260 K in Young et al., 2016, 267–270 K in Huang et al., 2017, and 258–276 K during a CAO transition in Abel et al., 2017) suggest a possible range spanning several orders of magnitude (1–10, 1–40, and 0.1–100 L−1, respectively). To gauge the impact of greater concentrations, we quadrupled Ninp to 4 L−1 (ice4) and again to 16 L−1 (ice16).
Figure 9 summarizes the resulting responses averaged over the period termed preconditioning by riming (Fig. 9a–f; referring to the gray shading in Figs. 2 and 6) and captures the duration of the overcast state, which is separated into the period from the formation of overcast clouds until the substantial rain onset (Fig. 9g) and the period from onset until the breakup of overcast clouds (Fig. 9h). Adding the diagnostics of Fig. 9g and h gives the total duration of the overcast state. In this subsection, we analyze impacts for an initial PBL aerosol concentration of 200 cm−3 (short dashed line in Fig. 9).
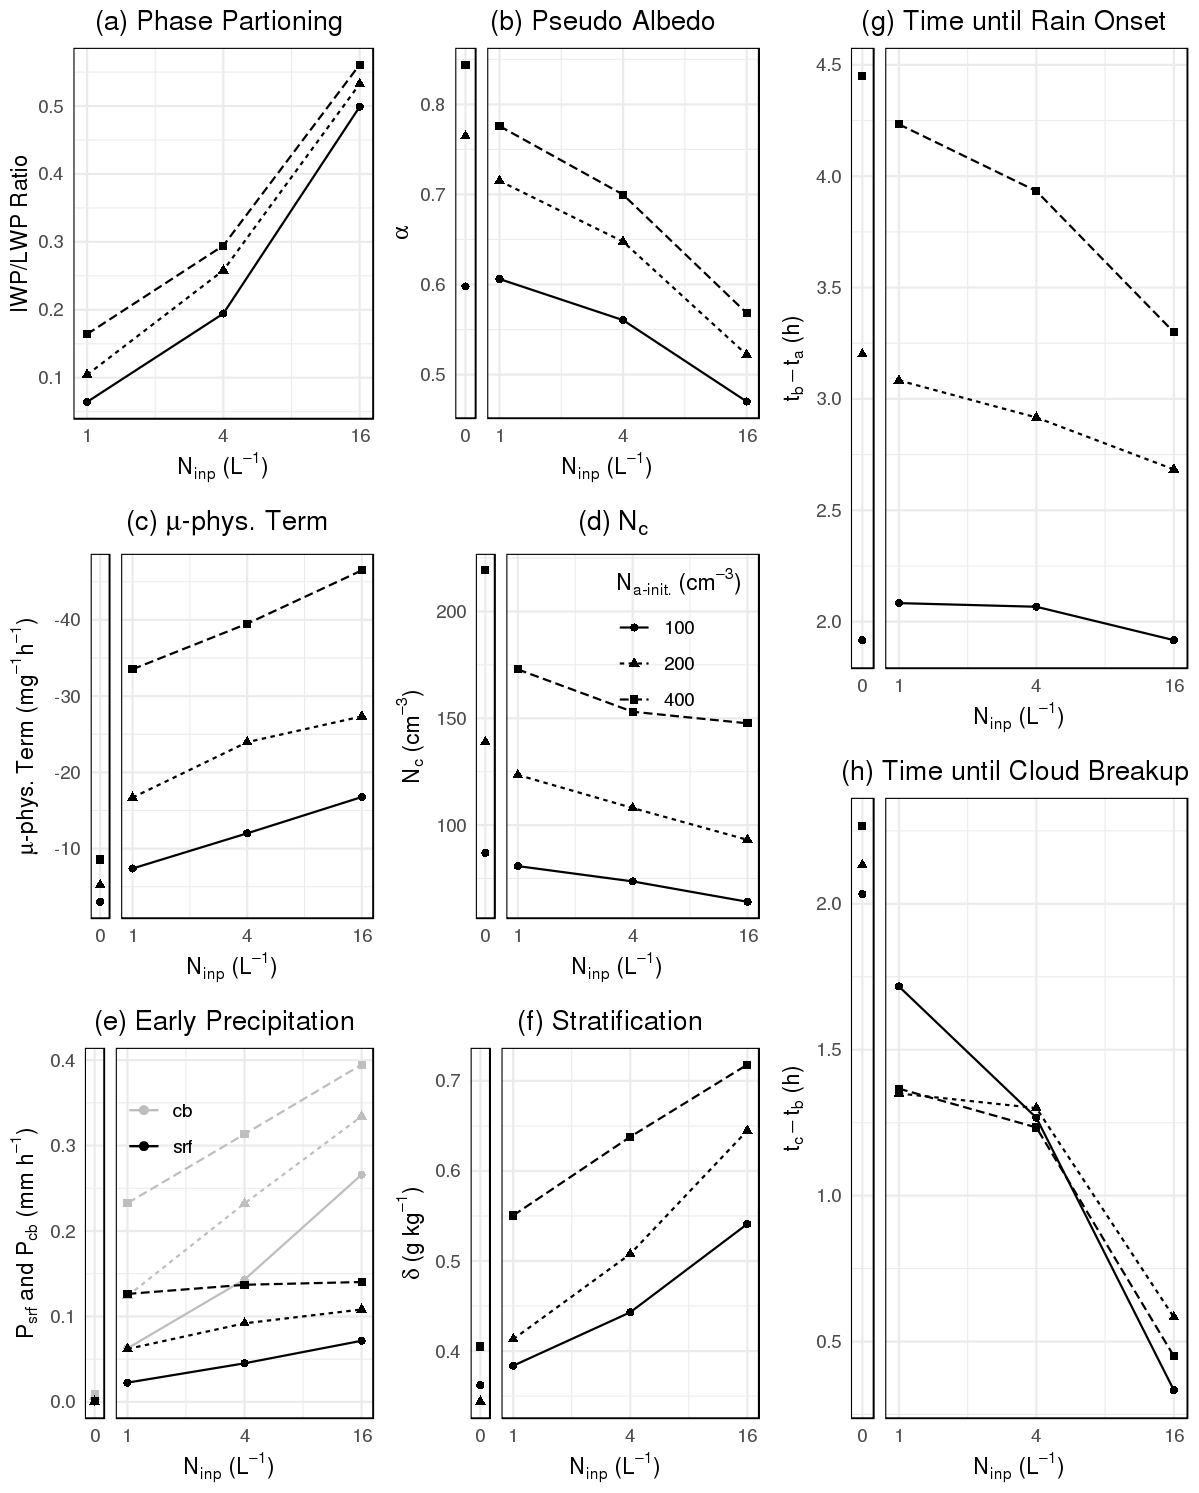
Figure 9Dependence on INP concentrations (x axis) and initial PBL Na (by line type and point shape) of metrics averaged over a 2 h period prior to the onset of substantial rain tb (termed preconditioning by riming in this study). (a) IWPLWP ratio, (b) pseudo albedo, (c) PBL-average aerosol consumption, (d) in-cloud droplet number concentration, (e) early (i.e., prior to onset of substantial rain) precipitation rates at cloud base and surface (cb and srf, respectively), and (f) PBL stratification δ. Also shown is the impact on transition speed, defined as the duration with overcast cloud. Panel (g) shows the time from the first overcast cloud deck formation, ta, to the onset of substantial rain, tb, and panel (h) shows the time from substantial rain onset until cloud deck breakup, tc.
Each successive Ninp increase adds ∼50 g m−2 in ice water path (IWP; Fig. 2d), while removing between 50–100 g m−2 in LWP (Fig. 2c) during preconditioning by riming, which are magnitudes that generally correspond with responses in Arctic mixed-phase stratocumulus simulations by Stevens et al. (2018). When combined, these raise the IWPLWP ratio to up to ∼0.5 for ice16 (Fig. 9a), comparable to ratios reported from mixed-phase simulations of PBL clouds using high ice number concentrations (e.g., Eirund et al., 2019; Young et al., 2016). Overall diminished condensate (LWP plus IWP) and greater proportions of ice lead to a lower cloud albedo (Fig. 9b). Increasing Ninp enhances riming (Figs. 6c and 9c) and reduces Nc (Fig. 9d), intensifying light precipitation at cloud base and, to a lesser extent, at the surface (Fig. 9e), resulting in further stratification (Fig. 9f). While the onset of substantial rain is surprisingly insensitive to Ninp (Fig. 9g), the time from rain onset to cloud breakup (Fig. 9h) is shortened from over 2 h in ice0 down to ∼0.5 h in ice16. At the onset, the ice16 simulation develops a cloud vertical structure composed foremost of geometrically thin portions and a few with a large geometric extent, all in the presence of relatively weak in-cloud vertical winds (Fig. 3c; red lines). In ice0 and ice1, such geometric extents and vertical winds were only associated with a convective state 1–2 h after substantial rain onset (Fig. 3a and b). However, the progression of increasing RWP modal values before, during, and after onset of substantial rain in ice16 remains similar to ice0 and ice1 simulations.
The accelerated breakup between ice0 and ice16 measures ∼1.5 h (Fig. 9h) and translates into a ∼120 km distance downwind that would reflect much more sunlight and emit less longwave radiation in the absence of cloud ice. Using a cloud cover >50 % to define the overcast state results in a similarly timed breakup across mixed-phase experiments (i.e., Ninp>0 L−1), regardless of Ninp (Fig. 2b).
3.4 Intensification of riming preconditioning in high aerosol environments
Finally, we investigate the role of initial PBL aerosol concentrations to represent their substantial variability at the USA east coast with air mass origin (Sorooshian et al., 2019).
The main effect of greater Na is to delay the onset of substantial rain (Fig. 9g), while the time from onset to breakup is remarkably insensitive to aerosol concentrations (Fig. 9h), with the exception of a configuration using ice1 and that showed a slightly delayed breakup compared to greater Na-init, and this delay is smaller than the ensemble spread of baseline simulations (i.e., ∼0.5 h; Fig. 2b).
Additional time prior to the onset of substantial rain allows the PBL to further deepen (not shown) and to promote greater IWPLWP ratios (Fig. 9a), presumably due to a greater geometric depth of supercooled cloud extent, where Ninp can be activated in these simulations. Owing to larger liquid and ice water paths (not shown) and also more numerous and smaller particles, cloud albedo is greater (Fig. 9b). More time prior to substantial rain onset further reduces aerosol concentrations through prolonged dilution via entrainment and microphysical consumption (Fig. 9c), leading to Nc progressively diminished from initial concentrations (Fig. 9d; cf. ice0 and mixed-phase simulations). We further find greater rates of light precipitation (Fig. 9e; the larger geometric extents of supercooled cloud presumably facilitates more precipitating riming-grown frozen hydrometeors) over an extended period that leads to additional stratification (Fig. 9f). Positive feedbacks during substantial rain always quickly reduce Nc below 50 mg−1 (and below 25 mg−1 after several hours; not shown), resulting in a low CCN state in all experiments, which has been observed far downwind of CAOs (Wood et al., 2017). The time between substantial rain onset and breakup is relatively weakly sensitive to the factor of 4 range of initial Na considered here (Fig. 9h), with the exception of one configuration that we pointed out earlier.
These experiments support the initially suggested mechanism of preconditioning by riming as being a driver of accelerated breakup. Ingredients for longer overcast periods (here the sum of the periods of cloud formation to substantial precipitation onset, Fig. 9g, and from onset to cloud breakup, Fig. 9h) are lower ice nucleation particle concentrations and higher initial aerosol concentrations in both PBL and FT.
Cold air outbreaks produce PBL clouds that undergo radiatively important transitions from stratiform, overcast to convective, broken cloud fields. Here we demonstrate that frozen hydrometeors accelerate these transitions in an Ninp-dependent manner, mainly through riming-related responses that act prior to transition-inducing rain.
Morrison et al. (2012) highlights stabilizing mechanisms of ice in mixed-phase clouds. Even though we showed that (more) ice leads to (progressively) faster breakups in cold air outbreaks, one stabilizing mechanism does emerge from our study, that is, with more ice, the PBL deepens less. A shallower PBL prevents portions of the clouds from being supercooled and from developing greater IWP over extended times that would accelerate breakups further. While our simulations assume a set Ninp, ice formation has been observed to intensify with lower temperatures (that a shallower PBL would miss), potentially amplifying this stabilizing mechanism. Future efforts should investigate why some properties, such as early precipitation, and also early cloud microphysical composition, scale linearly with log (Ninp), while others, such as breakup timing, respond less regularly.
Ice number particle concentration, treated diagnostically here, should be considered prognostically in the near future by, for example, including realistic INP spectra and established multiplication processes, such as ice multiplication, in connection to drizzle (e.g., Rangno and Hobbs, 2001) that, in itself, is uncertain, as seen in model intercomparisons (e.g., Klein et al., 2009; de Roode et al., 2019). In situ measurements are required to provide better bounds to INP sinks and sources.
This study, like others before (e.g., Abel et al., 2017; Field et al., 2014), demonstrates that cold air outbreaks are complex systems. An evaluation of the general circulation model's column physics should focus on the ability to capture positive feedbacks between precipitation and droplet numbers (necessitating a prognostic treatment of aerosol), as well as the progressive stratification that appear as a cornerstone for closed-to-open cloud transitions. Such evaluations have been done in the past for SCT (e.g., Neggers, 2015; de Roode et al., 2019) but lacked prognostic aerosol.
This study demonstrates that cold air outbreaks exhibit both shortwave and longwave cloud radiative effects. Between a simulation setup that transitions toward the broken cloud state, such as ice0, and one that remains overcast, for example ice0_no_loss, we find a pseudo albedo difference of about 0.4 (Fig. 2i). Using a global diurnal average solar insolation of 340 W m−2, the shortwave effect translates into roughly 140 W m−2. On the other hand, results vary in outgoing longwave radiation (Fig. 2j), which responds to changes in cloud-top temperature, cloud cover, and underlying surface temperature, counteracting the shortwave radiative effect. The longwave effects can roughly be approximated from the difference between ice0 and ice0_no_loss at 12 h, which is about 40 W m−2, leaving a total cloud radiative effect of about 100 W m−2.
Meteorological factors and their dynamic range may exert more leverage than the microphysical controls examined here. We are currently considering an ensemble of cold air outbreaks and their transition speeds in response to varied forcings, including large-scale meteorology, to investigate driving factors under a range of conditions. Among these factors are the initial profiles of moisture and stability. Even within the same CAO, differences in transition speed can occur, as seen across neighboring trajectories in Fig. 1. For instance, breakup is faster along adjacent trajectories to the northeast, where subsidence is weaker according to the reanalysis.
Despite other governing factors, we expect that the same microphysical mechanisms should be at play in CAOs of different intensity or in different regions. Likewise, we expect that the sensitivities shown here would generally hold for a differing meteorological baseline, which could be associated with a more or less rapid breakup compared to our selected trajectory. Few observational case studies exist. Relative to an observed CAO transition in the North Sea by Abel et al. (2017), we find a comparable evolution in micro- and macro-physical liquid cloud properties. For example, coincident remote sensing data indicated peak LWP beyond 400 g m−2 before the transition, similar to mixed-phase simulations in this study. Even though Abel et al. (2017) found much a higher ice loading in the final stages of the breakup, in situ probes indicated rimed particles before and after the transition, similar to cold air outbreaks in the Beaufort Sea during M-PACE (Fridlind and Ackerman, 2018) or in post-frontal open cellular clouds in the Southern Ocean (Huang et al., 2017). Preliminary measurements during ACTIVATE corroborate the common presence of rimed ice particles (Simon Kirschler and Christiane Voigt, personal communication, 2021). Abel et al. (2017) further observed a similar intensification of the PBL moisture stratification from 0.3 to 1.5 g kg−1 (shown in Fig. 2m) over the course of the transition. Lastly, preliminary size distributions during ACTIVATE (Luke Ziemba and Richard Moore, personal communication, 2021) indicate that there are often fewer CCN in the FT than in the PBL during CAOs, similar to Abel et al. (2017). Inspection of sequential geostationary images along the trajectory simulated for this case (not shown) suggests that an overcast state was sustained hours longer than our simulations that include ice. As discussed above, the duration of the overcast state is sensitive to the choice of trajectory, and uncertainty in meteorological forcings remains uninvestigated. Furthermore, the microphysical sensitivity to accumulation mode aerosol could explain such a difference; we demonstrated that higher aerosol concentrations available for CCN activation delay the cloud transition. Lastly, the preliminary aerosol size distribution gathered during ACTIVATE indicates an abundance of small aerosol particles (Luke Ziemba and Richard Moore, personal communication, 2021). An Aitken mode was not included in our simulations, and the activation of small particles during elevated at high supersaturations (found in our simulation in the presence of rain; not shown) might further delay the cloud breakup. However, no in situ measurements are available to indicate plausibility of such a setup for this case.
The ongoing ACTIVATE campaign (Sorooshian et al., 2019) should allow for an observationally inferred assessment of riming. In the spirit of Popper's falsifiability (Popper, 2002), we should be looking for counterexamples in the observations, such as abundant riming without a significant reduction in total aerosol (contrasting with CCN loss zones in our simulations; not shown here) or else the presence of ice in a high liquid water content (LWC) environment that failed to rime, ideally using in situ imaging probes that characterize both ice and supercooled liquid. Finding such contradictory observations could point towards an inflated representation of this effect when using our model parameterizations and setup.
Mixed-phase PBL clouds are thought to constitute a reason for the large spread in equilibrium climate sensitivity across general circulation models (e.g., Zelinka et al., 2020; McCoy et al., 2020). In a warming climate, in which PBL conditions for ice formations shift progressively into higher altitudes and latitudes, cold air outbreaks might be expected to produce less cloud ice and, thereby, break up slower, increasing cloud cover and solar reflectivity (as seen in Fig. 2i) and reducing longwave emission (Fig. 2j). We argue that riming represents a potentially important confinement of a negative cloud–climate feedback, assuming that ice formation will be generally weaker with increasing temperature.
CAOs strongly modulate the local albedo by forming overcast, stratiform cloud decks that transition into broken, convective cloud fields downwind. This study investigates the role of mixed-phase processes in these transitions. We show that, regardless of cloud characteristics, transitions are triggered by the onset of substantial rain and are mediated by rapidly depleting PBL CCN. The presence of frozen hydrometeors, mostly in the form of snow, accelerates transitions through the following riming-related effects prior to substantial rain onset: (1) reduction in cloud liquid water, (2) faster depletion of PBL CCN, and (3) early, light precipitation of riming-grown snow particles that stratify the PBL through sublimation or melting and evaporation. These effects, collectively termed preconditioning by riming, leave the timing of substantial rain onset unaffected while modulating the PBL early towards the convective state. Preconditioning by riming scales with a specified diagnostic INP concentration that serves as a proxy for uncertain ice formation strength, leading to progressively shorter overcast states. Increasing initial PBL CCN delays the onset of precipitation but, owing to prolonged microphysical CCN loss prior to the onset, the transition towards the broken state is largely indifferent to initial CCN concentration. The use of a CAO case in the NW Atlantic sets the stage for future ACTIVATE observations to assess the plausibility of this potential negative cloud–climate feedback with its roots in mixed-phase microphysics.
Code available upon request.
Simulation output available upon request.
FT, AA, and AF designed the simulations, and FT carried them out. FT performed the formal analysis and visualized the data. FT prepared the initial draft, and AA and AF reviewed and edited the paper.
The authors declare that they have no conflict of interest.
Publisher's note: Copernicus Publications remains neutral with regard to jurisdictional claims in published maps and institutional affiliations.
We would like to thank George Tselioudis, Brian Cairns, and Paquita Zuidema, for the insightful discussions, as well as NASA Advanced Supercomputing (NAS), for the computing time. We thank the two anonymous reviewers for their careful reading and insightful comments, which improved the paper. This work is part of the ACTIVATE Earth Venture Suborbital-3 (EVS-3) investigation founded by NASA's Earth Science Division and managed through the Earth System Science Pathfinder Program Office, also supported by funding from the NASA Modeling, Analysis, and Prediction Program. We acknowledge the use of imagery from the NASA Worldview application (https://worldview.earthdata.nasa.gov/, last access: 28 January 2021), which is part of the NASA Earth Observing System Data and Information System (EOSDIS).
This research has been supported by the Earth Sciences Division (grant no. 80NSSC19K0442).
This paper was edited by Timothy Garrett and reviewed by two anonymous referees.
Abel, S. J., Boutle, I. A., Waite, K., Fox, S., Brown, P. R. A., Cotton, R., Lloyd, G., Choularton, T. W., and Bower, K. N.: The Role of Precipitation in Controlling the Transition from Stratocumulus to Cumulus Clouds in a Northern Hemisphere Cold-Air Outbreak, J. Atmos. Sci., 74, 2293–2314, https://doi.org/10.1175/JAS-D-16-0362.1, 2017. a, b, c, d, e, f, g, h, i, j
Ackerman, A. S., Kirkpatrick, M., and Stevens, D.: The impact of humidity above stratiform clouds on indirect aerosol climate forcing, Nature, 432, 1014–1017, https://doi.org/10.1038/nature03174, 2004. a
Ahn, E., Huang, Y., Chubb, T. H., Baumgardner, D., Isaac, P., de Hoog, M., Siems, S. T., and Manton, M. J.: In situ observations of wintertime low-altitude clouds over the Southern Ocean, Q. J. Roy. Meteor. Soc., 143, 1381–1394, https://doi.org/10.1002/qj.3011, 2017. a
Albrecht, B., Ghate, V., Mohrmann, J., Wood, R., Zuidema, P., Bretherton, C., Schwartz, C., Eloranta, E., Glienke, S., Donaher, S., Sarkar, M., McGibbon, J., Nugent, A. D., Shaw, R. A., Fugal, J., Minnis, P., Paliknoda, R., Lussier, L., Jensen, J., Vivekanandan, J., Ellis, S., Tsai, P., Rilling, R., Haggerty, J., Campos, T., Stell, M., Reeves, M., Beaton, S., Allison, J., Stossmeister, G., Hall, S., and Schmidt, S.: Cloud System Evolution in the Trades (CSET): Following the Evolution of Boundary Layer Cloud Systems with the NSF–NCAR GV, B. Am. Meteorol. Soc., 100, 93–121, https://doi.org/10.1175/BAMS-D-17-0180.1, 2019. a
Albrecht, B. A., Bretherton, C. S., Johnson, D., Scubert, W. H., and Frisch, A. S.: The Atlantic Stratocumulus Transition Experiment – ASTEX, B. Am. Meteorol. Soc., 76, 889–904, https://doi.org/10.1175/1520-0477(1995)076<0889:TASTE>2.0.CO;2, 1995. a
Baker, M. and Charlson, R.: Bistability of CCN concentrations and thermodynamics in the cloud-topped boundary layer, Nature, 345, 142–145, https://doi.org/10.1038/345142a0, 1990. a
Bretherton, C. S. and Wyant, M. C.: Moisture Transport, Lower-Tropospheric Stability, and Decoupling of Cloud-Topped Boundary Layers, J. Atmos. Sci., 54, 148–167, https://doi.org/10.1175/1520-0469(1997)054<0148:MTLTSA>2.0.CO;2, 1997. a
Brümmer, B.: Roll and Cell Convection in Wintertime Arctic Cold-Air Outbreaks, J. Atmos. Sci., 56, 2613–2636, https://doi.org/10.1175/1520-0469(1999)056<2613:RACCIW>2.0.CO;2, 1999. a
Businger, J. A., Wyngaard, J. C., Izumi, Y., and Bradley, E. F.: Flux-Profile Relationships in the Atmospheric Surface Layer, J. Atmos. Sci., 28, 181–189, https://doi.org/10.1175/1520-0469(1971)028<0181:FPRITA>2.0.CO;2, 1971. a
Christensen, M. W., Jones, W. K., and Stier, P.: Aerosols enhance cloud lifetime and brightness along the stratus-to-cumulus transition, P. Natl. Acad. Sci. USA, 117, 17591–17598, https://doi.org/10.1073/pnas.1921231117, 2020. a, b
Clarke, A. D., Owens, S. R., and Zhou, J.: An ultrafine sea-salt flux from breaking waves: Implications for cloud condensation nuclei in the remote marine atmosphere, J. Geophys. Res.-Atmos., 111, D06202, https://doi.org/10.1029/2005JD006565, 2006. a
Comstock, K. K., Wood, R., Yuter, S. E., and Bretherton, C. S.: Reflectivity and rain rate in and below drizzling stratocumulus, Q. J. Roy. Meteor. Soc., 130, 2891–2918, https://doi.org/10.1256/qj.03.187, 2004. a
de Boer, G., Morrison, H., Shupe, M. D., and Hildner, R.: Evidence of liquid dependent ice nucleation in high-latitude stratiform clouds from surface remote sensors, Geophys. Res. Lett., 38, L01803, https://doi.org/10.1029/2010GL046016, 2011. a
de Roode, S. R., Frederikse, T., Siebesma, A. P., Ackerman, A. S., Chylik, J., Field, P. R., Fricke, J., Gryschka, M., Hill, A., Honnert, R., Krueger, S. K., Lac, C., Lesage, A. T., and Tomassini, L.: Turbulent Transport in the Gray Zone: A Large Eddy Model Intercomparison Study of the CONSTRAIN Cold Air Outbreak Case, J. Adv. Model. Earth Sy., 11, 597–623, https://doi.org/10.1029/2018MS001443, 2019. a, b
DeMott, P. J., Prenni, A. J., Liu, X., Kreidenweis, S. M., Petters, M. D., Twohy, C. H., Richardson, M. S., Eidhammer, T., and Rogers, D. C.: Predicting global atmospheric ice nuclei distributions and their impacts on climate, P. Natl. Acad. Sci. USA, 107, 11217–11222, https://doi.org/10.1073/pnas.0910818107, 2010. a
Eastman, R. and Wood, R.: Factors Controlling Low-Cloud Evolution over the Eastern Subtropical Oceans: A Lagrangian Perspective Using the A-Train Satellites, J. Atmos. Sci., 73, 331–351, https://doi.org/10.1175/JAS-D-15-0193.1, 2016. a, b
Eirund, G. K., Lohmann, U., and Possner, A.: Cloud Ice Processes Enhance Spatial Scales of Organization in Arctic Stratocumulus, Geophys. Res. Lett., 46, 14109–14117, https://doi.org/10.1029/2019GL084959, 2019. a, b, c, d, e
Field, P. R. and Heymsfield, A. J.: Importance of snow to global precipitation, Geophys. Res. Lett., 42, 9512–9520, https://doi.org/10.1002/2015GL065497, 2015. a
Field, P. R., Cotton, R. J., McBeath, K., Lock, A. P., Webster, S., and Allan, R. P.: Improving a convection-permitting model simulation of a cold air outbreak, Q. J. Roy. Meteor. Soc., 140, 124–138, https://doi.org/10.1002/qj.2116, 2014. a, b
Fletcher, J., Mason, S., and Jakob, C.: The Climatology, Meteorology, and Boundary Layer Structure of Marine Cold Air Outbreaks in Both Hemispheres, J. Climate, 29, 1999–2014, https://doi.org/10.1175/JCLI-D-15-0268.1, 2016. a, b, c
Fridlind, A. M. and Ackerman, A. S.: Chapter 7 – Simulations of Arctic Mixed-Phase Boundary Layer Clouds: Advances in Understanding and Outstanding Questions, in: Mixed-Phase Clouds, edited by: Andronache, C., Elsevier, Amsterdam, the Netherlands, Oxford, UK, Cambridge, USA, 153–183, https://doi.org/10.1016/B978-0-12-810549-8.00007-6, 2018. a, b
Fridlind, A. M., Ackerman, A. S., Chaboureau, J.-P., Fan, J., Grabowski, W. W., Hill, A. A., Jones, T. R., Khaiyer, M. M., Liu, G., Minnis, P., Morrison, H., Nguyen, L., Park, S., Petch, J. C., Pinty, J.-P., Schumacher, C., Shipway, B. J., Varble, A. C., Wu, X., Xie, S., and Zhang, M.: A comparison of TWP-ICE observational data with cloud-resolving model results, J. Geophys. Res.-Atmos., 117, D05204, https://doi.org/10.1029/2011JD016595, 2012. a
Gelaro, R., McCarty, W., Suárez, M. J., Todling, R., Molod, A., Takacs, L., Randles, C. A., Darmenov, A., Bosilovich, M. G., Reichle, R., Wargan, K., Coy, L., Cullather, R., Draper, C., Akella, S., Buchard, V., Conaty, A., da Silva, A. M., Gu, W., Kim, G.-K., Koster, R., Lucchesi, R., Merkova, D., Nielsen, J. E., Partyka, G., Pawson, S., Putman, W., Rienecker, M., Schubert, S. D., Sienkiewicz, M., and Zhao, B.: The Modern-Era Retrospective Analysis for Research and Applications, Version 2 (MERRA-2), J. Climate, 30, 5419–5454, https://doi.org/10.1175/JCLI-D-16-0758.1, 2017. a
Goren, T., Kazil, J., Hoffmann, F., Yamaguchi, T., and Feingold, G.: Anthropogenic Air Pollution Delays Marine Stratocumulus Breakup to Open Cells, Geophys. Res. Lett., 46, 14135–14144, https://doi.org/10.1029/2019GL085412, 2019. a
Hartmann, D. L., Ockert-Bell, M. E., and Michelsen, M. L.: The Effect of Cloud Type on Earth's Energy Balance: Global Analysis, J. Climate, 5, 1281–1304, https://doi.org/10.1175/1520-0442(1992)005<1281:TEOCTO>2.0.CO;2, 1992. a
Hersbach, H., Bell, B., Berrisford, P., Hirahara, S., Horányi, A., Muñoz-Sabater, J., Nicolas, J., Peubey, C., Radu, R., Schepers, D., Simmons, A., Soci, C., Abdalla, S., Abellan, X., Balsamo, G., Bechtold, P., Biavati, G., Bidlot, J., Bonavita, M., De Chiara, G., Dahlgren, P., Dee, D., Diamantakis, M., Dragani, R., Flemming, J., Forbes, R., Fuentes, M., Geer, A., Haimberger, L., Healy, S., Hogan, R. J., Hólm, E., Janisková, M., Keeley, S., Laloyaux, P., Lopez, P., Lupu, C., Radnoti, G., de Rosnay, P., Rozum, I., Vamborg, F., Villaume, S., and Thépaut, J.-N.: The ERA5 global reanalysis, Q. J. Roy. Meteor. Soc., 146, 1999–2049, https://doi.org/10.1002/qj.3803, 2020. a
Huang, Y., Chubb, T., Baumgardner, D., deHoog, M., Siems, S. T., and Manton, M. J.: Evidence for secondary ice production in Southern Ocean open cellular convection, Q. J. Roy. Meteor. Soc., 143, 1685–1703, https://doi.org/10.1002/qj.3041, 2017. a, b, c
Kanji, Z. A., Ladino, L. A., Wex, H., Boose, Y., Burkert-Kohn, M., Cziczo, D. J., and Krämer, M.: Overview of Ice Nucleating Particles, Meteor. Mon., 58, 1.1–1.33, https://doi.org/10.1175/AMSMONOGRAPHS-D-16-0006.1, 2017. a
Kirkpatrick, M. P., Ackerman, A. S., Stevens, D. E., and Mansour, N. N.: On the Application of the Dynamic Smagorinsky Model to Large-Eddy Simulations of the Cloud-Topped Atmospheric Boundary Layer, J. Atmos. Sci., 63, 526–546, https://doi.org/10.1175/JAS3651.1, 2006. a, b
Klein, S. A., McCoy, R. B., Morrison, H., Ackerman, A. S., Avramov, A., Boer, G. d., Chen, M., Cole, J. N. S., Del Genio, A. D., Falk, M., Foster, M. J., Fridlind, A., Golaz, J.-C., Hashino, T., Harrington, J. Y., Hoose, C., Khairoutdinov, M. F., Larson, V. E., Liu, X., Luo, Y., McFarquhar, G. M., Menon, S., Neggers, R. A. J., Park, S., Poellot, M. R., Schmidt, J. M., Sednev, I., Shipway, B. J., Shupe, M. D., Spangenberg, D. A., Sud, Y. C., Turner, D. D., Veron, D. E., Salzen, K. v., Walker, G. K., Wang, Z., Wolf, A. B., Xie, S., Xu, K.-M., Yang, F., and Zhang, G.: Intercomparison of model simulations of mixed-phase clouds observed during the ARM Mixed-Phase Arctic Cloud Experiment. I: single-layer cloud, Q. J. Roy. Meteor. Soc., 135, 979–1002, https://doi.org/10.1002/qj.416, 2009. a
Knight, C. A., Knight, N. C., Dye, J. E., and Toutenhoofd, V.: The Mechanism of Precipitation Formation in Northeastern Colorado Cumulus I. Observations of the Precipitation Itself, J. Atmos. Sci., 31, 2142–2147, https://doi.org/10.1175/1520-0469(1974)031<2142:TMOPFI>2.0.CO;2, 1974. a
Kolstad, E. W., Bracegirdle, T. J., and Seierstad, I. A.: Marine cold-air outbreaks in the North Atlantic: temporal distribution and associations with large-scale atmospheric circulation, Clim. Dynam., 33, 187–197, https://doi.org/10.1007/s00382-008-0431-5, 2009. a
Korolev, A. and Leisner, T.: Review of experimental studies of secondary ice production, Atmos. Chem. Phys., 20, 11767–11797, https://doi.org/10.5194/acp-20-11767-2020, 2020. a
Korolev, A., Heckman, I., Wolde, M., Ackerman, A. S., Fridlind, A. M., Ladino, L. A., Lawson, R. P., Milbrandt, J., and Williams, E.: A new look at the environmental conditions favorable to secondary ice production, Atmos. Chem. Phys., 20, 1391–1429, https://doi.org/10.5194/acp-20-1391-2020, 2020. a
L'Ecuyer, T. S., Hang, Y., Matus, A. V., and Wang, Z.: Reassessing the Effect of Cloud Type on Earth's Energy Balance in the Age of Active Spaceborne Observations. Part I: Top of Atmosphere and Surface, J. Climate, 32, 6197–6217, https://doi.org/10.1175/JCLI-D-18-0753.1, 2019. a
McCoy, D. T., Hartmann, D. L., Zelinka, M. D., Ceppi, P., and Grosvenor, D. P.: Mixed-phase cloud physics and Southern Ocean cloud feedback in climate models, J. Geophys. Res.-Atmos., 120, 9539–9554, https://doi.org/10.1002/2015JD023603, 2015. a
McCoy, D. T., Field, P., Bodas-Salcedo, A., Elsaesser, G. S., and Zelinka, M. D.: A Regime-Oriented Approach to Observationally Constraining Extratropical Shortwave Cloud Feedbacks, J. Climate, 33, 9967–9983, https://doi.org/10.1175/JCLI-D-19-0987.1, 2020. a
McCoy, I. L., Wood, R., and Fletcher, J. K.: Identifying Meteorological Controls on Open and Closed Mesoscale Cellular Convection Associated with Marine Cold Air Outbreaks, J. Geophys. Res.-Atmos., 122, 11678–11702, https://doi.org/10.1002/2017JD027031, 2017. a
Mohrmann, J., Bretherton, C. S., McCoy, I. L., McGibbon, J., Wood, R., Ghate, V., Albrecht, B., Sarkar, M., Zuidema, P., and Palikonda, R.: Lagrangian Evolution of the Northeast Pacific Marine Boundary Layer Structure and Cloud during CSET, Mon. Weather Rev., 147, 4681–4700, https://doi.org/10.1175/MWR-D-19-0053.1, 2019. a
Morrison, H. and Grabowski, W. W.: A Novel Approach for Representing Ice Microphysics in Models: Description and Tests Using a Kinematic Framework, J. Atmos. Sci., 65, 1528–1548, https://doi.org/10.1175/2007JAS2491.1, 2008. a, b
Morrison, H., Thompson, G., and Tatarskii, V.: Impact of Cloud Microphysics on the Development of Trailing Stratiform Precipitation in a Simulated Squall Line: Comparison of One- and Two-Moment Schemes, Mon. Weather Rev., 137, 991–1007, https://doi.org/10.1175/2008MWR2556.1, 2009. a, b
Morrison, H., de Boer, G., and Feingold, G.: Resilience of persistent Arctic mixed-phase clouds, Nat. Geosci., 5, 11–17, https://doi.org/10.1038/ngeo1332, 2012. a
Myers, T. A. and Norris, J. R.: Observational Evidence That Enhanced Subsidence Reduces Subtropical Marine Boundary Layer Cloudiness, J. Climate, 26, 7507–7524, https://doi.org/10.1175/JCLI-D-12-00736.1, 2013. a
Neggers, R. A. J.: Attributing the behavior of low-level clouds in large-scale models to subgrid-scale parameterizations, J. Adv. Model. Earth Sy., 7, 2029–2043, https://doi.org/10.1002/2015MS000503, 2015. a
Ovchinnikov, M., Easter, R. C., and Gustafson Jr., W. I.: Untangling dynamical and microphysical controls for the structure of stratocumulus, Geophys. Res. Lett., 40, 4432–4436, https://doi.org/10.1002/grl.50810, 2013. a
Ovchinnikov, M., Ackerman, A. S., Avramov, A., Cheng, A., Fan, J., Fridlind, A. M., Ghan, S., Harrington, J., Hoose, C., Korolev, A., McFarquhar, G. M., Morrison, H., Paukert, M., Savre, J., Shipway, B. J., Shupe, M. D., Solomon, A., and Sulia, K.: Intercomparison of large-eddy simulations of Arctic mixed-phase clouds: Importance of ice size distribution assumptions, J. Adv. Model. Earth Sy., 6, 223–248, https://doi.org/10.1002/2013MS000282, 2014. a, b, c
Paluch, I. R. and Lenschow, D. H.: Stratiform Cloud Formation in the Marine Boundary Layer, J. Atmos. Sci., 48, 2141–2158, https://doi.org/10.1175/1520-0469(1991)048<2141:SCFITM>2.0.CO;2, 1991. a
Papritz, L. and Spengler, T.: A Lagrangian Climatology of Wintertime Cold Air Outbreaks in the Irminger and Nordic Seas and Their Role in Shaping Air–Sea Heat Fluxes, J. Climate, 30, 2717–2737, https://doi.org/10.1175/JCLI-D-16-0605.1, 2017. a
Papritz, L., Pfahl, S., Sodemann, H., and Wernli, H.: A Climatology of Cold Air Outbreaks and Their Impact on Air–Sea Heat Fluxes in the High-Latitude South Pacific, J. Climate, 28, 342–364, https://doi.org/10.1175/JCLI-D-14-00482.1, 2015. a
Pithan, F., Svensson, G., Caballero, R., Chechin, D., Cronin, T. W., Ekman, A. M. L., Neggers, R., Shupe, M. D., Solomon, A., Tjernström, M., and Wendisch, M.: Role of air-mass transformations in exchange between the Arctic and mid-latitudes, Nat. Geosci., 11, 805–812, https://doi.org/10.1038/s41561-018-0234-1, 2019. a
Popper, K. R.: The Logic of Scientific Discovery, Routledge Classics, London and New York, first published in German in 1934. First published in English in 1959, 2002. a
Possner, A., Ekman, A. M. L., and Lohmann, U.: Cloud response and feedback processes in stratiform mixed-phase clouds perturbed by ship exhaust, Geophys. Res. Lett., 44, 1964–1972, https://doi.org/10.1002/2016GL071358, 2017. a
Rangno, A. L. and Hobbs, P. V.: Ice particles in stratiform clouds in the Arctic and possible mechanisms for the production of high ice concentrations, J. Geophys. Res.-Atmos., 106, 15065–15075, https://doi.org/10.1029/2000JD900286, 2001. a
Roberts, J. B., Robertson, F. R., Clayson, C. A., and Bosilovich, M. G.: Characterization of Turbulent Latent and Sensible Heat Flux Exchange between the Atmosphere and Ocean in MERRA, J. Climate, 25, 821–838, https://doi.org/10.1175/JCLI-D-11-00029.1, 2012. a
Rémillard, J. and Tselioudis, G.: Cloud Regime Variability over the Azores and Its Application to Climate Model Evaluation, J. Climate, 28, 9707–9720, https://doi.org/10.1175/JCLI-D-15-0066.1, 2015. a
Sandu, I. and Stevens, B.: On the Factors Modulating the Stratocumulus to Cumulus Transitions, J. Atmos. Sci., 68, 1865–1881, https://doi.org/10.1175/2011JAS3614.1, 2011. a, b, c
Sandu, I., Stevens, B., and Pincus, R.: On the transitions in marine boundary layer cloudiness, Atmos. Chem. Phys., 10, 2377–2391, https://doi.org/10.5194/acp-10-2377-2010, 2010. a, b
Sarkar, M., Zuidema, P., Albrecht, B., Ghate, V., Jensen, J., Mohrmann, J., and Wood, R.: Observations Pertaining to Precipitation within the Northeast Pacific Stratocumulus-to-Cumulus Transition, Mon. Weather Rev., 148, 1251–1273, https://doi.org/10.1175/MWR-D-19-0235.1, 2020. a
Savic-Jovcic, V. and Stevens, B.: The Structure and Mesoscale Organization of Precipitating Stratocumulus, J. Atmos. Sci., 65, 1587–1605, https://doi.org/10.1175/2007JAS2456.1, 2008. a
Seifert, A.: On the Parameterization of Evaporation of Raindrops as Simulated by a One-Dimensional Rainshaft Model, J. Atmos. Sci., 65, 3608–3619, https://doi.org/10.1175/2008JAS2586.1, 2008. a, b
Seifert, A. and Beheng, K. D.: A double-moment parameterization for simulating autoconversion, accretion and selfcollection, Atmos. Res., 59–60, 265–281, https://doi.org/10.1016/S0169-8095(01)00126-0, 2001. a, b
Shupe, M. D., Daniel, J. S., de Boer, G., Eloranta, E. W., Kollias, P., Long, C. N., Luke, E. P., Turner, D. D., and Verlinde, J.: A Focus On Mixed-Phase Clouds: The Status of Ground-Based Observational Methods, B. Am. Meteorol. Soc., 89, 1549–1562, https://doi.org/10.1175/2008BAMS2378.1, 2008. a, b
Solomon, A., Feingold, G., and Shupe, M. D.: The role of ice nuclei recycling in the maintenance of cloud ice in Arctic mixed-phase stratocumulus, Atmos. Chem. Phys., 15, 10631–10643, https://doi.org/10.5194/acp-15-10631-2015, 2015. a
Sorooshian, A., Anderson, B., Bauer, S. E., Braun, R. A., Cairns, B., Crosbie, E., Dadashazar, H., Diskin, G., Ferrare, R., Flagan, R. C., Hair, J., Hostetler, C., Jonsson, H. H., Kleb, M. M., Liu, H., MacDonald, A. B., McComiskey, A., Moore, R., Painemal, D., Russell, L. M., Seinfeld, J. H., Shook, M., Smith, W. L., Thornhill, K., Tselioudis, G., Wang, H., Zeng, X., Zhang, B., Ziemba, L., and Zuidema, P.: Aerosol–Cloud–Meteorology Interaction Airborne Field Investigations: Using Lessons Learned from the U. S. West Coast in the Design of ACTIVATE off the U. S. East Coast, B. Am. Meteorol. Soc., 100, 1511–1528, https://doi.org/10.1175/BAMS-D-18-0100.1, 2019. a, b, c
Stevens, B., Cotton, W. R., Feingold, G., and Moeng, C.-H.: Large-Eddy Simulations of Strongly Precipitating, Shallow, Stratocumulus-Topped Boundary Layers, J. Atmos. Sci., 55, 3616–3638, https://doi.org/10.1175/1520-0469(1998)055<3616:LESOSP>2.0.CO;2, 1998. a, b, c
Stevens, D. E., Ackerman, A. S., and Bretherton, C. S.: Effects of Domain Size and Numerical Resolution on the Simulation of Shallow Cumulus Convection, J. Atmos. Sci., 59, 3285–3301, https://doi.org/10.1175/1520-0469(2002)059<3285:EODSAN>2.0.CO;2, 2002. a
Stevens, R. G., Loewe, K., Dearden, C., Dimitrelos, A., Possner, A., Eirund, G. K., Raatikainen, T., Hill, A. A., Shipway, B. J., Wilkinson, J., Romakkaniemi, S., Tonttila, J., Laaksonen, A., Korhonen, H., Connolly, P., Lohmann, U., Hoose, C., Ekman, A. M. L., Carslaw, K. S., and Field, P. R.: A model intercomparison of CCN-limited tenuous clouds in the high Arctic, Atmos. Chem. Phys., 18, 11041–11071, https://doi.org/10.5194/acp-18-11041-2018, 2018. a, b
Terai, C. R., Bretherton, C. S., Wood, R., and Painter, G.: Aircraft observations of aerosol, cloud, precipitation, and boundary layer properties in pockets of open cells over the southeast Pacific, Atmos. Chem. Phys., 14, 8071–8088, https://doi.org/10.5194/acp-14-8071-2014, 2014. a
Toon, O. B., McKay, C. P., Ackerman, T. P., and Santhanam, K.: Rapid calculation of radiative heating rates and photodissociation rates in inhomogeneous multiple scattering atmospheres, J. Geophys. Res.-Atmos., 94, 16287–16301, https://doi.org/10.1029/JD094iD13p16287, 1989. a
van der Dussen, J. J., de Roode, S. R., and Siebesma, A. P.: How large-scale subsidence affects stratocumulus transitions, Atmos. Chem. Phys., 16, 691–701, https://doi.org/10.5194/acp-16-691-2016, 2016. a
Wang, H. and Feingold, G.: Modeling Mesoscale Cellular Structures and Drizzle in Marine Stratocumulus. Part I: Impact of Drizzle on the Formation and Evolution of Open Cells, J. Atmos. Sci., 66, 3237–3256, https://doi.org/10.1175/2009JAS3022.1, 2009. a
Wang, H., Feingold, G., Wood, R., and Kazil, J.: Modelling microphysical and meteorological controls on precipitation and cloud cellular structures in Southeast Pacific stratocumulus, Atmos. Chem. Phys., 10, 6347–6362, https://doi.org/10.5194/acp-10-6347-2010, 2010. a
Wood, R., Bretherton, C. S., Leon, D., Clarke, A. D., Zuidema, P., Allen, G., and Coe, H.: An aircraft case study of the spatial transition from closed to open mesoscale cellular convection over the Southeast Pacific, Atmos. Chem. Phys., 11, 2341–2370, https://doi.org/10.5194/acp-11-2341-2011, 2011. a
Wood, R., Stemmler, J. D., Rémillard, J., and Jefferson, A.: Low-CCN concentration air masses over the eastern North Atlantic: Seasonality, meteorology, and drivers, J. Geophys. Res.-Atmos., 122, 1203–1223, https://doi.org/10.1002/2016JD025557, 2017. a, b
Wyant, M. C., Bretherton, C. S., Rand, H. A., and Stevens, D. E.: Numerical Simulations and a Conceptual Model of the Stratocumulus to Trade Cumulus Transition, J. Atmos. Sci., 54, 168–192, https://doi.org/10.1175/1520-0469(1997)054<0168:NSAACM>2.0.CO;2, 1997. a
Yamaguchi, T., Feingold, G., and Kazil, J.: Stratocumulus to Cumulus Transition by Drizzle, J. Adv. Model. Earth Sy., 9, 2333–2349, https://doi.org/10.1002/2017MS001104, 2017. a, b, c, d
Yang, Q. and Geerts, B.: Horizontal Convective Rolls in Cold Air over Water: Buoyancy Characteristics of Coherent Plumes Detected by an Airborne Radar, Mon. Weather Rev., 134, 2373–2396, https://doi.org/10.1175/MWR3203.1, 2006. a
Young, G., Jones, H. M., Choularton, T. W., Crosier, J., Bower, K. N., Gallagher, M. W., Davies, R. S., Renfrew, I. A., Elvidge, A. D., Darbyshire, E., Marenco, F., Brown, P. R. A., Ricketts, H. M. A., Connolly, P. J., Lloyd, G., Williams, P. I., Allan, J. D., Taylor, J. W., Liu, D., and Flynn, M. J.: Observed microphysical changes in Arctic mixed-phase clouds when transitioning from sea ice to open ocean, Atmos. Chem. Phys., 16, 13945–13967, https://doi.org/10.5194/acp-16-13945-2016, 2016. a, b, c, d
Young, G., Connolly, P. J., Dearden, C., and Choularton, T. W.: Relating large-scale subsidence to convection development in Arctic mixed-phase marine stratocumulus, Atmos. Chem. Phys., 18, 1475–1494, https://doi.org/10.5194/acp-18-1475-2018, 2018. a
Zelinka, M. D., Myers, T. A., McCoy, D. T., Po-Chedley, S., Caldwell, P. M., Ceppi, P., Klein, S. A., and Taylor, K. E.: Causes of Higher Climate Sensitivity in CMIP6 Models, Geophys. Res. Lett., 47, e2019GL085782, https://doi.org/10.1029/2019GL085782, 2020. a
Zhou, X., Ackerman, A. S., Fridlind, A. M., and Kollias, P.: Simulation of Mesoscale Cellular Convection in Marine Stratocumulus. Part I: Drizzling Conditions, J. Atmos. Sci., 75, 257–274, https://doi.org/10.1175/JAS-D-17-0070.1, 2018. a