the Creative Commons Attribution 4.0 License.
the Creative Commons Attribution 4.0 License.
 | 06 Aug 2021
Aitken mode particles as CCN in aerosol- and updraft-sensitive regimes of cloud droplet formation
Mira L. Pöhlker
Minghui Zhang
Ramon Campos Braga
Ovid O. Krüger
Ulrich Pöschl
The high variability of aerosol particle concentrations, sizes and chemical composition makes their description challenging in atmospheric models. Aerosol–cloud interaction studies are usually focused on the activation of accumulation mode particles as cloud condensation nuclei (CCN). However, under specific conditions Aitken mode particles can also contribute to the number concentration of cloud droplets (Nd), leading to large uncertainties in predicted cloud properties on a global scale. We perform sensitivity studies with an adiabatic cloud parcel model to constrain conditions under which Aitken mode particles contribute to Nd. The simulations cover wide ranges of aerosol properties, such as total particle number concentration, hygroscopicity (κ) and mode diameters for accumulation and Aitken mode particles. Building upon the previously suggested concept of updraft (w)- and aerosol-limited regimes of cloud droplet formation, we show that activation of Aitken mode particles does not occur in w-limited regimes of accumulation mode particles. The transitional range between the regimes is broadened when Aitken mode particles contribute to Nd, as aerosol limitation requires much higher w than for aerosol size distributions with accumulation mode particles only. In the transitional regime, Nd is similarly dependent on w and κ. Therefore, we analyze the sensitivity of Nd to κ, ξ(κ), as a function of w to identify the value combinations above which Aitken mode particles can affect Nd. As ξ(κ) shows a minimum when the smallest activated particle size is in the range of the “Hoppel minimum” (0.06 µm ≤ Dmin ≤0.08 µm), the corresponding (w–κ) pairs can be considered a threshold level above which Aitken mode particles have significant impact on Nd. This threshold is largely determined by the number concentration of accumulation mode particles and by the Aitken mode diameter. Our analysis of these thresholds results in a simple parametric framework and criterion to identify aerosol and updraft conditions under which Aitken mode particles are expected to affect aerosol–cloud interactions. Our results confirm that Aitken mode particles likely do not contribute to Nd in polluted air masses (urban, biomass burning) at moderate updraft velocities (w≤3 m s−1) but may be important in deep convective clouds. Under clean conditions, such as in the Amazon, the Arctic and remote ocean regions, hygroscopic Aitken mode particles can act as CCN at updrafts of w<1 m s−1.
- Article
(8444 KB) - Full-text XML
-
Supplement
(19726 KB) - BibTeX
- EndNote


The representation of aerosol–cloud interactions in atmospheric models is challenging due to the high variability of aerosol particle loading, properties and processes on small temporal and spatial scales. Aerosol–cloud interactions include both the effects of aerosol particles on clouds by acting as cloud condensation nuclei (CCN) and the modification of aerosol due to chemical and physical cloud processing.
The interaction of aerosol particles with water vapor is described by the Köhler theory (Köhler, 1936). It combines the curvature (Kelvin) effect that describes the enhancement of the water vapor pressure above a curved particle surface and the solute (Raoult) effect that accounts for water uptake by hygroscopic particle mass, which is often parameterized by the hygroscopicity parameter κ (Petters and Kreidenweis, 2007). The maximum of the Köhler curve represents the critical supersaturation (Scrit) above which a particle of a given composition and dry size (critical diameter, Dcrit) is activated and efficiently grows to a cloud droplet.
Clouds are dynamic systems where the supersaturation is continuously altered due to increasing water vapor concentration in cooling air parcels and other processes and water vapor condensation onto particles. As the supply of water vapor and the growth timescales in clouds are limited, particles and droplets may not reach their equilibrium sizes. Thus, conclusions based on equilibrium conditions as implied by Köhler theory often represent overestimates of the effect of aerosol properties on clouds, e.g., Ervens et al. (2005).
The relative importance of aerosol parameters (e.g., chemical composition (κ), dry particle diameter (Ds), shape of aerosol size distribution (ASD), particle number concentration (Na)) and updraft velocity (w) on cloud properties was explored in previous sensitivity studies. Feingold (2003) showed that Na has the largest influence on the effective radius of a cloud droplet size population, followed by the geometric mean mode diameters and standard deviations of ASDs (Dg and σg). A similar ranking was discussed by Hernández Pardo et al. (2019), who showed that conclusions regarding the relative importance of the aerosol properties and w hold true for both the effective droplet radius and number concentration (Nd) with lower sensitivity of the effective radius than that of Nd. Other sensitivity studies also identified w and Na, followed by κ and other chemical composition effects, as the most important parameters determining Nd (Ervens et al., 2005; McFiggans et al., 2006; Anttila and Kerminen, 2007; Reutter et al., 2009; Ward et al., 2010) or the supersaturation in clouds (Hammer et al., 2015). A similar relative importance of Na and w in the shape of the cloud droplet size distribution (CDSD) was shown (Cecchini et al., 2017).
CCN can be modified in clouds by mass addition due to chemical reactions in cloud droplets and by collision–coalescence processes (e.g., Ervens, 2015). These processes are suggested to lead to a size separation of cloud-processed and interstitial particles, resulting in a gap between the Aitken and accumulation modes (“Hoppel minimum”) (Hoppel et al., 1986; Cantrell et al., 1999; Feingold and Kreidenweis, 2000). It is traditionally assumed that only accumulation mode particles ( µm) undergo cloud processing, leading possibly to a broadening of this mode.
Model and observational studies challenge this assumption, as ambient conditions were identified under which supersaturation in clouds is sufficiently high to form cloud droplets on Aitken mode particles. For example, at a continental remote background site in France, Aitken mode particles with µm were shown to contribute the major fraction to Nd due to the absence of a significant accumulation mode (Gérémy et al., 2000). About 30 % of all Aitken mode particles were observed to form cloud droplets at a background site in Finland at very low Na (∼150 cm−3) (Komppula et al., 2005). Similarly low aerosol loading was encountered above the tropical ocean, where ≤40 % of Aitken mode particles were predicted to act as CCN (Roelofs et al., 2006). Also in Arctic clouds, high contributions of Aitken mode particles to Nd were predicted (Korhonen et al., 2008; Jung et al., 2018; Bulatovic et al., 2021). In marine stratocumuli off the Californian coast, CCN and droplet closure could only be achieved when contributions of Aitken mode particles to Nd were taken into account in clouds with w≥0.6 m s−1 (Schulze et al., 2020). In deep convective clouds above the Amazon (w≤12 m s−1), it was predicted that the formation of cloud droplets on Aitken mode particles (D≥0.02 µm) might even impact the thermodynamic cloud structure by amplifying the convective invigoration and affecting precipitation rates (Fan et al., 2018).
Based on an intercomparison of 16 global models, it was concluded that Aitken mode particles do not significantly contribute to CCN in clouds with maximum supersaturations Smax = 0.2 % (Fanourgakis et al., 2019). Based on another global model study, Lee et al. (2013) compared the influence of 28 parameters characterizing aerosol emissions, processes and size distributions on the CCN number concentration at S = 0.3 %. They identified the width of the Aitken mode as the second most important parameter after the dry deposition of accumulation mode particles. Chang et al. (2017) found that on a global scale, the fraction of Aitken mode particles to total CCN is negligible at S = 0.2 %, while it can be significant at S = 0.4 % above the continental Northern Hemisphere. In their later global model study, cloud supersaturation in each grid cell was calculated based on the mean vertical velocity, and Nd was derived as the number of particles whose Scrit was approximated and compared for three cloud activation schemes (Chang et al., 2021). While the schemes mostly agreed in the Nd prediction from accumulation mode particles, large discrepancies were found in the predictions of the contribution of Aitken mode particles to Nd.
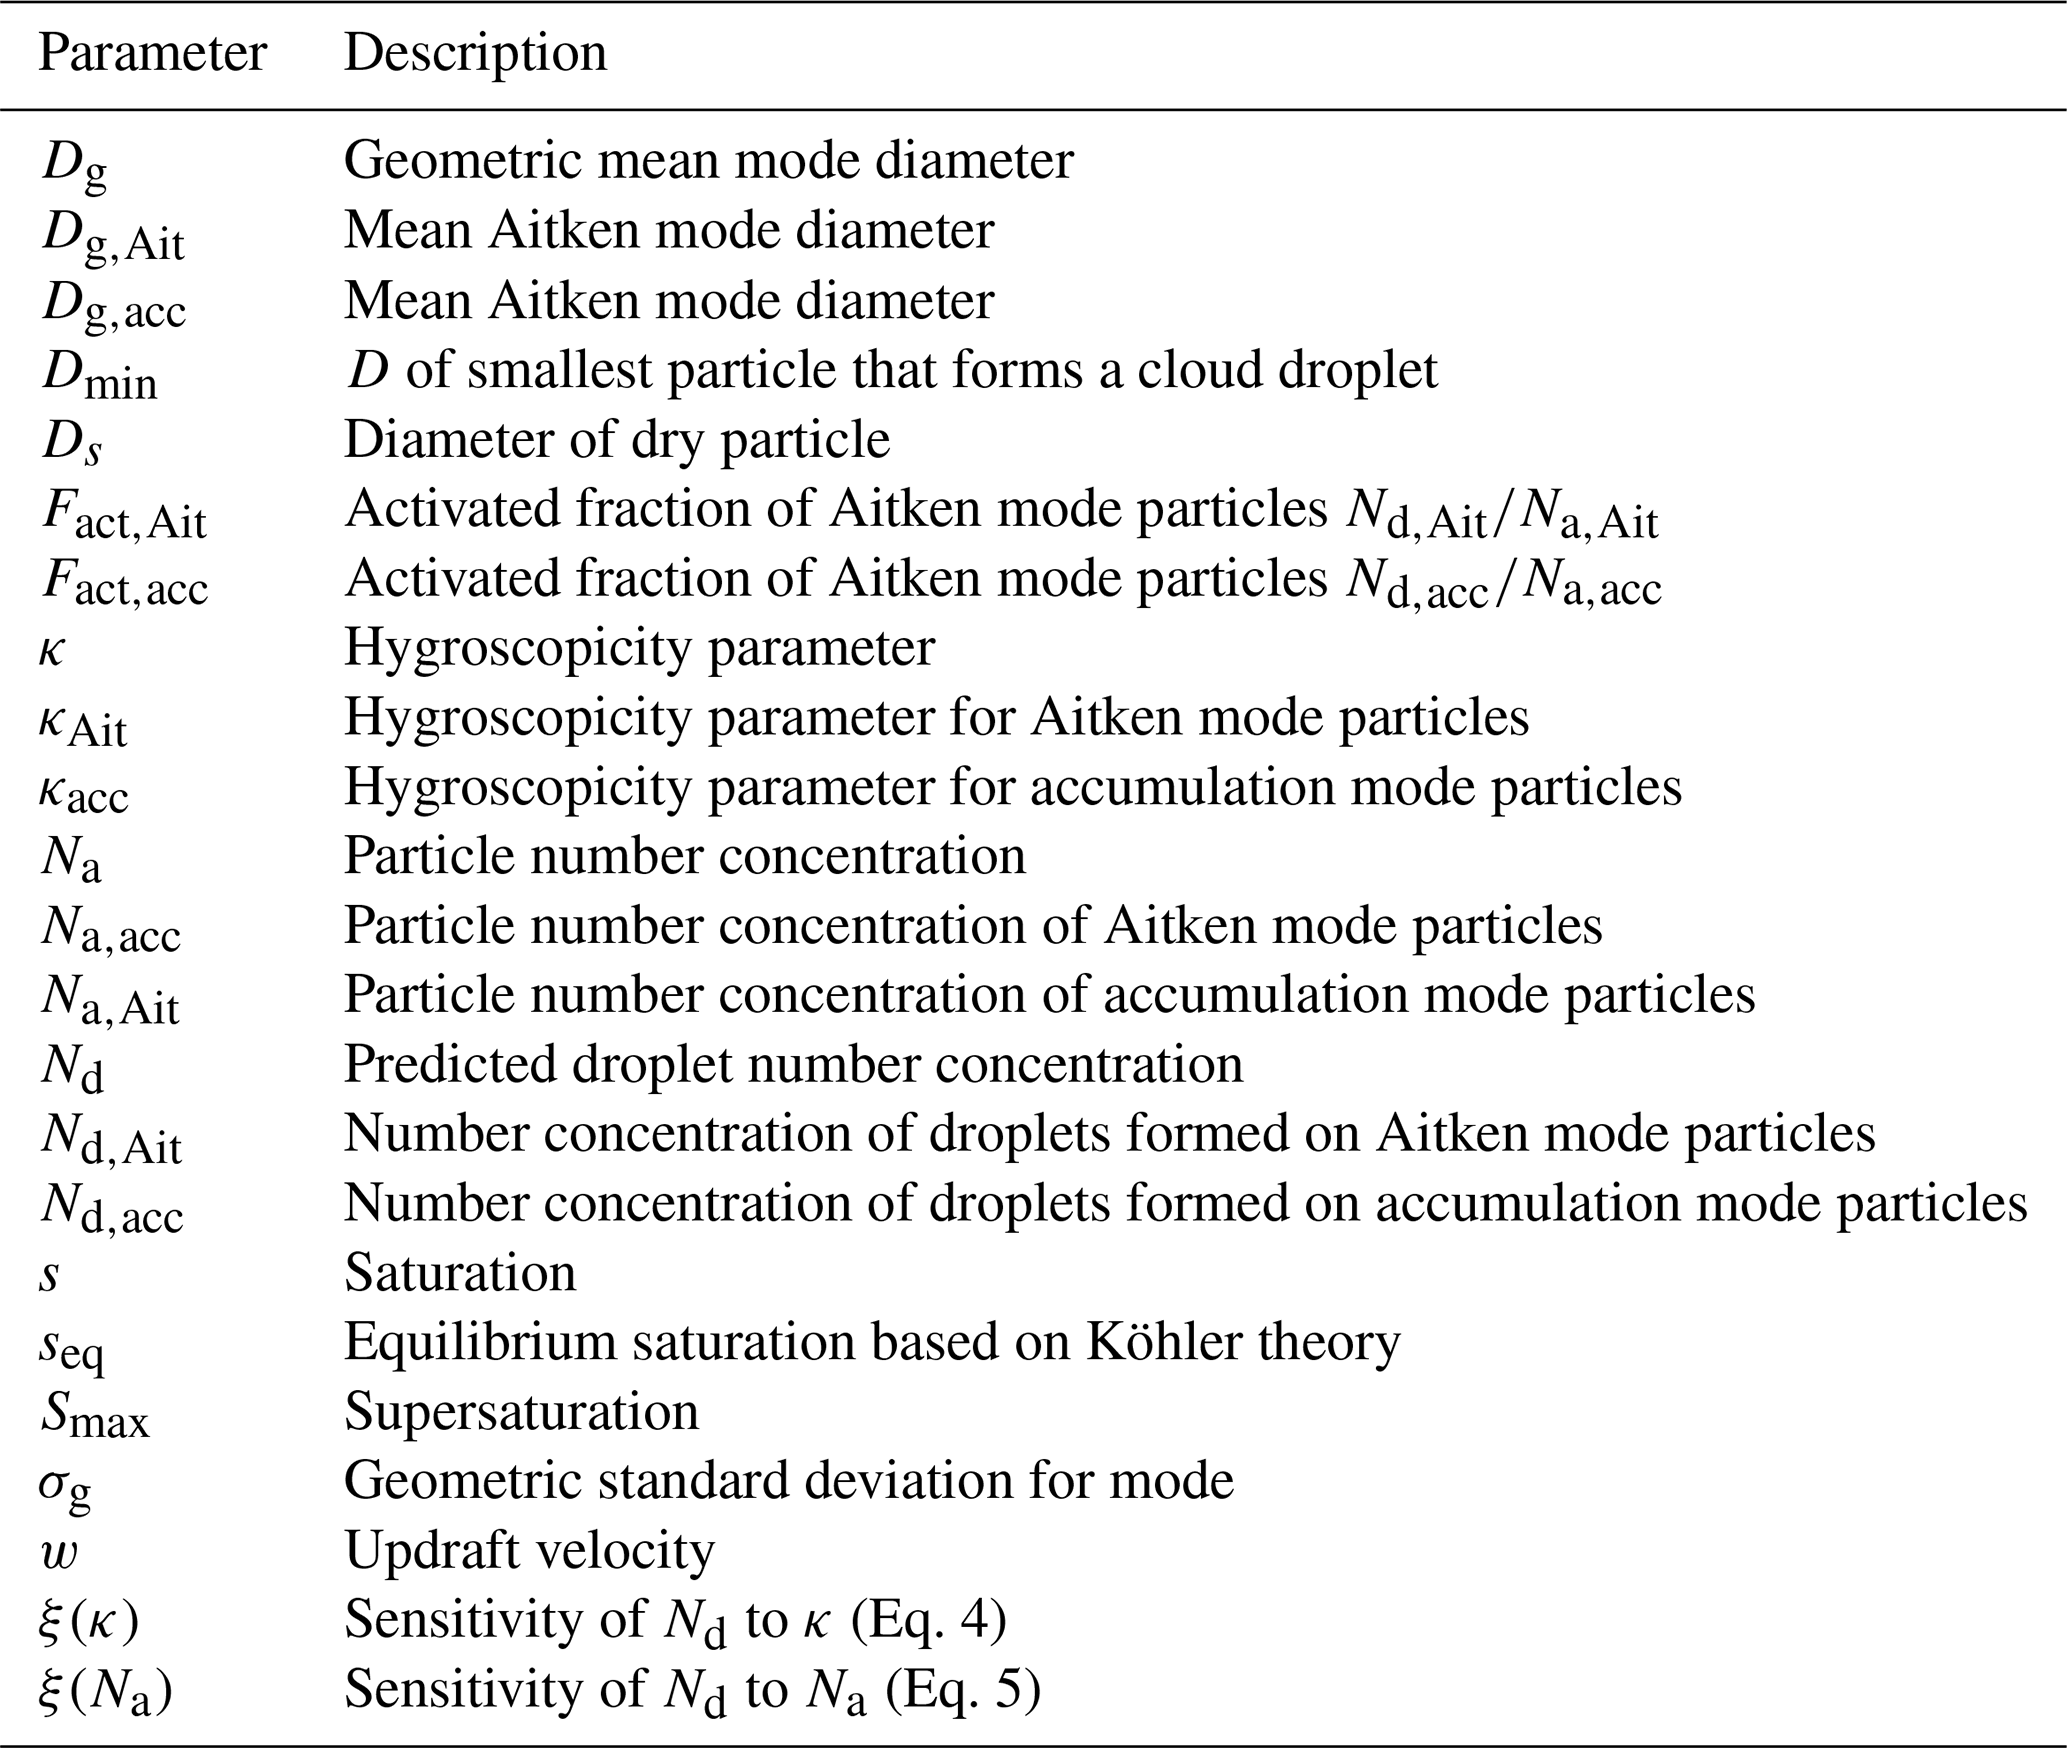
These prior studies provide strong evidence that Aitken mode particles can cause large uncertainties in predicted aerosol–cloud interactions under conditions of low Na, small fractions of accumulation mode particles to total Na and/or high w. In the current study, we perform simulations with an adiabatic parcel model to systematically explore the parameter ranges of aerosol properties (Na, , κ, Dg,Ait, Dg,acc) and of w to identify aerosol and cloud conditions under which Aitken mode particles contribute to Nd. (All parameters are defined Table A1 in the Appendix.) Our analysis results in a framework that can be used to assess under which aerosol and cloud conditions detailed information on Aitken mode particles is needed to describe their potential role in aerosol–cloud interactions.
2.1 Model description
We use an adiabatic parcel model to examine droplet formation on a population of aerosol particles (Feingold and Heymsfield, 1992; Ervens et al., 2005). The evolution of particle and droplet sizes is described on a moving size grid. The calculation of the equilibrium saturation (seq) is based on Köhler theory, including the hygroscopicity parameter κ (Petters and Kreidenweis, 2007; Rose et al., 2008).
where Dwet is the wet particle diameter, σsol the surface tension of the wet particle (72 mN m−1), ρs the density of the dry particle, ρw the density of pure water, Mw the molecular weight of water, R the constant for ideal gases and T the absolute temperature.
We note that we do not consider additional composition effects (such as surface tension suppression) as κ represents the effective hygroscopicity as derived from experimental data. The model includes the standard thermodynamic equations for particle and droplet growth and the derivatives to time of temperature, saturation and pressure (Pruppacher and Klett, 2003). These differential equations are iteratively solved within each model time step. The times steps are function of w and chosen such that they cover a vertical change of the air parcel of 0.1 m. The change in the saturation is calculated as
where Ψ1 and Ψ2 are functions of temperature and saturation (s). The updraft term describes the increase of s due to cooling of a rising air parcel in an adiabatic environment; the condensation term accounts for the condensation of water vapor on aerosol particles and droplets. Particle and droplet growth are driven by the gradient between s and the particle-specific seq:
2.2 Model simulations
2.2.1 Initialization
The model is initialized below cloud at RH = 98 %, T=290 K and p=829 mbar. The initial ASDs consist of 545 particle size classes in a diameter range of 0.0028 µm 1.4 µm, in lognormal distributions with geometric mean mode diameters Dg,Ait = 0.037 µm and Dg,acc = 0.145 µm with standard deviations of σg = 0.5 (corresponding to 1.4 in commonly used Heisenberg fits). Note that different versions of lognormal fit functions are used in the literature (Pöhlker et al., 2021); a standard lognormal fit function was applied here (Pöhlker et al., 2018).
In sensitivity tests, Dg,Ait and Dg,acc are shifted to 0.05, 0.06 and 0.07 µm and to 0.13 and 0.17 µm, respectively (Sect. 3.3.2). We define 15 model ASDs that differ (i) in the relative contributions of Aitken and accumulation mode particles (Na,Ait, Na,acc) to total Na (columns I–V in Fig. 1) and (ii) in the total number concentration Na (rows a–c in Fig. 1). ASDs I and V are monomodal with an accumulation or Aitken mode only; ASDs II, III and IV are bimodal with Na,Ait corresponding to 50 % (ASD II), 100 % (ASD III) and 150 % (ASD IV) of Na,acc. We distinguish the two modes by the diameter of the Hoppel minimum (∼0.07 µm). While strictly both modes have “tails” beyond the Hoppel minimum (Aitken mode particles being larger and accumulation mode particles being smaller than the Hoppel minimum), we do not consider this in our model. This simplification seems justified since the mode classification in measured ASDs is usually ascribed based on particle size and not on composition, which may differ because of different sources of particles in the two modes. The particle hygroscopicity is assumed to be equal in both modes; 27 values are used in the simulations to cover a range of . Additional tests are performed for fixed κ values in the accumulation mode (κacc = 0.1 and 0.5; Sect. 3.3.1). A total of 30 values for the updraft velocities are applied (0.1 m s−1 ≤ w ≤ 3 m s−1), resulting in 810 simulations (27κ×30w) for each of the 15 ASDs.
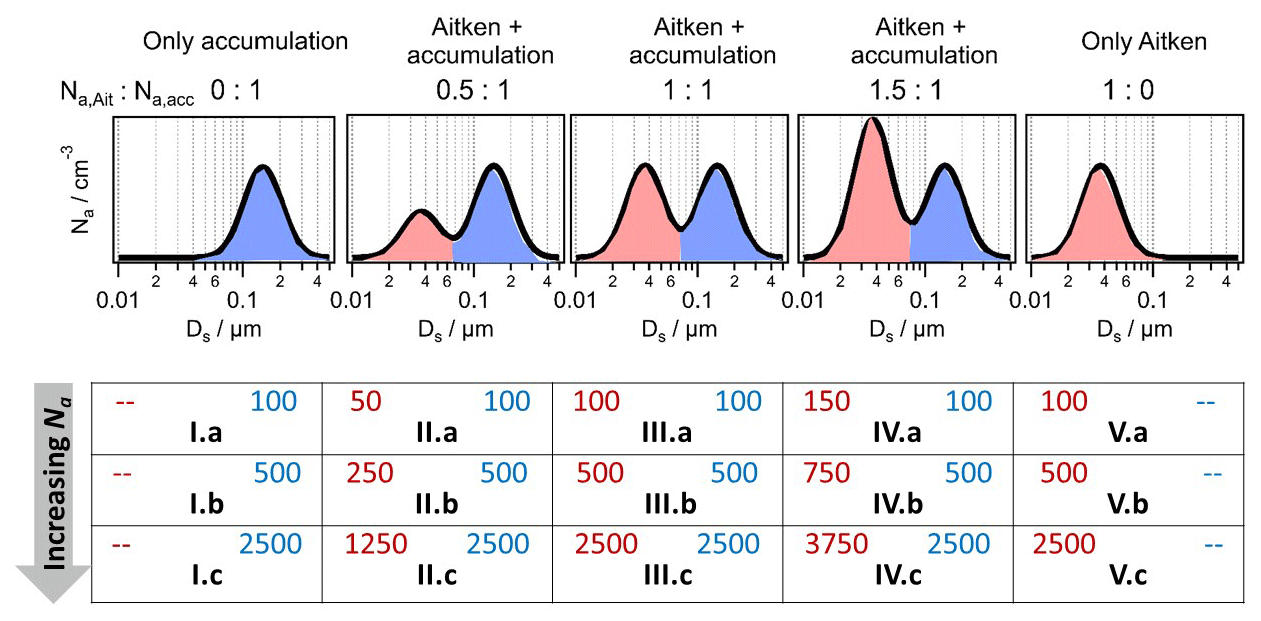
Figure 1Schematic of model input aerosol size distributions (ASDs, designated I–V, a–c) with different number concentrations of Aitken mode particles (Na,Ait, red) and accumulation mode particles (Na,acc, blue). Particle number concentrations are given in units of cubic centimeters (cm−3). The modal geometric mean diameters are µm and m.
2.2.2 Analysis of sensitivities ξ(κ) and ξ(Na)
Droplets are defined as particles with Dwet≥3 µm. This definition does not strictly follow Köhler theory that defines droplets as particles whose Scrit is exceeded. The reasoning for our definition is the comparability of model results to observational studies that commonly report data from cloud probes detecting particles above a fixed size threshold, e.g., Campos Braga et al. (2021). As our study is intended to give guidance to future field and model studies, we use the size-based (3 µm) rather than the Köhler-based (Dcrit) droplet definition. We define the smallest dry particle size on which droplets grow to ≥3 µm as Dmin. The droplet number concentration Nd is calculated as the cumulative particle number concentration between Dmin and the largest Ds (1.4 µm). We describe the predicted change in Nd as a function of particle hygroscopicity (κ) as the sensitivity ξ(κ):
For comparison to conclusions on parameter regimes as discussed in previous model sensitivity studies, we also investigate the sensitivity of Nd to Na:
These definitions follow the same approach as in previous model studies that investigated the sensitivity of Nd to κ and Na for monomodal accumulation mode ASDs (e.g., McFiggans et al., 2006; Reutter et al., 2009; Ward et al., 2010; Hernández Pardo et al., 2019).
Since Nd is predicted to increase above cloud base, we perform most of our sensitivity analyses at 20 m above the height level of maximum supersaturation (Smax). In a recent Nd closure study, we found not only the best agreement of measured and predicted Nd at this height, but also of the liquid water content, independently of the pollution level of the air mass (Campos Braga et al., 2021).
3.1 Vertical profiles of Nd, Dmin and ξ(κ)
Figure 2 shows the vertical profiles of Nd, Dmin and ξ(κ) as a function of κ (color-coding) for simulations with ASD I.b and ASD III.b at an updraft velocity of w = 2.9 m s−1; complementary results for w = 1.0 and 0.2 m s−1 are shown in Figs. S1 and S2. The black lines denote the height at which the supersaturation reaches its maximum value (Fig. S3). At high w and κ, Nd shows significantly smaller Nd for the monomodal ASD I.b than for the bimodal ASD III.b (Fig. 2a and b). The Dmin values are nearly identical for the two ASDs for a given w (comparison of left and right columns in Figs. 2, S1 and S2), and they are inversely correlated with Nd. Under these conditions, Dmin reaches minimum values of ∼0.05 µm, which means that all accumulation mode particles form cloud droplets ( = 500 cm−3) and Nd cannot further increase for ASD I.b. In the presence of an Aitken mode, a significant fraction of highly hygroscopic Aitken mode particles grow to cloud droplets (Nd∼620 cm−3, Fig. 2b) as Dmin is significantly smaller than the size range of the Hoppel minimum (Ds∼0.07 µm).
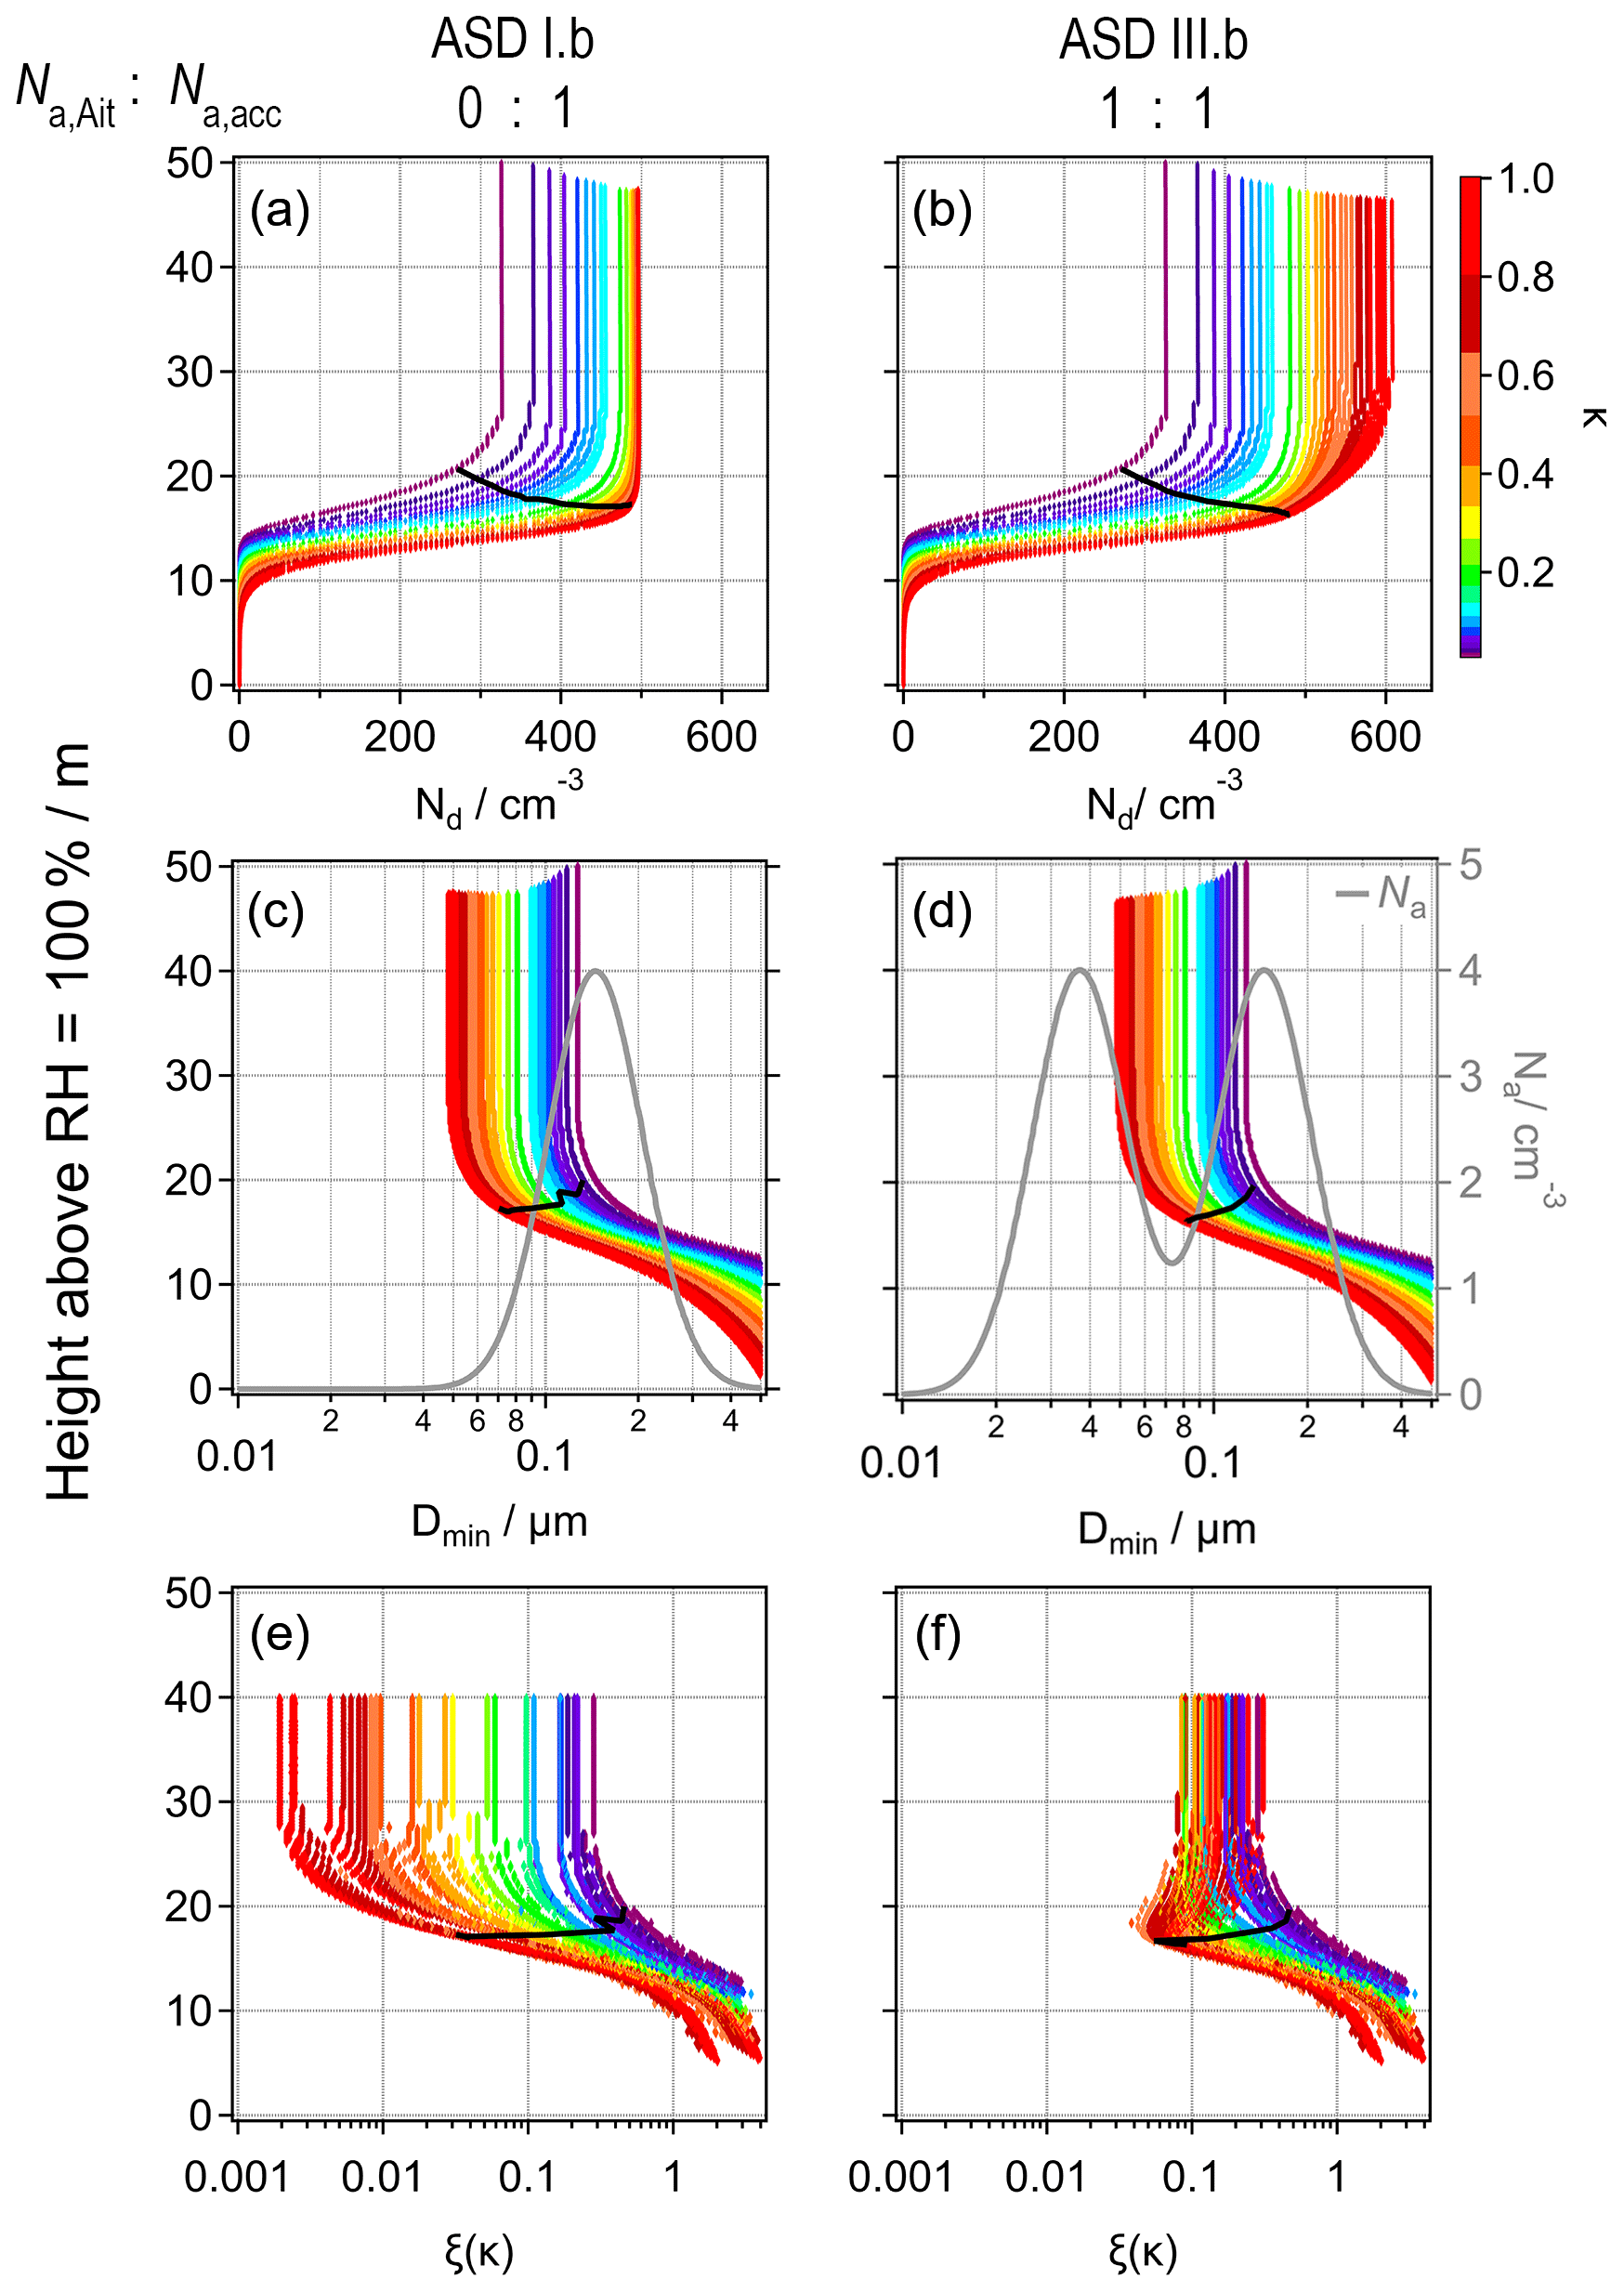
Figure 2Vertical profiles of (a, b) cloud droplet number concentration (Nd), (c, d) dry size of smallest particles that contribute to Nd (Dmin), overlaid by the corresponding ASD (grey lines) and (e, f) sensitivity of Nd to κ (ξ(κ)) for an updraft velocity w = 2.9 m s−1. Left and right columns show results for ASD I.b and III.b, respectively. The black lines in all panels mark the height of Smax above the level of saturation (RH = 100 %).
The ξ(κ) evolution for ASD I.b (Fig. 2e) repeats the trends of Dmin and mirrors those of Nd; i.e., ξ(κ) is lowest for the highest κ and w. For ASD I.b, ξ(κ) reaches the lowest values for the highest w when nearly all particles are grown to cloud droplets (Nd∼500 cm−3), and a decrease in Dmin does not further increase Nd. The difference in ξ(κ) for ASD I.b and III.b is significant (Fig. 2e, f) as ξ(κ) for the bimodal ASD III.b is predicted to increase for above the level of Smax. This inversion of ξ(κ) occurs at the height at which Aitken mode particles start contributing to Nd (Fig. 2).While for the monomodal ASD I.b ξ(κ) is predicted to continuously decrease with height, the increasing contribution of Aitken mode particles to Nd leads to the opposite trend, i.e., to the highest ξ(κ) values for particles with the highest κ.
Generally, the differences in the vertical profiles for ASD I.b and III.b are smaller with lower w (Figs. S1 and S2). At w = 1 m s−1, Nd is only slightly lower for ASD I.b than for ASD III.b. The two modes overlap at the Hoppel minimum (Fig. 1), and the small concentration of Aitken mode particles at this size explains the somewhat higher Nd in Fig. S1a as compared to Fig. S1b. At w = 0.2 m s−1, only large accumulation mode particles are activated (activated fraction, and Dmin≥0.12 µm), and ξ(κ) remains generally higher than for larger w. A high sensitivity implies that Dmin is in a size range in which the ASD exhibits a steep slope, where a small change in Dmin translates into a relatively large change in Nd.
Similar trends of ξ(κ) with w were discussed in previous studies in which it was generalized that ξ(κ) is highest at low w as only a small but significant fraction of the accumulation mode particles is activated (e.g., Moore et al., 2013; Ervens et al., 2005). Reutter et al. (2009) showed low sensitivities of Nd at low w for very high Na(∼10 000 cm−3). In this case, the supersaturation is efficiently suppressed as the condensation term (Eq. 2) is dominated by Na. As only very large particles grow to droplet sizes, Nd would only include particles with µm , i.e., only in a flat part of the ASD, where a small change in Dmin does not lead to a significant change in Nd. The increased ξ(κ) at high w for the bimodal ASD III.b (Fig. 2f) follows the same reasoning as Dmin is located at a size range where the Aitken mode exhibits approximately the same slope as at Dmin for w = 0.2 m s−1. For less hygroscopic particles, Dmin is near the Hoppel minimum and thus ξ(κ) is smaller than for high κ (Fig. 3).
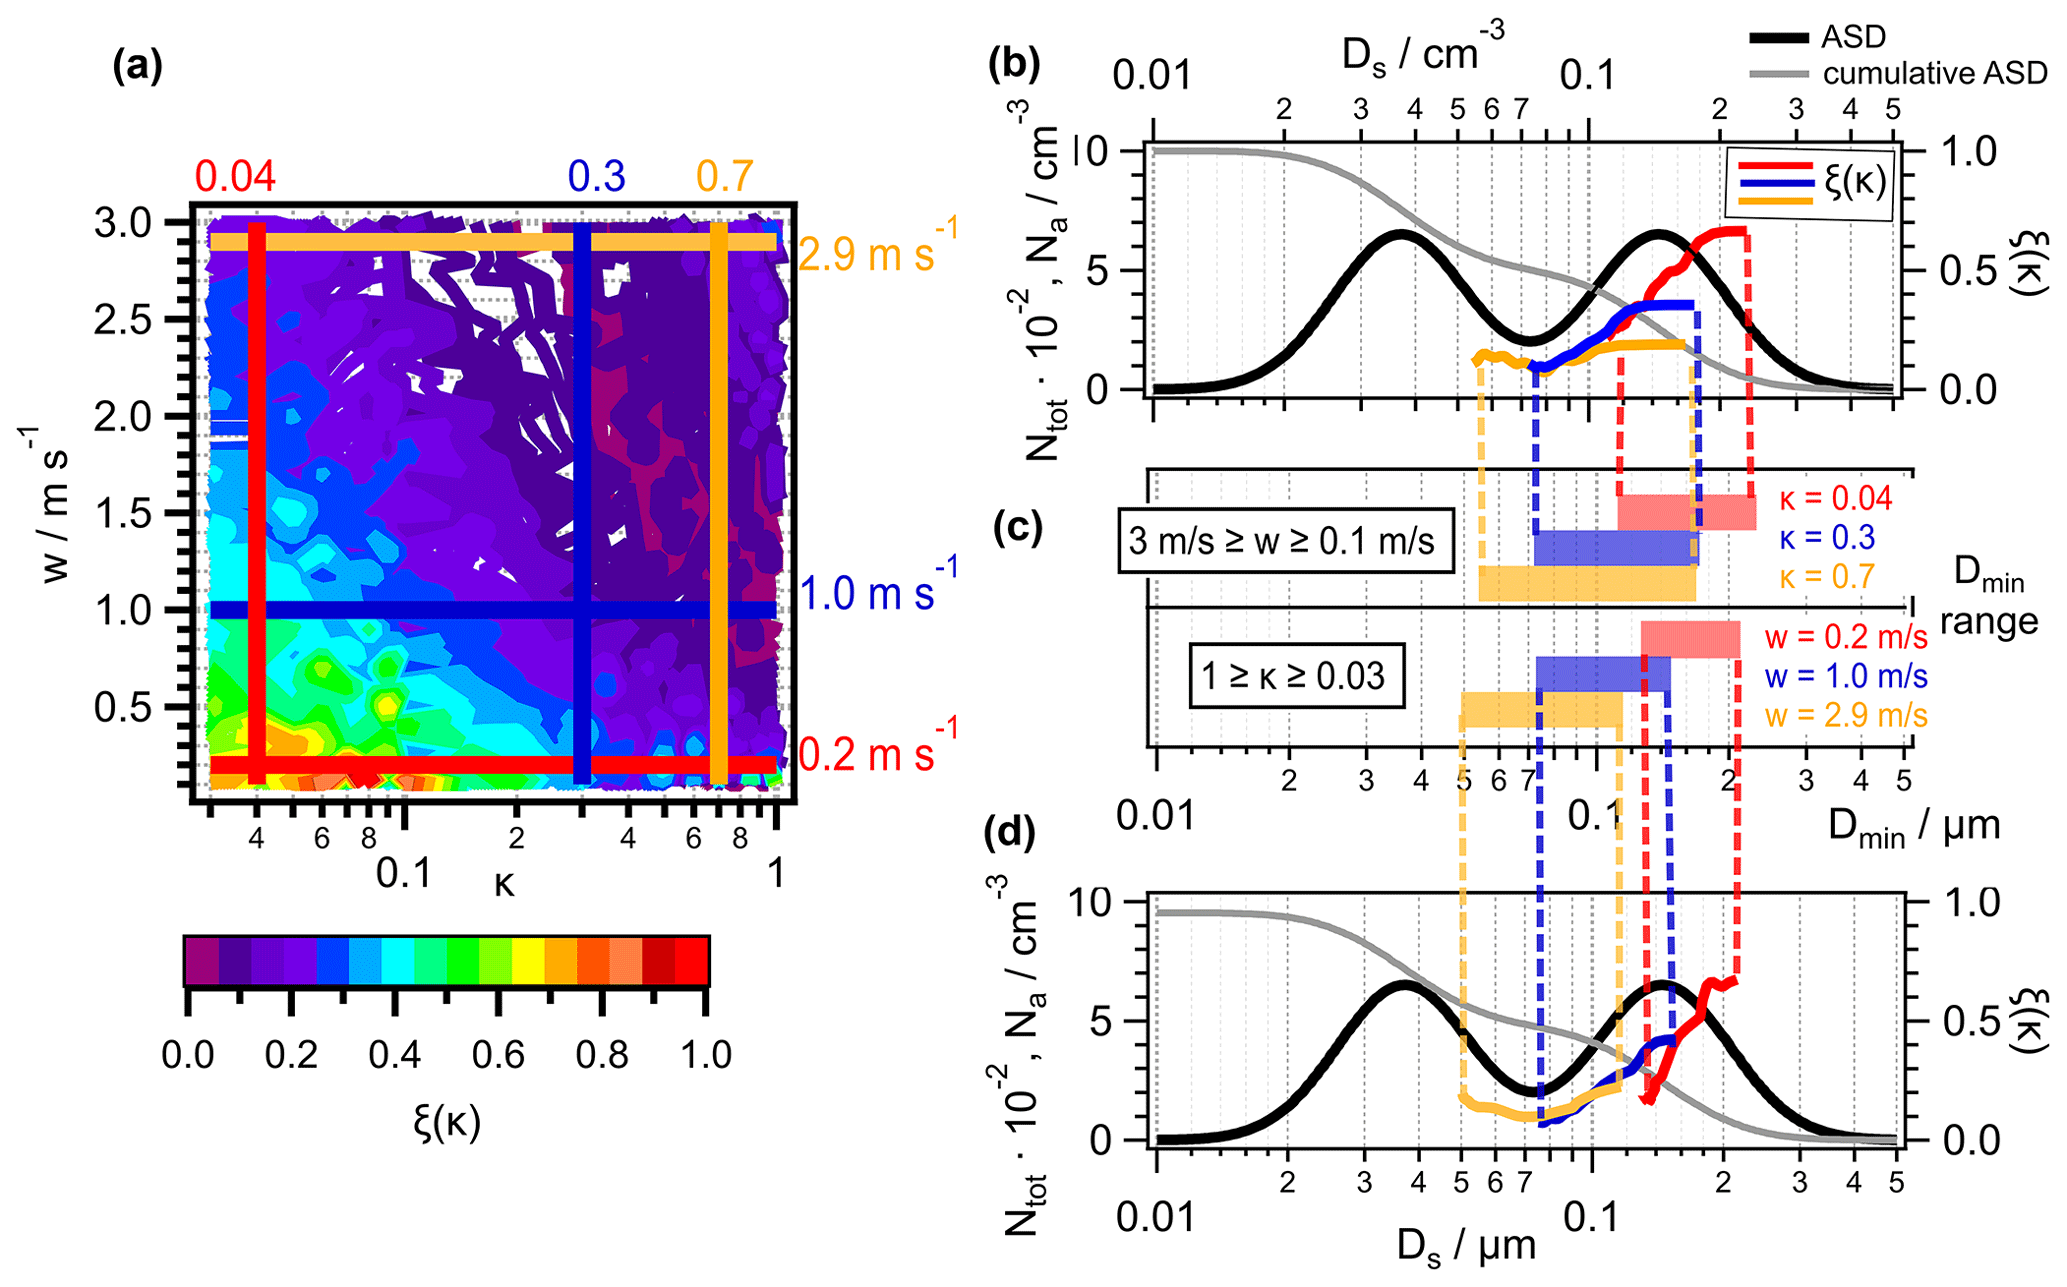
Figure 3(a) Sensitivity of cloud droplet number concentration to aerosol hygroscopicity (ξ(κ)) as a function of κ and w for ASD III.b at 20 m above Smax. (b) ξ(κ) (right axis) as a function of Dmin for κ = 0.04 (red), κ = 0.3 (blue) and κ = 0.7 (orange). (c) Ranges of Dmin for the simulations in panel (b) and (d). (b) ξ(κ) (right axis) as a function of Dmin for w = 0.2 m s−1 (red), w = 1.0 m s−1 (blue) and w = 2.9 m s−1 (orange).
In all simulations, Nd is predicted to increase while Dmin decreases until the air parcel reaches up to several tens of meters above the height level of Smax (Figs. 2, S1, and S2), as particles continue to grow and eventually reach the size threshold of 3 µm. The size distributions of haze particles and droplets are shown in Fig. S4 at four heights for the three w and κ = 0.04, 0.3 and 0.7; the red vertical lines indicate the size threshold (3 µm) for droplets. It can be seen that the separation of haze particles and droplets occurs at different heights, depending on κ and w. Hygroscopic Aitken mode particles successively grow at high w to similar droplet sizes as accumulation mode particles (orange box at the bottom of the figure), coinciding with the height at which ξ(κ) increases. This ξ(κ) trend is opposite to that for ASD I.b and also as found in previous studies of monomodal ASDs (Hernández Pardo et al., 2019; Cecchini et al., 2017) that showed decreasing sensitivities to aerosol properties with height.
If cloud droplets were defined based on Dcrit, Nd would be computed at the level of Smax (black lines in Figs. 2, S1, and S2) and remain constant above this height. This would result in different Nd as large haze particles may not be counted if their Scrit were not reached in cloud, and small particles whose Scrit is exceeded might also not be counted using our size-based droplet definition. Since Nd would not change above Smax, ξ(κ) would also be constant above this level. A detailed comparison of predicted cloud properties applying the two droplet definitions (Dcrit versus Dwet≥2 µm) was performed in a previous sensitivity study (Loftus, 2018). There it was shown that predicted Nd based on the two definitions shows largest discrepancies at the lowest w and/or high Na and that the droplet size distributions are generally narrower if droplets are defined based on Dcrit. Also sensitivities would be overestimated if they are computed in the unstable bottom layer of the cloud at the level of Smax. It can be concluded that sensitivity studies in which a droplet definition based on Dcrit is applied will not only lead to higher absolute values of ξ(κ) but, at the same time, also to an underestimate of the sensitivity to κ as the predicted differences of ξ(κ) for different κ values are much smaller (e.g., Reutter et al., 2009). Such studies might thus lead to biased conclusions if they are applied to ambient Nd measurements that are based on fixed size thresholds to discriminate cloud droplets.
3.2 Sensitivity to aerosol properties: ξ(κ) and ξ(Na)
3.2.1 Dependence of ξ(κ) on Dmin (ASD III.b)
In the following, we investigate more generally the parameter ranges at which Aitken mode particles affect sensitivities and Nd in clouds. Our discussion will be limited to cloud conditions at a height of 20 m above Smax, i.e., when Nd has reached a constant value. Figure 3 shows results at 20 m above the levels of Smax. This height corresponds to ∼35 m above the level where RH = 100 % in Fig. 2e and f. Figure 3 depicts the ξ(κ) values resulting from the 810 simulations for ASD III.b as a function of κ and w. The contour lines are color-coded by . Parallel to the axes, six lines are marked for three κ values (vertical lines at κ = 0.7 (orange), 0.3 (blue) and 0.04 (red)), and three updraft velocities (horizontal lines at w = 2.9 m s−1 (orange), 1.0 m s−1 (blue) and 0.2 m s−1 (red)).
Each ξ(κ) can be related to a Dmin (Fig. 3). This relationship is shown in Fig. 3b, where the ξ(κ) values along the vertical lines are overlaid by the aerosol size distribution. Figure 3c shows the Dmin range that is covered by the simulations for the three constant κ values. The end points of the Dmin ranges in Fig. 3b and c are connected by vertical dashed lines. In the same way, Fig. 3d shows Dmin for ξ(κ), i.e., along the horizontal lines in Fig. 3a.
In line with the results in Figs. 2, ξ(κ) and Dmin are highest for small κ and w and decrease with increasing w (Fig. 3a and b). Analogous trends are shown in Fig. 3b for the ξ(κ) values as a function of Dmin along the horizontal lines (constant w) in Fig. 3a. The ξ(κ) lines for the three κ or three w values, respectively, overlap as ξ(κ) depends on the slope of the ASD at Dmin. Different combinations of κ and w can result in identical Dmin values and thus yield the same ξ(κ) values (contour lines of identical color in Fig. 3a). When Dmin is near the Hoppel minimum, a change in Dmin by either of the parameters does not lead to a significant change in Nd leading to low ξ(κ) values. Accordingly, ξ(κ) increases when Dmin reaches sizes smaller than the Hoppel minimum.
Overall, ξ(κ) as a function of Dmin traces the shape of the ASD (black line in Fig. 3a and c). The combinations of w and κ for which an increase in ξ(κ) with a decrease in Dmin is predicted are those in the upper right corner of Fig. 3a.
The Dmin ranges, covered by a variation of w or κ by the same factor (∼30) (colored bars in Fig. 3c), are similar. This suggests that an equal change in either of the parameters affects Dmin to the same extent. However, this relationship cannot be generalized. Figures S5 and S6 show equivalent results to those in Fig. 3 but for Na = 200 cm−3 and Na = 5000 cm−3, respectively. Smaller Na implies a smaller condensation term (Eq. 2), resulting in a higher supersaturation, which allows also smaller particles to grow to cloud droplets. Thus, for Na = 200 cm−3, the Dmin ranges are shifted to smaller values, resulting in higher activated fractions (Fig. S5b and c). Accordingly, the Dmin ranges move to larger values for Na = 5000 cm−3 (Fig. S6b and c).
While for Na = 200 cm−3 and 1000 cm−3 the minima in the ξ(κ) curves coincide with the Hoppel minimum of the ASD, the minimum of ξ(κ) is shifted to somewhat larger sizes for Na = 5000 cm−3 (Fig. S6). At such high Na, the supersaturation is very low (Fig. S7). Under these conditions, an increase in w or κ might result in only small changes in Nd because of buffering effects; i.e., the growth of additional droplets suppresses the supersaturation and prevents further activation.
The comparison of Figs. 3, S5 and S6 reveals that not only the ranges of Dmin values are shifted as a function of Na but also that their widths differ depending on Na. The Dmin ranges are widest for Na = 200 cm−3, which implies that for these conditions Nd is most sensitive to κ and w, as a change in these parameters causes a significant change in Dmin and Nd. Correspondingly, for Na = 5000 cm−3, a change in w or κ only leads to a small change in Dmin. While such a shift in Dmin only leads to small change in the activated fraction, it translates into a relatively large difference in Nd, resulting in high ξ(κ).
This analysis demonstrates that the similarity in the Dmin ranges in Fig. 3b and c resulting from a change in κ or w by the same factor is coincidental and should not be generalized to all conditions as the relative sensitivities to κ and w depend on Na. However, it also shows that conditions exist under which Nd is similarly sensitive to w and κ, and both parameters need to be taken into account to accurately predict Nd.
3.2.2 Sensitivity regimes of ξ(Na) for mono- and bimodal ASDs
Previously, sensitivity of Nd to Na and to w was presented in terms of aerosol (Na)- and updraft (w)-limited regimes (Reutter et al., 2009, 2014; Chang et al., 2015). The Na-limited regime is characterized by high activated fractions, i.e., when an increase in Nd can only be caused by an increase in Na and Nd depends linearly only on Na; the w-limited regime occurs for small activated fractions where an increase in w leads to sufficient decrease in Dmin to increase Nd. Our analysis in Sect. 3.2.1 suggests that for wide parameter ranges, Nd is similarly sensitive to κ and w. To discuss these results in the context of Na- and w-limited regimes, we explore the sensitivity of Nd to Na, ξ(Na), as a function of w for κ = 0.7 for ASD I, III and V with 500 cm−3 ≤ Na ≤ 5000 cm−3. Figure 4a shows Nd for ASD I as a function of Na and w and confirms the thresholds between the regimes as suggested by Reutter et al. (2009), i.e., Na limitation above > m s−1 cm3 and w limitation below m s−1 cm3, with a transitional regime in between. Accordingly, ξ(Na) approaches unity in the Na-limited regime when nearly all particles are activated (upper left corner of Fig. 4d) and even exceeds this value at high Na and low w (bottom right corner).
The ξ(Na) pattern in Fig. 4d exhibits a minimum when the activated fraction is ∼0.7. This fraction corresponds to the size range at which the cumulative ASD exhibits the largest slope. If more particles are activated, the relative change in Nd and therefore in ξ(Na) becomes smaller.
In the presence of an Aitken mode, in addition to an accumulation mode (ASD III; Fig. 4b), Nd is not limited by Na,acc under the same Na and w conditions as for ASD I since only a small fraction of the Aitken mode is activated. Figure 4e shows the same ξ(Na) patterns as the part of Figure 4d for Na ≤ 2500 cm−3 under conditions where only accumulation mode particles are activated and thus contribute to Nd and to ξ(Na). Thus, the transitional regime is extended to a broader parameter space as ξ(Na) does not show a constant value of unity as it should in an Na-limited regime. As at high Na and low w, only accumulation mode particles contribute to Nd, the contours for the w-limited regime do not differ between Fig. 4d and e.
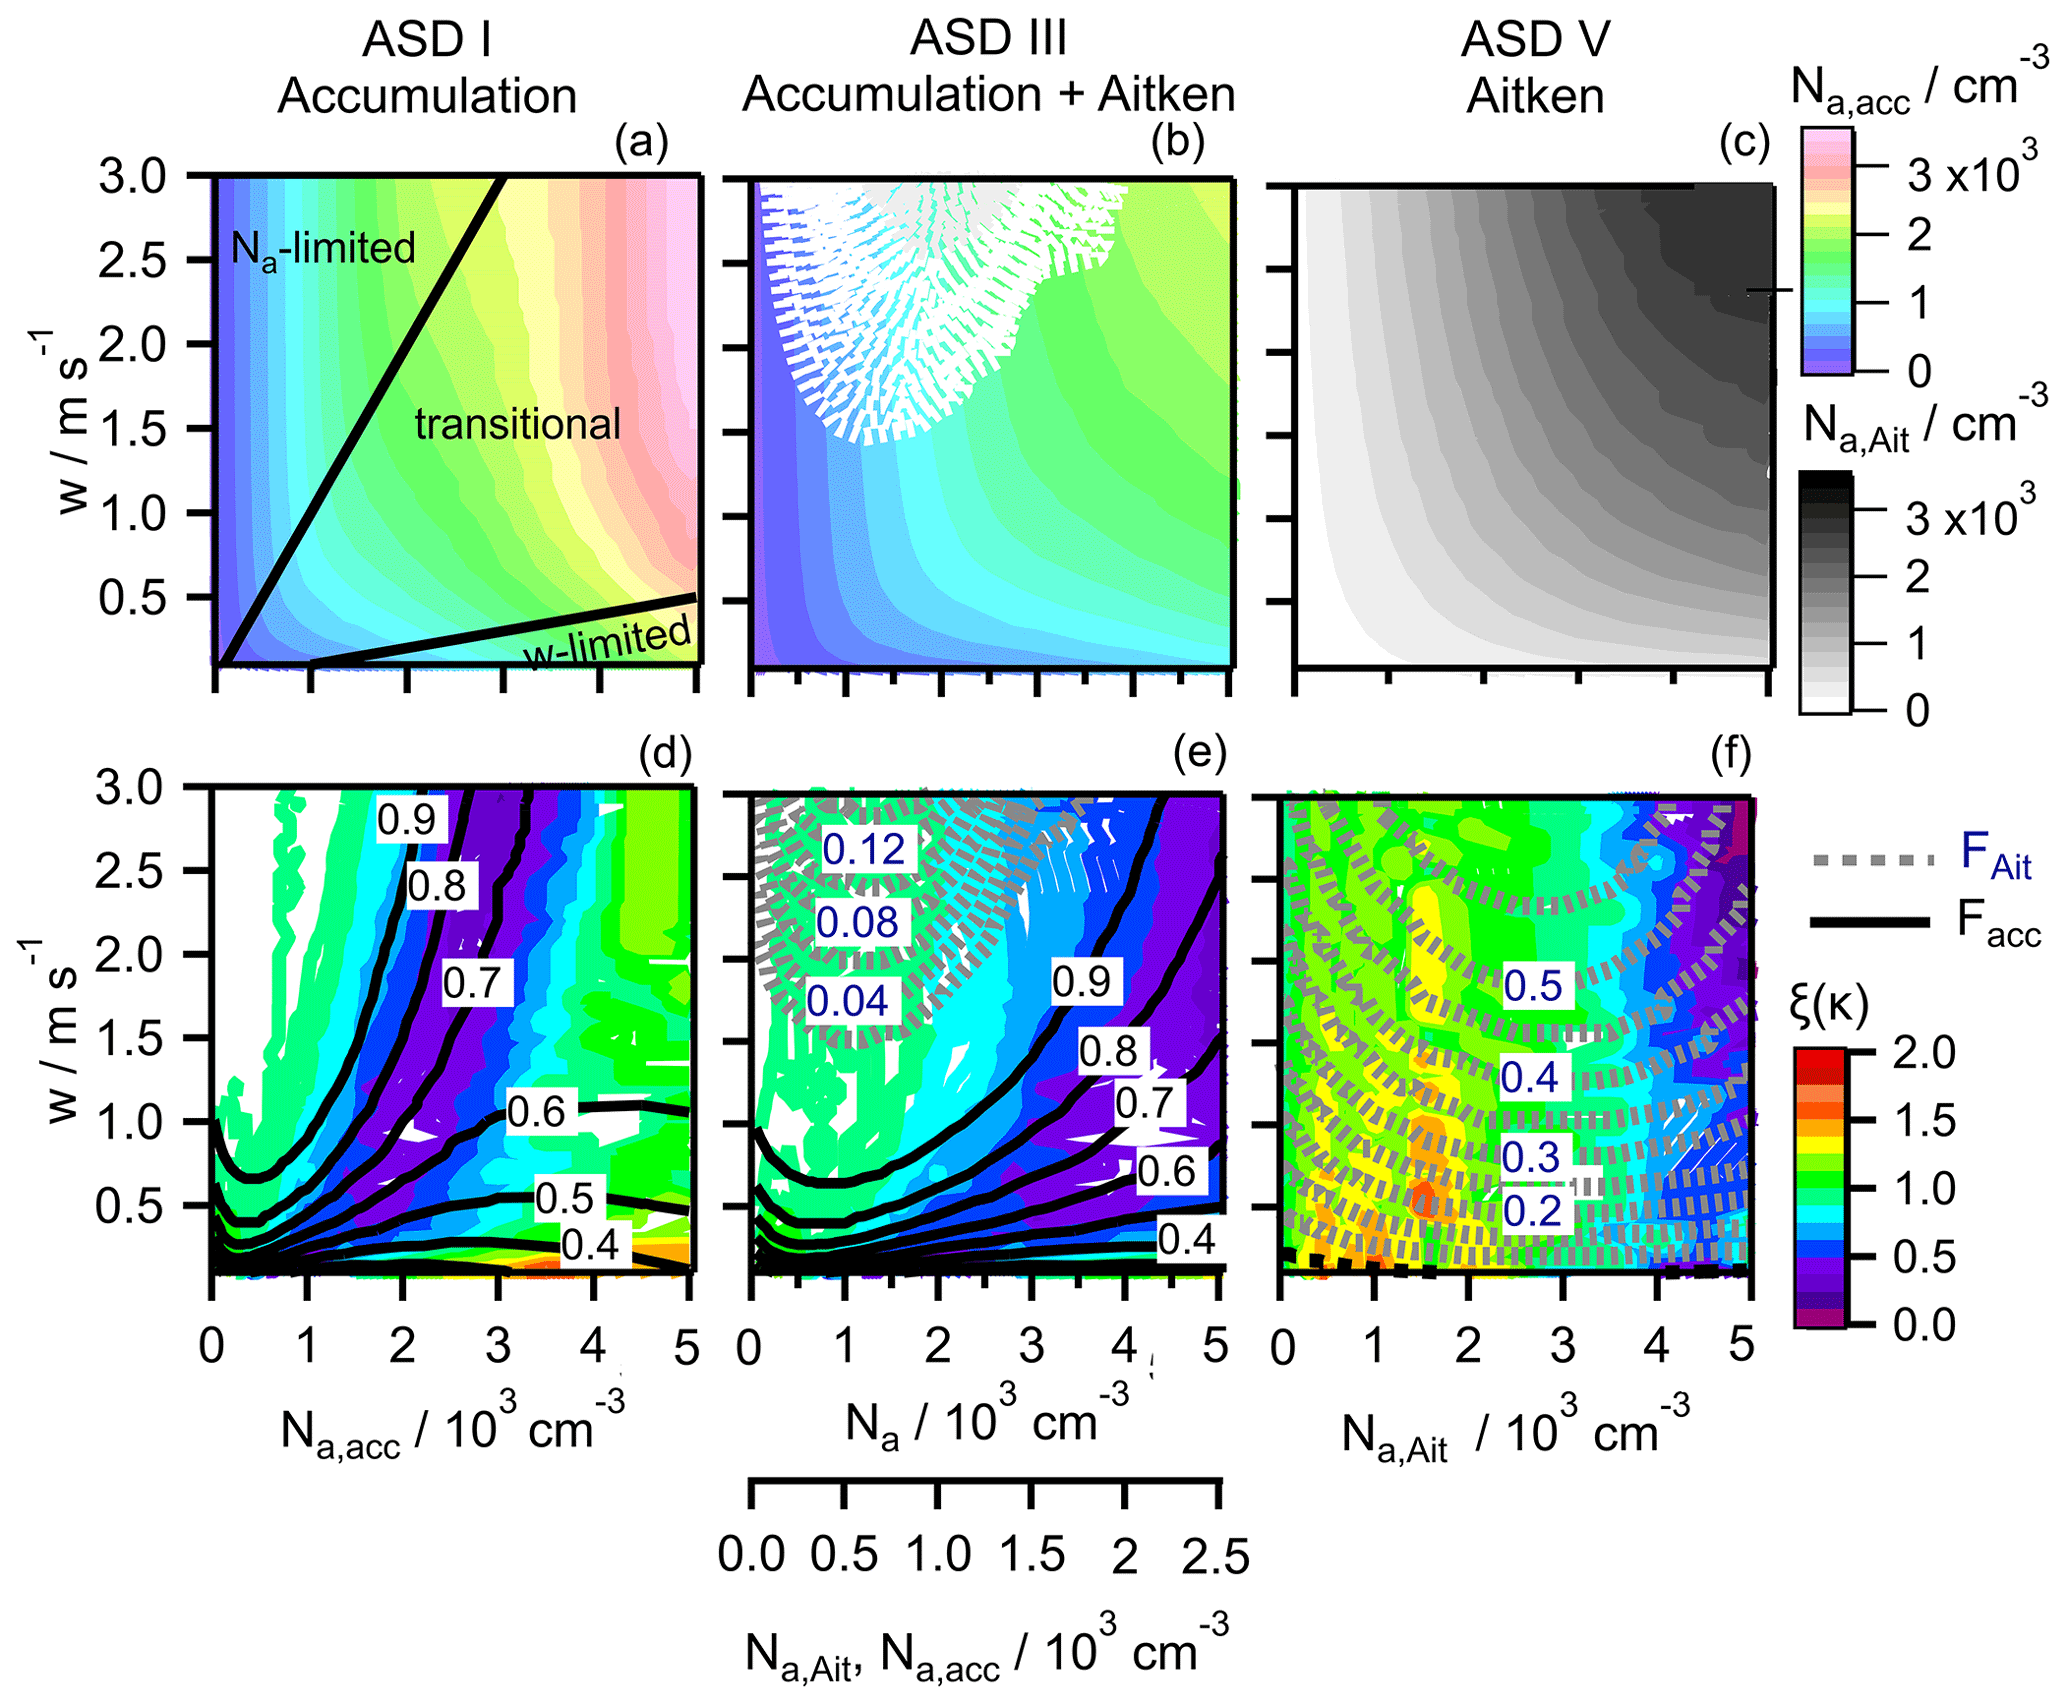
Figure 4(a)–(c) Nd as a function of w and Na for ASD and κ = 0.7. (a) I, (b) III and (c). Color scale: Nd,acc, black/white scale: Nd,Ait. (d)–(f) Corresponding ξ(Na) for ASD. (d) I, (e) III and (f) V. Solid black lines show contours of activated fraction of the accumulation mode (Fact,acc) and dashed grey lines show contours of activated fraction of the Aitken mode (Fact,Ait).
For the monomodal ASD V (Aitken mode), the activated fraction reaches at most ∼0.6 (Fig. 4c, f); thus, the aerosol-limited regime is not reached. However, for cm−3 and w < ∼1.0 m s−1, Nd is linearly dependent on w and independent of Na, which implies a w-limited regime for m s−1 cm3, i.e., shifted by an order of magnitude as compared to ASD I. Accordingly, ξ(Na)≥1, similar to the ξ(Na) values reached for much higher Na,acc and lower w for the monomodal accumulation mode ASD I. The ξ(Na) pattern in Fig. 4b exhibits a minimum when the activated fraction is ∼0.7. This fraction corresponds to the size range at which the cumulative ASD has the largest slope. If more particles are activated, the relative change in Nd and therefore in ξ(Na) becomes smaller. In summary, based on these trends of ξ(Na) and those of ξ(κ) in Sect. 3.2.1, the following conclusions can be drawn:
-
The Na- and w-limited regimes are dependent on particle size, and thus the limits are different for monomodal Aitken vs. accumulation mode ASDs and also for monomodal vs. bimodal ASDs.
-
The sensitivities of Nd to ASD parameters (Na, Dg, κ) and to w depend on their value combinations.
-
Under most w and Na conditions as considered here for bimodal ASDs, the Na-limited regime is not reached, as they cover the transitional regime.
-
The equivalency of a change in w and κ to affect Dmin (Fig. 3) implies that a κ-sensitive regime could be equally defined and taken into account as a w-sensitive regime when exploring sensitivities of Nd.
3.2.3 Sensitivities ξ(κ) for different aerosol size distributions
The parameter ranges of w, κ and Na considered in our simulations in the presence of an Aitken mode constrain transitional or w-limited regimes in which Nd can be equally influenced by w and κ. Therefore, we explore in detail the w–κ combinations above which Aitken mode particles significantly affect Nd and ξ(κ). Figure 5 shows ξ(κ) contour plots for all cases as defined in Fig. 1; the middle column (ASD III) repeats Figs. 3a, S5a and S6a. As the supersaturation and activated fractions are closely related to ξ(κ), the corresponding figures for the 15 cases are shown in Figs. S7 and S8.
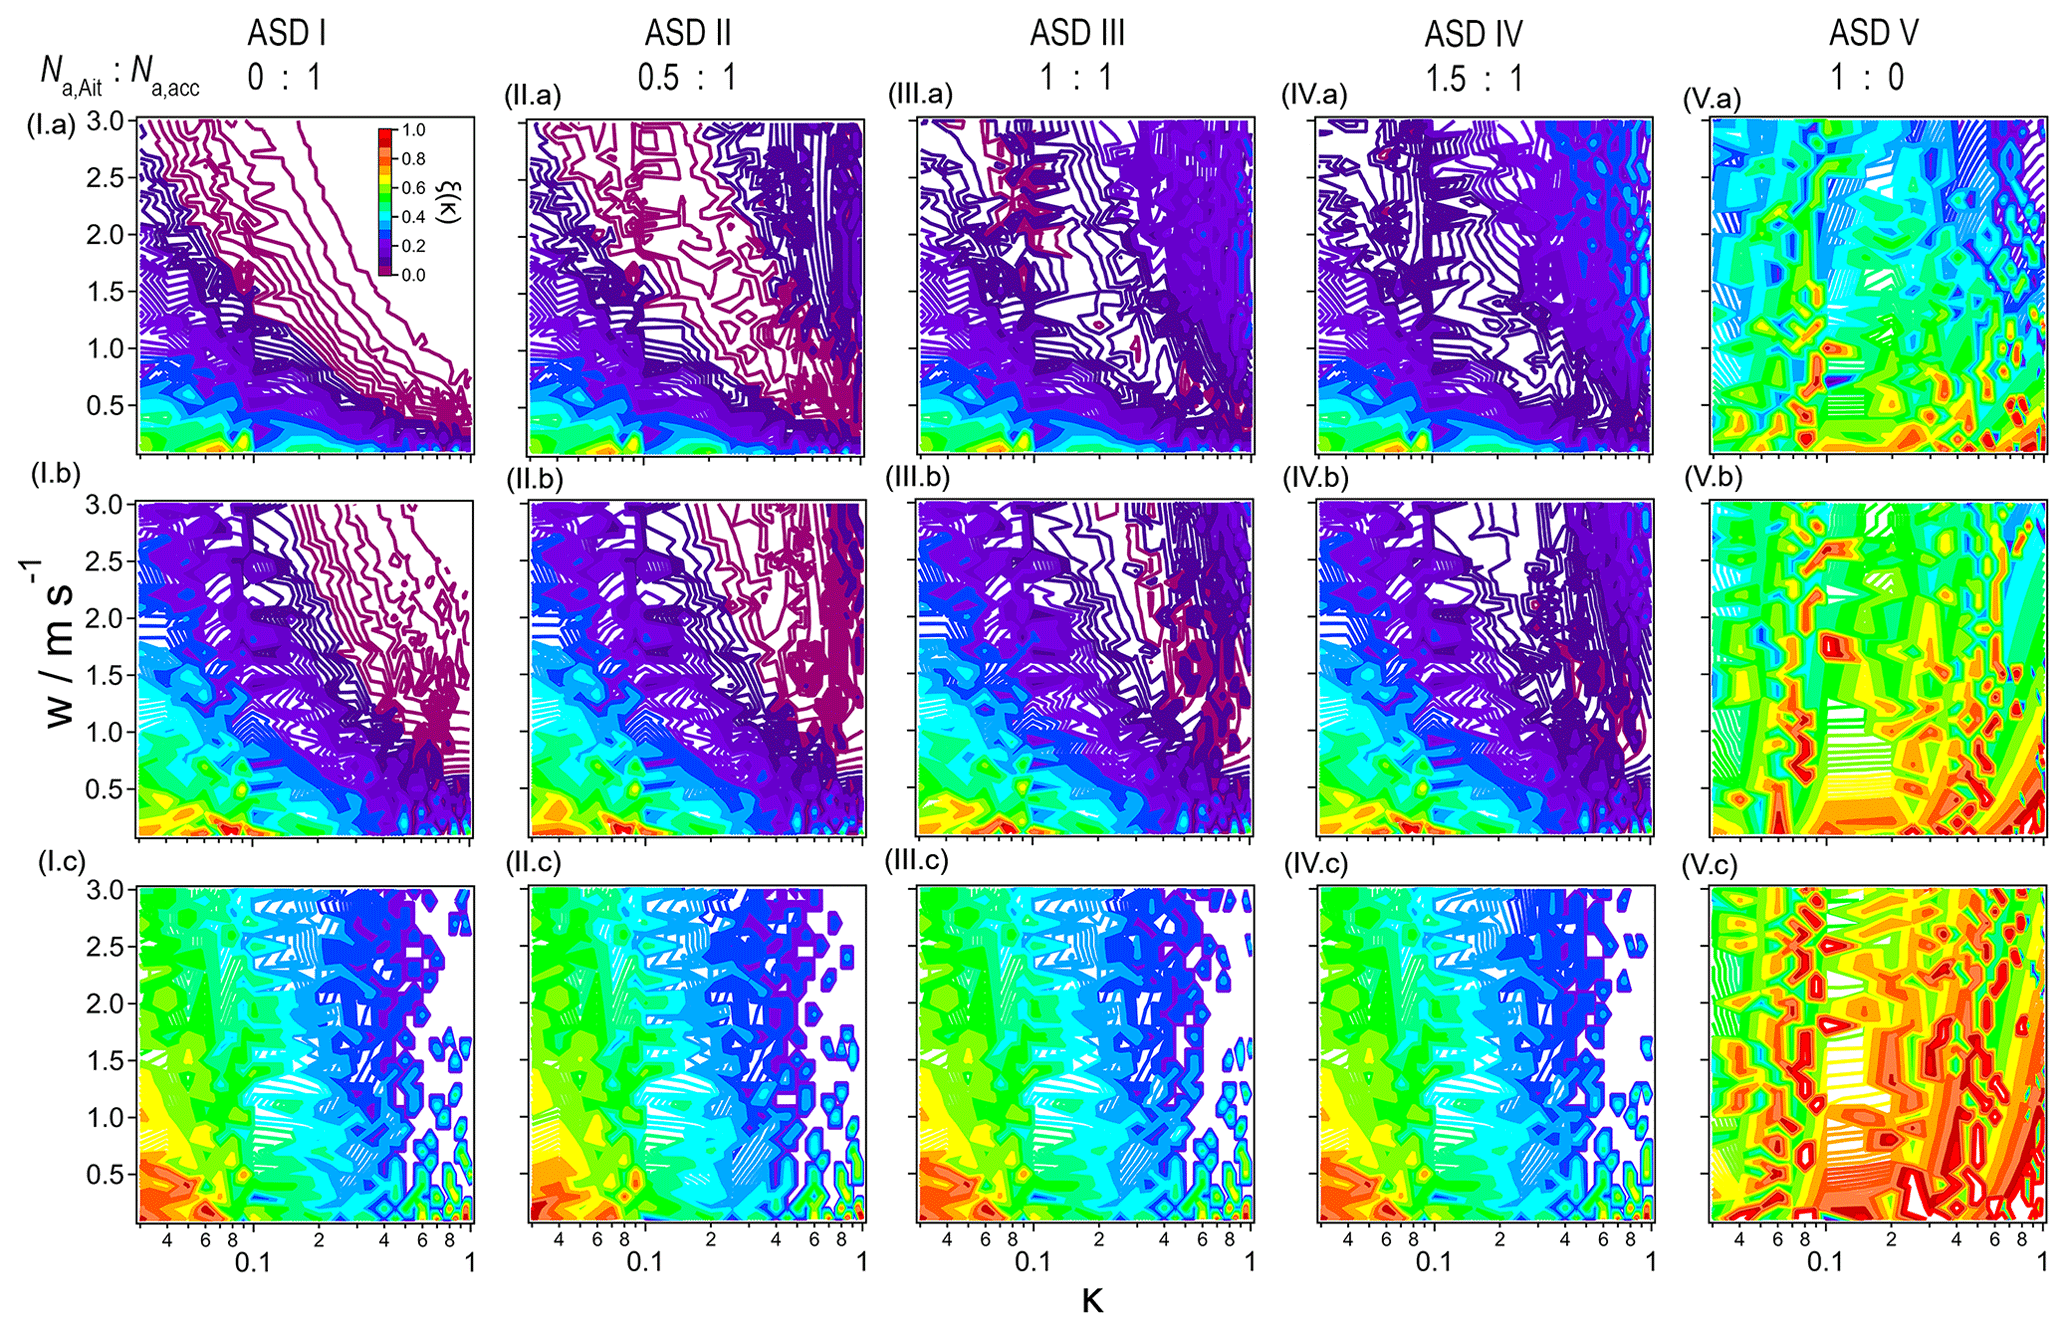
The ξ(κ) values for the monomodal accumulation mode ASD I are shown in the first column of Fig. 5 (a: Na = 100 cm−3, b: 500 cm−3 and c: 2500 cm−3). The white regions in the upper right part of the figures mark the parameter spaces above which ξ(κ)∼0, i.e., the Na-limited regime. At high Na, this space is shifted to higher κ and w, in agreement with the trends of larger Dmin at higher Na (Sect. 3.1.1). The trends in ξ(κ) along columns II, III and IV show the effect on ξ(κ) due to increasing (0.5, 1.0, 1.5) for a fixed Na,acc in each row. The ξ(κ) contours in the parameter space at which only accumulation mode particles contribute to Nd do not significantly change for a given Na,acc (bottom left corners of panels ASD I–IV). However, with increasing , the absolute ξ(κ) values increase, i.e., ∼0.15≲ξ(κ)≲0.25 for the major part of panels IV.a and IV.b whereas 0≤ξ(κ)≲0.25 in panels II.a and II.b. A higher causes the range to narrow at which ξ(κ) shows a minimum, while the w–κ combinations for minimum ξ(κ) are not significantly shifted (ASD I–IV within each row in Fig. 5). This trend in ξ(κ) is caused by the higher Na,Ait near the Hoppel minimum with increasing and thus higher Nd when Dmin∼0.07 µm.
At the highest Na, the ξ(κ) patterns do not show any significant difference (I.c to IV.c in Fig. 5). As under these conditions for κ, w and Na only accumulation mode particles are activated, the presence of the Aitken mode does not affect ξ(κ) within the κ and w ranges considered here. If our scales were extended to updraft velocities of several meters per second as encountered in deep convective clouds, Aitken mode particle particles may activate even if cm−3, resulting in similar contour patterns as for lower Na and the w ranges considered here. However, in polluted air masses eventually a saturation effect in terms of droplet formation is reached above which Nd and effective radii do not significantly change, as shown for convective clouds in the Amazon region (Polonik et al., 2020).
At first sight, the ξ(κ) patterns for ASD V are very different to those of the other ASDs (columns I–IV vs. V in Fig. 5). These apparently different trends can be reconciled based on the discussion in Sect. 3.2.1. and 3.2.2: the higher ξ(κ) for highly hygroscopic particles (red area at the bottom right corner in Fig. 5 V.a–c) implies that at low w, a large number of particles with high κ form droplets, whereas Nd is smaller for less hygroscopic particles. This suggests that Dmin for high κ is located in a “steep” part of the ASD with relatively high Na,Ait, and a decrease in κ increases Dmin, such that it is in the flat part of the ASD (Ds∼0.1 µm).
For ASD I, such situations are not encountered for the chosen parameter ranges. Even for the lowest κ and w, a significant fraction of Na,acc is activated, and any change in Dmin due to a change in w or κ shifts it along the steep part of the cumulative ASD. If we performed simulations for higher Na,acc, i.e., for conditions typical for a w-limited regime, Dmin would be shifted to even larger sizes than shown in Fig. S6b and c, resulting in very small Nd and ξ(κ).
As discussed in Sect. 3.2.2., the conditions for ASD V can be described as a w- and/or κ-limited regime that it is characterized by a relatively low (or ) ratio. Using ASD I, similar ξ(κ) patterns as in Fig. 5V.a could be obtained using ASD I.a for smaller κ and/or w or higher Na than considered here. This can be seen in the upper row of Fig. 5 where panel V.a is apparently a continuation of panel I.a to smaller κ values. However, the match of the corresponding panels (V.b to I.b or V.c to I.c, respectively) is not as perfect which suggests different sensitivities of ξ(κ) to Dg and κ, depending on Na. Thus, not only are the limits of the w-limited regime depending on Dg (i.e., accumulation or Aitken mode) but also on the parameter ranges that characterize the regimes.
The comparison of the influence on ξ(κ) due to increasing Na,Ait (V.a, b, c in Fig. 5) and on ξ(Na) (Fig. 4f) shows that ξ(κ) is increasing, whereas ξ(Na) is decreasing. Therefore, when high concentrations of Aitken mode particles dominate the ASD, Nd is highly sensitive to κ and w and less to Na,Ait. While in the presence of accumulation-mode-dominated ASDs such w- and κ-sensitive conditions might only be encountered in highly polluted air masses (e.g., biomass burning), they can occur for Aitken mode-dominated ASDs at much lower aerosol concentrations. This shift in sensitivities might partially explain the large uncertainties in cloud properties predicted in global model studies when Aitken mode particles significantly influence Nd and other cloud properties (e.g., Lee et al., 2013; Chang et al., 2021).
3.3 Dependence of ξ(κ) on κacc and Dg
3.3.1 Influence of constant κacc on ξ(κ)
While we have assumed so far that both Aitken and accumulation modes have the same κ, such conditions are rarely encountered in the atmosphere. They might occur, for example, when sea salt contributes significantly to both modes (Wex et al., 2016). However, more frequently the accumulation mode consists of material of higher hygroscopicity as it accumulates sulfate and other compounds during cloud processing and other aging processes. Continental accumulation modes typically exhibit values in a range of 0.1<κacc≲0.5, with an average value of κacc∼0.3 (Andreae and Rosenfeld, 2008). The Aitken mode is comprised of fresher, less hygroscopic particles with 0<κ≲0.05 in urban and continental air masses, corresponding to hygroscopic growth factors ≤1.1 at RH = 90 %. Aged Aitken mode particles are more hygroscopic, with κ∼0.3 in the free troposphere and κ∼0.6 in remote marine air (McFiggans et al., 2006). Similar trends in the hygroscopicity of the two modes were also observed during the wet season in the Amazon, with κAit∼0.1 and κacc∼0.2 (Zhou et al., 2002; Gunthe et al., 2009). In a global model study, fairly large differences were predicted above oceans (κAit∼0.5, κacc∼1) and more similar values for both modes above continents (∼0.3 ≤κ≲0.8; Chang et al., 2017).
To explore situations with κacc≠κAit, we repeat the simulations for ASD III.b but use a single value of κacc, whereas the full range of is applied (Fig. 6a). For low w and κ, ξ(κAit) is zero (white space in Fig. 6c and d) because in this parameter range droplets only form on accumulation mode particles and a change in κAit does not affect Nd. When κAit>κacc, small accumulation mode particles may not become activated, whereas more hygroscopic (but smaller) Aitken mode particles sufficiently grow and contribute to Nd. Thus, the total Nd is the sum based on two separate Dmin values for Aitken and accumulation modes, respectively. The activated fractions for the two simulations are compared in Fig. S8; Fact,acc appears as horizontal lines as it is independent of κAit; only at high κAit values are there small deviations from this behavior as very hygroscopic Aitken mode particles may sufficiently suppress the supersaturation and prevent efficient growth of accumulation mode particles. The large overlap of the activated fractions from both modes in Fig. S8a (κacc = 0.1) demonstrates that at w≳1 m s−1, large Aitken mode particles with κAit≳0.3 may grow to droplet sizes, even though only ∼70 % of accumulation mode particles are activated, whereas the smallest 30 % of the accumulation mode particles have not been activated yet.
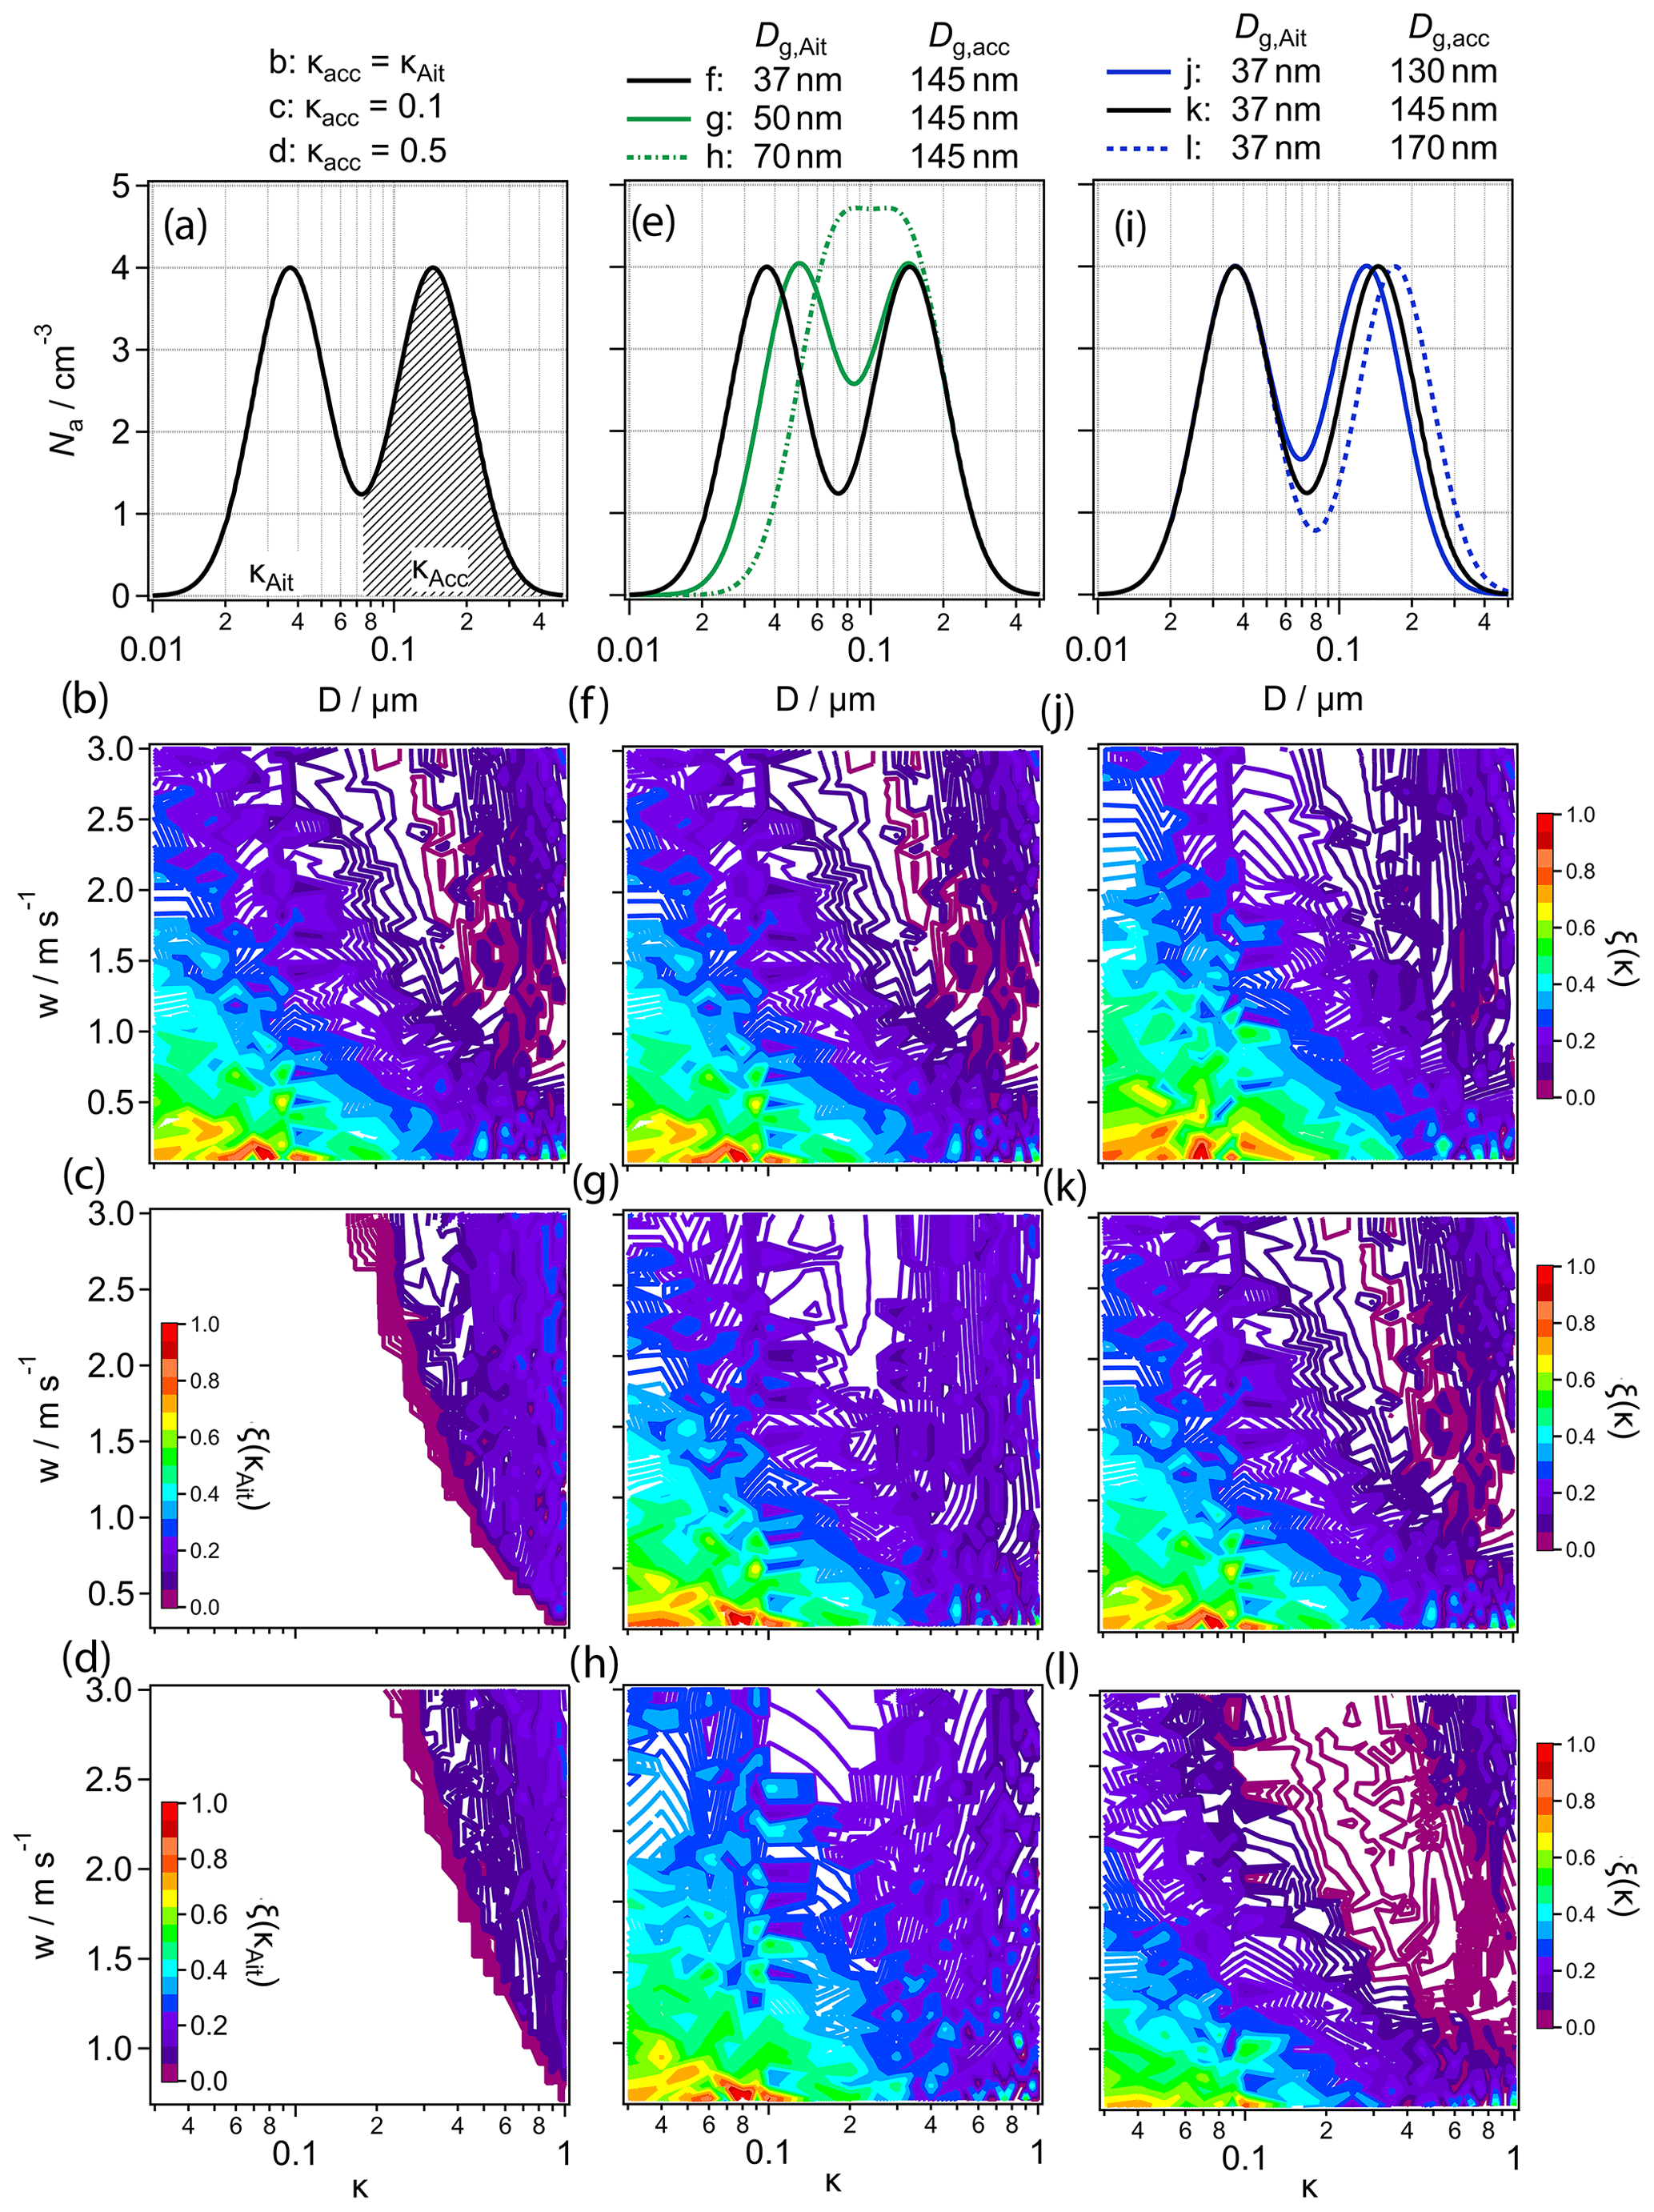
Figure 6Sensitivity of Nd to κ (ξ(κ)) as a function of w and κ for variable ASDs and aerosol properties as outlined in the top panels. (a) Schematic ASD with constant κacc; (b) identical to Fig. 5 III.b; (c) ξ(κAit), assuming κacc = 0.1; (d) ξ (κAit), assuming κacc = 0.5; (e) ASDs with different Dg,Ait in addition to ASD III; (f) identical to Fig. 5 III.b; (g) ξ(κ) for Dg,Ait = 0.05 µm; (h) ξ(κ) for Dg,Ait = 0.07 µm; (i) ASDs with different Dg,acc in addition to ASD III; (j) ξ(κ) for Dg,acc = 0.13 µm; (k) identical to Fig. 5 III.b; and (l) ξ(κ) for Dg,acc = 0.17 µm.
The similar ξ(κ(Ait)) values in Fig. 6b–d show their weak dependence on κacc. The supersaturation is largely controlled by Na,acc, resulting in very similar values over the full κ range, independent of the presence of an Aitken mode (Figure S7 I.b–IV.b). When κacc = 0.1, droplet formation on Aitken mode particles occurs for slightly lower values of κ and w as compared to the case with κacc = 0.5 (Fig. 6c and d). More hygroscopic accumulation mode particles efficiently suppress the supersaturation and prevent smaller (Aitken mode) particles from efficient growth. Thus, for the same w–κ combinations, Fact,Ait is smaller when κacc = 0.5 compared to κacc = 0.1 (Fig. S8).
Similar feedbacks of the two modes on cloud properties were described in previous model sensitivity studies that showed more Aitken mode particles to activate in the presence of less hygroscopic accumulation mode particles (Kulmala et al., 1996). In the latter study, soluble and insoluble mass fractions were used as proxies of particle composition, and it was shown that CCN activation can be parameterized by the soluble mass, which may be higher in large, soluble (hygroscopic) Aitken than in small, less soluble accumulation mode particles. A significant contribution of Aitken mode particles to Nd (>50 %) was observed at a background site in northern Finland, with average activated fractions of % and % (Komppula et al., 2005). While such observations could be equally explained by externally mixed aerosol, this would result in the same effects during cloud processing: efficient formation of mass (e.g., sulfate) in droplets formed on Aitken mode particles that led to a narrowing of the Hoppel minimum rather than to a widening. In a global model study, it was demonstrated that efficient sulfate formation in such droplets could contribute several percent (≳5 %) to the global sulfate budget (Roelofs et al., 2006).
3.3.2 Influence of Dg,Ait and Dg,acc on ξ(κ)
The parameters commonly used to characterize lognormal ASDs, Dg and σg, were identified as the most important aerosol parameters in affecting cloud properties (e.g., Feingold, 2003; Ervens et al., 2005; Reutter et al., 2009; Ward et al., 2010; Anttila et al., 2012). To compare their importance for accumulation and Aitken modes, we vary Dg,Ait and Dg,acc within the range of observed values. Our base case values (Dg,Ait = 0.037 µm, Dg,acc = 0.145 µm, Fig. 1) are typical for oceanic aerosol (Wex et al., 2016). In addition, we apply Dg,acc = 0.13 µm and 0.17 µm for continental aerosol (Pöhlker et al., 2016, 2018). The size of Aitken mode particles strongly depends on their aging state; it is larger for continental aerosol than above the ocean (e.g., Birmili et al., 2001; Heintzenberg et al., 2004; Pöhlker et al., 2016, 2018). In sensitivity tests, we assume Dg,Ait = 0.05 µm and 0.07 µm while keeping Dg,acc = 0.145 µm.
We use ASD III.b as the reference case; it is shown together with the Dg-shifted ASDs in Fig. 6e and i. The panels below the ASDs show the effect on ξ(κ) of increasing Dg,Ait (f, g, h) and Dg,acc (j, k, l). With increasing Dg,Ait, the parameter space at which ξ(κ) exhibits minimum values is shifted to lower w and κ values. The lowest values of ξ(κ) (∼0) are predicted for the smallest Dg,Ait, whereas ξ(κ) ∼0.2 for most of the w–κ space above which Aitken mode particles are activated. This is in agreement with our interpretation of Fig. 3 that the dependence of ξ(κ) on Dmin traces the ASD shape. With Dg,Ait = 0.07 µm, there is no w–κ space in which ξ(κ) shows a distinct minimum as both modes largely overlap (dotted green line in Fig. 6e). As Dmin is determined by the supersaturation, which, in turn, is largely controlled by the accumulation mode properties (Na,acc, Dg,acc, κacc), a shift of Dg,Ait to larger sizes moves Dmin to a different part of the ASD. For example, while Dmin∼0.06 µm only leads to a small activated fraction of Aitken mode particles () if Dg,Ait = 0.037 µm, it would be >0.5 with Dg,Ait = 0.07 µm.
Accordingly, the trends in ξ(κ) for a change in Dg,acc (Fig. 6j, k, l) can be explained: the Hoppel minimum is widest for the ASD with Dg,acc = 0.17 µm, which is reflected by the large space in which ξ(κ)∼0 (Fig. 6l). However, unlike the shift of the range in which ξ(κ) shows a minimum to lower w–κ values for increasing Dg,Ait, the w–κ space only becomes broader for larger Dg,acc but barely changes its position. It can be concluded that Dg,acc is of minor importance as compared to Dg,Ait for the w–κ parameter space above which Aitken mode particles contribute to Nd.
Our sensitivity studies have shown that for bimodal (Aitken and accumulation mode) ASDs, the w–κ combinations resulting in ξ(κ) minimum values can be used as a criterion of conditions under which Aitken mode particles contribute to Nd. An increase in w or κ decreases Dmin to sizes smaller than the region of the Hoppel minimum.
To provide a general framework of our model results, we extract from the sensitivity simulations the w–κ combinations where Fact,Ait = 0.05 as a threshold above which Aitken mode particles may significantly contribute to the total droplet number concentration. Figure 7a and c present a selection of our model ASDs, together with additional ASDs ( and ∼0.1) to further map out the parameter space. In the bottom panels, the w–κ lines are summarized from each simulation that correspond to (Fig. 7b, d).

Figure 7Updraft and hygroscopicity regimes where Aitken mode particles are relevant as CCN. (a) Aerosol size distributions with different Na and . (b) Lines indicate the w–κ combinations for which Fact,Ait = 0.05 using the corresponding ASDs in (a) (same color). (c) Aerosol size distributions with different Dg,Ait and Dg,acc. (d) Lines indicate the w–κ combinations for which Fact,Ait = 0.05 using the corresponding ASDs in (c) (same color).
The black lines in Fig. 7 show two ASDs with equal contributions of Aitken and accumulation mode to Na (1000 cm−3, ASD III.b). For ASDs of these Dg and Na, any combination along the lines yields , such as w≥1.5 m s−1 and κAit∼1 or κ≥0.3 and w∼3 m s−1, respectively. The red lines in Fig. 7b mark the shift of the w–κ as a function of Na and : decreasing Na of both modes by a factor 5 moves the line to much lower w and κ values, such that Aitken mode particles with κ∼0.4 may be activated at w ≳1 m s−1 and more hygroscopic Aitken mode particles at even lower w (dotted red line). When the ASD is dominated by an Aitken mode (), Aitken mode particles with κAit≥0.1 will be activated at w≥1 m s−1 (dashed red line). Conversely, when with Na,Ait = 55 cm−3, the w and κ values are nearly outside the ranges of our κ and w scales (solid red line). Results for even higher Na (2500–6750 cm−3) are consequently not included in the figure because under these conditions, the efficient suppression of the supersaturation by the high Na,acc prevents Aitken mode particles from being activated within the considered parameter ranges of w and κ. Obviously, for wider w ranges as relevant for pyrocumuli or other highly convective cloud systems, corresponding thresholds and w–κ combinations could be derived on extended axes.
The purple lines in Fig. 7b correspond to results for constant Na,acc = 500 cm−3 and for Na,Ait, being 0.5 and 1.5 times that of the accumulation mode (ASD II.b, IV.b). The fact that they do not show any noticeable difference to results using ASD III.b demonstrates that the ratio – if Na,acc is approximately constant – does not significantly impact the position of the w–κ line.
In Fig. 7d, we show the effects of Dg,Ait and Dg,acc on the w–κ space. A change in Dg,acc from 0.145 to 0.13 µm or to 0.17 µm has a negligible effect (solid and dotted blue lines). The low sensitivity of the w–κ line position to Dg,acc suggests that it is applicable to continental and marine air masses, largely independent of Dg,acc. However, an increase in Dg,Ait from 0.037 µm (ASD III.b) to 0.05, 0.06 and 0.07 µm (green lines) significantly reduces the w and κ values that are required to activate Aitken mode particles. Thus, aging processes might efficiently increase Dg,Ait to those of CCN.
Figure 7b and d represent a simple scheme that can be applied to estimate whether Aitken mode particles contribute to Nd under ambient conditions in various air masses and cloud types. While we did not explore all relevant combinations of the parameters that are commonly used to characterize ASDs (Na, , Dg,acc, Dg,Ait), the ranking of their relative importance in determining the position of the w–κ line is expected to hold generally true.
Previous field and model studies suggested that not only accumulation, but also – under specific conditions – Aitken mode particles increase cloud droplet number concentrations and are involved in aerosol–cloud interactions. However, the conditions under which the Aitken mode significantly contributes to cloud droplet number concentration (Nd) had not been fully constrained.
Using an adiabatic parcel model, we systematically investigated the conditions under which Aitken mode particles contribute to Nd for wide ranges of aerosol size distribution (ASD) parameters (particle number concentrations of accumulation and Aitken modes, Na,acc, Na,Ait, mode diameters, Dg,acc, Dg,Ait, and hygroscopicities κacc, κAit) and of the updraft velocity w for Nd. In previous model sensitivity studies of monomodal ASDs, aerosol- and updraft-limited regimes were defined in which Nd depends linearly on Na or w (Reutter et al., 2009). Using this concept, we show that Aitken mode particles are not activated if updraft-limited conditions prevail in the presence of a dominant accumulation mode (high Na,acc). Also, aerosol-limited conditions do not occur as by far not all Aitken mode particles are activated (for w≤3 m s−1, i.e., updraft velocities of abundant cloud types), and thus the transitional regime (between Na and w limitations) exists over wider parameter spaces than in the presence of monomodal accumulation mode ASDs. When ASDs are dominated by an Aitken mode, we find that Nd is highly sensitive to w even at low Na,Ait which implies that the regime limits as identified previously for accumulation mode ASDs are not always applicable, but they depend on parameter value combinations of Dg, Na, κ and w.
Exceeding the previous framework that was restricted to w and Na limitations, we show that the sensitivities of Nd in the transitional and w-limited regimes equally depend on w and κ. Therefore, we explored in detail the sensitivity of Nd to κ, ξ(κ), as a function of w for ASDs that differ in the number of modes (mono- or bimodal), and total Na. Based on the patterns of ξ(κ) as a function of w and κ, we analyze the dependence of the w–κ range above which Aitken mode particles contribute to Nd on the ASD parameters. We show that ξ(κ) exhibits minimum values for w–κ combinations for which the smallest activated particle size (Dmin) is near the Hoppel minimum and increases when smaller Aitken mode particles are activated. Defining lines near these w–κ combinations as the minimum threshold, it can be estimated under which aerosol (Na, κ, Dg) and w conditions Aitken mode particles start contributing to Nd. We conclude that the most important requirements are a low number concentration of total and accumulation mode particles (Na, Na,acc) and/or a large mode diameter of the Aitken mode (Dg,Ait). While this ranking repeats previous findings for sensitivities to monomodal ASDs (e.g., Ervens et al., 2005; Reutter et al., 2009; Ward et al., 2010; Cecchini et al., 2017; Hernández Pardo et al., 2019), our analysis exceeds these studies as it evaluates the relative importance of these parameters of accumulation and Aitken modes for the activation of Aitken mode particles.
Applying this framework to typical ambient aerosol conditions, it seems likely that above the ocean where aerosol loading is usually low and ASDs often exhibit bimodal shapes with very hygroscopic particles (Wex et al., 2016; Campos Braga et al., 2021), Aitken mode particles are activated to cloud droplets. This confirms findings in marine stratocumulus clouds with moderate w≥0.5 m s−1 (Schulze et al., 2020). Given that marine stratocumuli comprise a large fraction of global cloud coverage, the contribution of Aitken mode particles to Nd above the ocean should thus be included in global estimates of aerosol–cloud interactions. Similarly, our concept is consistent with the large observed fractions of activated Aitken mode particles at Arctic sites (Komppula et al., 2005). Conversely, it implies that in highly polluted regions even high Na,Ait (e.g., in megacities; Mönkkönen et al., 2005) are not relevant in stratocumulus and shallow cumulus clouds as droplets will only form on accumulation mode particles.
Global model studies have identified large uncertainties in CCN number concentration and Nd predictions due to the assumptions associated with Aitken mode particle properties, specifically in the Southeast US, Europe and to a small extent in the Amazon region (Lee et al., 2013; Chang et al., 2021). Our framework, together with global maps of κAit and κacc (e.g., Chang et al., 2017), will help to reduce these uncertainties and constrain aerosol–cloud interactions in regions where Aitken mode particles affect cloud properties.
Table A1Definition of parameters that are used in the discussion.
Details on the model codes and further model results can be obtained from the corresponding authors upon request.
The supplement related to this article is available online at: https://doi.org/10.5194/acp-21-11723-2021-supplement.
MLP and BE led the study and wrote the manuscript with input from all coauthors. MZ and BE performed the model simulations. MZ, RCB, OOK and UP commented on the manuscript.
The authors declare that they have no conflict of interest.
Publisher’s note: Copernicus Publications remains neutral with regard to jurisdictional claims in published maps and institutional affiliations.
Barbara Ervens and Minghui Zhang were financially supported by the French National Research Agency (ANR) (grant no. ANR-17-MPGA-0013).
The article processing charges for this open-access publication were covered by the Max Planck Society.
This paper was edited by Hailong Wang and reviewed by Jingyi Chen and one anonymous referee.
Andreae, M. O. and Rosenfeld, D.: Aerosol-cloud-precipitation interactions. Part 1: The nature and sources of cloud-active aerosols, Earth-Sci. Rev., 89, 13–41, 2008. a
Anttila, T. and Kerminen, V.-M.: On the contribution of Aitken mode particles to cloud droplet populations at continental background areas – a parametric sensitivity study, Atmos. Chem. Phys., 7, 4625–4637, https://doi.org/10.5194/acp-7-4625-2007, 2007. a
Anttila, T., Brus, D., Jaatinen, A., Hyvärinen, A.-P., Kivekäs, N., Romakkaniemi, S., Komppula, M., and Lihavainen, H.: Relationships between particles, cloud condensation nuclei and cloud droplet activation during the third Pallas Cloud Experiment, Atmos. Chem. Phys., 12, 11435–11450, https://doi.org/10.5194/acp-12-11435-2012, 2012. a
Birmili, W., Wiedensohler, A., Heintzenberg, J., and Lehmann, K.: Atmospheric particle number size distribution in central Europe: Statistical relations to air masses and meteorology, J. Geophys. Res.-Atmos., 106, 32005–32018, https://doi.org/10.1029/2000JD000220, 2001. a
Campos Braga, R., Ervens, B., Rosenfeld, D., Andreae, M. O., Förster, J.-D., Fütterer, D., Hernández Pardo, L., Holanda, B. A., Jurkat, T., Krüger, O. O., Lauer, O., Machado, L. A. T., Pöhlker, C., Sauer, D., Voigt, C., Walser, A., Wendisch, M., Pöschl, U., and Pöhlker, M. L.: Cloud droplet number closure for tropical convective clouds during the ACRIDICON–CHUVA campaign, Atmos. Chem. Phys. Discuss. [preprint], https://doi.org/10.5194/acp-2021-80, in review, 2021. a, b, c
Bulatovic, I., Igel, A. L., Leck, C., Heintzenberg, J., Riipinen, I., and Ekman, A. M. L.: The importance of Aitken mode aerosol particles for cloud sustenance in the summertime high Arctic – a simulation study supported by observational data, Atmos. Chem. Phys., 21, 3871–3897, https://doi.org/10.5194/acp-21-3871-2021, 2021. a
Cantrell, W., Shaw, G., and Benner, R.: Cloud properties inferred from bimodal aerosol number distributions, J. Geophys. Res.-Atmos., 104, 27615–27624, https://doi.org/10.1029/1999JD900252, 1999. a
Cecchini, M. A., Machado, L. A. T., Andreae, M. O., Martin, S. T., Albrecht, R. I., Artaxo, P., Barbosa, H. M. J., Borrmann, S., Fütterer, D., Jurkat, T., Mahnke, C., Minikin, A., Molleker, S., Pöhlker, M. L., Pöschl, U., Rosenfeld, D., Voigt, C., Weinzierl, B., and Wendisch, M.: Sensitivities of Amazonian clouds to aerosols and updraft speed, Atmos. Chem. Phys., 17, 10037–10050, https://doi.org/10.5194/acp-17-10037-2017, 2017. a, b, c
Chang, D., Cheng, Y., Reutter, P., Trentmann, J., Burrows, S. M., Spichtinger, P., Nordmann, S., Andreae, M. O., Pöschl, U., and Su, H.: Comprehensive mapping and characteristic regimes of aerosol effects on the formation and evolution of pyro-convective clouds, Atmos. Chem. Phys., 15, 10325–10348, https://doi.org/10.5194/acp-15-10325-2015, 2015. a
Chang, D. Y., Lelieveld, J., Tost, H., Steil, B., Pozzer, A., and Yoon, J.: Aerosol physicochemical effects on CCN activation simulated with the chemistry-climate model EMAC, Atmos. Environ., 162, 127–140, https://doi.org/10.1016/j.atmosenv.2017.03.036, 2017. a, b, c
Chang, D. Y., Lelieveld, J., Steil, B., Yoon, J., Yum, S. S., and Kim, A.-H.: Variability of aerosol-cloud interactions induced by different cloud droplet nucleation schemes, Atmos. Res., 250, 105367, https://doi.org/10.1016/j.atmosres.2020.105367, 2021. a, b, c
Ervens, B.: Modeling the Processing of Aerosol and Trace Gases in Clouds and Fogs, Chem. Rev., 115, 4157–4198, https://doi.org/10.1021/cr5005887, 2015. a
Ervens, B., Feingold, G., and Kreidenweis, S. M.: Influence of water-soluble organic carbon on cloud drop number concentration, J. Geophys. Res.-Atmos., 110, D18211, https://doi.org/10.1029/2004JD005634, 2005. a, b, c, d, e, f
Fan, J., Rosenfeld, D., Zhang, Y., Giangrande, S. E., Li, Z., Machado, L. A. T., Martin, S. T., Yang, Y., Wang, J., Artaxo, P., Barbosa, H. M. J., Braga, R. C., Comstock, J. M., Feng, Z., Gao, W., Gomes, H. B., Mei, F., Pöhlker, C., Pöhlker, M. L., Pöschl, U., and de Souza, R. A. F.: Substantial convection and precipitation enhancements by ultrafine aerosol particles, Science, 359, 411–418, https://doi.org/10.1126/science.aan8461, 2018. a
Fanourgakis, G. S., Kanakidou, M., Nenes, A., Bauer, S. E., Bergman, T., Carslaw, K. S., Grini, A., Hamilton, D. S., Johnson, J. S., Karydis, V. A., Kirkevåg, A., Kodros, J. K., Lohmann, U., Luo, G., Makkonen, R., Matsui, H., Neubauer, D., Pierce, J. R., Schmale, J., Stier, P., Tsigaridis, K., van Noije, T., Wang, H., Watson-Parris, D., Westervelt, D. M., Yang, Y., Yoshioka, M., Daskalakis, N., Decesari, S., Gysel-Beer, M., Kalivitis, N., Liu, X., Mahowald, N. M., Myriokefalitakis, S., Schrödner, R., Sfakianaki, M., Tsimpidi, A. P., Wu, M., and Yu, F.: Evaluation of global simulations of aerosol particle and cloud condensation nuclei number, with implications for cloud droplet formation, Atmos. Chem. Phys., 19, 8591–8617, https://doi.org/10.5194/acp-19-8591-2019, 2019. a
Feingold, G.: Modeling of the first indirect effect: Analysis of measurement requirements, Geophys. Res. Lett., 30, 1997, https://doi.org/10.1029/2003GL017967, 2003. a, b
Feingold, G. and Heymsfield, A. J.: Parameterizations of condensational growth of droplets for use in general circulation models, J. Atmos. Sci., 49, 2325–2342, https://doi.org/10.1175/1520-0469(1992)049<2325:POCGOD>2.0.CO;2, 1992. a
Feingold, G. and Kreidenweis, S.: Does cloud processing of aerosol enhance droplet concentrations?, J. Geophys. Res., 105, 24351–24361, https://doi.org/10.1029/2000JD900369, 2000. a
Gérémy, G., Wobrock, W., Flossmann, A. I., Schwarzenböck, A., and Mertes, S.: A modelling study on the activation of small Aitken-mode aerosol particles during CIME 97, Tellus B, 52, 959–979, https://doi.org/10.3402/tellusb.v52i3.17078, 2000. a
Gunthe, S. S., King, S. M., Rose, D., Chen, Q., Roldin, P., Farmer, D. K., Jimenez, J. L., Artaxo, P., Andreae, M. O., Martin, S. T., and Pöschl, U.: Cloud condensation nuclei in pristine tropical rainforest air of Amazonia: size-resolved measurements and modeling of atmospheric aerosol composition and CCN activity, Atmos. Chem. Phys., 9, 7551–7575, https://doi.org/10.5194/acp-9-7551-2009, 2009. a
Hammer, E., Bukowiecki, N., Luo, B. P., Lohmann, U., Marcolli, C., Weingartner, E., Baltensperger, U., and Hoyle, C. R.: Sensitivity estimations for cloud droplet formation in the vicinity of the high-alpine research station Jungfraujoch (3580 m a.s.l.), Atmos. Chem. Phys., 15, 10309–10323, https://doi.org/10.5194/acp-15-10309-2015, 2015. a
Heintzenberg, J., Birmili, W., Wiedensohler, A., Nowak, A., and Tuch, T.: Structure, variability and persistence of the submicrometre marine aerosol, Tellus B, 56, 357–367, https://doi.org/10.3402/tellusb.v56i4.16450, 2004. a
Hernández Pardo, L., Toledo Machado, L. A., Amore Cecchini, M., and Sánchez Gácita, M.: Quantifying the aerosol effect on droplet size distribution at cloud top, Atmos. Chem. Phys., 19, 7839–7857, https://doi.org/10.5194/acp-19-7839-2019, 2019. a, b, c, d
Hoppel, W. A., Frick, G. M., and Larson, R. E.: Effect of nonprecipitating clouds on the aerosol size distribution in the marine boundary layer, Geophys. Res. Lett., 13, 125–128, https://doi.org/10.1029/GL013i002p00125, 1986. a
Jung, C. H., Yoon, Y. J., Kang, H. J., Gim, Y., Lee, B. Y., Ström, J., Krejci, R., and Tunved, P.: The seasonal characteristics of cloud condensation nuclei (CCN) in the arctic lower troposphere, Tellus B, 70, 1–13, https://doi.org/10.1080/16000889.2018.1513291, 2018. a
Köhler, H.: The nucleus in and the growth of hygroscopic droplets, Transact. Faraday Soc., 32, 1152–1161, 1936. a
Komppula, M., Lihavainen, H., Kerminen, V. M., Kulmala, M., and Viisanen, Y.: Measurements of cloud droplet activation of aerosol particles at a clean subarctic background site, J. Geophys. Res.-Atmos., 110, D06204, https://doi.org/10.1029/2004JD005200, 2005. a, b, c
Korhonen, H., Carslaw, K. S., Spracklen, D. V., Ridley, D. A., and Ström, J.: A global model study of processes controlling aerosol size distributions in the Arctic spring and summer, J. Geophys. Res.-Atmos., 113, D08211, https://doi.org/10.1029/2007JD009114, 2008. a
Kulmala, M., Korhonen, P., Vesala, T., Hansson, H.-C., Noone, K., and Svenningsson, B.: The effect of hygroscopicity on cloud droplet formation, Tellus B, 48, 347–360, https://doi.org/10.3402/tellusb.v48i3.15903, 1996. a
Lee, L. A., Pringle, K. J., Reddington, C. L., Mann, G. W., Stier, P., Spracklen, D. V., Pierce, J. R., and Carslaw, K. S.: The magnitude and causes of uncertainty in global model simulations of cloud condensation nuclei, Atmos. Chem. Phys., 13, 8879–8914, https://doi.org/10.5194/acp-13-8879-2013, 2013. a, b, c
Loftus, A. M.: Towards an enhanced droplet activation scheme for multi-moment bulk microphysics schemes, Atmos. Res., 214, 442–449, https://doi.org/10.1016/j.atmosres.2018.08.025, 2018. a
McFiggans, G., Artaxo, P., Baltensperger, U., Coe, H., Facchini, M. C., Feingold, G., Fuzzi, S., Gysel, M., Laaksonen, A., Lohmann, U., Mentel, T. F., Murphy, D. M., O'Dowd, C. D., Snider, J. R., and Weingartner, E.: The effect of physical and chemical aerosol properties on warm cloud droplet activation, Atmos. Chem. Phys., 6, 2593–2649, https://doi.org/10.5194/acp-6-2593-2006, 2006. a, b, c
Mönkkönen, P., Koponen, I. K., Lehtinen, K. E. J., Hämeri, K., Uma, R., and Kulmala, M.: Measurements in a highly polluted Asian mega city: observations of aerosol number size distribution, modal parameters and nucleation events, Atmos. Chem. Phys., 5, 57–66, https://doi.org/10.5194/acp-5-57-2005, 2005. a
Moore, R. H., Karydis, V. A., Capps, S. L., Lathem, T. L., and Nenes, A.: Droplet number uncertainties associated with CCN: an assessment using observations and a global model adjoint, Atmos. Chem. Phys., 13, 4235–4251, https://doi.org/10.5194/acp-13-4235-2013, 2013. a
Petters, M. D. and Kreidenweis, S. M.: A single parameter representation of hygroscopic growth and cloud condensation nucleus activity, Atmos. Chem. Phys., 7, 1961–1971, https://doi.org/10.5194/acp-7-1961-2007, 2007. a, b
Pöhlker, M. L., Pöhlker, C., Ditas, F., Klimach, T., Hrabe de Angelis, I., Araújo, A., Brito, J., Carbone, S., Cheng, Y., Chi, X., Ditz, R., Gunthe, S. S., Kesselmeier, J., Könemann, T., Lavrič, J. V., Martin, S. T., Mikhailov, E., Moran-Zuloaga, D., Rose, D., Saturno, J., Su, H., Thalman, R., Walter, D., Wang, J., Wolff, S., Barbosa, H. M. J., Artaxo, P., Andreae, M. O., and Pöschl, U.: Long-term observations of cloud condensation nuclei in the Amazon rain forest – Part 1: Aerosol size distribution, hygroscopicity, and new model parametrizations for CCN prediction, Atmos. Chem. Phys., 16, 15709–15740, https://doi.org/10.5194/acp-16-15709-2016, 2016. a, b
Pöhlker, M. L., Ditas, F., Saturno, J., Klimach, T., Hrabě de Angelis, I., Araùjo, A. C., Brito, J., Carbone, S., Cheng, Y., Chi, X., Ditz, R., Gunthe, S. S., Holanda, B. A., Kandler, K., Kesselmeier, J., Könemann, T., Krüger, O. O., Lavrič, J. V., Martin, S. T., Mikhailov, E., Moran-Zuloaga, D., Rizzo, L. V., Rose, D., Su, H., Thalman, R., Walter, D., Wang, J., Wolff, S., Barbosa, H. M. J., Artaxo, P., Andreae, M. O., Pöschl, U., and Pöhlker, C.: Long-term observations of cloud condensation nuclei over the Amazon rain forest – Part 2: Variability and characteristics of biomass burning, long-range transport, and pristine rain forest aerosols, Atmos. Chem. Phys., 18, 10289–10331, https://doi.org/10.5194/acp-18-10289-2018, 2018. a, b, c
Pöhlker, M. L., Krüger, O. O., Förster, J.-D., Elbert, W., Fröhlich-Nowoisky, J., Pöschl, U., Pöhlker, C., Bagheri, G., Bodenschatz, E., Huffman, J. A., Scheithauer, S., and Mikhailov, E.: Respiratory aerosols and droplets in the transmission of infectious diseases, arXiv [preprint], arXiv:2103.01188, 1 March 2021. a
Polonik, P., Knote, C., Zinner, T., Ewald, F., Kölling, T., Mayer, B., Andreae, M. O., Jurkat-Witschas, T., Klimach, T., Mahnke, C., Molleker, S., Pöhlker, C., Pöhlker, M. L., Pöschl, U., Rosenfeld, D., Voigt, C., Weigel, R., and Wendisch, M.: The challenge of simulating the sensitivity of the Amazonian cloud microstructure to cloud condensation nuclei number concentrations, Atmos. Chem. Phys., 20, 1591–1605, https://doi.org/10.5194/acp-20-1591-2020, 2020. a
Pruppacher, H. R. and Klett, J. D.: Microphysics of clouds and precipitation, 2nd edn., Kluwer Academics Publisher, Dordrecht, the Netherlands, 2003. a
Reutter, P., Su, H., Trentmann, J., Simmel, M., Rose, D., Gunthe, S. S., Wernli, H., Andreae, M. O., and Pöschl, U.: Aerosol- and updraft-limited regimes of cloud droplet formation: influence of particle number, size and hygroscopicity on the activation of cloud condensation nuclei (CCN), Atmos. Chem. Phys., 9, 7067–7080, https://doi.org/10.5194/acp-9-7067-2009, 2009. a, b, c, d, e, f, g, h, i
Reutter, P., Trentmann, J., Seifert, A., Neis, P., Su, H., Chang, D., Herzog, M., Wernli, H., Andreae, M. O., and Pöschl, U.: 3-D model simulations of dynamical and microphysical interactions in pyroconvective clouds under idealized conditions, Atmos. Chem. Phys., 14, 7573–7583, https://doi.org/10.5194/acp-14-7573-2014, 2014. a
Roelofs, G. J., Stier, P., Feichter, J., Vignati, E., and Wilson, J.: Aerosol activation and cloud processing in the global aerosol-climate model ECHAM5-HAM, Atmos. Chem. Phys., 6, 2389–2399, https://doi.org/10.5194/acp-6-2389-2006, 2006. a, b
Rose, D., Gunthe, S. S., Mikhailov, E., Frank, G. P., Dusek, U., Andreae, M. O., and Pöschl, U.: Calibration and measurement uncertainties of a continuous-flow cloud condensation nuclei counter (DMT-CCNC): CCN activation of ammonium sulfate and sodium chloride aerosol particles in theory and experiment, Atmos. Chem. Phys., 8, 1153–1179, https://doi.org/10.5194/acp-8-1153-2008, 2008. a
Schulze, B. C., Charan, S. M., Kenseth, C. M., Kong, W., Bates, K. H., Williams, W., Metcalf, A. R., Jonsson, H. H., Woods, R., Sorooshian, A., Flagan, R. C., and Seinfeld, J. H.: Characterization of Aerosol Hygroscopicity Over the Northeast Pacific Ocean: Impacts on Prediction of CCN and Stratocumulus Cloud Droplet Number Concentrations, Earth and Space Science, 7, e2020EA001098, https://doi.org/10.1029/2020EA001098, 2020. a, b
Ward, D. S., Eidhammer, T., Cotton, W. R., and Kreidenweis, S. M.: The role of the particle size distribution in assessing aerosol composition effects on simulated droplet activation, Atmos. Chem. Phys., 10, 5435–5447, https://doi.org/10.5194/acp-10-5435-2010, 2010. a, b, c, d
Wex, H., Dieckmann, K., Roberts, G. C., Conrath, T., Izaguirre, M. A., Hartmann, S., Herenz, P., Schäfer, M., Ditas, F., Schmeissner, T., Henning, S., Wehner, B., Siebert, H., and Stratmann, F.: Aerosol arriving on the Caribbean island of Barbados: physical properties and origin, Atmos. Chem. Phys., 16, 14107–14130, https://doi.org/10.5194/acp-16-14107-2016, 2016. a, b, c
Zhou, J., Swietlicki, E., Hansson, H. C., and Artaxo, P.: Submicrometer aerosol particle size distribution and hygroscopic growth measured in the Amazon rain forest during the wet season, J. Geophys. Res.-Atmos., 107, LBA 22-1–LBA 22-10, https://doi.org/10.1029/2000JD000203, 2002. a
- Abstract
- Introduction
- Adiabatic parcel model
- Results and discussion
- Updraft and hygroscopicity regimes of Aitken mode CCN activation
- Summary and conclusions
- Appendix A
- Code and data availability
- Author contributions
- Competing interests
- Disclaimer
- Financial support
- Review statement
- References
- Supplement
accumulation mode). Previous studies suggest that this can also occur in smaller particles (
Aitken mode). Our study provides a general framework to estimate under which aerosol and cloud conditions Aitken mode particles affect clouds.
- Abstract
- Introduction
- Adiabatic parcel model
- Results and discussion
- Updraft and hygroscopicity regimes of Aitken mode CCN activation
- Summary and conclusions
- Appendix A
- Code and data availability
- Author contributions
- Competing interests
- Disclaimer
- Financial support
- Review statement
- References
- Supplement