the Creative Commons Attribution 4.0 License.
the Creative Commons Attribution 4.0 License.
 | 04 Aug 2021
A comparative study to reveal the influence of typhoons on the transport, production and accumulation of O3 in the Pearl River Delta, China
Xuesong Wang
Yu Yan
Jin Shen
Teng Xiao
Huabin Dong
Limin Zeng
Yuanhang Zhang
The Pearl River Delta (PRD) region in South China is faced with severe ambient tropospheric ozone (O3) pollution in autumn and summer, which mostly coincides with the occurrence of typhoons above the Northwest Pacific. With increasingly severe O3 pollution in the PRD under the influence of typhoons, it is necessary to gain a comprehensive understanding of the impact of typhoons on O3 transport, production and accumulation for efficient O3 reduction. In this study, we analysed the general influence of typhoons on O3 pollution in the PRD via systematic comparisons of meteorological conditions, O3 processes and sources on O3 pollution days with and without typhoon occurrence (denoted as the typhoon-induced and no-typhoon scenarios, respectively) and also examined the differences in these influences in autumn and summer. The results show that the approach of typhoons was accompanied by higher wind speeds and strengthened downdraughts in autumn, as well as the inflows of more polluted air masses in summer, suggesting favourable O3 transport conditions in the typhoon-induced scenario in both seasons. However, the effect of typhoons on the production and accumulation of O3 were distinct. Typhoons led to reduced cloud cover, and thus stronger solar radiation in autumn, which accelerated O3 production, but the shorter residence time of local air masses was unfavourable for the accumulation of O3 within the PRD. In contrast, in summer, typhoons increased cloud cover, and weakened solar radiation, thus restraining O3 formation, but the growing residence time of local air masses favoured O3 accumulation. The modelling results using the Community Multiscale Air Quality (CMAQ) model for the typical O3 pollution days suggest increasing contributions from the transport processes and sources outside the PRD for O3 pollution, confirming enhanced O3 transport under typhoon influence in both seasons. The results of the process analysis in CMAQ suggest that the chemical process contributed more in autumn but less in summer in the PRD. Since O3 production and accumulation cannot be enhanced at the same time, the proportion of O3 contributed by emissions within the PRD was likely to decrease in both seasons. The difference in the typhoon influence on O3 processes in autumn and summer can be attributed to the seasonal variation of the East Asian monsoon. From the meteorology–process–source perspective, this study revealed the complex influence of typhoons on O3 pollution in the PRD and their seasonal differences. To alleviate O3 pollution under typhoon influence, emission control is needed on a larger scale, rather than only within the PRD.
- Article
(15747 KB) - Full-text XML
-
Supplement
(2093 KB) - BibTeX
- EndNote


Tropospheric ozone (O3) serves as a secondary pollutant in ambient air and is detrimental for human health and crop production (Wang et al., 2017; Liu et al., 2018; Mills et al., 2018). Ambient O3 is produced from its precursors, i.e. nitrogen oxides (NOx = NO + NO2) and volatile organic compounds (VOCs), through chemical reactions in the presence of sunlight. Due to the relatively long lifetime of O3 (∼ 22 d; Stevenson et al., 2006), it can accumulate locally or be transported to downwind regions. Under unfavourable meteorological conditions, enhanced transport, production and/or accumulation of O3 can all contribute to the O3 pollution within a region (National Research Council, 1991).
As the largest city cluster in southern China, the Pearl River Delta (PRD) region faces frequent ambient O3 pollution, especially in autumn and summer (Li et al., 2014; Wang et al., 2017; Lu et al., 2018). Along with the continuous increase in O3 levels in recent years (Li et al., 2019), O3 has become the primary contributor to the deterioration of air quality in this region (Feng et al., 2019). The occurrence of O3 pollution in the PRD is predominantly related to the influence of typhoons (or tropical cyclones) above the Northwest Pacific (Gao et al., 2018; Deng et al., 2019; Lin et al., 2019). According to Gao et al. (2018), seven out of the nine most severe O3 episodes (regional mean maximum 8 h average O3 concentrations > 240 µg m−3) during 2014–2016 coincided with the approach of typhoons. The changes in the tracks and intensity of typhoons may contribute to the growing trend of O3 levels, both recently and in future (Lam, 2018; Lam et al., 2018). Therefore, a comprehensive understanding of the influence of typhoons on the transport, production and accumulation of O3 has important implications for efficient and strategic O3 reduction in the PRD.
Analyses of typhoon-related O3 episodes in the PRD have been extensively reported in previous publications. The effect of typhoons on O3 pollution is closely linked to meteorological conditions that are conducive to the transport, production and/or accumulation of O3. Stagnation caused by typhoons, characterised by low wind speeds, has been reported during many episodes, and it promotes the accumulation of locally formed O3 within the PRD (Wang et al., 1998; So and Wang, 2003; Wang and Kwok, 2003; Huang et al., 2005; Lam et al., 2005; Jiang et al., 2008; Zhang et al., 2014; Chow et al., 2019). Strong northerly or westerly winds were observed or simulated during several episodes, suggesting the potentially strengthened transport of pollutants under typhoon influence (Wang et al., 2001; Yang et al., 2012; Wang et al., 2015; Wei et al., 2016). Downdraughts on the outskirts of typhoons may promote downward O3 transport and contribute to near-ground O3 pollution as well (Lam, 2018), but its appearance in the PRD has only been examined in a few studies. Cloudless conditions and strong solar radiation enhance O3 production, which is another important cause of O3 pollution (Wang et al., 1998; Wang and Kwok, 2003; Li et al., 2018; Yue et al., 2018; Chow et al., 2019). In a more direct way, several studies have utilised chemical transport models, along with the process analysis (PA) tool and source apportionment (SA) methods, to quantify and compare the contributions of various O3 processes (e.g. transport and the chemical process) and sources (e.g. local emissions, outside emissions and background) during these episodes. Based on reports by Huang et al. (2005), Lam et al. (2005), Jiang et al. (2008), Wang et al. (2010), Li (2013), Wang et al. (2015), Wei et al. (2016) and Chen et al. (2018), horizontal/vertical transport and chemical production may both be the main contributing process for typhoon-induced O3 pollution in different parts of the PRD. The SA results revealed that emissions within the PRD contributed 40 %–80 % of O3 during typhoon-related O3 episodes (Li et al., 2012; Li, 2013; Chen et al., 2015), suggesting the potentially important role of O3 accumulation for O3 pollution here. However, despite massive episode-based studies, several important questions still remain. Are O3 transport, production and accumulation within the PRD all enhanced at the same time by typhoons? Do both O3 pollution seasons (autumn and summer) experience similar impact of typhoons on O3 pollution? More thorough investigations are needed to answer these questions.
In this study, we present systematic comparisons between O3 pollution in the typhoon-induced and no-typhoon scenarios (definitions given in Sect. 2.2) to elucidate the influence of typhoons on O3 transport, production and accumulation in the PRD and to reveal their seasonal differences. October and July in 2014–2018 were selected as the representative months for autumn and summer, respectively. Multiple data sets, including the ERA-Interim reanalysis, the routine monitoring data sets, trajectories calculated by the Hybrid Single-Particle Lagrangian Integrated Trajectory (HYSPLIT) model and the modelling results of typical O3 pollution days using the Community Multiscale Air Quality (CMAQ) model, were used in the comparisons. A detailed introduction of these data sets is presented in Sect. 2. The comparisons were conducted from the perspectives of meteorological conditions (Sect. 3), O3 processes and sources (Sect. 4), and the conclusions about the influence of typhoons on the causes of ambient O3 pollution in the PRD in the two seasons are illustrated in Sect. 5.
2.1 Data sets
The detailed information for the data sets utilised in the comparison of meteorological conditions is presented below:
-
Reanalysis data sets. We mainly used the ERA-Interim reanalysis product in the comparisons due to its more available parameters compared to other reanalysis data sets and high spatial coverage (available at https://www.ecmwf.int/en/forecasts/datasets/reanalysis-datasets/era-interim, last access: 8 February 2020; Dee et al., 2011; Berrisford et al., 2011). Specifically, meteorological parameters used in the comparisons include the following three categories: (1) near-surface parameters from the analyses data, including air temperature (at a height of 2 m), relative humidity (RH; at 1000 hPa), horizontal wind speeds (at a height of 10 m; zonal and meridional wind speeds were also involved in the comparisons) and low (for the height at which pressure/surface pressure > 0.8), medium (for the height at which 0.45 < pressure/surface pressure < 0.8), high (for the height at which pressure/surface pressure < 0.45) and total cloud covers; (2) near-surface parameters from the forecast data, including the planetary boundary layer (PBL) height and net surface solar radiation; and (3) upper air parameters at multiple heights, including the horizontal and vertical wind speeds, cloud water content and O3 mixing ratio. The focus of this study is O3 pollution during the daytime, and therefore, only the parameters at 14:00 local time (LT) were selected for the analyses (except for net surface solar radiation, which was averaged between 08:00 and 17:00 LT).
-
Surface meteorological routine monitoring data sets. The routine monitoring meteorological data collected at 29 national meteorological sites within the PRD (locations shown in Fig. S1a in the Supplement) were also used to explore the meteorological features under the impact of typhoons. The parameters include air temperature, RH, and wind speed and direction (also transformed to zonal and meridional wind speeds in the comparisons) at 14:00 LT.
-
Typhoon information. The times, locations and intensities of typhoons were provided by the Chinese Meteorological Administration best-track data set of tropical cyclones (Ying et al., 2014). The tracks of all typhoons that potentially contributed to O3 pollution in the PRD during the study period (October and July in 2014–2018) are shown in Figs. S2 and S3.
-
O3 concentrations. Hourly O3 concentration data, which were originally released by the China National Environmental Monitoring Centre, were downloaded from https://quotsoft.net/air/ (last access: 18 December 2018). Based on the hourly data, we calculated the maximum 1 h concentrations (MDA1) and maximum 8 h average concentrations (MDA8) of O3 in nine municipalities in the PRD (including Guangzhou, Shenzhen, Zhuhai, Foshan, Jiangmen, Zhaoqing, Huizhou, Dongguan and Zhongshan) to identify O3 pollution days that served as samples in the comparisons.
2.2 Definition and classification of O3 pollution days
In this study, O3 pollution days were defined as the days when the MDA1 exceeds 200 µg m−3 or the MDA8 exceeds 160 µg m−3 for O3 (both are the Grade II thresholds of the Chinese National Ambient Air Quality Standard, NAAQS; GB 3095-2012) in any of the nine municipalities in the PRD. According to these criteria, there were 78 and 55 O3 pollution days (given in Tables S1 and S2) during October and July in 2014–2018, respectively. The information about these O3 pollution days in the 2 representative months is listed in Table 1 (overall) and Table S3 (monthly), including the numbers of days, their proportions in the month and the corresponding mean O3 concentrations (MDA8 and MDA1; highest values among nine municipalities in the PRD). Although there were more O3 pollution days in October than in July, O3 pollution under typhoon influence occurred on ∼ 30 % days in both months. Typhoons tend to result in more severe O3 pollution in the PRD, as indicated by generally higher O3 MDA1 and MDA8 values with the influence of typhoons than those without typhoons.
Table 1The numbers and proportions of O3 pollution days and O3 concentrations for various scenarios.
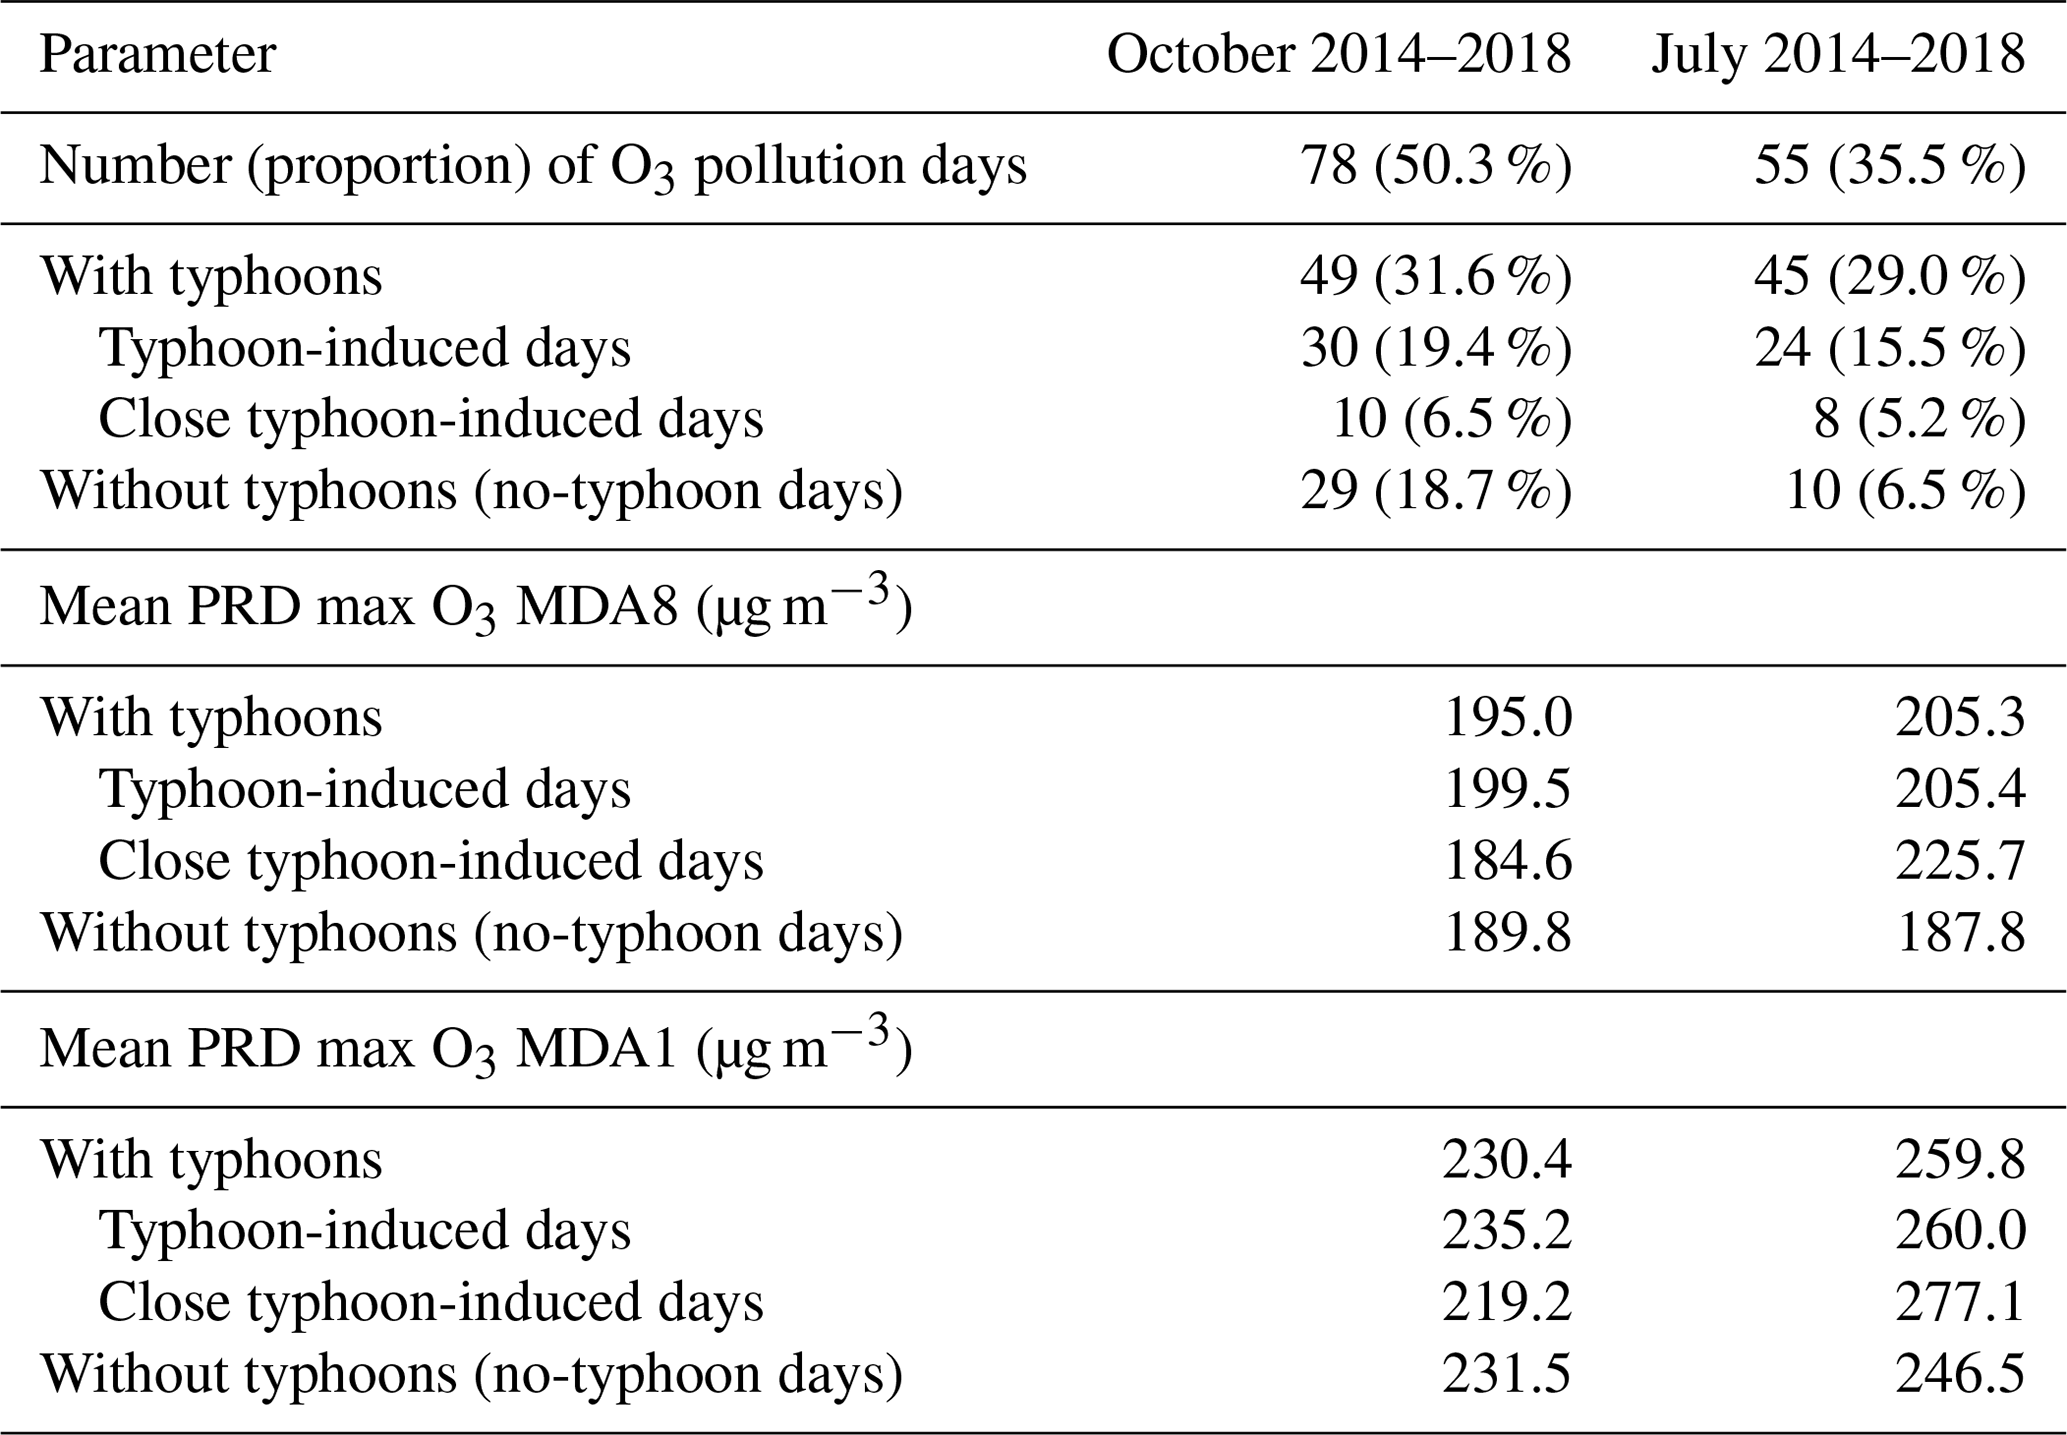
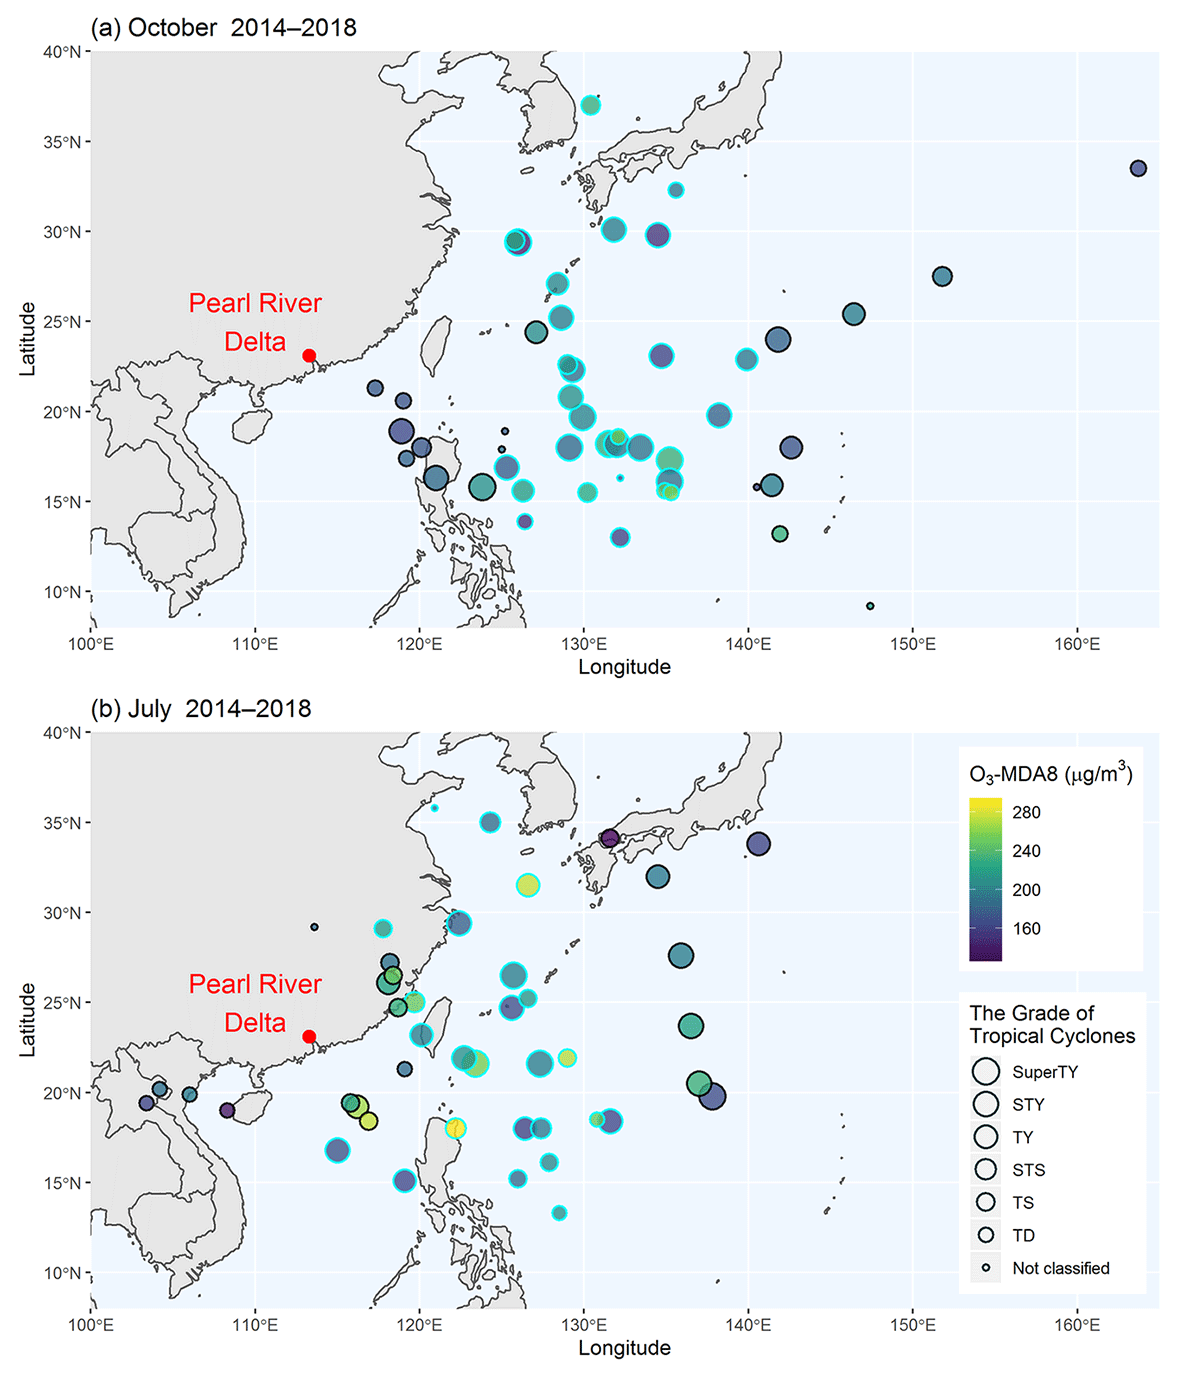
Figure 1The location and intensity of typhoons at 14:00 LT on all O3 pollution days with typhoons, and the corresponding O3 MDA8 concentrations (maximum values in the nine municipalities of the PRD) on the same days during (a) October and (b) July in 2014–2018. The points with cyan borders indicate the typhoon-induced O3 pollution days used in the comparisons. The grades of tropical cyclones (Chinese National Standard, GB/T 19201-2006) are as follows: SuperTY – super typhoon; STY – severe typhoon; TY – typhoon; STS – severe tropical storm; TS – tropical storm; TD – tropical depression; others are not classified.
The differing locations of typhoons can result in the diverse effect of typhoons on O3 pollution (Chow et al., 2018). To determine the general influence of typhoons on O3 pollution in the PRD, it is necessary to further select O3 pollution days coinciding with typhoons with similar directions and distances to the PRD. As is shown in Fig. 1, all O3 pollution days in October and most O3 pollution days in July under typhoon influence were associated with typhoons to the east of the PRD, which were more likely to cause O3 pollution (Chow et al., 2018). In order to minimise the disturbance of typhoon directions in the comparisons, we removed the remaining five O3 pollution days in July with typhoons located due north or southwest of the PRD from the analyses. After this, based on the distances between typhoon centres and the PRD (at 14:00 LT), we classified the pollution days with typhoons in each season into three categories, i.e. close typhoon-induced days (lowest 20 % of distances), typhoon-induced days (20 %–80 % intervals of distances) and far typhoon-induced days (longest 20 % of distances). The typhoon-induced days represent O3 pollution days with general typhoon influence, and they were compared with those without the appearance of typhoons (hereafter denoted as no-typhoon days). It should be noted that the distances between typhoon centres and the PRD on typhoon-induced days were overall larger in autumn (1400–2800 km; 14:00 LT) than in summer (700–2000 km; 14:00 LT), which may be a consequence of the different characteristics of the typhoon paths in the two seasons. Most typhoons in autumn travel northwest initially and then turn northward in the areas east of the Philippines (Fig. S2), whereas they are more likely to end up landing in southeastern China in summer (Fig. S3). Since the influence of typhoons on O3 pollution may be different when typhoons come close enough to the PRD (Lam et al., 2005; Li, 2013), the close typhoon-induced days were considered to be a special scenario in the comparisons of meteorological conditions (Sect. 3.5). Owing to the less apparent effect of typhoons over the PRD, we did not include the far typhoon-induced days in the discussions.
2.3 Calculation of the trajectories and air parcel residence time
To explore the potential effect of cross-regional transport on O3 pollution in the PRD, we applied the HYSPLIT model (Stein et al., 2015) with the Global Data Assimilation System (GDAS) data sets as input to calculate the 72 h backward trajectories reaching the PRD at 14:00 LT for all O3 pollution days. The Modiesha site (23.1∘ N, 113.3∘ E; Fig. S1b), which is located in the central part of the PRD, was the endpoint of the backward trajectories. Its height was set to 500 m above the ground to indicate the effect of long-range transport on O3 pollution within the PBL (Park et al., 2007).
Air parcel residence time (APRT), discussed by Huang et al. (2019), is the average number of hours that air parcels originated from one place stay within a predefined domain, and long APRTs can be used to indicate good accumulation conditions for locally sourced pollutants. To calculate APRTs in the PRD, we designed a 21 × 15 point matrix (resolution of 0.2∘ × 0.2∘) that embraces the whole PRD (Fig. S4), and forward trajectories starting from these points were also calculated using the HYSPLIT model. The height of all points was set as 100 m above the ground to represent the height of all local emissions and to reduce the disturbance of the surface as well. The start times were set as 02:00, 08:00, 14:00 and 20:00 LT for all O3 pollution days. Afterwards, the length of time that each trajectory remained within the administration borders of the PRD, i.e. APRT, was calculated and attributed to its starting point. APRTs in each point were averaged, and these averaged APRT values in all points were interpolated using the kriging method to obtain field results for the further comparisons.
2.4 CMAQ modelling: basic setup and modelling methods
We utilised the widely used 3D chemical transport model CMAQ (version 5.0.2) to investigate the effects of typhoons on O3 processes and sources. October 2015 and July 2016 featured the most severe O3 pollution under typhoon influence among all representative months in autumn and summer, respectively (Table S3). Therefore, O3 pollution in these 2 months was modelled and used in further comparisons. Note that the modelling period in autumn was adjusted to 11 October–10 November 2015 to involve more O3 pollution days (3–5 November 2015). In detail, there were four typhoon-induced O3 pollution days (14–16 and 21 October 2015) and four no-typhoon O3 pollution days (28 October and 3–5 November 2015) in October 2015, whereas there were four and six typhoon-induced and no-typhoon days in July 2016, respectively (typhoon-induced days on 7–8 and 30–31 July 2016; no-typhoon days on 22–26 and 29 July 2016). The results of daytime (09:00–17:00 LT) O3 PA and SA on the above O3 pollution days were averaged for the typhoon-induced and no-typhoon scenarios in autumn (October 2015) and summer (July 2016) and were used in the comparisons.
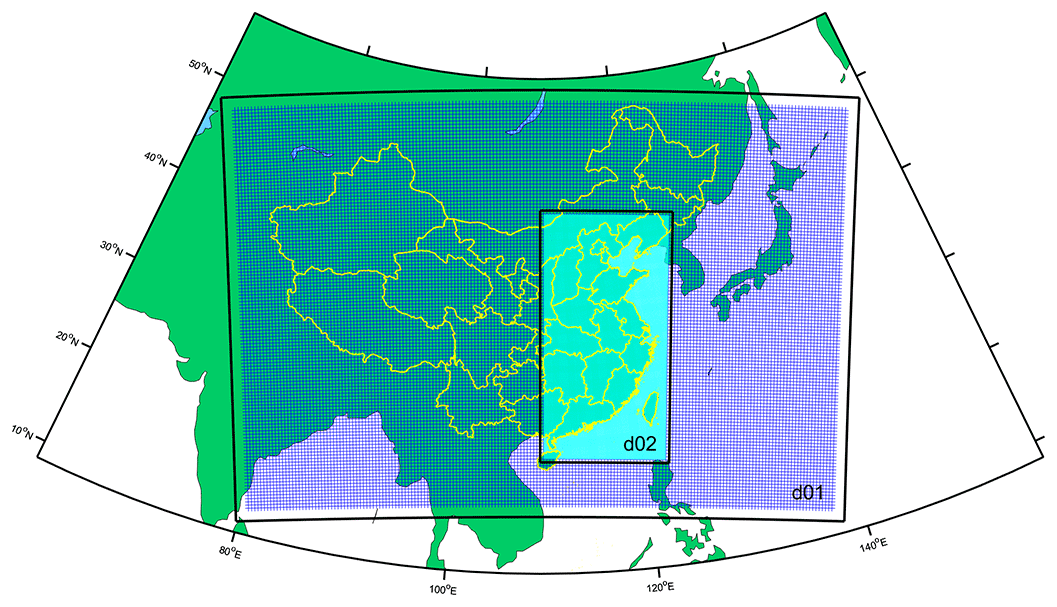
Figure 2The two nested modelling domains, denoted as d01 and d02. The black boxes indicate the WRF modelling domains, and the nested areas are the CMAQ modelling domains.
The main setup of the CMAQ model is presented as follows. The two nested modelling domains with the resolutions of 36 and 12 km (denoted as d01 and d02, respectively) were set in this study (Fig. 2). Specifically, d02 covers the whole of eastern and central China (EC-China), enabling us to evaluate the contribution of emissions in these areas to O3 pollution in the PRD. There were 19 vertical layers in the CMAQ modelling, with about 10 layers within the PBL (about 0–1 km in heights; Guo et al., 2016). The Weather Research and Forecasting (WRF) model (version 3.2) provided the meteorological fields used as inputs. Sparse Matrix Operator Kernel Emissions (SMOKE; version 2.5) and the Model of Emissions of Gases and Aerosols from Nature (MEGAN; version 2.10) were used to process the anthropogenic and biogenic emissions, respectively. The anthropogenic emissions inventory used in this study consisted of the following three parts: (1) emissions in the PRD, which were provided by the Guangdong Environmental Monitoring Center; (2) emissions in other areas of mainland China, which were extracted from the Multi-resolution Emission Inventory for China (MEIC) inventory (He, 2012); and (3) emissions in other countries and regions in Asia, which were extracted from the MIX inventory (Li et al., 2017). The initial and boundary conditions of the d01 modelling were obtained from the same period results of the Model for Ozone and Related chemical Tracers, version 4 (MOZART-4), global model (available at https://www.acom.ucar.edu/wrf-chem/mozart.shtml, last access: 4 December 2019), and those of the d02 modelling were extracted from the d01 modelling results. The SAPRC07 gas-phase chemistry mechanism (Carter, 2010) and the AERO6 aerosol scheme were set in the modelling. In addition, the simulations of the 2 months were both started 10 d ahead to minimise the disturbance of the bias of the initial conditions. The modelling performances of CMAQ and WRF were determined to be acceptable based on the comparisons between the observational and modelling series of meteorological parameters, O3 MDA8, daily NO2 concentrations and the mixing ratios of non-methane hydrocarbons (NMHCs) in the PRD (for details, refer to Sect. S1 in the Supplement), which ensures the validity of the further analyses.
The PA tool in CMAQ was implemented to quantify the hourly contributions of O3 processes (or integrated process rate, IPR), which includes vertical/horizontal transport (convection + diffusion), chemical process (net O3 production through gas-phase reactions), dry deposition and cloud process. To explore the overall effect of typhoons on O3 transport and production in the region, the mean PA results within the administration boundaries of the PRD were calculated and compared.
In order to identify the sources of all O3 in the PRD, we used the classic brute force method (BFM) to identify the contributions of emissions (including anthropogenic and biogenic emissions) in the PRD and other regions in the d02 (mainly EC-China), as well as regions outside the d02 (the boundary conditions, BCONs, of the d02) for O3 pollution in the PRD (hereafter denoted as the contributions of PRD, EC-China and BCONs, or SPRD, SEC-China and SBCON, respectively). For a pollutant, the contribution of a specific emission, Ei, can be calculated in the following two ways: (1) the difference between the modelled concentrations of the base case (all emissions involved) and the sensitivity case where Ei is zeroed out (i.e. top-down BFM), and (2) the difference between two sensitivity cases where emissions except Ei and all of the emissions are zeroed out, respectively (i.e. bottom-up BFM). Owing to the nonlinearity between O3 and its precursors, biases may occur between the results of the two types of BFM methods, leading to the nonadditivity of the results (Clappier et al., 2017). Therefore, the average of the top-down and bottom-up BFM results was treated as the quantified contributions of the concerned sources. A total of four simulation cases were run in this study, including the following (the modelled O3 concentration in each case is also marked in parentheses):
-
the base case (Cbase);
-
the PRD-cut case (CPRD_cut), where emissions within the PRD were zeroed out;
-
the PRD-only case (CPRD_only), where emissions outside the PRD (within d02) were zeroed out; and
-
the zero-emission case (C0), where all emissions within the d02 were zeroed out.
Afterwards, the SPRD, SEC-China and SBCON values (in concentrations) in the polluted areas of the PRD (where modelled daytime O3 concentrations > 160 µg m−3, the Grade II O3 MDA8 thresholds of the Chinese NAAQS) were calculated using the following equations:
The percentage forms of these values were used in the comparisons.
3.1 Overview: comparison of meteorological parameters in the PRD
First, we compared near-ground meteorological parameters in the PRD on the typhoon-induced and no-typhoon O3 pollution days. Near-surface parameters from routine monitoring data sets and the ERA-Interim reanalysis were used in the comparison. The parameters include air temperature, RH, wind speeds, cloud covers, PBL height and net surface solar radiation. Since there was no rainfall on most O3 pollution days (indicated by the weather in Guangzhou; Table S4), precipitation was not considered in the comparisons. For consistency, the parameters of ERA-Interim were extracted at the same time (14:00 LT) and the locations of sites (Fig. S1a) as those in routine monitoring. The Mann–Whitney U test was applied to determine whether the above parameters were significantly different (p < 0.05) between typhoon-induced and no-typhoon O3 pollution days.
Table 2The comparisons of meteorological parameters (all at 14:00 LT except for net surface solar radiation, which is the average value for 08:00–17:00 LT) in the PRD for the three (no-typhoon, typhoon-induced and close typhoon-induced) scenarios in two seasons (autumn and summer). RM – routine measurement; ERA – ERA-Interim reanalysis. All of the parameters are presented as the mean value ± standard deviation. The differences between parameters in the typhoon-induced or close typhoon-induced scenarios and the corresponding typhoon-induced scenarios for the same season are given in parentheses, and the asterisk (∗) indicates p < 0.05 or statistically significant differences between these parameters when the Mann–Whitney U test is used.

As is listed in Table 2, statistically significant differences between the typhoon-induced and no-typhoon scenarios existed for most of the parameters, such as meridional (south–north) wind speed, cloud covers within various height ranges and net surface solar radiation. In both seasons, these parameters were significantly different for the two scenarios. It indicates that the causes of O3 pollution may vary on typhoon-induced and no-typhoon O3 pollution days. Note that air temperature, one of the parameters most closely related to O3 pollution in the PRD (Zhao et al., 2019), was not significantly different in the two scenarios. We also found that the comparison in autumn and summer did not produce the same results. The typhoon-induced days in autumn featured lower RH, stronger winds (especially the north wind), reduced cloud cover (low, medium, high and total) and stronger surface solar radiation, whereas in summer, these days had higher RH, weaker south winds, more cloud cover (medium, high and total), weaker surface solar radiation and lower PBL heights. Therefore, the impact of typhoons on O3 pollution differs in the two seasons as well. In order to reveal the impact of typhoons on O3 transport, production and accumulation in the PRD, more detailed comparisons of the corresponding meteorological indicators are presented in the following sections.
3.2 O3 transport conditions: comparison of wind speeds, backward trajectories and vertical air motions
The higher the wind speeds and/or O3 levels in the transported air masses are, the more likely O3 transport plays an increasingly important role in O3 pollution. In the PRD, O3 levels are closely linked to the type of air masses influencing the region, which can be identified based on backward trajectories. According to Zheng et al. (2010), there are generally three types of air masses that are transported into the PRD along different paths and contribute to O3 pollution here, namely the continental, coastal and marine air masses (Fig. 3a). The continental and coastal air masses can bring O3 from EC-China to the PRD, and thus, they are typically recognised as being polluted and contributing to relatively high O3 levels in the PRD. In contrast, the marine air masses originating from the South China Sea are much cleaner. In this section, we studied the influence of typhoons on O3 transport by comparing wind speeds and 72 h backward trajectories in the typhoon-induced and no-typhoon scenarios.
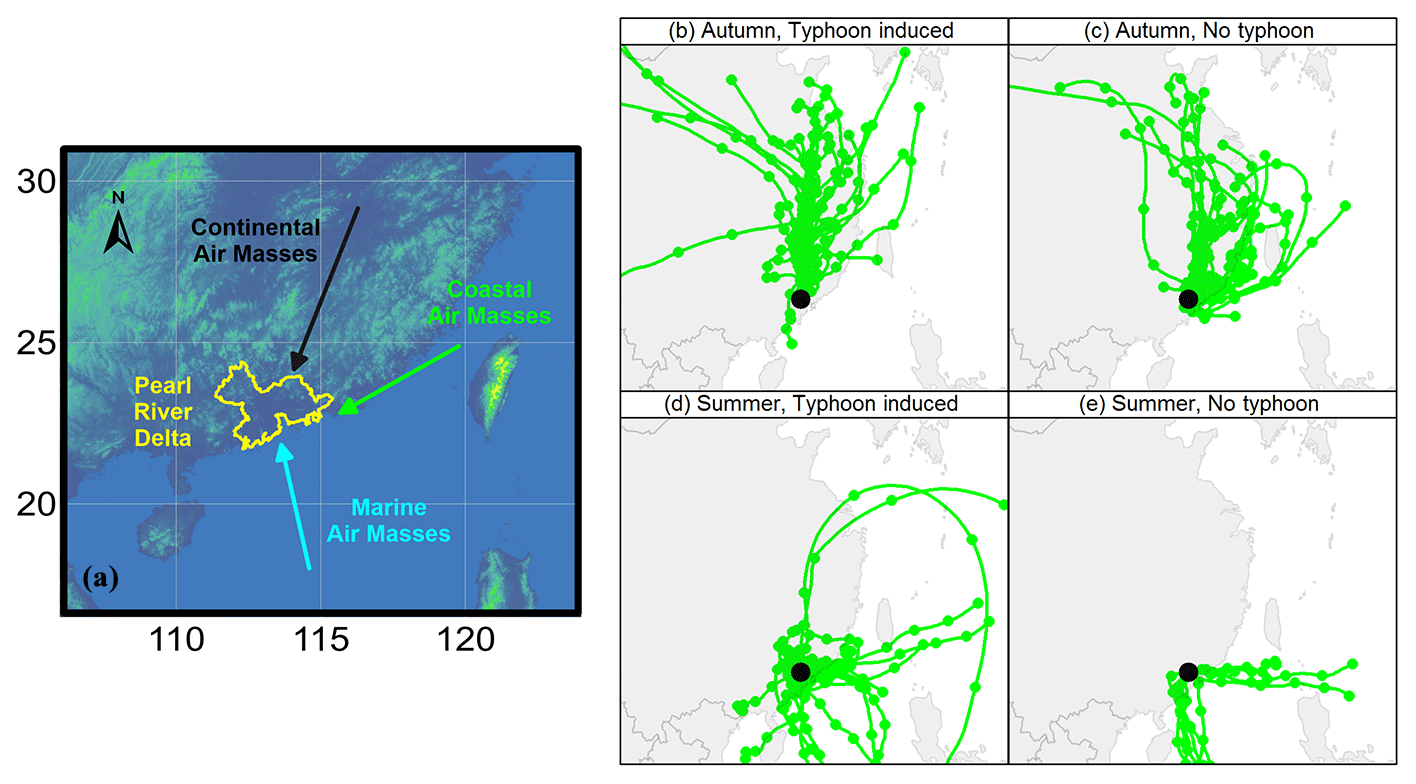
Figure 3(a) The three O3 transport paths towards the PRD. (b–e) Backward trajectories at 14:00 LT for each scenario, i.e. (b) autumn (typhoon-induced), (c) autumn (no-typhoon), (d) summer (typhoon-induced) and (e) summer (no-typhoon). The black dots indicate the end point of all trajectories, i.e. where the Modiesha site in the central PRD is located.
As is displayed in Fig. 3b–c, we identified the influence of continental air masses on the typhoon-induced O3 pollution days in autumn and mixed contributions from the continental and coastal air masses on the corresponding no-typhoon days. However, for the former scenario, significantly increased wind speeds (Table 2) ensure more favourable conditions for the transport of O3. In summer, the three types of air masses may all have affected O3 pollution in the typhoon-induced scenario, while only the marine air masses influenced the PRD in the no-typhoon scenario (Fig. 3d–e). The increasing influence of much more polluted air masses (continental and coastal air masses) led by typhoons ensured that more O3 was transported to the PRD; thus, typhoons also tended to increase the contribution of transport to O3 pollution in the PRD in summer. In addition, the influence of different air masses was also accompanied by variations in the prevailing winds in the PRD, i.e. north winds and easterlies in the typhoon-induced and no-typhoon scenarios in autumn, respectively, and southerly winds in the no-typhoon scenario in summer (indicated by the wind roses in Fig. S5). For the typhoon-induced scenario in summer, the dominate wind direction is hard to determine. These variations in the local wind fields potentially result in the different spatial distribution of O3 concentrations in various scenarios.

Figure 4The cross sections of mean vertical wind field at 14:00 LT for each scenario, i.e. (a) autumn (typhoon-induced), (b) autumn (no-typhoon), (c) summer (typhoon-induced) and (d) summer (no-typhoon). Cross sections were made along the 113.2∘ E longitude line, from 26.0 to 20.0∘ N (Fig. S4). The vectors indicate meridional wind speed (metres per second; hereafter m s−1) and vertical wind speed (centimetres per second; hereafter cm s−1), and the contours indicate vertical wind speed (cm s−1). PRD is the Pearl River Delta.
Downdraughts are typically considered to be an important cause of typhoon-induced O3 pollution (Lam, 2018), but in which scenarios downdraughts influence the PRD remains unclear. Thus, we explored the overall features of vertical air motions from the surface layer to the tropopause in the typhoon-induced and no-typhoon scenarios, and the ERA-Interim reanalysis data set (including all upper air parameters at multiple heights introduced in Sect. 2.1) was utilised in the comparisons. The contours in Fig. 4 show the cross sections of mean vertical wind speed at 14:00 LT of all O3 pollution days corresponding to the typhoon-induced and no-typhoon scenarios of two seasons, which were made along the 113.2∘ E longitude line, from 26.0 to 20.0∘ N (Fig. S4). On the typhoon-induced days in autumn, downdraughts occurred over large areas above the PRD, especially above a height of ∼ 700 hPa. Although updraughts can still be found near the sea surface in this scenario, vertical wind speeds tended to be lower compared with those on the no-typhoon days in autumn, which also suggests the enhancement of downdraughts caused by typhoons. In summer, the influence of downdraughts was found over the PRD under 850 hPa on the typhoon-induced O3 pollution days. However, overall, updraughts prevailed above the land areas and downdraughts prevailed above the sea in both the typhoon-induced and no-typhoon scenarios in summer, which is recognised as being the structure of the East Asian summer monsoon cell (Chen et al., 1964; Jin et al., 2013; Ding et al., 2018). For both updraughts and downdraughts, the absolute values of vertical wind speeds in the typhoon-induced scenario in summer were overall higher than those in the corresponding no-typhoon scenario. Therefore, the approach of typhoons did not break the structure of the summer monsoon cell, but instead, they further strengthened the vertical motions above both land areas and sea. These analyses suggest that typhoons do not necessarily lead to downdraughts during O3 pollution periods in the PRD and its adjacent areas. In summer, vertical air motions affected by typhoons are more complicated than expected, owing to the existence of the East Asian summer monsoon.

Figure 5O3 mixing ratio (ppbv – parts per billion by volume) and wind fields at the height of (a–d) 850 hPa, (e–h) 700 hPa and (i–l) 500 hPa at 14:00 LT for each scenario, i.e. (a, e, i) autumn (typhoon-induced), (b, f, j) autumn (no-typhoon), (c, g, k) summer (typhoon-induced) and (d, h, l) summer (no-typhoon). The red triangle in each plot indicates the PRD. The gridded areas indicate that vertical wind speed is less than zero or where downdraughts occur.
We also explored the regions in which downdraughts and updraughts occurred on a larger scale and their potential connections with O3 levels. As is shown in Fig. 5, though updraughts appeared in the PRD at 850 hPa on the typhoon-induced days in autumn, downdraughts dominated in the region at 700 and 500 hPa. For the areas to the north of the PRD, the important role of downdraughts was found at all three heights. In contrast to the no-typhoon days in autumn, downdraughts tended to cover much larger areas in this scenario. Moreover, these areas at 850 and 700 hPa generally featured higher O3 mixing ratios as well as lower RH (Fig. S6) than others, which is a sign of possible direct downward O3 transport (Roux et al., 2020; Wang et al., 2020). This part of O3 can notably aggravate near-ground O3 pollution in the PRD. In contrast, in summer, updraughts dominated the PRD at various heights in both scenarios. Besides the PRD, most of the regions near the coast were characterised by updraughts above the land and downdraughts offshore, further indicating the ubiquity of the summer monsoon cell. By comparing the two scenarios in summer, we found that typhoons resulted in more areas being influenced by updraughts. The areas with high O3 levels did not coincide with the downdraught-affected areas, and therefore, O3 transported from the upper air may play a less significant role in the typhoon-induced O3 pollution in summer.
3.3 O3 production conditions: comparison of clouds
Clouds efficiently reflect solar radiation (Liou, 1976), and therefore, they have a notable impact on the local formation of O3. Figure 6 displays the cross sections of mean ERA-Interim cloud liquid water contents (CLWCs) at 14:00 LT of all O3 pollution days corresponding to the typhoon-induced and no-typhoon scenarios of two seasons, which were also made along the 113.2∘ E longitude line, from 26.0 to 20.0∘ N (Fig. S4). The comparison of CLWCs in the cross sections suggests that typhoons generally resulted in fewer clouds in autumn but more clouds in summer, which agrees well with the comparison of cloud covers in Table 2. The presence of fewer clouds on the typhoon-induced days in autumn can be attributed to the following two reasons: the influence of dry air masses (indicated by the lower RH in Table 2 and Fig. S6) and/or the hindrance of cloud formation by downdraughts. In summer, the strengthened updraughts above the land caused by typhoons favoured cloud formation, which is demonstrated by higher CLWCs at the heights of 500–850 hPa and increases in medium and high cloud covers. In areas above the PRD below 850 hPa, downdraughts led to slight decrease in clouds in the typhoon-induced scenario in summer, which is also indicated by reduced low cloud cover. As a consequence of varied cloud covers in each scenario, on average, net surface solar radiation increased by 13 % and decreased by 7 % on the typhoon-induced days in autumn and summer, respectively (Table 2), which promoted and hindered O3 production in the PRD during these two seasons, respectively.
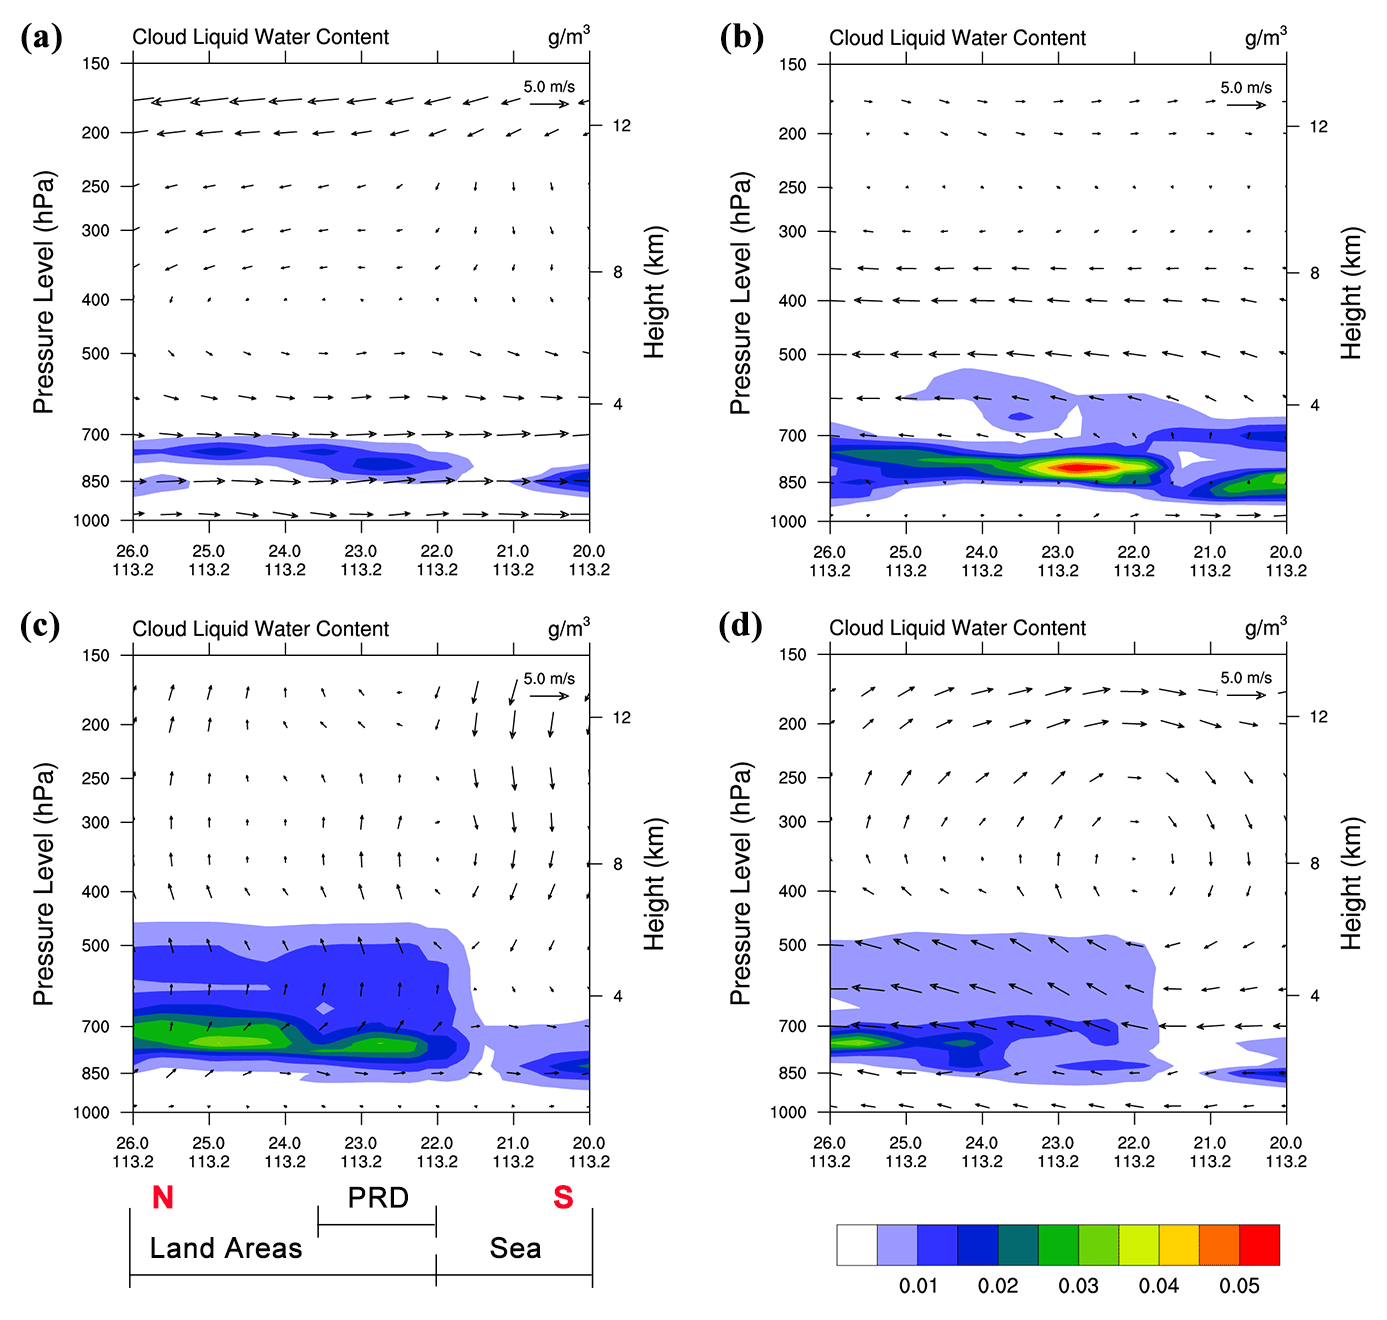
Figure 6The cross sections of mean cloud liquid water content (grams per cubic metre; hereafter g m−3) and wind vectors at 14:00 LT for each scenario, i.e. (a) autumn (typhoon-induced), (b) autumn (no-typhoon), (c) summer (typhoon-induced) and (d) summer (no-typhoon). Cross sections were made along the 113.2∘ E longitude line, from 26.0 to 20.0∘ N (Fig. S4). The vectors indicate meridional wind speed (m s−1) and vertical wind speed (cm s−1). PRD is the Pearl River Delta.
3.4 O3 accumulation conditions: comparison of APRTs
The longer the APRTs are, the more likely it is that the O3 produced by local emissions accumulates within the targeted region and notably contributes to near-ground O3 pollution. In order to study the effect of typhoons on O3 accumulation, we calculated APRTs in the PRD in the typhoon-induced and no-typhoon scenarios (Fig. 7) for further comparison. On the typhoon-induced days in autumn, APRTs were typically 5–10 h (mean = 9.5 h), which is shorter than those on the no-typhoon days in autumn (mean = 13.1 h). In addition, lower APRT values occurred in the central part of the PRD, where high anthropogenic emissions of pollutants are distributed (Zheng et al., 2009). Despite the more active O3 chemistry discussed in the last section, locally sourced O3 was less likely to accumulate within the PRD in this scenario, potentially limiting the contribution of local emissions for O3. The comparison suggests the opposite results in the summer scenarios, i.e. APRTs on the typhoon-induced days (20–30 h; mean = 21.0 h) were higher overall than those on the no-typhoon days (15–25 h; mean = 16.5 h). This favoured the accumulation of locally sourced O3. Based on the comparisons in this and the previous section, typhoons did not provide more favourable conditions for O3 production and accumulation simultaneously in the PRD in both autumn and summer, thus potentially resulting in reduced contributions (in terms of the percentage) of local emissions to O3 pollution here. More quantitative evaluations of the contributions from multiple O3 sources are discussed in Sect. 4.
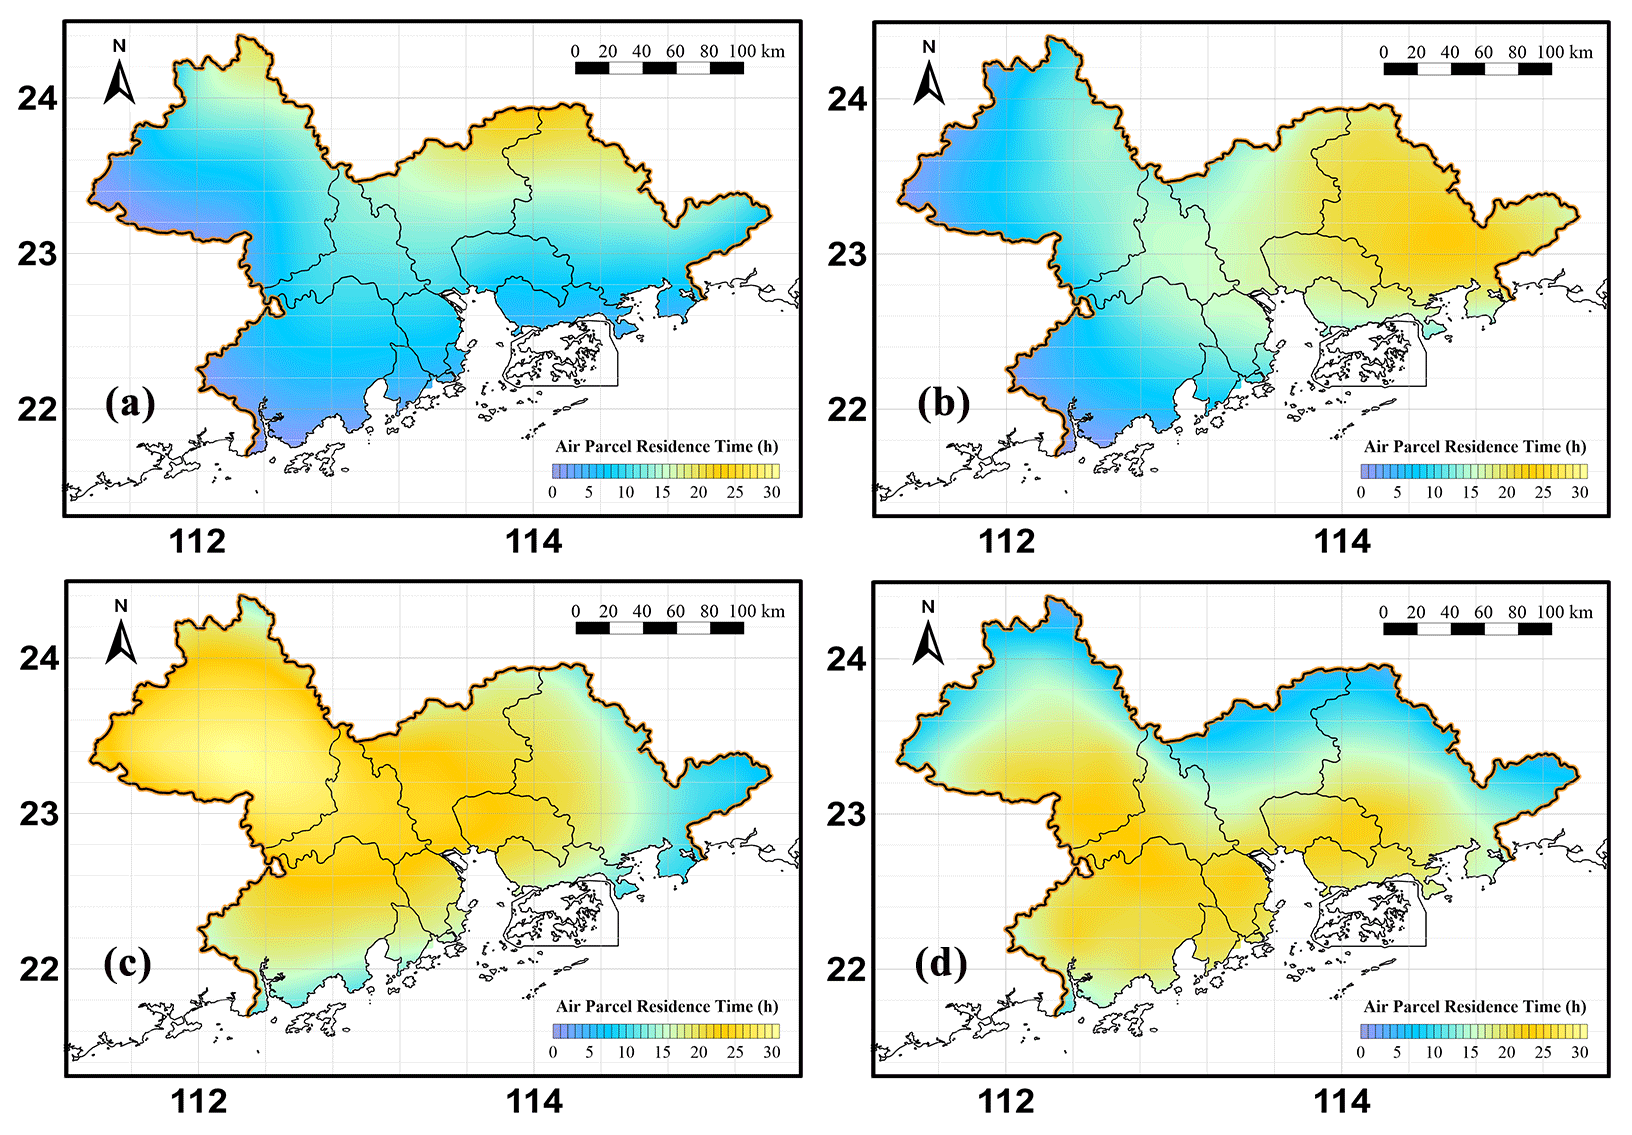
Figure 7The spatial distributions of APRTs in the PRD for each scenario, i.e. (a) autumn (typhoon-induced), (b) autumn (no-typhoon), (c) summer (typhoon-induced) and (d) summer (no-typhoon).
3.5 Meteorological conditions on the close typhoon-induced days
On the close typhoon-induced days in the two seasons, stronger north winds prevailed and total cloud cover was higher than that on the no-typhoon days (Table 2), suggesting better conditions for the transport of O3 but less favourable conditions for O3 production. As displayed in Fig. S7, the APRT values were significantly lower on the close typhoon-induced days (mean = 6.6 h and 12.9 h in autumn and summer, respectively) than on the no-typhoon days, making it even harder for locally sourced O3 to accumulate within the PRD. Therefore, close typhoons are concluded to promote the transport of O3 from the outside and to reduce the contributions of O3 produced from local emissions in a more notable way. In addition, close typhoons led to stronger downdraughts in autumn and updraughts in summer than for other scenarios in the same season (Fig. S8). It should be noted that the structure of the summer monsoon cell near the PRD was destroyed in the close typhoon-induced scenario in summer, indicating the stronger influence of typhoons on regional wind fields. The dominant role of O3 transport during O3 pollution days in this special scenario agrees well with the reported episode-based analyses (Lam et al., 2005; Li, 2013).
The comparisons of meteorological conditions served as qualitative evidence to determine the general influence of typhoons on O3 transport, production and accumulation in autumn and summer. Based on the comparison between the CMAQ modelling results on the typical O3 pollution days in October 2015 and July 2016, more quantitative evidence can be presented. Figure 8 displays modelled mean O3 MDA8 concentrations and wind fields (at 14:00 LT) on the typhoon-induced and no-typhoon O3 pollution days of two seasons. Large standard-exceedance (> 160 µg m−3) areas were distributed in the PRD on most days, and the typhoon-induced days of both seasons generally featured higher O3 levels. The distinct wind fields for these scenarios, which were consistent with those in the longer time span (Fig. S5), indeed led to different spatial distributions of O3. Generally, the most severe O3 pollution occurred in the downwind areas, such as the central and southern parts of the PRD on the typhoon-induced days in October 2015, the central PRD on the no-typhoon days in October 2015 and the northern and eastern PRD on the no-typhoon days in July 2016. On the typhoon-induced days in July 2016, high levels of O3 accumulated around the Pearl River Estuary (PRE). In this section, we discuss the different contributions of various O3 processes and sources on these days to better understand the effect of typhoons on O3 pollution in the PRD.
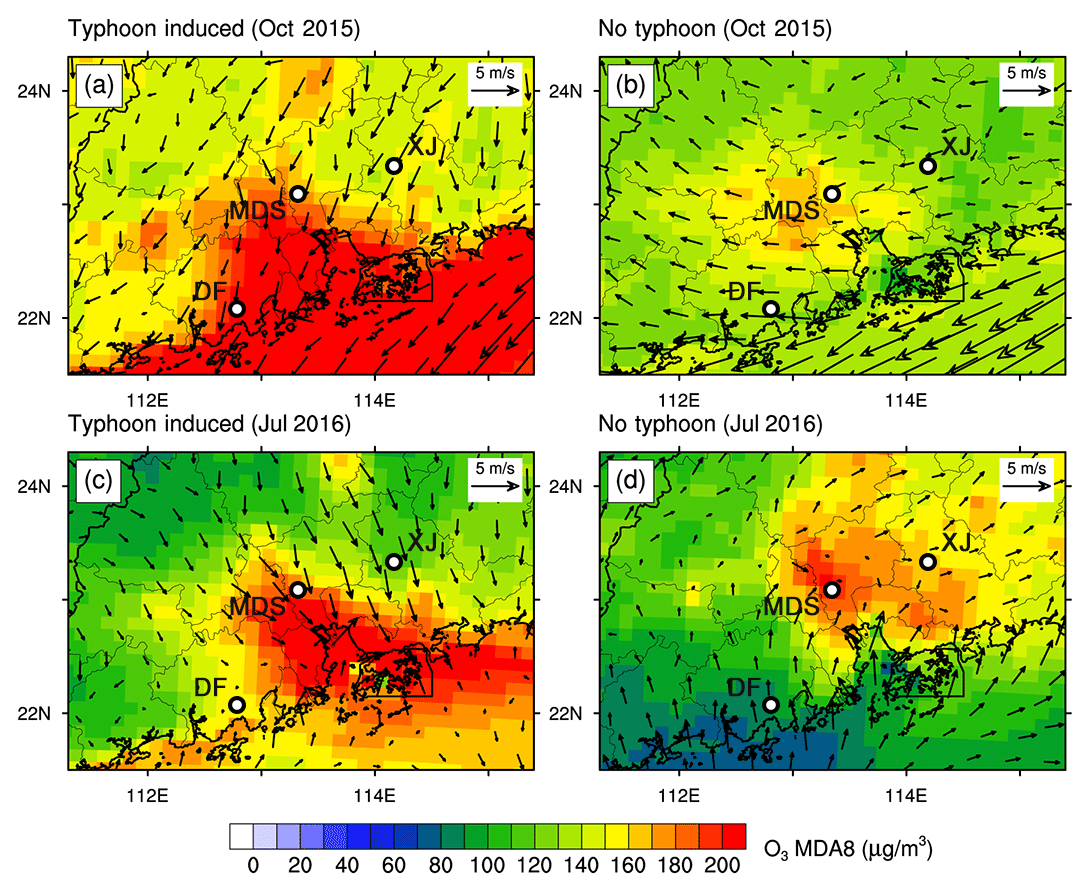
Figure 8Modelling mean O3 MDA8 concentrations (micrograms per cubic metre; hereafter µg m−3) and wind vectors (at 14:00 LT) on the representative O3 pollution days. (a) The typhoon-induced days in October 2015 (14–16 and 21 October 2015). (b) The no-typhoon days in October 2015 (28 October and 3–5 November 2015). (c) The typhoon-induced days in July 2016 (7–8 and 30–31 July 2016). (d) The no-typhoon days in July 2016 (22–26 and 29 July 2016). Three representative sites in the PRD are shown as black circles in the plots: XJ – Xijiao; MDS – Modiesha; DF – Duanfen.
4.1 O3 processes: transport vs. chemical process
The PA tool in CMAQ was used to quantify the contributions of transport and chemical process to the O3 variations on the O3 pollution days in October 2015 and July 2016. As is shown in Fig. 9, the daytime (09:00–17:00 LT) O3 PA results within the PRD in all scenarios share similar characteristics. Dry deposition dominated O3 removal near the surface, and it also led to high gradients of O3 concentrations that promote downward O3 diffusion. Within the PBL (about 0–1 km in height), O3 was mainly contributed by horizontal transport and chemical processes, and vertical convection led to the drop in O3 concentrations. However, differences existed between the O3 PA results in the typhoon-induced and no-typhoon scenarios, indicating the impact of typhoons on the transport and production of O3. In both months, typhoons led to a notably higher contribution of horizontal transport to O3, especially in the lower and middle part of the PBL. Within the PBL, on average, it increased from −0.9 and −0.8 ppb h−1 to 1.2 and 2.0 ppb h−1 under typhoon influence in autumn and summer, respectively (where ppb is parts per billion). The comparison of the contribution of chemical processes (in absolute rates) suggests that they had opposite effects in the 2 months. Under typhoons, the contribution increased in October 2015 (from 4.0 to 4.5 ppb h−1 or by 11.4 % within the PBL), but it decreased in July 2016 (from 7.1 to 5.7 ppb h−1 or by −20.8 % within the PBL). In other words, typhoons promoted and hindered O3 production in autumn and summer, respectively. These results agree well with the comparisons of O3 transport and production conditions in the previous section.
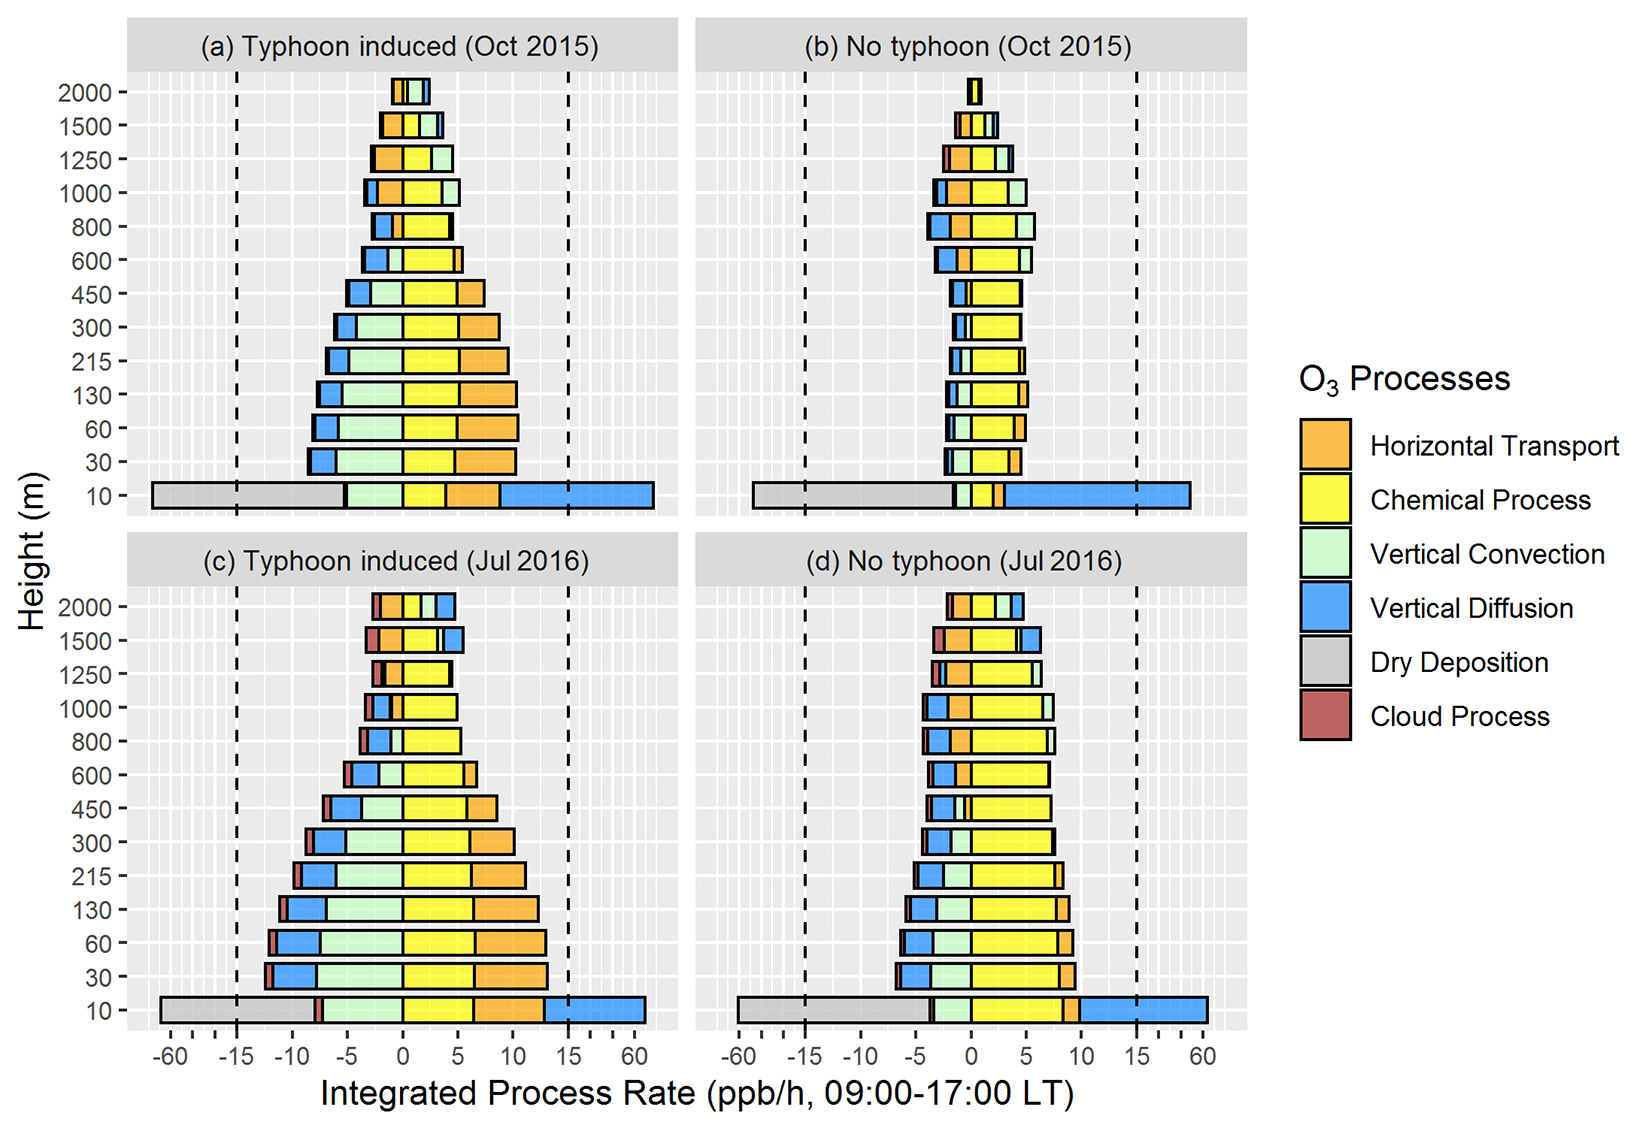
Figure 9The daytime mean (09:00–17:00 LT) hourly contributions of O3 processes within the PRD in vertical layers 1–13 on representative O3 pollution days. (a) The typhoon-induced days in October 2015 (14–16 and 21 October 2015). (b) The no-typhoon days in October 2015 (28 October and 3–5 November 2015). (c) The typhoon-induced days in July 2016 (7–8 and 30–31 July 2016). (d) The no-typhoon days in July 2016 (22–26 and 29 July 2016).
4.2 O3 sources: local sources vs. regional sources
The contributions of various sources to O3 within the PRD are determined by the combined impact of O3 transport, production and accumulation. The results for mean daytime (09:00–17:00 LT) O3 SA near the ground (about 0–80 m in height) on typhoon-induced and no-typhoon O3 pollution days are illustrated in Fig. 10. For polluted regions within the PRD, stronger O3 production under typhoons did not lead to a higher proportion of local contributions to O3 pollution in October 2015 – it even decreased from 22 % (on no-typhoon days) to 17 % (on typhoon-induced days). The contributions of EC-China emissions and BCONs, in contrast, increased slightly from 37 % and 41 % to 40 % and 43 %, respectively. The distinction in the O3 SA results is more apparent for the summer scenarios, i.e. typhoons resulted in growing contributions from O3 transported from other regions (from 40 % to 59 %) but decreased local contributions (from 60 % to 41 %) in July 2016. More favourable O3 accumulation conditions (indicated by higher APRTs on the representative typhoon-induced O3 pollution days in summer; Fig. S9) were far from sufficient to compensate for the effect of weakened O3 production on the high contributions of local sources.
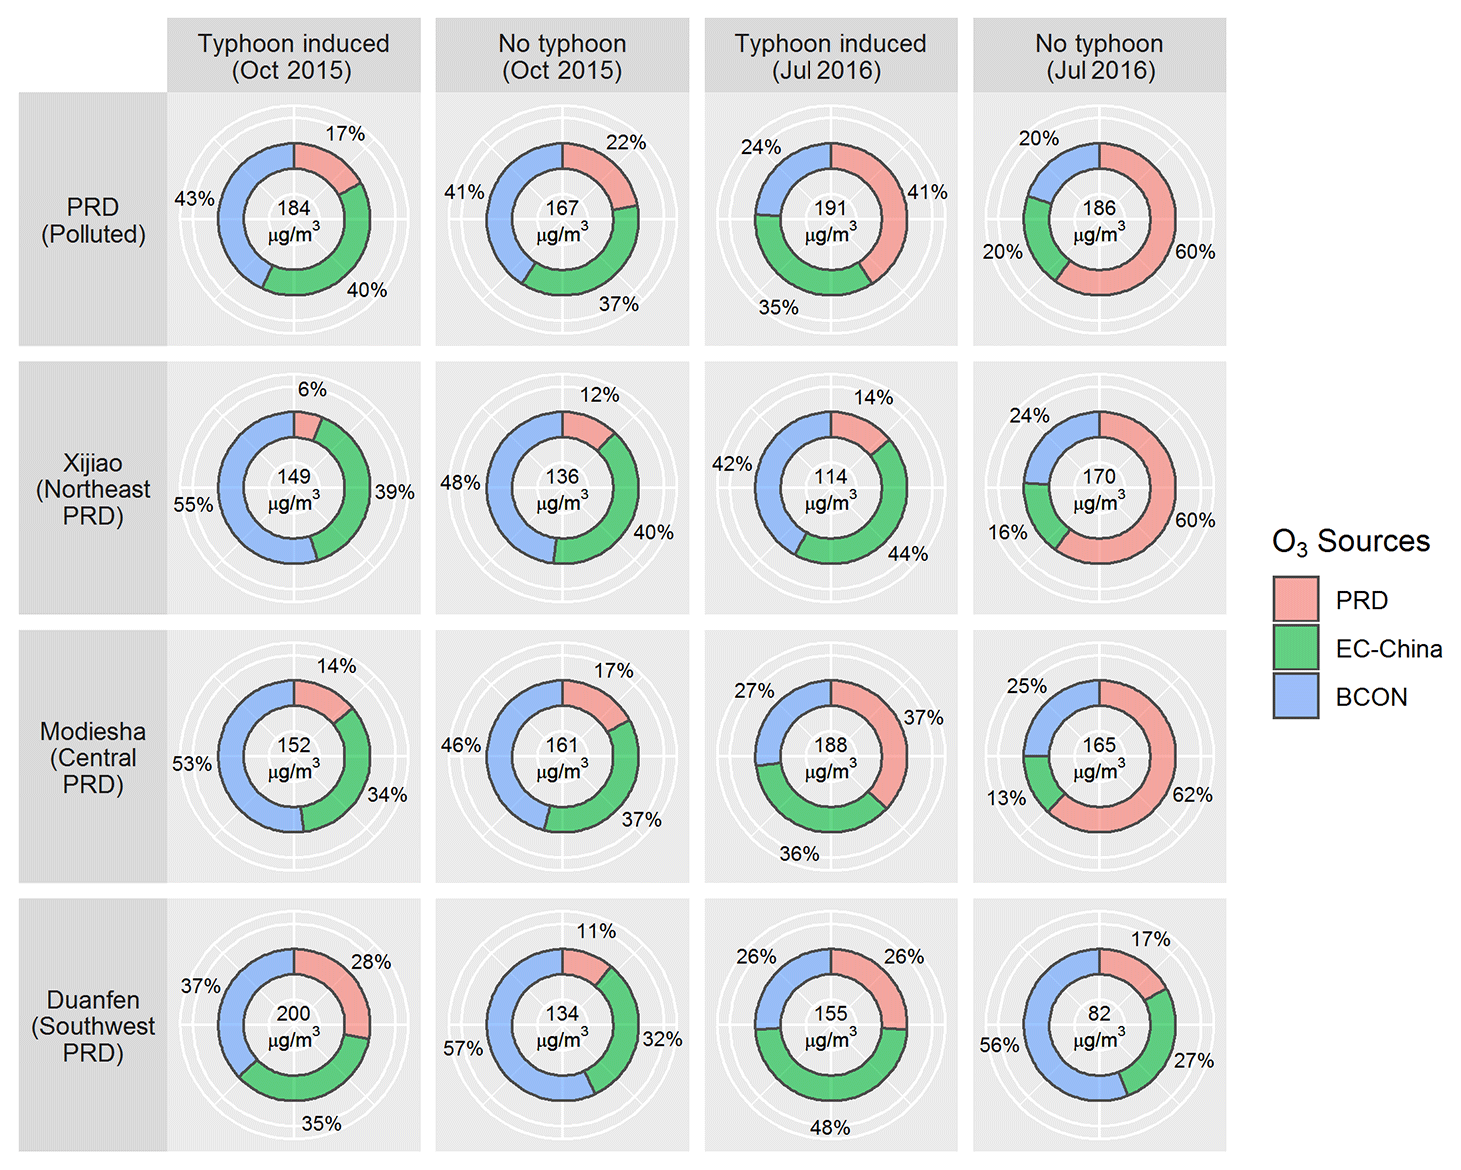
Figure 10The mean O3 SA near the ground (about 0–80 m in height) on the represented typhoon-induced and no-typhoon O3 pollution days in October 2015 and July 2016 (the average results of 09:00–17:00 LT). The locations of the three representative sites (Xijiao, Modiesha and Duanfen) are shown in Fig. 8. PRD is the Pearl River Delta; EC-China is eastern and central China; BCON is the boundary condition of the d02 modelling.
Furthermore, owing to the variations in wind fields, the comparison results of O3 SA in different parts of the PRD may differ from the regional ones. For instance, while the comparisons of O3 SA in the Xijiao and Modiesha sites (located in the northeastern and central parts of the PRD, respectively) agree well with those in the polluted regions of the PRD, higher contributions of PRD emissions for O3 can be found in the Duanfen site (located in the southwestern part of the PRD) on the typhoon-induced days of the 2 months in comparison to those on the corresponding no-typhoon days (Fig. 10). Since the site was located in the downwind region in the typhoon-induced scenario in October 2015 (Fig. 8a), enhanced O3 production led by typhoons from the massive emissions of O3 precursors in the central PRD (Zheng et al., 2009) contributed to higher local contributions for O3 pollution here (as the distribution of local contributions, in percentage, to the daytime O3 shown in Fig. S10, the highest local contribution in the PRD occurred in areas near the Duanfen site and almost reached 40 % in this scenario, which was even higher than that in the corresponding no-typhoon scenario, which was 33 %). In the no-typhoon scenario in July 2016, the site was located in the upwind regions under the prevailing southerly winds, limiting the contributions of local emissions for O3 at the site (Fig. 8d). Thus, higher local contributions can also be found in the typhoon-induced scenario in this month.
The significance of typhoons for O3 pollution in the PRD calls for thorough evaluations of the different causes of O3 pollution with the appearance of typhoons in the Northwest Pacific. In this study, we revealed the different impacts of typhoons on O3 transport, production and accumulation in the PRD (as summarised in Fig. 11) through systematic comparisons of meteorological conditions and the contributions of various O3 processes and sources in the typhoon-induced and no-typhoon scenarios. We found that typhoons tended to promote O3 transport towards the PRD but failed to provide more favourable O3 production and accumulation conditions simultaneously, which limited the contribution of local emissions to O3 pollution. Furthermore, there were also differences between the influence of typhoons on O3 pollution in autumn and summer. More favourable transport conditions occurred in the typhoon-induced scenario in autumn, which was characterised by higher wind speeds and the increased influence of downdraughts. In summer, the mixed types of air masses in the typhoon-induced scenario were likely to bring more O3 into the PRD than the clean marine air masses in the no-typhoon scenario, also suggesting enhanced O3 transport under the influence of typhoons. Generally, typhoons led to cloudless conditions, stronger solar radiation and, thus, more rapid O3 production in autumn, but shorter APRTs (5–10 h) suggest that locally sourced O3 was hard to accumulate within the PRD. As a result, the contributions, in percentage of local emissions to O3 pollution, decreased slightly (by ∼ 5 % for the polluted regions of the PRD in October 2015). In contrast, in summer, intensified updraughts associated with typhoons strengthened cloud formation, weakened solar radiation and, thus, restrained local O3 production. Longer APRTs (> 20 h) under typhoon influence were far from sufficient to maintain high contributions of local emissions for O3 pollution (which decreased by ∼ 20 % for the polluted regions of the PRD in July 2016). However, due to the variations in wind fields under different scenarios, the changes in local and transport contributions for O3 led by typhoons were different in the southwestern part of the PRD, i.e. higher contributions from emissions within the PRD and reduced transport contributions occurred in the typhoon-induced scenarios in both seasons. As for the close typhoon-induced scenario, O3 transport was further strengthened, but meteorological conditions in the PRD became less favourable for both the production and accumulation of O3.
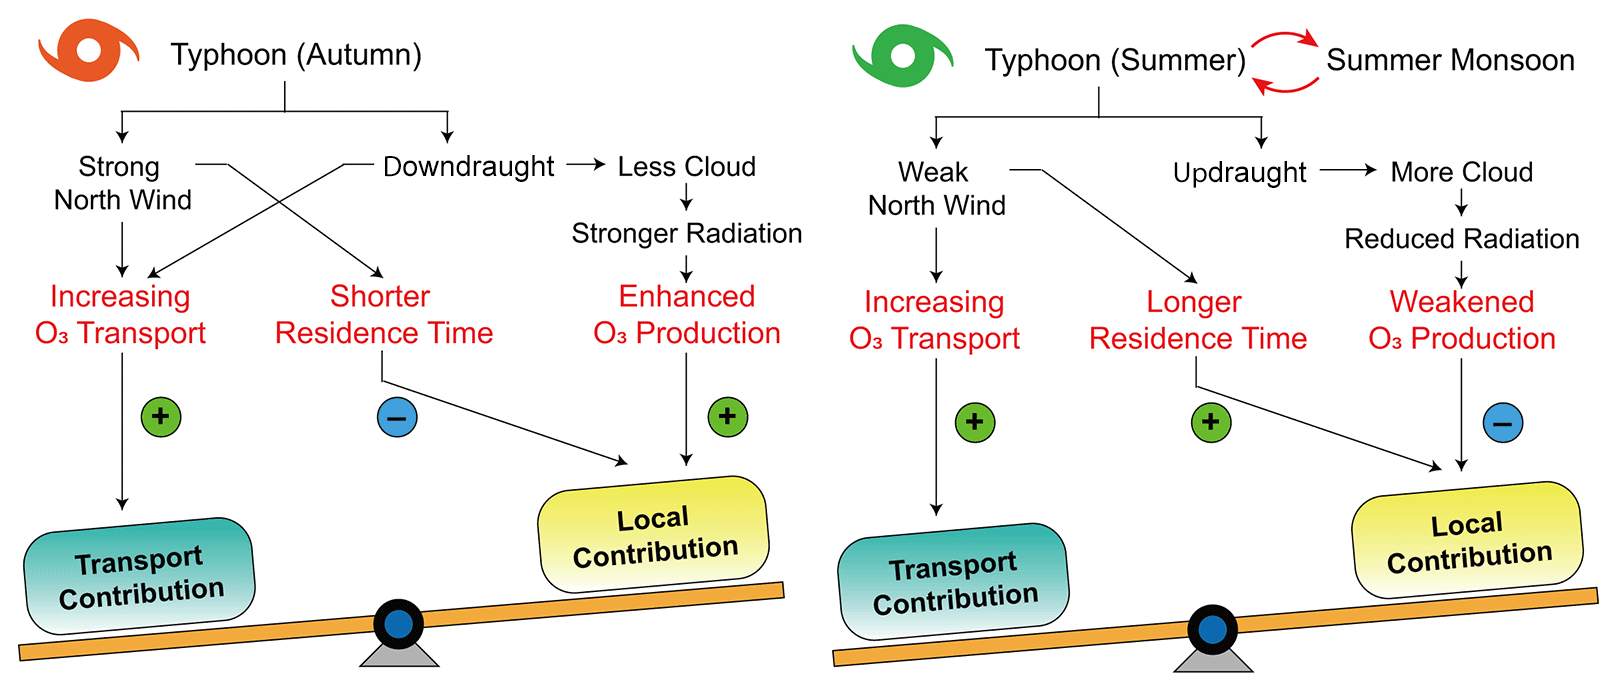
Figure 11The summary of the causes of O3 pollution in the PRD under typhoon influence in autumn (left) and summer (right).
The East Asian monsoon, changing with seasons, has a pronounced impact on local meteorological conditions and the characteristics of O3 pollution in East China (He et al., 2008). The seasonal behaviour of the East Asian monsoon is likely to result in the seasonally varied effect of typhoons on O3 pollution in the PRD. In October, the summer monsoon has almost finished its retraction and the winter monsoon is beginning (Ding, 1994). Thus, there are not many obstacles to the southward movement of typhoon periphery and the transport of O3 towards the PRD by the continental and coastal air masses. Large downdraught-influenced areas in central and southern China occur in this scenario, and high O3 levels and low RH in these areas indicate the potentially important role of direct downward O3 transport. In July, the summer monsoon reaches its strongest point (Ding, 1994). The interaction between typhoon periphery and the summer monsoon results in stagnation and enhanced updraughts above the land areas of the PRD and its surroundings. Only when the typhoon is close enough to the PRD is the stagnation terminated and the structure of the summer monsoon cell broken. This also explains why some summertime typhoon-induced O3 episodes in the PRD can be typically divided into two periods as stagnation leads to the accumulation of locally produced O3 in the first phase and strong northerly winds strengthen O3 transport before the landing of typhoons (Lam et al., 2005; Li, 2013). It should be noted that updraughts, rather than downdraughts, prevailed on typhoon-induced O3 pollution days in summer. High levels of O3 did not necessarily occur in the regions dominated by downdraughts in this scenario, suggesting a less notable connection between downdraughts and summertime O3 pollution in the PRD. Further investigations are required to trace the detailed process of downward O3 transport, including the stratosphere–troposphere exchange (Stohl et al., 2003) in each scenario, and to quantify their contributions to near-ground O3 pollution.
Some limitations remain in this study. We chose O3 pollution days as individual samples, ignoring the influence of O3 pollution on the previous days. Thus, more detailed full-episode analyses are required. Moreover, owing to the small sampling size, the influence of typhoons on O3 pollution in the PRD is still not fully understood, including, for instance, the detailed connections between the features of typhoons (intensity and position) and O3 pollution. However, the comparisons of meteorological conditions, O3 processes and sources in different scenarios and seasons demonstrate the complex causes of typhoon-induced O3 pollution in the PRD – typhoons tend to enhance O3 transport into the PRD in both seasons, but their impacts on the production and accumulation of O3 are completely different. As a result, emissions within (outside of) the PRD are likely to contribute less (more) on typhoon-induced O3 pollution days than on no-typhoon days. In order to effectively alleviate O3 pollution and to reduce exposure to the population in the PRD, more attention should be paid to controlling anthropogenic emissions of O3 precursors on a larger scale rather than focusing on local emissions under typhoon influence. For air quality management, it is suggested that the response of O3 levels in the PRD to fractional local and nonlocal emission reductions be comprehensively evaluated so as to find the most effective strategies to alleviate O3 pollution in different scenarios (Thunis et al., 2019, 2020). This study also suggests that a thorough evaluation of O3 transport, production and accumulation conditions can be applied to understand the causes of regional O3 pollution – not only in the PRD but also in other regions. The results will help us find efficient strategies to alleviate regional O3 pollution and to reduce its adverse effects.
Data are available from the corresponding author upon request.
The supplement related to this article is available online at: https://doi.org/10.5194/acp-21-11593-2021-supplement.
KQ, XW and YZ designed the study. KQ, XW, and TX did the simulation work, including the operation of the WRF, SMOKE and CMAQ models. JS, HD, LZ and YZ provided the observational results of field campaigns and the routine monitoring data sets for the evaluation of model performance. KQ, XW, YY and YZ analysed the modelling results. KQ, XW, YY and YZ wrote and revised this paper, with critical feedback from all other authors.
The authors declare that they have no conflict of interest.
Publisher’s note: Copernicus Publications remains neutral with regard to jurisdictional claims in published maps and institutional affiliations.
The authors are grateful to Xavier Querol and four anonymous referees for their constructive comments on the manuscript. The authors thank the support by the National Key Research and Development Program of China and the National Science and Technology Pillar Program of China.
This research has been supported by the National Key Research and Development Program of China (grant nos. 2018YFC0213204, 2018YFC0213506, and 2018YFC0213501) and the National Science and Technology Pillar Program of China (grant no. 2014BAC21B01).
This paper was edited by Xavier Querol and reviewed by four anonymous referees.
Berrisford, P., Dee, D., Poli, P., Brugge, R., Fielding, K., Fuentes, M., Kallberg, P., Kobayashi, S., Uppala, S., and Simmons, A.: The ERA-Interim archive Version 2.0, ERA report series, 1, 1–16, 2011.
Carter, W. P. L.: Development of the SAPRC-07 chemical mechanism, Atmos. Environ., 44, 5324–5335, https://doi.org/10.1016/j.atmosenv.2010.01.026, 2010.
Chen, H., Wang, X., Shen, J., Lu, K., and Zhang, Y.: Ozone source apportionment of typical photochemical pollution episodes in the Pearl River Delta in autumn, Acta Scientiarum Naturalium Universitatis Pekinensis, 51, 620–630, https://doi.org/10.13209/j.0479-8023.2015.089, 2015 (in Chinese).
Chen, Q., Miao, J., and Li, W.: A comparison of mean wind field and mean meridional circulation between south-west monsoon area in Southeast Asia and Pacific trade wind area in July, 1958, Acta Meteorol. Sin., 34, 51–61, https://doi.org/10.11676/qxxb1964.006, 1964 (in Chinese).
Chen, X., Liu, Y., Lai, A., Han, S., Fan, Q., Wang, X., Ling, Z., Huang, F., and Fan, S.: Factors dominating 3-dimensional ozone distribution during high tropospheric ozone period, Environ. Pollut., 232, 55–64, https://doi.org/10.1016/j.envpol.2017.09.017, 2018.
Chow, E. C., Li, R. C., and Zhou, W.: Influence of tropical cyclones on Hong Kong air quality, Adv. Atmos. Sci., 35, 1177–1188, https://doi.org/10.1007/s00376-018-7225-4, 2018.
Chow, E. C., Wen, M., Li, L., Leung, M. Y., Cheung, P. K., and Zhou, W.: Assessment of the Environmental and Societal Impacts of the Category-3 Typhoon Hato, Atmosphere, 10, 296, https://doi.org/10.3390/atmos10060296, 2019.
Clappier, A., Belis, C. A., Pernigotti, D., and Thunis, P.: Source apportionment and sensitivity analysis: two methodologies with two different purposes, Geosci. Model Dev., 10, 4245–4256, https://doi.org/10.5194/gmd-10-4245-2017, 2017.
Dee, D. P., Uppala, S. M., Simmons, A. J., Berrisford, P., Poli, P., Kobayashi, S., Andrae, U., Balmaseda, M. A., Balsamo, G., Bauer, P., Bechtold, P., Beijaars, A.C.M., van de Berg, L., Bidiot, J., Bormann, N., Delsol, C., Dragani, R., Fuentes, M., Geer, A.J., Haimberger, L., Healy, S.B., Hersbach, H., Hólm, E.V., Isaksen, L., Isaksen, L., Kållberg, P., Köhler, M., Matricardi, M., McNally, A.P., Monge-Sanz, B.M., Morcrette, J.-J., Park, B.-K., Peubey, C., de Rosnay, P., Tavolato, Thépaut, J.-N., and Vitart, F.: The ERA-Interim reanalysis: Configuration and performance of the data assimilation system, Q. J. Roy. Meteor. Soc., 137, 553–597, https://doi.org/10.1002/qj.828, 2011.
Deng, T., Wang, T., Wang, S., Zou, Y., Yin, C., Li, F., Liu, L., Wang, N., Song, L., Wu, C., and Wu, D.: Impact of typhoon periphery on high ozone and high aerosol pollution in the Pearl River Delta region, Sci. Total Environ., 668, 617–630, https://doi.org/10.1016/j.scitotenv.2019.02.450, 2019.
Ding, Y., Si, D., Liu, Y., Wang, Z., Li, Y., Zhao, L., and Song, Y.: On the Characteristics, Driving Forces and Inter-decadal Variability of the East Asian Summer Monsoon, Chinese Journal of Atmospheric Sciences, 42, 533–558, https://doi.org/10.3878/j.issn.1006-9895.1712.17261, 2018 (in Chinese).
Ding, Y. H.: Monsoons over China, Kluwer Academic Publishers, Dordrecht, the Netherlands, Boston, USA, London, UK, 1994.
Feng, Y., Ning, M., Lei, Y., Sun, Y., Liu, W., and Wang, J.: Defending blue sky in China: Effectiveness of the “Air Pollution Prevention and Control Action Plan” on air quality improvements from 2013 to 2017, J. Environ. Manage., 252, 109603, https://doi.org/10.1016/j.jenvman.2019.109603, 2019.
Gao, X., Deng, X., Tan, H., Wang, C., Wang, N., and Yue, D.: Characteristics and analysis on regional pollution process and circulation weather types over Guangdong Province, Acta Scientiae Circumstantiae, 38, 1708–1716, https://doi.org/10.13671/j.hjkxxb.2017.0473, 2018 (in Chinese).
Guo, J., Miao, Y., Zhang, Y., Liu, H., Li, Z., Zhang, W., He, J., Lou, M., Yan, Y., Bian, L., and Zhai, P.: The climatology of planetary boundary layer height in China derived from radiosonde and reanalysis data, Atmos. Chem. Phys., 16, 13309–13319, https://doi.org/10.5194/acp-16-13309-2016, 2016.
He, K.: Multi-resolution Emission Inventory for China (MEIC): model framework and 1990-2010 anthropogenic emissions, American Geophysical Union, Fall Meeting 2012, 3–7 December 2012, San Francisco, USA, A32B-05, 2012.
He, Y. J., Uno, I., Wang, Z. F., Pochanart, P., Li, J., and Akimoto, H.: Significant impact of the East Asia monsoon on ozone seasonal behavior in the boundary layer of Eastern China and the west Pacific region, Atmos. Chem. Phys., 8, 7543–7555, https://doi.org/10.5194/acp-8-7543-2008, 2008.
Huang, J. P., Fung, J. C., Lau, A. K., and Qin, Y: Numerical simulation and process analysis of typhoon-related ozone episodes in Hong Kong, J. Geophys. Res.-Atmos., 110, D05301, https://doi.org/10.1029/2004JD004914, 2005.
Huang, Y., Yao, T., Fung, J. C., Lu, X., and Lau, A. K.: Application of air parcel residence time analysis for air pollution prevention and control policy in the Pearl River Delta region, Sci. Total Environ., 658, 744–752, https://doi.org/10.1016/j.scitotenv.2018.12.205, 2019.
Jin, Q., Yang, X. Q., Sun, X. G., and Fang, J. B.: East Asian summer monsoon circulation structure controlled by feedback of condensational heating, Clim. Dynam., 41, 1885–1897, https://doi.org/10.1007/s00382-012-1620-9, 2013.
Jiang, F., Wang, T., Wang, T., Xie, M., and Zhao, H.: Numerical modeling of a continuous photochemical pollution episode in Hong Kong using WRF–chem, Atmos. Environ., 42, 8717–8727, https://doi.org/10.1016/j.atmosenv.2008.08.034, 2008.
Lam, K. S., Wang, T. J., Wu, C. L., and Li, Y. S.: Study on an ozone episode in hot season in Hong Kong and transboundary air pollution over Pearl River Delta region of China, Atmos. Environ., 39, 1967–1977, https://doi.org/10.1016/j.atmosenv.2004.11.023, 2005.
Lam, Y. F.: Climate change and air quality in Southeastern China: Hong Kong study, in: Climate change and air pollution, edited by: Akhtar, R. and Palagiano, C., Springer, Cham, Switzerlands, 181–196, https://doi.org/10.1007/978-3-319-61346-8_12, 2018.
Lam, Y. F., Cheung, H. M., and Ying, C. C.: Impact of tropical cyclone track change on regional air quality, Sci. Total Environ., 610, 1347–1355, https://doi.org/10.1016/j.scitotenv.2017.08.100, 2018.
Li, J., Lu, K., Lv, W., Li, J., Zhong, L., Ou, Y., Chen, D., Huang, X., and Zhang, Y.: Fast increasing of surface ozone concentrations in Pearl River Delta characterized by a regional air quality monitoring network during 2006–2011, J. Environ. Sci., 26, 23–36, https://doi.org/10.1016/S1001-0742(13)60377-0, 2014.
Li, K., Jacob, D. J., Liao, H., Shen, L., Zhang, Q., and Bates, K. H.: Anthropogenic drivers of 2013–2017 trends in summer surface ozone in China, P. Natl. Acad. Sci. USA, 116, 422–427, https://doi.org/10.1073/pnas.1812168116, 2019.
Li, M., Zhang, Q., Kurokawa, J.-I., Woo, J.-H., He, K., Lu, Z., Ohara, T., Song, Y., Streets, D. G., Carmichael, G. R., Cheng, Y., Hong, C., Huo, H., Jiang, X., Kang, S., Liu, F., Su, H., and Zheng, B.: MIX: a mosaic Asian anthropogenic emission inventory under the international collaboration framework of the MICS-Asia and HTAP, Atmos. Chem. Phys., 17, 935–963, https://doi.org/10.5194/acp-17-935-2017, 2017.
Li, M., Jiang, S., Gan, Q., Chen, F., Zeng, D., Li, J., Fan, S., and Zhu, W.: Characteristics of ozone pollution and analysis of typical pollution processes in summer and autumn in Huizhou, Acta Scientiarum Naturalium Universitatis Sunyatseni, 57, 29–37, https://doi.org/10.13471/j.cnki.acta.snus.2018.05.004, 2018 (in Chinese).
Li, Y.: The evolution characteristics and source analysis of the secondary pollutants in summer over Pearl River Delta, Ph.D. thesis, College of Environmental Science and Engineering, Peking University, Beijing, China, 160 pp., 2013.
Li, Y., Lau, A. K. H., Fung, J. C. H., Zheng, J.Y., Zhong, L. J., and Louie, P. K. K.: Ozone source apportionment (OSAT) to differentiate local regional and super-regional source contributions in the Pearl River Delta region, China, J. Geophys. Res.-Atmos., 117, D15305, https://doi.org/10.1029/2011JD017340, 2012.
Liou, K. N.: On the absorption, reflection and transmission of solar radiation in cloudy atmospheres, J. Atmos. Sci., 33, 798–805, https://doi.org/10.1175/1520-0469(1976)033<0798:OTARAT>2.0.CO;2, 1976.
Lin, X., Yuan, Z., Yang, L., Luo, H., and Li, W.: Impact of extreme meteorological events on ozone in the Pearl River Delta, China, Aerosol Air Qual. Res., 19, 1307–1324, https://doi.org/10.4209/aaqr.2019.01.0027, 2019.
Liu, H., Liu, S., Xue, B., Lv, Z., Meng, Z., Yang, X., Xue, T., Yu, Q., and He, K.: Ground-level ozone pollution and its health impacts in China, Atmos. Environ., 173, 223–230, https://doi.org/10.1016/j.atmosenv.2017.11.014, 2018.
Lu, X., Hong, J., Zhang, L., Cooper, O. R., Schultz, M. G., Xu, X., Wang, T., Gao, M., Zhao, Y., and Zhang, Y.: Severe surface ozone pollution in China: A global perspective, Environ. Sci. Tech. Lett., 5, 487–494, https://doi.org/10.1021/acs.estlett.8b00366, 2018.
Mills, G., Sharps, K., Simpson, D., Pleijel, H., Broberg, M., Uddling, J., Jaramillo, F., Davies, W. J., Dentener, F., Van den Berg, M., Agrawal, M., Agrawal, S. B., Ainsworth, E. A., Büker, P., Emberson, L., Feng, Z., Harmens, H., Hayes, F., Kobayashi, K., Paoletti, E., and Van Dingenen, R.: Ozone pollution will compromise efforts to increase global wheat production, Glob. Change Biol., 24, 3560–3574, https://doi.org/10.1111/gcb.14157, 2018.
National Research Council: Rethinking the Ozone Problem in Urban and Regional Air Pollution, Natl. Acad. Press, Washington, D.C., USA, 1991.
Park, S. K., O'Neill, M. S., Stunder, B. J., Vokonas, P. S., Sparrow, D., Koutrakis, P., and Schwartz, J.: Source location of air pollution and cardiac autonomic function: trajectory cluster analysis for exposure assessment, J. Expo. Sci. Env. Epid., 17, 488-497, https://doi.org/10.1038/sj.jes.7500552, 2007.
Roux, F., Clark, H., Wang, K.-Y., Rohs, S., Sauvage, B., and Nédélec, P.: The influence of typhoons on atmospheric composition deduced from IAGOS measurements over Taipei, Atmos. Chem. Phys., 20, 3945–3963, https://doi.org/10.5194/acp-20-3945-2020, 2020.
So, K. L. and Wang, T.: On the local and regional influence on ground-level ozone concentrations in Hong Kong, Environ. Pollut., 123, 307–317, https://doi.org/10.1016/S0269-7491(02)00370-6, 2003.
Stein, A. F., Draxler, R. R., Rolph, G. D., Stunder, B. J., Cohen, M. D., and Ngan, F.: NOAA's HYSPLIT atmospheric transport and dispersion modeling system, B. Am. Meteorol. Soc., 96, 2059–2077, https://doi.org/10.1175/BAMS-D-14-00110.1, 2015.
Stevenson, D. S., Dentener, F. J., Schultz, M. G., Ellingsen, K., van Noije, T. P. C., Wild, O., Zeng, G., Amann, M., therton, C. S., Bell, N., Bergmann, D. J., Bey, I., Butler, T., Cofala, J., Collins, W. J., Derwent, R. G., Doherty, R. M., Drevet, J., Eskes, H. J., Fiore, A. M., Gauss, M., Hauglustaine, D. A., Horowitz, L. W., Isaksen, I. S. A., Krol, M. C., Lamarque, J.-F., Lawrence, M. G., Montanaro, V., Müller, J.-F., Pitari, G., Prather, M. J., Pyle, J. A., Rast, S., Rodriguez, J. M., Sanderson, M. G., Savage, N. H., Shindell, D. T., Strahan, S. E., Sudo, K., and Szopa, S.: Multimodel ensemble simulations of present-day and near-future tropospheric ozone, J. Geophys. Res., 111, D08301, https://doi.org/10.1029/2005JD006338, 2006.
Stohl, A., Bonasoni, P., Cristofanelli, P., Collins, W., Feichter, J., Frank, A., Forster, C., Gerasopoulos, E., Gaggeler, H., James, P., Kentarchos, T., Kromp-Kolb, H., Kruger, B., Land, C., Meloen, J., Papayannis, A., Priller, A., Seibert, P., Sprenger, M., Roelofs, G. J., Scheel, H. E., Schnabel, C., Siegmund, P., Tobler, L., Trickl, T., Wernli, H., Wirth, V., Zanis, P., and Zerefos, C.: Stratosphere-troposphere exchange: A review, and what we have learned from STACCATO, J. Geophys. Res., 108, 8516, https://doi.org/10.1029/2002JD002490, 2003.
Thunis, P., Clappier, A., Tarrason, L., Cuvelier, C., Monteiro, A., Pisoni, E., Wesseling, J., Belis, C. A., Pirovano, G., Janssen, S., Guerreiro, C., and Peduzzi, E.: Source apportionment to support air quality planning: Strengths and weaknesses of existing approaches, Environ. Int., 130, 104825, https://doi.org/10.1016/j.envint.2019.05.019, 2019.
Thunis, P., Clappier, A., and Pirovano, G.: Source apportionment to support air quality management practices, A fitness-for-purpose guide (V 3.1), EUR30263, Publications Office of the European Union, JRC120764, https://doi.org/10.2760/47145, 2020.
Wang, H., Wang, W., Huang, X., and Ding A.: Impacts of stratosphere-to-troposphere-transport on summertime surface ozone over eastern China, Sci. Bull., 65, 276–279, https://doi.org/10.1016/j.scib.2019.11.017, 2020.
Wang, N., Guo, H., Jiang, F., Ling, Z. H., and Wang, T.: Simulation of ozone formation at different elevations in mountainous area of Hong Kong using WRF-CMAQ model, Sci. Total Environ., 505, 939–951, https://doi.org/10.1016/j.scitotenv.2014.10.070, 2015.
Wang, T. and Kwok, J. Y: Measurement and analysis of a multiday photochemical smog episode in the Pearl River Delta of China, J. Appl. Meteorol., 42, 404–416, https://doi.org/10.1175/1520-0450(2003)042<0404:MAAOAM>2.0.CO;2, 2003.
Wang, T., Lam, K. S., Lee, A. S., Pang, S. W., and Tsui, W. S.: Meteorological and chemical characteristics of the photochemical ozone episodes observed at Cape D'Aguilar in Hong Kong, J. Appl. Meteorol., 37, 1167–1178, https://doi.org/10.1175/1520-0450(1998)037<1167:MACCOT>2.0.CO;2, 1998.
Wang, T., Wu, Y. Y., Cheung, T. F., and Lam, K. S.: A study of surface ozone and the relation to complex wind flow in Hong Kong, Atmos. Environ., 35, 3203–3215, https://doi.org/10.1016/S1352-2310(00)00558-6, 2001.
Wang, T., Xue, L., Brimblecombe, P., Lam, Y. F., Li, L., and Zhang, L.: Ozone pollution in China: A review of concentrations, meteorological influences, chemical precursors, and effects, Sci. Total Environ., 575, 1582–1596, https://doi.org/10.1016/j.scitotenv.2016.10.081, 2017.
Wang, X., Zhang, Y., Hu, Y., Zhou, W., Lu, K., Zhong, L., Zeng, L., Shao, M., Hu, M., and Russell, A. G.: Process analysis and sensitivity study of regional ozone formation over the Pearl River Delta, China, during the PRIDE-PRD2004 campaign using the Community Multiscale Air Quality modeling system, Atmos. Chem. Phys., 10, 4423–4437, https://doi.org/10.5194/acp-10-4423-2010, 2010.
Wei, X., Lam, K. S., Cao, C., Li, H., and He, J.: Dynamics of the typhoon Haitang related high ozone episode over Hong Kong, Adv. Meteorol., 2016, 6089154, https://doi.org/10.1155/2016/6089154, 2016.
Yang, J. X., Lau, A. K. H., Fung, J. C. H., Zhou, W., and Wenig, M.: An air pollution episode and its formation mechanism during the tropical cyclone Nuri's landfall in a coastal city of south China, Atmos. Environ., 54, 746–753, https://doi.org/10.1016/j.atmosenv.2011.12.023, 2012.
Ying, M., Zhang, W., Yu, H., Lu, X., Feng, J., Fan, Y., Zhu, Y., and Chen, D.: An overview of the China Meteorological Administration tropical cyclone database, J. Atmos. Ocean Tech., 31, 287–301, https://doi.org/10.1175/JTECH-D-12-00119.1, 2014.
Yue, H., Gu, T., Wang, C., Wu, D., Deng, X., Huang, J., and Wang, Y.: Influence of typhoon Nida process on ozone concentration in Guangzhou, Acta Scientiae Circumstantiae, 38, 4565–4572, https://doi.org/10.13671/j.hjkxxb.2018.0319, 2018 (in Chinese).
Zhang, X., Liu, Y., Deng, X., Chen, P., Feng, Y., and Fan, Q.: Analysis of summertime typical pollution in Pearl River Delta region – numerical simulation of meteorological field, Meteorological and Environmental Research, 59, 9–18, 2014.
Zhao, W., Gao, B., Liu, M., Lu, Q., Ma, S., Sun, S., Sun, J. Chen, L., and Fan, S.: Impact of meteorological factors on the ozone pollution in Hong Kong, Huan jing ke xue = Huanjing kexue, 40, 55–66, https://doi.org/10.13227/j.hjkx.201803151, 2019 (in Chinese).
Zheng, J., Zhang, L., Che, W., Zheng, Z., and Yin, S.: A highly resolved temporal and spatial air pollutant emission inventory for the Pearl River Delta region, China and its uncertainty assessment, Atmos. Environ., 43, 5112–5122, https://doi.org/10.1016/j.atmosenv.2009.04.060, 2009.
Zheng, J., Zhong, L., Wang, T., Louie, P. K. K., and Li, Z.: Ground-level ozone in the Pearl River Delta region: Analysis of data from a recently estabilished regional air quality monitoring network, Atmos. Environ., 44, 814–823, https://doi.org/10.1016/j.atmosenv.2009.11.032, 2010.