the Creative Commons Attribution 4.0 License.
the Creative Commons Attribution 4.0 License.
 | 03 Aug 2021
Temperature and volatile organic compound concentrations as controlling factors for chemical composition of α-pinene-derived secondary organic aerosol
Louise N. Jensen
Manjula R. Canagaratna
Kasper Kristensen
Lauriane L. J. Quéléver
Bernadette Rosati
Ricky Teiwes
Marianne Glasius
Henrik B. Pedersen
Mikael Ehn
This work investigates the individual and combined effects of temperature and volatile organic compound precursor concentrations on the chemical composition of particles formed in the dark ozonolysis of α-pinene. All experiments were conducted in a 5 m3 Teflon chamber at an initial ozone concentration of 100 ppb and initial α-pinene concentrations of 10 and 50 ppb, respectively; at constant temperatures of 20, 0, or −15 ∘C; and at changing temperatures (ramps) from −15 to 20 and from 20 to −15 ∘C. The chemical composition of the particles was probed using a high-resolution time-of-flight aerosol mass spectrometer (HR-ToF-AMS).
A four-factor solution of a positive matrix factorization (PMF) analysis of the combined HR-ToF-AMS data is presented. The PMF analysis and the elemental composition analysis of individual experiments show that secondary organic aerosol particles with the highest oxidation level are formed from the lowest initial α-pinene concentration (10 ppb) and at the highest temperature (20 ∘C). A higher initial α-pinene concentration (50 ppb) and/or lower temperature (0 or −15 ∘C) results in a lower oxidation level of the molecules contained in the particles. With respect to the carbon oxidation state, particles formed at 0 ∘C are more comparable to particles formed at −15 ∘C than to those formed at 20 ∘C. A remarkable observation is that changes in temperature during particle formation result in only minor changes in the elemental composition of the particles. Thus, the temperature at which aerosol particle formation is induced seems to be a critical parameter for the particle elemental composition.
Comparison of the HR-ToF-AMS-derived estimates of the content of organic acids in the particles based on 44 in the mass spectra show good agreement with results from off-line molecular analysis of particle filter samples collected from the same experiments. Higher temperatures are associated with a decrease in the absolute mass concentrations of organic acids (R-COOH) and organic acid functionalities (-COOH), while the organic acid functionalities account for an increasing fraction of the measured particle mass.
- Article
(2275 KB) - Full-text XML
- Companion paper
-
Supplement
(1019 KB) - BibTeX
- EndNote


Atmospheric aerosol particles can alter air quality (WHO, 2016) and visibility (Wang et al., 2009) on a regional scale. On a global scale, particles affect cloud formation, the radiative balance, and thus climate (IPCC, 2013).
Atmospheric particles are chemically diverse entities, often with a significant mass fraction of organic compounds (Zhang et al., 2007; Jimenez et al., 2009). Secondary organic aerosol (SOA) is formed from the condensation of oxidation products of volatile organic compounds (VOCs) emitted from both anthropogenic and biogenic sources (Sindelarova et al., 2014; Seinfeld and Pandis, 2016). α-pinene is a biogenic VOC emitted from sources such as the foliage of coniferous trees (Rasmussen, 1972), and it has been identified as the most common monoterpene in boreal forests all year round (Hakola et al., 2003). In the atmosphere, α-pinene is oxidized primarily by ozone (O3), hydroxyl radicals (OH•), and nitrate radicals (NO3•). Due to their low vapor pressures, some of the gas-phase oxidation products may partition onto already existing particles by condensation or reactive uptake and contribute to particle growth (Hallquist et al., 2009). In addition, some low-vapor-pressure oxidation products of α-pinene are able to nucleate (Kirkby et al., 2016) and likely play an important role in the initial growth of new particles in the atmosphere (O'Dowd et al., 2002; Riipinen et al., 2012; Ehn et al., 2014; Tröstl et al., 2016).
It is well established that the particle mass available for the condensation of gases affects the partitioning of organic species between the gas phase and the particle phase (Pankow, 1994a, b), although the traditional partitioning theory is limited in relation to non-liquid, more viscous particles, such as α-pinene-derived SOA formed at low relative humidity (Renbaum-Wolff et al., 2013), because of slow diffusion (Cappa and Wilson, 2011; Pöschl, 2011).
The fraction (F) of a given semi-volatile species in the particle phase at a given temperature has been formulated in an absorptive equilibrium partitioning framework as
where c* is the gas-phase mass concentration at saturation, and M is the mass concentration of absorbing material (Kroll and Seinfeld, 2008). Thus, the chemical composition of a particle that is in equilibrium with the surrounding gas phase is affected by both c* and M. The c* of a gaseous compound is generally inversely related to its level of oxidation (Jimenez et al., 2009). The particle composition can be shifted towards species with higher c* values (i.e., less oxidized, more volatile species) by increasing the mass concentration of preexisting particles, i.e., the value of M; conversely, lower M values result in particle-phase compositions that are dominated by species with lower c* values (i.e., more oxidized, less volatile species). This has been experimentally confirmed by studies such as Shilling et al. (2009), who showed that the oxidation level of SOA from α-pinene ozonolysis decreases with increasing particle mass loadings.
The equilibrium partitioning of a gas with a given c* (volatility) also depends on temperature, as demonstrated by Pathak et al. (2007), Saathoff et al. (2009), and Warren et al. (2009), based on chamber studies of α-pinene-derived particles at different constant temperatures between −30 and 45 ∘C. Partitioning has also been addressed in chamber studies where the temperature was ramped after the initial (constant temperature) formation of SOA. Stanier et al. (2007) increased the temperature from 22 ∘C to a maximum of 40 ∘C and then decreased the temperature back to 22 ∘C in some experiments. During heating, they observed a decrease in SOA size, which is an indication of evaporation, and during cooling, they observed an increase in SOA size, which is an indication of condensation. In experiments by Warren et al. (2009), where the temperature was cycled in the ranges of 5 to 27 and 27 to 45, respectively, heating was associated with a decrease in particle mass, and cooling was associated with an increase in particle mass. In a recent study by Zhao et al. (2019), where the temperature was cycled between 5 and 35 ∘C (RH varied between 10 % and 80 %), it was suggested that condensation during cooling is lower than predicted by equilibrium partitioning.
The chemical composition of the gas and particle phases in α-pinene ozonolysis experiments is determined by a combination of thermodynamic and kinetic aspects (Zhang et al., 2015; Kristensen et al., 2017). However, the effect of temperatures below room temperature (∼ 20 ∘C), in particular below 0 ∘C, on gas-phase oxidation products, nucleation, SOA growth, and particle chemical composition remains a largely unexplored area (Kristensen et al., 2017; Simon et al., 2020). As low temperatures are of high atmospheric relevance (e.g., low temperatures prevail at the latitudes of the boreal forests and at higher elevation), it is important to quantify SOA formation and properties under cold conditions. Furthermore, vertical transport can lead to changes in temperature within short time frames, affecting reaction kinetics, condensation processes, and properties relevant for the climate effect of particles (Topping et al., 2013; Murphy et al., 2015).
The lack of knowledge on how the chemical composition of both the gas phase and particle phase vary with temperature was the motivation behind the Aarhus Chamber Campaign on Highly Oxygenated Organic Molecules and Aerosols (ACCHA) introduced in Kristensen et al. (2020). The ACCHA campaign focuses on temperatures from 20 to −15 ∘C, corresponding to conditions relevant in the boreal forest regions (Portillo-Estrada et al., 2013). As in most chamber experiments, VOC concentrations in the ACCHA campaign (10–50 ppb) were 1–2 orders of magnitude higher than typical ambient conditions (Kourtchev et al., 2016). These conditions were chosen to speed up aerosol formation in the experiments, and we believe that the data provide valuable and atmospherically relevant information that is applicable to regions such as the boreal forest.
The impact of temperature on the yield of highly oxygenated organic molecules (HOMs) is presented in Quéléver et al. (2019), and more details on VOCs are presented in Rosati et al. (2019).
The goal of the current paper is to investigate and quantify the individual and combined effects of α-pinene precursor concentrations and temperature on the SOA mass concentration and chemical composition. For this purpose, we describe and discuss a subset of the data collected during the ACCHA campaign, focusing on results obtained from a high-resolution time-of-flight aerosol mass spectrometer (HR-ToF-AMS).
2.1 Experimental
This work is based on experiments conducted in the Aarhus University Research on Aerosol (AURA) smog chamber: a ∼ 5 m3 bag made of 125 µm fluorinated ethylene propylene Teflon film located in an enclosure, where the temperature is controllable between −16 and 26 ∘C. The AURA chamber has been described in detail by Kristensen et al. (2017).
The experiments were conducted as part of the ACCHA campaign and focus on SOA formed in dark ozonolysis of α-pinene at various temperatures. An overview of the campaign is provided in Kristensen et al. (2020); therefore, only a short summary of the ACCHA campaign is given here. A modified version of the overview table of the experiments from Kristensen et al. (2020) is also presented in Table 1, where the focus is on the parameters relevant in this work. At a constant respective temperature of 20, 0, or −15 ∘C, ozone was injected into the chamber to a concentration of ∼ 100 ppb, followed by the injection of either 10 ppb (low concentration) or 50 ppb (high concentration) α-pinene. The chamber was operated at atmospheric pressure, and neither seed particles nor OH scavengers were introduced.
Table 1Overview of experimental details for the ACCHA experiments included in this work. The experiments are constant temperature (const. temp.) experiments and/or temperature ramp (temp. ramp) experiments.
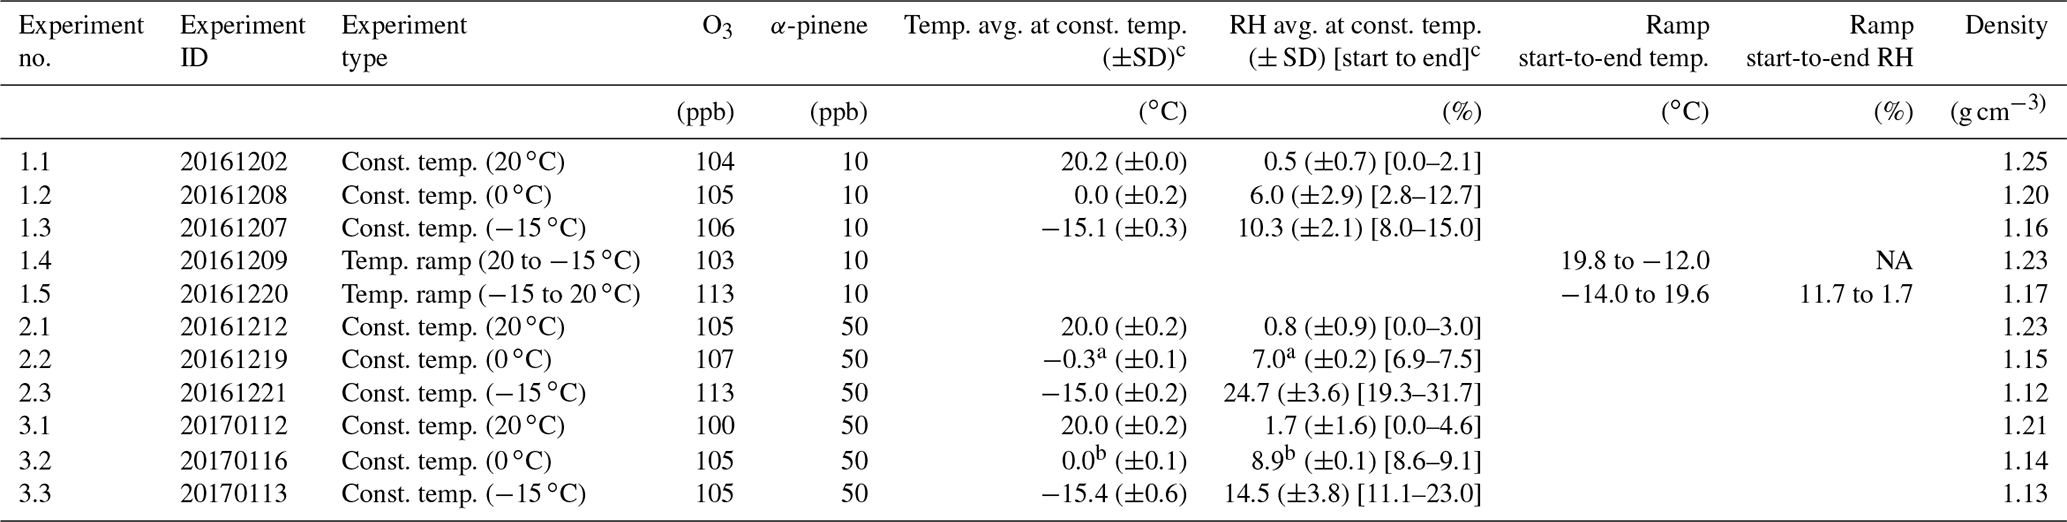
a Temperature and relative humidity probe failure after 59 min and the rest of the constant temperature experiment. b Temperature and relative humidity probe failure after 42 min. ∗ Averages of temperature and relative humidity are based on data from the time of α-pinene injection to filter sampling and might differ slightly from the values reported in Kristensen et al. (2020). Densities are 30 min averages obtained by the end of the experiments (1.1–1.5 and 3.1–3.3). NA denotes not available.
Three series of constant temperature experiments, all consisting of an experiment at 20, 0, and −15 ∘C, were conducted. In one of the series, 10 ppb α-pinene was injected into the chamber (experiments 1.1–1.3), while two similar series of experiments were performed at 50 ppb α-pinene (experiments 2.1–2.3 and 3.1–3.3). Additionally, the series of 10 ppb α-pinene experiments includes two temperature ramp experiments, where the temperature was decreased from 20 to −15 ∘C (experiment 1.4) and increased from −15 to 20 ∘C (experiment 1.5) ∼ 35 min after α-pinene injection, which corresponds to the period during SOA formation and before mass peak.
In this work, we present data from a subset of instruments involved in the ACCHA campaign: a temperature and humidity sensor (HC02-04) attached to a HygroFlex HF320 transmitter (Rotronic AG) placed in the center of the chamber; a scanning mobility particle sizer (SMPS), consisting of a differential mobility analyzer (DMA; TSI 3082) and a nano water-based condensation particle counter (CPC; TSI 3788); and a high-resolution time-of-flight aerosol mass spectrometer (HR-ToF-AMS; Aerodyne Research Inc.) (Jayne et al., 2000; DeCarlo et al., 2006; Canagaratna et al., 2007). In the following, the HR-ToF-AMS will be referred to as AMS. Both the SMPS and AMS were placed at room temperature next to the chamber outlets, and the connecting tubing was temperature insulated. By the end of each experiment, a particle sample was collected on a Teflon filter (0.45 µm pore size; CHROMAFIL). Particle samples were extracted and analyzed by an ultrahigh-performance liquid chromatograph–electrospray ionization quadrupole time-of-flight mass spectrometer (UHPLC–ESI-qTOF-MS; Bruker Daltonics), as described in Kristensen et al. (2020), where the analytical method and results are also presented in detail. Herein, we compare the findings from the UHPLC–ESI-qTOF-MS, hereafter referred to as LC-MS, to the AMS measurements.
2.2 Data analysis
Positive matrix factorization (PMF) (Paatero and Tapper, 1994; Paatero, 1997) has traditionally been used to investigate contributions of different sources to ambient particles, and the application of PMF to AMS data from chamber experiments was first demonstrated by Craven et al. (2012). In the present work, PMF analysis is applied to chemical composition data from SOA particles that are produced in the ozonolysis of α-pinene but are formed and aged under different temperatures and precursor concentrations and, consequently, different particle loadings. High-resolution AMS mass spectra of SOA particles from the various experimental conditions were analyzed in one matrix, allowing for the spectral and elemental chemical composition changes that occur to be monitored as conditions change. The PET tool (V 2.09A) was used to perform the PMF analysis on high-resolution AMS mass spectra, according to the principles described in detail by Ulbrich et al. (2009).
PMF is a model that can be used to express measured mass spectra as a linear combination of factors that are the products of constant mass spectra and related time profiles as follows:
The measured mass spectral data are the matrix X, an m×n matrix with n ion masses measured at m different time points, and xij is an element of this matrix. p is the number of factors chosen for the solution, gip is an element of the matrix G containing time series of the factors, and fpj is an element of the matrix F of constant factor mass spectral profiles. The matrix elements eij correspond to the error matrix, E, of residuals not explained by the model (Paatero, 1997; Ulbrich et al., 2009). Equation (2) is solved using the PMF2 algorithm (Paatero, 1997), which uses linear least-squares fitting and the constraints that the values of matrix F and G have to be nonnegative. The solution is found by minimizing the fit parameter Q:
where σij is an element of a matrix containing the standard deviations for each element of X (Paatero, 1997; Ulbrich et al., 2009). The estimation of standard deviations was performed as outlined in Ulbrich et al. (2009) with “weak” ions (i.e., ions with signal/noise () < 2) being down-weighted by a factor of 2, and “bad” ions (i.e., ions with .2) being down-weighted by a factor of 10. Additional sources of uncertainty that are not accounted for in the PMF analysis of high-resolution mass spectra are uncertainties related to high-resolution fitting, including errors in peak shape, and calibrations (Cubison and Jimenez, 2015). The number of factors (p) is chosen based on a combination of the evaluation of residuals, Q values, and a priori knowledge about the dataset (Lanz et al., 2007; Ulbrich et al., 2009). In the result section, a four-factor solution of the PMF analysis of high-resolution AMS data is presented. Although the five-factor solution and six-factor solution have lower (, i.e., the number of points in the data matrix, Ulbrich et al., 2009) compared with the four-factor solution, a larger number of factors is not selected because it does not provide any more interpretable information about the particle composition. The background for choosing the four-factor solution over the five- and six-factor solutions is explained in more detailed in the Supplement (Figs. S1–S11).
As previous laboratory experiments show that the collection efficiency (CE) and relative ionization efficiency (RIE) of laboratory SOA are variable (Docherty et al., 2013), the mass concentrations presented in the PMF analyses are estimated from the total SOA mass concentration, as obtained from integrated SMPS size distributions, assuming spherical particles and densities calculated from the AMS-derived elemental ratios (Kuwata et al., 2011). Densities are derived as averages based on AMS data from the last 30 min of each experiment. Uncertainties related to the density calculation are described in Kuwata et al. (2011).
Mass spectra of the factors from the PMF analysis are compared using the methods described by Wan et al. (2002) and Ulbrich et al. (2009), respectively. The comparisons focus on both the entire high-resolution mass spectra, 12 to 115, and the range of to prevent an impact from the most intense peaks, especially 43 and 44, which are the ions associated with the largest variation between the factors.
Low SOA concentrations at the beginning of the experiments increase the uncertainty of the AMS measurements. Therefore, the first 4 to 16 min of the experiments (longest in the 10 ppb α-pinene experiments) are omitted from the elemental analysis of the AMS data.
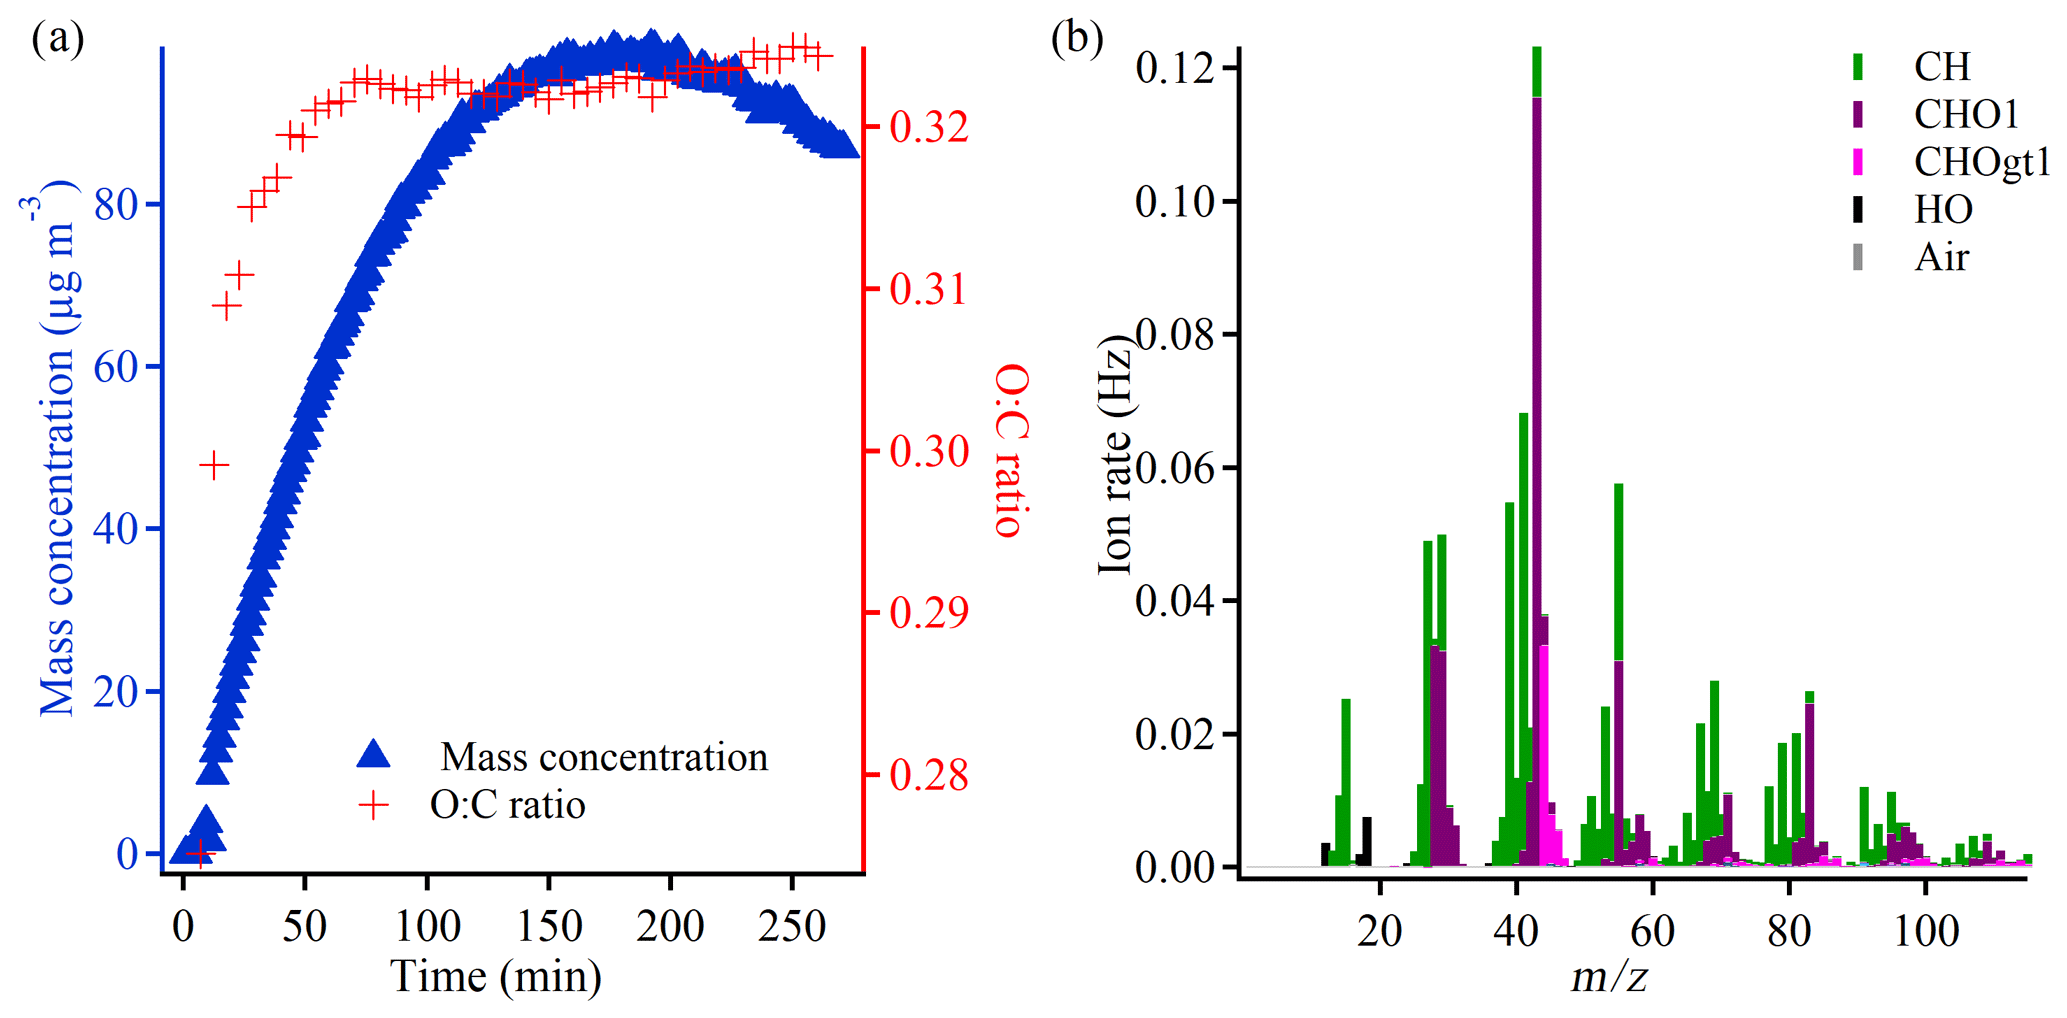
Figure 1(a) Evolution of the SOA mass (density corrected) and the O:C ratio during a typical experiment (50 ppb α-pinene, −15 ∘C, experiment 2.3) and (b) the mass spectra of the experiment obtained at the mass peak (5 min average). gt denotes greater than.
To provide an overview of the course of a typical experiment, Fig. 1a shows the evolution of the particle mass concentration and the elemental composition, illustrated by the oxygen-to-carbon (O:C) ratio in experiment 2.3 which is conducted at −15 ∘C with an initial α-pinene concentration of 50 ppb. At the beginning of the experiment, both the mass concentration and O:C ratio increase significantly, but the O:C ratio tends to stabilize after ∼ 50 min, whereas the particle mass concentration continues to increase and peaks after ∼ 175 min (not corrected for wall loss). The reported particle mass concentration is obtained using a density of 1.12 g cm−3. According to Table 1 and Supplement Fig. S12, the AMS-derived SOA densities are of the order of 1.1–1.3 g cm−3 by the end of the experiments. There are indications of a slight increase in density with higher experimental temperature as well as a slightly higher density for the particles formed at a low α-pinene concentration (10 ppb) compared with a high α-pinene concentration (50 ppb). For reproducibility with respect to SOA formation (mass concentration) as well as loss rates of α-pinene and ozone, see Kristensen et al. (2020).
Figure 1b is a mass spectrum of experiment 2.3 obtained from the high-resolution AMS data at the highest particle mass concentration (not corrected for wall loss). It shows that fragments, which belong to the so-called hydrocarbon family (CH), are distributed throughout the mass spectrum, with some of the most prominent peaks (and ions) being 39 (C3H), 41 (C3H), and 55 (C4H). The oxidized compounds, which belong to the CHO1 and CHOgt1 (gt means greater than) families, dominate at 28 (estimated from CO according to Aiken et al., 2008), 29 (CHO+), 43 (C2H3O+), 44 (C2H4O+, CO), 55 (C3H3O+), and 83 (C5H7O+). 43 is the most significant peak and also has the highest contribution of the CHO1 family, whereas the more oxidized CHOgt1 family dominates in 44. Previous studies have shown that these two peaks provide useful information about particle oxidation level (Ng et al., 2011). The patterns described above are also observed in the mass spectra of the other experiments, which are generally highly comparable across experimental conditions (Supplement Figs. S13–S23) as well as comparable to mass spectra of particles formed in dark ozonolysis of α-pinene in other chambers (Bahreini et al., 2005; Song et al., 2007; Shilling et al., 2009; Chhabra et al., 2010).
3.1 PMF analysis of aerosol mass spectra
While PMF analysis is traditionally utilized to identify distinct sources in ambient measurements and the factors are named according to what they are (e.g., oxygenated organic aerosol – OOA), here PMF analysis of the combined dataset of α-pinene SOA experiments provides a tool to identify subtle changes in the measured mass spectra across the different experimental conditions and the factors are named according to the conditions under which they dominate. The analysis was performed on a combined dataset representing eight different experimental conditions: three constant temperature conditions (20, 0, and −15 ∘C) with two initial α-pinene concentrations (10 and 50 ppb) – experiments 1.1, 1.2, 1.3, 3.1, 3.2, and 3.3 – and two temperature ramps (from 20 to −15 and from −15 to 20 ∘C), both with an initial α-pinene concentration of 10 ppb – experiments 1.4 and 1.5.
The result of the four-factor solution from the PMF analysis is presented in Fig. 2 (and Fig. S7), showing the changes in mass concentration of the factors as a function of time in each experiment, and in Fig. 3, showing the high-resolution mass spectra of the four factors (i.e., factor profiles). The mass spectra are colored according to contributions from the various types of elemental compositions (i.e., ion families) that appear at each ion signal. As expected from the comparison of the mass spectra from the individual experiments (Supplement Figs. S13–S23), the factor profiles show a high degree of similarity (Figs. 3 and S24) with small differences in the relative intensities of ions. Using the method described by Ulbrich et al. (2009), on a scale from 0 to 1, with 1 indicating highest similarity, the similarity is calculated to be between 0.86 and 0.97 across all factors in the range from 12 to 115 with Factor 3 and Factor 4 being the most similar and Factor 1 and 3 being least similar. By focusing only on the , similarities between 0.85 and 0.97 are obtained, and Factor 2 and Factor 3 are the most similar and Factor 1 and Factor 2 are least similar. Figure S24 also shows the corresponding results of a comparison using the method described by Wan et al. (2002).
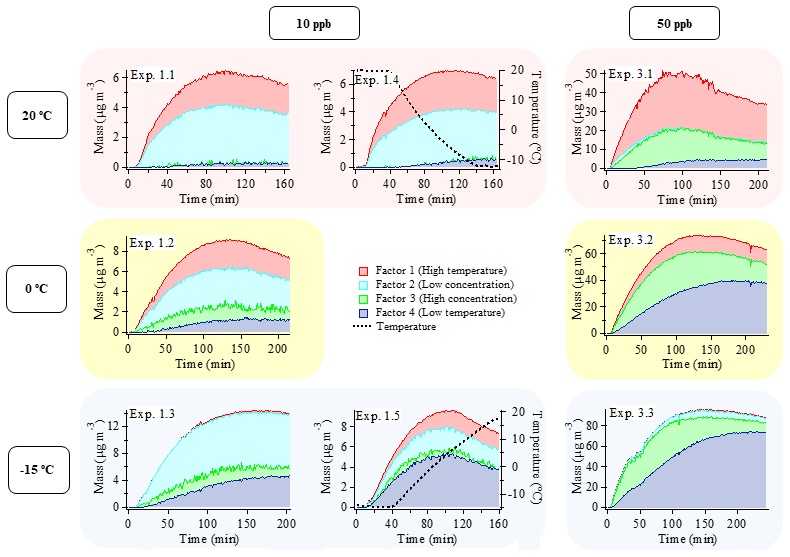
Figure 2Mass evolution (µg m−3) of the four factors from the PMF analysis of the combined AMS dataset including six constant temperature experiments with an initial α-pinene concentration of 10 or 50 ppb, conducted at 20 ∘C (experiments 1.1 and 3.1), 0 ∘C (experiments 1.2 and 3.2), and −15 ∘C (experiments 1.3 and 3.3), and two temperature ramp experiments with an initial α-pinene concentration of 10 ppb where the temperature was changed from 20 to −15 ∘C (experiment 1.4) and from −15 to 20 ∘C (experiment 1.5). Graphs in the left and middle columns depict 10 ppb α-pinene experiments, and 50 ppb α-pinene experiments are shown in the right column. Each row of graphs represents different initial temperatures. The reason for the bump/shoulder around 50 min in experiment 3.3. is unclear.
Table 2 summarizes how the four factors differ with respect to the oxygen-to-carbon (O:C) ratio; the hydrogen-to-carbon (H:C) ratio; the average carbon oxidation state (OSC; Kroll et al., 2011); the ratios between the absolute intensities of the fragment ions at 43 (C3H, C2H3O+) and 44 (C2H4O+, CO), respectively; and the corresponding total organic ion intensity (f43 and f44, respectively). Variations in these parameters can help explain the relative contribution of each factor to the SOA mass under different experimental conditions, i.e., temperatures and α-pinene concentrations (particle mass loadings).
Table 2Characteristics of the four factors obtained from PMF analysis of experiments (1.1, 1.2, 1.3, 1.4, 1.5, 3.1, 3.2, and 3.3) according to Fig. 2. For each factor, the fraction of 43 (f43) and 44 (f44) relative to the total mass spectra is given as a percentage.
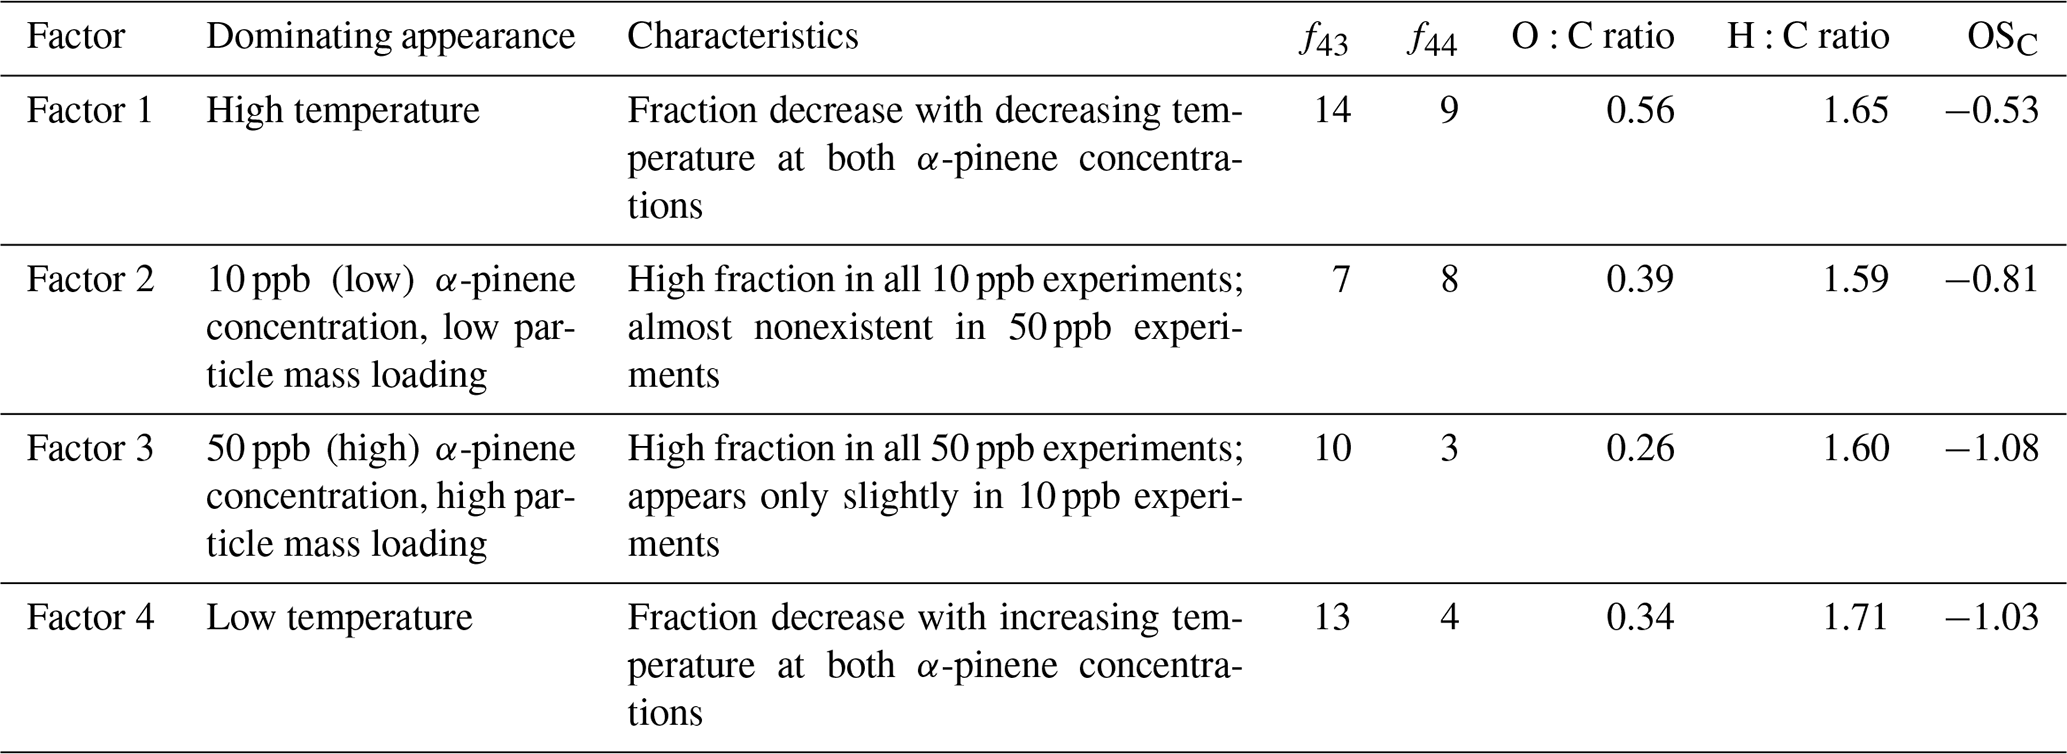
As shown in Fig. 2, the SOA observed under each experimental condition does not correspond to a single PMF factor. The SOA values obtained under different experimental conditions are represented by a linear combination of multiple factors instead. However, the factors are clearly distinguished from each other by consistent trends in their relative mass contributions to the SOA observed under the different experimental conditions. These trends are used in the interpretation and naming of the factors. According to their appearance and relative contribution to total SOA mass, factors 1 and 4 will be referred to as “temperature factors” in the following discussion, and factors 2 and 3 will be referred to as “concentration factors”. For example, according to Fig. 2, Factor 1 makes up a significant fraction of the particle mass in the 20 ∘C experiments at both α-pinene concentrations, but it plays a minor role in the colder experiments. Therefore, Factor 1 will be referred to as “high temperature factor”. The significant contribution of Factor 1 to the SOA mass at high temperature is in agreement with the fact that this factor is mostly dominated by ions from oxidized species (i.e., high intensity of CHO1 and CHOgt1 ion groups at 28, 29, 43, 44, 55, and 83) (Fig. 3). Among all factors, Factor 1 has the highest O:C ratio (0.56), OSC (−0.53), f43 (14 %), and f44 (9 %) (Table 2); therefore, the chemical species represented by Factor 1 (i.e., related to high temperature) are likely the most oxidized entities present in the SOA.
Factor 2 is dominant in all 10 ppb α-pinene experiments, but it is almost nonexistent in the 50 ppb α-pinene experiments. Therefore, it will be referred to as a “low concentration factor” (Fig. 2). Among all factors, Factor 2 (low α-pinene concentration) has the second highest contribution of oxidized ions (CHO1 and CHOgt1 family) (Fig. 3) as well as the second highest O:C ratio (0.39), OSC (−0.81), and f44 (8 %) (Table 2). With f43 (7 %) being of a similar magnitude as f44, it has the highest relative ratio of f44 to f43 among the four factors. Furthermore, Factor 2 also has strong contributions from hydrocarbons (CH family) such as 39, 41, 55, 67, 69, 79, 81, and 91 (Fig. 3).

Figure 3Mass spectra of the four factors from the PMF analysis (see also Fig. 2 and Table 2) of the combined dataset of experiments 1.1–1.5 and 3.1–3.3. gt denotes greater than.
Factor 3 makes up a significant fraction of the particle mass formed in the 50 ppb α-pinene experiments at all temperatures. It plays a less important role in the 10 ppb α-pinene experiments conducted at both 0 and −15 ∘C, whereas at 20 ∘C, where the lowest particle mass is formed, Factor 3 is practically nonexistent (Fig. 2). Based on this appearance, Factor 3 will be referred to as a “high concentration factor”. Looking into the profile of Factor 3 (high α-pinene concentration), it has relatively high contributions from the CHO1 family at 55 and 83, and among all factors, it has the highest contribution of 91 from the CH family, which has been used as a tracer of biogenic emissions in ambient measurements (Lee et al., 2016) (Fig. 3). Factor 3 also has the lowest f44 (3 %), O:C (0.26), and OSC (−1.08) among all factors, i.e., it represents the least oxidized material (Table 2).
Factor 4 (low temperature) appears at low temperature in SOA formed in both 10 and 50 ppb α-pinene experiments (Fig. 2). It has around the same level of f43 (13 %) as Factor 1 and relatively high intensities of 55 and 83, which are the fragment ions larger than 43 that are most intense in the CHO1 ion family (Fig. 3). On the other hand, Factor 4 is almost as low as Factor 3 in the more oxidized f44 (4 %) and also in O:C ratio (0.34) and OSC (−1.03) (Table 2).
It is generally seen that the factors related to temperature variation (factors 1 and 4) show a larger difference in the oxidation level than the factors related to the α-pinene concentration, i.e., particle mass loading (factors 2 and 3). This suggests that, within the investigated conditions, differences in temperature (20 to −15 ∘C) have a larger effect on the particle chemical composition than the VOC concentration (10 and 50 ppb α-pinene, respectively).
Overall, the four PMF factors represent different main characteristics of the particle chemical composition associated with temperature and VOC precursor concentrations, and they provide a useful framework for discussing the effects of temperature and VOC concentration on SOA formation and properties in chamber experiments. Figures 2 and S7 show that, within each experiment, the relative contribution of the factors changes with time. These changes in relative ratios likely reflect the changes in the SOA composition from nucleation (beginning of experiment), condensational growth (increase in mass concentration), and wall loss (decrease in mass concentration towards the end of the experiment). In addition, ongoing gas-phase chemistry may also affect observed trends in composition (Kristensen et al., 2020). Furthermore, recent studies (Pospisilova et al., 2020) have shown that particle-phase processing continues after condensation, but more work is needed to understand the extent and mechanisms of such processes; therefore, we cannot conclude on such effects.
In each chamber experiment, the correlation between the relative contribution of each factor and the SOA mass concentration can be utilized to infer information about the relative volatilities of the species in each factor. For example, Figs. 2 and S7 show that the relative mass concentration ratio of Factor 2 to Factor 1 is largest at lower SOA mass concentrations within experiments 1.1 and 1.2. This suggests that the volatility of species related to Factor 2 is lower than Factor 1 species, which is interesting as Factor 1 is more oxidized than Factor 2 (Table 2). For experiments 3.2 and 3.3, Figs. 2 and S7 show that the trend in the relative mass concentration ratio of Factor 3 to Factor 4 is largest at time periods in the experiments with lower SOA mass concentrations. This indicates that the volatility of Factor 3 species is lower than Factor 4 species. The relative volatilities of Factor 1 and Factor 3 can be assessed by examining the time trends in experiments 3.1 and 3.2, where the fraction of Factor 1 is higher at low mass loading. This, along with the fact that the relative ratio of Factor 3 to Factor 1 is higher at lower temperatures, suggests that Factor 3 is more volatile than Factor 1. Taken together, these results suggest that the volatility (c*) of the four factors increases in the following way: Factor 2 < Factor 1 < Factor 3 < Factor 4.
While we do not see any systematic indications of a specific factor being coupled to relative humidity in our experiments, we cannot rule out that the changes in relative humidity during the experiments might have some impact on SOA composition.
As PMF analysis is traditionally used on ambient AMS data, it is relevant to compare the findings from the AURA chamber experiments to ambient studies. Here, the analysis presented by Lee et al. (2016) is relevant, as they used PMF analysis to explore the SOA sources in a coniferous forest mountain region in British Columbia, where SOA concentrations reached up to 5 µg m−3 and the temperature varied from ∼ 5 to ∼ 25 ∘C, corresponding to the temperature in the upper range of the experiments presented in this paper. PMF factors obtained from the ambient AMS data showed a background source and two biogenic SOA sources: BSOA1 from terpene oxidized by ozone and nitrate radical during nighttime, and BSOA2 from terpene oxidized by ozone and OH radical during daytime. Especially the BSOA1 O:C ratio (0.56), the H:C ratio (1.56), and the overall distribution of peaks (particularly with respect to the relative ratios of 58 to 55 and to the ions above 60) in the mass spectrum are comparable to Factor 1 (high temperature). As both ozone and OH radicals are present in the ACCHA campaign experiments as discussed by Quéléver et al. (2019), is it interesting that the comparability to the Lee et al. (2016) BSOA1 factor representing ozone and nitrate radical at nighttime is higher than the comparability to the BSOA2 factor representing terpene oxidized by ozone and OH radical at daytime. This may be related to a larger fraction of SOA being formed from ozonolysis rather than OH oxidation in the ACCHA campaign experiments (Quéléver et al., 2019). Moreover, it suggests that (BSOA1) ozonolysis might have been the major SOA formation pathway in Lee et al. (2016) during nighttime.
The comparison and similarity between PMF factors from laboratory and ambient observations indicates that the PMF analysis of chamber SOA chemical composition, obtained under different temperature and loading conditions, can be useful for the interpretation and understanding of ambient SOA composition and vice versa.
3.2 Trends in chemical composition
3.2.1 Elemental analysis
Studying the evolution of the elemental composition of SOA can provide insight into the chemical changes occurring during chemical and physical processes. Figure 4 illustrates the evolution of the O:C ratio during constant temperature experiments and temperature ramps (standard errors are shown in Fig. S25). The time series of the O:C ratio in both 10 ppb α-pinene experiments (1.1–1.5) and 50 ppb α-pinene experiments (2.1–2.3 and 3.1–3.3) are shown. In accordance with expectations based on the absorptive equilibrium framework (Eq. 1), previous work (Shilling et al., 2009), and observations from the PMF analysis, SOA formed from a low α-pinene concentration (10 ppb) and at higher temperature are associated with higher O:C ratios, compared with SOA formed from a high α-pinene concentration (50 ppb) at lower temperatures. In all experiments, an initial increase in the O:C ratios, which subsequently level off, is observed – most significantly in the 50 ppb α-pinene experiments (2.1–2.3), which is probably due to the higher reaction rate in these experiments. Although the aging of oxidized organic particles in ambient measurements is associated with an increase in the O:C ratio (Ng et al., 2011) at higher particle mass concentrations, the O:C ratio is usually observed to decrease during particle aging (Shilling et al., 2009; Chhabra et al., 2010; Denjean et al., 2015b) due to the increased partitioning of less oxidized semi-volatile compounds into the particle phase.

Figure 4Time series of the O:C ratio in 10 ppb α-pinene experiments (1.1–1.5) and 50 ppb α-pinene experiments (2.1–2.3). Every fifth data point is shown. Standard errors are shown in Fig. S25.
In the 10 ppb α-pinene experiment (experiment 1.4), where the temperature is lowered 36 min after the start of the experiment, the temperature change from 20 to −15 ∘C is associated with a small decrease in the O:C ratio, which corresponds to condensation of less oxidized (i.e., more volatile) species (Fig. 4). Conversely, heating the particles from −15 to 20 ∘C at 34 min after the start of the experiment (experiment 1.5) results in a slight increase in the O:C ratio as more volatile, less oxidized species evaporate and increase the O:C ratio of the remaining particle mass. For comparison, Denjean et al. (2015a) also observed a slight increase in the O:C ratio when increasing the temperature by 6 ∘C in the room temperature range.
An important outcome of Fig. 4 is that the O:C ratios at the end of the temperature ramps are closer to the O:C ratios of the particles in the experiments conducted at the temperature where the ramps start than at the temperatures where they end. This observation suggests that the composition of α-pinene-derived SOA particles is, to a large extent, controlled by the temperature at which they are initially formed and that subsequent changes in temperature, even as dramatic as 35 ∘C during 100–130 min, only affect the particle chemical composition to a minor extent. Even though the newly formed particles are exposed to this change in temperature (∼ 35 min after the start of the experiment and ∼ 1 h before SOA mass peak; Fig. 2), only slight changes in the chemical composition are observed (Fig. 4).
It is also relevant to investigate the corresponding evolution of the O:C ratio and the H:C ratio derived from the AMS data based on the so-called Van Krevelen plot (Van Krevelen, 1950) (Aiken et al., 2007, 2008; Canagaratna et al., 2015). Van Krevelen plots of the constant temperature experiments (1.1–1.3, 2.1–2.3, and 3.1–3.3) are shown in Fig. 5 (the standard errors of O:C ratios and H:C ratios can be found in Figs. S25 and S26, respectively). The differences between the 50 ppb α-pinene experiments conducted at similar temperature might be a result of experimental uncertainty. The figures reveal interesting tendencies, both in relation to elemental composition at particle mass peak (Fig. 5a) and to evolution during the experiments (Fig. 5b). For comparison, the O:C ratio and H:C ratio of the four factors from the PMF analysis, which were obtained from the combined dataset of several experiments, are also shown in Fig. 5a and b. The O:C ratios and H:C ratios of the factors encompass the data from the individual experiments, illustrating how the factors from the PMF analysis capture and define the extremes in the diversity of the chemical composition of particles from the individual experiments, as a result of different experimental conditions. The largest differences in elemental ratios are observed between the SOA particles produced under different temperatures.
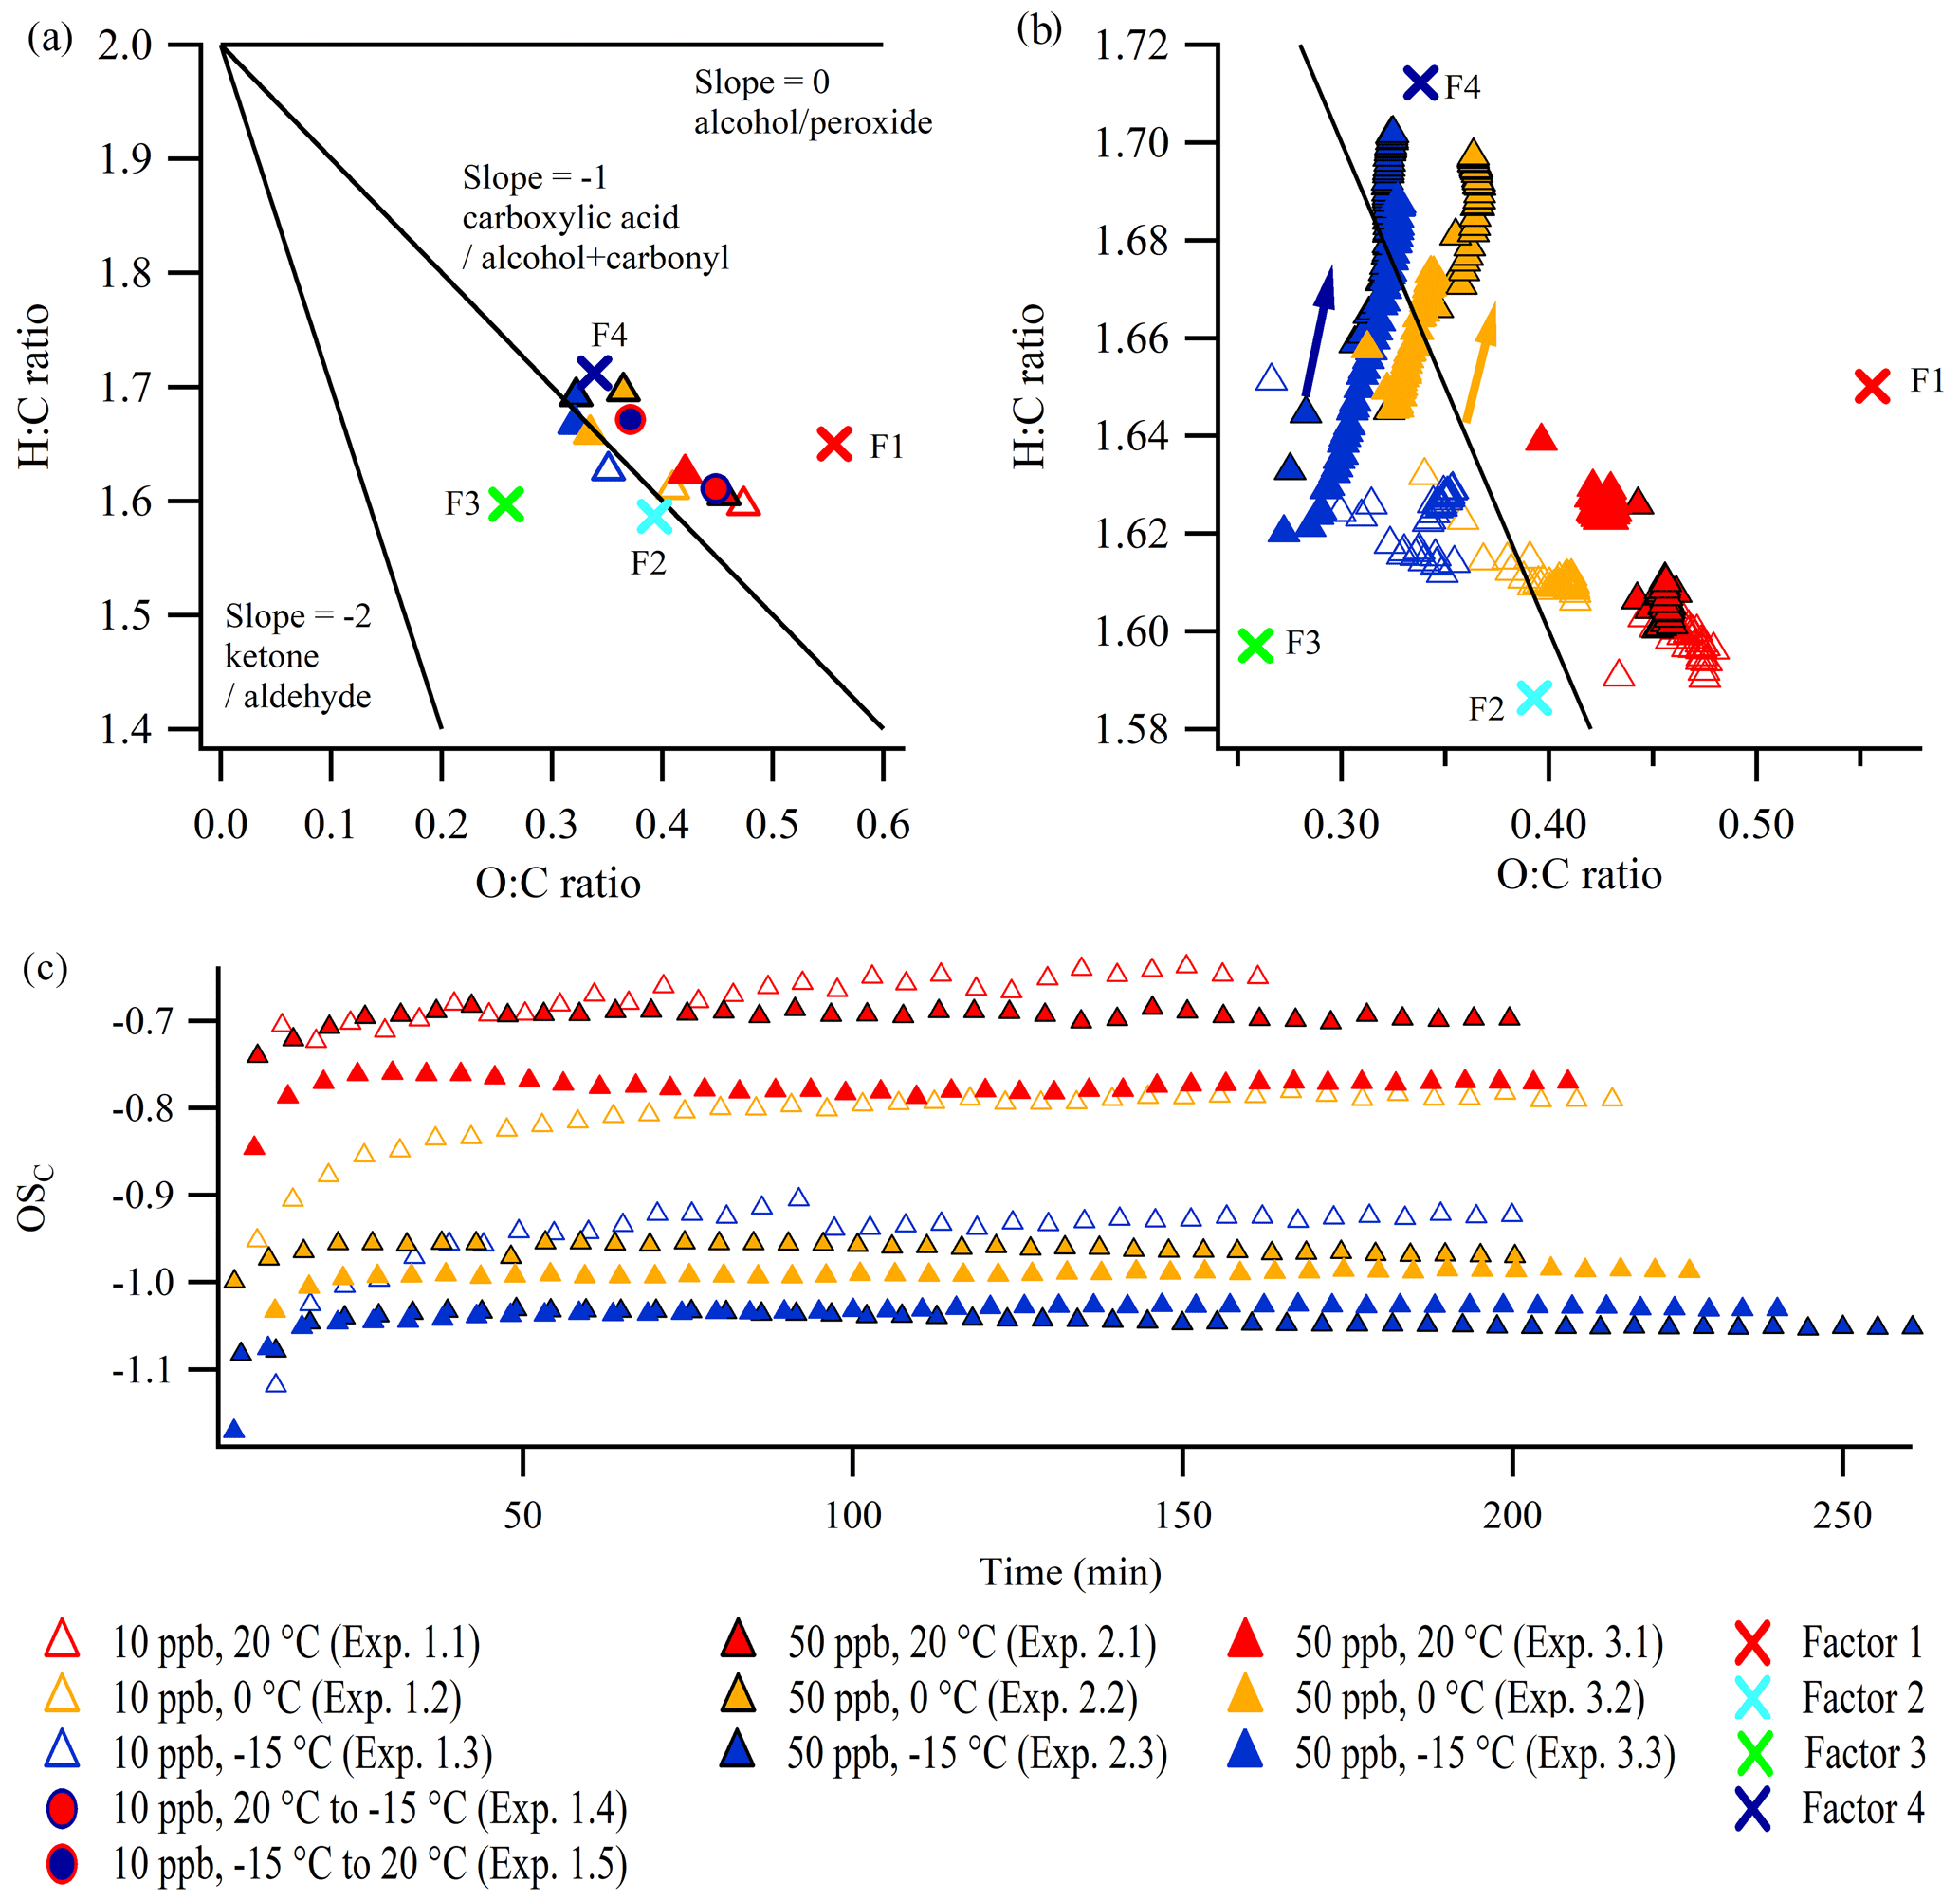
Figure 5Van Krevelen plots (H:C ratio vs. O:C ratio) at (a) the SOA mass peak (five-data-point average) and in the expansion (b) during the constant temperature experiments in this work (arrows indicate the direction of time). (c) The OSC during the experiments. The lines in the Van Krevelen plots are based on Heald et al. (2010) and Ng et al. (2011). Note the different scales of the axes in panels (a) and (b). The positions of the four factors obtained from the PMF analysis are indicated by crosses: F1 denotes Factor 1 (high temperature), F2 denotes Factor 2 (low concentration), F3 denotes Factor 3 (high concentration), and F4 denotes Factor 4 (low temperature). Panels (b) and (c) show every fifth data point. Standard errors are shown in Figs. S25 and S26.
Figure 5b shows that the O:C ratio and the H:C ratio are almost constant during all constant temperature 10 ppb α-pinene experiments. Interestingly, in the 50 ppb α-pinene experiments conducted at lower temperatures (0 and −15 ∘C; experiments 2.2, 2.3, 3.2, and 3.3), the H:C and O:C ratios increase simultaneously during the experiment. As this is not a commonly reported trend, neither in ambient measurements (Ng et al., 2011; Lee et al., 2016) nor in chamber experiments focusing on α-pinene-derived SOA (Chhabra et al., 2011), it demonstrates the importance of investigating SOA particles at low, atmospheric relevant, temperatures. Several mechanisms could potentially explain the observed evolution of the SOA elemental composition in the Van Krevelen plot, and it could in fact be due to a combination of different simultaneous mechanisms, such as oxidation and oligomerization. As no OH scavenger is added in our experiments, one explanation could be related to OH chemistry. Qi et al. (2012) demonstrated that the exposure of ozonolysis-generated α-pinene SOA to OH radicals increases the O:C ratio and also leads to higher H:C ratio, due to OH addition to the unsaturated VOC. However, modeling suggests that the OH oxidation is not more pronounced at low temperature (0 ∘C), compared with high temperature (20 ∘C) (Quéléver et al., 2019), which makes this a less likely explanation for the continuous increase in the O:C ratio and H:C ratio in the cold experiments. More specifically, the ratio of VOC oxidized by ozone relative to that oxidized by OH radicals was ∼ 2:1, independent of precursor concentration and temperature (Quéléver et al., 2019).
While the simultaneous increase in the H:C ratio and O:C ratio could also be associated with hydration reactions (Heald et al., 2010) of carbonyls (Axson et al., 2010), the condensation of water does not influence the elemental ratios derived from the AMS spectra, as the calculation does not directly utilize measured H2O-related ion signals, because they typically have large interferences from gas-phase H2O in air (Canagaratna et al., 2015). It should be mentioned that the observed increase in the H:C ratio could potentially be due to impurities condensing to the particle phase in the cold experiments, although this seems highly unlikely, as the chamber was cleaned thoroughly before each experiment (see Kristensen et al., 2020), and the observed changes in the H:C ratios would need an excessive amount of impurities because the particle mass is high (see Table 1, and Fig. 2).
The combined effect of the evolution of the O:C ratio and H:C ratio is shown in Fig. 5c, depicting the average carbon oxidation state OSC (Kroll et al., 2011) during the experiments. At all temperatures the 50 ppb α-pinene experiments reach a relatively stable OSC within ∼ 15 min. This suggests that the observed increase in the H:C ratio during the cold 50 ppb α-pinene experiments (Fig. 5b) only has a small effect on the oxidation state of the particles. Throughout the 10 ppb α-pinene experiments conducted at constant temperature (experiments 1.1–1.3) and during heating (1.5), a slight gradual increase in OSC is observed. For both the 10 and 50 ppb α-pinene experiments, the OSC is linearly correlated with the SOA density (Fig. S27).
3.2.2 Oxidized organic tracer ions
As described in relation to the mass spectra obtained from the PMF analysis (Fig. 3), differences in VOC precursor concentrations (i.e., particle mass loading) and temperature primarily result in intensity differences in the dominant oxygen-containing ions, 43 and 44. 43 (dominated by C2H3O+ (CHO1 family)) likely derives from organic compounds containing non-acid oxygen (Ng et al., 2010), whereas the signal at 44 (primary CO (CHOgt1 family)) arises from carboxylic acids (Alfarra, 2004). Both the number of acid groups and the length and functionalization of the carbon chain in the compounds affect the intensity of the signal at 44 (Alfarra et al., 2004; Canagaratna et al., 2015).
Figure 6a and b are “triangle plots” (Ng et al., 2010), showing f44 (the fraction of 44 relative to the total mass in the spectra) as a function of f43 (the fraction of 43 relative to the total mass in the spectra), obtained from unit mass resolution data from the AMS. Figure 6a shows the values at the peak of mass concentration (five-data-point average) of constant temperature experiments (1.1–1.3, 2.1–2.3, and 3.1–3.3) and temperature ramp experiments (1.4 and 1.5), whereas Fig. 6b shows the evolution through the constant temperature experiments. As observed in the Van Krevelen plots (Fig. 5a, b), data from the repeated 50 ppb α-pinene experiments (2.1–2.3 and 3.1–3.3) conducted at similar temperatures show overall reproducibility, although they are not identical.
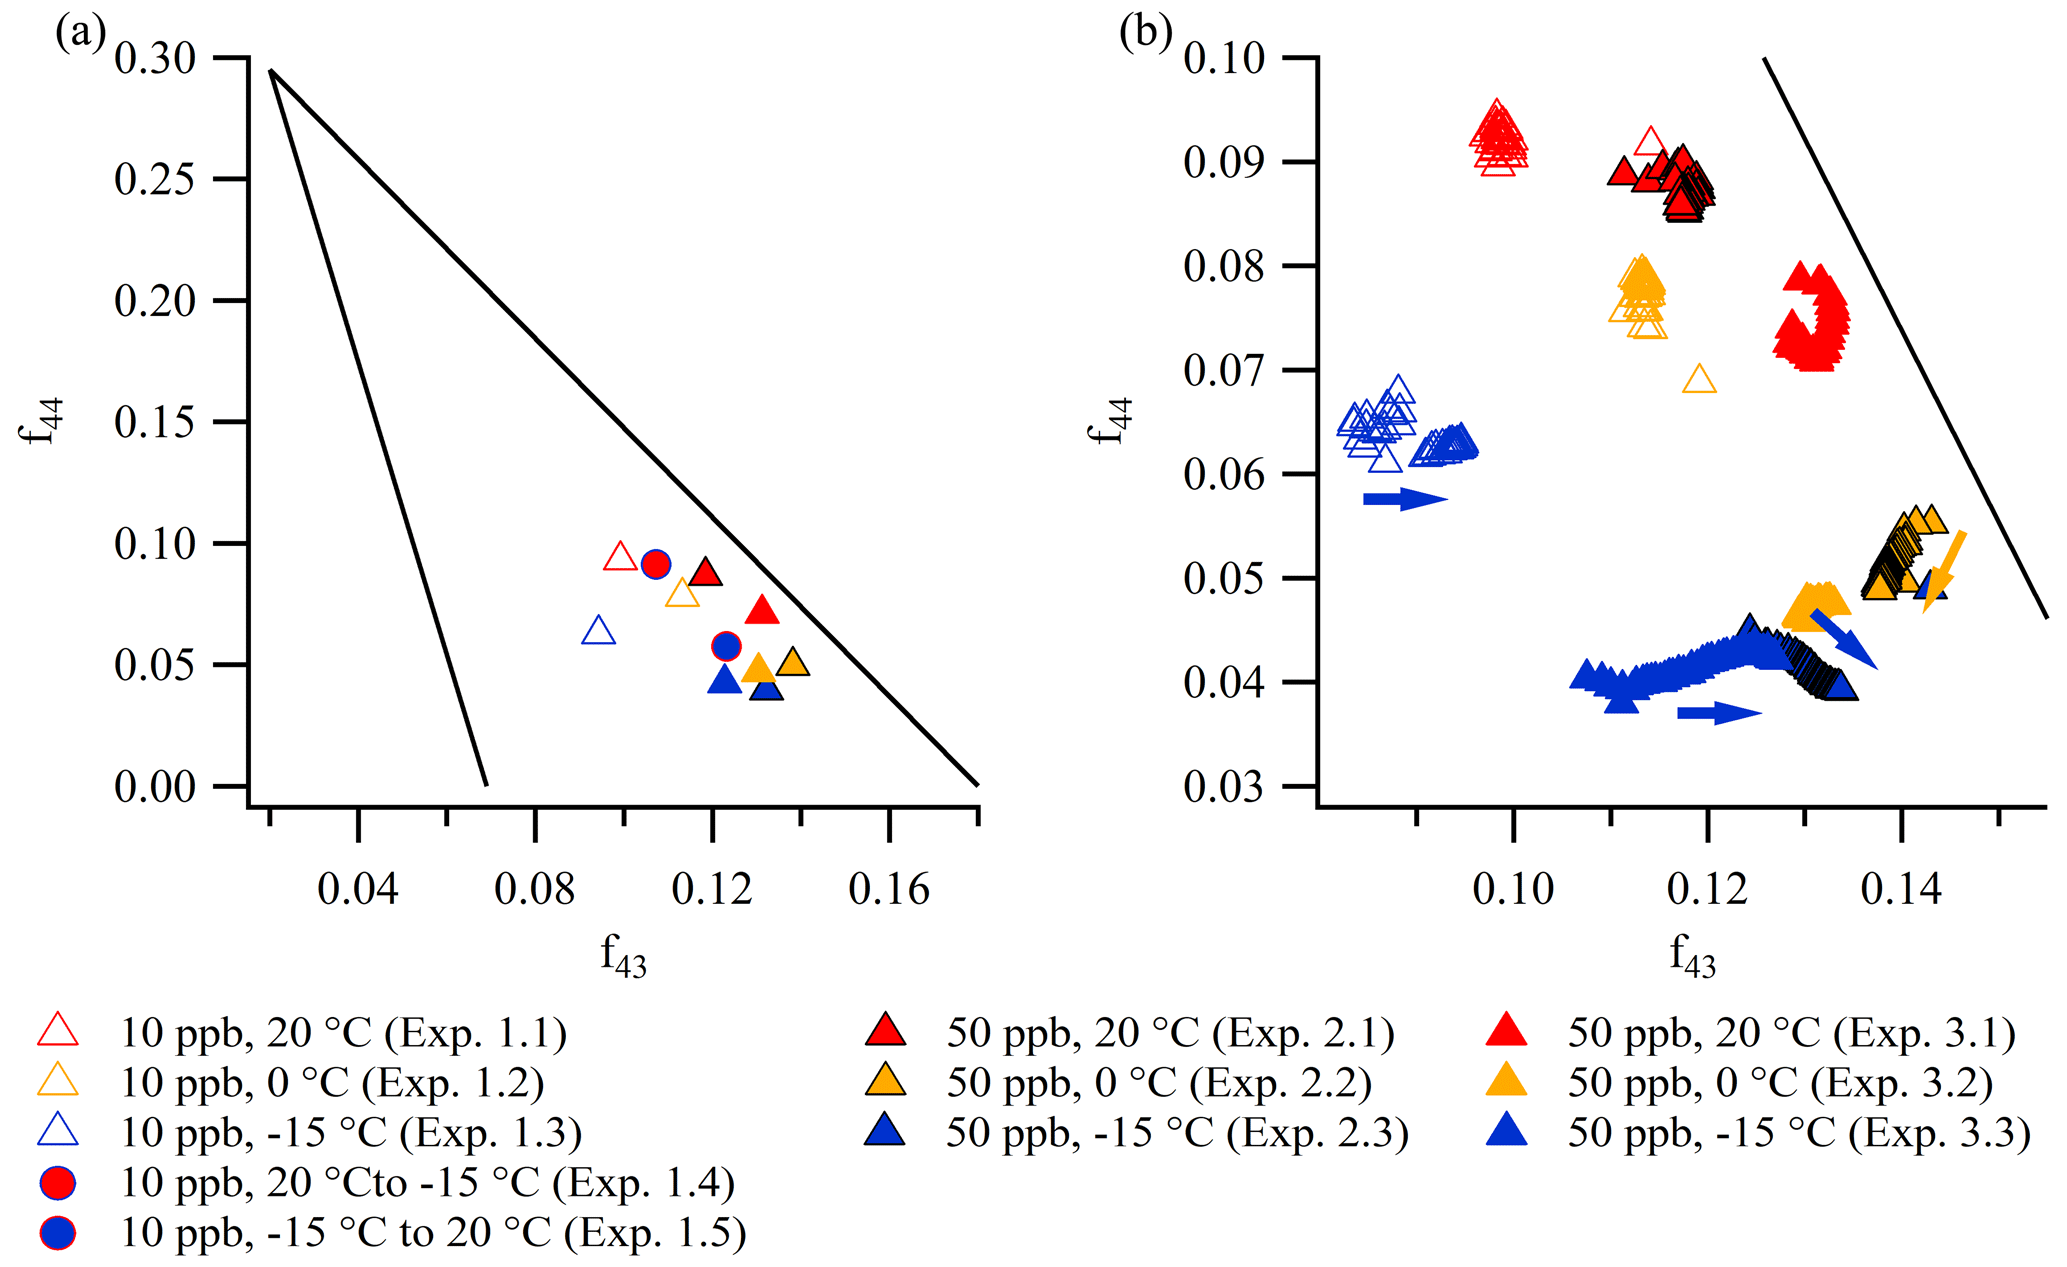
Figure 6The elemental composition of particles formed in experiments 1.1–1.3, 2.1–2.3, and 3.1–3.3 depicted in triangle plots (f44 vs. f43) (a) at the mass peak (five-data-point average) and in the expansion (b) during the experiments (∼ 5 min time resolution, arrows indicate the direction of time). Note the different scales of the axes in panels (a) and (b). In the triangle plots, the lines ( and , where and y≤0.295) define the common composition of oxygenated organic aerosol (Ng et al., 2010).
The triangle plots show that particles formed at higher temperature have a higher f44 (i.e., CO, acid-derived functionalities) than particles formed at lower temperature. No clear trends with temperature are observed for f43 (i.e., C2H3O+, non-acid-derived functionalities). Particles formed at a lower α-pinene concentration (10 ppb) have higher f44 and a lower f43 than particles formed at a higher α-pinene concentration (50 ppb). This suggests that acid-derived functionalities are more prevalent in α-pinene SOA formed at a low precursor concentration (and thus low particle mass loading), which is consistent with less partitioning of the more volatile, less oxidized material to the particle phase. In all experiments, f44 values are between 0.04 and 0.1, and f43 values are between 0.08 and 0.15. These levels are comparable to values reported in the literature from chamber experiments conducted at comparable α-pinene concentrations, both at room temperature (Chhabra et al., 2011; Kristensen et al., 2017) and at −15 ∘C (Kristensen et al., 2017). The slight continuous increase in f43 (Fig. 6b) in the experiments conducted at −15 ∘C (experiments 1.3, 2.3, and 3.3) is in agreement with observations by Kristensen et al. (2017) from experiments performed at −15 ∘C at identical α-pinene concentrations. Moreover, the non-evolving f43 at 20 ∘C is also in agreement with the literature exploring α-pinene SOA at comparable concentrations and room temperature (Chhabra et al., 2011; Kristensen et al., 2017). As the increase in f43 is only observed in the cold experiments, especially −15 ∘C, this suggests that the formation of species that give rise to high f43 values is highly temperature dependent.
3.2.3 Estimated particle content of organic acids
In AMS mass spectra, 44 has been shown to be a good tracer for the content of organic acids in SOA (Canagaratna et al., 2015; Yatavelli et al., 2015). Yatavelli et al. (2015) investigated how the mass concentration of molecules (R-COOH) containing one or more acid functionalities, can be related to the AMS-derived mass concentration of 44 multiplied by scaling factors. Yatavelli et al. (2015) estimated that 10 % to 50 % of the organic particle mass in the Northern Hemisphere can be attributed to molecules containing the carboxylic acid functionality. Inspired by Yatavelli et al. (2015), we explore how the intensity of 44 in the AMS mass spectra compares to the mass concentration of organic acids (R-COOH) and organic acid functionalities (-COOH) based on results from the off-line LC-MS analysis of filter samples obtained by the end of the AURA chamber experiments. As described in detail in Kristensen et al. (2020), LC-MS analysis was performed to identify and quantify 10 carboxylic acids formed in the dark ozonolysis of α-pinene (constituting 18 %–38 % of the SOA mass concentration in the current experiments), as well as 30 dimer esters (constituting in total 4 %–11 % of the total SOA mass concentration in the current experiments).
For the 50 ppb α-pinene experiments 3.1, 3.2, and 3.3, conducted at 20, 0, and −15 ∘C, respectively, Fig. 7a shows the mass concentration of organic acids (R-COOH) identified from LC-MS analysis (Kristensen et al., 2020), and the mass concentration of the 44 signal in the AMS mass spectra, scaled to the SMPS mass concentration and corrected for density, as previously described. For both techniques (AMS and LC-MS), the mass concentration of organic acids is lower at higher temperatures. The AMS 44 mass concentrations are lower than the organic acid concentrations obtained from the LC-MS by factors of 2.55, 4.11, and 4.65 at 20, 0, and −15 ∘C, respectively. In the following, these numbers will be referred to as scaling factors. For comparison, Yatavelli et al. (2015) reported that the 44 AMS signal was a factor of ∼ 2.32 lower than the mass concentration of organic acids in SOA during summertime in a forest area dominated by pine trees near Colorado Springs, USA. Their result is in very good agreement with the scaling factor obtained in the experiment conducted at 20 ∘C, which supports the hypothesis that the most important organic acids in α-pinene SOA are determined by the LC-MS method. The variation in scaling factors at the different temperatures likely reflects that organic acids with different numbers of acid functionality (-COOH) and/or different multifunctional moieties exhibit different degrees of thermal decomposition to the 44 signal in the AMS (Canagaratna et al., 2015; Yatavelli et al., 2015). The similarity of the scaling factors obtained in the 0 ∘C (4.11) and −15 ∘C (4.65) experiments is consistent with the fact that the SOA chemical composition at those temperatures have a higher degree of comparability relative to the 20 ∘C experiment, where a lower scaling factor (2.55) is obtained (recall Figs. 4 and 6).
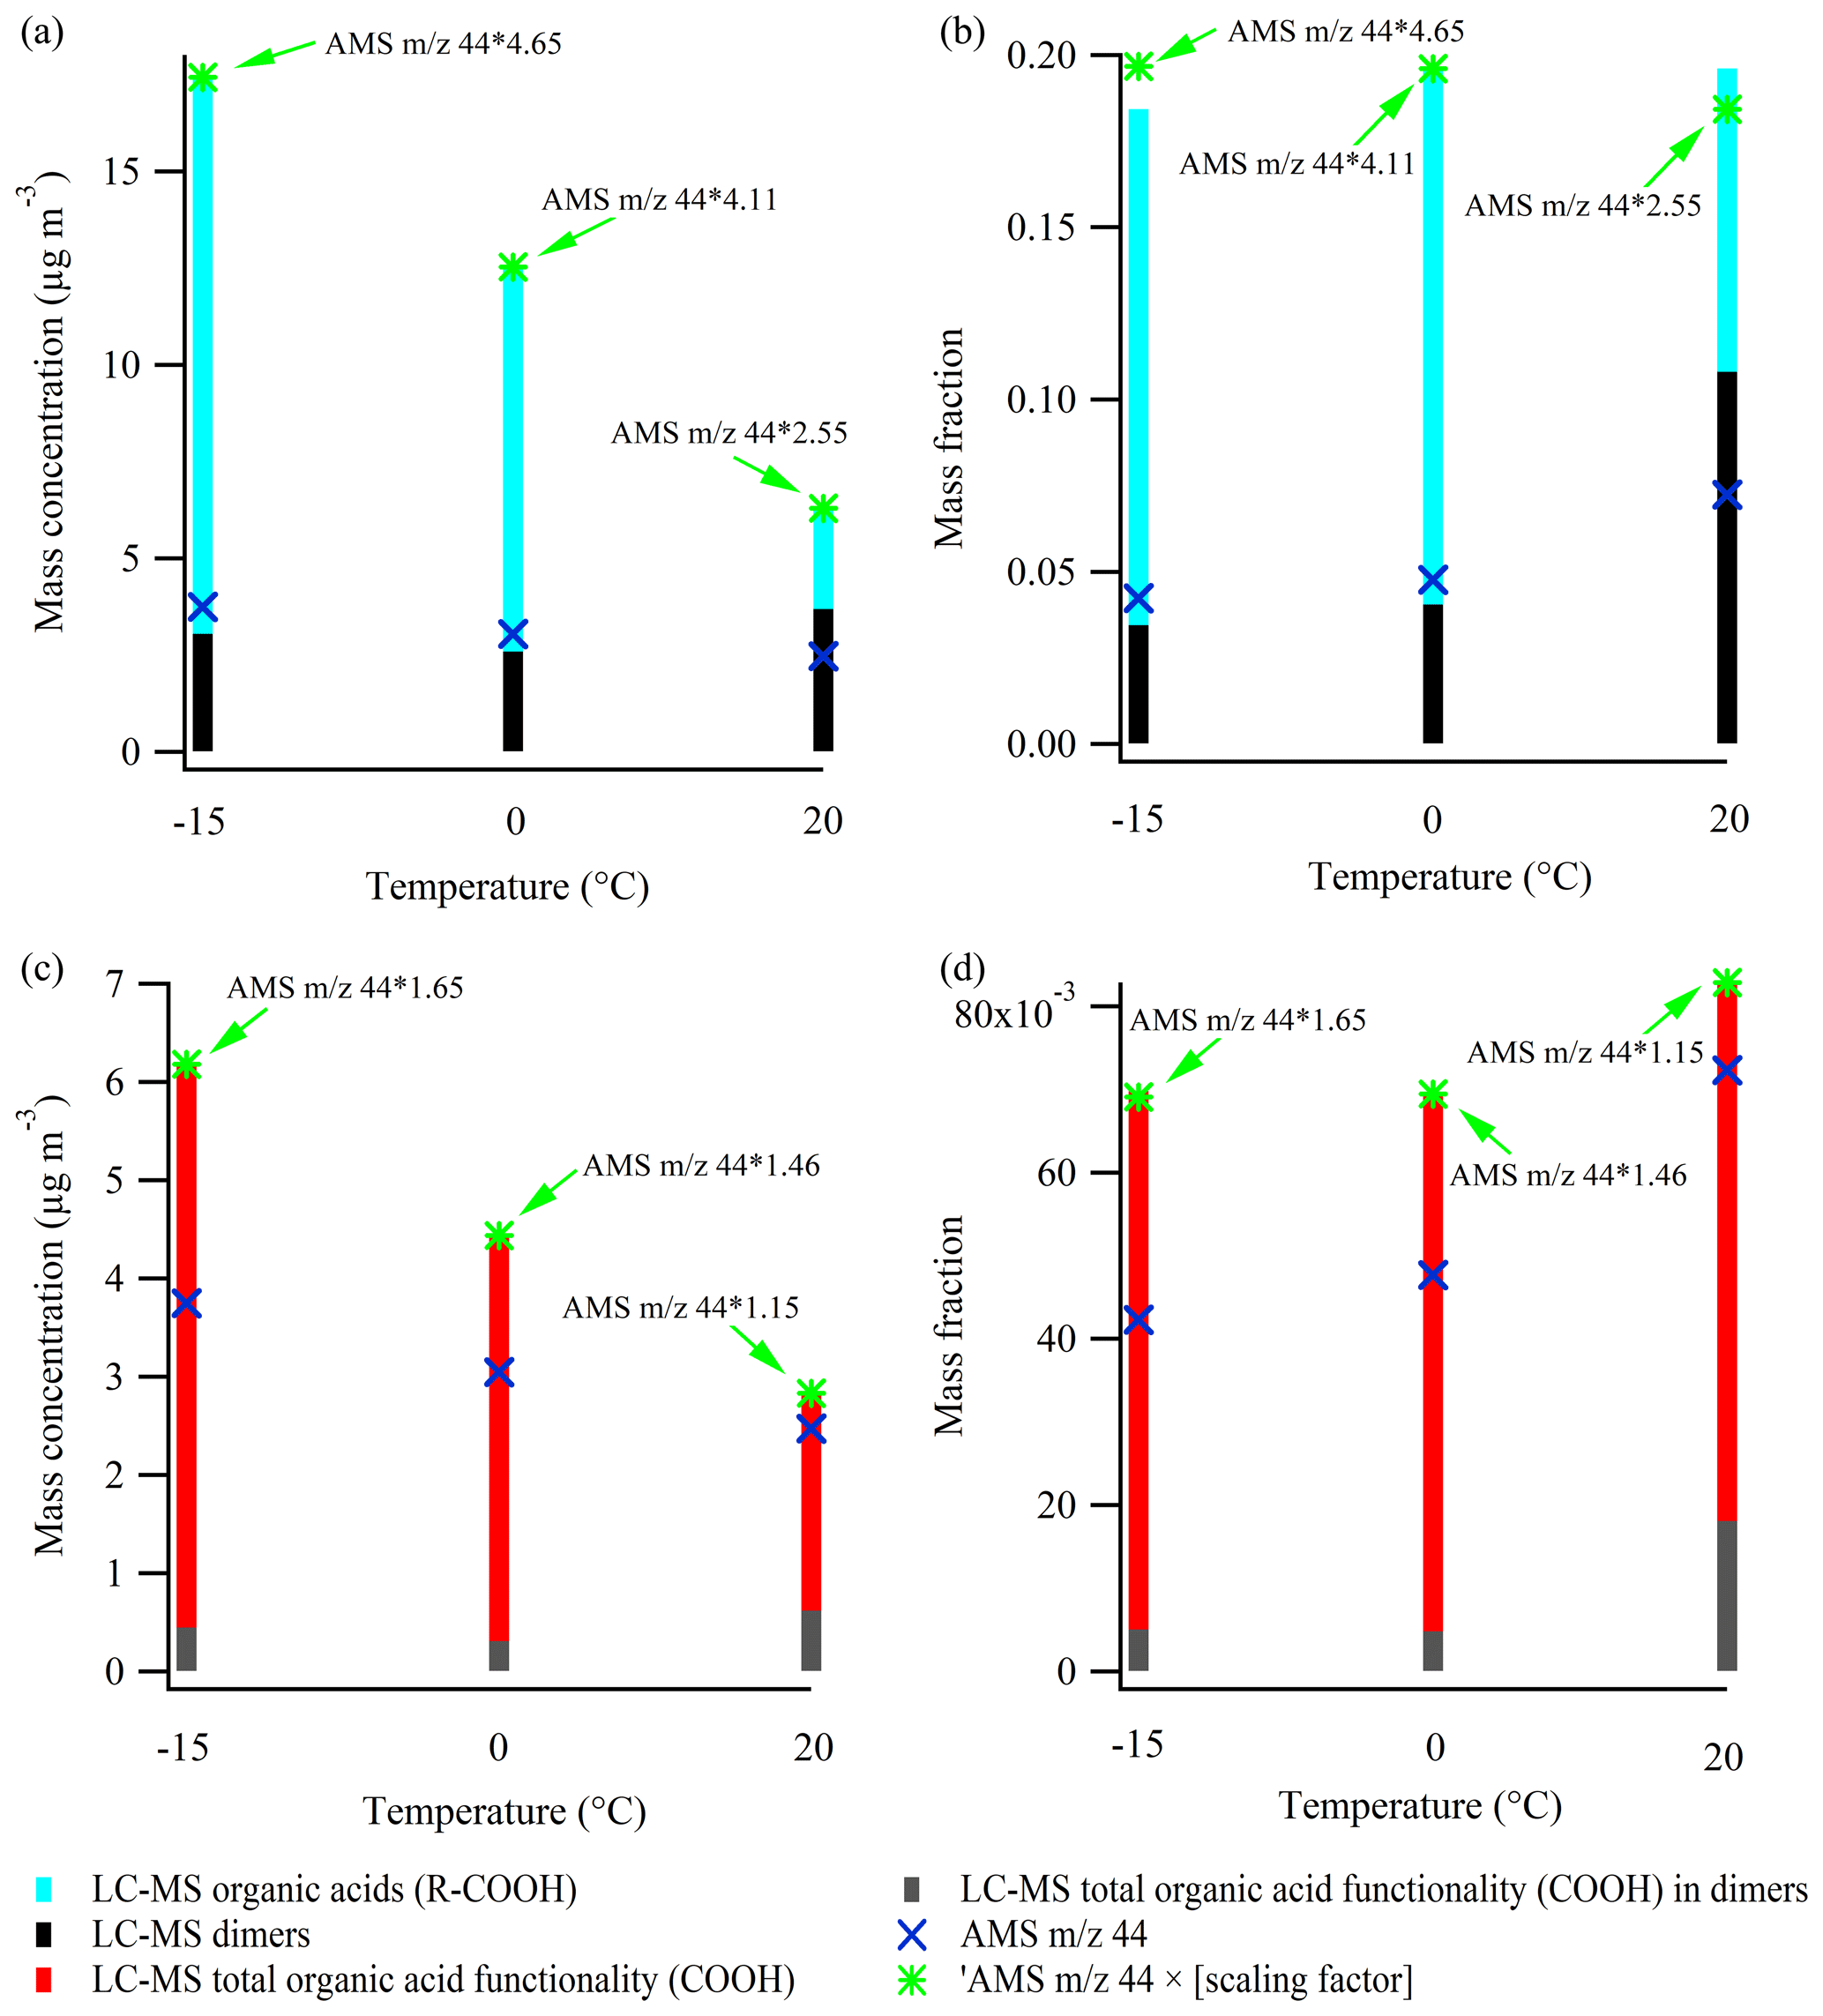
Figure 7LC-MS-derived organic acid (R-COOH) mass concentration (a) and organic acid mass fraction (b) at −15, 0, and 20 ∘C. The organic acid functionality (-COOH) mass concentration and mass concentration at the three temperatures are shown in panels (c) and (d), respectively. Additionally, the corresponding results related to dimers are shown. The panels also show 44 – a tracer of organic acids – from the AMS mass spectra and the scaling factors to be applied to reach the level of organic acid (functionality) measured by the LC-MS. The particle filter samples analyzed by the LC-MS are obtained by the end of the experiments (see Table 1), whereas the AMS results are obtained right before the filter sampling (10 min average). The figure is based on data from experiments 3.1–3.3.
As lower SOA mass is produced at the higher temperatures, it is also relevant to investigate how the mass fractions of organic acids vary with temperature (Fig. 7b). The mass fractions are obtained by dividing the LC-MS and AMS results presented in Fig. 7a by the total SOA mass concentration measured in the chamber, prior to the filter sampling, and corrected as described previously. By application of the scaling factors found above, the two techniques are in good agreement, although slight differences appear at 20 and −15 ∘C. While the mass concentration of organic acids (R-COOH) obtained from the LC-MS decreased significantly with higher temperature (Fig. 7a), no trend was observed in organic acid mass fractions (Fig. 7b). Interestingly, for 44 from the AMS mass spectra, the temperature-dependent trend changes from decreasing with higher temperature (Fig. 7a) to increasing when focusing on the mass fraction of 44 to total SOA mass concentration (Fig. 7b).
Some of the organic acids as well as the dimers observed from the LC-MS data (Fig. 7a, b) contain multiple acid functionalities (-COOH) (Kristensen et al., 2020). Therefore, it is also relevant to investigate how the mass concentration and mass fraction of acid functionalities (from the suggested molecular structures; Kristensen et al., 2020) relate to the 44 signal obtained from the AMS. Lower masses of organic acid functionalities (-COOH) are obtained at higher temperatures, and the scaling factors of 1.15, 1.46, and 1.70 applied to the 44 AMS signal at 20, 0, and −15 ∘C, respectively (Fig. 7c), are lower and less variable with temperature than those for the mass concentrations of organic acids (R-COOH; Fig. 7a). The difference between the scaling factors, related to the mass concentration of organic acids (R-COOH; Fig. 7a) and organic acid functionalities (-COOH; Fig. 7c) at the same temperatures, reflects the mass of the organic acid backbone (i.e., R in R-COOH). The observed trends in Fig. 7a and c suggest that organic acids with heavier backbones are formed at temperatures below 20 ∘C.
Figure 7d shows that carboxylic acid functionalities (-COOH) account for a greater fraction of the observed SOA mass concentration at higher temperatures, consistent with the observation of higher f44 values at higher temperatures in Fig. 6. This trend is the inverse of the temperature-dependent trends of the absolute mass concentration of organic acid functionalities (-COOH, Fig. 7c) and organic acids (R-COOH), both in this study (Fig. 7b) and in previous studies (Zhang et al., 2015; Kristensen et al., 2015).
Overall, the comparison of the 44 signal from the AMS mass spectra and SOA acid content obtained from LC-MS data shows that organic acids and organic acid functionalities are important constituents of α-pinene-derived SOA and that it is relevant to investigate and compare different techniques for their quantification.
The chemical composition of α-pinene-derived SOA was investigated using HR-ToF-AMS in a series of experiments performed at different α-pinene concentrations (10 and 50 ppb) and temperatures (20, 0, and −15 ∘C, and ramps in the range of 20 to −15 and −15 to 20 ∘C). PMF analysis was applied to a combined AMS dataset representing eight different experimental conditions. The PMF analysis revealed that the chemical composition of the SOA particles could be described by four factors, which differ in their dependence on VOC concentration and experiment temperature. To our knowledge, this is the first study using PMF analysis on AMS chamber data to reveal distinct factors sensitive to temperature.
This analysis demonstrates that the α-pinene SOA oxidation level is dependent on both temperature and the α-pinene concentration: SOA oxidation level increases with higher temperature and with lower SOA mass loading. The dataset suggests that particles formed at 0 ∘C are more chemically similar to particles formed at −15 ∘C than to particles formed at 20 ∘C. Temperature ramps over a range of 35 ∘C were only accompanied by slight changes in chemical composition, with increasing oxidation levels during heating ramps and decreasing oxidation levels during cooling ramps. The investigation demonstrates that the temperature at which particles are formed is decisive for their properties during α-pinene SOA lifetime. This is interesting from an atmospheric perspective as secondary organic aerosol particles are formed and age over a wide range of temperatures.
TThe PET code (Ulbrich et al., 2009) is freely available from the following website: http://cires1.colorado.edu/jimenez-group/wiki/index.php/PMF-AMS_Analysis_Guide (last access: 15 July 2021).
The PMF software is available from Pentti Paatero (Pentti.Paatero86@gmail.com).
Data are available upon request from the corresponding author.
The supplement related to this article is available online at: https://doi.org/10.5194/acp-21-11545-2021-supplement.
MB, ME, MG, and HBP supervised the ACCHA campaign. KK and LNJ initialized the chamber for experiments. KK and LNJ measured and analyzed the aerosol phase. KK, BR, RT, and LLJQ measured and analyzed the VOCs and their oxidation products. LNJ performed the AMS experiments, and LNJ analyzed the AMSA data with guidance and assistance from MRC. LNJ prepared the paper with contributions from all co-authors.
The authors declare that they have no conflict of interest.
This research has been supported by the Aarhus Universitets Forskningsfond (AUFF NOVA grant), the European Research Council (ERC grant no. 638703; COALA), and the Academy of Finland (project nos. 307331, 317380, and 320094).
This paper was edited by Astrid Kiendler-Scharr and reviewed by two anonymous referees.
Aiken, A. C., DeCarlo, P. F., and Jimenez, J. L.: Elemental analysis of organic species with electron ionization high-resolution mass spectrometry, Anal. Chem., 79, 8350–8358, https://doi.org/10.1021/ac071150w, 2007.
Aiken, A. C., Decarlo, P. F., Kroll, J. H., Worsnop, D. R., Huffman, J. A., Docherty, K. S., Ulbrich, I. M., Mohr, C., Kimmel, J. R., Sueper, D., Sun, Y., Zhang, Q., Trimborn, A., Northway, M., Ziemann, P. J., Canagaratna, M. R., Onasch, T. B., Alfarra, M. R., Prevot, A. S. H., Dommen, J., Duplissy, J., Metzger, A., Baltensperger, U., and Jimenez, J. L.: and ratios of primary, secondary, and ambient organic aerosols with high-resolution time-of-flight aerosol mass spectrometry, Environ. Sci. Technol., 42, 4478–4485, https://doi.org/10.1021/es703009q, 2008.
Alfarra, M. R.: Insights into the atmospheric organic aerosols using an aerosol mass spectrometer, Thesis, University of Manchester, Manchester, UK, 2004.
Alfarra, M. R., Coe, H., Allan, J. D., Bower, K. N., Boudries, H., Canagaratna, M. R., Jimenez, J. L., Jayne, J. T., Garforth, A. A., Li, S.-M., and Worsnop, D. R.: Characterization of urban and rural organic particulate in the Lower Fraser Valley using two Aerodyne Aerosol Mass Spectrometers, Atmos. Environ., 38, 5745–5758, https://doi.org/10.1016/j.atmosenv.2004.01.054, 2004.
Axson, J. L., Takahashi, K., De Haan, D. O., and Vaida, V.: Gas-phase water-mediated equilibrium between methylglyoxal and its geminal diol, P. Natl. Acad. Sci. USA, 107, 6687–6692, https://doi.org/10.1073/pnas.0912121107, 2010.
Bahreini, R., Keywood, M. D., Ng, N. L., Varutbangkul, V., Gao, S., Flagan, R. C., Seinfeld, J. H., Worsnop, D. R., and Jimenez, J. L.: Measurements of secondary organic aerosol from oxidation of cycloalkenes, terpenes, and m-xylene using an Aerodyne aerosol mass spectrometer, Environ. Sci. Technol., 39, 5674, https://doi.org/10.1021/es048061a, 2005.
Canagaratna, M. R., Jayne, J. T., Jimenez, J. L., Allan, J. D., Alfarra, M. R., Zhang, Q., Onasch, T. B., Drewnick, F., Coe, H., Middlebrook, A., Delia, A., Williams, L. R., Trimborn, A. M., Northway, M. J., DeCarlo, P. F., Kolb, C. E., Davidovits, P., and Worsnop, D. R.: Chemical and microphysical characterization of ambient aerosols with the aerodyne aerosol mass spectrometer, Mass Spectrom. Rev., 26, 185–222, https://doi.org/10.1002/mas.20115, 2007.
Canagaratna, M. R., Jimenez, J. L., Kroll, J. H., Chen, Q., Kessler, S. H., Massoli, P., Hildebrandt Ruiz, L., Fortner, E., Williams, L. R., Wilson, K. R., Surratt, J. D., Donahue, N. M., Jayne, J. T., and Worsnop, D. R.: Elemental ratio measurements of organic compounds using aerosol mass spectrometry: characterization, improved calibration, and implications, Atmos. Chem. Phys., 15, 253–272, https://doi.org/10.5194/acp-15-253-2015, 2015.
Cappa, C. D. and Wilson, K. R.: Evolution of organic aerosol mass spectra upon heating: implications for OA phase and partitioning behavior, Atmos. Chem. Phys., 11, 1895–1911, https://doi.org/10.5194/acp-11-1895-2011, 2011.
Chhabra, P. S., Flagan, R. C., and Seinfeld, J. H.: Elemental analysis of chamber organic aerosol using an aerodyne high-resolution aerosol mass spectrometer, Atmos. Chem. Phys., 10, 4111–4131, https://doi.org/10.5194/acp-10-4111-2010, 2010.
Chhabra, P. S., Ng, N. L., Canagaratna, M. R., Corrigan, A. L., Russell, L. M., Worsnop, D. R., Flagan, R. C., and Seinfeld, J. H.: Elemental composition and oxidation of chamber organic aerosol, Atmos. Chem. Phys., 11, 8827–8845, https://doi.org/10.5194/acp-11-8827-2011, 2011.
Craven, J. S., Yee, L. D., Ng, N. L., Canagaratna, M. R., Loza, C. L., Schilling, K. A., Yatavelli, R. L. N., Thornton, J. A., Ziemann, P. J., Flagan, R. C., and Seinfeld, J. H.: Analysis of secondary organic aerosol formation and aging using positive matrix factorization of high-resolution aerosol mass spectra: application to the dodecane low-NOx system, Atmos. Chem. Phys., 12, 11795–11817, https://doi.org/10.5194/acp-12-11795-2012, 2012.
Cubison, M. J. and Jimenez, J. L.: Statistical precision of the intensities retrieved from constrained fitting of overlapping peaks in high-resolution mass spectra, Atmos. Meas. Tech., 8, 2333–2345, https://doi.org/10.5194/amt-8-2333-2015, 2015.
DeCarlo, P. F., Kimmel, J. R., Trimborn, A., Northway, M. J., Jayne, J. T., Aiken, A. C., Gonin, M., Fuhrer, K., Horvath, T., Docherty, K. S., Worsnop, D. R., and Jimenez, J. L.: Field-deployable, high-resolution, time-of-flight aerosol mass spectrometer, Anal. Chem., 78, 8281–8289, https://doi.org/10.1021/ac061249n, 2006.
Denjean, C., Formenti, P., Picquet-Varrault, B., Camredon, M., Pangui, E., Zapf, P., Katrib, Y., Giorio, C., Tapparo, A., Temime-Roussel, B., Monod, A., Aumont, B., and Doussin, J. F.: Aging of secondary organic aerosol generated from the ozonolysis of α-pinene: effects of ozone, light and temperature, Atmos. Chem. Phys., 15, 883–897, https://doi.org/10.5194/acp-15-883-2015, 2015a.
Denjean, C., Formenti, P., Picquet-Varrault, B., Pangui, E., Zapf, P., Katrib, Y., Giorio, C., Tapparo, A., Monod, A., Temime-Roussel, B., Decorse, P., Mangeney, C., and Doussin, J. F.: Relating hygroscopicity and optical properties to chemical composition and structure of secondary organic aerosol particles generated from the ozonolysis of α-pinene, Atmos. Chem. Phys., 15, 3339–3358, https://doi.org/10.5194/acp-15-3339-2015, 2015b.
Docherty, K. S., Jaoui, M., Corse, E., Jimenez, J. L., Offenberg, J. H., Lewandowski, M., and Kleindienst, T. E.: Collection Efficiency of the Aerosol Mass Spectrometer for Chamber-Generated Secondary Organic Aerosols, Aerosol Sci. Tech., 47, 294–309, https://doi.org/10.1080/02786826.2012.752572, 2013.
Ehn, M., Thornton, J. A., Kleist, E., Sipilä, M., Junninen, H., Pullinen, I., Springer, M., Rubach, F., Tillmann, R., Lee, B., Lopez-Hilfiker, F., Andres, S., Acir, I.-H., Rissanen, M., Jokinen, T., Schobesberger, S., Kangasluoma, J., Kontkanen, J., Nieminen, T., Kurtén, T., Nielsen, L. B., Jørgensen, S., Kjaergaard, H. G., Canagaratna, M., Maso, M. D., Berndt, T., Petäjä, T., Wahner, A., Kerminen, V.-M., Kulmala, M., Worsnop, D. R., Wildt, J., and Mentel, T. F.: A large source of low-volatility secondary organic aerosol, Nature, 506, 476–479, https://doi.org/10.1038/nature13032, 2014.
Hakola, H., Tarvainen, V., Laurila, T., Hiltunen, V., Hellén, H., and Keronen, P.: Seasonal variation of VOC concentrations above a boreal coniferous forest, Atmos. Environ., 37, 1623–1634, https://doi.org/10.1016/S1352-2310(03)00014-1, 2003.
Hallquist, M., Wenger, J. C., Baltensperger, U., Rudich, Y., Simpson, D., Claeys, M., Dommen, J., Donahue, N. M., George, C., Goldstein, A. H., Hamilton, J. F., Herrmann, H., Hoffmann, T., Iinuma, Y., Jang, M., Jenkin, M. E., Jimenez, J. L., Kiendler-Scharr, A., Maenhaut, W., McFiggans, G., Mentel, Th. F., Monod, A., Prévôt, A. S. H., Seinfeld, J. H., Surratt, J. D., Szmigielski, R., and Wildt, J.: The formation, properties and impact of secondary organic aerosol: current and emerging issues, Atmos. Chem. Phys., 9, 5155–5236, https://doi.org/10.5194/acp-9-5155-2009, 2009.
Heald, C. L., Kroll, J. H., Jimenez, J. L., Docherty, K. S., DeCarlo, P. F., Aiken, A. C., Chen, Q., Martin, S. T., Farmer, D. K., and Artaxo, P.: A simplified description of the evolution of organic aerosol composition in the atmosphere, Geophys. Res. Lett., 37, L08803, https://doi.org/10.1029/2010GL042737, 2010.
IPCC: Climate Change 2013: The Physical Science Basis, in: Contribution of Working Group I to the Fifth Assessment Report of the Intergovernmental Panel on Climate Change, Cambridge University Press, Cambridge, United Kingdom and New York, USA, 2013.
Jayne, J. T., Leard, D. C., Zhang, X., Davidovits, P., Smith, K. A., Kolb, C. E., and Worsnop, D. R.: Development of an Aerosol Mass Spectrometer for Size and Composition Analysis of Submicron Particles, Aerosol Sci. Tech., 33, 49–70, https://doi.org/10.1080/027868200410840, 2000.
Jimenez, J. L., Canagaratna, M. R., Donahue, N. M., Prevot, A. S. H., Zhang, Q., Kroll, J. H., DeCarlo, P. F., Allan, J. D., Coe, H., Ng, N. L., Aiken, A. C., Docherty, K. S., Ulbrich, I. M., Grieshop, A. P., Robinson, A. L., Duplissy, J., Smith, J. D., Wilson, K. R., Lanz, V. A., Hueglin, C., Sun, Y. L., Tian, J., Laaksonen, A., Raatikainen, T., Rautiainen, J., Vaattovaara, P., Ehn, M., Kulmala, M., Tomlinson, J. M., Collins, D. R., Cubison, M. J., Dunlea, E. J., Huffman, J. A., Onasch, T. B., Alfarra, M. R., Williams, P. I., Bower, K., Kondo, Y., Schneider, J., Drewnick, F., Borrmann, S., Weimer, S., Demerjian, K., Salcedo, D., Cottrell, L., Griffin, R., Takami, A., Miyoshi, T., Hatakeyama, S., Shimono, A., Sun, J. Y., Zhang, Y. M., Dzepina, K., Kimmel, J. R., Sueper, D., Jayne, J. T., Herndon, S. C., Trimborn, A. M., Williams, L. R., Wood, E. C., Middlebrook, A. M., Kolb, C. E., Baltensperger, U., and Worsnop, D. R.: Evolution of Organic Aerosols in the Atmosphere, Science, 326, 1525–1529, https://doi.org/10.1126/science.1180353, 2009.
Kirkby, J., Duplissy, J., Sengupta, K., Frege, C., Gordon, H., Williamson, C., Heinritzi, M., Simon, M., Yan, C., Almeida, J., Tröstl, J., Nieminen, T., Ortega, I. K., Wagner, R., Adamov, A., Amorim, A., Bernhammer, A.-K., Bianchi, F., Breitenlechner, M., Brilke, S., Chen, X., Craven, J., Dias, A., Ehrhart, S., Flagan, R. C., Franchin, A., Fuchs, C., Guida, R., Hakala, J., Hoyle, C. R., Jokinen, T., Junninen, H., Kangasluoma, J., Kim, J., Krapf, M., Kürten, A., Laaksonen, A., Lehtipalo, K., Makhmutov, V., Mathot, S., Molteni, U., Onnela, A., Peräkylä, O., Piel, F., Petäjä, T., Praplan, A. P., Pringle, K., Rap, A., Richards, N. A. D., Riipinen, I., Rissanen, M. P., Rondo, L., Sarnela, N., Schobesberger, S., Scott, C. E., Seinfeld, J. H., Sipilä, M., Steiner, G., Stozhkov, Y., Stratmann, F., Tomé, A., Virtanen, A., Vogel, A. L., Wagner, A. C., Wagner, P. E., Weingartner, E., Wimmer, D., Winkler, P. M., Ye, P., Zhang, X., Hansel, A., Dommen, J., Donahue, N. M., Worsnop, D. R., Baltensperger, U., Kulmala, M., Carslaw, K. S., and Curtius, J.: Ion-induced nucleation of pure biogenic particles, Nature, 533, 521–526, https://doi.org/10.1038/nature17953, 2016.
Kourtchev, I., Giorio, C., Manninen, A., Wilson, E., Mahon, B., Aalto, J., Kajos, M., Venables, D., Ruuskanen, T., Levula, J., Loponen, M., Connors, S., Harris, N., Zhao, D., Kiendler-Scharr, A., Mentel, T., Rudich, Y., Hallquist, M., Doussin, J.-F., Maenhaut, W., Bäck, J., Petäjä, T., Wenger, J., Kulmala, M., and Kalberer, M.: Enhanced Volatile Organic Compounds emissions and organic aerosol mass increase the oligomer content of atmospheric aerosols, Sci. Rep.-UK, 6, 35038, https://doi.org/10.1038/srep35038, 2016.
Kristensen, K., Jensen, L. N., Glasius, M., and Bilde, M.: The effect of sub-zero temperature on the formation and composition of secondary organic aerosol from ozonolysis of alpha-pinene, Environ. Sci.-Proc. Imp., 19, 1220–1234, https://doi.org/10.1039/c7em00231a, 2017.
Kristensen, K., Jensen, L. N., Quéléver, L. L. J., Christiansen, S., Rosati, B., Elm, J., Teiwes, R., Pedersen, H. B., Glasius, M., Ehn, M., and Bilde, M.: The Aarhus Chamber Campaign on Highly Oxygenated Organic Molecules and Aerosols (ACCHA): particle formation, organic acids, and dimer esters from α-pinene ozonolysis at different temperatures, Atmos. Chem. Phys., 20, 12549–12567, https://doi.org/10.5194/acp-20-12549-2020, 2020.
Kroll, J. H. and Seinfeld, J. H.: Chemistry of secondary organic aerosol: Formation and evolution of low-volatility organics in the atmosphere, Atmos. Environ., 42, 3593–3624, https://doi.org/10.1016/j.atmosenv.2008.01.003, 2008.
Kroll, J. H., Donahue, N. M., Jimenez, J. L., Kessler, S. H., Canagaratna, M. R., Wilson, K. R., Altieri, K. E., Mazzoleni, L. R., Wozniak, A. S., Bluhm, H., Mysak, E. R., Smith, J. D., Kolb, C. E., and Worsnop, D. R.: Carbon oxidation state as a metric fordescribing the chemistry of atmospheric organic aerosol, Nat. Chem., 3, 133–139, 2011.
Kuwata, M., Zorn, S. R., and Martin, S. T.: Using elemental ratios to predict the density of organic material composed of carbon, hydrogen, and oxygen, Environ. Sci. Technol., 46, 787–794, 2011.
Lanz, V. A., Alfarra, M. R., Baltensperger, U., Buchmann, B., Hueglin, C., and Prévôt, A. S. H.: Source apportionment of submicron organic aerosols at an urban site by factor analytical modelling of aerosol mass spectra, Atmos. Chem. Phys., 7, 1503–1522, https://doi.org/10.5194/acp-7-1503-2007, 2007.
Lee, A. K. Y., Abbatt, J. P. D., Leaitch, W. R., Li, S.-M., Sjostedt, S. J., Wentzell, J. J. B., Liggio, J., and Macdonald, A. M.: Substantial secondary organic aerosol formation in a coniferous forest: observations of both day- and nighttime chemistry, Atmos. Chem. Phys., 16, 6721–6733, https://doi.org/10.5194/acp-16-6721-2016, 2016.
Murphy, B. N., Julin, J., Riipinen, I., and Ekman, A. M. L.: Organic aerosol processing in tropical deep convective clouds: Development of a new model (CRM-ORG) and implications for sources of particle number: Particle number Sources in CRM-ORG, J. Geophys. Res.-Atmos., 120, 10441–10464, https://doi.org/10.1002/2015JD023551, 2015.
Ng, N. L., Canagaratna, M. R., Zhang, Q., Jimenez, J. L., Tian, J., Ulbrich, I. M., Kroll, J. H., Docherty, K. S., Chhabra, P. S., Bahreini, R., Murphy, S. M., Seinfeld, J. H., Hildebrandt, L., Donahue, N. M., DeCarlo, P. F., Lanz, V. A., Prévôt, A. S. H., Dinar, E., Rudich, Y., and Worsnop, D. R.: Organic aerosol components observed in Northern Hemispheric datasets from Aerosol Mass Spectrometry, Atmos. Chem. Phys., 10, 4625–4641, https://doi.org/10.5194/acp-10-4625-2010, 2010.
Ng, N. L., Canagaratna, M. R., Jimenez, J. L., Chhabra, P. S., Seinfeld, J. H., and Worsnop, D. R.: Changes in organic aerosol composition with aging inferred from aerosol mass spectra, Atmos. Chem. Phys., 11, 6465–6474, https://doi.org/10.5194/acp-11-6465-2011, 2011.
O'Dowd, C. D., Aalto, P., Hmeri, K., Kulmala, M., and Hoffmann, T.: Atmospheric particles from organic vapours, Nature, 416, 497–498, https://doi.org/10.1038/416497a, 2002.
Paatero, P.: Least squares formulation of robust non-negative factor analysis, Chemometr. Intell. Lab., 37, 23–35, https://doi.org/10.1016/S0169-7439(96)00044-5, 1997.
Paatero, P. and Tapper, U.: Positive matrix factorization: A non-negative factor model with optimal utilization of error estimates of data values, Environmetrics, 5, 111–126, 1994.
Pankow, J. F.: An absorption model of gas/particle partitioning of organic compounds in the atmosphere, Atmos. Environ., 28, 185–188, 1994a.
Pankow, J. F.: An absorption model of the gas/aerosol partitioning involved in the formation of secondary organic aerosol, Atmos. Environ., 28, 189–193, 1994b.
Pathak, R. K., Stanier, C. O., Donahue, N. M., and Pandis, S. N.: Ozonolysis of α-pinene at atmospherically relevant concentrations: Temperature dependence of aerosol mass fractions (yields), J. Geophys. Res.-Atmos., 112, D03201, https://doi.org/10.1029/2006JD007436, 2007.
Portillo-Estrada, M., Korhonen, J. F. J., Pihlatie, M., Pumpanen, J., Frumau, A. K. F., Morillas, L., Tosens, T., and Niinemets, Ü.: Inter- and intra-annual variations in canopy fine litterfall and carbon and nitrogen inputs to the forest floor in two European coniferous forests. Ann. For. Sci., 70, 367–379, https://doi.org/10.1007/s13595-013-0273-0, 2013.
Pöschl, U.: Gas–particle interactions of tropospheric aerosols: Kinetic and thermodynamic perspectives of multiphase chemical reactions, amorphous organic substances, and the activation of cloud condensation nuclei, Atmos. Res., 101, 562–573, 2011.
Pospisilova, V., Lopez-Hilfiker, F. D., Bell, D. M., El Haddad, I., Mohr, C., Huang, W., Heikkinen, L., Xiao, M., Dommen, J., Prevot, A. S. H., Baltensperger, U., and Slowik, J. G.: On the fate of oxygenated organic molecules in atmospheric aerosol particles, Sci. Adv., 6, eaax8922, https://doi.org/10.1126/sciadv.aax8922, 2020.
Qi, L., Nakao, S., and Cocker, D. R.: Aging of secondary organic aerosol from α-pinene ozonolysis: Roles of hydroxyl and nitrate radicals, J. Air Waste Manage., 62, 1359–1369, https://doi.org/10.1080/10962247.2012.712082, 2012.
Quéléver, L. L. J., Kristensen, K., Normann Jensen, L., Rosati, B., Teiwes, R., Daellenbach, K. R., Peräkylä, O., Roldin, P., Bossi, R., Pedersen, H. B., Glasius, M., Bilde, M., and Ehn, M.: Effect of temperature on the formation of highly oxygenated organic molecules (HOMs) from alpha-pinene ozonolysis, Atmos. Chem. Phys., 19, 7609–7625, https://doi.org/10.5194/acp-19-7609-2019, 2019.
Rasmussen, R. A.: What do the hydrocarbons from trees contribute to air pollution?, JAPCA. J. Air Waste Ma., 22, 537–543, 1972.
Renbaum-Wolff, L., Grayson, J. W., Bateman, A. P., Kuwata, M., Sellier, M., Murray, B. J., Shilling, J. E., Martin, S. T., and Bertram, A. K.: Viscosity of α-pinene secondary organic material and implications for particle growth and reactivity, P. Natl. Acad. Sci. USA, 110, 8014–8019, 2013.
Riipinen, I., Yli-Juuti, T., Pierce, J. R., Petäjä, T., Worsnop, D. R., Kulmala, M., and Donahue, N. M.: The contribution of organics to atmospheric nanoparticle growth, Nat. Geosci., 5, 497–498, https://doi.org/10.1038/ngeo1499, 2012.
Rosati, B., Teiwes, R., Kristensen, K., Bossi, R., Skov, H., Glasius, M., Pedersen, H. B., and Bilde, M.: Factor analysis of chemical ionization experiments: Numerical simulations and an experimental case study of the ozonolysis of alpha-pinene using a PTR-ToF-MS, Atmos. Environ., 199, 15–31, 2019.
Saathoff, H., Naumann, K.-H., Möhler, O., Jonsson, Å. M., Hallquist, M., Kiendler-Scharr, A., Mentel, Th. F., Tillmann, R., and Schurath, U.: Temperature dependence of yields of secondary organic aerosols from the ozonolysis of α-pinene and limonene, Atmos. Chem. Phys., 9, 1551–1577, https://doi.org/10.5194/acp-9-1551-2009, 2009.
Seinfeld, J. H. and Pandis, S. N.: Atmospheric chemistry and physics: from air pollution to climate change, 3rd Edn., Wiley, John Wiley and Sons, United States of America, 1152 pp., 2016.
Shilling, J. E., Chen, Q., King, S. M., Rosenoern, T., Kroll, J. H., Worsnop, D. R., DeCarlo, P. F., Aiken, A. C., Sueper, D., Jimenez, J. L., and Martin, S. T.: Loading-dependent elemental composition of α-pinene SOA particles, Atmos. Chem. Phys., 9, 771–782, https://doi.org/10.5194/acp-9-771-2009, 2009.
Simon, M., Dada, L., Heinritzi, M., Scholz, W., Stolzenburg, D., Fischer, L., Wagner, A. C., Kürten, A., Rörup, B., He, X.-C., Almeida, J., Baalbaki, R., Baccarini, A., Bauer, P. S., Beck, L., Bergen, A., Bianchi, F., Bräkling, S., Brilke, S., Caudillo, L., Chen, D., Chu, B., Dias, A., Draper, D. C., Duplissy, J., El-Haddad, I., Finkenzeller, H., Frege, C., Gonzalez-Carracedo, L., Gordon, H., Granzin, M., Hakala, J., Hofbauer, V., Hoyle, C. R., Kim, C., Kong, W., Lamkaddam, H., Lee, C. P., Lehtipalo, K., Leiminger, M., Mai, H., Manninen, H. E., Marie, G., Marten, R., Mentler, B., Molteni, U., Nichman, L., Nie, W., Ojdanic, A., Onnela, A., Partoll, E., Petäjä, T., Pfeifer, J., Philippov, M., Quéléver, L. L. J., Ranjithkumar, A., Rissanen, M. P., Schallhart, S., Schobesberger, S., Schuchmann, S., Shen, J., Sipilä, M., Steiner, G., Stozhkov, Y., Tauber, C., Tham, Y. J., Tomé, A. R., Vazquez-Pufleau, M., Vogel, A. L., Wagner, R., Wang, M., Wang, D. S., Wang, Y., Weber, S. K., Wu, Y., Xiao, M., Yan, C., Ye, P., Ye, Q., Zauner-Wieczorek, M., Zhou, X., Baltensperger, U., Dommen, J., Flagan, R. C., Hansel, A., Kulmala, M., Volkamer, R., Winkler, P. M., Worsnop, D. R., Donahue, N. M., Kirkby, J., and Curtius, J.: Molecular understanding of new-particle formation from α-pinene between −50 and +25 ∘C, Atmos. Chem. Phys., 20, 9183–9207, https://doi.org/10.5194/acp-20-9183-2020, 2020.
Sindelarova, K., Granier, C., Bouarar, I., Guenther, A., Tilmes, S., Stavrakou, T., Müller, J.-F., Kuhn, U., Stefani, P., and Knorr, W.: Global data set of biogenic VOC emissions calculated by the MEGAN model over the last 30 years, Atmos. Chem. Phys., 14, 9317–9341, https://doi.org/10.5194/acp-14-9317-2014, 2014.
Song, C., Zaveri, R. A., Alexander, M. L., Thornton, J. A., Madronich, S., Ortega, J. V., Zelenyuk, A., Yu, X.-Y., Laskin, A., and Maughan, D. A.: Effect of hydrophobic primary organic aerosols on secondary organic aerosol formation from ozonolysis of α-pinene, Geophys. Res. Lett., 34, L20803, https://doi.org/10.1029/2007GL030720, 2007.
Stanier, C. O., Pathak, R. K., and Pandis, S. N.: Measurements of the volatility of aerosols from alpha-pinene ozonolysis, Environ. Sci. Technol., 41, 2756–2763, https://doi.org/10.1021/es0519280, 2007.
Topping, D., Connolly, P., and Mcfiggans, G.: Cloud droplet number enhanced by co-condensation of organic vapours, Nat. Geosci., 6, 443–446, https://doi.org/10.1038/ngeo1809, 2013.
Tröstl, J., Chuang, W. K., Gordon, H., Heinritzi, M., Yan, C., Molteni, U., Ahlm, L., Frege, C., Bianchi, F., Wagner, R., Simon, M., Lehtipalo, K., Williamson, C., Craven, J. S., Duplissy, J., Adamov, A., Almeida, J., Bernhammer, A.-K., Breitenlechner, M., Brilke, S., Dias, A., Ehrhart, S., Flagan, R. C., Franchin, A., Fuchs, C., Guida, R., Gysel, M., Hansel, A., Hoyle, C. R., Jokinen, T., Junninen, H., Kangasluoma, J., Keskinen, H., Kim, J., Krapf, M., Kürten, A., Laaksonen, A., Lawler, M., Leiminger, M., Mathot, S., Möhler, O., Nieminen, T., Onnela, A., Petäjä, T., Piel, F. M., Miettinen, P., Rissanen, M. P., Rondo, L., Sarnela, N., Schobesberger, S., Sengupta, K., Sipilä, M., Smith, J. N., Steiner, G., Tomè, A., Virtanen, A., Wagner, A. C., Weingartner, E., Wimmer, D., Winkler, P. M., Ye, P., Carslaw, K. S., Curtius, J., Dommen, J., Kirkby, J., Kulmala, M., Riipinen, I., Worsnop, D. R., Donahue, N. M., and Baltensperger, U.: The role of low-volatility organic compounds in initial particle growth in the atmosphere, Nature, 533, 527–531, https://doi.org/10.1038/nature18271, 2016.
Ulbrich, I. M., Canagaratna, M. R., Zhang, Q., Worsnop, D. R., and Jimenez, J. L.: Interpretation of organic components from Positive Matrix Factorization of aerosol mass spectrometric data, Atmos. Chem. Phys., 9, 2891–2918, https://doi.org/10.5194/acp-9-2891-2009, 2009.
Van Krevelen, D. W.: Graphical-statistical method for the study of structure and reaction processes of coal, Fuel, 29, 269–284, 1950.
Wan, K. X., Vidavsky, I., and Gross, M. L.: Comparing similar spectra: From similarity index to spectral contrast angle, J. Am. Soc. Mass Spectrom., 13, 85–88, 2002.
Wang, K., Dickinson, R. E., and Liang, S.: Clear Sky Visibility Has Decreased over Land Globally from 1973 to 2007, Science, 323, 1468–1470, https://doi.org/10.1126/science.1167549, 2009.
Warren, B., Austin, R. L., and Cocker, D. R.: Temperature dependence of secondary organic aerosol, Atmos. Environ., 43, 3548–3555, https://doi.org/10.1016/j.atmosenv.2009.04.011, 2009.
WHO: Ambient air pollution: a global assessment of exposure and burden of disease, World Health Organization, Geneva, Switzerland, 2016.
Yatavelli, R. L. N., Mohr, C., Stark, H., Day, D. A., Thompson, S. L., Lopez-Hilfiker, F. D., Campuzano-Jost, P., Palm, B. B., Vogel, A. L., Hoffmann, T., Heikkinen, L., Äijälä, M., Ng, N. L., Kimmel, J. R., Canagaratna, M. R., Ehn, M., Junninen, H., Cubison, M. J., Petäjä, T., Kulmala, M., Jayne, J. T., Worsnop, D. R., and Jimenez, J. L.: Estimating the contribution of organic acids to northern hemispheric continental organic aerosol, Geophys. Res. Lett., 42, 6084–6090, https://doi.org/10.1002/2015GL064650, 2015.
Zhang, Q., Jimenez, J. L., Canagaratna, M. R., Allan, J. D., Coe, H., Ulbrich, I., Alfarra, M. R., Takami, A., Middlebrook, A. M., Sun, Y. L., Dzepina, K., Dunlea, E., Docherty, K., DeCarlo, P. F., Salcedo, D., Onasch, T., Jayne, J. T., Miyoshi, T., Shimono, A., Hatakeyama, S., Takegawa, N., Kondo, Y., Schneider, J., Drewnick, F., Borrmann, S., Weimer, S., Demerjian, K., Williams, P., Bower, K., Bahreini, R., Cottrell, L., Griffin, R. J., Rautiainen, J., Sun, J. Y., Zhang, Y. M., and Worsnop, D. R.: Ubiquity and dominance of oxygenated species in organic aerosols in anthropogenically-influenced Northern Hemisphere midlatitudes, Geophys. Res. Lett., 34, L13801, https://doi.org/10.1029/2007GL029979, 2007.
Zhang, X., McVay, R. C., Huang, D. D., Dalleska, N. F., Aumont, B., Flagan, R. C., and Seinfeld, J. H.: Formation and evolution of molecular products in α-pinene secondary organic aerosol, P. Natl. Acad. Sci. USA, 112, 14168–14173, https://doi.org/10.1073/pnas.1517742112, 2015.
Zhao, Z., Le, C., Xu, Q., Peng, W., Jiang, H., Lin, Y.-H., Cocker, D. R., and Zhang, H.: Compositional Evolution of Secondary Organic Aerosol as Temperature and RelativeHumidity Cycle in Atmospherically Relevant Ranges, ACS Earth Space Chem., 3, 2549–2558, 2019.