the Creative Commons Attribution 4.0 License.
the Creative Commons Attribution 4.0 License.
 | 02 Aug 2021
Unexplored volatile organic compound emitted from petrochemical facilities: implications for ozone production and atmospheric chemistry
Gracie Wong
Anne Mielnik
Sanjeevi Nagalingam
Nicole Jenna Gross
Alex B. Guenther
Taehyoung Lee
Taehyun Park
Jihee Ban
Seokwon Kang
Jin-Soo Park
Joonyoung Ahn
Danbi Kim
Hyunjae Kim
Jinsoo Choi
Beom-Keun Seo
Jong-Ho Kim
Jeong-Ho Kim
Soo Bog Park
A compound was observed using airborne proton transfer reaction time-of-flight mass spectrometry (PTR-TOF-MS) measurements in the emission plumes from the Daesan petrochemical facility in South Korea. The compound was detected at 43.018 on the PTR-TOF-MS and was tentatively identified as ketene, a rarely measured reactive volatile organic compound (VOC). Estimated ketene mixing ratios as high as ∼ 50 ppb (parts per billion) were observed in the emission plumes. Emission rates of ketene from the facility were estimated using a horizontal advective flux approach and ranged from 84–316 kg h−1. These emission rates were compared to the emission rates of major known VOCs such as benzene, toluene, and acetaldehyde. Significant correlations (r2 > 0.7) of ketene with methanol, acetaldehyde, benzene, and toluene were observed for the peak emissions, indicating commonality of emission sources. The calculated average ketene OH reactivity for the emission plumes over Daesan ranged from 3.33–7.75 s−1, indicating the importance of the quantification of ketene to address missing OH reactivity in the polluted environment. The calculated average O3 production potential for ketene ranged from 2.98–6.91 ppb h−1. Our study suggests that ketene, or any possible VOC species detected at 43.018, has the potential to significantly influence local photochemistry, and therefore, further studies focusing on the photooxidation and atmospheric fate of ketene through chamber studies are required to improve our current understanding of VOC OH reactivity and, hence, tropospheric O3 production.
- Article
(4440 KB) - Full-text XML
-
Supplement
(1022 KB) - BibTeX
- EndNote


Reactive volatile organic compounds (VOCs) can have atmospheric lifetimes ranging from minutes to days (Atkinson, 2000) and have a significant influence on regional air quality as they participate in atmospheric chemical reactions that lead to the formation of secondary pollutants such as tropospheric ozone (O3) and secondary organic aerosol (SOA). Both tropospheric O3 and SOA are important from the standpoint of air quality and human health and have an impact on the radiative forcing of the atmosphere (IPCC, 2013). In addition, through chemical reactions with the hydroxyl radicals (major oxidant of the atmosphere; Lelieveld et al., 2004), photodissociation, and radical recycling reactions, VOCs strongly influence the HOx (OH and HO2) radical budget that controls the removal rates of gaseous pollutants from the atmosphere, including most greenhouse gases (such as CH4).
Ketene (ethenone; CAS – 674–82–8; H2C=C=O) is a highly reactive oxygenated VOC. Recent studies have revealed that gaseous ketene has very high pulmonary toxicity and can be lethal at high concentrations (Wu and O'Shea, 2020). Ketene is formed due to pyrolysis reactions of furfural derivatives and furans emitted during the thermal cracking of cellulose and lignin in biomass material (Kahan et al., 2013). Pyrolysis of acetic anhydride is also reported to be a potential source of ketene in the atmosphere (Atkinson et al., 2016). Ozonolysis of propene and oxidation of heterocyclic oxepin (benzene oxide) also produce ketene in the atmosphere (Klotz et al., 1997; McNelis et al., 1975). Due to the presence of both double bond and carbonyl functional groups, ketene is highly reactive and can play a significant role in ambient OH reactivity and, hence, OH recycling processes (Lelieveld et al., 2016). Kahan et al. (2013) demonstrated that the hydration reaction of ketene can form acetic acid under ambient conditions. Therefore, ketene has the potential to explain acetic acid chemistry in the troposphere, notably near the biomass burning plumes (Akagi et al., 2012; Yokelson et al., 2009). A recent theoretical study proposed that the hydrolysis of ketene produces acetic acid at a much faster rate in the atmosphere in presence of formic acid (Louie et al., 2015). This mechanism pathway can facilitate the hydrolysis of ketene if it is adsorbed into the interface of SOA and, therefore, can contribute to the rapid growth of aerosols even in the absence of a proper aqueous environment. A quantum chemical study recently showed that the ammonolysis (addition of NH3) of ketene has the potential to produce acetamide (CH3CONH2) in the troposphere (Sarkar et al., 2018). Photooxidation of this acetamide can produce isocyanic acid (HNCO) that has potential health impacts, such as cataracts, cardiovascular diseases, and rheumatoid arthritis, as it undergoes protein carbamylation (Wang et al., 2007; Roberts et al., 2014; Sarkar et al., 2016).
In this study, we present the results from an aircraft measurement campaign conducted in the summer (May–June) and fall (October) of 2019 that shows that a compound emitted from a petrochemical facility in South Korea was detected at 43.018 by a high-sensitivity proton transfer reaction time-of-flight mass spectrometry (PTR-TOF-MS) technique and tentatively identified as ketene. The emission rate estimation of ketene, using a horizontal advective flux approach adapted from the top-down emission rate retrieval algorithm (TERRA; Gordon et al., 2015) with in situ chemical and meteorological observations, is presented. Finally, an estimation of the OH reactivity and the tropospheric O3 production potential of ketene in the emission plumes is provided, and their importance is discussed.
2.1 Aircraft campaign
Airborne VOC measurements were carried out during seven research flights of typically 3–4 h duration, conducted in the summer (May–June) and fall (October) of 2019, to characterize emissions from large industrial facilities (coal power plants, steel mills, and petrochemical facilities) on the Taean Peninsula, located approximately 50 km south of the Seoul metropolis. A PTR-TOF-MS (model 8000; Ionicon Analytic GmbH, Innsbruck, Austria) was deployed on the Hanseo University research aircraft (Beechcraft 1900D; HL 5238) for VOC measurements, along with a fast meteorological sensor (AIMMS-30; Aventech Research Inc.) that is capable of quantifying aviation, such as global positioning information, heading, angle of attack, and meteorological data, such as water vapor, temperature, pressure, and three-dimensional wind field at 10 Hz resolution. To capture real-time emission activity, the research aircraft encircled individual industrial facilities at a flight altitude of 300–1000 m above ground level. Table 1 provides the details of the research flights with VOC measurements during summer and fall aircraft campaigns, while Fig. 1 shows locations of the industrial facilities and research flight tracks.
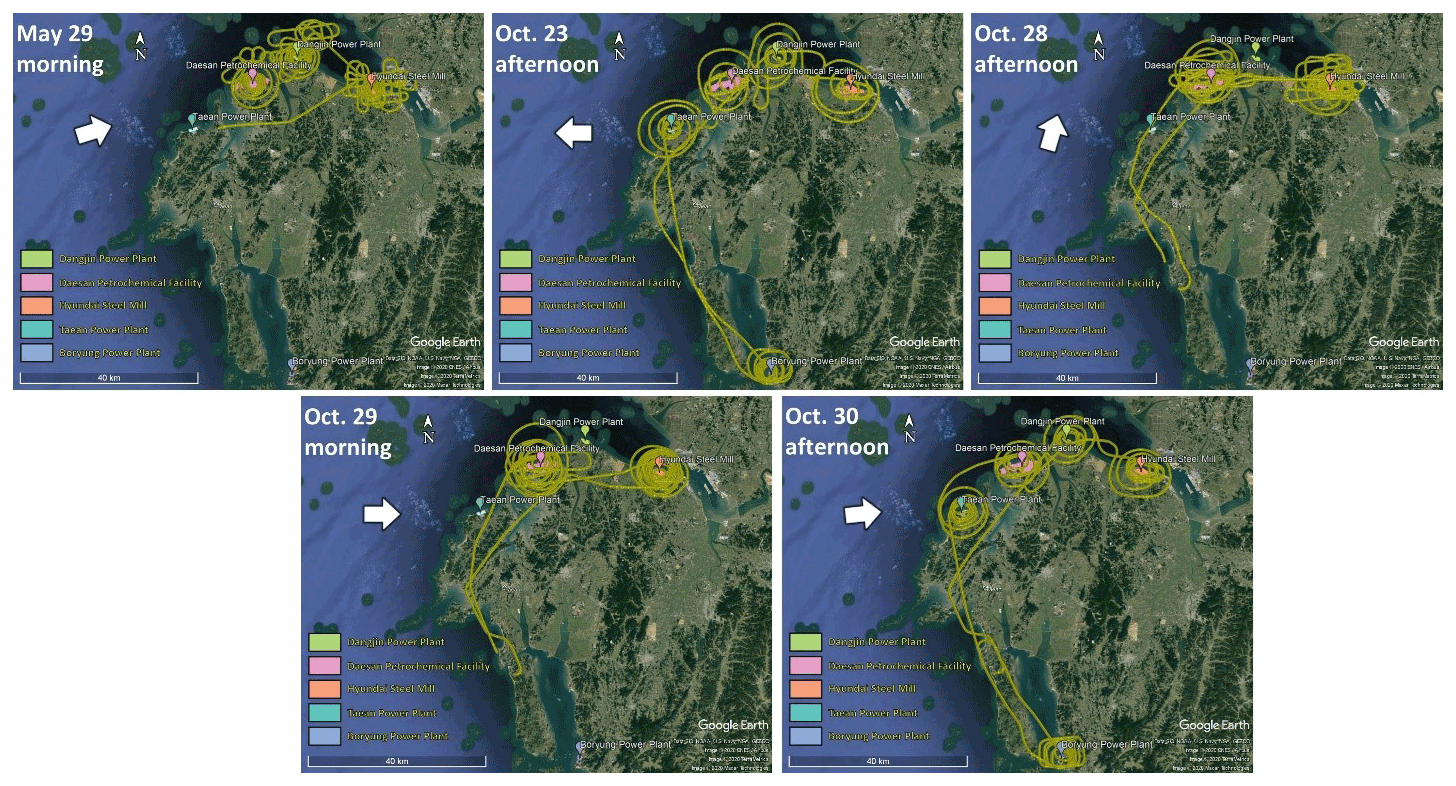
Figure 1Composite Google Earth images (© Google Earth) showing research flight tracks over the Daesan petrochemical facility, the Dangjin and Boryeong thermal power plants, Hyundai steel mills, and Taean coal power plants during the airborne study conducted in summer (May–June 2019) and fall (October 2019). The white arrow in each plot represents the mean wind direction during the flight. Only those flights for which wind direction measurements were available are shown.
Table 1Summary of research flights with VOC measurements during the summer (May–June) and fall (October) aircraft campaigns in South Korea. Note: all times are given in local time (LT).

2.2 VOC measurements
VOC measurements were performed over major point and area sources (i.e., the Daesan petrochemical facility, Dangjin and Boryeong thermal power plants, Hyundai steel mills, and Taean coal power plants) using a high-sensitivity PTR-TOF-MS that enables high mass resolution, with a detection limit of low parts per billion to parts per trillion, using H3O+ as reagent ion (Lindinger et al., 1998; Jordan et al., 2009; Sarkar et al., 2016; Sarkar et al., 2020). The PTR-TOF-MS was operated over the mass range of 21–210 amu at a drift tube pressure of 2.2 mbar and temperature of 60 ∘C (E/N ∼ 136 Td) that enabled the collection of VOC data at 1 Hz resolution. Ambient air was sampled continuously through a Teflon inlet line (OD = ; length = 3 m) at an inlet flow rate of 100 sccm. To avoid any condensation effect, the inlet line was well insulated and heated to 40 ∘C. Instrumental backgrounds were performed using ambient air through a VOC scrubber catalyst heated to 350 ∘C (GCU-s 0703; Ionimed Analytik GmbH, Innsbruck, Austria).
The mixing ratio calculations for methanol, acetaldehyde, benzene, and toluene reported in this study were done by using the sensitivity factors (normalized counts per second per parts per billion; hereafter in ncps ppb−1) obtained from the PTR-TOF-MS calibrations performed using a gravimetric mixture of a 14 component VOC gas standard (Ionimed Analytik GmbH, Austria; ∼ 1 ppm; stated accuracy was better than 6 % and National Institute of Standards and Technology, NIST, traceable) containing methanol, acetonitrile, acetaldehyde, ethanol, acrolein, acetone, isoprene, methyl vinyl ketone, methyl ethyl ketone, benzene, toluene, o-xylene, chlorobenzene, α-pinene, and 1,2-dichlorobenzene. Calibrations were performed in the range of 2–10 ppb. In order to establish the instrumental background, VOC-free zero air was generated by passing the ambient air through a catalytic converter (stainless steel tube filled with platinum-coated glass wool) heated at 350 ∘C. The measured ion signals were normalized to the primary ion (H3O+, =19) as follows (Sarkar et al., 2016, 2020):
The VOC sensitivities did not show any significant change during the calibrations performed, as the instrumental operating conditions remained constant, which is in agreement to several previous studies (de Gouw and Warneke, 2007). Table S1 of the Supplement lists the sensitivity factors for methanol, acetaldehyde, benzene, and toluene and their estimated limit of detection (LOD), which is calculated as the 2σ value while measuring VOC-free zero air at 1 Hz resolution (Sarkar et al., 2016). The concentrations of VOCs for which we do not have any sensitivity factors from the calibrations (e.g., ketene); thus, concentrations were estimated based on the reaction rate constants as described by de Gouw and Warneke (2007). A proton transfer reaction rate coefficient of cm3 s−1 was used (Zhao and Zhang, 2004) to calculate ketene concentrations. The estimated limit of detection (LOD) for ketene was 0.58 ppb. Data acquisition and analysis of the PTR-TOF raw mass spectra were accomplished using TofDaq (version 1.89; TOFWERK AG, Switzerland) and PTR-MS viewer (version 3.2; Ionicon Analytic GmbH, Innsbruck, Austria) software, respectively.
3.1 Detection of ketene using PTR-TOF-MS
For the identification of VOCs in the raw mass spectra, we followed the protocol described by Sarkar et al. (2016) and attributed the ion peak detected at 43.018 in the mass scan spectra to the monoisotopic mass of protonated ketene. The absence of any competing shoulder ion peaks between 42.968–43.068 amu (mass width bin of 0.05 amu) indicated no contribution from other ions in this mass window, as shown in Fig. S1 in the Supplement. The major advantage of using a PTR-TOF-MS over a conventional PTR-Q-MS (with a quadrupole mass analyzer; Sarkar et al., 2013) for VOC measurements is the ability of PTR-TOF-MS to separate the isobaric species such as ketene (measured at 43.018) and propene (measured at 43.054), based on their monoisotopic masses, allowing us to characterize more VOC species and, thus, minimize interfering compounds. With the conventional PTR-Q-MS, both ketene and propene appear at a nominal mass of 43, and therefore, the individual contributions of propene and ketene at 43 remain unknown. PTR-TOF-MS overcomes this limitation of PTR-Q-MS due to its high sensitivity and a mass resolution of , enabling a separate detection of ketene (at 43.018) and propene ( 43.054). Detection of propene at 43.054 using a PTR-TOF-MS is well established and has been reported in several previous studies (Stockwell et al., 2015; Sarkar et al., 2016; Koss et al., 2018). On the other hand, ketene has been quantified only recently at 43.018 using PTR-TOF-MS in the ambient air (Jordan et al., 2009) and in laboratory biomass smoke (Stockwell et al., 2015). Therefore, propene does not interfere in the detection of ketene using PTR-TOF-MS, as they show separate peaks in the raw mass spectra (Fig. S2 in the Supplement). Fragmentation of propanol also results in propene, which is detected at 43.054 by PTR-TOF-MS, and therefore, propanol fragmentation does not interfere in the detection of ketene at 43.018. Figure S3 in the Supplement shows the time series plot of the corrected ketene measured at 43.018 (in red) and propene measured at 43.054 (in blue) during the research flight conducted on 29 May in the morning. It can be seen from the time series that we also detected propene in the emission plumes from the petrochemical industries. A list of all the VOCs detected in the emission plumes from petrochemical industries and other industrial facilities during our campaigns will be provided in a companion paper (currently being prepared).
Although the PTR-TOF-MS signal at 43.018 could potentially originate from several other VOC species (e.g., acetic acid, glycolaldehyde, vinyl acetate, etc.) due to the fragmentation process, our results suggest that ketene is the most probable species detected at this mass during this study. Accurate quantification of ketene with the PTR-MS technique depends on the fragmentation of acetic acid (CH3COOH) and glycolaldehyde (C2H4O2; Karl et al., 2007), the parent ion of which is measured at 61.027 by PTR-TOF-MS (Stockwell et al., 2015; Sarkar et al., 2016). It is not possible to differentiate the structural isomers of acetic acid and glycolaldehyde using PTR-TOF-MS; however, ∼ 82 % of acetic acid is reported to contribute to the 61.027 signal (Karl et al., 2007). Fragmentation of this ion can significantly contribute to the ketene signal ( 43.018) in the mass spectra. During our study, the measured ratio between 61.027 and 43.018 outside of the peak emission cases (Fig. 2) was ∼ 0.9, which is consistent with the ratio reported in previous studies at a similar E N ratio (von Hartungen et al., 2004; Haase et al., 2012). This indicates that the fragmentation of acetic acid and glycolaldehyde results in about half at 61.027, and the remaining half at 43.018, which is an interference for ketene signal and was subtracted to obtain the corrected ketene concentrations. Henceforth, we refer to the 43.018 signal, corrected for the contribution of acetic acid and glycolaldehyde fragments, as ketene in this paper.
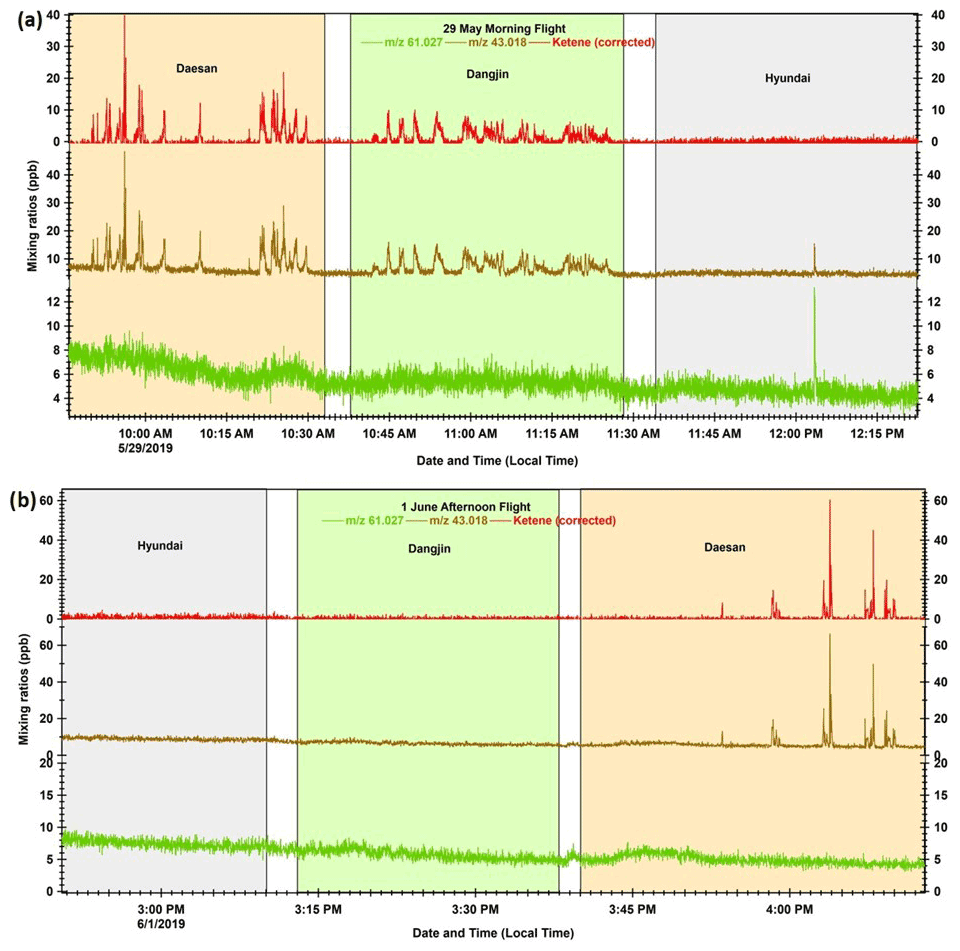
Figure 2 Time series profiles for mixing ratios (1 Hz resolution) of acetic acid and glycolaldehyde parent ion ( 61.027), ketene fragment ( 43.018), and corrected ketene (corrected for 61.027 fragmentation) during the (a) 29 May morning flight and (b) 1 June afternoon flight. The light pink, light green, and light blue shaded areas represent the duration of the flights over Daesan, Dangjin, and Hyundai, respectively.
Fragmentation of vinyl acetate (detected at 87.044) could also potentially contribute to the signal at 43.018. However, during our airborne measurements, 87.044 did not show any high peaks that we observed in 43.018 (attributed to ketene). In addition, no significant correlations were observed between 43.018 and 87.044 when data corresponding to the plume episodes were utilized. The signal-to-noise (S N) ratios for and were 6 and 2 ppt, respectively, which indicates that the instrument sensitivity was good enough to observe the linearity between and . This indicates that high peaks of 43.018 cannot be attributed to the fragmentation of 87.044, and the signal at 43.018 had a different source. Previous studies have reported that the 87.044 signal can also be due to VOCs like 2,3-butanedione and methyl acrylate (Müller et al., 2016; Koss et al., 2018). These compounds are reported to be emitted from incomplete combustion or biomass burning sources. We have carried out laboratory experiments with these two VOC standards and found that, similar to vinyl acetate, these two VOCs were unlikely to be contributing to the 43.018 peaks observed during our airborne measurements over Daesan. Ketene has a proton affinity of 196 kCal mol−1, which is much higher than that of water (166 kCal mol−1), and therefore, it is possible to detect protonated ketene using PTR-TOF-MS. The direct protonation of ketene can result in three different structural conformations, and the most stable structure of protonated ketene is the acylium ion (Vogt et al., 1978; Nobes et al., 1983; Leung-Toung et al., 1989; Prakash et al., 2005), which is detected at 43.018 using PTR-TOF-MS. Therefore, even though we have detected the same acylium ion (at 43.018) that can be formed from direct protonation of ketene and the fragmentation of vinyl acetate, methyl acrylate, and 2,3-butanedione, our results suggest that the origin of the acylium ion detected during our field campaign is the protonation of directly emitted ketene and not the fragmentation of vinyl acetate.
Figures 2a and b show time series plots for the mixing ratios of acetic acid and the glycolaldehyde parent ion ( 61.027; in green), ketene fragment ( 43.018; in brown), and the corrected ketene (in red) during research flights conducted on the morning of 29 May and the afternoon of 1 June. It can be seen from Fig. 2a that there were several high peaks of ketene over the Daesan petrochemical facility on 29 May. Such high peaks of ketene were observed over Daesan during all flights conducted in the summer and fall (Figs. 2b and S4). These high ketene peaks are entirely absent in the time series of 61.027, indicating that acetic acid and glycolaldehyde fragmentation made a relatively small contribution to the signal detected in the emission plumes over Daesan. Some peaks were also observed for both 61.027 and 43.018 over the Dangjin coal power plants and Hyundai steel mills during the flights conducted on 29 May and 23 October (Figs. 2a and S4). However, in most cases, these peaks of 43.018 originated from the fragmentation of 61.027, and so they do not contribute to the corrected ketene signals. This further demonstrates that ketene has fresh emission sources in the plumes over the Daesan petrochemical facility. Since the measured ketene outside the plume was always < 2 ppb (Figs. 2 and S4), contributions from photochemically produced ketene would be negligible, further indicating direct emission of ketene from the facility.
VOC correlation analyses were performed for the peak values to identify potential emission sources for ketene at Daesan. Ketene showed strong correlations (r2 > 0.7) with acetaldehyde, methanol, benzene, and toluene, indicating the commonality of emission sources. Figure S5 represents example correlation plots between these VOCs during 28 October afternoon flight. Many of these VOCs are emitted during high-temperature production processes, such as the thermal cracking of ethylene and the production of polypropylene in the petrochemical industries (Cetin et al., 2003; Chen et al., 2014; Mo et al., 2015). The Daesan petrochemical facility is a major manufacturer of heat-resistant polypropylene in South Korea, and therefore, ketene could potentially be produced during these high-temperature production processes. However, future studies focusing on VOC measurements in the stacks and analysis using source apportionment models (e.g., USEPA-PMF; Sarkar et al., 2017) will improve our understanding of ketene emissions and chemistry at Daesan.
3.2 Estimation of ketene emission rate using a horizontal advective flux approach
Emission rates (ERs) of ketene and accompanying VOCs were estimated by integrating the horizontal advective flux around Daesan petrochemical facility. A two-dimensional cylindrical screen is created, encompassing each facility during each flight. The mixing ratio flux through this screen is then used to determine the emission rate coming from the interior of the screen. To create the screen, a single horizontal path surrounding the facility is determined for flight tracks to represent the horizontal component of the screen. The start of the horizontal path is approximately set as the southeastern corner of the ellipse and progresses in a counter-clockwise direction. The horizontal path length (s) is calculated in meters and as a function of longitude (x) and latitude (y). Each measurement point within 100 m of the determined horizontal path is mapped to the closest point on the horizontal path but retains its altitude (z). This creates a set of points on the cylindrical screen. The measured mixing ratios of each compound, zonal wind (U), meridional wind (V), and air density are interpolated to fill areas on the screen to a resolution of 40×20 m (s×z). Interpolation is performed using a radial basis function, with weights estimated by linear least squares. The interpolated screens of zonal wind, meridional wind, and air density are used to calculate the air flux (Eair,H) through the screen as follows:
Air density (ρair) is calculated at each flight position from the measured temperature (T), pressure (p), and percent relative humidity (RH), as described by Yau and Rogers (1996), as follows:
where R= 287.1 J kg−1 K−1; is the water vapor mixing ratio, Ad= 3.41×10⁹ kPa, and ε= 0.622; Bd= 5420 K and Td are the dew point temperature calculated using the August–Roche–Magnus approximation as follows:
where λ= 243.12 ∘C and β= 17.62.
The wind speed normal to the path is calculated, as described by Gordon et al. (2015), as follows:
The mixing ratios of the compounds are interpolated for each point on the screen and combined with the air flux to calculate the ER of the compounds using the following equation:
where χC is the mixing ratio of VOCs, and MR is the ratio between compound molar mass and the molar mass of air ( for ketene). The air density (ρair) from the lowest flight track altitude is approximated with a linear dependence on altitude. U⊥ is the normal wind vector (positive outwards). Mixing ratios in the areas between the flight track measurements are interpolated using a radial basis function, with weights estimated by linear least square approximation. Interpolated screens (resolution 40×20 m; horizontal × altitude) of U, V wind, and air density were then used to retrieve air flux through the screens. This method is adapted from the TERRA approach described by Gordon et al. (2015). The mass balance approach was used to estimate emissions through the top of the cylinder. Pressure and temperature were assumed to be constant during the measurement time frame. To determine emissions through the top of the cylinder, the following mass balance approach was used:
where Eair,H is the net horizontal air flux, Eair,V is the net air flux through the top of the cylinder, and Eair,M is the change in air mass within the volume. We considered constant average pressure and temperature for the duration of the observations to assume no change in air mass within the volume. As a result, the air flux through the top of the cylinder can be considered . The average value of the mixing ratio at the top of the cylinder is multiplied by Eair,V to retrieve emissions through the top of the cylinder.
Figure 3a and b depict the mixing ratio screens for ketene for the 29 May morning flight and 28 October afternoon flight. For both flights, the highest ketene mixing ratios (χketene) were measured near the lowest flight path, clearly indicating that surface emission sources caused the bulk of the ketene to be below the flight track. The estimated net ERs (kilograms per hour) for ketene and accompanying VOCs are shown in Table 2a. The net ER represents emissions only from the facility and excludes the contribution of emissions from outside sources that are upwind of the screen. The difference between the estimated net ER and the ER going out of the screen (Table S2) for ketene were < 12 % for both flights. For the 29 May flight, the estimated net ketene ER was similar to that of toluene and ∼ 3 times lower than benzene, while it was ∼ 4 times lower than acetaldehyde. For the 28 October flight, the estimated net ketene ER was ∼ 1.3 times lower and ∼ 1.5 times higher than benzene and toluene, respectively, while it was ∼ 2 times lower than acetaldehyde. These results indicate that accurate estimation of ketene emissions from petrochemical facilities could be as important as some of the major VOCs, and therefore, including ketene (a rarely quantified VOC) to the emission inventory will be a step forward towards effective VOC mitigation strategies.
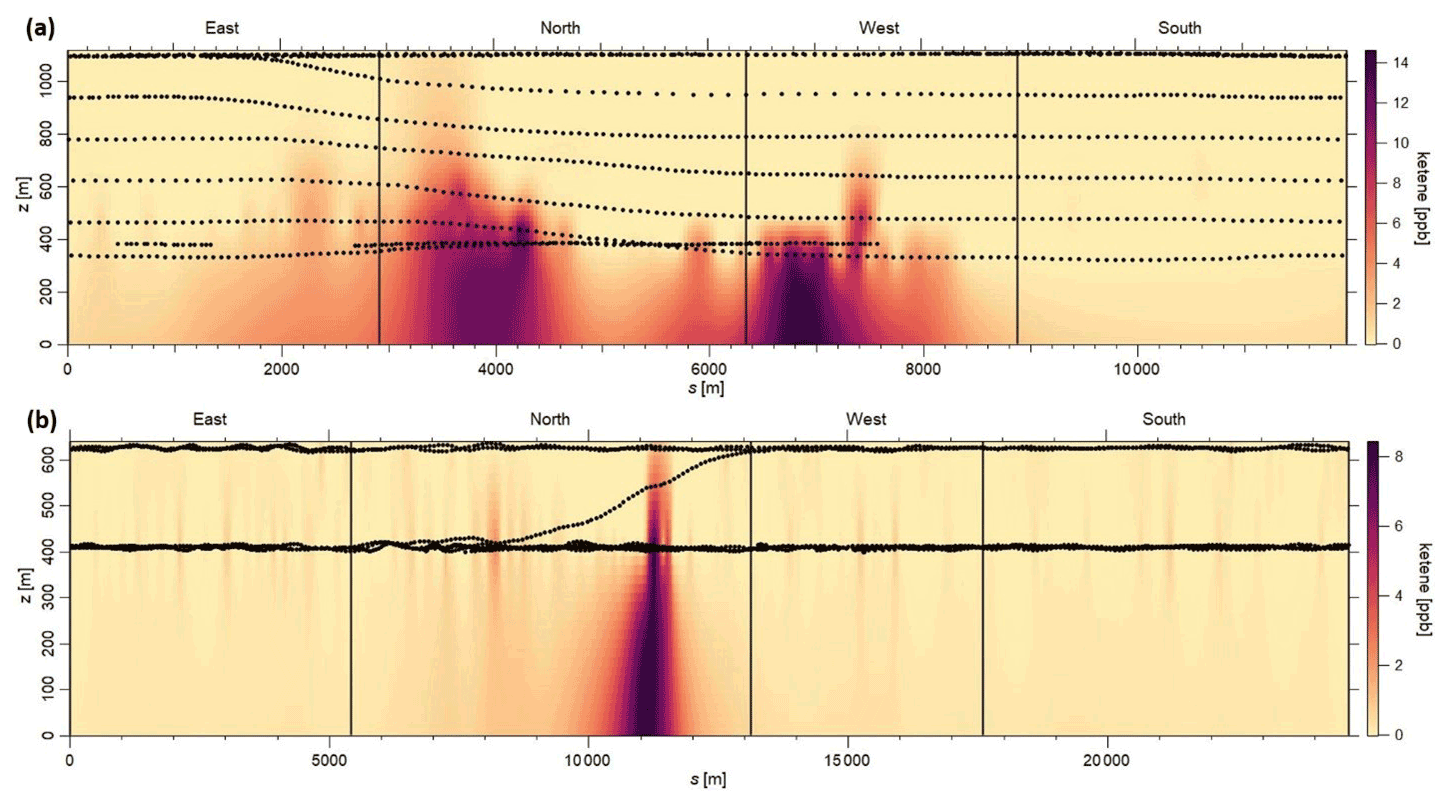
Figure 3Kriging interpolated ketene mixing ratios for the (a) 29 May morning flight and (b) 28 October afternoon flight. Black dots represent the flight path.
Table 2(a) Net emission rates (kg h−1) of ketene, benzene, acetaldehyde, and toluene over Daesan petrochemical facility. (b) Calculated average OH reactivity (s−1) and O3 production potential (ppb h−1) of ketene during emission plumes measured over Daesan petrochemical facility.
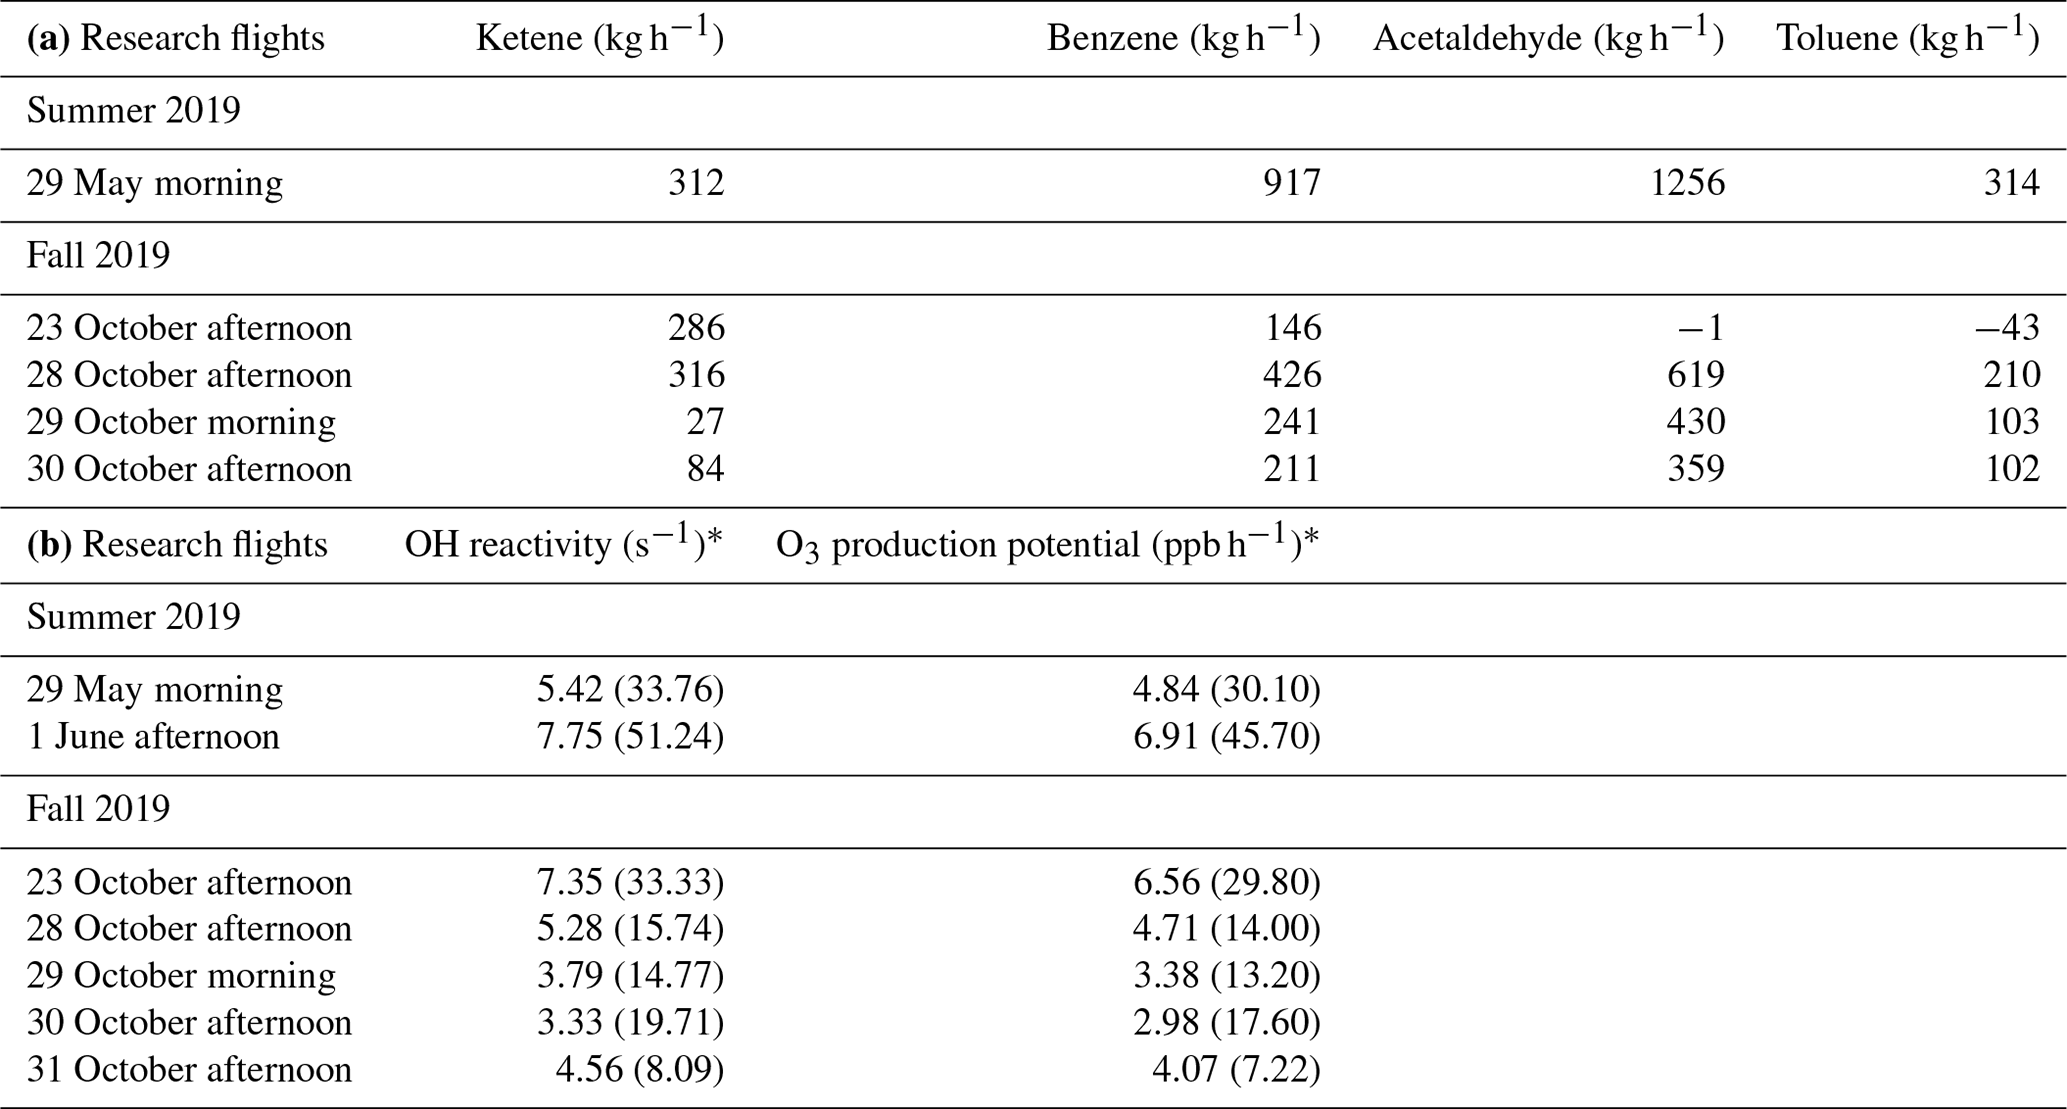
* Values in the parentheses represent the maximum OH reactivity and O3 production potential.
To address the uncertainty in the extrapolation method below the measurement heights, we have used two different approaches. In the first approach, we considered the nature of emissions from the petrochemical facility being mainly from evaporative sources. As a result, we assumed that the mixing ratios of ketene increases as it approaches the ground. This is observed when we used the radial basis function to extrapolate linearly. To quantify the uncertainty in this extrapolation, we assumed a constant value for heights under the measurement height equal to the mixing ratios at the lowest observed altitude and defined it as a “constant” case. We assumed that the constant case represents a lower end estimation due to the nature of the evaporative sources from the facility. Then, we estimated the uncertainty due to ground extrapolation as being the percentage change in emission rates calculated from the linear radial basis function and from the constant case. The estimated uncertainties were < 20 % for most cases. For example, for the 29 May morning flight, the estimated uncertainty was ∼ 16 % (Fig. 4). As expected, this uncertainty is highly dependent on the vertical position of the plume, with the uncertainty being higher in cases where the highest mixing ratio observed is at the lowest altitude measured. The second approach is to assess the accuracy of the radial basis function interpolation method; plumes resembling the observed plumes were simulated. The plumes were generated based on a Gaussian distribution of the mixing ratio as follows:
where χ is the mixing ratio, so,i is the horizontal plume center, zo,i is the vertical plume center, and i is the plume number. The parameters used for each date are listed in Table S3. The flight path of each date is used to sample the simulated plume on the screen. The simulated Gaussian plume is then reconstructed using the radial basis function interpolation based on the points sampled from the simulated plume. Figure 5 shows the simulated plumes and radial basis function interpolated plumes for the flights on 29 May and 28 October. The root mean square (RMS) and correlation coefficient (R2) values were calculated to compare the simulated plume with the radial basis function interpolated plumes. The calculated RMS and R2 values for 29 May were 0.034 and 0.983, respectively. For 28 October, the calculated RMS and R2 values were 0.018 and 0.991, respectively.
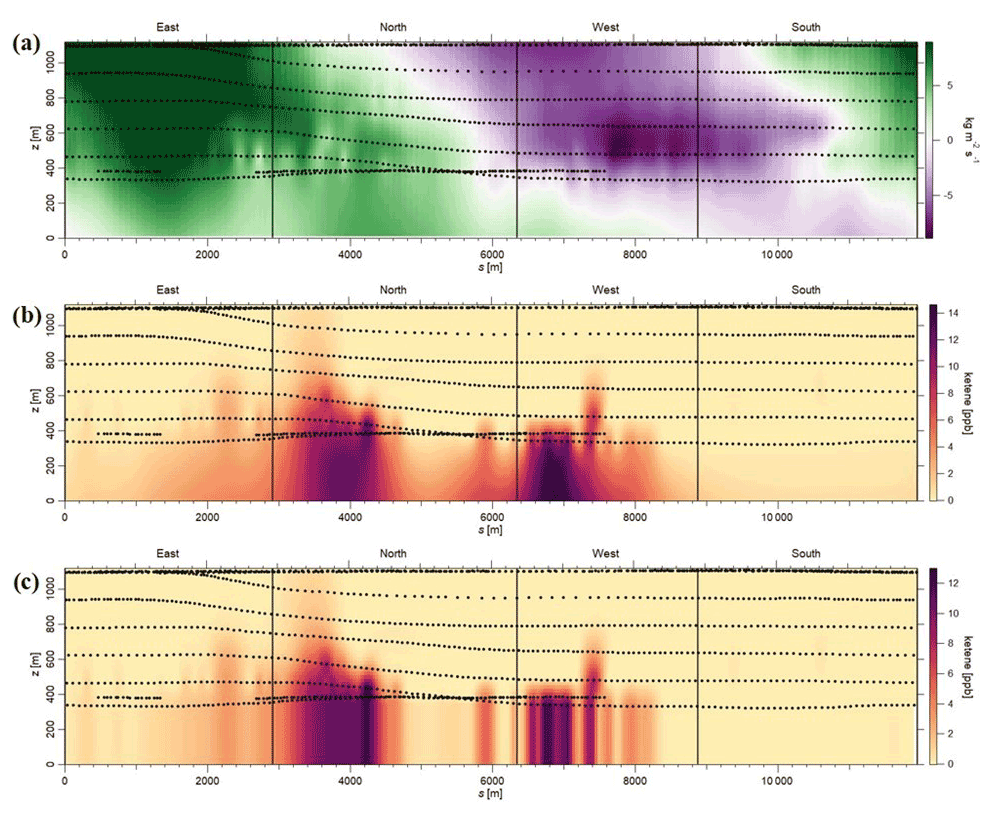
Figure 4Estimation of uncertainty in the emission rates, using the first approach, during 29 May morning flight. (a) Air flux screen (green – going out of the facility; purple – going into the facility). (b) Case 1: linear extrapolation, using radial basis function (net emission rate from the facility – 312.36 kg h−1; emission rate going out of the screen – 357.73 kg h−1). (c) Case 2: linear extrapolation using the constant case (net emission rate from the facility – 262.44 kg h−1; emission rate going out of the screen –298.74 kg h−1; exponentials are the same for both the cases; uncertainty is ∼ 15.5 %–16 %).
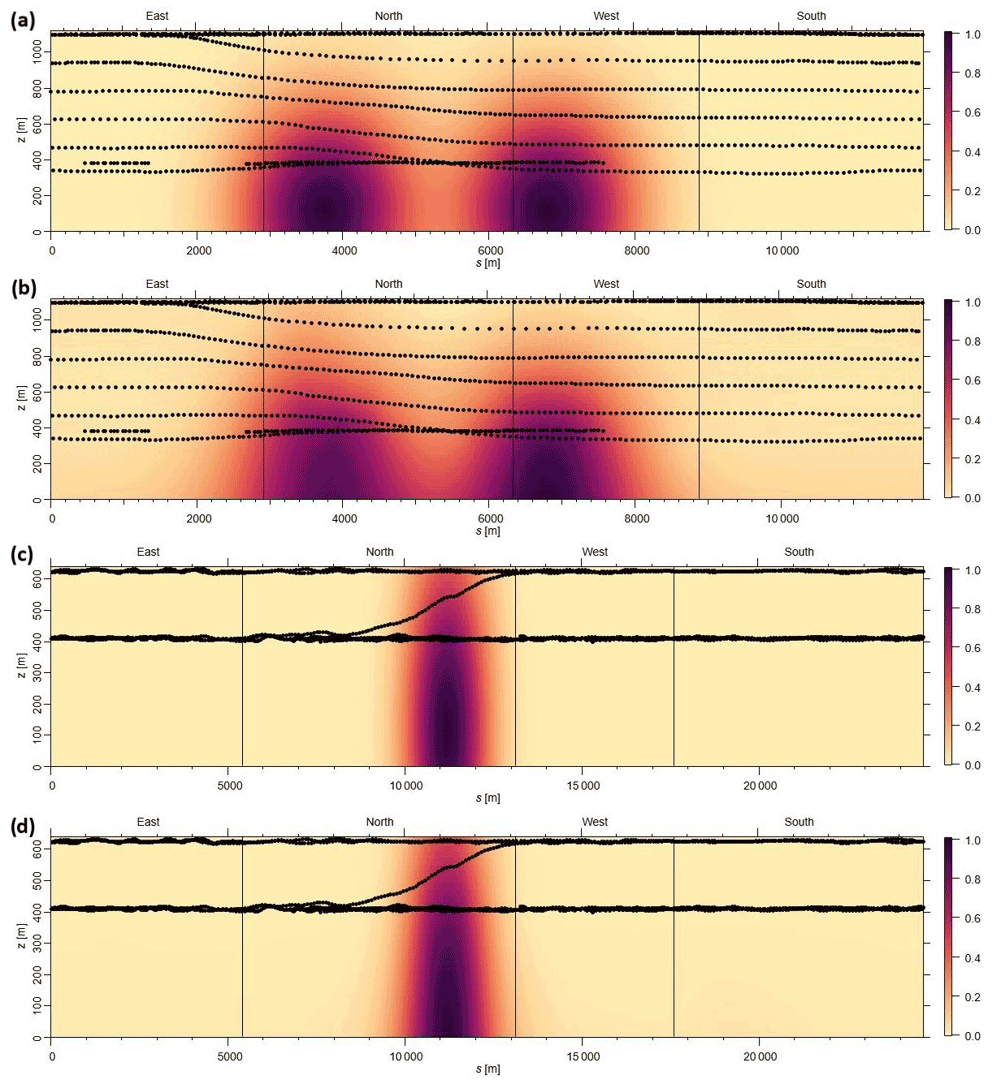
Figure 5(a) Simulated plume scenario and (b) radial basis function interpolated plume for the 29 May morning flight. (c) Simulated plume scenario and (d) radial basis function interpolated plume for 28 October afternoon flight. Black dots are the flight position measurements of each flight.
3.3 OH reactivity and O3 production potential
The OH reactivity of ketene was calculated according to the following equation:
where kKetene+OH is the first-order rate coefficient for the reaction of ketene with OH radicals and [Ketene] is the measured mixing ratio of ketene. The rate coefficient of cm3 mol−1 s−1 was used for the reaction of ketene with OH (Brown et al., 1989). For the 29 May and 1 June flights (summer campaign), the calculated average ketene OH reactivity for the emission plumes over Daesan was 5.42 and 7.75 s−1, respectively. The average OH reactivities during research flights conducted in October (fall campaign) ranged from 3.33 to 7.35 s−1. Table 2b shows the calculated average and maximum OH reactivity and O3 production potential of ketene during seven research flights. Several previous studies have reported 50 % or more missing OH reactivities near industrial areas (Kim et al., 2011; Ryerson et al., 2003) and have shown large uncertainties affecting HOx budget. Ambient ketene was not quantified in these studies due to the absence of PTR-TOF-MS and the attribution of nominal mass of 43 (detected by PTR-QMS) only to propene. With PTR-TOF-MS measurements, it is clear that both propene and ketene can contribute to the nominal mass of 43. While the rate coefficient of propene with OH radical is about 10 % lower ( and cm3 mol−1 s−1 for propene (Atkinson et al., 2006) and ketene (Brown et al., 1989), respectively at 298 K), their chemical reactions with OH would be different since ketene contains a carbonyl functional group (H2C=C=O), but propene is an alkene (H3C–C=CH2). Therefore, quantification of ketene will improve our estimation of the missing OH reactivity.
Tropospheric O3 formation is significantly influenced by VOCs in polluted environments and has strong impacts on air quality (ability to form photochemical smog), climate (contribution to radiative forcing), human health (a pulmonary irritant), and can cause decreased crop yields (Monks et al., 2015; Jerrett et al., 2009). The O3 production potential of ketene was calculated according to the following equation:
Average OH radical concentration of 6.2×10⁶ mol cm−3, derived using a reactive plume model considering NOx photochemistry (with 255 condensed photochemical reactions) in power plant plumes (Kim et al., 2017), was used for the O3 production potential calculation. The calculated atmospheric lifetime of ketene using this OH concentration was ∼ 1.4 h, indicating that the spatial scale for which ketene would be effective in photochemistry could be at least a few kilometers (e.g., ∼ 10 km, assuming horizontal wind speed of 2 m s−1). For the 29 May and 1 June flights, the calculated average O3 production potential for ketene in the emission plumes over Daesan was 4.84 and 6.91 ppb h−1, respectively. For the research flights conducted in October (fall campaign), the average O3 production potential ranged from 2.98 to 6.56 ppb h−1 (Table 2b). However, maximum O3 production potential for ketene at Daesan was 45.70 ppb h−1 on 1 June. Due to its fast reaction rate with OH, ketene can contribute significantly to VOC OH reactivity and, hence, O3 production, and a quantitative understanding of ketene is vital for tropospheric O3 mitigation efforts. Therefore, it is important to carry out further field and chamber studies to investigate the implications of ketene photo-oxidation on HOx chemistry and the atmospheric fate of ketene.
Ketene, a rare and highly reactive VOC, was tentatively identified and quantified as the major species at 43.018 using PTR-TOF-MS technique in the emission plumes of the Daesan petrochemical facility in South Korea during aircraft measurement campaigns conducted in the summer (May–June) and fall (October) of 2019. Ketene mixing ratios of as high as ∼ 50 ppb were measured in the emission plumes. Estimated ketene emission rates from the facility, using a horizontal advective flux approach, ranged from 84–316 kg h−1. Ketene emission rates were compared to the estimated emission rates of benzene, toluene, and acetaldehyde. In most cases, ketene emission rates were comparable to toluene. During peak emissions, ketene also showed significant correlations (r2 > 0.7) with acetaldehyde, methanol, benzene, and toluene, indicating emissions of these VOCs occur from common processes. The petrochemical facility at Daesan is the largest producer of heat-resistant polypropylene in South Korea, and the high-temperature production processes of polypropylene could be a potential source of ketene at Daesan. However, future VOC measurement studies focusing on the stack emissions at Daesan, in combination with source apportionment models such as USEPA-PMF, will provide better insights on ketene emissions and chemistry at the Daesan petrochemical facility.
For the emission plumes over Daesan, the calculated average OH reactivity for ketene ranged from 3.33–7.75 s−1. This indicates the importance of the quantification of ketene in the polluted environment for addressing the puzzle of missing OH reactivity. During this study, calculated average ketene O3 production potential ranged from 2.98–6.91 ppb h−1. Our study suggests that ketene can potentially influence local photochemistry. Therefore, future studies focusing on the photooxidation processes and the atmospheric fate of ketene using chamber studies are required to gain better insights to ketene formation in the atmosphere. Such studies will also improve our current understanding of VOC–OH reactivity and, hence, secondary pollutants formation.
Although, based on our observation, we strongly believe that the 43.018 signal corresponds to ketene, the possibility of the contribution from vinyl acetate and other species cannot be ruled out completely, and therefore, further laboratory and field studies focusing on this aspect are needed. Since the rate coefficient of vinyl acetate with OH radical is cm3 molecule−1 s−1 (Saunders et al., 1994), the estimated OH reactivity and O3 production potential for vinyl acetate can be ∼ 20 %–25 % less than that of ketene. Since both ketene and vinyl acetate can significantly contribute to the OH reactivity and O3 production, it is important to explore these new and understudied oxygenated VOCs and their impact on secondary pollutants formation.
The observational data will be made available upon the request to the corresponding authors.
The supplement related to this article is available online at: https://doi.org/10.5194/acp-21-11505-2021-supplement.
CS, AG, TL, JA, SBP, and SK conceptualized the study. CS, GW, AM, TP, JB, SK, JSP, DK, HK, JC, BKS, and JHK conducted the field measurements. CS, SN, and NJG performed laboratory experiments. CS, GW, and SK analyzed the data. AG, TL, JA, SBP, and SK supervised and administered the project. CS, GW, SK, and AG wrote the original draft. All authors reviewed and edited the paper. All authors have given their approval to the final version of the paper.
The authors declare that they have no conflict of interest.
Publisher’s note: Copernicus Publications remains neutral with regard to jurisdictional claims in published maps and institutional affiliations.
The authors thankfully acknowledge support for this research from the National Institute of Environmental Research (grant no. NIER-RP2019-152) of South Korea, the National Strategic Project – Fine Particle of the National Research Foundation of Korea (NRF) funded by the Ministry of Science and ICT (MSIT), the Ministry of Environment (ME), and the Ministry of Health and Welfare (MOHW; grant no. 2019M3D8A1067406) and the Technology Development Program to Solve Climate Changes through the National Research Foundation of Korea (NRF), supported by the Ministry of Science, ICT (grant no. 2019M1A2A2103953) of South Korea for funding and logistics. We also appreciate helpful discussion on the TERRA application generously provided by Andrea Darlington at Environment Canada and Mark Gordon at York University, Canada. Seokwon Kang would like to acknowledge funding from the Brain Pool Program of the National Research Foundation Korea (NRF), funded by the Ministry of Science ICT (grant no. 2020H1D3A2A01060699).
This research has been supported by the National Institute of Environmental Research (grant no. NIER-RP2019-152) and the National Research Foundation of Korea (grant nos. 2020H1D3A2A0106069 and 2019M3D8A1067406).
This paper was edited by Arthur Chan and reviewed by Armin Wisthaler and two anonymous referees.
Akagi, S. K., Craven, J. S., Taylor, J. W., McMeeking, G. R., Yokelson, R. J., Burling, I. R., Urbanski, S. P., Wold, C. E., Seinfeld, J. H., Coe, H., Alvarado, M. J., and Weise, D. R.: Evolution of trace gases and particles emitted by a chaparral fire in California, Atmos. Chem. Phys., 12, 1397–1421, https://doi.org/10.5194/acp-12-1397-2012, 2012.
Atkinson, R.: Atmospheric chemistry of VOCs and NOx, Atmos. Environ., 34, 2063–2101, https://doi.org/10.1016/S1352-2310(99)00460-4, 2000.
Atkinson, R., Baulch, D. L., Cox, R. A., Crowley, J. N., Hampson, R. F., Hynes, R. G., Jenkin, M. E., Rossi, M. J., Troe, J., and IUPAC Subcommittee: Evaluated kinetic and photochemical data for atmospheric chemistry: Volume II – gas phase reactions of organic species, Atmos. Chem. Phys., 6, 3625–4055, https://doi.org/10.5194/acp-6-3625-2006, 2006.
Atkinson, S. J., Noble-Eddy, R., and Masters, S. L.: Gas-Phase Structures of Ketene and Acetic Acid from Acetic Anhydride Using Very-High-Temperature Gas Electron Diffraction, J. Phys. Chem. A, 120, 2041–2048, https://doi.org/10.1021/acs.jpca.6b00704, 2016.
Brown, A. C., Canosa-Mas, C. E., Parr, A. D., and Wayne, R. P.: Temperature dependence of the rate of the reaction between the OH radical and ketene, Chem. Phys. Lett., 161, 491–496, https://doi.org/10.1016/0009-2614(89)87026-5, 1989.
Cetin, E., Odabasi, M., and Seyfioglu, R.: Ambient volatile organic compound (VOC) concentrations around a petrochemical complex and a petroleum refinery, Sci. Total Environ., 312, 103–112, https://doi.org/10.1016/S0048-9697(03)00197-9, 2003.
Chen, M.-H., Yuan, C.-S., and Wang, L.-C.: Source Identification of VOCs in a Petrochemical Complex by Applying Open-Path Fourier Transform Infrared Spectrometry, Aerosol Air Qual. Res., 14, 1630–1638, https://doi.org/10.4209/aaqr.2014.04.0079, 2014.
de Gouw, J. and Warneke, C.: Measurements of volatile organic compounds in the earth's atmosphere using proton-transfer-reaction mass spectrometry, Mass Spectrom. Rev., 26, 223–257, https://doi.org/10.1002/mas.20119, 2007.
Gordon, M., Li, S.-M., Staebler, R., Darlington, A., Hayden, K., O'Brien, J., and Wolde, M.: Determining air pollutant emission rates based on mass balance using airborne measurement data over the Alberta oil sands operations, Atmos. Meas. Tech., 8, 3745–3765, https://doi.org/10.5194/amt-8-3745-2015, 2015.
Haase, K. B., Keene, W. C., Pszenny, A. A. P., Mayne, H. R., Talbot, R. W., and Sive, B. C.: Calibration and intercomparison of acetic acid measurements using proton-transfer-reaction mass spectrometry (PTR-MS), Atmos. Meas. Tech., 5, 2739–2750, https://doi.org/10.5194/amt-5-2739-2012, 2012.
IPCC: Impacts, Adaptation and Vulnerability: Working Group II: Contribution to the Intergovernmental Panel on Climate Change: Fifth Assessment Report: Summary for Policymakers, Intergovernmental Panel on Climate Change. Working Group Impacts, Cambridge University Press, Cambridge, UK and New York, NY, USA, 1–32, 2013.
Jerrett, M., Burnett, R. T., Pope, C. A., Ito, K., Thurston, G., Krewski, D., Shi, Y., Calle, E., and Thun, M.: Long-Term Ozone Exposure and Mortality, New Engl. J. Med., 360, 1085–1095, https://doi.org/10.1056/NEJMoa0803894, 2009.
Jordan, A., Haidacher, S., Hanel, G., Hartungen, E., Märk, L., Seehauser, H., Schottkowsky, R., Sulzer, P., and Märk, T. D.: A high resolution and high sensitivity proton-transfer-reaction time-of-flight mass spectrometer (PTR-TOF-MS), Int. J. Mass Spectrom., 286, 122–128, https://doi.org/10.1016/j.ijms.2009.07.005, 2009.
Kahan, T. F., Ormond, T. K., Ellison, G. B., and Vaida, V.: Acetic acid formation via the hydration of gas-phase ketene under ambient conditions, Chem. Phys. Lett., 565, 1–4, https://doi.org/10.1016/j.cplett.2013.02.030, 2013.
Karl, T. G., Christian, T. J., Yokelson, R. J., Artaxo, P., Hao, W. M., and Guenther, A.: The Tropical Forest and Fire Emissions Experiment: method evaluation of volatile organic compound emissions measured by PTR-MS, FTIR, and GC from tropical biomass burning, Atmos. Chem. Phys., 7, 5883–5897, https://doi.org/10.5194/acp-7-5883-2007, 2007.
Kim, S.-W., McKeen, S. A., Frost, G. J., Lee, S.-H., Trainer, M., Richter, A., Angevine, W. M., Atlas, E., Bianco, L., Boersma, K. F., Brioude, J., Burrows, J. P., de Gouw, J., Fried, A., Gleason, J., Hilboll, A., Mellqvist, J., Peischl, J., Richter, D., Rivera, C., Ryerson, T., te Lintel Hekkert, S., Walega, J., Warneke, C., Weibring, P., and Williams, E.: Evaluations of NOx and highly reactive VOC emission inventories in Texas and their implications for ozone plume simulations during the Texas Air Quality Study 2006, Atmos. Chem. Phys., 11, 11361–11386, https://doi.org/10.5194/acp-11-11361-2011, 2011.
Kim, Y. H., Kim, H. S., and Song, C. H.: Development of a Reactive Plume Model for the Consideration of Power-Plant Plume Photochemistry and Its Applications, Environ. Sci. Technol., 51, 1477–1487, https://doi.org/10.1021/acs.est.6b03919, 2017.
Klotz, B., Barnes, I., H. Becker, K., and T. Golding, B.: Atmospheric chemistry of benzene oxide/oxepin, J. Chem. Soc. Farad. T., 93, 1507–1516, https://doi.org/10.1039/A606152D, 1997.
Koss, A. R., Sekimoto, K., Gilman, J. B., Selimovic, V., Coggon, M. M., Zarzana, K. J., Yuan, B., Lerner, B. M., Brown, S. S., Jimenez, J. L., Krechmer, J., Roberts, J. M., Warneke, C., Yokelson, R. J., and de Gouw, J.: Non-methane organic gas emissions from biomass burning: identification, quantification, and emission factors from PTR-ToF during the FIREX 2016 laboratory experiment, Atmos. Chem. Phys., 18, 3299–3319, https://doi.org/10.5194/acp-18-3299-2018, 2018.
Lelieveld, J., Dentener, F. J., Peters, W., and Krol, M. C.: On the role of hydroxyl radicals in the self-cleansing capacity of the troposphere, Atmos. Chem. Phys., 4, 2337–2344, https://doi.org/10.5194/acp-4-2337-2004, 2004.
Lelieveld, J., Gromov, S., Pozzer, A., and Taraborrelli, D.: Global tropospheric hydroxyl distribution, budget and reactivity, Atmos. Chem. Phys., 16, 12477–12493, https://doi.org/10.5194/acp-16-12477-2016, 2016.
Leung-Toung, R., Peterson, M. R., Tidwell, T. T., and Csizmadia, I. G.: Protonation of ketene and vinylketene: Relative stabilities of isomeric cationic products, J. Mol. Struc.-THEOCHEM, 183, 319–330, https://doi.org/10.1016/0166-1280(89)80013-2, 1989.
Lindinger, W., Hansel, A., and Jordan, A.: On-line monitoring of volatile organic compounds at pptv levels by means of proton-transfer-reaction mass spectrometry (PTR-MS) medical applications, food control and environmental research, Int. J. Mass Spectrom., 173, 191–241, https://doi.org/10.1016/S0168-1176(97)00281-4, 1998.
Louie, M. K., Francisco, J. S., Verdicchio, M., Klippenstein, S. J., and Sinha, A.: Hydrolysis of Ketene Catalyzed by Formic Acid: Modification of Reaction Mechanism, Energetics, and Kinetics with Organic Acid Catalysis, J. Phys. Chem. A, 119, 4347–4357, https://doi.org/10.1021/jp5076725, 2015.
McNelis, D. N., Ripperton, L., Wilson, W. E., Hanst, P. L., and Gay, B. W.: Gas-Phase Reactions of Ozone and Olefin in the Presence of Sulfur Dioxide, in: Removal of Trace Contaminants from the Air, ACS Symposium Series, 17, American Chemical Society, 187–200, 1975.
Mo, Z., Shao, M., Lu, S., Qu, H., Zhou, M., Sun, J., and Gou, B.: Process-specific emission characteristics of volatile organic compounds (VOCs) from petrochemical facilities in the Yangtze River Delta, China, Sci. Total Environ., 533, 422–431, https://doi.org/10.1016/j.scitotenv.2015.06.089, 2015.
Monks, P. S., Archibald, A. T., Colette, A., Cooper, O., Coyle, M., Derwent, R., Fowler, D., Granier, C., Law, K. S., Mills, G. E., Stevenson, D. S., Tarasova, O., Thouret, V., von Schneidemesser, E., Sommariva, R., Wild, O., and Williams, M. L.: Tropospheric ozone and its precursors from the urban to the global scale from air quality to short-lived climate forcer, Atmos. Chem. Phys., 15, 8889–8973, https://doi.org/10.5194/acp-15-8889-2015, 2015.
Müller, M., Anderson, B. E., Beyersdorf, A. J., Crawford, J. H., Diskin, G. S., Eichler, P., Fried, A., Keutsch, F. N., Mikoviny, T., Thornhill, K. L., Walega, J. G., Weinheimer, A. J., Yang, M., Yokelson, R. J., and Wisthaler, A.: In situ measurements and modeling of reactive trace gases in a small biomass burning plume, Atmos. Chem. Phys., 16, 3813–3824, https://doi.org/10.5194/acp-16-3813-2016, 2016.
Nobes, R. H., Bouma, W. J., and Radom, L.: Structures and stabilities of gas-phase C2H3O+ ions: an ab initio molecular orbital study, J. Am. Chem. Soc., 105, 309–314, https://doi.org/10.1021/ja00341a001, 1983.
Prakash, G. K. S., Bae, C., Rasul, G., and Olah, G. A.: The question of C- vs. O-silylation of ketenes: Electrophilic triethylsilylation of diphenylketene, P. Natl. Acad. Sci. USA, 102, 6251, https://doi.org/10.1073/pnas.0501813102, 2005.
Roberts, J. M., Veres, P. R., VandenBoer, T. C., Warneke, C., Graus, M., Williams, E. J., Lefer, B., Brock, C. A., Bahreini, R., Öztürk, F., Middlebrook, A. M., Wagner, N. L., Dubé, W. P., and de Gouw, J. A.: New insights into atmospheric sources and sinks of isocyanic acid, HNCO, from recent urban and regional observations, J. Geophys. Res.-Atmos., 119, 1060–1072, https://doi.org/10.1002/2013jd019931, 2014.
Ryerson, T. B., Trainer, M., Angevine, W. M., Brock, C. A., Dissly, R. W., Fehsenfeld, F. C., Frost, G. J., Goldan, P. D., Holloway, J. S., Hübler, G., Jakoubek, R. O., Kuster, W. C., Neuman, J. A., Nicks Jr., D. K., Parrish, D. D., Roberts, J. M., Sueper, D. T., Atlas, E. L., Donnelly, S. G., Flocke, F., Fried, A., Potter, W. T., Schauffler, S., Stroud, V., Weinheimer, A. J., Wert, B. P., Wiedinmyer, C., Alvarez, R. J., Banta, R. M., Darby, L. S., and Senff, C. J.: Effect of petrochemical industrial emissions of reactive alkenes and NOx on tropospheric ozone formation in Houston, Texas, J. Geophys. Res.-Atmos., 108, 4249, https://doi.org/10.1029/2002jd003070, 2003.
Sarkar, C., Kumar, V., and Sinha, V.: Massive emissions of carcinogenic benzenoids from paddy residue burning in North India, Curr. Sci.-India, 104, 1703–1709, 2013.
Sarkar, C., Sinha, V., Kumar, V., Rupakheti, M., Panday, A., Mahata, K. S., Rupakheti, D., Kathayat, B., and Lawrence, M. G.: Overview of VOC emissions and chemistry from PTR-TOF-MS measurements during the SusKat-ABC campaign: high acetaldehyde, isoprene and isocyanic acid in wintertime air of the Kathmandu Valley, Atmos. Chem. Phys., 16, 3979–4003, https://doi.org/10.5194/acp-16-3979-2016, 2016.
Sarkar, C., Sinha, V., Sinha, B., Panday, A. K., Rupakheti, M., and Lawrence, M. G.: Source apportionment of NMVOCs in the Kathmandu Valley during the SusKat-ABC international field campaign using positive matrix factorization, Atmos. Chem. Phys., 17, 8129–8156, https://doi.org/10.5194/acp-17-8129-2017, 2017.
Sarkar, C., Guenther, A. B., Park, J.-H., Seco, R., Alves, E., Batalha, S., Santana, R., Kim, S., Smith, J., Tóta, J., and Vega, O.: PTR-TOF-MS eddy covariance measurements of isoprene and monoterpene fluxes from an eastern Amazonian rainforest, Atmos. Chem. Phys., 20, 7179–7191, https://doi.org/10.5194/acp-20-7179-2020, 2020.
Sarkar, S., Mallick, S., Kumar, P., and Bandyopadhyay, B.: Ammonolysis of ketene as a potential source of acetamide in the troposphere: a quantum chemical investigation, Phys. Chem. Chem. Phys., 20, 13437–13447, https://doi.org/10.1039/C8CP01650J, 2018.
Saunders, S. M., Baulch, D. L., Cooke, K. M., Pilling, M. J., and Smurthwaite, P. I.: Kinetics and mechanisms of the reactions of OH with some oxygenated compounds of importance in tropospheric chemistry, Int. J. Chem. Kinet., 26, 113–130, https://doi.org/10.1002/kin.550260112, 1994.
Stockwell, C. E., Veres, P. R., Williams, J., and Yokelson, R. J.: Characterization of biomass burning emissions from cooking fires, peat, crop residue, and other fuels with high-resolution proton-transfer-reaction time-of-flight mass spectrometry, Atmos. Chem. Phys., 15, 845–865, https://doi.org/10.5194/acp-15-845-2015, 2015.
Vogt, J., Williamson, A. D., and Beauchamp, J. L.: Properties and reactions of ketene in the gas phase by ion cyclotron resonance spectroscopy and photoionization mass spectrometry. Proton affinity, site specificity of protonation, and heat of formation of ketene, J. Am. Chem. Soc., 100, 3478–3483, https://doi.org/10.1021/ja00479a032, 1978.
von Hartungen, E., Wisthaler, A., Mikoviny, T., Jaksch, D., Boscaini, E., Dunphy, P. J., and Märk, T. D.: Proton-transfer-reaction mass spectrometry (PTR-MS) of carboxylic acids: Determination of Henry's law constants and axillary odour investigations, Int. J. Mass Spectrom., 239, 243–248, https://doi.org/10.1016/j.ijms.2004.09.009, 2004.
Wang, Z., Nicholls, S. J., Rodriguez, E. R., Kummu, O., Hörkkö, S., Barnard, J., Reynolds, W. F., Topol, E. J., DiDonato, J. A., and Hazen, S. L.: Protein carbamylation links inflammation, smoking, uremia and atherogenesis, Nat. Med., 13, 1176–1184, https://doi.org/10.1038/nm1637, 2007.
Wu, D. and O'Shea, D. F.: Potential for release of pulmonary toxic ketene from vaping pyrolysis of vitamin E acetate, P. Natl. Acad. Sci. USA, 117, 6349–6355, https://doi.org/10.1073/pnas.1920925117, 2020.
Yau, M. K. A. and Rogers, R. R.: A Short Course in Cloud Physics, Elsevier Science, Saint Louis, 3rd Edition, 1996.
Yokelson, R. J., Crounse, J. D., DeCarlo, P. F., Karl, T., Urbanski, S., Atlas, E., Campos, T., Shinozuka, Y., Kapustin, V., Clarke, A. D., Weinheimer, A., Knapp, D. J., Montzka, D. D., Holloway, J., Weibring, P., Flocke, F., Zheng, W., Toohey, D., Wennberg, P. O., Wiedinmyer, C., Mauldin, L., Fried, A., Richter, D., Walega, J., Jimenez, J. L., Adachi, K., Buseck, P. R., Hall, S. R., and Shetter, R.: Emissions from biomass burning in the Yucatan, Atmos. Chem. Phys., 9, 5785–5812, https://doi.org/10.5194/acp-9-5785-2009, 2009.
Zhao, J. and Zhang, R.: Proton transfer reaction rate constants between hydronium ion (H3O+) and volatile organic compounds, Atmos. Environ., 38, 2177–2185, https://doi.org/10.1016/j.atmosenv.2004.01.019, 2004.