the Creative Commons Attribution 4.0 License.
the Creative Commons Attribution 4.0 License.
 | 28 Jul 2021
Differentiation of coarse-mode anthropogenic, marine and dust particles in the High Arctic islands of Svalbard
Congbo Song
Angelo Lupi
Mauro Mazzola
Rita Traversi
Silvia Becagli
Stefania Gilardoni
Stergios Vratolis
Karl Espen Yttri
David C. S. Beddows
Julia Schmale
James Brean
Agung Ghani Kramawijaya
Roy M. Harrison
Understanding aerosol–cloud–climate interactions in the Arctic is key to predicting the climate in this rapidly changing region. Whilst many studies have focused on submicrometer aerosol (diameter less than 1 µm), relatively little is known about the supermicrometer aerosol (diameter above 1 µm). Here, we present a cluster analysis of multiyear (2015–2019) aerodynamic volume size distributions, with diameter ranging from 0.5 to 20 µm, measured continuously at the Gruvebadet Observatory in the Svalbard archipelago. Together with aerosol chemical composition data from several online and offline measurements, we apportioned the occurrence of the coarse-mode aerosols during the study period (mainly from March to October) to anthropogenic (two sources, 27 %) and natural (three sources, 73 %) origins. Specifically, two clusters are related to Arctic haze with high levels of black carbon, sulfate and accumulation mode (0.1–1 µm) aerosol. The first cluster (9 %) is attributed to ammonium sulfate-rich Arctic haze particles, whereas the second one (18 %) is attributed to larger-mode aerosol mixed with sea salt. The three natural aerosol clusters were open-ocean sea spray aerosol (34 %), mineral dust (7 %) and an unidentified source of sea spray-related aerosol (32 %). The results suggest that sea-spray-related aerosol in polar regions may be more complex than previously thought due to short- and long-distance origins and mixtures with Arctic haze, biogenic and likely blowing snow aerosols. Studying supermicrometer natural aerosol in the Arctic is imperative for understanding the impacts of changing natural processes on Arctic aerosol.
- Article
(12807 KB) - Full-text XML
- BibTeX
- EndNote


The Arctic is one of the most sensitive regions of the world, and the Arctic environment is experiencing tremendous changes at a much faster pace than lower latitudes (Landrum and Holland, 2020). The rising temperature, sea ice melt and local air pollutant emissions (Schmale et al., 2018) in the Arctic all exert a broad range of impacts on natural and anthropogenic processes, thereby changing Arctic aerosol properties and consequently radiative forcing and cloud formation (Abbatt et al., 2019; Willis et al., 2018). A better knowledge of Arctic aerosol is an essential requisite for narrowing the uncertainty in assessing the impacts of aerosols on cloud formation and climate change (Schmale et al., 2021). It is known that aerosol–cloud–climate interactions depend upon aerosol properties, such as concentration, size distribution and chemical composition. In particular, the size distribution of aerosols is important as size dictates many of the direct and indirect climate forcing properties of aerosols, as well as indicating their sources and atmospheric lifetimes.
There are several studies that have investigated particle number size distributions at High Arctic sites (Dall'Osto et al., 2019; Freud et al., 2017; Asmi et al., 2016), but the spectra generally measured by scanning mobility particle sizers (SMPSs) are usually limited to aerosol diameters of less than 1 µm, i.e., submicrometer aerosol. These studies are highly informative, but the measured submicrometer aerosols are unlikely to capture some important aerosol sources that are mainly present in the supermicrometer mode (i.e., above 1 µm diameter) decisive for the volume and mass concentration basis, notably sea spray and mineral dust (Quinn et al., 2015; Ricard et al., 2002; Porter and Clarke, 1997; Li and Winchester, 1990). Recently, a long-term trend analysis demonstrated that aerosol observed at the Zeppelin Observatory in Svalbard has become more dominated by coarse mode over time, most likely due the result of increases in the relative amount of sea spray aerosol (Heslin-Rees et al., 2020).
Sea spray aerosol (SSA) is primarily generated from the wave-breaking process, resulting in bubble bursting at the sea surface, and is a significant contributor to the Arctic aerosol mass burden (Quinn et al., 2002; Fitzgerald, 1991). SSA originates from film drops (fragment of the collapsed cap), jet drops (shot from the cavity formed after the bubble bursting) and spume drops (torn off the wave crest by sufficient high wind stress) (Feng et al., 2017; Quinn et al., 2015). The film drops are evaporated in the atmosphere and generate submicrometer SSA, while the jet and spume drops can produce supermicrometer SSA (O'Dowd et al., 1997). According to size-resolved chemical composition of individual SSA reproduced in a laboratory facility, submicrometer SSA is overwhelmingly dominated by organic matter and sea salt mixed with organic matter, while supermicrometer SSA mainly consists of sea salt and biological species (Prather et al., 2013). This suggests that understanding supermicrometer aerosol in the Arctic is of great value for understanding not only sea salt but also biological processes. Contrary to other global oceans, in the Arctic sea salt can be generated from open water, open leads in the sea ice (Kirpes et al., 2019; May et al., 2016) and salty blowing snow (Frey et al., 2020; Huang and Jaeglé, 2017). All sources can contribute significantly to the Arctic sea salt budget, and they have different seasonality. With rapidly declining Arctic sea ice extent and snow coverage and increasing ocean areas, the chemical nature and size distribution of SSA in the Arctic are both likely to change, which potentially alters cloud condensation nuclei (CCN) activity (Collins et al., 2013), ice nucleating capacity (Wilson et al., 2015; Russell, 2015) and radiative forcing (Struthers et al., 2011). Murphy et al. (2019) recently also reported a source of sea salt aerosol over pack ice that is distinct from that over open water, stressing that sea spray aerosols in the Arctic regions may be more complex than previously assumed.
Mineral dust is important owing to its ability to affect the radiation balance of the atmosphere as well as the surface energy balance by its presence in layers over high albedo surfaces or deposited on snow and ice (Sanchez-Marroquin et al., 2020; Kylling et al., 2018; Stone et al., 2007). They can also serve as ice nucleating particles and thus altering the cloud properties and lifetime (Tobo et al., 2019). Sharma et al. (2019) found dust components in the Arctic to be most abundant in late summer/early autumn, whereas a less abundant but still significant peak was observed in spring. The atmospheric dust load in the Arctic is presumably influenced by high-latitude local dust emissions (Tobo et al., 2019; Bullard et al., 2016) and long-range transported windblown dust from low-mid latitudes (Sirois and Barrie, 1999). Mineral species in Arctic aerosol were reported to be mainly present in the supermicrometer mode with mean aerodynamic diameter at ∼ 5 µm on a volume/mass concentration basis (Ricard et al., 2002). The frequency of windblown dust events is projected to increase in the Arctic as a consequence of the rapid and widespread retreat of glaciers leading to more ice free terrain (proglacial fields or floodplains where fine glaciofluvial sediment deposits are exposed to wind) (Tobo et al., 2019; Bullard et al., 2016).
Measuring supermicrometer aerosol in the Arctic is important to understand the chemical nature of SSA and mineral dust, their potential sources, and their impacts on aerosol–radiation and aerosol–cloud interactions in the rapidly changing Arctic. Several studies have measured supermicrometer aerosol in the Arctic environment using multi-stage cascade impactors combined with offline chemical analysis (Ghahremaninezhad et al., 2016; May et al., 2016; Ricard et al., 2002; Li and Winchester, 1990) and using single-particle analysis (Tobo et al., 2019; Kirpes et al., 2019; Yu et al., 2019; Kirpes et al., 2018; Chi et al., 2015; Geng et al., 2010). These measurements were typically carried out for short periods in a particular season and serving specific research questions, thus providing only limited understanding of the seasonal cycle of the supermicrometer aerosol in the Arctic. One exception is the multiyear (2006–2009) measurements of submicrometer and supermicrometer aerosols by May et al. (2016), who found that open leads contribute year-round to local Arctic SSA emissions. The aerosol size distribution and seasonal and interannual variations of the supermicrometer aerosol remain open questions due to the low time resolution and the limited aerosol size bins.
To improve the current understanding of the seasonal cycle and interannual variations of the submicrometer and supermicrometer aerosols, as well as the roles of natural and anthropogenic aerosols in the Arctic, in situ aerosol aerodynamic size distributions up to 20 µm were measured from 2015 to 2019 at an hourly time resolution at a background site in Svalbard, i.e., Gruvebadet. A k-means clustering technique was applied to the size distribution to separate major aerosol types (Lachlan-Cope et al., 2020; Dall'Osto et al., 2019; Freud et al., 2017; Beddows et al., 2014, 2009). In addition, the aerosol size distributions are complemented by aerosol chemical composition data from several online and offline measurements to distinguish anthropogenic and natural aerosol types and their potential sources. This study adds to our knowledge of supermicrometer aerosol in the rapidly changing Arctic, and it is a complement to the submicrometer aerosol number size distributions in the European Arctic presented by Dall'Osto et al. (2019). Future studies will look at receptor modeling of both aerosol size distributions and chemical composition in the Arctic.
2.1 Sampling and measurements
A total of 5 years (from 2015 to 2019) of aerosol sampling and measurements were carried out at the Gruvebadet (GVB) Observatory (78.918∘ N, 11.895∘ E; 61 m above mean sea level), located at about 800 m southwest of the village of Ny-Ålesund in the Svalbard archipelago. In the northeastern direction towards the Ny-Ålesund research village, a clean area was established and motorized activity and other potentially contaminant activities were forbidden. The geographic location of GVB and the dominant winds ensure minimal anthropogenic contamination from local emissions (Udisti et al., 2016) while also capturing long-range transported pollution air masses.
The aerosol size distribution was measured by an aerodynamic particle sizer (APS; TSI model 3321, 52 channels) (Traversi et al., 2020). The APS spectrometer provides real-time aerodynamic measurements of particles from 0.5 to 20 µm diameter. Typical single-channel uncertainty in aerosol number concentration measured by the APS is ±10 % according to the specification sheets. The aerosol size distribution was usually measured from March to September (see Fig. 1), with approximately 21200 hourly observations in total from 2015 to 2019, corresponding to approximately 909 and 140 aerosol size distributions after averaging to daily and weekly observations, respectively. Aerosol light absorption was simultaneously measured at three wavelengths (i.e., 467, 530 and 660 nm) by a particle soot absorption photometer (PSAP, Radiance Research) at a 1 min time resolution and then averaged into hourly observations. The raw data from PSAP were corrected according to Virkkula et al. (2005). Aerosol absorption coefficient is directly proportional to the concentration of equivalent black carbon (eBC) (Petzold et al., 2013), a marker of anthropogenic and wildfire emissions in the Arctic (Abbatt et al., 2019). Details regarding the PSAP and eBC measurements at the site are described by Gilardoni et al. (2020). The APS and PSAP are attached to a same inlet, which has followed EUSAAR-ACTRIS protocol since 2011 and runs about 4 m above the ground. Further information can be found elsewhere (Lupi et al., 2016).

Figure 1Monthly average aerosol volume size distribution from 2015 to 2019. There are missing data in some months but good data coverage from March to June. No data are available in December. Monthly average aerosol number size distribution measured by the APS during 2015–2019 is shown in Fig. A1.
Aerosol filter samples were collected daily from February 2015 to August 2018, using a Tecora SkyPost sequential sampler equipped with a PM10 sampling head, operating following the EN 12341 European protocol. PM10 was collected on Teflon filters (Pall Corp., 47 mm diameter, 2 µm porosity, collection efficiency 99.6 %); 606 daily samples were analyzed, of which 570 samples overlapped with the aerosol size distribution measurements. Samples were handled in a clean room (class 10 000), under a laminar flow hood (class 100) to minimize contamination. Half of each filter sample was extracted in an ultrasonic bath (15 min) using ultrapure water (MilliQ, 18 MΩ cm, 12 mL) for subsequent analysis of inorganic anions (Cl−, Br−, NO and SO) and cations (Na+, NH, K+, Mg2+ and Ca2+) and selected organic anions (methanesulfonate (MSA) and oxalate) on a three Dionex ion chromatography (IC) system equipped with electrochemical-suppressed conductivity detectors. The configuration of the three IC system is described by Giardi et al. (2016) and Udisti et al. (2016, 2012). Analytic uncertainty is typically below 5 %.
Meteorological parameters, including wind speed, wind direction, relative humidity and ambient temperature, were recorded hourly by a Vaisala thermo-hygrometer model HMP45AC and a Young Marine wind sensor model Wind Monitor 05106 at a height of 10 m (a.g.l.) on the Amundsen-Nobile Climate Change Tower (Mazzola et al., 2016) in the neighborhood of Gruvebadet observatory.
2.2 k-means cluster analysis
Cluster analysis is commonly used to interpret particle number size distribution measurements (Lachlan-Cope et al., 2020; Dall'Osto et al., 2019; Freud et al., 2017; Beddows et al., 2014, 2009). As we mainly focus on supermicrometer aerosol, we conduct cluster analysis of the aerosol volume size distribution rather than aerosol number size distribution using a k-means clustering algorithm following a standard procedure by Beddows et al. (2014). The underlying principle of the k-means clustering is to minimize the sum of squared Euclidean distances between each data point and the corresponding cluster centers (the average spectra of the subgroup). This allows for dividing the whole dataset into a predefined number of subgroups that are as different as possible from each other and as coincident as possible within themselves.
To cluster the spectra modes irrespective of the magnitude of the concentrations, the aerosol size distributions were pre-processed using min–max normalization:
where x and y are the absolute and normalized concentrations, respectively. The subscript i and j denote size bins, and n is the number of size bins. The normalized concentrations were then clustered using k-means.
2.3 Source apportionment of sulfate
Source apportionment of sulfate was carried out following Udisti et al. (2016) to understand potential sources of sulfate for the identified aerosol clusters. We first apportion Na+ and Ca2+ to sea salt and non-sea salt fractions. In general, Na+ and Ca2+ are considered proxies for sea salt and mineral dust, respectively. However, a small amount of Na+-containing aerosol in remote regions could be brought in by non-sea salt sources and some fractions of Ca2+-containing aerosol originate from sea spray (Salter et al., 2016; Bigler et al., 2006). Assuming a Ca2+ Na+ ratio () of 0.038 for sea water and 1.78 for mineral dust (Bowen, 1979), the measured total Na+ and Ca2+ can be apportioned to a sea salt (ss) fraction and a non-sea salt (shortened to nss) fraction calculated by
The sea salt fraction of sulfate (ss-SO) was calculated by multiplying the ss-Na+ (as a sea spray marker) concentration by 0.253 (indicating the SO Na+ ratio in sea water) (Bowen, 1979). The non-sea salt fraction of sulfate (nss-SO) was calculated by subtracting the ss-SO contribution from the total SO concentrations. The mineral fraction of sulfate (mineral-SO) was estimated by multiplying the nss-Ca2+ content by 0.59 (SO Ca2+ ratio in the uppermost part of Earth's crust) (Guerzoni and Chester, 1996). It is worth noting that Ca in high-latitude dust may not be in the form of carbonate and thus will not be measurable as Ca2+ (McCutcheon et al., 2021; Baldo et al., 2020; Bachelder et al., 2020). Some studies also reported a low amount of Ca-containing high-latitude dust (McCutcheon et al., 2021; Baldo et al., 2020; Bachelder et al., 2020). Thus, the nss-Ca2+ is a conservative tracer for mineral dust. Sulfate formed by atmospheric oxidation of dimethylsulfide (DMS) from micro-algae, bio-SO, was estimated by multiplying methanesulfonate (MSA) concentration by 3.0, which was derived from the relationship between MSA and SO at the same site by Udisti et al. (2016). In their study, they used 136 PM10 samples from the spring–summer season of 2014 to establish the MSA and bio-SO relationship. The anthropogenic fraction of sulfate (anthr-SO) in each sample is then estimated by subtracting the sum of the ss-SO, mineral-SO, and bio-SO fractions from the total SO concentration.
2.4 Back trajectories and potential source regions
The Hybrid Single Particle Lagrangian Integrated Trajectory (HYSPLIT 5.0.0) model (Stein et al., 2016) was used to calculate hourly backward trajectories arriving at an altitude of 100 m (average mean sea level) at the GVB from 2015 to 2019. The determination of the length of the back trajectories is a compromise between the uncertainty in calculation, which increases with time, and the typical lifetime of aerosol in the Arctic, which is usually between 3 and 8 d for black carbon (Stohl, 2006) and up to 39 d during Arctic haze (Baskaran and Shaw, 2001). In the present study, a 7 d air mass backward trajectory was chosen.
The HYSPLIT back trajectories provide a detailed history of the air parcels, including latitude, longitude, altitude and the height of the mixing layer (ML). The back trajectories are divided into above or below the mixing layer height. Daily surface types in the Northern Hemisphere were obtained from the National Ice Center's Interactive Multisensor Snow and Ice Mapping System (IMS) (U.S. National Ice Center, 2008), National Snow & Ice Center. The IMS map of the Northern Hemisphere classified each of 1024 × 1024 grid cells (24 km spatial resolution) as sea, land (without snow), sea ice or snow-covered land (snow). The daily surface types are temporally allocated with the back trajectories. Each data point from the hourly back trajectories is labeled as (1) sea, (2) sea ice, (3) snow, (4) land or (5) above ML.
The potential source contribution function (PSCF) values were calculated using the “openair” package in R (Carslaw and Ropkins, 2012) to identify the potential geographic origins of each aerosol cluster. The geographic region covered by the back trajectories was divided into 1∘ × 1∘ grid. The PSCF value is calculated by
where ni,j is the total number of endpoints that fall in the i,jth cell, and mi,j is defined as the number of endpoints in the same cell that exceed the threshold criterion. In the present study, the 75th percentile of total volume concentration for each cluster was used as the criterion value. A higher ratio of indicates a higher probability of a particular grid through which a passing air parcel would result in a higher concentration at the receptor (Zeng and Hopke, 1989). Wi,j is an empirical weight function to reduce the uncertainty of for the cells with ni,j less than 2 times the grid average number of the trajectory endpoint (2×nave).
Figures 1 and A1 show the monthly average aerosol volume and number size distributions from 2015 to 2019, respectively. The peaks of monthly average number size distributions all occurred in the accumulation mode and the number concentration () of the peaks are usually below 10 cm−3 (Fig. A1). For volume size distribution, bimodal or trimodal size distributions are often observed throughout the years. The highest concentration was found at 2–4 µm diameter, regardless of season. A second peak was observed in the submicrometer mode at 0.6–0.8 µm diameter, more prominent from March to May.
3.1 Characterization of the k-means derived aerosol types
The k-means cluster analysis of aerosol volume size distributions was performed using 909 daily spectra collected from 2015 to 2019. The determination of the most appropriate number of clusters is critical. Here, the Dunn Index (DI) and silhouette width (SW) were calculated for cluster numbers ranging from 2 to 15 (see Fig. A2). DI is to identify sets of clusters that are compact, with a small variance between members of the cluster, and well separated, where the cluster centers are sufficiently far apart, as compared to the within cluster variance. A higher DI indicates better separated clusters. SW refers to a method of interpretation and validation of consistency within clusters of data. A high SW indicates that an individual spectrum is well matched to its own cluster and poorly matched to neighboring clusters. For a given assignment of clusters, higher DI and SW values indicate better clustering results. According to the DI and SW values versus cluster numbers (Fig. A2), five- and seven-cluster solutions appear to be the two promising solutions. For the seven-cluster solution, we observed an obvious increase in the DI value but a decrease in the SW value compared to those from the five-cluster solution, suggesting that some of the clusters in the seven-cluster solution tend to be similar to neighboring clusters. Figure A3 illustrates that the C3 to C6 aerosol categories overlapped with each other and are not well separated, especially when taking into account the standard deviation. The five-cluster solution is able to overcome the overlapping issues and thus was chosen in the present study.
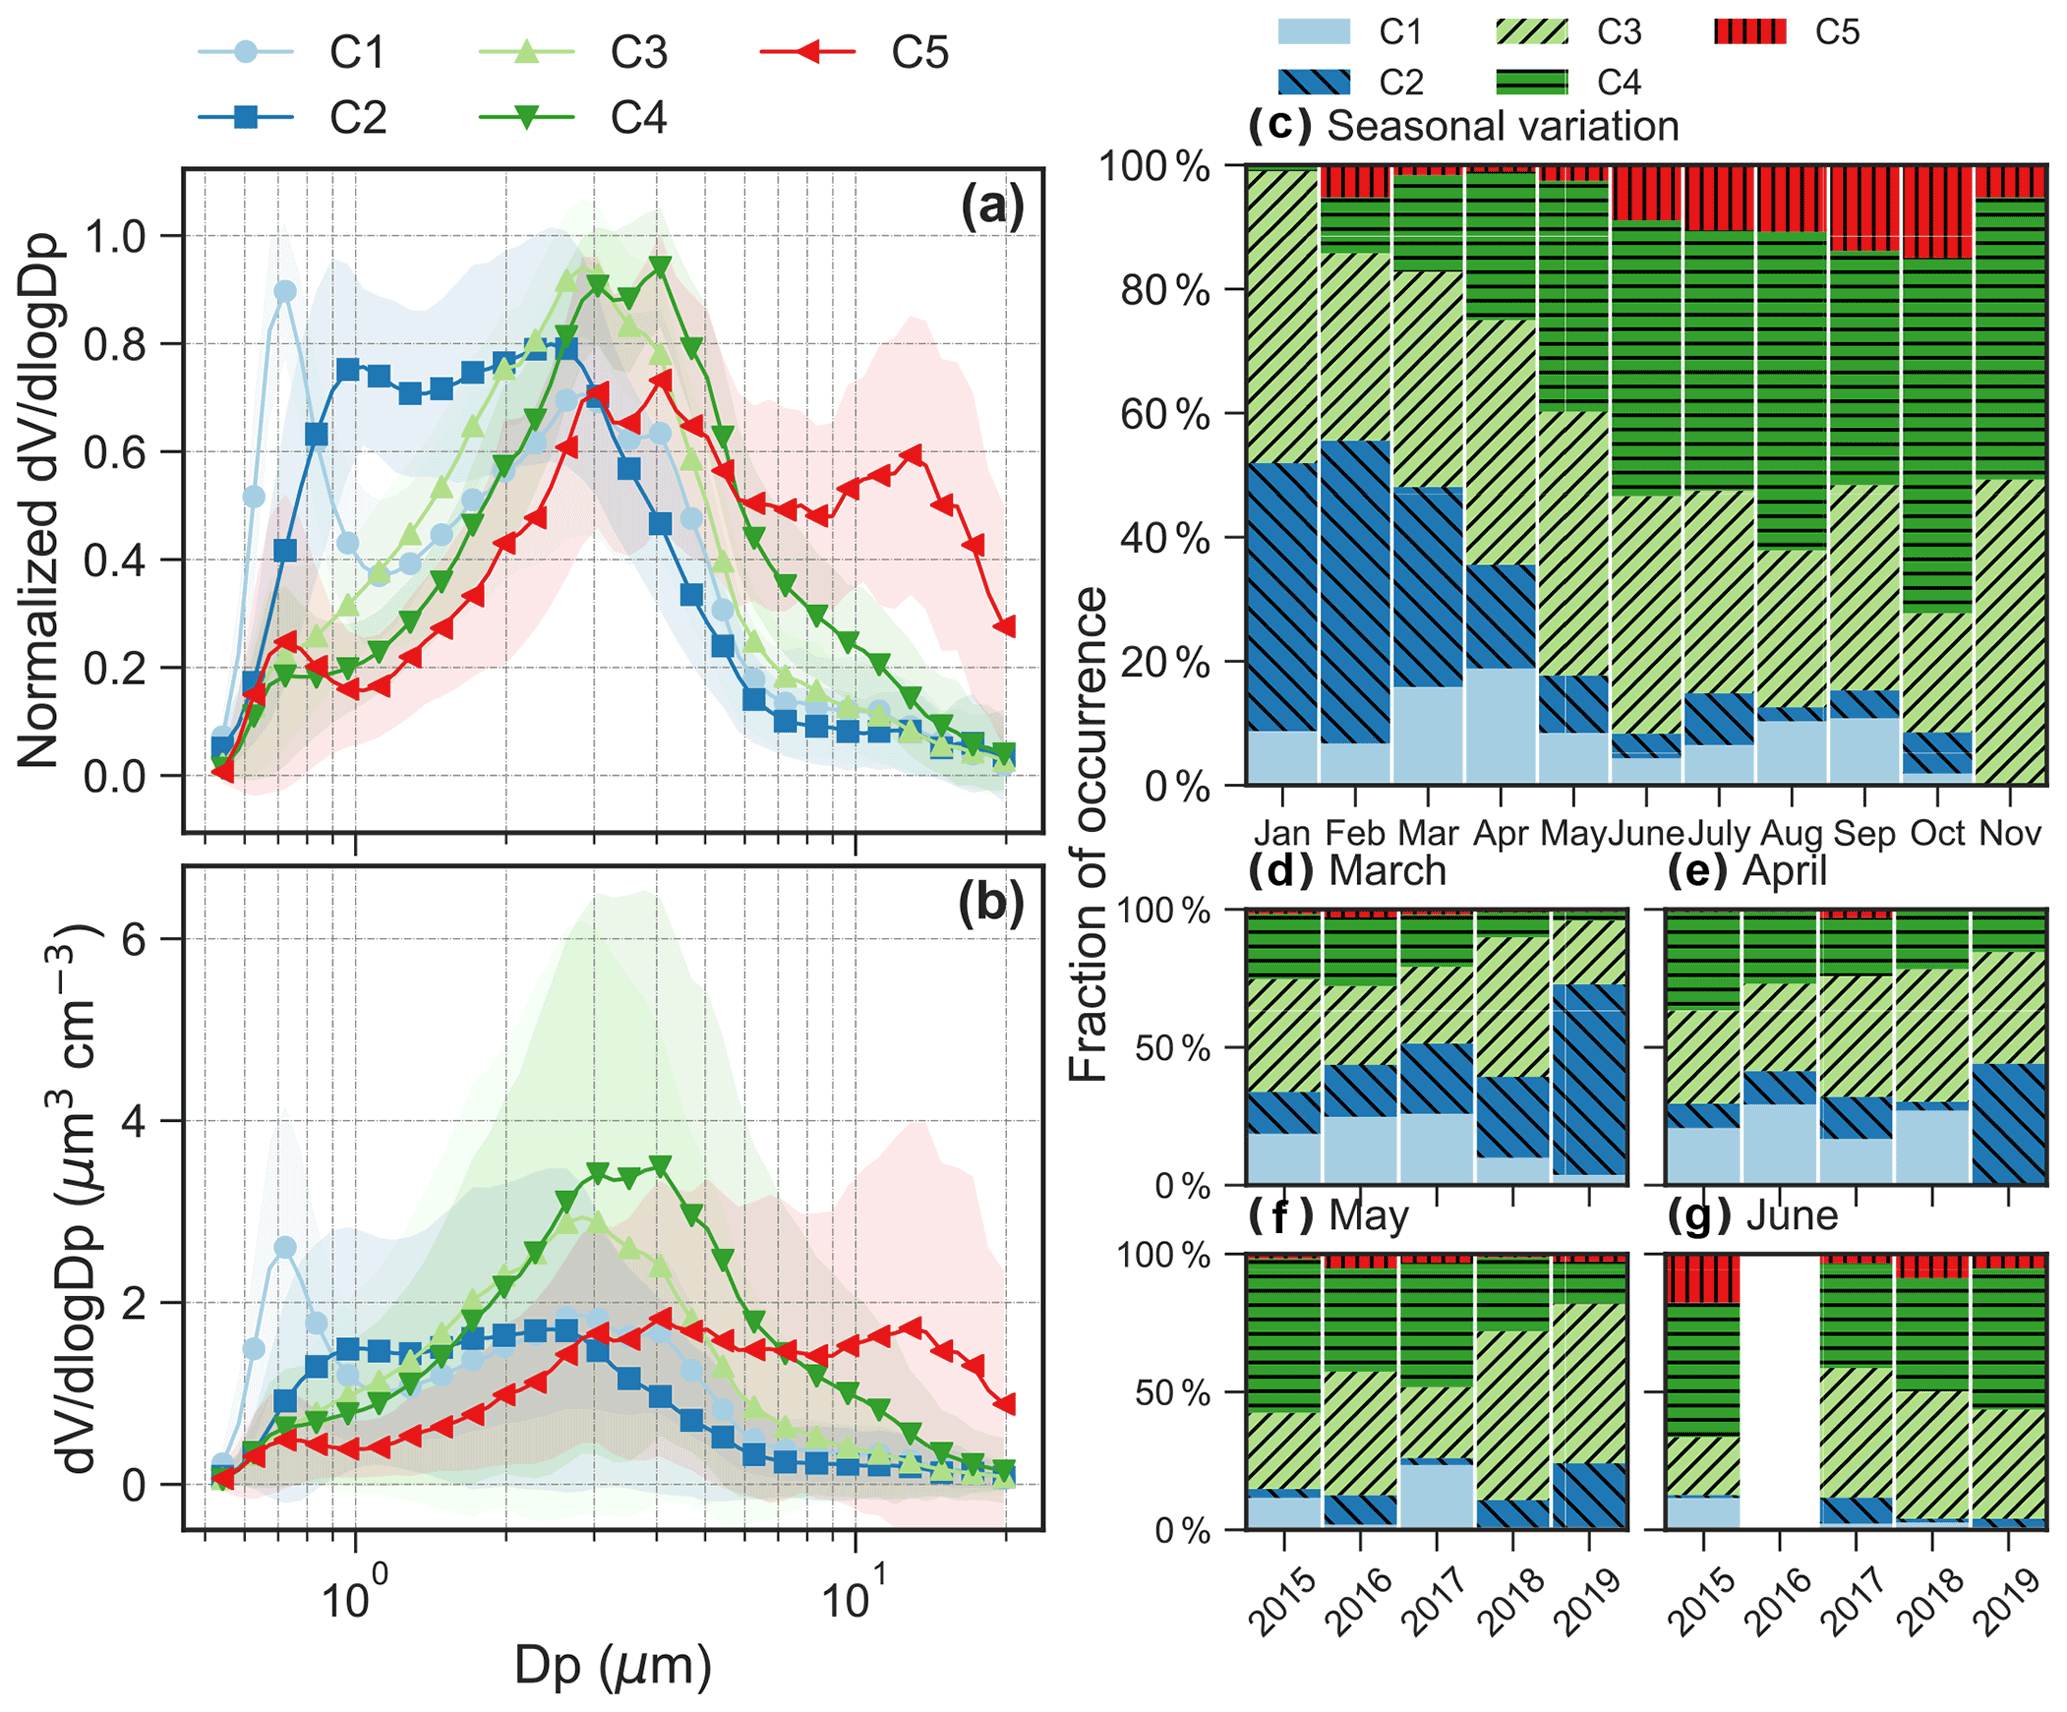
Figure 2(a) Normalized and (b) absolute aerosol volume size distributions for the five clusters. Shaded area for the size distribution shows 1 standard deviation. (c) Seasonal variation in relative abundance of the five clusters. Interannual variation in the relative abundance from 2015 to 2019 in the months of (d) March, (e) April, (f) May and (g) June. We only show the interannual variation from March to June because these months have good data coverage in 2015–2019.

Figure 3(a) Diurnal variation of the mean of the aerosol volume size distribution and (b) polar plots of total volume concentration for the five aerosol clusters. Polar plots show that the average concentrations vary by wind speed and wind direction. The color scale of the polar plot is the average concentration level normalized by dividing by the mean value from each cluster.
Note that the five clusters (C1, C2, C3, C4 and C5) were ranked by the main aerodynamic diameter of the peak concentration in the average spectrum from small to large diameters for C1 to C5 (Fig. 2). Figure 3 shows the daily temporal trends and the polar plots of the five aerosol clusters. The aerosol types are characterized as follows.
-
C1, which occurs 9.3 ± 5.1 % (μ ± σ, average from monthly occurrence frequency) of the time. C1 presents a bimodal size distribution with a dominant peak in the accumulation mode at ∼ 0.7 µm and a lower peak at ∼ 3 µm (Figs. 2a–b and 3a). The predominant months were March (15.9 %) and April (18.8 %), i.e., in spring (Fig. 2c). The relative contribution from different regions to back-trajectory air parcels for C1 is similar to that in March and April, which is characterized by the highest fraction of historical air parcels above mixing-layer height among the five clusters or all seasons (Fig. A4a).
-
C2, which occurs 17.6 ± 17.4 % of the time. C2 shows a bimodal size distribution with peaks at ∼ 0.9 and 2–3 µm (Figs. 2a–b and 3a). The concentration in the accumulation mode was lower but with a slightly larger diameter (∼ 1 µm) compared to C1. The predominant months are from January (43.2 %) to March (32.2 %), i.e., in winter and early spring (Fig. 2c). C2 has the second highest fraction of air masses above mixing-layer height (Fig. A4a).
-
C3, which occurs 34.2 ± 8.2 % of the time. The size distribution is dominated by the coarse mode with a peak at ∼ 3 µm (Figs. 2a–b and 3a). C3 occurred throughout all seasons, with a relative contribution ranging from 19.2 % in October to 49.3 % in November (Fig. 2c).
-
C4, which occurs 32.0 ± 18.7 % of the time. The size distribution is dominated by the coarse mode, with a peak diameter of 3-4 µm (Figs. 2a–b and 3a). The average peak concentration for C4 is slightly higher and with a slightly larger diameter compared to C3. This cluster dominated over other clusters from June to November (Fig. 2c).
-
C5, which occurs 6.9 ± 5.5 % of the time. C5 shows a trimodal distribution with a peak in the accumulation mode at ∼ 0.7 µm and in the coarse mode at 3–4 and 12–14 µm (Figs. 2a–b and 3a). The predominant months are from June (8.9 %) to October (15.0 %) with warm temperature, low relative humidity and high wind speed (Fig. A5), i.e., in summer and early autumn. These months also received relatively high fractions of air parcels spent above lands (Fig. A4a–b).
The occurrence of the five clusters and the key chemical species associated with each cluster are summarized in Table 1. Note that the relative occurrences of the clusters are limited to the study period (mainly from March to October), and thus with limited coverage of the winter season. The interannual variations of fraction of occurrence from March to June are also shown in Fig. 2d–g. No clear interannual patterns were observed for the aerosol clusters identified. The polar plots show that high concentrations of the five clusters were typically found when wind speed was higher than 5 m s−1 (Fig. 3a), which is consistent with the probability density distribution of the wind speed for aerosol volume concentrations exceeded their 90th-percentile values within each cluster (Fig. A5).
Table 1Occurrence and key species for the five clusters.
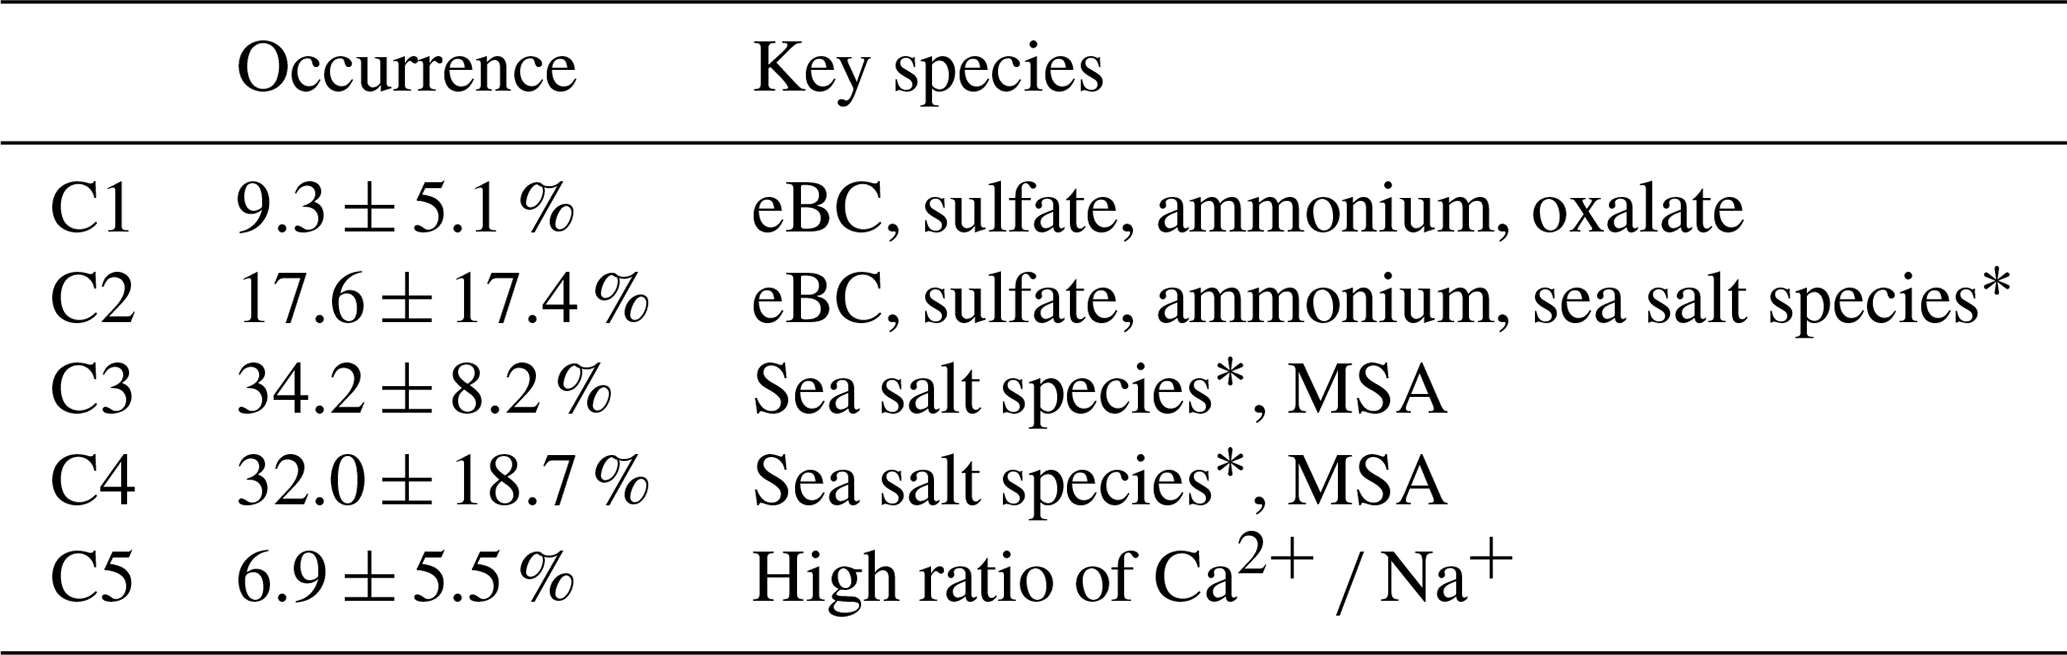
∗ Sea salt species here refers to Na+, Cl− and Mg2+.
3.2 Relationship of aerosol clusters and chemical components
Figures 4 and 5 present average concentrations of each chemical species and absorption coefficients for the identified clusters, respectively. Absorption coefficients (Fig. 5b), oxalate (Fig. 4j), total SO (Fig. 4h) and NH (Fig. 4f) were enhanced for C1. These components are also enriched in C2, along with Na+ (Fig. 4d), Cl− (Fig. 4e) and Br− (Fig. 4i). Absorption coefficients were relatively low for C3–5 compared to C1 and C2 (see Fig. 5b). MSA (Fig. 4k), Na+ (Fig. 4d) and Cl− (Fig. 4e) were enriched in C3. C4 showed an enhanced concentration in MSA (Fig. 4k), Na+ (Fig. 4d) and Cl− (Fig. 4e), whereas C5 was characterized by lowest K+ (Fig. 4a), NH4 (Fig. 4f), NO (Fig. 4g) and SO (Fig. 4h). The relationship between C1–5 and the absorption coefficient is shown in Fig. 5b. Clearly, the absorption coefficient for C1–2 was enhanced in comparison to that for C3–5. We will discuss these results in detail in Sect. 4.
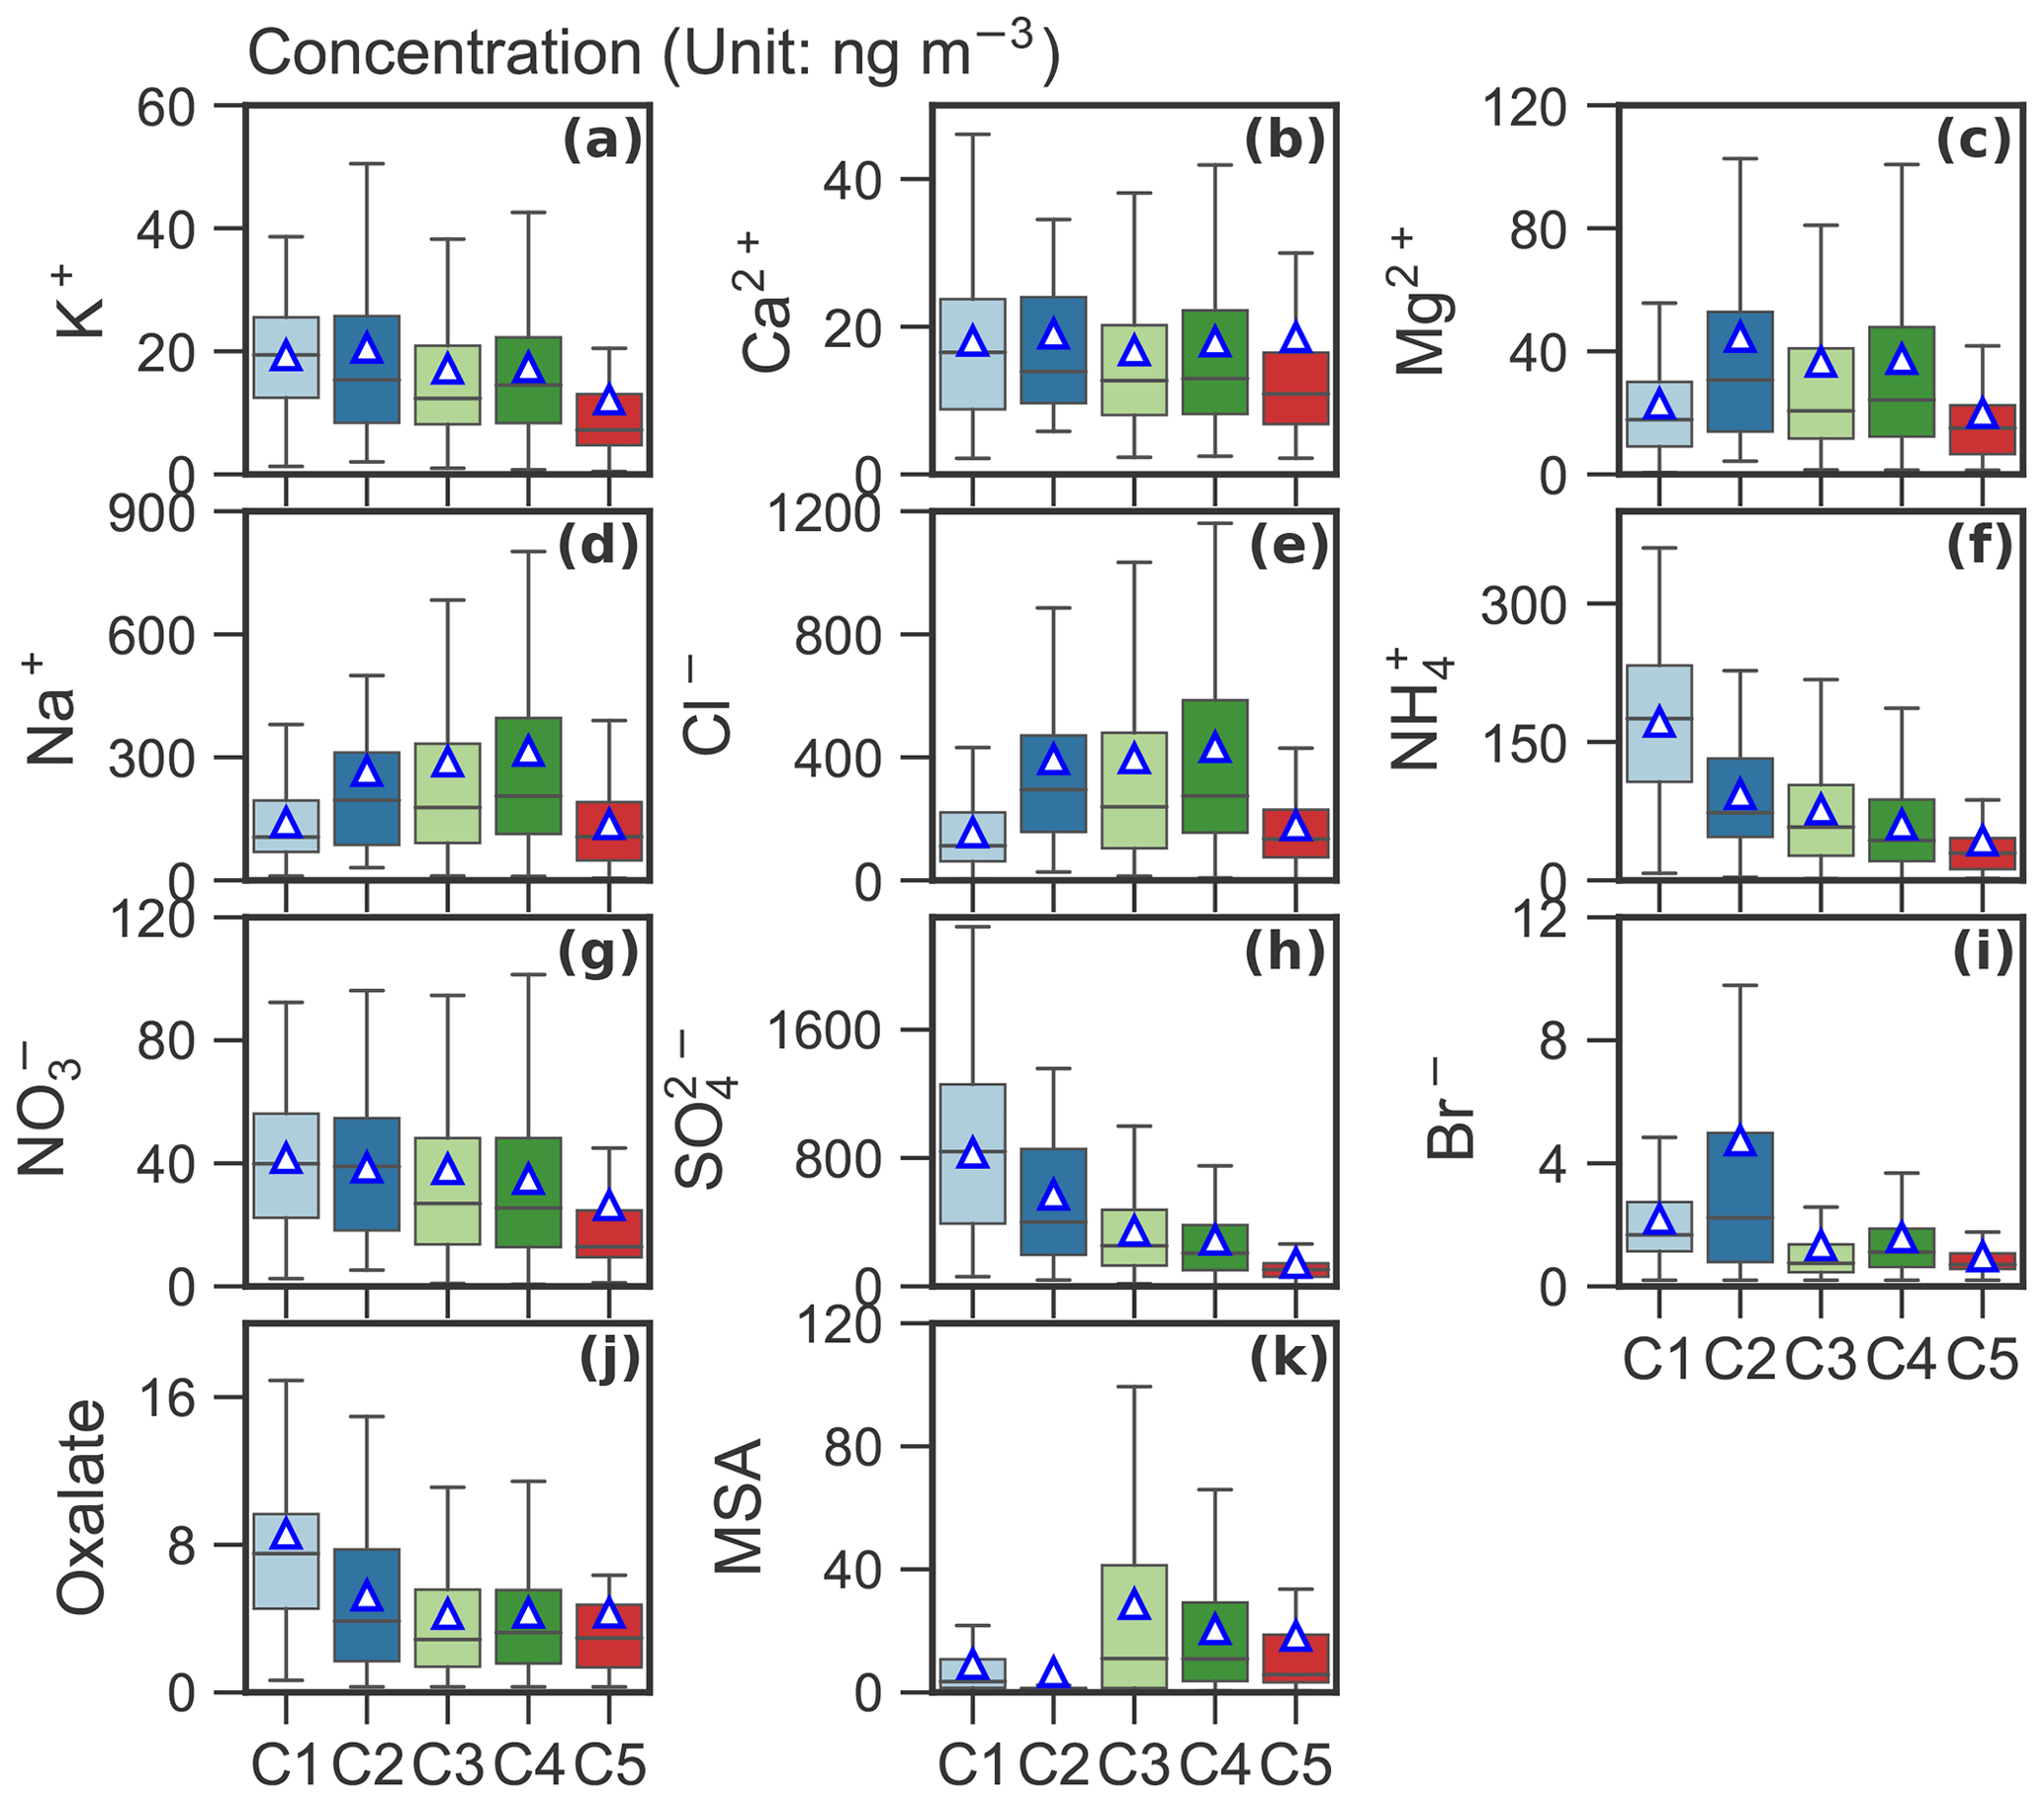
Figure 4Box plot of mass concentration (unit: ng m−3) of each chemical species for the identified clusters. The mean values are marked as triangles.
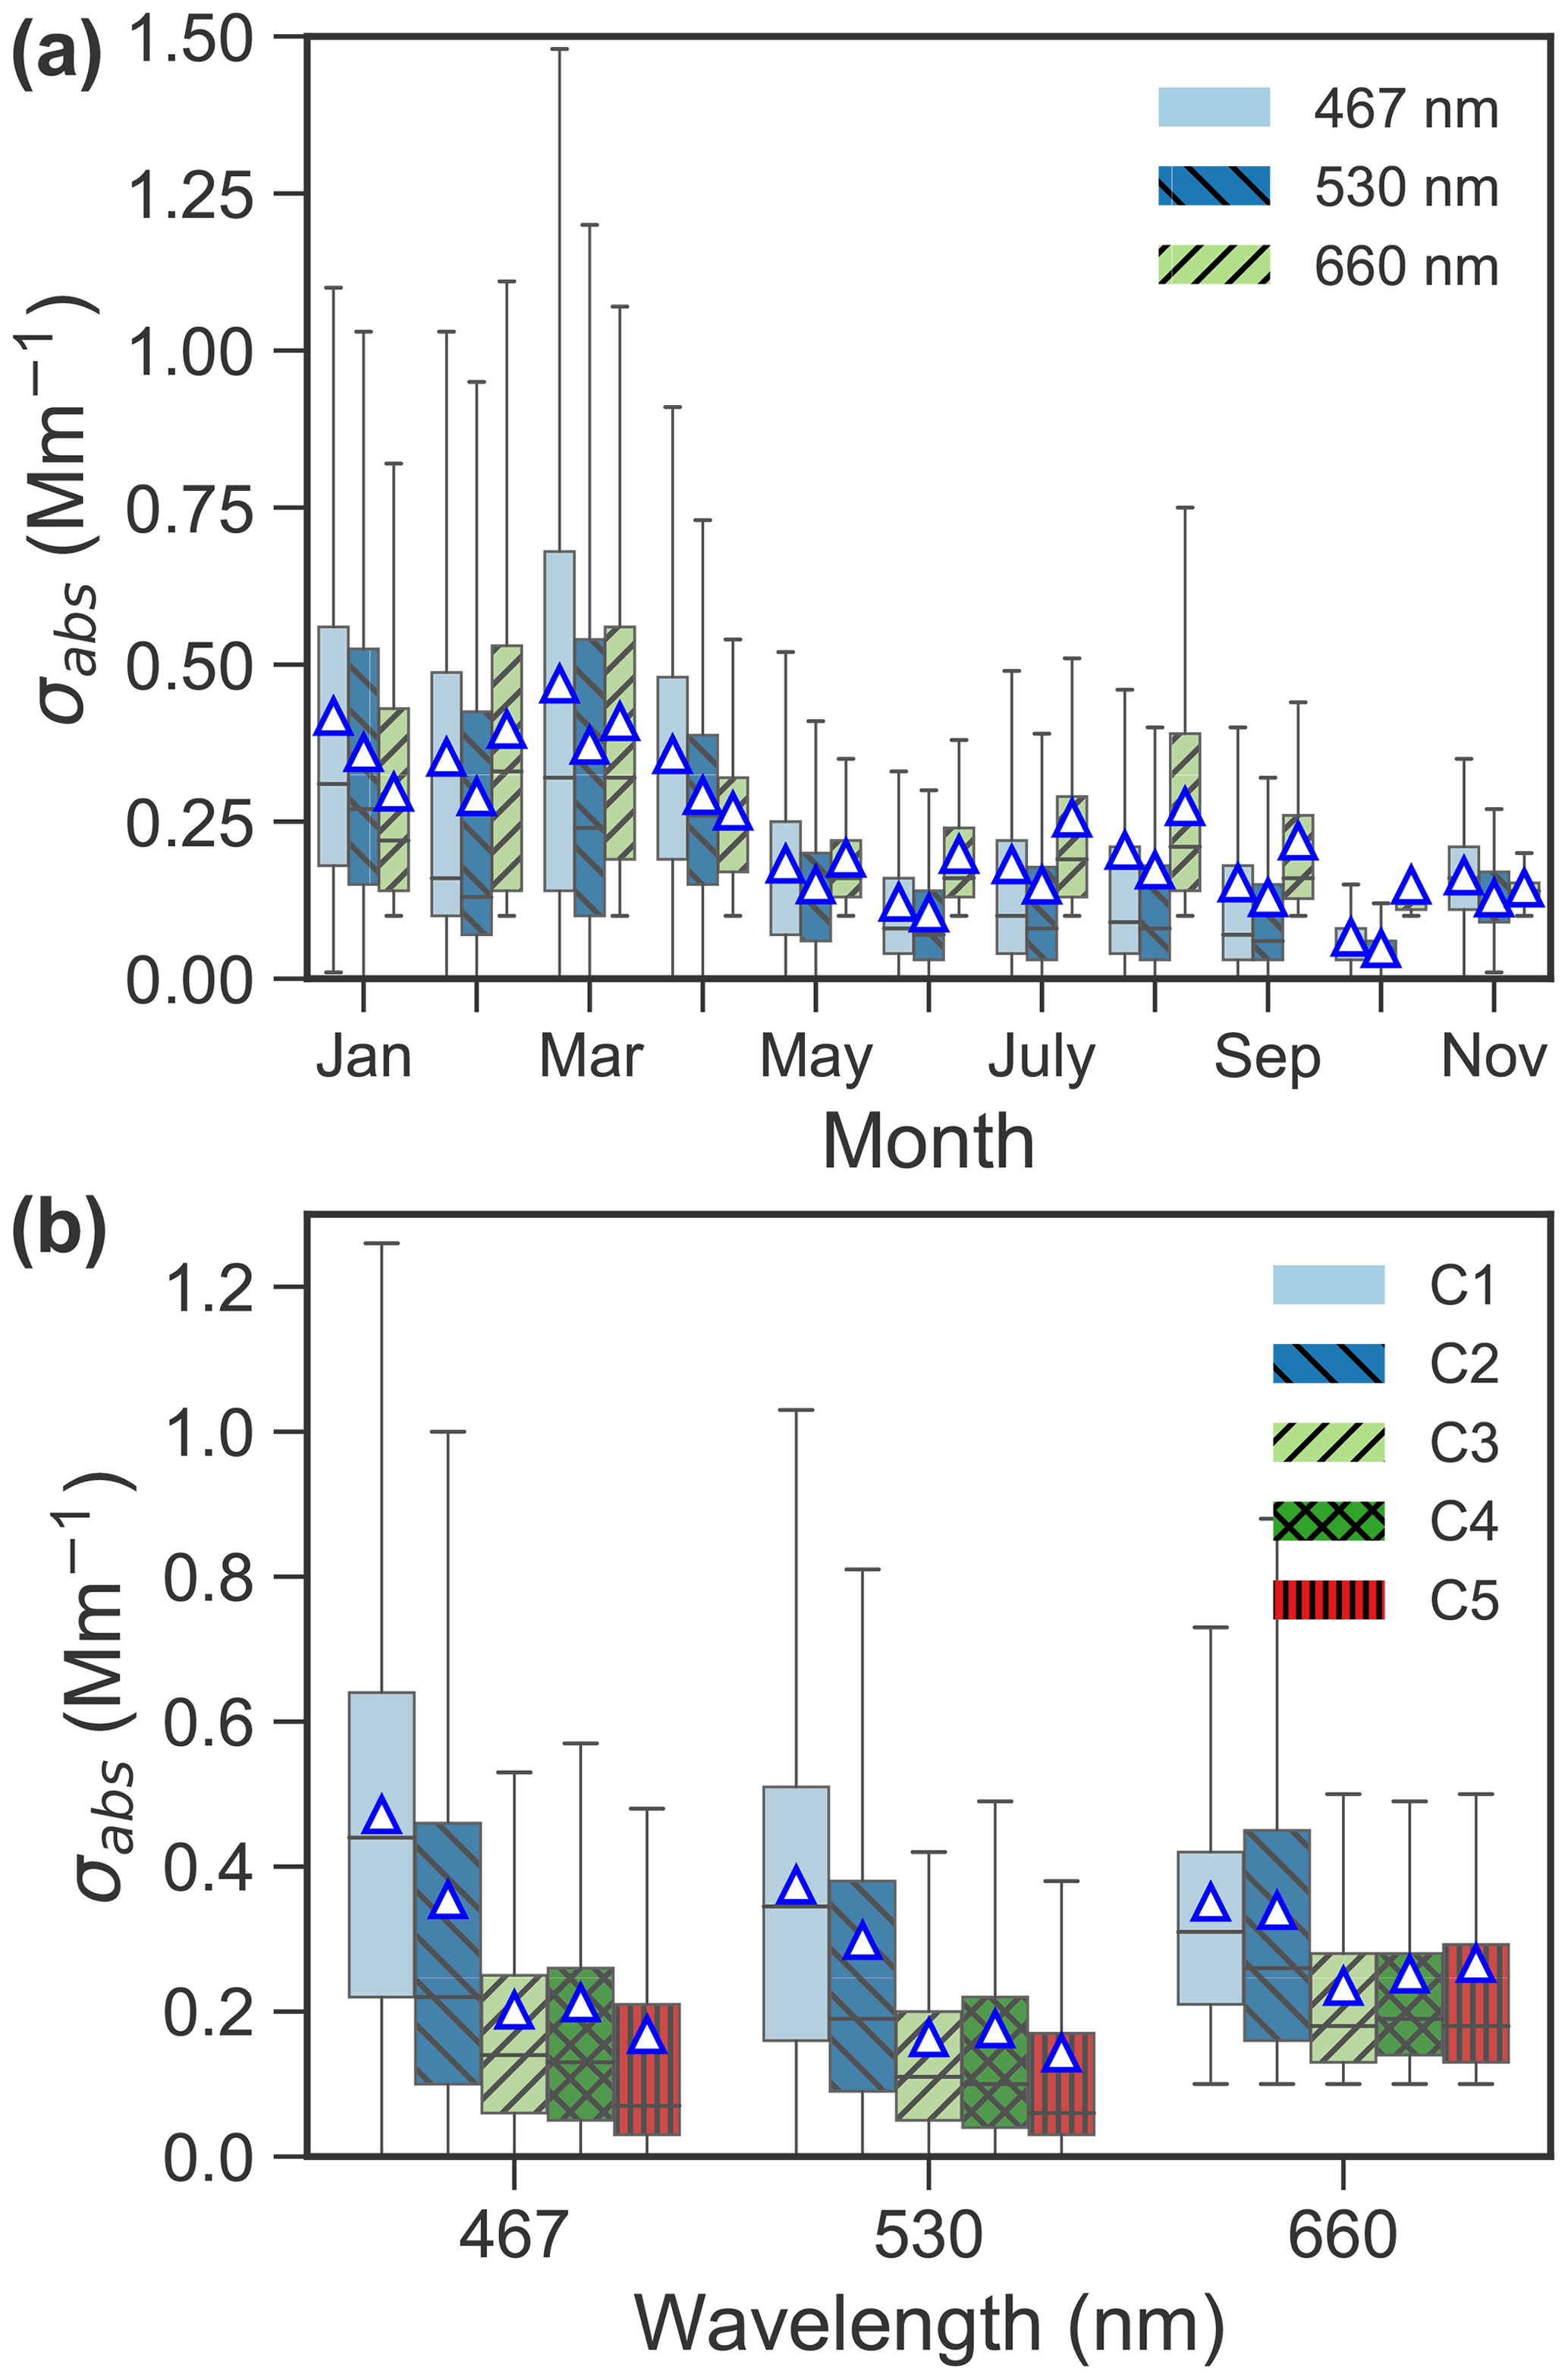
Figure 5(a) Seasonal variation of absorption coefficient (σabs) at wavelengths of 467, 530 and 660 nm in 2015–2019, and (b) boxplot of absorption coefficient at the three wavelengths for each cluster. The mean values are marked as triangles.
Na+ and Ca2+ are usually apportioned to a sea salt and a non-sea salt fractions using characteristic ratios of Ca2+ and Na+ in sea water and in the Earth's crust (Eqs. 2–3). Figure 6 shows a scatter plot of Ca2+ versus Na+ for the clusters, including Ca2+ Na+ ratios for sea water (0.038, ) and the Earth's crust (1.78, ). The regression line of Na+ and Ca2+ for C5 is close to the “mineral” ratio, whereas it is closer to the sea water ratio for C2–4. Note that the Na+ and Ca2+ regression line for C3 fits very well with that in sea water. The regression line for C1 is in the middle of the mineral ratio and the sea water ratio.
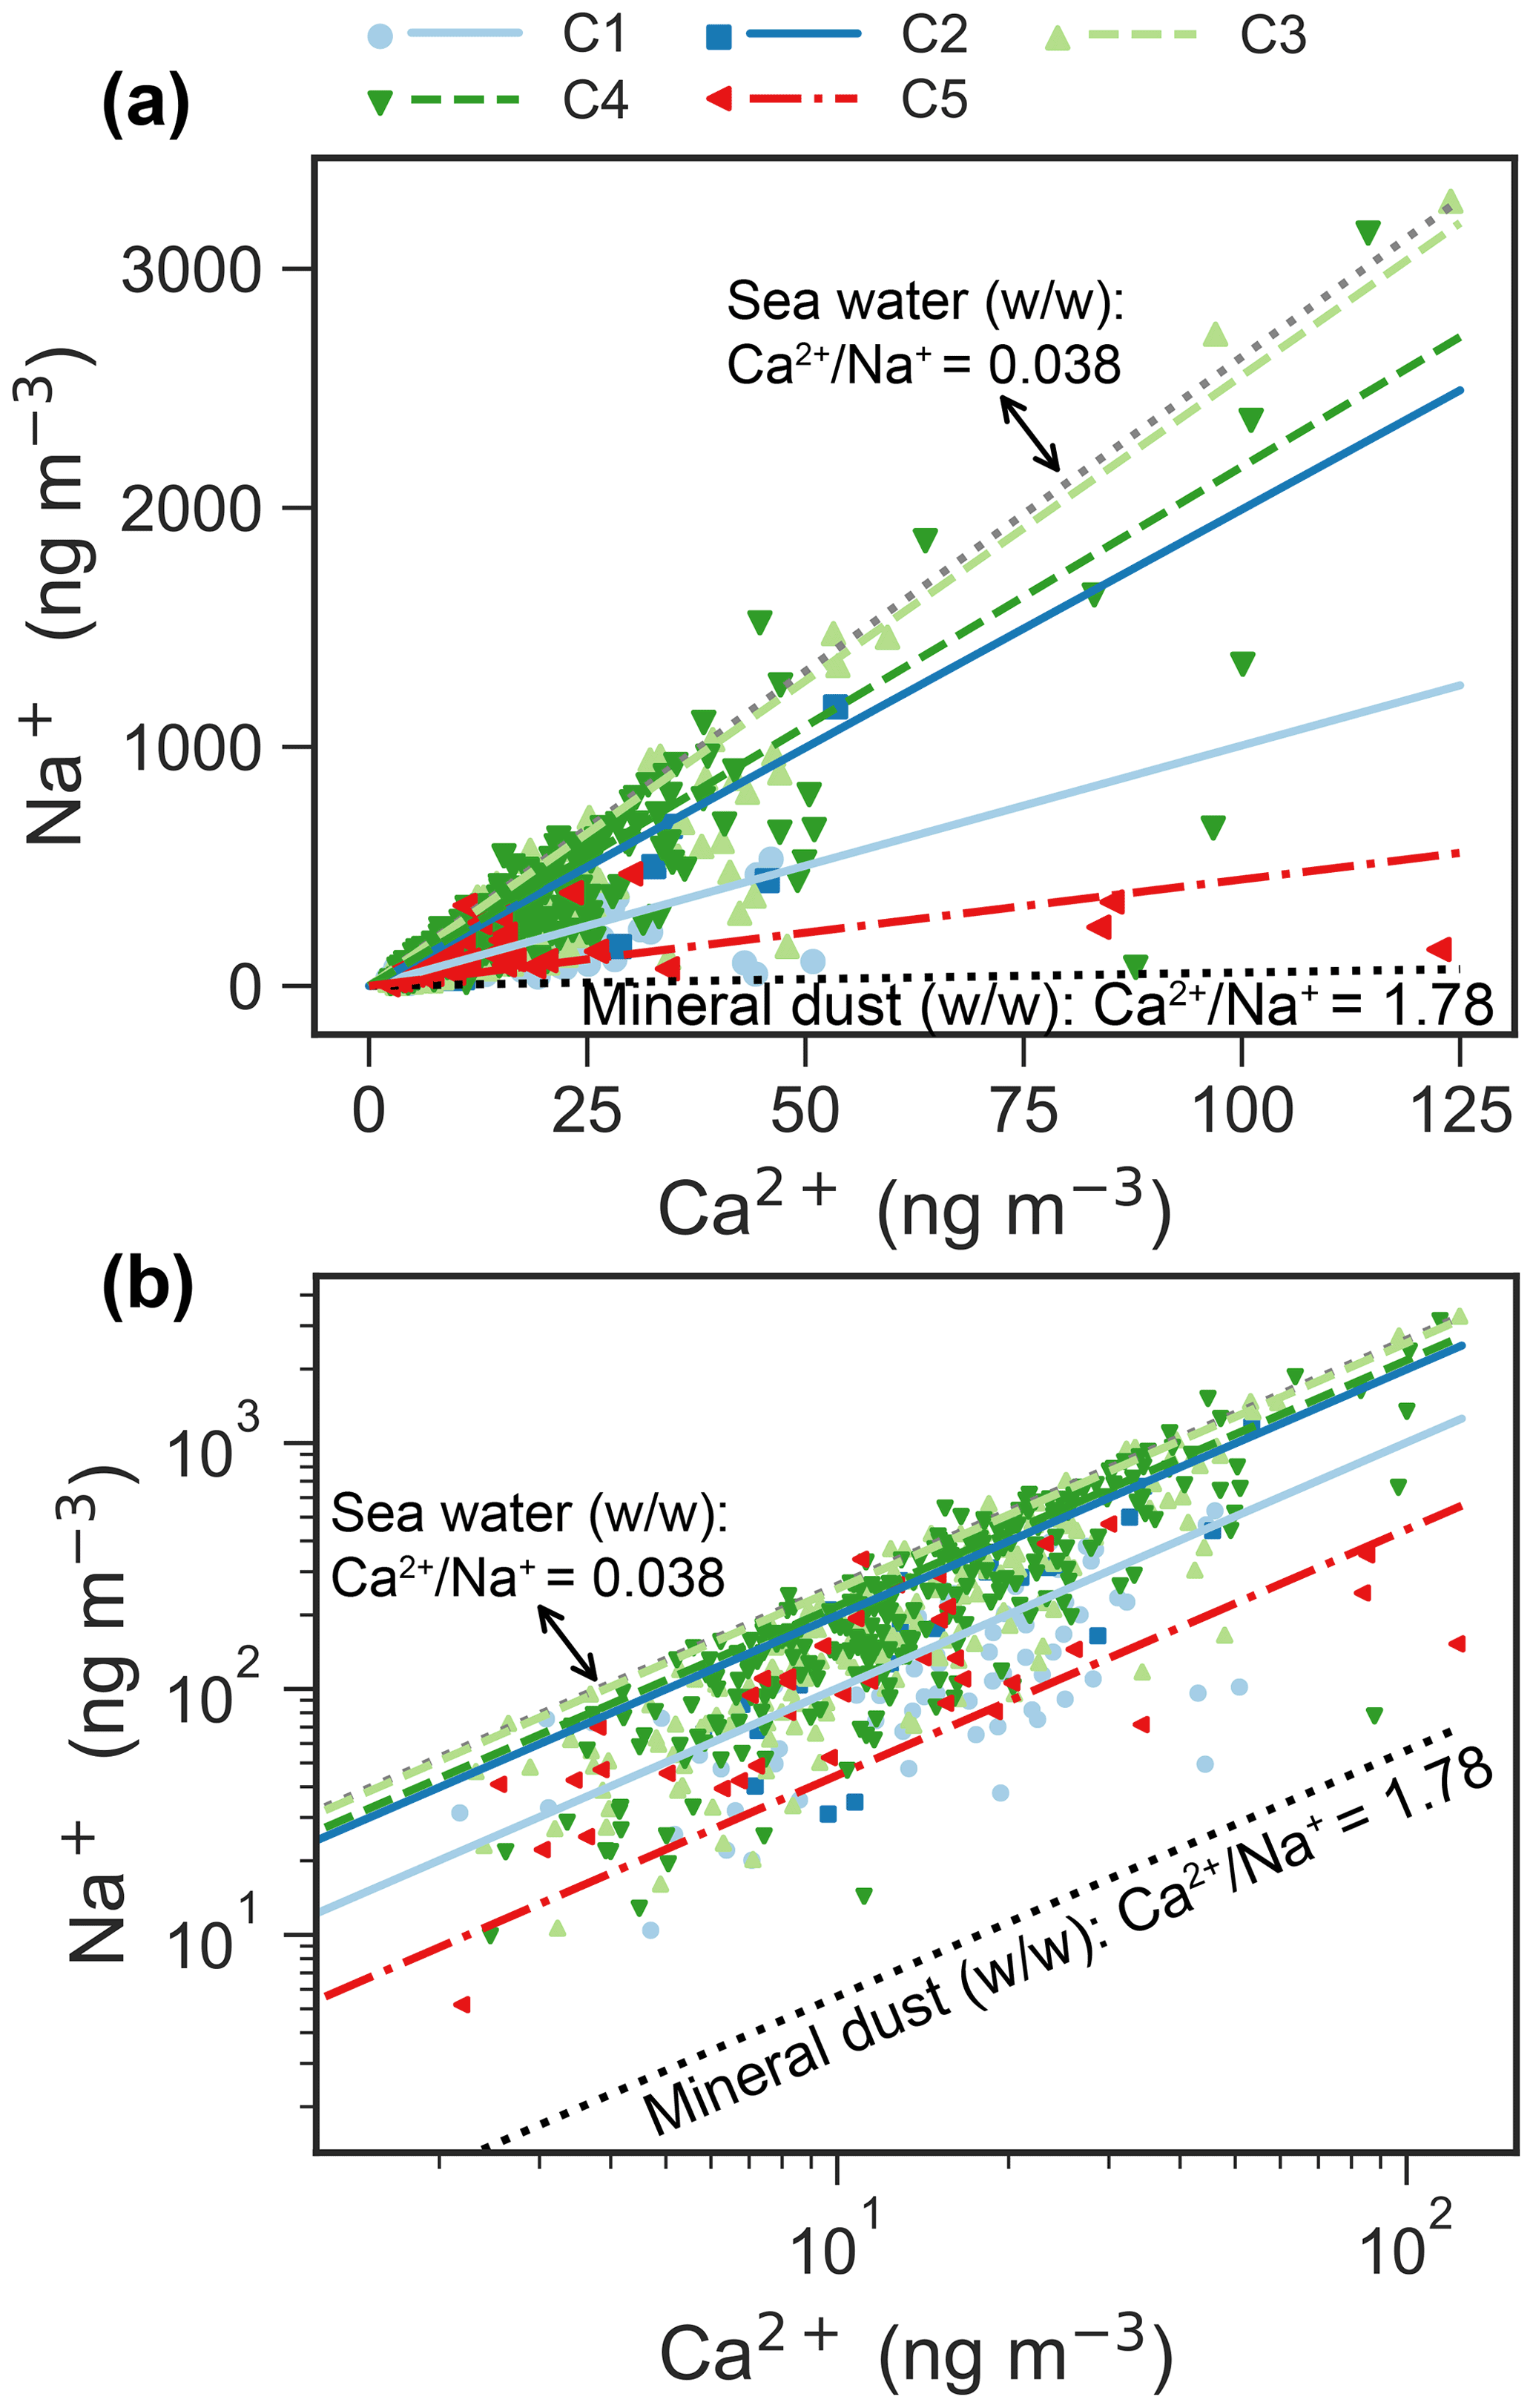
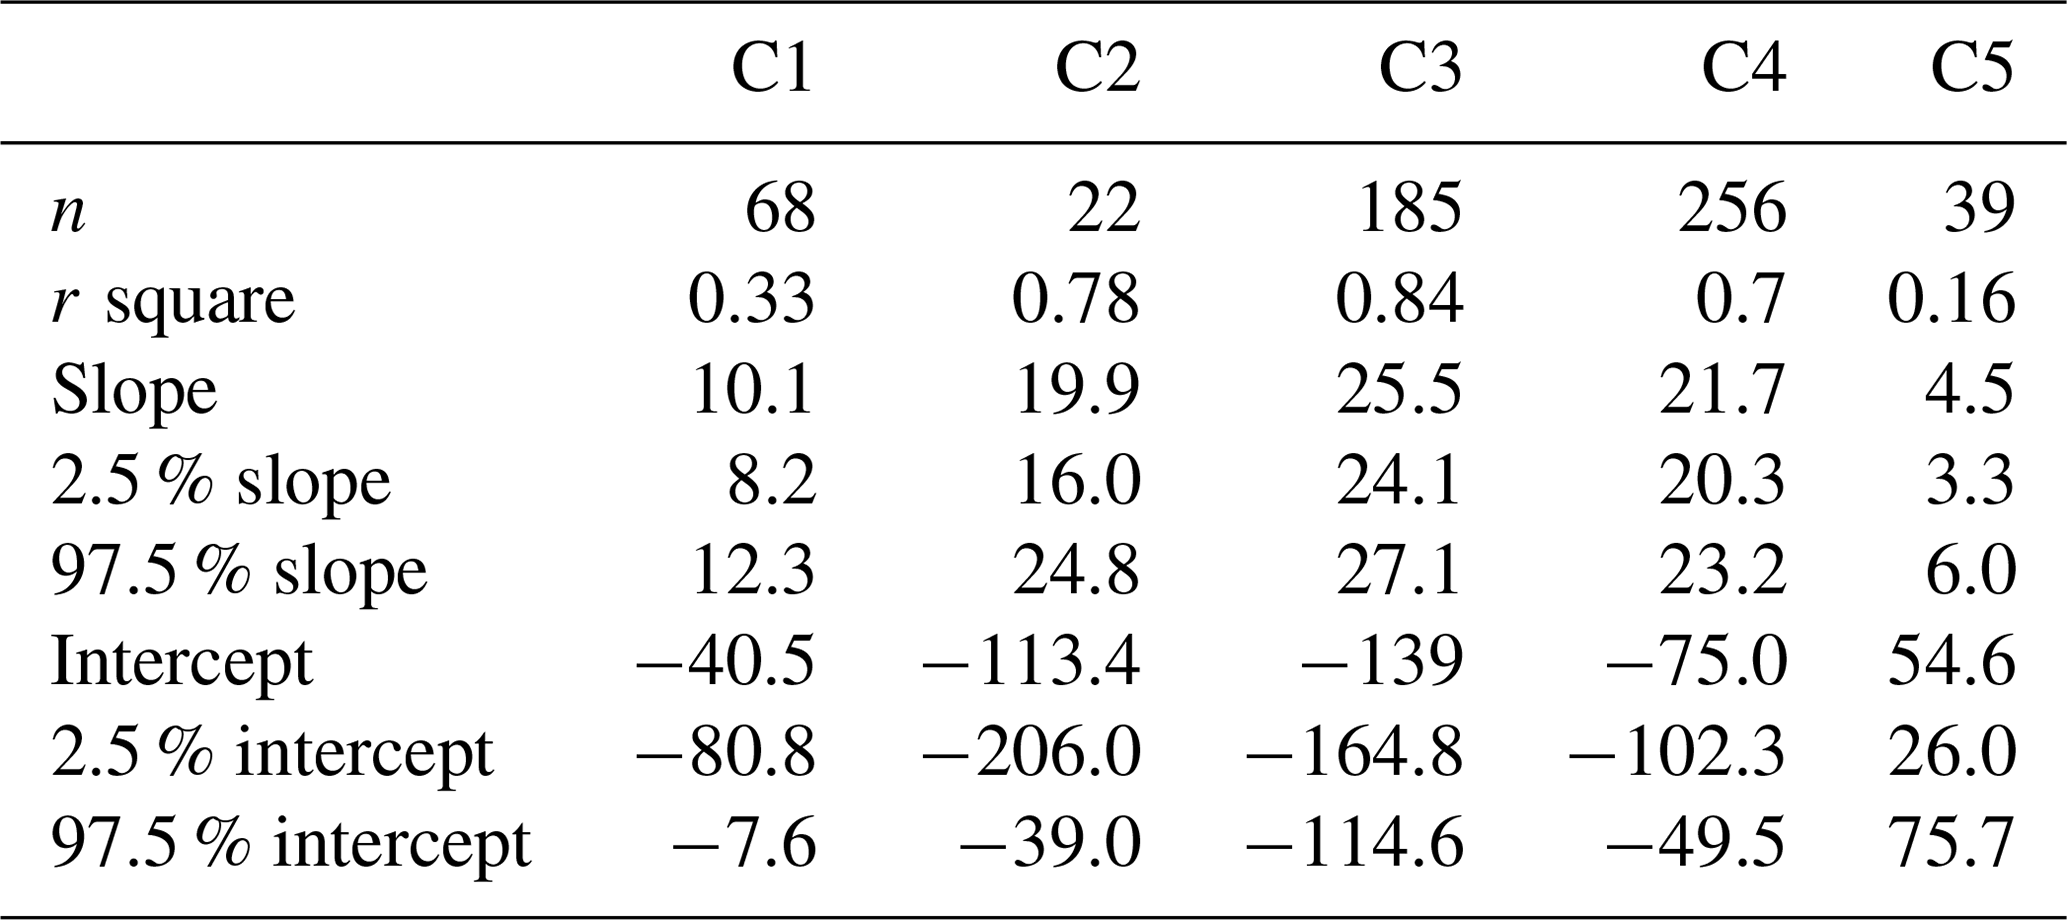
Figure 6Scatter plot (a: linear scale; b: log scale) of daily Na+ versus Ca2+ mass concentrations for each cluster. The ratios of Ca2+ Na+ from sea water and Earth's crust are denoted by dotted lines. The scatter points are usually in the ranges of ratios of sea water and Earth's crustal (Bowen, 1979). The reduced major axis (RMA) regression between Na+ and Ca2+ for each cluster is superimposed onto the figure. The parameters of the regressions are listed in Table A1.
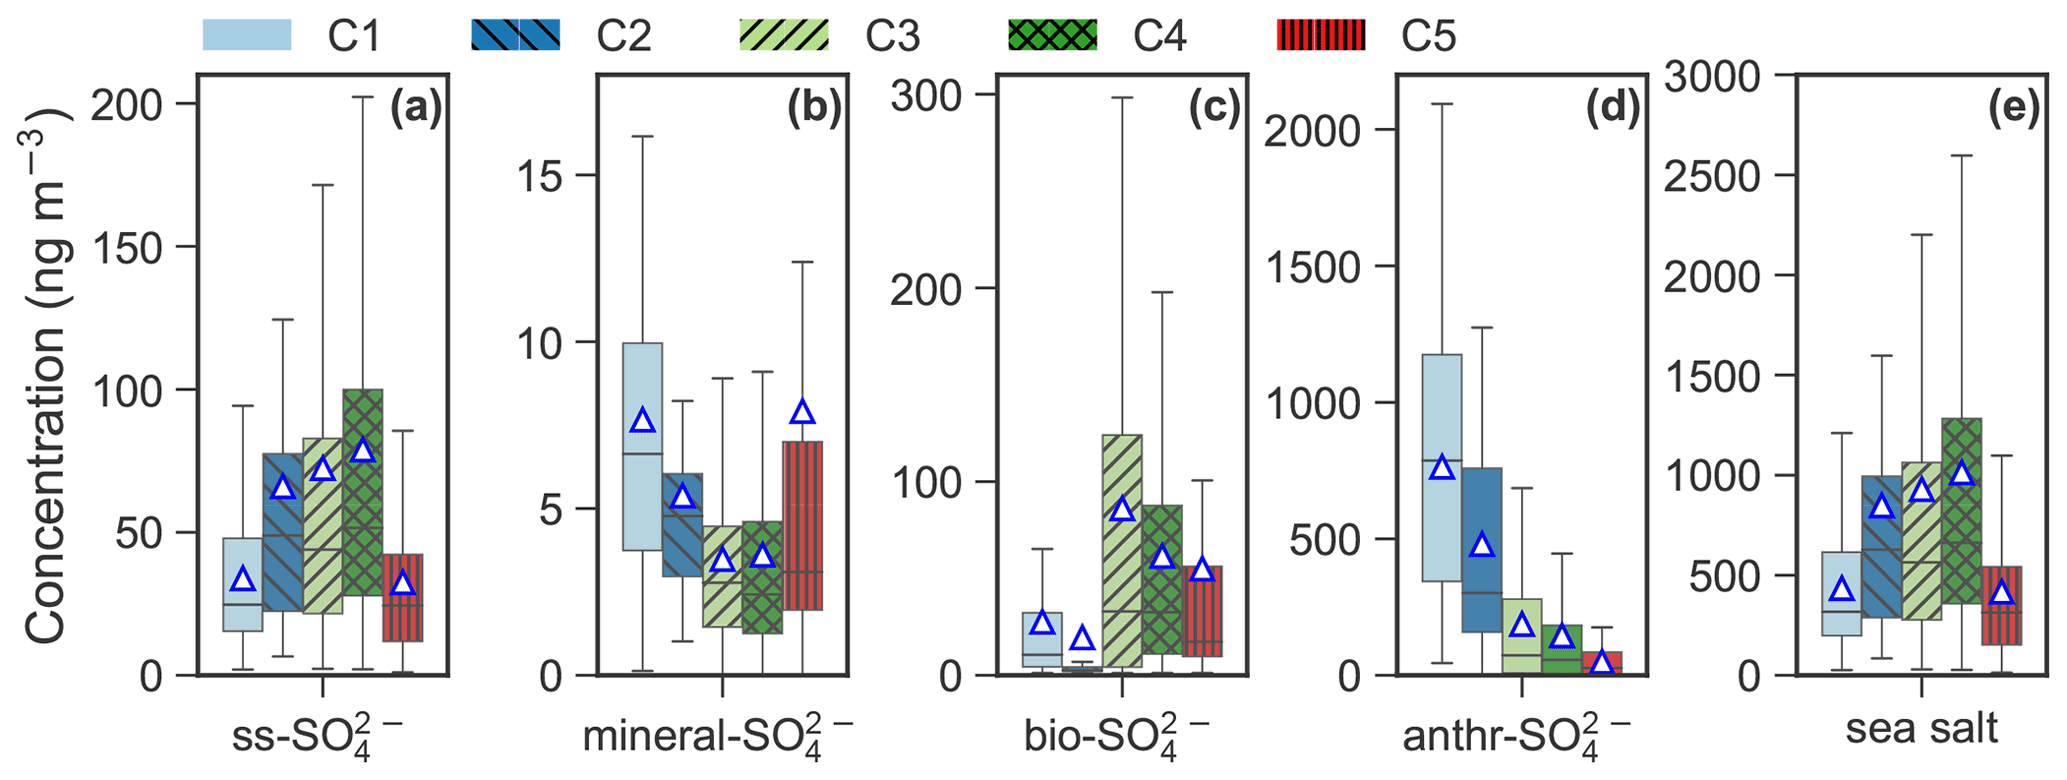
Figure 7Box plot of (a) sea salt SO (ss-SO), (b) mineral SO (mineral-SO), (c) biogenic SO (bio-SO), (d) anthropogenic SO (anthr-SO) and (e) sea salt for each cluster. The (e) sea salt aerosol is calculated by multiplying the ss-Na+ by a factor of 3.248 (Kerminen et al., 2000; Brewer, 1975). The mean values are marked as triangles.
The apportioned ss-SO, mineral-SO, bio-SO, anthr-SO and sea salt aerosol (Fig. 7) further improve our understanding of the aerosol cluster-associated sources. C2–4 were enhanced with respect to ss-SO, ranging from 66.1 ng m−3 in C2 to 78.9 ng m−3 in C4, as well as SSA (ranging from 853.4 ng m−3 in C2 to 1019.2 ng m−3 in C4). A high bio-SO fraction was observed in C3 (86.2 ng m−3) and C4 (61.6 ng m−3), whereas mineral-SO is elevated in C1 (7.7 ng m−3) and C5 (7.9 ng m−3). The anthr-SO level decreased from C1 (763.8 ng m−3) to C5 (49.7 ng m−3). Anthr-SO contributes to 34.4 % in C5 to 91.7 % in C1.
3.3 Potential source areas of the aerosol clusters
The PSCF probability map (Fig. 8) for C1 illustrates that air mass origin was mainly from northeastern Russia (lat > 60∘). Potential geographical source regions of C2 are more complex and likely distributed in northern Eurasia (lat > 60∘), the western and northern coasts of Greenland, the Norwegian Sea, the Barents Sea and the North Sea (lat > 55∘). In contrast to C1–2, several regions of elevated probability for C3 appear in open-sea and open-ocean regions (lat > 55∘), including the Norwegian Sea, the North Atlantic Ocean, the Barents Sea, the Kara Sea and Baffin Bay. C4 is likely associated with both land and snow (e.g., Greenland, northern Europe, northwestern Russia) and sea and ocean regions (e.g., the Greenland Sea, the Norwegian Sea, the North Atlantic Ocean, the Barents Sea, Baffin Bay). C5 exhibits high PSCF values near the western and northern coasts of Greenland (e.g., the Kangerlussuaq area), northern Eurasia, and northern Alaska. For the whole aerosol population, high PSCF values were broadly observed in the surrounding sea and ocean regions and occasionally observed in land and snow regions (e.g., northern Eurasia and Greenland). Note that potentially local sources can not be captured by the back-trajectory analysis.

Figure 8Potential source contribution function (PSCF) map for each cluster and all data. The GVB station is denoted as a black dot on the map.
4.1 Dominant sources of the aerosol clusters
The dominant source for each aerosol cluster that distinguishes the aerosol clusters from each other was identified based on (1) volume size distribution, (2) chemical components, (3) seasonality in occurrence of the clusters and (4) potential source maps. It is possible that each cluster does not represent a pure source but contain signals of other aerosol sources. In the following contents, sources of aerosol clusters refer to the sources that distinguish the aerosol clusters from each other.
4.1.1 C1: anthropogenic Arctic haze
The distinct peaks of C1 are typical modes of Arctic haze (Radke et al., 1984). The high occurrence of C1 in March and April is consistent with typical months of springtime Arctic haze (Abbatt et al., 2019), which have the highest absorption coefficient (Fig. 5a). C1 is characterized by the highest eBC (Fig. 5b), sulfate (total sulfate, particularly anthropogenic sulfate, Figs. 4h and 7d) and ammonium (Fig. 4f) among the five clusters. These chemical species are usually abundant in Arctic haze (Adachi et al., 2021; Law and Stohl, 2007; Quinn et al., 2007) and found to be mainly related to the accumulation mode aerosol (Tunved et al., 2013; Porter and Clarke, 1997; Radke et al., 1984). This is supported by the highest concentrations in the accumulation mode of C1 compared to the other clusters (Fig. 2b). Thus, C1 is dominated by anthropogenic Arctic haze.
4.1.2 C2: anthropogenic wintertime Arctic haze
C2 shows a similar size distribution to that of C1 (Fig. 2a) but with a much lower concentration in the accumulation mode, which is still higher than those in the other clusters (Fig. 2b). Compared to the other clusters, C2 has intermediate concentrations of eBC (Fig. 5b), sulfate (particularly anthropogenic sulfate, Fig. 7d) and ammonium (Fig. 4f). The main differences relative to C1 are a temporal trend towards colder January–March months (Fig. 2c) and an abundance of sea salt. PSCF maps also point to the Greenland coast and Northern Europe as potential source regions (Fig. 8), likely associated with industrial activities. In summary, whilst C1 is mainly associated with the typical Arctic haze with sulfate and eBC-rich aerosols (9.3 %), industrial activities may also be an important source of anthropogenic aerosols (17.6 %) in winter in the Arctic. In addition, wintertime Arctic haze at the site is more likely mixed with SSA since the occurrence fraction of C2 is above twice that of C1.
4.1.3 C3: sea spray aerosol
The average size distribution of C3 is similar to that of sea salt species (e.g., Na+, Cl− and Mg2+), which are generally dominated by a supermicrometer mode (Morawska et al., 1999; Porter and Clarke, 1997) with a peak at ∼ 4 µm in summer (Dall'Osto et al., 2006; Ricard et al., 2002; Wall et al., 1988) and a peak between 2 and 3 µm (more close to 3 µm) in the winter in the marine environment (Ricard et al., 2002). In addition, the average size distribution of C3 (Fig. 2a–b) agrees well with that of sea salt aerosol observed in Antarctic (Fan et al., 2021). High loadings of sea salt (Fig. 7e) and their associated species (Fig. 4c–e) and the average ratio of Na+ Ca2+ (Fig. 6) for C3 further indicate that C3 is associated with SSA. MSA and apportioned bio-SO are also enriched in C3 (Figs. 4k and 7c).
Arctic MSA has been reported to be abundant in late spring and in summer (Becagli et al., 2019; Sharma et al., 2019), but C3 does not show the same seasonality. This inconsistency might be due to the mixture of sea spray and biogenic sources. Ricard et al. (2002) reported that MSA has two submicrometer modes (∼ 0.3 and ∼ 0.7 µm) and one supermicrometer mode (∼ 2 µm) between 43 nm and 20 µm in summer of the marine environment. These modes are in agreement with those for wintertime sea salt aerosol (Ricard et al., 2002). The PSCF map also shows that C3 aerosols are likely coming from surrounding ocean and sea ice (Fig. 8c), where sea salt and MSA originate. In addition, the ambient temperatures for C3 exceeded their 90th-percentile value present a bimodal pattern (Fig. A5) with two modes of cold temperature at ∼ −5 ∘C and warm temperature at ∼ 5 ∘C, respectively. The wind speeds for C3 exceeded their 90th-percentile value and have bimodal distribution with peaks around 2 and 10 m s−1, which may suggest that local and long-range-transported sea spray aerosol are both important. Thus, this cluster is associated with sea spray aerosols coming from marine open ocean, likely co-existing with secondary MSA-containing biogenic aerosol.
4.1.4 C4: unidentified sea spray-related aerosol
The average size distribution of C4 is quite similar to that of C3 but with an enhancement at larger diameters and a lower average ratio of Na+ Ca2+ (Fig. 6). The main differences relative to C3 are more sea salt mass (Figs. 2a and 7e) and more source contribution from Greenland (Fig. 8d). The PSCF map for C4 is quite different compared to C3 (Fig. 8), suggesting that drivers of C4 might be different from those of C3. Specifically, potential sources of C4 are in shorter distance than C3 and are observed largely from Greenland (Fig. 8), which is mostly covered by snow throughout the year.
The ratio of Ca2+ Na+ suggests that C4 is more likely associated with SSA compared to mineral dust (Fig. 6). Note that a few samples of C4 in Fig. 6 tend to be mineral dust, especially for samples with high concentration of Ca2+. This may suggest a possible source of uplifted snow with mineral dust that was deposited on the snow surface. C4 also shows a higher relative abundance in the months of September–November (Fig. 2c). Therefore, C4 is considered unidentified sea spray aerosol, possibly short-distance sea spray, or a mixture of sea spray and blowing snow. More research is needed to better understand the potential sources of C4.
4.1.5 C5: mineral dust
C5 has distinct peaks in the coarse modes (Fig. 2a–b) pointing towards dust sources (Denjean et al., 2016; Ricard et al., 2002; Porter and Clarke, 1997). C5 occurs usually from June to October, which are the months with frequent dust emissions from Svalbard and/or high-latitude sources (Tobo et al., 2019). The ratio of Ca2+ Na+ (Fig. 6) and the mineral fraction of sulfate (Fig. 7b) for C5 further indicate a mineral dust source. According to the PSCF map (Fig. 8e), C5 very likely originated from typical dust sources at high-latitude ice-free terrain (proglacial fields or floodplains where fine glaciofluvial sediment deposits are exposed to wind), such as the western and northern coasts of Greenland (e.g., the Kangerlussuaq area), northern Eurasia, and coastal Alaska (Tobo et al., 2019; Groot Zwaaftink et al., 2016; Bullard et al., 2016; Crusius et al., 2011). Note that C5 has one similar mode (∼ 3–4 µm diameter) to C3–4, which might suggest that C5 is a mixture of mineral dust and sea salt. The considerable fractions of air parcels spent over land and sea or sea ice for C5 (Fig. A4) further indicate the possibility of mixture of mineral dust and sea salt, which has been reported by Geng et al. (2010).
4.2 Drivers of coarse-mode aerosols in the Arctic
In the present study, Arctic aerosol is characterized by prevalent Arctic haze between winter and late spring, biogenic aerosol and mineral dust during warm seasons and sea spray aerosol throughout all seasons. The seasonal cycle in the Arctic aerosol is driven by many aspects, such as the annual cycle in Arctic sea ice, temperature, radiation, atmospheric oxidants, cloud properties, and seasonally varying transport and removal mechanisms (Abbatt et al., 2019; Willis et al., 2018). In this study, potential drivers of the coarse-mode anthropogenic aerosol and natural aerosol are discussed in Sect. 4.2.1 and 4.2.2.
4.2.1 Coarse-mode anthropogenic aerosol
High occurrences of C1–2 in winter and early spring suggest that anthropogenic sources are a predominant contributor to Arctic haze, particularly for accumulation-mode aerosol (Fig. 2a–b). According to the chemical composition of C1-2, Arctic haze contains a large fraction of eBC (Fig. 5b), sulfate (particularly anthropogenic sulfate, Figs. 4h and 7d), ammonium (Fig. 4f) and oxalate (Fig. 4j), implying that both primary and secondary sources (including secondary inorganic and organic aerosols) contributed to the Arctic haze. On average, the contributions of anthropogenic sources to total sulfate were 91.7 % for C1 and 84.1 % for C2, which are almost twice as high as those for the other clusters (ranging from 34.2 % for C5 to 52.7 % for C3) (Fig. 7). According to the PSCF maps of C1–2 (Fig. 8a–b), long-range transport from northern Eurasia to Arctic regions might be mainly responsible for the anthropogenic aerosol in winter and spring. High contributions from air parcels above the mixing layer for C1–2 also support the critical role of long-range transport (Fig. A4a). It is suggested that meteorological conditions during the Arctic haze period are conducive to long-range transport from northern Eurasia to the Arctic (Willis et al., 2018; Law and Stohl, 2007). Furthermore, the polar front could extend to about 40∘ N in winter to include industrial emissions that can be transported into the High Arctic, thus leading to the presence of industrial sources in the wintertime Arctic aerosol (Law and Stohl, 2007).
However, C2 contains a sea salt fraction (Figs. 6–7). Prather et al. (2013) showed that submicrometer sea spray aerosol consists of two externally mixed particle types, sea salt mixed with organic carbon and organic aerosol without chloride, based on transmission electron microscopy with energy-dispersive X-ray analysis. Yu et al. (2019) found that sulfate and organic matter are often internally mixed based on individual particles (100 nm to 2 µm) collected in the Svalbard Archipelago in summer. Thus, the enrichment of eBC, sulfate, organic aerosol and sea salt in C2 is likely due to the chemical mixing state of the particle size ranges, leading to a mixed anthropogenic and natural aerosol, which is a transition mode driven by both Arctic haze and sea spray.
4.2.2 Coarse-mode natural aerosol
The drivers of natural aerosol in the Arctic are even more complex than those of anthropogenic aerosol, mainly because of various natural sources. Our analysis identified three main natural sources, including open ocean sea spray aerosol (Figs. 2a and 6 and 7e and 8c), unidentified source of sea-spray-related aerosol (Figs. 2a, 6, 7e and 8d) and mineral dust (Figs. 2a, 6, 7 and 8e). These natural aerosols dominated the Arctic aerosol population with a fraction of > 50 % throughout all seasons, and with a much higher fractions of > 80 % in summer and autumn than those during the Arctic haze period (Fig. 2b). Warm seasons facilitate the production of natural aerosols in many ways, such as enhanced marine primary production (Becagli et al., 2016), biogenic new particle formation and growth (Lange et al., 2019, 2018; Dall'Osto et al., 2018, 2017) as well as high-latitude dust source emissions (Tobo et al., 2019; Groot Zwaaftink et al., 2016; Bullard et al., 2016). In addition, high fractions of air parcels spent over land and open ocean were observed in warm seasons (Fig. A4b), which could facilitate generation of mineral dust and sea spray aerosol.
Notably, C3–4 comprised the largest fraction of the aerosol population throughout all seasons (Fig. 2b), suggesting that SSA is ubiquitous in the High Arctic regardless of season. The production of sea salt has been attributed to various mechanical processes, such as wind-driven sea spray and bubble bursting from open ocean (Quinn et al., 2015), leads (Kirpes et al., 2019; May et al., 2016), or wind-blown snow (Huang and Jaeglé, 2017). The prevalence of C3 in all seasons and the closest ratio of Ca2+ Na+ to sea water (Fig. 6) provide compelling evidence that it is driven by open-ocean emission. More studies are needed to elucidate the underlying drivers of the occurrence of C3 throughout all seasons.
MSA-containing biogenic aerosol was observed mainly in C3–4 (Figs. 4k and 7c). Lin et al. (2012) found that MSA constitutes a major fraction of total aerosol sulfate over the remote ocean by means of isotope analysis. However, their analysis was based on submicrometer-mode (< 1 µm) aerosol. Our study suggests that a fraction of MSA could occur in the coarse mode and is not entirely in the submicrometer fraction. The fractions of biogenic sulfate in total sulfate for C3 (∼ 24.6 %) and C4 (∼ 21.2 %) were much higher than those for anthropogenic Arctic haze (i.e., ∼ 3.3 % for C1 and ∼ 3.4 % for C2) but were lower than that of anthropogenic sulfate (i.e., 53.7 % for C3 and 50.3 % for C4). The contributions of biogenic emissions to sulfate for C3–4 are consistent with Udisti et al. (2016), who reported that biogenic emissions contributed ∼ 35 % to sulfate in summertime Arctic, mainly because C3–4 predominated (> 80 %) summertime Arctic aerosol. However, the biogenic sulfate fraction for C3 is less than half of that from anthropogenic sulfate. It means that long-range-transported anthropogenic pollution still appears to be the largest source of sulfate in the Arctic, even for MSA-containing biogenic aerosol type.
Biogenic aerosol in the Arctic is likely to be mixed with SSA, which is consistent with Prather et al. (2013), who reported that supermicrometer marine biogenic aerosol is mixed with SSA based on the single-particle chemical mixing state. The seasonal variation in biogenic aerosol in the Arctic appears to be related to sea ice retreat, but the interannual trend in MSA concentration is likely to be driven by the extent of the ice-free marginal zone (Becagli et al., 2019, 2016).
Mineral dust was identified as another natural aerosol mainly in C5. Mineral dust aerosol appears to originate from dust sources at high-latitude ice-free terrain (Fig. 8e) in warm seasons (Fig. A5d). Unfortunately, geological minerals were not reconstructed in the present study due to lack of measurements of mineral elements. Measurements of metal elements at the station are urgently needed in future studies to better understand the mineral dust in the High Arctic (Becagli et al., 2020; Moroni et al., 2015). Furthermore, mineral dust is often mixed with sea salt in C5, which makes it difficult to quantify absolute contributions from mineral dust to C5.
In summary, we have reported relatively long-term (2015–2019) measurements of aerosol aerodynamic volume size distributions up to 20 µm in the High Arctic for the first time. Our results provide insights into supermicrometer aerosol properties and their potential sources around at an Arctic site in Svalbard, particularly sea spray aerosol, MSA-containing biogenic aerosol and mineral dust. The study elucidated five main aerosol volume size distributions and their natural and anthropogenic sources in the High Arctic, which may help us to better understand the complex interactions and feedbacks between aerosol, cloud, radiation, and air–sea dynamic exchange and biota (Abbatt et al., 2019; Willis et al., 2018; Browse et al., 2014). Our study shows that about two-thirds of the coarse-mode aerosols are related to two sea-spray-related aerosol clusters, indicating that sea spray aerosol – commonly assumed to be a known source from open ocean – may be more complex in the Arctic environment. Further studies – both ambient and laboratory-based – are strongly needed to understand sea spray sources. Measurements of metal elements up to coarse mode are encouraged in future studies to better understand local and transported mineral dust and anthropogenic pollution (e.g., industrial activity and shipping emissions) in the High Arctic. Further measurements in the winter season are needed to fill the gaps in the present study. In addition, a more in-depth observation (such as single-particle composition) and analysis is needed to better quantify local sources, which might have been overlooked here because local sources are not captured by the backward trajectory analyses. More advanced receptor modeling and observational data, such as insoluble particles (Tobo et al., 2019; Geng et al., 2010) are needed to address the ubiquitous mixing sources found in the k-means clusters.

Figure A1Monthly average aerosol number size distribution from 2015 to 2019. There are missing data in some months but good data coverage from March to June. No data are available in December.
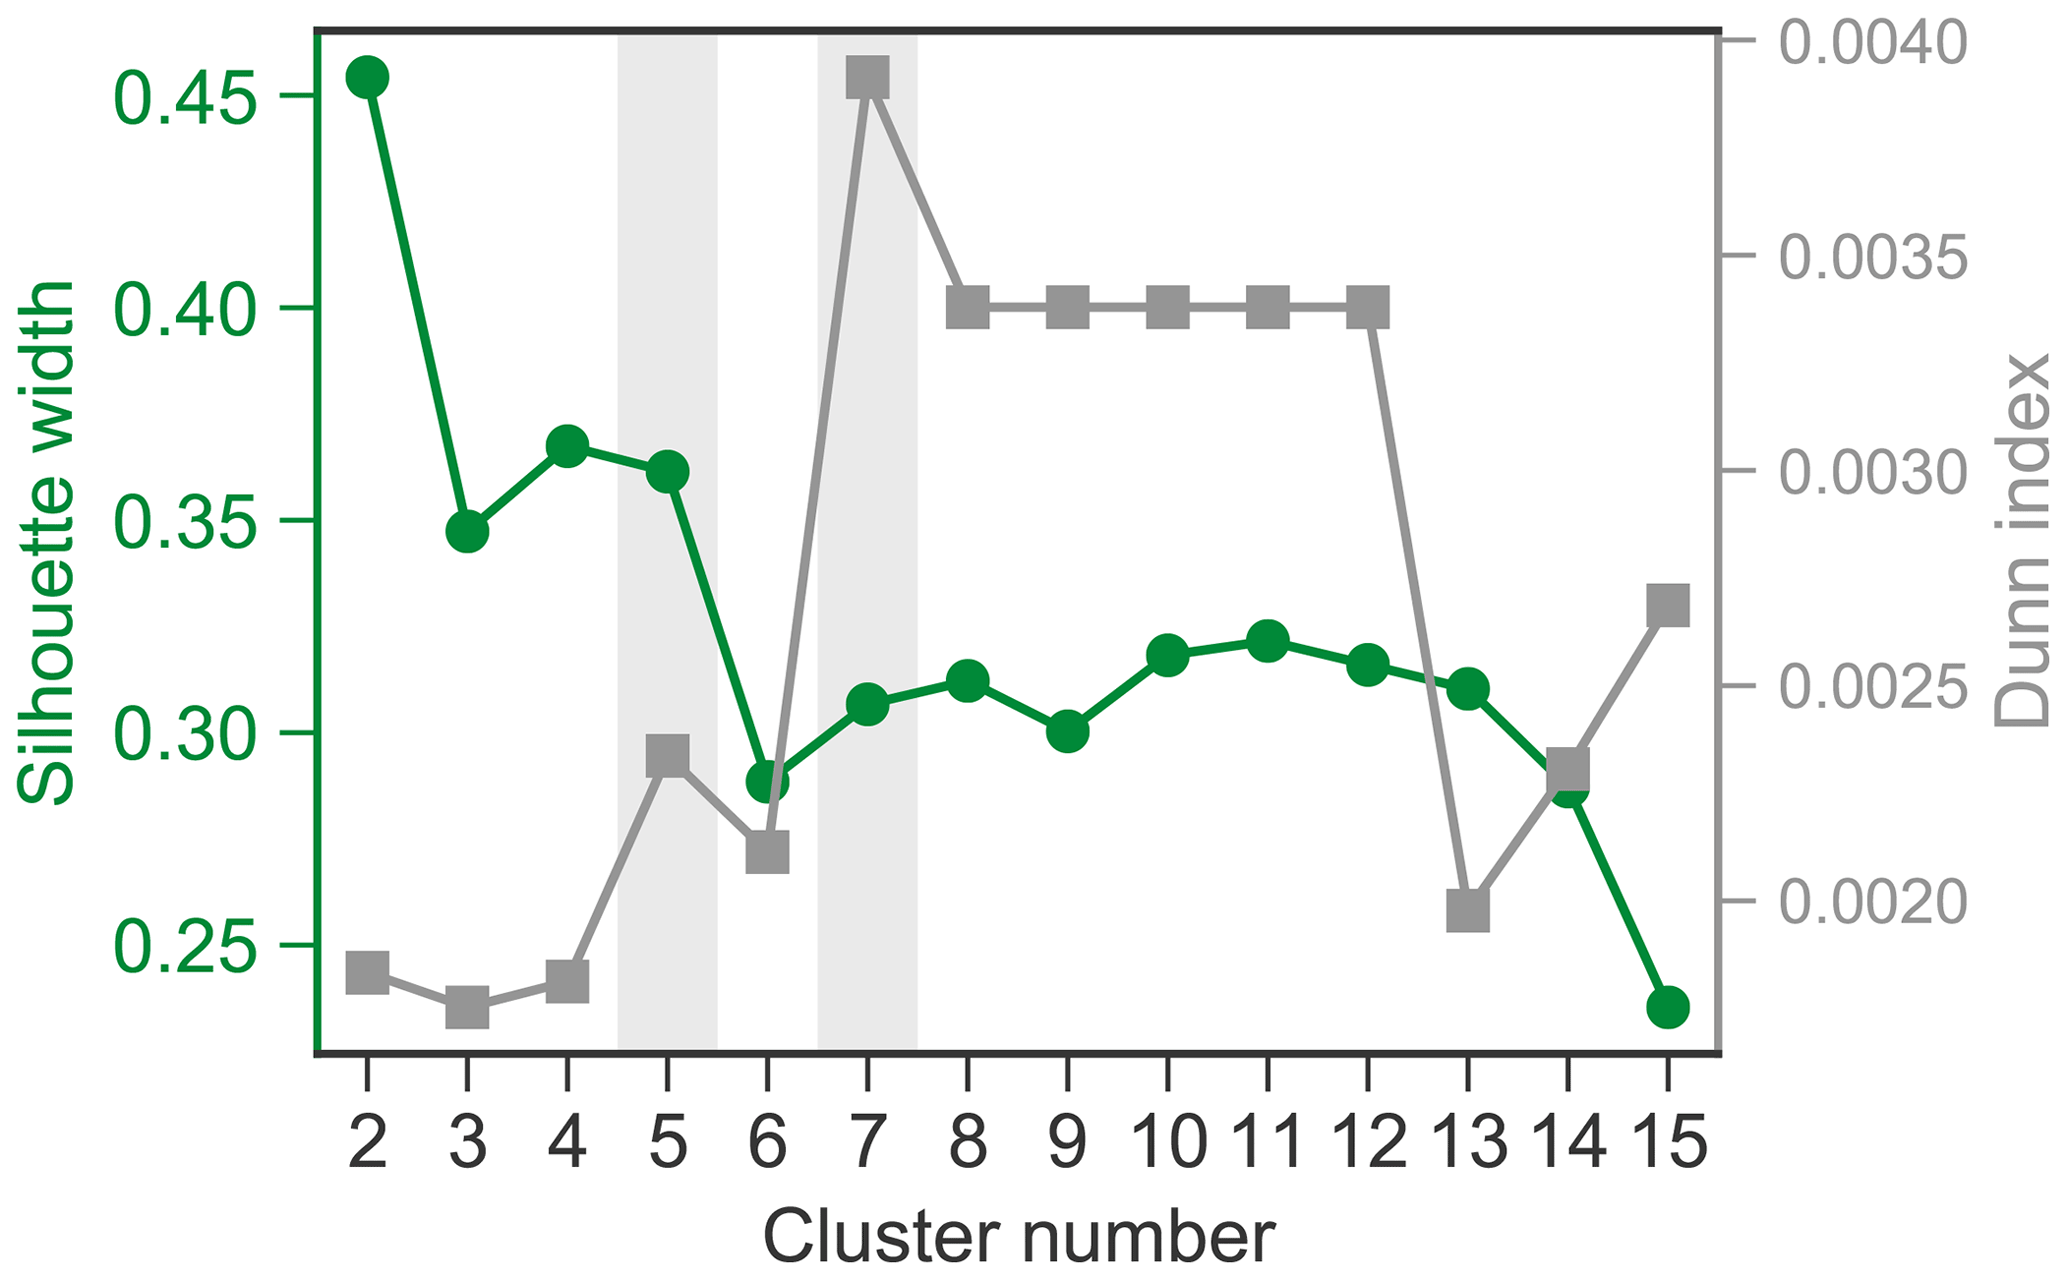

Figure A3Average aerosol size distribution of the seven clusters using a seven-cluster solution.

Figure A4(a) Relative contribution (%) of the accumulated time for back-trajectory air parcels spent over sea, sea ice, snow, land and above the mixing layer (ML) for each month and each cluster. (b) Relative contribution without considering back trajectories above the mixing layer.

Figure A5Probability density distribution of the meteorological conditions for aerosol volume concentrations that exceeded their 90th-percentile values within each cluster.
Table A1Parameters for reduced major axis (RMA) regression between Na+ and Ca2+ for the five clusters
The APS data can be accessed from https://doi.org/10.5281/zenodo.3961473 (Traversi et al., 2020). The absorption coefficient data are available upon request from Gilardoni et al. (2020). Data supporting this publication can be accessed upon request from the corresponding authors.
MDO conceived the study and discussed the analysis and results. ZS supervised the project, discussed the analysis and results, and funded this study. CS performed data analysis, data visualization, and data interpretation and wrote the original draft. DCSB provided the raw R code for k-means clustering. AL, MM, RT, SB, SG and SV carried out the field measurements at the GVB station and chemical analysis of the offline samples and provided feedback on the draft. JS, KEY, MDO, ZS, JB, AGK and RMH participated in editing the manuscript. All the authors commented on the manuscript and approved the submission.
The authors declare that they have no conflict of interest.
Publisher's note: Copernicus Publications remains neutral with regard to jurisdictional claims in published maps and institutional affiliations.
The authors acknowledge the staff of the Arctic Station Dirigibile Italia of the National Research Council of Italy for their support in measurements at the GVB station. Julia Schmale holds the Ingvar Kamprad Chair for Extreme Environment Research. The authors acknowledge the NOAA Air Resources Laboratory (ARL) for providing the HYSPLIT model used to analyze the back trajectories.
This research has been supported by the Natural Environment Research Council (grant no. NE/S00579X/1).
We acknowledge support of the publication fee by the CSIC Open Access Publication Support Initiative through its Unit of Information Resources for Research (URICI).
This paper was edited by Drew Gentner and reviewed by two anonymous referees.
Abbatt, J. P. D., Leaitch, W. R., Aliabadi, A. A., Bertram, A. K., Blanchet, J.-P., Boivin-Rioux, A., Bozem, H., Burkart, J., Chang, R. Y. W., Charette, J., Chaubey, J. P., Christensen, R. J., Cirisan, A., Collins, D. B., Croft, B., Dionne, J., Evans, G. J., Fletcher, C. G., Galí, M., Ghahremaninezhad, R., Girard, E., Gong, W., Gosselin, M., Gourdal, M., Hanna, S. J., Hayashida, H., Herber, A. B., Hesaraki, S., Hoor, P., Huang, L., Hussherr, R., Irish, V. E., Keita, S. A., Kodros, J. K., Köllner, F., Kolonjari, F., Kunkel, D., Ladino, L. A., Law, K., Levasseur, M., Libois, Q., Liggio, J., Lizotte, M., Macdonald, K. M., Mahmood, R., Martin, R. V., Mason, R. H., Miller, L. A., Moravek, A., Mortenson, E., Mungall, E. L., Murphy, J. G., Namazi, M., Norman, A.-L., O'Neill, N. T., Pierce, J. R., Russell, L. M., Schneider, J., Schulz, H., Sharma, S., Si, M., Staebler, R. M., Steiner, N. S., Thomas, J. L., von Salzen, K., Wentzell, J. J. B., Willis, M. D., Wentworth, G. R., Xu, J.-W., and Yakobi-Hancock, J. D.: Overview paper: New insights into aerosol and climate in the Arctic, Atmos. Chem. Phys., 19, 2527–2560, https://doi.org/10.5194/acp-19-2527-2019, 2019. a, b, c, d, e
Adachi, K., Oshima, N., Ohata, S., Yoshida, A., Moteki, N., and Koike, M.: Compositions and mixing states of aerosol particles by aircraft observations in the Arctic springtime, 2018, Atmos. Chem. Phys., 21, 3607–3626, https://doi.org/10.5194/acp-21-3607-2021, 2021. a
Asmi, E., Kondratyev, V., Brus, D., Laurila, T., Lihavainen, H., Backman, J., Vakkari, V., Aurela, M., Hatakka, J., Viisanen, Y., Uttal, T., Ivakhov, V., and Makshtas, A.: Aerosol size distribution seasonal characteristics measured in Tiksi, Russian Arctic, Atmos. Chem. Phys., 16, 1271–1287, https://doi.org/10.5194/acp-16-1271-2016, 2016. a
Bachelder, J., Cadieux, M., Liu-Kang, C., Lambert, P., Filoche, A., Galhardi, J. A., Hadioui, M., Chaput, A., Bastien-Thibault, M.-P., Wilkinson, K. J., King, J., and Hayes, P. L.: Chemical and microphysical properties of wind-blown dust near an actively retreating glacier in Yukon, Canada, Aerosol Sci. Tech., 54, 2–20, https://doi.org/10.1080/02786826.2019.1676394, 2020. a, b
Baldo, C., Formenti, P., Nowak, S., Chevaillier, S., Cazaunau, M., Pangui, E., Di Biagio, C., Doussin, J.-F., Ignatyev, K., Dagsson-Waldhauserova, P., Arnalds, O., MacKenzie, A. R., and Shi, Z.: Distinct chemical and mineralogical composition of Icelandic dust compared to northern African and Asian dust, Atmos. Chem. Phys., 20, 13521–13539, https://doi.org/10.5194/acp-20-13521-2020, 2020. a, b
Baskaran, M. and Shaw, E. G.: Residence time of arctic haze aerosols using the concentrations and activity ratios of 210Po, 210Pb and 7Be, J. Aerosol Sci., 32, 443–452, https://doi.org/10.1016/S0021-8502(00)00093-8, 2001. a
Becagli, S., Lazzara, L., Marchese, C., Dayan, U., Ascanius, S., Cacciani, M., Caiazzo, L., Di Biagio, C., Di Iorio, T., di Sarra, A., Eriksen, P., Fani, F., Giardi, F., Meloni, D., Muscari, G., Pace, G., Severi, M., Traversi, R., and Udisti, R.: Relationships linking primary production, sea ice melting, and biogenic aerosol in the Arctic, Atmos. Environ., 136, 1–15, https://doi.org/10.1016/j.atmosenv.2016.04.002, 2016. a, b
Becagli, S., Amore, A., Caiazzo, L., Iorio, T. D., Sarra, A. d., Lazzara, L., Marchese, C., Meloni, D., Mori, G., Muscari, G., Nuccio, C., Pace, G., Severi, M., and Traversi, R.: Biogenic Aerosol in the Artic from Eight Years of MSA Data from Ny Ålesund (Svalbard Islands) and Thule (Greenland), Atmosphere, 10, 349, https://doi.org/10.3390/atmos10070349, 2019. a, b
Becagli, S., Caiazzo, L., Di Iorio, T., di Sarra, A., Meloni, D., Muscari, G., Pace, G., Severi, M., and Traversi, R.: New insights on metals in the Arctic aerosol in a climate changing world, Sci. Total Environ., 741, 140511, https://doi.org/10.1016/j.scitotenv.2020.140511, 2020. a
Beddows, D. C. S., Dall'Osto, M., and Harrison, R. M.: Cluster Analysis of Rural, Urban, and Curbside Atmospheric Particle Size Data, Environ. Sci. Technol., 43, 4694–4700, https://doi.org/10.1021/es803121t, 2009. a, b
Beddows, D. C. S., Dall'Osto, M., Harrison, R. M., Kulmala, M., Asmi, A., Wiedensohler, A., Laj, P., Fjaeraa, A. M., Sellegri, K., Birmili, W., Bukowiecki, N., Weingartner, E., Baltensperger, U., Zdimal, V., Zikova, N., Putaud, J.-P., Marinoni, A., Tunved, P., Hansson, H.-C., Fiebig, M., Kivekäs, N., Swietlicki, E., Lihavainen, H., Asmi, E., Ulevicius, V., Aalto, P. P., Mihalopoulos, N., Kalivitis, N., Kalapov, I., Kiss, G., de Leeuw, G., Henzing, B., O'Dowd, C., Jennings, S. G., Flentje, H., Meinhardt, F., Ries, L., Denier van der Gon, H. A. C., and Visschedijk, A. J. H.: Variations in tropospheric submicron particle size distributions across the European continent 2008–2009, Atmos. Chem. Phys., 14, 4327–4348, https://doi.org/10.5194/acp-14-4327-2014, 2014. a, b, c
Bigler, M., Röthlisberger, R., Lambert, F., Stocker, T. F., and Wagenbach, D.: Aerosol deposited in East Antarctica over the last glacial cycle: Detailed apportionment of continental and sea-salt contributions, J. Geophys. Res.-Atmos., 111, D08205, https://doi.org/10.1029/2005JD006469, 2006. a
Bowen, H. J. M.: Environmental chemistry of the elements, Academic Press, London, UK, 333 pp., 1979. a, b, c
Brewer, G.: Minor elements in seawater, Chemical oceanography, 1, 415–496, 1975. a
Browse, J., Carslaw, K. S., Mann, G. W., Birch, C. E., Arnold, S. R., and Leck, C.: The complex response of Arctic aerosol to sea-ice retreat, Atmos. Chem. Phys., 14, 7543–7557, https://doi.org/10.5194/acp-14-7543-2014, 2014. a
Bullard, J. E., Baddock, M., Bradwell, T., Crusius, J., Darlington, E., Gaiero, D., Gassó, S., Gisladottir, G., Hodgkins, R., McCulloch, R., McKenna-Neuman, C., Mockford, T., Stewart, H., and Thorsteinsson, T.: High-latitude dust in the Earth system, Rev. Geophys., 54, 447–485, https://doi.org/10.1002/2016RG000518, 2016. a, b, c, d
Carslaw, D. C. and Ropkins, K.: openair – An R package for air quality data analysis, Environ. Model. Softw., 27–28, 52–61, https://doi.org/10.1016/j.envsoft.2011.09.008, 2012. a
Chi, J. W., Li, W. J., Zhang, D. Z., Zhang, J. C., Lin, Y. T., Shen, X. J., Sun, J. Y., Chen, J. M., Zhang, X. Y., Zhang, Y. M., and Wang, W. X.: Sea salt aerosols as a reactive surface for inorganic and organic acidic gases in the Arctic troposphere, Atmos. Chem. Phys., 15, 11341–11353, https://doi.org/10.5194/acp-15-11341-2015, 2015. a
Collins, D. B., Ault, A. P., Moffet, R. C., Ruppel, M. J., Cuadra-Rodriguez, L. A., Guasco, T. L., Corrigan, C. E., Pedler, B. E., Azam, F., Aluwihare, L. I., Bertram, T. H., Roberts, G. C., Grassian, V. H., and Prather, K. A.: Impact of marine biogeochemistry on the chemical mixing state and cloud forming ability of nascent sea spray aerosol, J. Geophys. Res.-Atmos., 118, 8553–8565, https://doi.org/10.1002/jgrd.50598, 2013. a
Crusius, J., Schroth, A. W., Gassó, S., Moy, C. M., Levy, R. C., and Gatica, M.: Glacial flour dust storms in the Gulf of Alaska: Hydrologic and meteorological controls and their importance as a source of bioavailable iron, Geophys. Res. Lett., 38, L06602, https://doi.org/10.1029/2010GL046573, 2011. a
Dall'Osto, M., Harrison, R. M., Beddows, D. C. S., Freney, E. J., Heal, M. R., and Donovan, R. J.: Single-Particle Detection Efficiencies of Aerosol Time-of-Flight Mass Spectrometry during the North Atlantic Marine Boundary Layer Experiment, Environ. Sci. Technol., 40, 5029–5035, https://doi.org/10.1021/es050951i, 2006. a
Dall'Osto, M., Beddows, D. C. S., Tunved, P., Krejci, R., Ström, J., Hansson, H.-C., Yoon, Y. J., Park, K.-T., Becagli, S., Udisti, R., Onasch, T., O'Dowd, C. D., Simó, R., and Harrison, R. M.: Arctic sea ice melt leads to atmospheric new particle formation, Sci. Rep., 7, 1–10, https://doi.org/10.1038/s41598-017-03328-1, 2017. a
Dall'Osto, M., Geels, C., Beddows, D. C. S., Boertmann, D., Lange, R., Nøjgaard, J. K., Harrison, R. M., Simo, R., Skov, H., and Massling, A.: Regions of open water and melting sea ice drive new particle formation in North East Greenland, Sci. Rep., 8, 1–10, https://doi.org/10.1038/s41598-018-24426-8, 2018. a
Dall'Osto, M., Beddows, D. C. S., Tunved, P., Harrison, R. M., Lupi, A., Vitale, V., Becagli, S., Traversi, R., Park, K.-T., Yoon, Y. J., Massling, A., Skov, H., Lange, R., Strom, J., and Krejci, R.: Simultaneous measurements of aerosol size distributions at three sites in the European high Arctic, Atmos. Chem. Phys., 19, 7377–7395, https://doi.org/10.5194/acp-19-7377-2019, 2019. a, b, c, d
Denjean, C., Cassola, F., Mazzino, A., Triquet, S., Chevaillier, S., Grand, N., Bourrianne, T., Momboisse, G., Sellegri, K., Schwarzenbock, A., Freney, E., Mallet, M., and Formenti, P.: Size distribution and optical properties of mineral dust aerosols transported in the western Mediterranean, Atmos. Chem. Phys., 16, 1081–1104, https://doi.org/10.5194/acp-16-1081-2016, 2016. a
Fan, S., Gao, Y., Sherrell, R. M., Yu, S., and Bu, K.: Concentrations, particle-size distributions, and dry deposition fluxes of aerosol trace elements over the Antarctic Peninsula in austral summer, Atmos. Chem. Phys., 21, 2105–2124, https://doi.org/10.5194/acp-21-2105-2021, 2021. a
Feng, L., Shen, H., Zhu, Y., Gao, H., and Yao, X.: Insight into generation and evolution of sea-salt aerosols from field measurements in diversified marine and coastal atmospheres, Sci. Rep., 7, 41260, https://doi.org/10.1038/srep41260, 2017. a
Fitzgerald, J. W.: Marine aerosols: A review, Atmos. Environ. A.-Gen., 25, 533–545, https://doi.org/10.1016/0960-1686(91)90050-H, 1991. a
Freud, E., Krejci, R., Tunved, P., Leaitch, R., Nguyen, Q. T., Massling, A., Skov, H., and Barrie, L.: Pan-Arctic aerosol number size distributions: seasonality and transport patterns, Atmos. Chem. Phys., 17, 8101–8128, https://doi.org/10.5194/acp-17-8101-2017, 2017. a, b, c
Frey, M. M., Norris, S. J., Brooks, I. M., Anderson, P. S., Nishimura, K., Yang, X., Jones, A. E., Nerentorp Mastromonaco, M. G., Jones, D. H., and Wolff, E. W.: First direct observation of sea salt aerosol production from blowing snow above sea ice, Atmos. Chem. Phys., 20, 2549–2578, https://doi.org/10.5194/acp-20-2549-2020, 2020. a
Geng, H., Ryu, J., Jung, H.-J., Chung, H., Ahn, K.-H., and Ro, C.-U.: Single-Particle Characterization of Summertime Arctic Aerosols Collected at Ny-Ålesund, Svalbard, Environ. Sci. Technol., 44, 2348–2353, https://doi.org/10.1021/es903268j, 2010. a, b, c
Ghahremaninezhad, R., Norman, A.-L., Abbatt, J. P. D., Levasseur, M., and Thomas, J. L.: Biogenic, anthropogenic and sea salt sulfate size-segregated aerosols in the Arctic summer, Atmos. Chem. Phys., 16, 5191–5202, https://doi.org/10.5194/acp-16-5191-2016, 2016. a
Giardi, F., Becagli, S., Traversi, R., Frosini, D., Severi, M., Caiazzo, L., Ancillotti, C., Cappelletti, D., Moroni, B., Grotti, M., Bazzano, A., Lupi, A., Mazzola, M., Vitale, V., Abollino, O., Ferrero, L., Bolzacchini, E., Viola, A., and Udisti, R.: Size distribution and ion composition of aerosol collected at Ny-Ålesund in the spring–summer field campaign 2013, Rend. Lincei, 27, 47–58, https://doi.org/10.1007/s12210-016-0529-3, 2016. a
Gilardoni, S., Lupi, A., Mazzola, M., Cappelletti, D. M., Moroni, B., Ferrero, L., Markuszewski, P., Rozwadowska, A., Krejci, R., Zieger, P., Tunved, P., Karlsson, L., Vratolis, S., Eleftheriadis, K., and Viola, A. P.: Atmospheric black carbon in Svalbard (ABC Svalbard), in: SESS report 2019, Svalbard Integrated Arctic Earth Observing System, edited by: Van den Heuvel, F., Hübner, C., Błaszczyk, M., Heimann, M., and Lihavainen, H., Longyearbyen, 200–201, available at: https://sios-svalbard.org/SESS_Issue2 (last access: 22 July 2021), 2020. a, b
Groot Zwaaftink, C. D., Grythe, H., Skov, H., and Stohl, A.: Substantial contribution of northern high-latitude sources to mineral dust in the Arctic, J. Geophys. Res.-Atmos., 121, 13678–13697, https://doi.org/10.1002/2016JD025482, 2016. a, b
Guerzoni, S. and Chester, R.: The impact of desert dust across the Mediterranean, Springer Science & Business Media, Kluwer Academic Publishers, Dordrecht, the Netherlands, vol. 11, 333–338, 1996. a
Heslin-Rees, D., Burgos, M., Hansson, H.-C., Krejci, R., Ström, J., Tunved, P., and Zieger, P.: From a polar to a marine environment: has the changing Arctic led to a shift in aerosol light scattering properties?, Atmos. Chem. Phys., 20, 13671–13686, https://doi.org/10.5194/acp-20-13671-2020, 2020. a
Huang, J. and Jaeglé, L.: Wintertime enhancements of sea salt aerosol in polar regions consistent with a sea ice source from blowing snow, Atmos. Chem. Phys., 17, 3699–3712, https://doi.org/10.5194/acp-17-3699-2017, 2017. a, b
Kerminen, V.-M., Teinilä, K., and Hillamo, R.: Chemistry of sea-salt particles in the summer Antarctic atmosphere, Atmos. Environ., 34, 2817–2825, https://doi.org/10.1016/S1352-2310(00)00089-3, 2000. a
Kirpes, R. M., Bondy, A. L., Bonanno, D., Moffet, R. C., Wang, B., Laskin, A., Ault, A. P., and Pratt, K. A.: Secondary sulfate is internally mixed with sea spray aerosol and organic aerosol in the winter Arctic, Atmos. Chem. Phys., 18, 3937–3949, https://doi.org/10.5194/acp-18-3937-2018, 2018. a
Kirpes, R. M., Bonanno, D., May, N. W., Fraund, M., Barget, A. J., Moffet, R. C., Ault, A. P., and Pratt, K. A.: Wintertime Arctic Sea Spray Aerosol Composition Controlled by Sea Ice Lead Microbiology, ACS Central Science, 5, 1760–1767, https://doi.org/10.1021/acscentsci.9b00541, 2019. a, b, c
Kylling, A., Groot Zwaaftink, C. D., and Stohl, A.: Mineral Dust Instantaneous Radiative Forcing in the Arctic, Geophys. Res. Lett., 45, 4290–4298, https://doi.org/10.1029/2018GL077346, 2018. a
Lachlan-Cope, T., Beddows, D. C. S., Brough, N., Jones, A. E., Harrison, R. M., Lupi, A., Yoon, Y. J., Virkkula, A., and Dall'Osto, M.: On the annual variability of Antarctic aerosol size distributions at Halley Research Station, Atmos. Chem. Phys., 20, 4461–4476, https://doi.org/10.5194/acp-20-4461-2020, 2020. a, b
Landrum, L. and Holland, M. M.: Extremes become routine in an emerging new Arctic, Nat. Clim. Change, 10, 1108–1115, https://doi.org/10.1038/s41558-020-0892-z, 2020. a
Lange, R., Dall'Osto, M., Skov, H., Nøjgaard, J., Nielsen, I., Beddows, D., Simo, R., Harrison, R., and Massling, A.: Characterization of distinct Arctic aerosol accumulation modes and their sources, Atmos. Environ., 183, 1–10, https://doi.org/10.1016/j.atmosenv.2018.03.060, 2018. a
Lange, R., Dall'Osto, M., Wex, H., Skov, H., and Massling, A.: Large Summer Contribution of Organic Biogenic Aerosols to Arctic Cloud Condensation Nuclei, Geophys. Res. Lett., 46, 11500–11509, https://doi.org/10.1029/2019GL084142, 2019. a
Law, K. S. and Stohl, A.: Arctic air pollution: Origins and impacts, Science, 315, 1537–1540, https://doi.org/10.1126/science.1137695, 2007. a, b, c
Li, S.-M. and Winchester, J. W.: Particle size distribution and chemistry of late winter Arctic aerosols, J. Geophys. Res.-Atmos., 95, 13897–13908, https://doi.org/10.1029/JD095iD09p13897, 1990. a, b
Lin, C., Baker, A., Jickells, T., Kelly, S., and Lesworth, T.: An assessment of the significance of sulphate sources over the Atlantic Ocean based on sulphur isotope data, Atmos. Environ., 62, 615–621, https://doi.org/10.1016/j.atmosenv.2012.08.052, 2012. a
Lupi, A., Busetto, M., Becagli, S., Giardi, F., Lanconelli, C., Mazzola, M., Udisti, R., Hansson, H.-C., Henning, T., Petkov, B., Ström, J., Krejci, R., Tunved, P., Pietro Viola, A., and Vitale, V.: Multi-seasonal ultrafine aerosol particle number concentration measurements at the Gruvebadet observatory, Ny-Ålesund, Svalbard Islands, Rend. Lincei, 27, 59–71, https://doi.org/10.1007/s12210-016-0532-8, 2016. a
May, N. W., Quinn, P. K., McNamara, S. M., and Pratt, K. A.: Multiyear study of the dependence of sea salt aerosol on wind speed and sea ice conditions in the coastal Arctic, J. Geophys. Res.-Atmos., 121, 9208–9219, https://doi.org/10.1002/2016JD025273, 2016. a, b, c, d
Mazzola, M., Viola, A. P., Lanconelli, C., and Vitale, V.: Atmospheric observations at the Amundsen-Nobile climate change tower in Ny-Ålesund, Svalbard, Rend. Lincei, 27, 7–18, https://doi.org/10.1007/s12210-016-0540-8, 2016. a
McCutcheon, J., Lutz, S., Williamson, C., Cook, J. M., Tedstone, A. J., Vanderstraeten, A., Wilson, S. A., Stockdale, A., Bonneville, S., Anesio, A. M., Yallop, M. L., McQuaid, J. B., Tranter, M., and Benning, L. G.: Mineral phosphorus drives glacier algal blooms on the Greenland Ice Sheet, Nat. Commun., 12, 1–11, https://doi.org/10.1038/s41467-020-20627-w, 2021. a, b
Morawska, L., Thomas, S., Jamriska, M., and Johnson, G.: The modality of particle size distributions of environmental aerosols, Atmos. Environ., 33, 4401–4411, https://doi.org/10.1016/S1352-2310(99)00217-4, 1999. a
Moroni, B., Becagli, S., Bolzacchini, E., Busetto, M., Cappelletti, D., Crocchianti, S., Ferrero, L., Frosini, D., Lanconelli, C., Lupi, A., Maturilli, M., Mazzola, M., Perrone, M. G., Sangiorgi, G., Traversi, R., Udisti, R., Viola, A., and Vitale, V.: Vertical profiles and chemical properties of aerosol particles upon Ny-Ålesund (Svalbard islands), Adv. Meteorol., 2015, 292081, https://doi.org/10.1155/2015/292081, 2015. a
Murphy, D. M., Froyd, K. D., Bian, H., Brock, C. A., Dibb, J. E., DiGangi, J. P., Diskin, G., Dollner, M., Kupc, A., Scheuer, E. M., Schill, G. P., Weinzierl, B., Williamson, C. J., and Yu, P.: The distribution of sea-salt aerosol in the global troposphere, Atmos. Chem. Phys., 19, 4093–4104, https://doi.org/10.5194/acp-19-4093-2019, 2019. a
U.S. National Ice Center: IMS Daily Northern Hemisphere Snow and Ice Analysis at 1 km, 4 km, and 24 km Resolutions, Version 1, NSIDC: National Snow and Ice Data Center, Boulder, Colorado, USA, https://doi.org/10.7265/N52R3PMC, 2008. a
O'Dowd, C. D., Smith, M. H., Consterdine, I. E., and Lowe, J. A.: Marine aerosol, sea-salt, and the marine sulphur cycle: a short review, Atmos. Environ., 31, 73–80, https://doi.org/10.1016/S1352-2310(96)00106-9, 1997. a
Petzold, A., Ogren, J. A., Fiebig, M., Laj, P., Li, S.-M., Baltensperger, U., Holzer-Popp, T., Kinne, S., Pappalardo, G., Sugimoto, N., Wehrli, C., Wiedensohler, A., and Zhang, X.-Y.: Recommendations for reporting “black carbon” measurements, Atmos. Chem. Phys., 13, 8365–8379, https://doi.org/10.5194/acp-13-8365-2013, 2013. a
Porter, J. N. and Clarke, A. D.: Aerosol size distribution models based on in situ measurements, J. Geophys. Res.-Atmos., 102, 6035–6045, https://doi.org/10.1029/96JD03403, 1997. a, b, c, d
Prather, K. A., Bertram, T. H., Grassian, V. H., Deane, G. B., Stokes, M. D., DeMott, P. J., Aluwihare, L. I., Palenik, B. P., Azam, F., Seinfeld, J. H., Moffet, R. C., Molina, M. J., Cappa, C. D., Geiger, F. M., Roberts, G. C., Russell, L. M., Ault, A. P., Baltrusaitis, J., Collins, D. B., Corrigan, C. E., Cuadra-Rodriguez, L. A., Ebben, C. J., Forestieri, S. D., Guasco, T. L., Hersey, S. P., Kim, M. J., Lambert, W. F., Modini, R. L., Mui, W., Pedler, B. E., Ruppel, M. J., Ryder, O. S., Schoepp, N. G., Sullivan, R. C., and Zhao, D.: Bringing the ocean into the laboratory to probe the chemical complexity of sea spray aerosol, P. Natl. Acad. Sci. USA, 110, 7550–7555, https://doi.org/10.1073/pnas.1300262110, 2013. a, b, c
Quinn, P., Shaw, G., Andrews, E., Dutton, E., Ruoho-Airola, T., and Gong, S.: Arctic haze: current trends and knowledge gaps, Tellus B, 59, 99–114, https://doi.org/10.1111/j.1600-0889.2006.00236.x, 2007. a
Quinn, P. K., Miller, T. L., Bates, T. S., Ogren, J. A., Andrews, E., and Shaw, G. E.: A 3-year record of simultaneously measured aerosol chemical and optical properties at Barrow, Alaska, J. Geophys. Res.-Atmos., 107, AAC 8-1–AAC 8-15, https://doi.org/10.1029/2001JD001248, 2002. a
Quinn, P. K., Collins, D. B., Grassian, V. H., Prather, K. A., and Bates, T. S.: Chemistry and related properties of freshly emitted sea spray aerosol, Chem. Rev., 115, 4383–4399, https://doi.org/10.1021/cr500713g, 2015. a, b, c
Radke, L. F., Lyons, J. H., Hegg, D. A., Hobbs, P. V., and Bailey, I. H.: Airborne observations of Arctic aerosols. I: Characteristics of Arctic haze, Geophys. Res. Lett., 11, 393–396, https://doi.org/10.1029/GL011i005p00393, 1984. a, b
Ricard, V., Jaffrezo, J.-L., Kerminen, V.-M., Hillamo, R. E., Teinilä, K., and Maenhaut, W.: Size distributions and modal parameters of aerosol constituents in northern Finland during the European Arctic Aerosol Study, J. Geophys. Res.-Atmos., 107, AAC 4-1–AAC 4-18, https://doi.org/10.1029/2001JD001130, 2002. a, b, c, d, e, f, g, h
Russell, L. M.: Sea-spray particles cause freezing in clouds, Nature, 525, 194–195, https://doi.org/10.1038/525194a, 2015. a
Salter, M. E., Hamacher-Barth, E., Leck, C., Werner, J., Johnson, C. M., Riipinen, I., Nilsson, E. D., and Zieger, P.: Calcium enrichment in sea spray aerosol particles, Geophys. Res. Lett., 43, 8277–8285, https://doi.org/10.1002/2016GL070275, 2016. a
Sanchez-Marroquin, A., Arnalds, O., Baustian-Dorsi, K. J., Browse, J., Dagsson-Waldhauserova, P., Harrison, A. D., Maters, E. C., Pringle, K. J., Vergara-Temprado, J., Burke, I. T., McQuaid, J. B., Carslaw, K. S., and Murray, B. J.: Iceland is an episodic source of atmospheric ice-nucleating particles relevant for mixed-phase clouds, Sci. Adv., 6, 26, https://doi.org/10.1126/sciadv.aba8137, 2020. a
Schmale, J., Arnold, S. R., Law, K. S., Thorp, T., Anenberg, S., Simpson, W. R., Mao, J., and Pratt, K. A.: Local Arctic Air Pollution: A Neglected but Serious Problem, Earth's Future, 6, 1385–1412, https://doi.org/10.1029/2018EF000952, 2018. a
Schmale, J., Zieger, P., and Ekman, A. M.: Aerosols in current and future Arctic climate, Nat. Clim. Change, 11, 95–105, https://doi.org/10.1038/s41558-020-00969-5, 2021. a
Sharma, S., Barrie, L., Magnusson, E., Brattström, G., Leaitch, W., Steffen, A., and Landsberger, S.: A Factor and Trends Analysis of Multidecadal Lower Tropospheric Observations of Arctic Aerosol Composition, Black Carbon, Ozone, and Mercury at Alert, Canada, J. Geophys. Res.-Atmos., 124, 14133–14161, https://doi.org/10.1029/2019JD030844,2019. a, b
Sirois, A. and Barrie, L. A.: Arctic lower tropospheric aerosol trends and composition at Alert, Canada: 1980–1995, J. Geophys. Res.-Atmos., 104, 11599–11618, https://doi.org/10.1029/1999JD900077, 1999. a
Stein, A. F., Draxler, R. R., Rolph, G. D., Stunder, B. J. B., Cohen, M. D., and Ngan, F.: NOAA's HYSPLIT Atmospheric Transport and Dispersion Modeling System, B. Am. Meteorol. Soc., 96, 2059–2077, https://doi.org/10.1175/BAMS-D-14-00110.1, 2016. a
Stohl, A.: Characteristics of atmospheric transport into the Arctic troposphere, J. Geophys. Res.-Atmos., 111, D11306, https://doi.org/10.1029/2005JD006888, 2006. a
Stone, R. S., Anderson, G. P., Andrews, E., Dutton, E. G., Shettle, E. P., and Berk, A.: Incursions and radiative impact of Asian dust in northern Alaska, Geophys. Res. Lett., 34, L14815, https://doi.org/10.1029/2007GL029878, 2007. a
Struthers, H., Ekman, A. M. L., Glantz, P., Iversen, T., Kirkevåg, A., Mårtensson, E. M., Seland, Ø., and Nilsson, E. D.: The effect of sea ice loss on sea salt aerosol concentrations and the radiative balance in the Arctic, Atmos. Chem. Phys., 11, 3459–3477, https://doi.org/10.5194/acp-11-3459-2011, 2011. a
Tobo, Y., Adachi, K., DeMott, P. J., Hill, T. C., Hamilton, D. S., Mahowald, N. M., Nagatsuka, N., Ohata, S., Uetake, J., Kondo, Y., and Koike, M.: Glacially sourced dust as a potentially significant source of ice nucleating particles, Nat. Geosci., 12, 253–258, https://doi.org/10.1038/s41561-019-0314-x, 2019. a, b, c, d, e, f, g, h
Traversi, R., Becagli, S., Mazzola, M., Lupi, A., and Vitale, V.: Aerosol large particles size distribution collected at Gruvebadet, Ny-Ålesund, Svalbard, Zenodo [data set], https://doi.org/10.5281/zenodo.3961473, 2020. a, b
Tunved, P., Ström, J., and Krejci, R.: Arctic aerosol life cycle: linking aerosol size distributions observed between 2000 and 2010 with air mass transport and precipitation at Zeppelin station, Ny-Ålesund, Svalbard, Atmos. Chem. Phys., 13, 3643–3660, https://doi.org/10.5194/acp-13-3643-2013, 2013. a
Udisti, R., Dayan, U., Becagli, S., Busetto, M., Frosini, D., Legrand, M., Lucarelli, F., Preunkert, S., Severi, M., Traversi, R., and Vitale, V.: Sea spray aerosol in central Antarctica. Present atmospheric behaviour and implications for paleoclimatic reconstructions, Atmos. Environ., 52, 109–120, https://doi.org/10.1016/j.atmosenv.2011.10.018, 2012. a
Udisti, R., Bazzano, A., Becagli, S., Bolzacchini, E., Caiazzo, L., Cappelletti, D., Ferrero, L., Frosini, D., Giardi, F., Grotti, M., Lupi, A., Malandrino, M., Mazzola, M., Moroni, B., Severi, M., Traversi, R., Viola, A., and Vitale, V.: Sulfate source apportionment in the Ny-Ålesund (Svalbard Islands) Arctic aerosol, Rend. Lincei, 27, 85–94, https://doi.org/10.1007/s12210-016-0517-7, 2016. a, b, c, d, e
Virkkula, A., Ahlquist, N. C., Covert, D. S., Arnott, W. P., Sheridan, P. J., Quinn, P. K., and Coffman, D. J.: Modification, Calibration and a Field Test of an Instrument for Measuring Light Absorption by Particles, Aerosol Sci. Tech., 39, 68–83, https://doi.org/10.1080/027868290901963, 2005. a
Wall, S. M., John, W., and Ondo, J. L.: Measurement of aerosol size distributions for nitrate and major ionic species, Atmos. Environ., 22, 1649–1656, https://doi.org/10.1016/0004-6981(88)90392-7, 1988. a
Willis, M. D., Leaitch, W. R., and Abbatt, J. P.: Processes Controlling the Composition and Abundance of Arctic Aerosol, Rev. Geophys., 56, 621–671, https://doi.org/10.1029/2018RG000602, 2018. a, b, c, d
Wilson, T. W., Ladino, L. A., Alpert, P. A., Breckels, M. N., Brooks, I. M., Browse, J., Burrows, S. M., Carslaw, K. S., Huffman, J. A., Judd, C., Kilthau, W. P., Mason, R. H., McFiggans, G., Miller, L. A., Nájera, J. J., Polishchuk, E., Rae, S., Schiller, C. L., Si, M., Temprado, J. V., Whale, T. F., Wong, J. P. S., Wurl, O., Yakobi-Hancock J. D., Abbatt, J. P. D., Aller, J. Y., Bertram, A. K., Knopf, D. A., and Murray, B. J.: A marine biogenic source of atmospheric ice-nucleating particles, Nature, 525, 234–238, https://doi.org/10.1038/nature14986, 2015. a
Yu, H., Li, W., Zhang, Y., Tunved, P., Dall'Osto, M., Shen, X., Sun, J., Zhang, X., Zhang, J., and Shi, Z.: Organic coating on sulfate and soot particles during late summer in the Svalbard Archipelago, Atmos. Chem. Phys., 19, 10433–10446, https://doi.org/10.5194/acp-19-10433-2019, 2019. a, b
Zeng, Y. and Hopke, P.: A study of the sources of acid precipitation in Ontario, Canada, Atmos. Environ., 23, 1499–1509, https://doi.org/10.1016/0004-6981(89)90409-5, 1989. a