the Creative Commons Attribution 4.0 License.
the Creative Commons Attribution 4.0 License.
 | 27 Jul 2021
Cloud activation properties of aerosol particles in a continental Central European urban environment
Wanda Thén
Máté Vörösmarty
András Zénó Gyöngyösi
Collocated measurements using a condensation particle counter, differential mobility particle sizer and cloud condensation nuclei counter were realised in parallel in central Budapest from 15 April 2019 to 14 April 2020 to gain insight into the cloud activation properties of urban aerosol particles. The median total particle number concentration was 10.1 × 103 cm−3. The median concentrations of cloud condensation nuclei (CCN) at water vapour supersaturation (S) values of 0.1 %, 0.2 %, 0.3 %, 0.5 % and 1.0 % were 0.59, 1.09, 1.39, 1.80 and 2.5 × 103 cm−3, respectively. The CCN concentrations represented 7–27 % of all particles. The CCN concentrations were considerably larger but the activation fractions were systematically substantially smaller than observed in regional or remote locations. The effective critical dry particle diameters (dc,eff) were derived utilising the CCN concentrations and particle number size distributions. Their median values at the five supersaturation values considered were 207, 149, 126, 105 and 80 nm, respectively; all of these diameters were positioned within the accumulation mode of the typical particle number size distribution. Their frequency distributions revealed a single peak for which the geometric standard deviation increased monotonically with S. This broadening indicated high time variability in the activating properties of smaller particles. The frequency distributions also showed fine structure, with several compositional elements that seemed to reveal a consistent or monotonical tendency with S. The relationships between the critical S and dc,eff suggest that urban aerosol particles in Budapest with diameters larger than approximately 130 nm showed similar hydroscopicity to corresponding continental aerosol particles, whereas smaller particles in Budapest were less hygroscopic than corresponding continental aerosol particles. Only modest seasonal cycling in CCN concentrations and activation fractions was seen, and only for large S values. This cycling likely reflects changes in the number concentration, chemical composition and mixing state of the particles. The seasonal dependencies of dc,eff were featureless, indicating that the droplet activation properties of the urban particles remained more or less the same throughout the year. This is again different from what is seen in non-urban locations. Hygroscopicity parameters (κ values) were computed without determining the time-dependent chemical composition of the particles. The median values for κ were 0.15, 0.10, 0.07, 0.04 and 0.02, respectively, at the five supersaturation values considered. The averages suggested that the larger particles were considerably more hygroscopic than the smaller particles. We found that the κ values for the urban aerosol were substantially smaller than those previously reported for aerosols in regional or remote locations. All of these characteristics can be linked to the specific source composition of particles in cities. The relatively large variability in the hygroscopicity parameters for a given S emphasises that the individual values represent the CCN population in ambient air while the average hygroscopicity parameter mainly corresponds to particles with sizes close to the effective critical dry particle diameter.
- Article
(1889 KB) - Full-text XML
-
Supplement
(161 KB) - BibTeX
- EndNote


Water is the most abundant vapour in the troposphere. Its condensation onto aerosol particles is the only relevant pathway for cloud or fog droplet formation at water vapour supersaturation (S) values that occur in the ambient air (Pruppacher and Klett, 2000). The S values in clouds are usually less than 1 %, with a median value of between 0.1 % and 0.2 %. The number and size of the generated droplets depend on both the particle properties and the local S value (Andreae and Rosenfeld, 2008). Only a subset of aerosol particles are able to grow to droplets at a given S; they are called the cloud condensation nuclei (CCN) for this S. The aerosol properties that primarily influence the ability to grow droplets are the size of the aerosol particle and, to a lesser degree, its chemical composition and mixing state (Dusek et al., 2006). S is mainly governed by cloud dynamics and the amount of cloud droplets present. The droplets act as a sink for water vapour and the amount of droplets present also depends on the CCN concentration. Different updraft velocities and droplet populations in clouds result in different S values, which can also change the activation process. As a consequence, droplet formation can be limited by the availability of CCN and/or the updraft velocity. The former case ordinarily prevails in the global troposphere at concentrations of < 9 × 103 cm−3 and is called the CCN-limited regime (Rosenfeld et al., 2014).
CCN modify the intensity and other properties of the sunlight reaching the Earth's surface indirectly, through cloud droplets. These properties are primarily influenced by the droplet number, droplet size and cloud residence time (Andreae and Rosenfeld, 2008; Rosenfeld et al., 2008, 2014). CCN also influence the hydrological cycle (including the amount and intensity of precipitation), vegetation and its interactions with the carbon cycle, as well as atmospheric chemistry, physics and dynamics. Moreover, it is this indirect effect of aerosols that contributes the most uncertainty to global radiative forcing calculations (e.g. Carslaw et al., 2013). This is particularly important given that number concentrations of particles seem to be increasing globally due to anthropogenic activities (Andreae et al., 2005). Concentrations of CCN can vary considerably over space and time. Dedicated studies of CCN have been performed in field experiments at several locations in the world and in various laboratories (e.g. Dusek et al., 2006; McFiggans et al., 2006; Hudson, 2007; Rose et al., 2008, 2010; Kuwata and Kondo, 2008; Pringle et al., 2010; Wex et al., 2010; Burkart et al., 2011; Sihto et al., 2011; Jurányi et al., 2011; Kerminen et al., 2012; Topping and McFiggans, 2012; Paramonov et al., 2015; Herenz et al., 2018; Schmale et al., 2018). Despite their importance, our knowledge of aerosol–water vapour interactions at supersaturations that are typical of atmospheric conditions and cloud microphysics is still insufficient. Longer-term studies (e.g. those lasting 1 year) are preferred to understand these processes and their consequences. Broad regional coverage is also needed to achieve representative results. Data sets for the environmental category of large cities are particularly scarce.
The study presented here deals with the cloud droplet activation properties of aerosol particles in a continental Central European city, Budapest, which has 2.2 million inhabitants in its metropolitan area and is the largest city in the Carpathian Basin. Online aerosol and meteorological measurements have been performed in a semicontinuous manner at the Budapest platform for Aerosol Research and Training (BpART) Laboratory for more than a decade (Salma et al., 2011; Mikkonen et al., 2020). Essential instruments for this task include a differential mobility particle sizer (DMPS) and a condensation particle counter (CPC). They have also been complemented by a continuous-flow cloud condensation nuclei counter (CCNc) since 2018. The ability to obtain long-term particle number size distributions, total particle number concentrations and CCN data at various S values facilitates the utilisation of special data validation methods and joint evaluation procedures.
The main objective of the present study was to gain insight into the cloud activation properties of urban aerosol particles based on 1 year of measurements in central Budapest. Specifically, in this paper we report, discuss, explain and interpret the measured time series and descriptive statistics of CCN concentrations, activated fractions of aerosol particles, effective activation dry particle diameters and effective hygroscopicity parameters under various supersaturated conditions, and we discuss some collective consequences of the data sets.
The time interval considered in this study was 15 April 2019 to 14 April 2020. CPC, DMPS, CCNc and meteorological measurements were performed on 100 %, 99 %, 85 % and 100 % of the relevant days, respectively. The CCNc was out of operation in January 2020. We also mention for completeness that the study period also included the emergency phase (from 12 to 27 March 2020, 16 d) and the period (from 28 March to the end of the measurement year; 18 d) in which movement was restricted during the first outbreak of the COVID-19 pandemic in Hungary (Salma et al., 2020b). Local time (LT = UTC+1 or daylight-saving time, UTC+2) was chosen as the time base for the data because it has been observed that the daily activity pattern of the inhabitants of a city strongly influences many of the atmospheric processes in that city (Salma et al., 2014; Mikkonen et al., 2020).
2.1 Experimental part
All measurements were performed at the BpART Laboratory (47∘28′30′′ N, 19∘3′45′′ E, 115 m above mean sea level) of Eötvös Loránd University (Salma et al., 2016). Due to its geographical location and meteorological conditions, this location site is representative of the average atmospheric environment for central Budapest. Thus, it can be regarded as an urban background. Local sources comprise residential and household emissions, including seasonal heating, vehicle traffic exhaust and some industrial sources (Salma et al., 2017, 2020a, b). Long-range transport of air masses can also play a role over shorter time intervals. The measurement site is located 85 m from the River Danube. The sampling inlets of the instruments were between 12 and 13 m above street level and protected by a weather shield and insect net. The laboratory was air conditioned and maintained at (20±3) ∘C.
The CPC instrument deployed (TSI, model 3752, USA) was operated with an aerosol inlet flow of 1.5 L min−1 and recorded concentrations of particles with diameters above 4 nm using n-butanol as a working fluid. Its sampling inlet was a stainless-steel tube with a diameter of 6.35 mm ( in.) and a length of ca. 1.6 m. Mean particle number concentration (NCPC) data with a time resolution of 1 min were extracted from its extended database. According to the nominal specification of the CPC, the difference between the concentrations measured by two identical instruments operating in the single-particle counting mode with a data averaging interval of > 30 s is less than ±10 %.
The DMPS system utilised was a laboratory-made flow-switching-type device (University of Helsinki, Finland). It measured particle number concentrations in the electrical mobility diameter range from 6 to 1000 nm in the dry state (when the relative humidity, RH, was < 30 %) in 30 channels with a time resolution of 8 min (Salma et al., 2011, 2016). Its main components included a radioactive (60Ni) bipolar diffusion charger, a Nafion semipermeable membrane monotube dryer, a 28 cm long Vienna-type differential mobility analyser and a butanol-based CPC (TSI, model 3775, USA). The aerosol flow rates in the high and low modes were 2.0 and 0.31 L min−1, respectively. The sheath flows were 10 times larger than the aerosol flows. The sampling inlet was made of copper tube with a diameter of 6 mm and a length of ca. 1.9 m. The measurements were realised semicontinuously according to international technical standards (Wiedensohler et al., 2012; Schmale et al., 2017).
The CCNc system implemented was a DMT-200 instrument (Droplet Measurement Technologies, USA) that contained two vertical condensation chambers, A and B, with a cylindrical shape (inner diameter 2.3 cm, length 50 cm; Roberts and Nenes, 2005; Rose et al., 2008). The porous internal walls of the chambers were continuously wetted with liquid water from peristaltic pumps. A linear positive temperature gradient was established along the cylinders and controlled at the top, middle and bottom zones of the chambers. The aerosol sample flow was continuously guided through the centre of each chamber and surrounded by a filtered sheath air flow. The flows proceeded from top to bottom under laminar conditions and near-ambient air pressure (P). As the flows passed through the chambers, heat and water vapour were transported from the internal wall surface towards the centre of each chamber. Because water molecules diffuse faster than air molecules (transferring the heat), a constant S value was obtained along the axes. The S value could be adjusted by changing the temperature gradient. The particles were exposed to this S for ca. 10 s, and the particles that activated at a critical S that was lower than the adjusted value formed droplets that were substantially larger than the inactivated particles. The droplets were detected at the chamber exit by optical particle counters, yielding size distributions in the 0.75–10 µm diameter range. Droplets larger than 1 µm were considered to be activated CCN, and the concentration of particles in this size interval was negligible.
The total air flow rate was set to 500 cm3 min−1 and the ratio of the sample flow rate to the sheath flow rate was 1 : 10. The S value was shifted from 0.1 % to 0.2 %, 0.3 %, 0.5 % and then 1.0 % within a measuring cycle, with durations at each S value of 12, 5, 5, 5 and 5 min, respectively. The data measured by the system were recorded every 1 s. The CCN concentrations (NCCN,S) obtained by the two chambers at a given S were accepted provided they did not differ by more than 15 %. The system was run in polydisperse operation mode, largely according to the ACTRIS standard operating protocol (Gysel and Stratmann, 2013).
The meteorological measurements took place onsite at the BpART Lab. Air temperature (T), RH, wind speed (WS), wind direction (WD), P and global solar radiation (GRad) data were obtained by standardised meteorological sensors (HD52.3D17, Delta OHM, Italy and an SMP3 pyranometer, Kipp and Zonen, the Netherlands) with a time resolution of 1 min (see the Supplement).
2.2 Data treatment and validation
The measured DMPS data were inverted into discrete size distributions that were utilised to calculate particle number concentrations in the diameter ranges 6–25 nm (N6–25), 6–100 nm (N6–100), 30–1000 nm (N30–1000) and 6–1000 nm (N6–1000). These size intervals were selected to represent various important particle source types and to enable comparisons with earlier results. The extraction, treatment and processing of the measured CCNc data – including the date and time, NCCN,S, flow rates and activation temperatures (, where T1 and T2 are the read wall temperatures in the top and middle zones of the condensation chambers; Gysel and Stratmann, 2013) – were accomplished for each S stage using the laboratory-developed computer software AeroSoLutions.
Averaging of the individual measurements was performed from the end of each S stage in a backward direction over a set time span at a stable temperature in the condensation chambers. The averaging times were the result of examining several randomly selected time dependencies of the CCN concentration and temperature in different seasons. The averaging interval was preselected for each S, and was ordinarily set to 90, 210, 210, 180 and 150 s, respectively, for S values of 0.1 %, 0.2 %, 0.3 %, 0.5 % and 1.0 %. The averaging was monitored within the data treatment to ensure proper functioning, and it was refined in some cases when necessary. Warning flags were generated for suspicious data during data processing, and the filtered data were checked separately. The two data sets for chambers A and B were averaged if their ratio was between 80 and 120 %. Otherwise, one of the two data sets was chosen on the basis of its time evolution. For an S of 0.1 % (i.e. for small CCN concentrations), another averaging criterion, namely , was utilised instead of the concentration ratio. The limits were based upon tests with concentrations in typical measurement intervals. The criteria represented sensible and pragmatic approaches, although alternative thresholds could also be set. Finally, it was checked that the average CCN concentration increased monotonically with S within a measurement cycle. The time resolution of all experimental data derived from the CCNc instrument was 32 min.
The N6–1000 data from the DMPS system were compared to the CPC concentrations, which were averaged over the corresponding DMPS measuring cycle. Due to a difference between the lowest diameters that can be measured by the two instruments (6 vs. 4 nm, respectively), measurements from the instruments were assumed to agree if the contribution of nucleation-mode particles to the total number of particles was negligible. Additional factors such as larger particle transport losses along the longer path in the DMPS system and the potentially different response times of the two CPCs involved in the instruments could also contribute to the observed concentration discrepancy (Salma et al., 2016). The comparison was realised by evaluating the ratio as a function of the ratio. The intercept of the regression line for the resulting plot was considered the correction factor for the DMPS system (Sect. 3.1).
For validation purposes, the CCN concentrations at an S of 1.0 % (NCCN,1.0 %) were compared to the particle number concentrations. These two concentrations would be expected to be similar if most particles activate at this S. In a previous survey, certain criteria were set to exclude the time intervals during which very small, hence, non-activating particles were present in larger concentrations (Schmale et al., 2017). The comparison was performed when the concentration ratio of particles <30 nm in diameter to all particles was either <10 % or between 10 % and 20 %. These two criteria proved useful for remote or regional locations. They do not seem to be applicable for urban data sets since the annual means and standard deviations (SDs) are much lower in urban areas than in more distant environments. In Budapest, for instance, they were (52±15) %. This also meant that the proportion of the DMPS data that fulfilled either of the two criteria above was very small: only 2 % annually. This is due to the relatively large and persistent contributions from the high-temperature emission sources of particles that are typically present in cities. The representativeness of any conclusion drawn for the whole data set based on such a limited amount of data is statistically questionable.
To avoid this weak point, we propose another criterion for urban or polluted environments as a compromise between the larger number of cases and the constrained contribution of small and thus non-activating particles: the NCCN,1.0 % data are only compared to the N30–1000 data if %. This was fulfilled by more of the DMPS concentrations and yielded more robust statistics, although the contribution from smaller particles remained higher than for the original criteria. The limit value of 70 % employed to express this compromise was determined in a pragmatic manner; alternative values could also be set. The size distribution spectrum for which the date and time were the closest (within 20 min) and earlier than or equal to that of the CCN concentration was considered. This procedure is discussed further in Sect. 3.1.
2.3 Particle hygroscopicity
For atmospheric aerosol, the activated fraction of particles tends to increase gradually with the dry particle diameter (as a sigmoid function, instead of the step function valid for internally mixed monodisperse particles). This is primarily because atmospheric particles are often external mixtures or because chemical composition changes with particle size (Dusek et al., 2006; Rose et al., 2010). A threshold activation diameter called the effective critical dry particle diameter (dc,eff) is defined in these cases as the particle size at which 50 % of the dry particles activate at a given S (Rose et al., 2008, 2010).
The effective critical dry particle diameter was determined from collocated polydisperse CCN and particle number size distribution measurements as (Sihto et al., 2011; Kerminen et al., 2012; Schmale et al., 2018)
where dmax is the largest dry particle diameter measured by the sizing instrument (DMPS here) and Ni is the number of particles in size channel i of the instrument. Hence, the concentrations were summed from the largest particle size (dmax) to smaller diameters until the measured CCN concentration was obtained. In order to estimate dc,eff with higher accuracy, a logarithmic interpolation was accomplished between the last two diameters of the summation. The size distribution spectrum for which the date and time were the closest (within 20 min) and earlier than or equal to that of the CCN concentration was considered.
It should be noted that the assumption of internally mixed particles is rarely met in urban environments, including Budapest (Enroth et al., 2018). However, the approximation involves various influences that largely compensate for each other, so it still gives reasonable results for such environments (Kammermann et al., 2010).
The cloud droplet activation of aerosol particles refers to indefinite diameter growth (i.e. up to the droplet sizes) due to the condensation of water vapour at a constant saturation ratio (, where p is the partial vapour pressure of water over a droplet solution and p0 is the saturation vapour pressure of water over pure water with a flat surface). The conditions for the S (with ) at which the droplets stay in equilibrium with the water vapour (Seq) can be identified using the Köhler model (e.g. Pruppacher and Klett, 2000; McFiggans et al., 2006). To calculate the composition-dependent Seq as a function of the droplet diameter (dwet) for a given dry particle diameter ds, most of the controlling variables are further simplified and approximated within different types of thermodynamic parametrisations. In the present study, the effective hygroscopicity model was adopted (Petters and Kreidenweis, 2007). Laboratory and field measurements together with modelling considerations indicate that this parametrisation is reliable for both sub- and supersaturated conditions (Rose et al., 2008; Merikanto et al., 2009; Rissler et al., 2010; Sihto et al., 2011; Kerminen et al., 2012; Schmale et al., 2018).
Seq can be expressed as follows by assuming volume additivity of the solute and water in the droplet and spherical shapes for the dry solute particle and solution droplet (Petters and Kreidenweis, 2007):
where
Here, κ, , Mw, ρw, R and T are the hygroscopicity parameter, surface tension of the droplet–air interface, molar mass of water (0.018015 kg mol−1), density of water, universal gas constant (8.3145 J mol−1 K−1) and absolute temperature of the droplet and air in thermodynamic equilibrium, respectively. was assumed to be that of pure water. Some organic chemical species in atmospheric aerosol particles, such as humic-like substances, are surface active and can lower the surface tension of droplets (Facchini et al., 1999; Ovadnevaite et al., 2017). This depression is mainly controlled by the diffusion of surfactants from the bulk of the droplet to its surface. It takes several hours to reach thermodynamic equilibrium at medium concentrations (Salma et al., 2006). This implies that possible alterations due to the lower surface tension compared to that of pure water are small with respect to estimated experimental uncertainties; they may also be compensated for by some surface/bulk partitioning effects (Sorjamaa et al., 2004). The surface tension of pure water seems, therefore, to be a reasonable approximation to reality under the conditions considered in the present study.
The κ values can be computed by solving Eq. (2). This contains several independent variables, i.e. T, ds and dwet in addition to Seq and κ. S is controlled by the CCNc instrument; T can be expressed by the activation temperature in the condensation chamber (Ta, Sect. 2.2). For a polydisperse atmospheric aerosol, ds can be approximated by dc,eff (Eq. 1; Rose et al., 2008). An additional independent relationship, namely the fact that the dependency of Seq on dwet exhibits a maximum (of Sc at a diameter of dc), is also exploited to solve Eq. (2). The κ values were computed in an iterative manner by varying both κ and dwet until the calculated S values were equivalent to the adjusted S values and showed a maximum (Jurányi et al., 2010; Rose et al., 2010).
When the volume occupied by the solute can be neglected with respect to the water volume at the activation stage, Sc can be approximated for κ>0.2 as follows (Petters and Kreidenweis, 2007):
The time resolution of all modelled data was 32 min, which typically resulted in 13.6 × 10³ counts in each data set at each S level.
The relevant meteorological properties for each month are summarised in Table S1 in the Supplement to give an impression of the actual atmospheric environment at the study location. They also indicate that typical weather conditions were present in Budapest during the measurement year, with no extraordinary situations.
3.1 Data quality
The DMPS systematically measured smaller total particle number concentrations (N6–1000) than those measured by the CPC (NCPC), as discussed in Sect. 2.2. The intercept (a) and slope (b) and their SDs of the regression line of the ratio vs. the ratio were and , respectively, and the Pearson coefficient of correlation (R) between the concentration sets was 0.943. As a result of the comparison, a size-independent multiplication correction factor of 1.33 was adopted for the inverted DMPS data.
A scatter plot of the DMPS N30–1000 data for which % (; see also Sect. 2.2) versus the NCCN,1.0 % data is shown in Fig. 1a. It can be seen that all measured particle number concentrations were larger than those for the CCN. The ratio as a function of NCCN,1.0 % (Fig. 1b) did not indicate a systematic difference between the two instruments. Most concentration ratios with larger values (i.e. from ca. 3 to 7) that appear in all panels of the figure were isolated cases. They are most likely related to the time difference between the actual DMPS and CCNc data. Since the instruments have time resolutions of ca. 8 and 32 min, respectively, a compared pair of values could have a time difference of up to 16 min (if the first possible DMPS-measured spectrum was missing). During this time, the particle number concentrations could change substantially. Actual atmospheric concentrations can vary rapidly because of changes in the intensities of some important anthropogenic emission sources in the vicinity, changes in physical removal processes and changes in local meteorological conditions (such as WS, which influences particle transport). Dynamic concentration variability is often observed in cities, and manifests as the sudden appearance of stripes in the particle number size distribution surface plot (e.g. Fig. 10 in Salma et al., 2016).
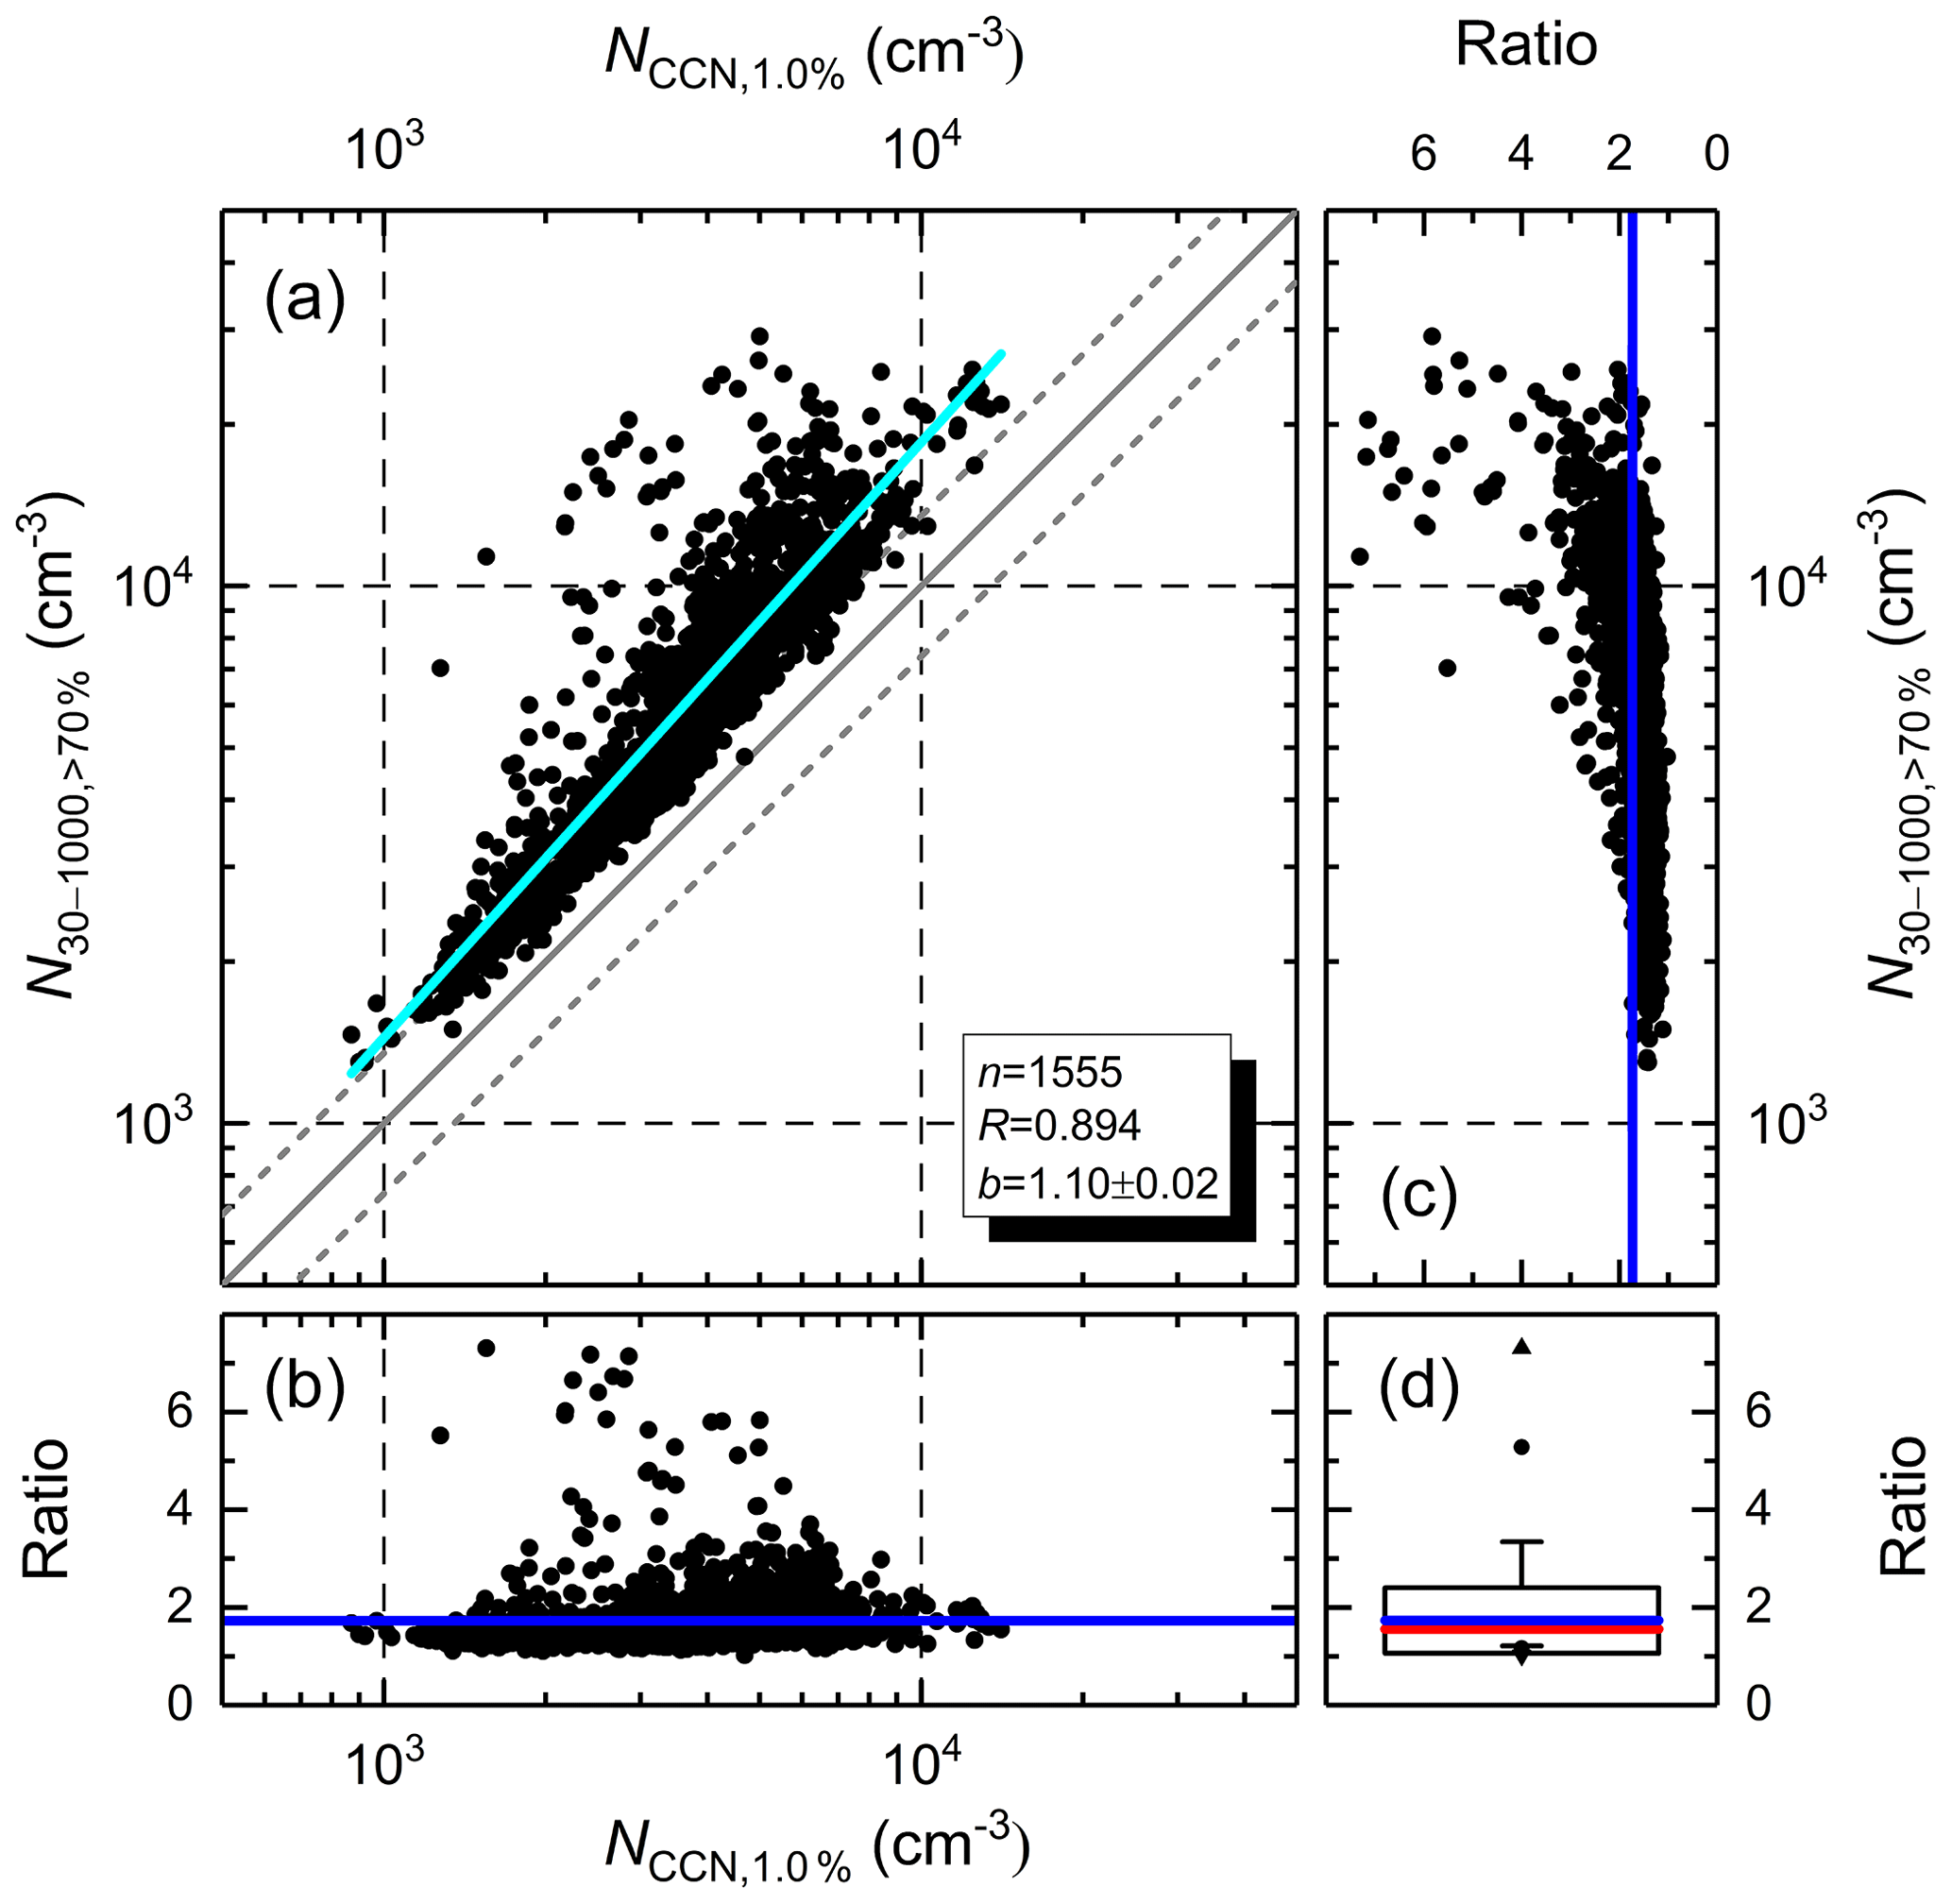
Figure 1Relationship between the concentration of particles with diameters >30 nm that contribute >70 % of all particles () and the CCN concentration at a supersaturation of 1.0 % (NCCN,1.0 %) (a); the number of the data points considered (n), their coefficient of correlation (R) and the slope (b) and SD of the regression line (in cyan) are also indicated. The line of equality and the dashed grey lines indicate the range of uncertainty expected solely from particle counting (±15 %). The ratio is also shown as functions of the variables NCCN,1.0 % (b) and (c), with the mean indicated by the blue line in each plot. The box and whisker plot (d) summarises the maximum and minimum (triangles pointing upward and downward, respectively), the first and 99th percentiles (bullets), the mean and SD (blue line and the horizontal borders of the box, respectively), and the median (red line) of the ratio.
The plot of the ratio as a function of (Fig. 1c) suggested that the ratio slightly increased with concentration, in particular when was above 104 cm−3. is expected to agree with NCCN,1.0 % (to within approximately ±15 %; Sect. 2.1) if the number of particles that are >30 nm and exhibit low hygroscopicity is negligible with respect to . The opposite can easily be true in cities, including Budapest. This argument is backed by the fact that the R between and N6–25 was significant (0.875) during the measurement year. Most of the time, the latter size fraction mainly contains freshly emitted particles from road vehicles (Salma et al., 2017), and these particles typically exhibit low hygroscopicity (Burkart et al., 2011; Rose et al., 2011; Enroth et al., 2018). They contribute to as well. Another indication that low-hygroscopicity chemical species are abundant is the low contribution of water-soluble organic carbon (WSOC) and the high contribution of elemental carbon (soot) to organic carbon (OC) in central Budapest. These ratios are moderately related to the general hygroscopicity. The former ratio was found to be substantially lower (WSOC OC ranged from 20 % to 39 %) and the latter ratio was considerably larger (EC OC ranged from 14 % to 20 %) in comparison with those of aerosols that are chemically aged or found above regional or remote areas (Salma et al., 2007, 2020a and references therein).
All of the above imply that the importance of the average ratio is rivalled by or even superseded by the importance of the slope of the regression line and R between the two data sets as quality assurance metrics. The mean ratio and SD, and the median ratio , the slope of the regression line and SD, and the coefficient of correlation for the overall data set were 1.73±0.67, 1.56, 1.10±0.02 and 0.894, respectively. Our set of quality indicators are in accord with the results of data quality checks elaborated for a number of other mainly regional locations (Schmale et al., 2017). They jointly suggest that the CCNc and DMPS instruments were operating in a coherent manner and that the CCNc instrument performed reasonably well over the whole measurement year.
3.2 Concentrations and their ratios
The basic statistical measures of the particle number concentrations in different size fractions over the whole measurement year are summarised in Table 1. The mean ratio and SD of were (81±10) %. The concentrations are comparable with but somewhat larger than our previous annual results, while the ratios agree well with the previous data (Mikkonen et al., 2020). The median particle number size distribution is shown in Fig. S1 in the Supplement.
Table 1Ranges, medians and means with SDs of the particle number concentrations in the diameter ranges 6–25 nm (N6–25), 6–100 nm (N6–100), 30–1000 nm (N30–1000), 30–1000 nm if they contributed >70 % of all particles (), and 6–1000 nm (N6–1000); all values are in units of 103 cm−3.
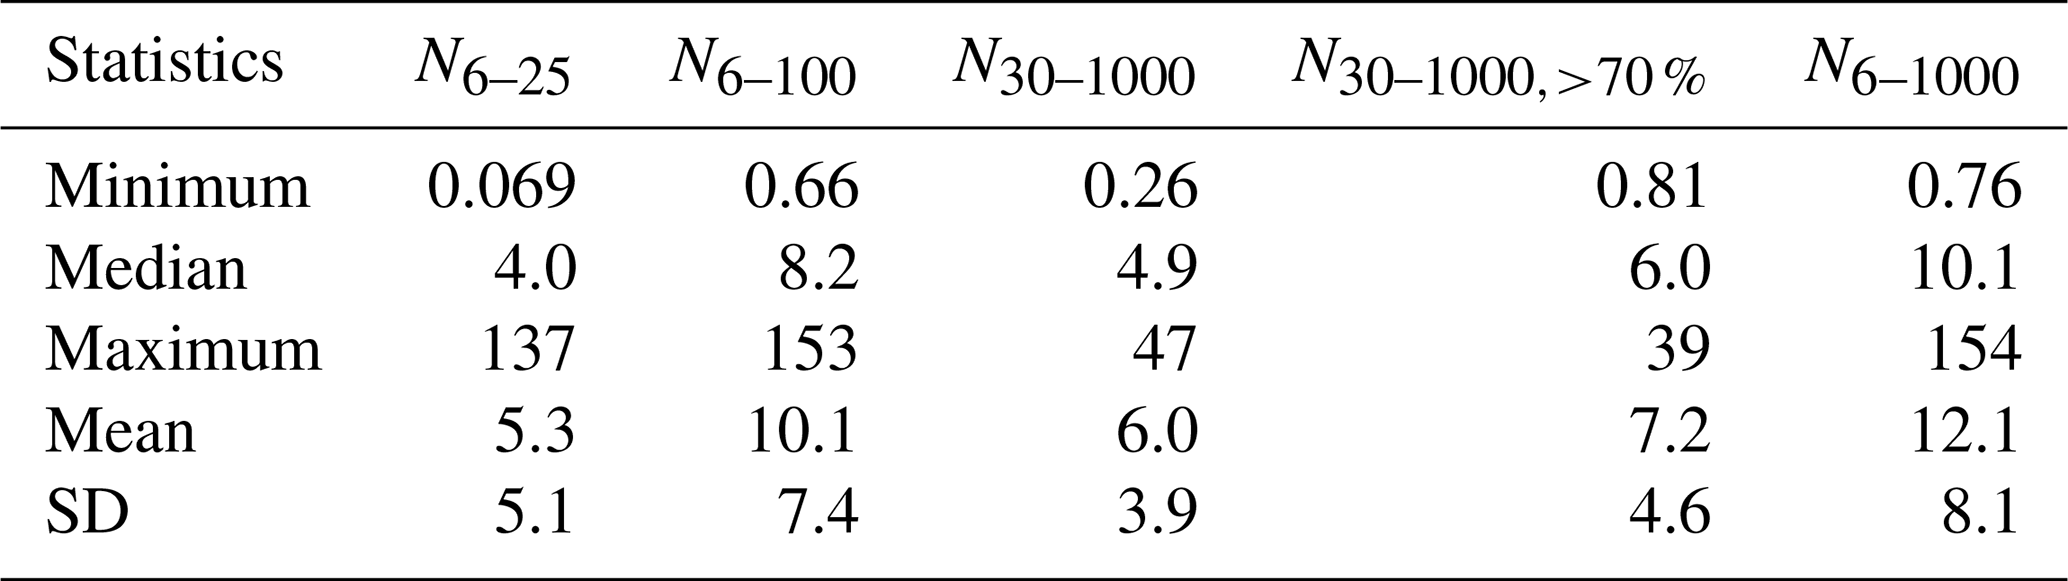
For the sake of completeness, we note that the median N6–100 and N6–1000 values during the period with restricted movement (associated with the first outbreak of the COVID-19 pandemic) were smaller than the annual medians by 72 % and 79 %, respectively, while the N30–1000 values for the period with restricted movement and the whole year were similar. The mean and SD of (75±12) % indicate that the contribution from ultrafine particles substantially decreased (see the previous paragraph). All this is in accordance with the conclusions of a more extensive study we dedicated to this issue (Salma et al., 2020b).
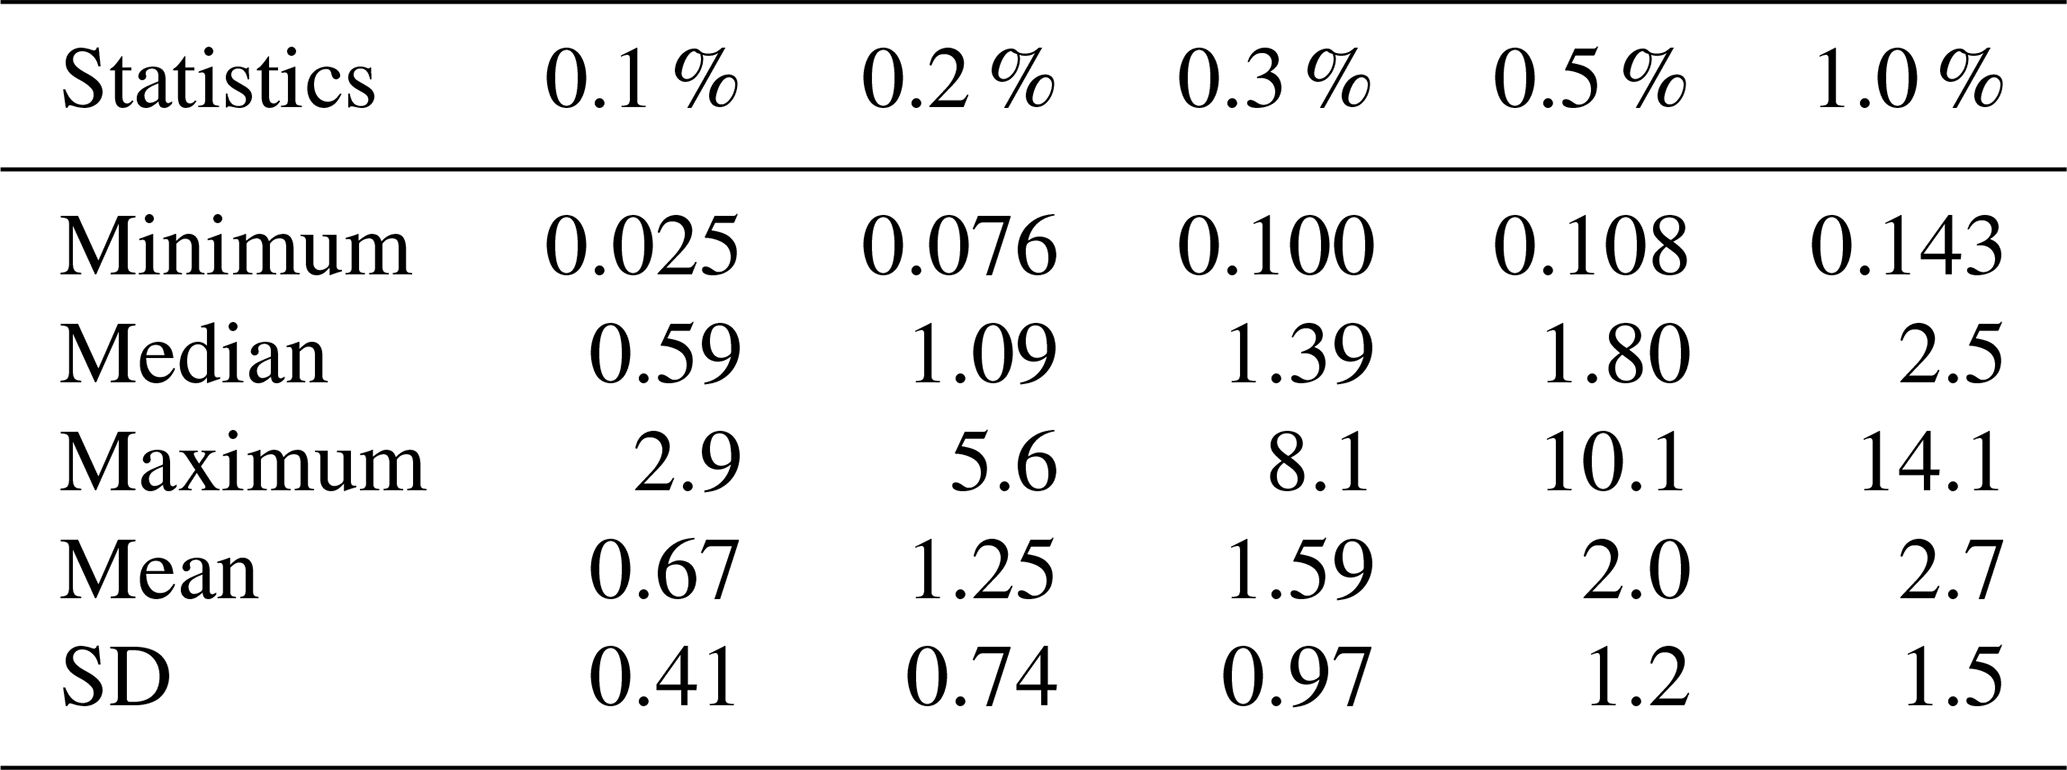
Basic statistical measures of the CCN concentrations at different S values over the whole measurement year are surveyed in Table 2. We mention for completeness that while some of the CCN concentrations at S values of 0.5 % and 1.0 % were above 9 × 103 cm−3 (Sect. 1), these corresponded to only 10 cases (0.073 % of all relevant data) and 59 cases (0.43 %), respectively, whereas the related κ values were rather low (Sect. 3.5). Therefore, the CCN-limited regime of droplet activation was realised. The median concentration changed monotonically from 0.59 × 10³ to 2.5 × 103 cm−3 with S and showed a levelling-off tendency. The medians were fitted (in Origin Pro 2017 software using the Levenberg–Marquardt iteration algorithm) by a power law function of form × Sk, where S is the supersaturation in %, to obtain the so-called traditional CCN spectrum (Pruppacher and Klett, 2000). The constant c corresponds to the CCN concentration at an S of 1.0 %. Knowledge of these two parameters is sufficient for some cloud microphysics applications. The resulting fitted parameters c and k and their SDs were (2.81±0.12) × 103 cm−3 and 0.52±0.05, respectively. The coefficient c agreed with the measured average NCCN,1.0 % (Table 2). The exponent k was within the range reported for other continental locations (k = 0.4–0.9; Pruppacher and Klett, 2000). The fitted function reproduced the experimental data at higher S values (>0.2 %) satisfactorily, while the ratio of the value from the fitted function to the corresponding experimental value became 1.25 at an S of 0.1 %. A comparison of the concentrations and effective critical dry particle diameters with those observed in other locations is given in Sect. 3.3.
The mean activation fractions () of the particles increased monotonically from 7 % to 27 % with S and showed some levelling off (Fig. 2). The activation curve was obtained by fitting the experimental data with the two-parameter logarithm function , where a and b are fitting parameters (Paramonov et al., 2015) using the Levenberg–Marquardt iteration algorithm in the Origin Pro 2017 software. The shape of the fit curve was similar to that for the CCN concentrations. This is typical of non-coastal locations, where a multicomponent mixture of particle sources yield more or less balanced and therefore similar curves (Schmale et al., 2018). Figure 2 also contains the annual activation curve obtained in a synthesis study (performed within the European Aerosol Cloud Climate and Air Quality Interactions project) by fitting the mean AFs for several regional and remote locations with an identical function (Fig. 5 in Paramonov et al., 2015). It can be seen that the curves for the urban and other sites were rather different from each other in magnitude or placement. The urban AFs were systematically much smaller than those for the regional and remote locations. This was also witnessed for other regional results (Sihto et al., 2011), and could be an urban feature. The low AF in cities is probably explained by larger particle number concentrations, higher abundances of small particles that do not activate, and a chemical composition that typically leads to lower hygroscopicity than for regional aerosols. At the same time, the relative SDs (RSDs) of our mean values were relatively high (between 45 % and 70 %), which points to considerable variability in both N6–1000 and NCCN,S over time. It also hints that the prediction of CCN concentrations based solely on particle number concentrations and mean AFs is unlikely to be reliable for urban environments. Moreover, the annual curves do not necessary capture the variability at shorter or seasonal scales.
Table 2Ranges, medians and means with SDs of the CCN concentration (in × 103 cm−3) at supersaturations of 0.1 %, 0.2 %, 0.3 %, 0.5 % and 1.0 %.
3.3 Effective critical dry particle diameters
Basic statistical measures of the effective critical dry particle diameter at different S values over the whole measurement year are displayed in Table 3. The median dc,eff decreased from 207 to 80 nm with S. All diameters were positioned within the accumulation mode of the median particle number size distribution (Fig. S1). The monthly mean number median mobility diameters for the Aitken and accumulation modes were typically 26 and 93 nm, respectively, with identical geometric SDs (GSDs) of 2.1 (Salma et al., 2011). The broadening was caused by the averaging of the individual size distributions. Considering the minimum of the dc,eff data, some diameters, in particular for S values of 0.5 % and 1.0 %, could be shifted to the Aitken mode.
Table 3Ranges, medians and means with SDs of the effective critical dry particle diameter (in nm) at supersaturations of 0.1 %, 0.2 %, 0.3 %, 0.5 % and 1.0 %.
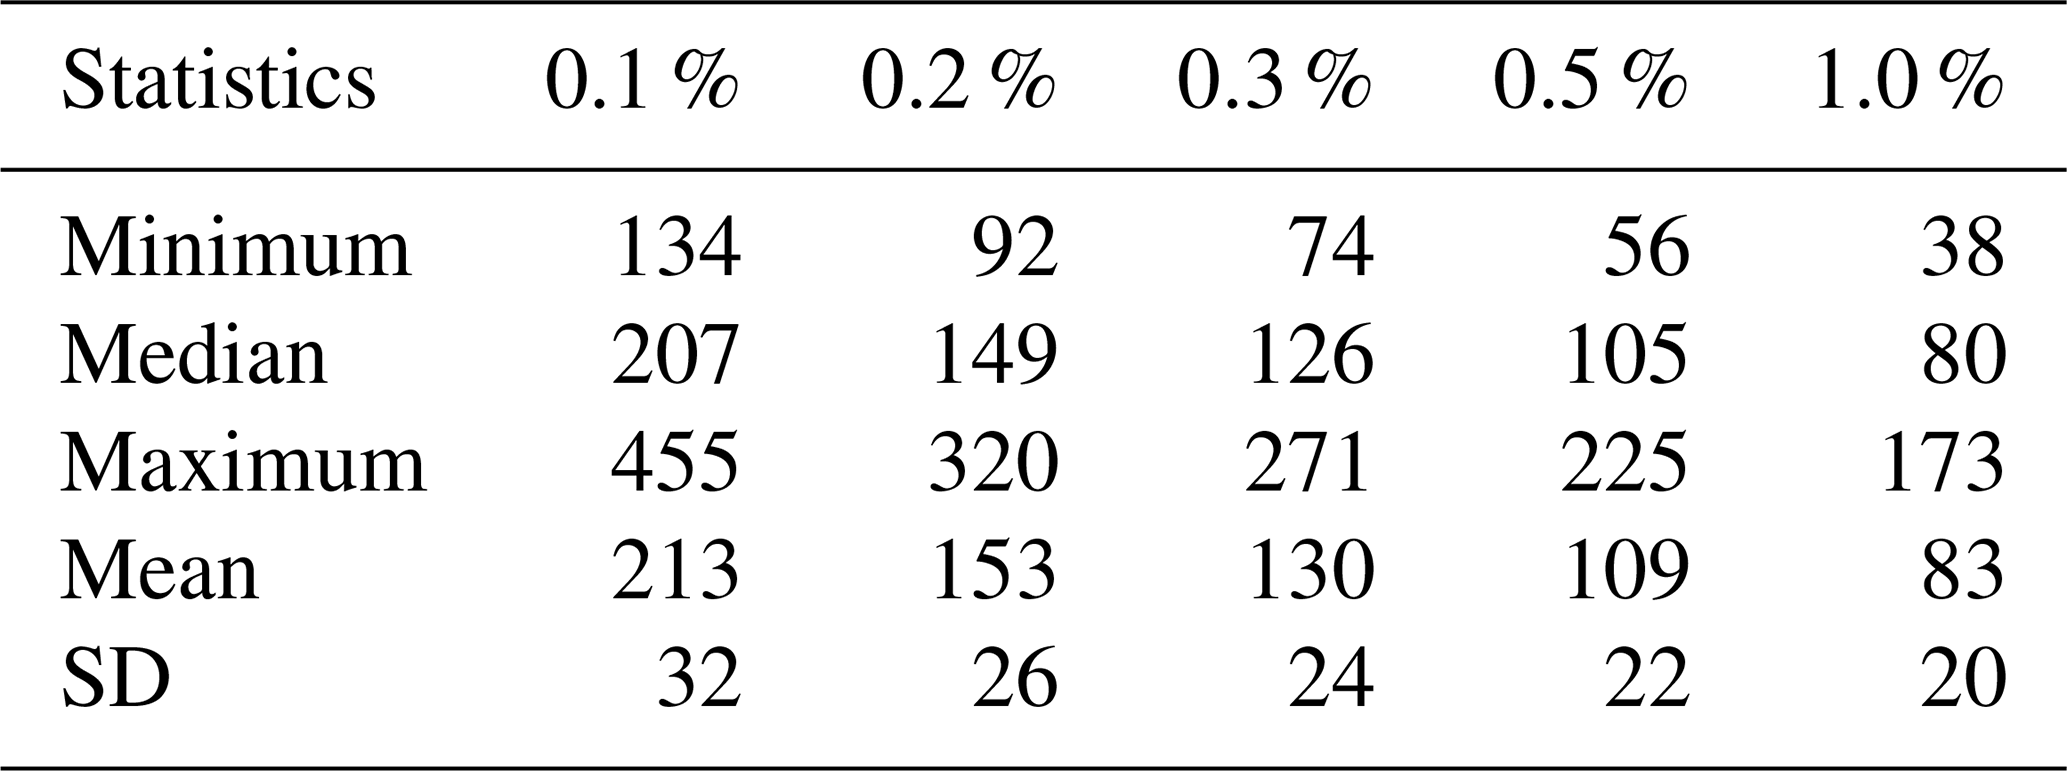
The present average diameters and CCN concentrations were larger than those reported for coastal or rural background, forested, or remote environments (Henning et al., 2002; Komppula et al., 2005; Paramonov et al., 2015; Schmale et al., 2018). This confirmed that the water activation properties of aerosol particles depend on their type. Our data were comparable with those obtained for other urban sites (Kuwata and Kondo, 2008; Rose et al., 2010; Burkart et al., 2011; Meng et al., 2014). Variations within the location category are likely to be associated with relatively large differences between urban aerosol properties. The mean contribution and SD of ultrafine particles were, for instance, % in Budapest and % in Vienna. The present dc,eff data are also contrasted with the computed results for the simulated global continental mean κ value and SD (0.27±0.21; Pringle et al., 2010) in Fig. 3. The lines shown in the figure were obtained using the parameters given in Sect. 2.3. The individual data points belong to various parallel lines with a theoretical slope of . They suggest that the urban aerosol particles in Budapest with diameters larger than approximately 130 nm show similar hygroscopicity to the continental aerosol in general, whereas the smaller particles appear to be less hygroscopic than the corresponding continental aerosol particles. The differences are even larger when the European continental aerosol is considered (κ=0.36; Pringle et al., 2010). The data points tend toward a limiting relationship for insoluble but wettable (hydrophilic) particles (e.g. freshly emitted soot particles; Rose et al., 2011) with decreasing diameter.
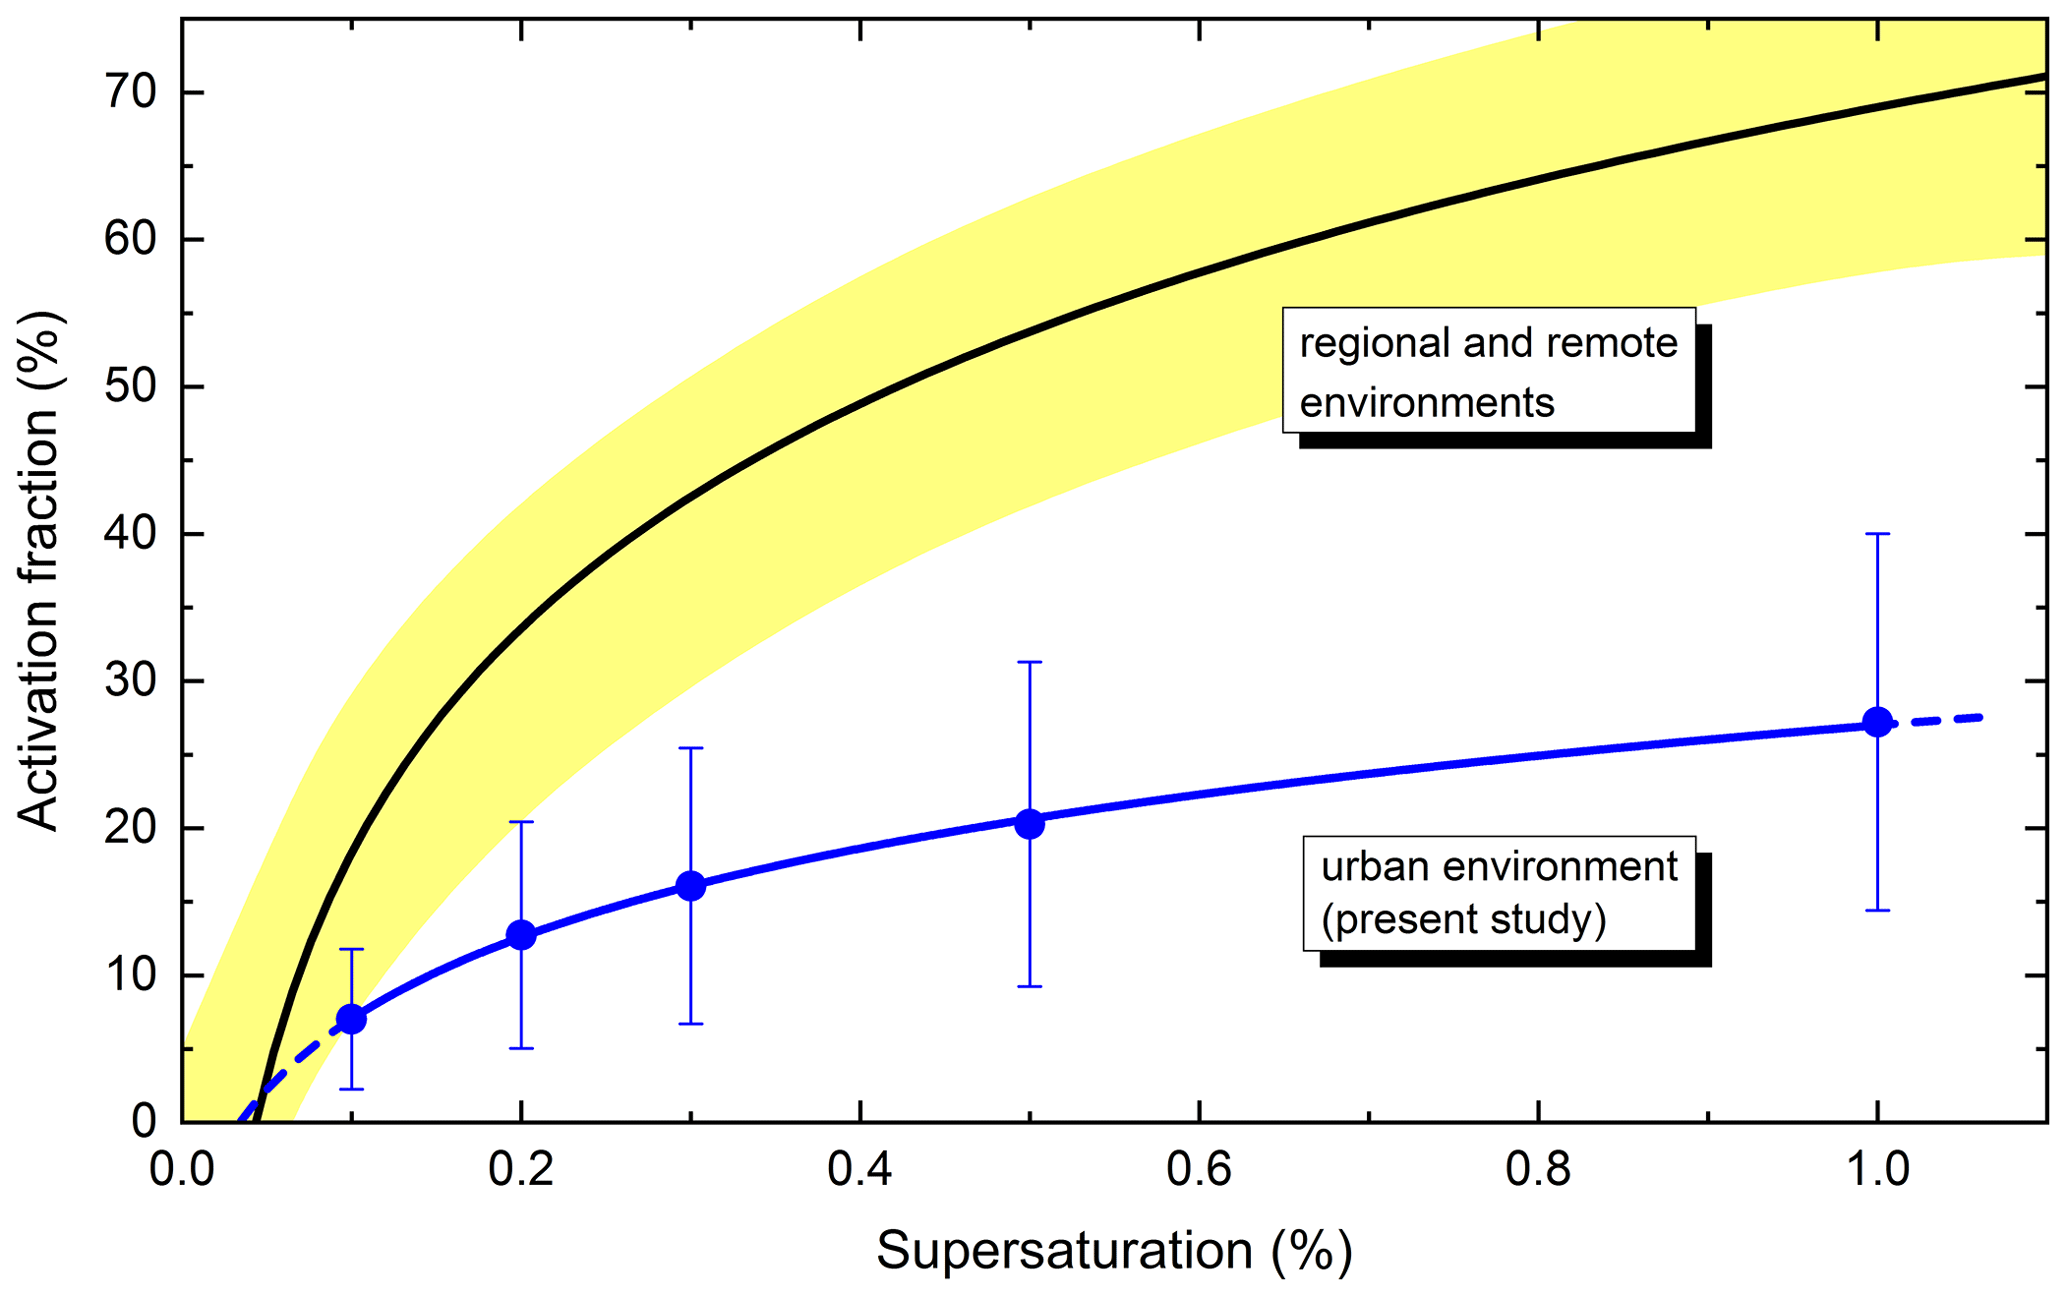
Figure 2Experimentally determined mean activated fraction of total particles (N6–1000) and its SD for central Budapest at supersaturations of 0.1 %, 0.2 %, 0.3 %, 0.5 % and 1.0 % (blue dots) together with the curve fit to the data (blue line). The fitting function used was , with parameters of and . The black line, shown for comparison, corresponds to the same fitting function but with mean parameters of a=22 and b=69, as obtained for several selected regional and remote sites in a EUCAARI synthesis study (Table 4; Paramonov et al., 2015). The yellow band represents the 95 % confidence interval.
The tendentious dependency of the deviation of the experimentally derived (dc,eff, Sc) data points from the line for the simulated global continental mean κ (Fig. 3) also point to a size dependence of the chemical composition, and this dependence is likely to be more pronounced for urban particles. All this is in line with the major source types, such as vehicle emissions, biomass burning, and new particle formation and diameter growth (NPF) events (Salma et al., 2014, 2017, 2020a, b), as well as the particle number size distributions in Budapest (Salma et al., 2011). Photochemical processing may also play a role through chemical ageing (Furutani et al., 2008). As a result, urban sources often result in external mixtures of particles.
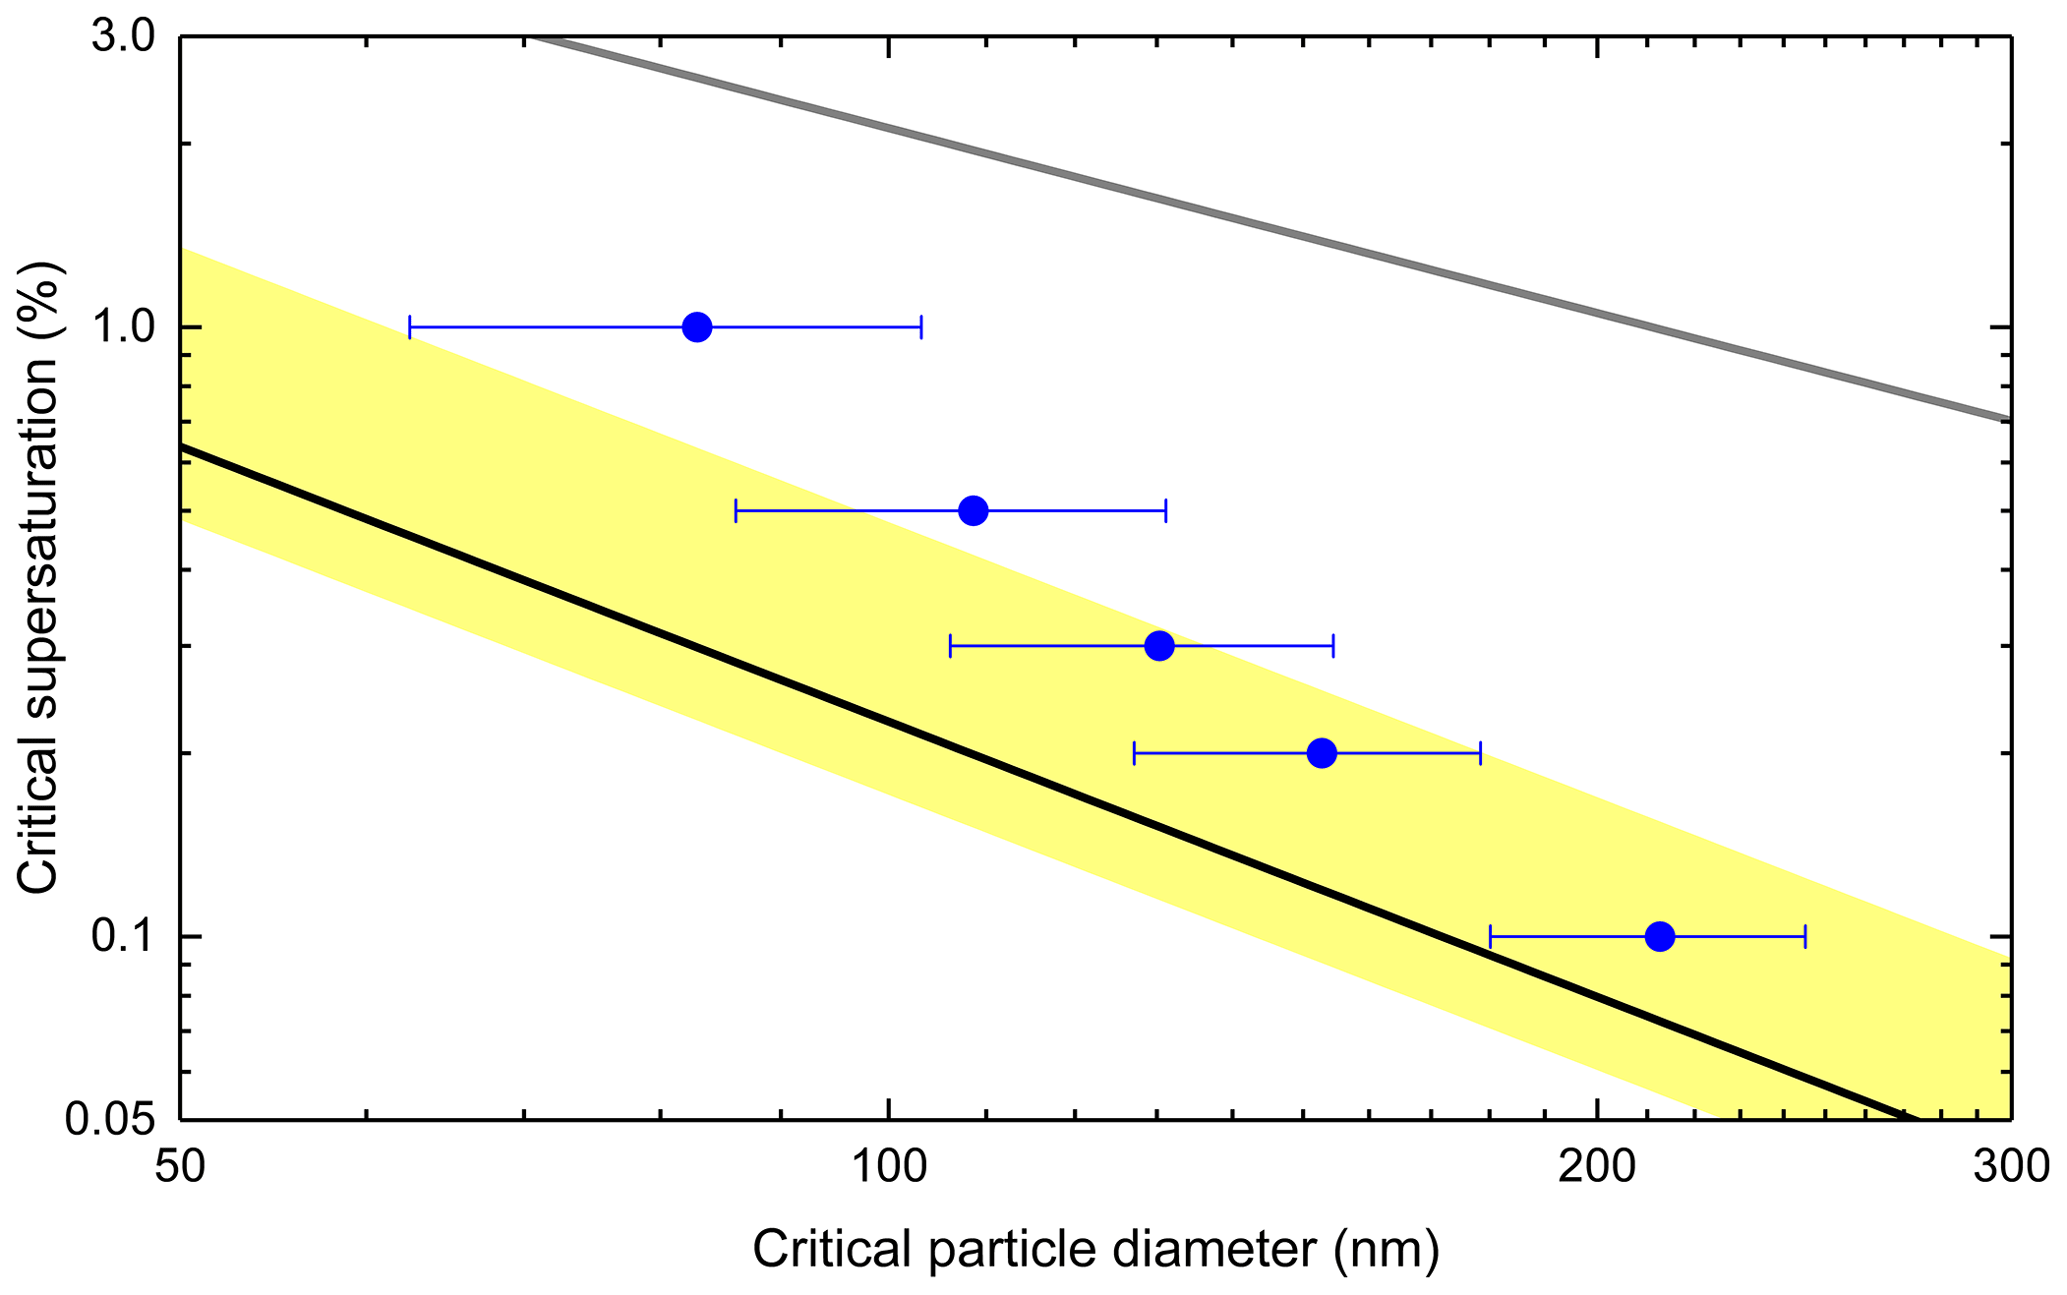
Figure 3Critical supersaturation and effective critical dry particle diameter data pairs (blue dots) and SDs (blue error bars) determined experimentally in central Budapest, and the dependency calculated for the simulated global continental mean κ and SD of 0.27±0.21 (the black line represents the mean κ value and the yellow band represents ±1 SD). The relationship for insoluble but wettable particles (κ=0, the Kelvin term) is also shown (grey line) for comparison.
The frequency distribution of dc,eff for a particular S can be described by a lognormal distribution function. The normalised differential distributions of the dc,eff data for the five S values considered in this work are shown in Fig. 4. They were derived by partitioning all the diameter data into 71 intervals of width 0.0243 on a logarithmic scale between 10 and 500 nm. The selected interval width proved to be a reasonable compromise between good statistics and good data resolution. The distributions exhibit single peaks with geometric SDs that increase monotonically with S: 1.14, 1.16, 1.20, 1.22 and 1.27, respectively. The broadening indicates that the droplet activation properties of the smaller particles showed greater variability.
The peaks exhibit fine structure. They seem to contain submodes. This is probably because there were mixtures of particles with different activation properties. The submodes could have been produced by sources that result in particles with different chemical compositions and mixing states. These differences may not necessarily show up in particle number size distributions, but they can lead to diverse activation properties. Several compositional elements of the fine structure (e.g. the maximum or the relative peak areas) changed in a tendentious manner with S. Exact identification and interpretation of this fine structure is beyond the objectives of the present work but will be included in an upcoming study that will deal with the relationships of major source types such as vehicle emissions, NPF events and biomass burning to the activation properties of CCN together with their diurnal variability and air mass trajectories.
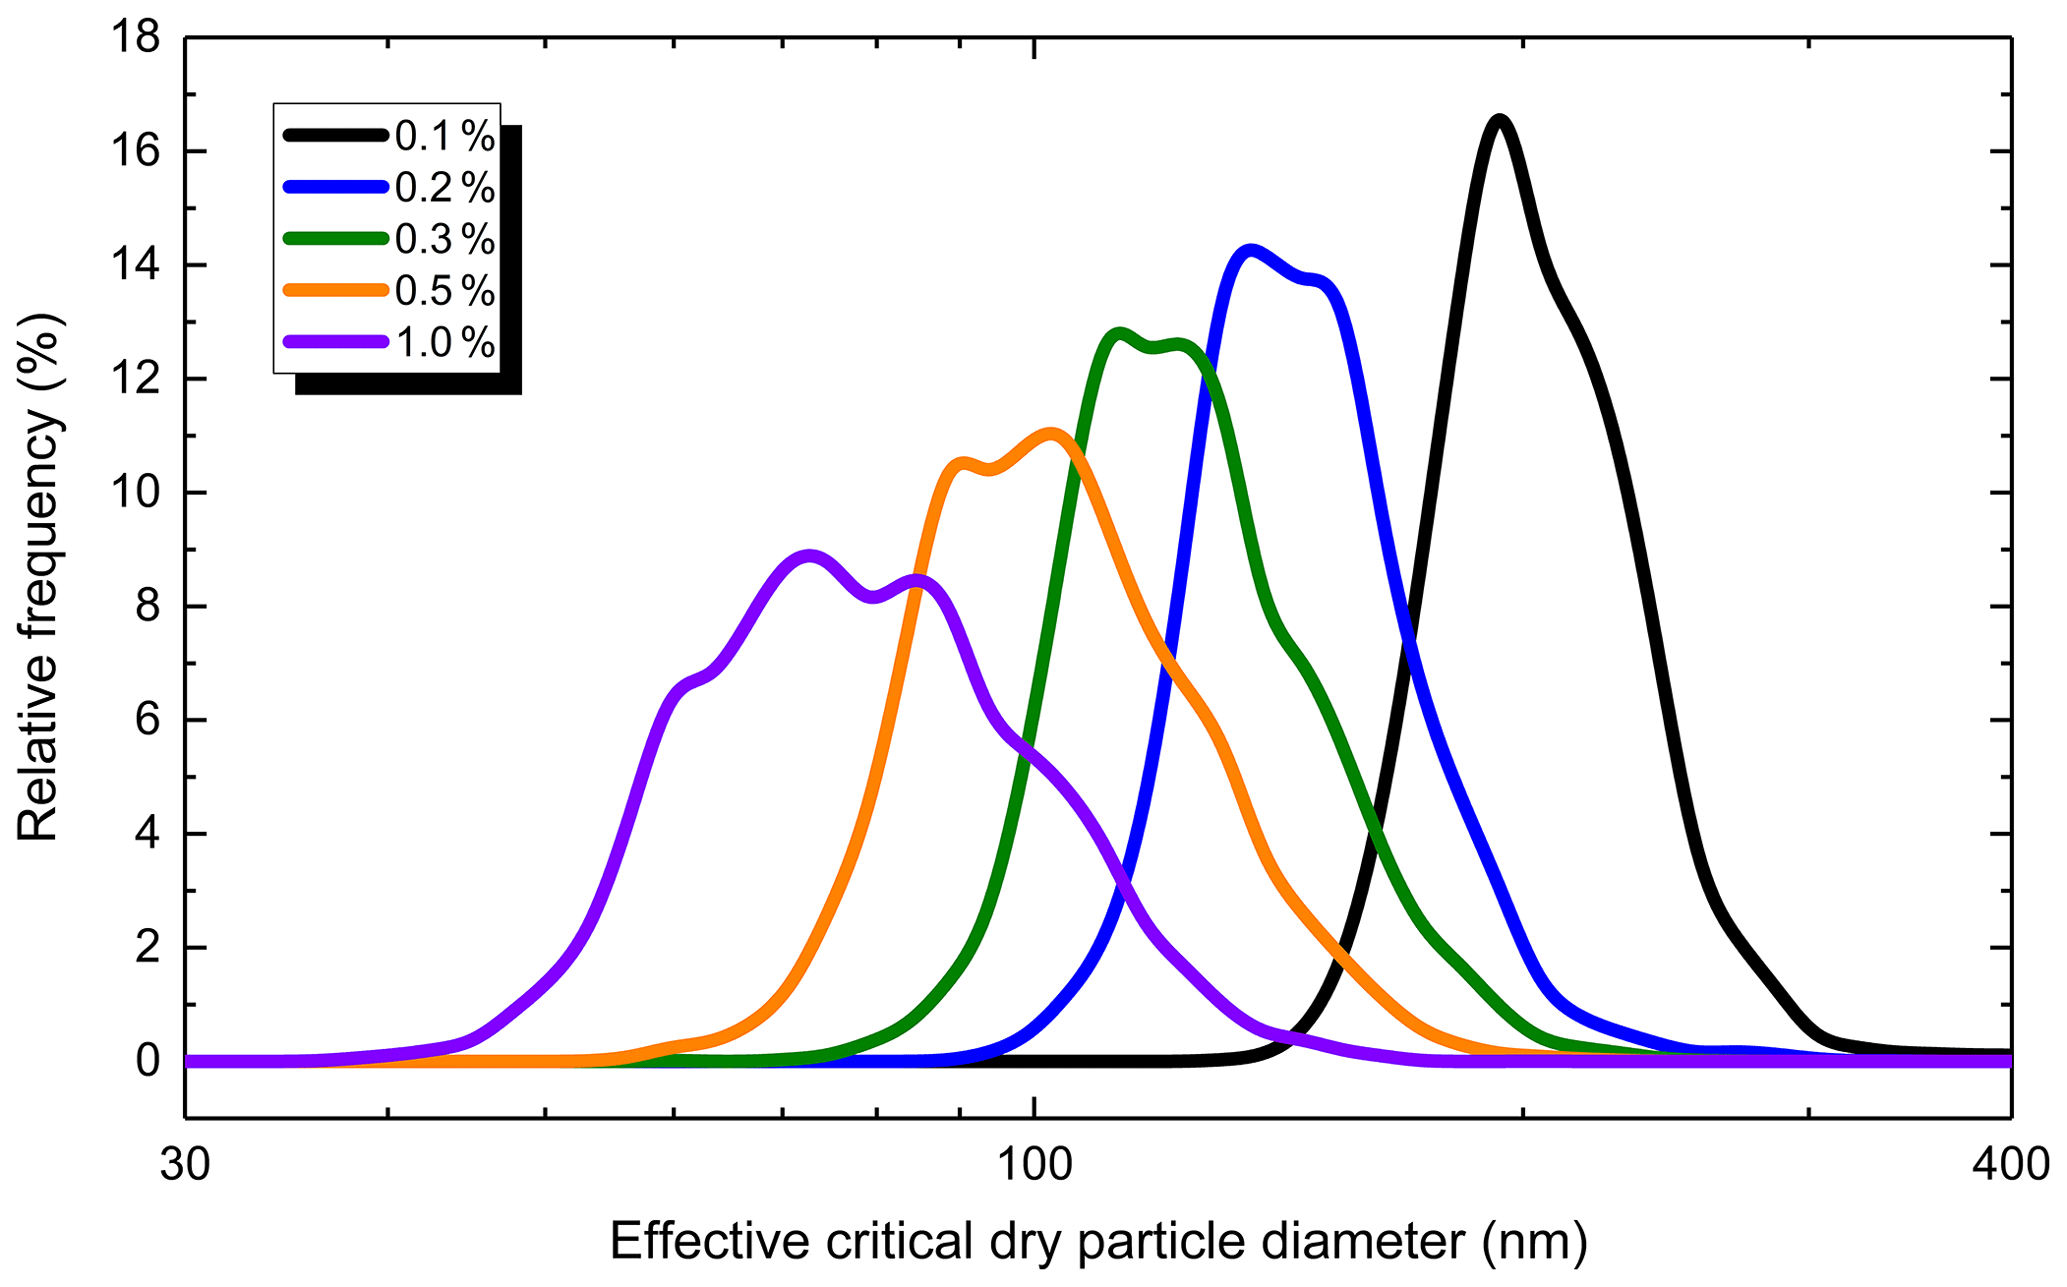
Figure 4Differential frequency distributions of the effective critical dry particle diameter at supersaturations of 0.1 %, 0.2 %, 0.3 %, 0.5 % and 1.0 %; the frequencies are normalised to the total counts of diameter data.
3.4 Seasonal cycling
The time series of the experimental data showed high variability over time. The monthly medians seemed to be advantageous for investigating possible seasonal cycling (Fig. 5). It should be noted that the medians were selected rather than the means and SDs for this task since atmospheric concentrations can be described by lognormal distribution functions (Sect. 3.2). The months were organised into spring (MAM), summer (JJA), autumn (SON) and winter (DJF) seasons. Stricter chronological ordering of the months seems to be more advantageous for source-related or dynamic studies on various timescales.
For each S value considered, the dependencies for the separate variables were similar to each other. Variations were most pronounced with larger S values, which are the least relevant for ambient air. This already indicates that seasonal cycling does not substantially influence aerosol–water vapour interactions under ordinary environmental conditions. The CCN concentrations were somewhat smaller from May to September and somewhat larger in the other months; the minimum was typically in May. These intervals coincided with the non-heating (formally from 15 April to 15 October) and heating (the rest of the year) seasons in Hungary. However, in an exception to this rule, the concentrations in February were unexpectedly small. The AFs were smaller in May (and perhaps also in June) and September (and perhaps also in October) and larger in the other months. A comparison of the seasonal variations in the monthly median NCCN,S and AF to the seasonal variation in the total particle number implied that the seasonal variations in the former two properties were not mainly due to the seasonal variations in the particle number concentration. No obvious dependency of the monthly median dc,eff was established since the seasonal variation in this parameter was featureless. This lack of seasonal cycling meant that the particles in Budapest exhibited more or less similar droplet activation behaviour throughout the year, which differs from what is seen in some non-urban locations (Pringle et al., 2010; Sihto et al., 2011; Paramonov et al., 2013, 2015; Schmale et al., 2018). It should also be noted that the dc,eff values for an S of 0.1 % were segregated somewhat from the dc,eff values for other S values, and that March and April 2020 were unusual in that they coincided with the first outbreak of the COVID-19 pandemic in Hungary. A greater understanding of seasonal dependencies requires longer measurements since the related properties can also be influenced by interannual variability.
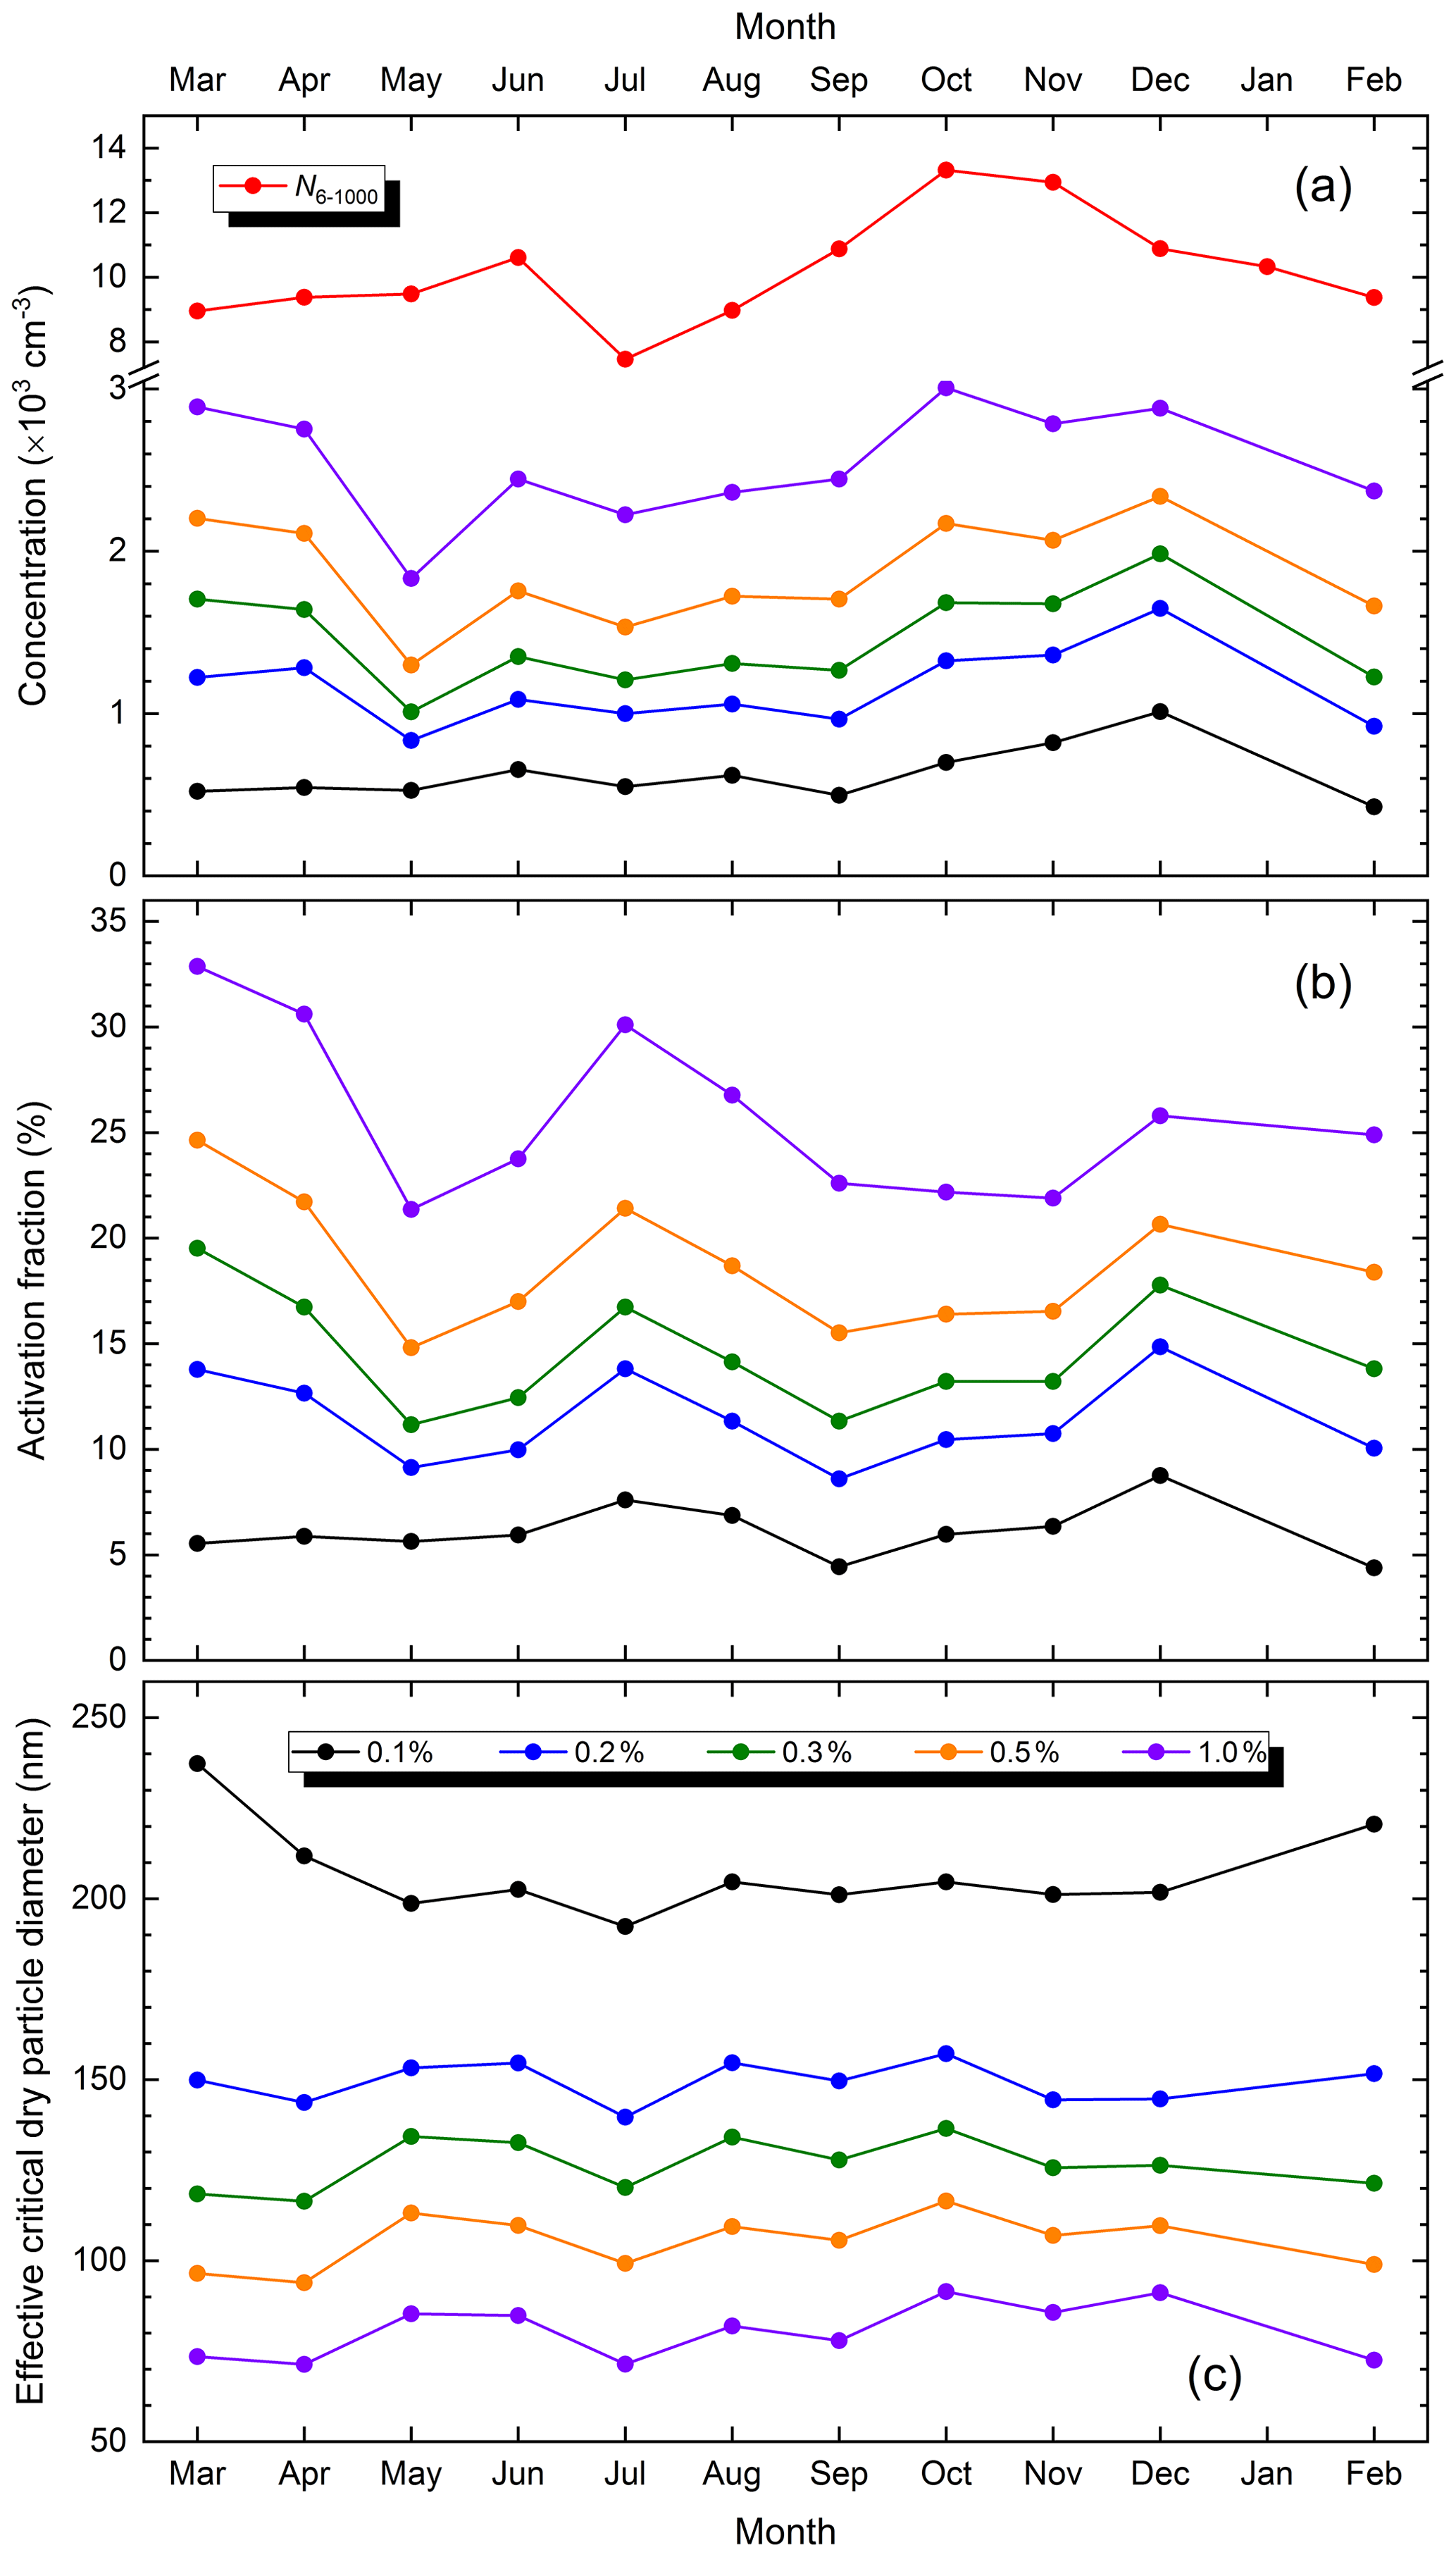
Figure 5Time series of the monthly median CCN concentration and the total particle number concentration (N6–1000) (a), the activation fraction (b) and the effective critical dry particle diameter (c) at supersaturations of 0.1 %, 0.2 %, 0.3 %, 0.5 % and 1.0 %.
Supersaturations of ca. 0.1 % ordinarily occur in warm stratiform clouds, and these S values only activate larger (d>200 nm) particles. The chemical composition of these particles is usually more stable than that of smaller particles over the year due to, for instance, chemical and physical ageing and particle mixing processes. Therefore, it can be concluded that differences in chemical composition do not seem to play a crucial role in cloud activation properties, even in cities.
3.5 Hygroscopicity parameters
The basic statistical measures of the κ values for different S values over the whole measurement year are given in Table 4. All characteristics decreased monotonically and showed a levelling-off tendency with S. The averages implied that, in general, the larger particles exhibited higher hygroscopicity than the smaller particles. When the dc,eff data for each S value were also considered, the present hygroscopicity parameters were found to agree fairly well with the values derived previously from volatility and hygroscopicity tandem differential mobility analyser (VH-TDMA) measurements performed under subsaturated conditions (RH = 90 %) at the same site (Enroth et al., 2018). In that study, the nearly hydrophobic particles exhibited a mean κ value of 0.033. The mode typically contained 69 % of the particles at a dry diameter of 50 nm, and κ seemed to be independent of the particle diameter in the range from 50 to 145 nm. The less hygroscopic particles showed a larger mean κ value of 0.20 and typically contributed 59 % of the particles at 145 nm.
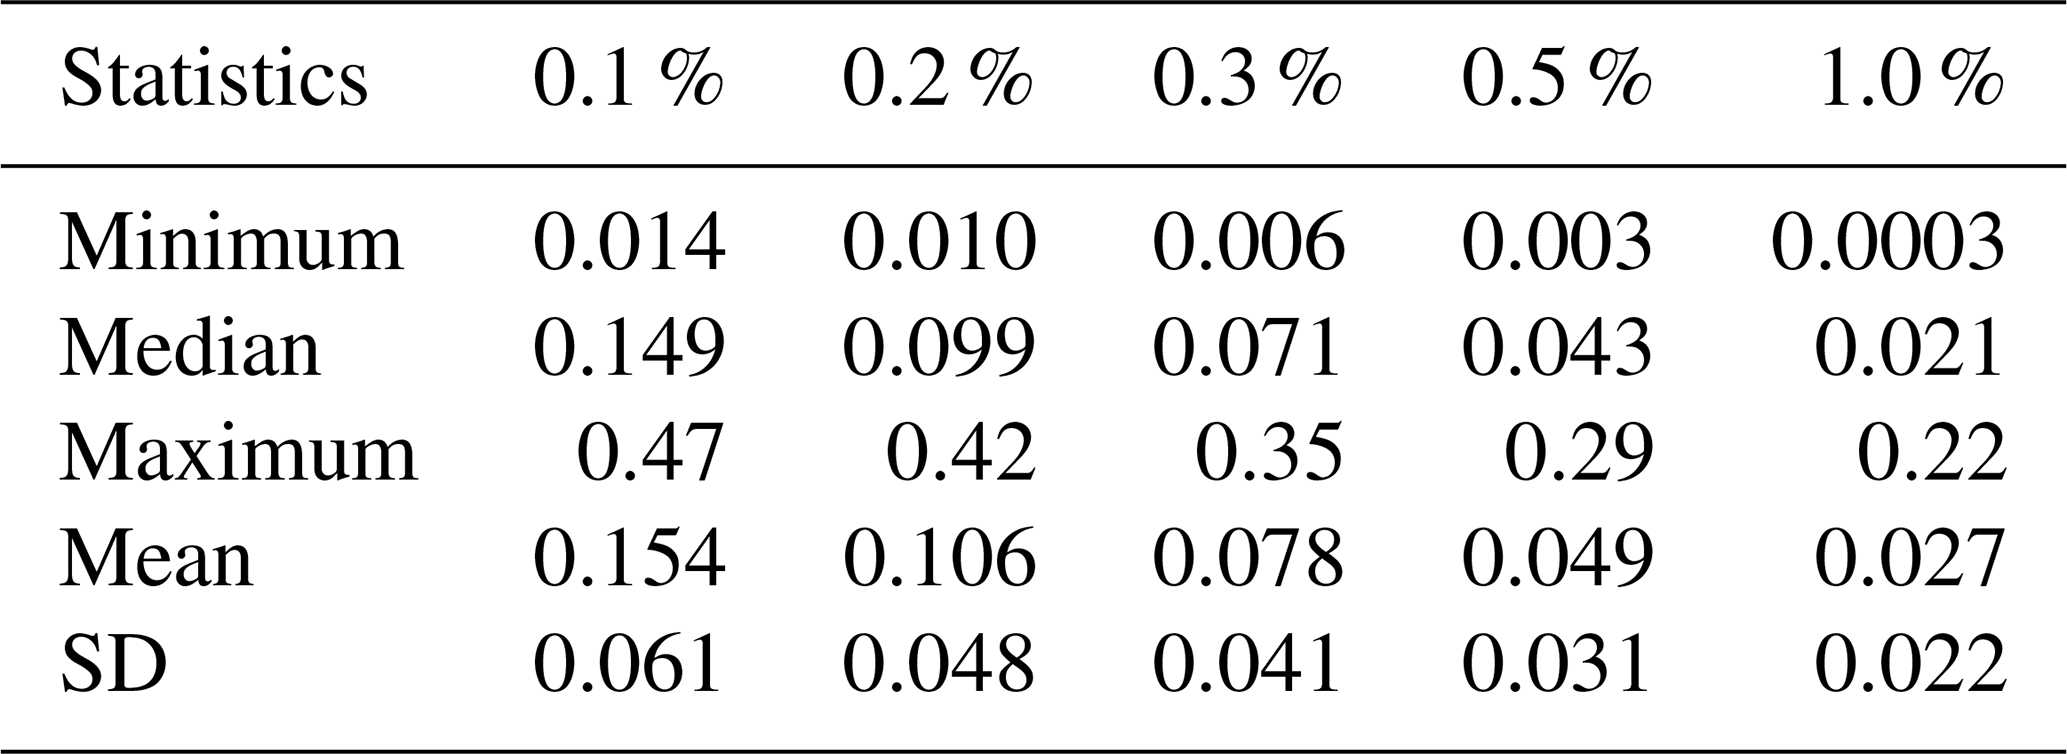
Table 4Ranges, medians and means with SDs of the hygroscopicity parameter at supersaturations of 0.1 %, 0.2 %, 0.3 %, 0.5 % and 1.0 %.
The average κ values were considerably smaller than those in regional or remote locations (Paramonov et al., 2015; Schmale et al., 2018). Only a few hygroscopicity parameters specifically for urban environments have been reported, and even fewer for city centres (Gunthe et al., 2011; Rose et al., 2010, 2011; Meng et al., 2014; Arub et al., 2020). The present data can also be linked to the average or effective hygroscopicity parameters found in field measurements and chamber studies for fresh soot particles (<0.01), for a secondary organic aerosol (approximately 0.10) and for an inorganic aerosol fraction (ca. 0.64) (Rose et al., 2011). These all point to a high abundance of freshly emitted and externally mixed soot particles with very low hygroscopicity in central Budapest.
The range of κ values increased with S and, more importantly, became rather large (a factor of ca. 103 for 1.0 %), even when compared with aerosol properties typically driven by atmospheric dynamics. This can be illustrated by the relationships between κ and dc,eff for different S values (Fig. 6). The data sets create separate lines or narrow stripes with a theoretical slope of −3 over the main range of the variables considered, assuming that the other physicochemical properties such as dwet, Ta, and ρw do not change substantially. The line for an S of 1.0 % bends at low κ and large dc,eff, in accordance with the κ–Köhler model (Eq. 2). It can be seen that the data pairs for a given S level do indeed cover wide intervals of the variables. Such variability in κ suggests that it would be a rough approximation to use a single characteristic value for a given S; an effective κ parameter or κ as a function of particle size would be preferable instead (Paramonov et al., 2015). The average hygroscopicity parameter represents particles with sizes close to the effective critical dry particle diameter. Furthermore, the distribution of the data pairs along each line is not completely symmetric with respect to the median, confirming the fine structure of the frequency distributions (Sect. 3.3). The three characteristic points (the 10th, 50th and 90th percentiles) on the lines indicate a broadening of the frequency distribution with S. Frequency distributions of the hygroscopicity parameter in 71 intervals of width 0.0571 plotted on a logarithmic scale between 10−4 and 100 are shown in Fig. S2. These largely reflect the behaviour and tendencies observed for the effective critical dry particle diameter (Fig. 4), since they were computed using dc,eff.
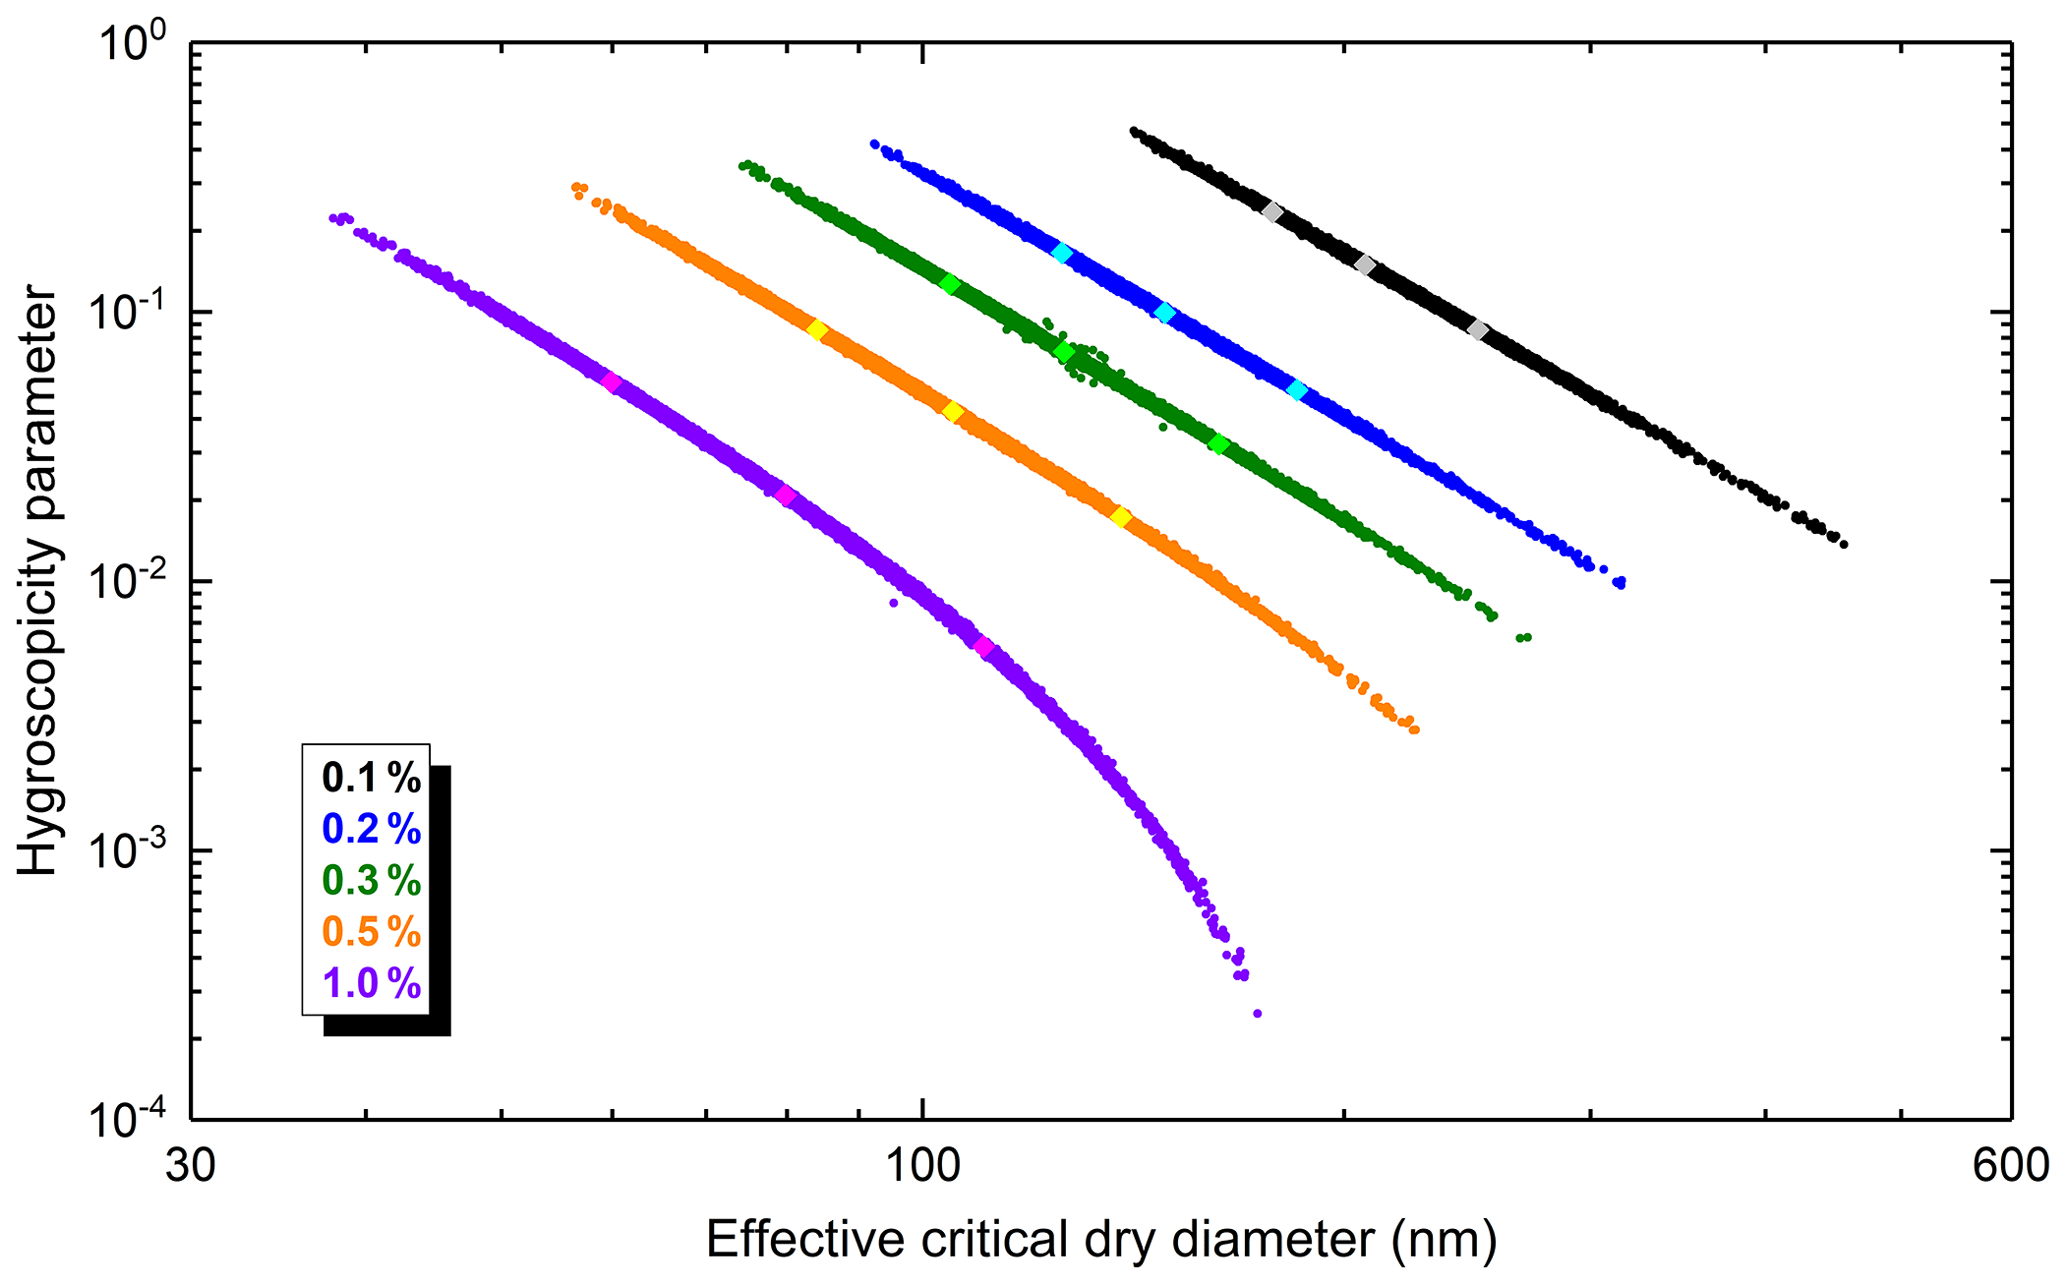
Figure 6Relationship of the hygroscopicity parameter to the effective critical dry particle diameter (dc,eff) derived for supersaturations of 0.1 %, 0.2 %, 0.3 %, 0.5 % and 1.0 %. The three diamond symbols that appear along each line of data represent, in order of increasing dc,eff, the data pairs for the 10th and 90th percentiles, the 50th and 50th percentiles, and the 90th and 10th percentiles.
Concentrations of CCN at various S values and particle number size distributions were measured in parallel in a continental Central European urban environment over the course of 1 year. The effective cloud droplet activation properties of the aerosol population were determined from the available experimental data without measuring the time-resolved chemical composition. The results indicated several distinguishing features of this urban aerosol. The average CCN concentrations were substantially larger and the average effective critical dry particle diameters and activation fractions were systematically considerably smaller than for non-urban sites. Particles with diameters of ca. 130 nm showed relatively low hygroscopicity, and the difference in hygroscopicity between urban aerosol particles and non-urban aerosol particles increased with decreasing particle size. These characteristic features of the urban aerosol are probably related to the high abundance of freshly emitted less-hygroscopic particles, including soot, and to substantial differences in the size-dependent chemical composition and mixing states of particles in cities. The seasonal dependencies of NCCN and the activation fraction at various S values were only weakly influenced by the total particle number concentration. The results achieved here represent the first information of this type for a city in the Carpathian Basin, and contribute to our general knowledge and understanding of urban atmospheric environments.
The measurements were performed at a fixed location in central Budapest that can be regarded as an urban background site. The obtained results and conclusions are representative of the average or overall atmosphere of the city centre. Some urban microenvironments such as kerbside sites, street canyons, road junctions and suburban areas exhibit diverse particle size distributions and chemical compositions, so they would be expected to differ somewhat in the hygroscopic properties of aerosol particles in those environments. Furthermore, some relevant meteorological conditions can vary within the urban canopy due to, for instance, the heat islands that are often realised in large cities. At the same time, the related atmospheric processes likely occur on larger spatial scales than the city itself or its central part. From this point of view, the data derived for the urban background appear to be a sensible starting approximation to reality. Further dedicated studies preferably involving surface measurements, satellite products and modelling could contribute to a greater understanding of the challenging issue of the urban climate.
The water uptake properties of urban aerosol particles under both sub- and supersaturated conditions are increasingly of interest because of their relevance in urban climate considerations and in the modelling of particle deposition in the human respiratory system. The κ values determined here are to be further utilised in health-related studies.
After gaining experience of the operation and calibration of the dual-chamber CCNc measurement system, we plan to extend one of its chambers by using a DMA and CPC setup so that we can perform both polydisperse and monodisperse measurements in parallel, which are expected to supply further valuable knowledge on the mixing states of particles. This is especially important since urban aerosol particles typically comprise externally mixed carbonaceous particles with very distinct hygroscopic properties. This is relevant in general and could also support or facilitate the association of hygroscopicity parameters with major source types in cities and with multistatistical apportionment methods.
The observational data are available from the corresponding author.
The supplement related to this article is available online at: https://doi.org/10.5194/acp-21-11289-2021-supplement.
IS conceived, designed and led the research; WT and AZGy performed the measurements; MV developed the ASL data evaluation software; IS, MV and WT accomplished the data treatment and prepared the figures; IS, WT, MV and AZGy interpreted the results; IS wrote the manuscript, taking into account comments from all the coauthors.
The authors declare that they have no conflict of interest.
Publisher’s note: Copernicus Publications remains neutral with regard to jurisdictional claims in published maps and institutional affiliations.
This research has been supported by the Hungarian Research, Development and Innovation Office (grant no. K132254) and by the European Regional Development Fund and the Hungarian Government (GINOP-2.3.2-15-2016-00028).
This paper was edited by Ivan Kourtchev and reviewed by two anonymous referees.
Andreae, M. O. and Rosenfeld, D.: Aerosol-cloud-precipitation interactions. Part 1. The nature and sources of cloud-active aerosols, Earth Sci. Rev., 89, 13–41, https://doi.org/10.1016/j.earscirev.2008.03.001, 2008.
Andreae, M. O., Jones, C. D., and Cox, P. M.: Strong present-day aerosol cooling implies a hot future, Nature, 435, 1187–1190, https://doi.org/10.1038/nature03671, 2005.
Arub, Z., Bhandari, S., Gani, S., Apte, J. S., Hildebrandt Ruiz, L., and Habib, G.: Air mass physiochemical characteristics over New Delhi: impacts on aerosol hygroscopicity and cloud condensation nuclei (CCN) formation, Atmos. Chem. Phys., 20, 6953–6971, https://doi.org/10.5194/acp-20-6953-2020, 2020.
Burkart, J., Steiner, G., Reischl, G., and Hitzenberger, R.: Longterm study of cloud condensation nuclei (CCN) activation of the atmospheric aerosol in Vienna, Atmos. Environ., 45, 5751–5759, https://doi.org/10.1016/j.atmosenv.2011.07.022, 2011.
Carslaw, K., Lee, L., Reddington, C., Pringle, K., Rap, A., Forster, P., Mann, G., Spracklen, D., Woodhouse, M., and Regayre, L.: Large contribution of natural aerosols to uncertainty in indirect forcing, Nature, 503, 67–71, https://doi.org/10.1038/nature12674, 2013.
Dusek, U., Frank, G. P., Hildebrandt, L, Curtius, J., Schneider, J., Walter, S., Chand, D., Drewnick, F., Hings, S., Jung, D., Bormann, S., and Andreae, M. O.: Size matters more than chemistry for cloud-nucleating ability of aerosol particles, Science, 312, 1375–1378, https://doi.org/10.1126/science.1125261, 2006.
Enroth, J., Mikkilä, J., Németh, Z., Kulmala, M., and Salma, I.: Wintertime hygroscopicity and volatility of ambient urban aerosol particles, Atmos. Chem. Phys., 18, 4533–4548, https://doi.org/10.5194/acp-18-4533-2018, 2018.
Facchini, M. C., Mircea, M., Fuzzi, S., and Charlson, R. J.: Cloud albedo enhancement by surface-active organic solutes in growing droplets, Nature, 401, 257–259, https://doi.org/10.1038/45758, 1999.
Furutani, H., Dall'osto, M., Roberts, G. C., and Prather, K. A.: Assessment of the relative importance of atmospheric aging on CCN activity derived from measurements, Atmos. Environ., 42, 3130–3142, https://doi.org/10.1016/j.atmosenv.2007.09.024, 2008.
Gunthe, S. S., Rose, D., Su, H., Garland, R. M., Achtert, P., Nowak, A., Wiedensohler, A., Kuwata, M., Takegawa, N., Kondo, Y., Hu, M., Shao, M., Zhu, T., Andreae, M. O., and Pöschl, U.: Cloud condensation nuclei (CCN) from fresh and aged air pollution in the megacity region of Beijing, Atmos. Chem. Phys., 11, 11023–11039, https://doi.org/10.5194/acp-11-11023-2011, 2011.
Gysel, M. and Stratmann, F.: WP3 – NA3: In-situ chemical, physical and optical properties of aerosols, Deliverable D3.11: Standardized protocol for CCN measurements, Tech. rep., available at: https://studylib.net/doc/18744398/standardized-protocol-for-long-term-cloud-condensation (last access: 2 April 2021), 2013.
Henning, S., Weingartner, E., Schmidt, S., We11ndisch, M., Gäggeler, H. W., and Baltensperger, U.: Size-dependent aerosol activation at the high-alpine site Jungfraujoch (3580 m a.s.l.), Tellus B, 54, 82–95, https://doi.org/10.3402/tellusb.v54i1.16650, 2002.
Herenz, P., Wex, H., Henning, S., Kristensen, T. B., Rubach, F., Roth, A., Borrmann, S., Bozem, H., Schulz, H., and Stratmann, F.: Measurements of aerosol and CCN properties in the Mackenzie River delta (Canadian Arctic) during spring–summer transition in May 2014, Atmos. Chem. Phys., 18, 4477–4496, https://doi.org/10.5194/acp-18-4477-2018, 2018.
Hudson, J.: Variability of the relationship between particle size and cloud nucleating ability, Geophys. Res. Let., 34, L08801, https://doi.org/10.1029/2006GL028850, 2007.
Jurányi, Z., Gysel, M., Weingartner, E., DeCarlo, P. F., Kammermann, L., and Baltensperger, U.: Measured and modelled cloud condensation nuclei number concentration at the high alpine site Jungfraujoch, Atmos. Chem. Phys., 10, 7891–7906, https://doi.org/10.5194/acp-10-7891-2010, 2010.
Jurányi, Z., Gysel, M., Weingartner, E., Bukowiecki, N., Kammermann, L., and Baltensperger, U.: A 17 month climatology of the cloud condensation nuclei number concentration at the high alpine site Jungfraujoch, J. Geophys. Res.-Atmos., 116, D10204, https://doi.org/10.1029/2010JD015199, 2011.
Kammermann, L., Gysel, M., Weingartner, E., Herich, H., Cziczo, D. J., Holst, T., Svenningsson, B., Arneth, A., and Baltensperger, U.: Subarctic atmospheric aerosol composition: 3. Measured and modeled properties of cloud condensation nuclei, J. Geophys. Res., 115, 04202, https://doi.org/10.1029/2009JD012447, 2010.
Kerminen, V.-M., Paramonov, M., Anttila, T., Riipinen, I., Fountoukis, C., Korhonen, H., Asmi, E., Laakso, L., Lihavainen, H., Swietlicki, E., Svenningsson, B., Asmi, A., Pandis, S. N., Kulmala, M., and Petäjä, T.: Cloud condensation nuclei production associated with atmospheric nucleation: a synthesis based on existing literature and new results, Atmos. Chem. Phys., 12, 12037–12059, https://doi.org/10.5194/acp-12-12037-2012, 2012.
Komppula, M., Lihavainen, H., Kerminen, V.-M., Kulmala, M., and Viisanen, Y.: Measurements of cloud droplet activation of aerosol particle at a clean subarctic background site, J. Geophys. Res., 110, 06204, https://doi.org/10.1029/2004JD005200, 2005.
Kuwata, M. and Kondo Y.: Dependence of size-resolved CCN spectra on the mixing state of nonvolatile cores observed in Tokyo, J. Geophys. Res., 113, 19202, https://doi.org/10.1029/2007JD009761, 2008.
McFiggans, G., Artaxo, P., Baltensperger, U., Coe, H., Facchini, M. C., Feingold, G., Fuzzi, S., Gysel, M., Laaksonen, A., Lohmann, U., Mentel, T. F., Murphy, D. M., O'Dowd, C. D., Snider, J. R., and Weingartner, E.: The effect of physical and chemical aerosol properties on warm cloud droplet activation, Atmos. Chem. Phys., 6, 2593–2649, https://doi.org/10.5194/acp-6-2593-2006, 2006.
Merikanto, J., Spracklen, D. V., Mann, G. W., Pickering, S. J., and Carslaw, K. S.: Impact of nucleation on global CCN, Atmos. Chem. Phys., 9, 8601–8616, https://doi.org/10.5194/acp-9-8601-2009, 2009.
Mikkonen, S., Németh, Z., Varga, V., Weidinger, T., Leinonen, V., Yli-Juuti, T., and Salma, I.: Decennial time trends and diurnal patterns of particle number concentrations in a central European city between 2008 and 2018, Atmos. Chem. Phys., 20, 12247–12263, https://doi.org/10.5194/acp-20-12247-2020, 2020.
Meng, J. W., Yeung, M. C., Li, Y. J., Lee, B. Y. L., and Chan, C. K.: Size-resolved cloud condensation nuclei (CCN) activity and closure analysis at the HKUST Supersite in Hong Kong, Atmos. Chem. Phys., 14, 10267–10282, https://doi.org/10.5194/acp-14-10267-2014, 2014.
Ovadnevaite, J., Zuend, A., Laaksonen, A., Sanchez, K. J., Roberts, G., Ceburnis, D., Decesari, S., Rinaldi, M., Hodas, N., Facchini, M. C., Seinfeld, J. H., and O'Dowd, C.: Surface tension prevails over solute effect in organic-influenced cloud droplet activation, Nature, 546, 637–641, https://doi.org/10.1038/nature22806, 2017.
Paramonov, M., Aalto, P. P., Asmi, A., Prisle, N., Kerminen, V.-M., Kulmala, M., and Petäjä, T.: The analysis of size-segregated cloud condensation nuclei counter (CCNC) data and its implications for cloud droplet activation, Atmos. Chem. Phys., 13, 10285–10301, https://doi.org/10.5194/acp-13-10285-2013, 2013.
Paramonov, M., Kerminen, V.-M., Gysel, M., Aalto, P. P., Andreae, M. O., Asmi, E., Baltensperger, U., Bougiatioti, A., Brus, D., Frank, G. P., Good, N., Gunthe, S. S., Hao, L., Irwin, M., Jaatinen, A., Jurányi, Z., King, S. M., Kortelainen, A., Kristensson, A., Lihavainen, H., Kulmala, M., Lohmann, U., Martin, S. T., McFiggans, G., Mihalopoulos, N., Nenes, A., O'Dowd, C. D., Ovadnevaite, J., Petäjä, T., Pöschl, U., Roberts, G. C., Rose, D., Svenningsson, B., Swietlicki, E., Weingartner, E., Whitehead, J., Wiedensohler, A., Wittbom, C., and Sierau, B.: A synthesis of cloud condensation nuclei counter (CCNC) measurements within the EUCAARI network, Atmos. Chem. Phys., 15, 12211–12229, https://doi.org/10.5194/acp-15-12211-2015, 2015.
Petters, M. D. and Kreidenweis, S. M.: A single parameter representation of hygroscopic growth and cloud condensation nucleus activity, Atmos. Chem. Phys., 7, 1961–1971, https://doi.org/10.5194/acp-7-1961-2007, 2007.
Pringle, K. J., Tost, H., Pozzer, A., Pöschl, U., and Lelieveld, J.: Global distribution of the effective aerosol hygroscopicity parameter for CCN activation, Atmos. Chem. Phys., 10, 5241–5255, https://doi.org/10.5194/acp-10-5241-2010, 2010.
Pruppacher, H. R. and Klett, J. D.: Microphysics of clouds and precipitation, Kluwer, Dordrecht, https://doi.org/10.1007/978-0-306-48100-0, 2000.
Rissler, J., Svenningsson, B., Fors, E. O., Bilde, M., and Swietlicki, E.: An evaluation and comparison of cloud condensation nucleus activity models: Predicting particle critical saturation from growth at subsaturation, J. Geophys. Res., 115, 22208, https://doi.org/10.1029/2010JD014391, 2010.
Roberts, G. and Nenes, A.: A continuous-flow streamwise thermal-gradient CCN chamber for atmospheric measurements, Aerosol Sci. Tech., 39, 206–221, https://doi.org/10.1080/027868290913988, 2005.
Rose, D., Gunthe, S. S., Mikhailov, E., Frank, G. P., Dusek, U., Andreae, M. O., and Pöschl, U.: Calibration and measurement uncertainties of a continuous-flow cloud condensation nuclei counter (DMT-CCNC): CCN activation of ammonium sulfate and sodium chloride aerosol particles in theory and experiment, Atmos. Chem. Phys., 8, 1153–1179, https://doi.org/10.5194/acp-8-1153-2008, 2008.
Rose, D., Nowak, A., Achtert, P., Wiedensohler, A., Hu, M., Shao, M., Zhang, Y., Andreae, M. O., and Pöschl, U.: Cloud condensation nuclei in polluted air and biomass burning smoke near the mega-city Guangzhou, China – Part 1: Size-resolved measurements and implications for the modeling of aerosol particle hygroscopicity and CCN activity, Atmos. Chem. Phys., 10, 3365–3383, https://doi.org/10.5194/acp-10-3365-2010, 2010.
Rose, D., Gunthe, S. S., Su, H., Garland, R. M., Yang, H., Berghof, M., Cheng, Y. F., Wehner, B., Achtert, P., Nowak, A., Wiedensohler, A., Takegawa, N., Kondo, Y., Hu, M., Zhang, Y., Andreae, M. O., and Pöschl, U.: Cloud condensation nuclei in polluted air and biomass burning smoke near the mega-city Guangzhou, China – Part 2: Size-resolved aerosol chemical composition, diurnal cycles, and externally mixed weakly CCN-active soot particles, Atmos. Chem. Phys., 11, 2817–2836, https://doi.org/10.5194/acp-11-2817-2011, 2011.
Rosenfeld, D., Lohmann, U., Raga, G. B., O'Dowd, C. D., Kulmala, M., Fuzzi, S., Reissell, A., and Andreae, M. O.: Flood or drought: How do aerosols affect precipitations?, Science, 321, 1309–1313, https://doi.org/10.1126/science.1160606, 2008.
Rosenfeld, D., Andreae, M. O., Asmi, A., Chin, M., de Leeuw, G., Donovan, D. P., Kahn, R., Kinne, S., Kivekäs, N., Kulmala, M., Lau, W., Schmidt, K. S., Suni, T., Wagner, T., and Wild, M.: Global observations of aerosol-cloud-precipitation-climate interactions, Rev. Geophys., 52, 750–808, https://doi.org/10.1002/2013RG000441, 2014.
Salma, I., Ocskay, R., Varga, I., and Maenhaut, W.: Surface tension of atmospheric humic-like substances in connection with relaxation, dilution, and solution pH, J. Geophys. Res., 111, D23205, https://doi.org/10.1029/2005JD007015, 2006.
Salma, I., Ocskay, R., Chi, X., and Maenhaut, W.: Sampling artefacts, concentration and chemical composition of fine water-soluble organic carbon and humic-like substances in a continental urban atmospheric environment, Atmos. Environ., 41, 4106–4118, https://doi.org/10.1016/j.atmosenv.2007.01.027, 2007.
Salma, I., Borsós, T., Weidinger, T., Aalto, P., Hussein, T., Dal Maso, M., and Kulmala, M.: Production, growth and properties of ultrafine atmospheric aerosol particles in an urban environment, Atmos. Chem. Phys., 11, 1339–1353, https://doi.org/10.5194/acp-11-1339-2011, 2011.
Salma, I., Borsós, T., Németh, Z., Weidinger, T., Aalto, T., and Kulmala, M.: Comparative study of ultrafine atmospheric aerosol within a city, Atmos. Environ., 92, 154–161, https://doi.org/10.1016/j.atmosenv.2014.04.020, 2014.
Salma, I., Németh, Z., Weidinger, T., Kovács, B., and Kristóf, G.: Measurement, growth types and shrinkage of newly formed aerosol particles at an urban research platform, Atmos. Chem. Phys., 16, 7837–7851, https://doi.org/10.5194/acp-16-7837-2016, 2016.
Salma, I., Varga, V., and Németh, Z.: Quantification of an atmospheric nucleation and growth process as a single source of aerosol particles in a city, Atmos. Chem. Phys., 17, 15007–15017, https://doi.org/10.5194/acp-17-15007-2017, 2017.
Salma, I., Vasanits-Zsigrai, A., Machon, A., Varga, T., Major, I., Gergely, V., and Molnár, M.: Fossil fuel combustion, biomass burning and biogenic sources of fine carbonaceous aerosol in the Carpathian Basin, Atmos. Chem. Phys., 20, 4295–4312, https://doi.org/10.5194/acp-20-4295-2020, 2020a.
Salma, I., Vörösmarty, M., Gyöngyösi, A. Z., Thén, W., and Weidinger, T.: What can we learn about urban air quality with regard to the first outbreak of the COVID-19 pandemic? A case study from central Europe, Atmos. Chem. Phys., 20, 15725–15742, https://doi.org/10.5194/acp-20-15725-2020, 2020b.
Schmale, J., Henning, S., Henzing, B., Keskinen, H., Sellegri, K., Ovadnevaite, J., Bougiatioti, A., Kalivitis, N., Stavroulas, I., Jefferson, A., Park, M., Schlag, P., Kristensson, A., Iwamoto, Y., Pringle, K., Reddington, C., Aalto, P., Äijälä, M., Baltensperger, U., Bialek, J., Birmili, W., Bukowiecki, N., Ehn, M., Fjæraa, A. M., Fiebig, M., Frank, G., Fröhlich, R., Frumau, A., Furuya, M., Hammer, E., Heikkinen, L., Herrmann, E., Holzinger, R., Hyono, H., Kanakidou, M., Kiendler-Scharr, A., Kinouchi, K., Kos, G., Kulmala, M., Mihalopoulos, N., Motos, G., Nenes, A., O'Dowd, C., Paramonov, M., Petäjä, T., Picard, D., Poulain, L., Prévôt, A. S. H., Slowik, J., Sonntag, A., Swietlicki, E., Svenningsson, B., Tsurumaru, H., Wiedensohler, A., Wittbom, C., Ogren, J. A., Matsuki, A., Yum, S. S., Myhre, C. L., Carslaw, K., Stratmann, F., and Gysel, M.: Collocated observations of cloud condensation nuclei, particle size distributions, and chemical composition, Sci. Data, 4, 170003, https://doi.org/10.1038/sdata.2017.3, 2017.
Schmale, J., Henning, S., Decesari, S., Henzing, B., Keskinen, H., Sellegri, K., Ovadnevaite, J., Pöhlker, M. L., Brito, J., Bougiatioti, A., Kristensson, A., Kalivitis, N., Stavroulas, I., Carbone, S., Jefferson, A., Park, M., Schlag, P., Iwamoto, Y., Aalto, P., Äijälä, M., Bukowiecki, N., Ehn, M., Frank, G., Fröhlich, R., Frumau, A., Herrmann, E., Herrmann, H., Holzinger, R., Kos, G., Kulmala, M., Mihalopoulos, N., Nenes, A., O'Dowd, C., Petäjä, T., Picard, D., Pöhlker, C., Pöschl, U., Poulain, L., Prévôt, A. S. H., Swietlicki, E., Andreae, M. O., Artaxo, P., Wiedensohler, A., Ogren, J., Matsuki, A., Yum, S. S., Stratmann, F., Baltensperger, U., and Gysel, M.: Long-term cloud condensation nuclei number concentration, particle number size distribution and chemical composition measurements at regionally representative observatories, Atmos. Chem. Phys., 18, 2853–2881, https://doi.org/10.5194/acp-18-2853-2018, 2018.
Sihto, S.-L., Mikkilä, J., Vanhanen, J., Ehn, M., Liao, L., Lehtipalo, K., Aalto, P. P., Duplissy, J., Petäjä, T., Kerminen, V.-M., Boy, M., and Kulmala, M.: Seasonal variation of CCN concentrations and aerosol activation properties in boreal forest, Atmos. Chem. Phys., 11, 13269–13285, https://doi.org/10.5194/acp-11-13269-2011, 2011.
Sorjamaa, R., Svenningsson, B., Raatikainen, T., Henning, S., Bilde, M., and Laaksonen, A.: The role of surfactants in Köhler theory reconsidered, Atmos. Chem. Phys., 4, 2107–2117, https://doi.org/10.5194/acp-4-2107-2004, 2004.
Topping, D. O. and McFiggans, G.: Tight coupling of particle size, number and composition in atmospheric cloud droplet activation, Atmos. Chem. Phys., 12, 3253–3260, https://doi.org/10.5194/acp-12-3253-2012, 2012.
Wex, H., McFiggans, G., Henning, S., and Stratmann, F.: Influence of the external mixing state of atmospheric aerosol on derived CCN number concentrations, Geophys. Res. Lett., 37, 10805, https://doi.org/10.1029/2010GL043337, 2010.
Wiedensohler, A., Birmili, W., Nowak, A., Sonntag, A., Weinhold, K., Merkel, M., Wehner, B., Tuch, T., Pfeifer, S., Fiebig, M., Fjäraa, A. M., Asmi, E., Sellegri, K., Depuy, R., Venzac, H., Villani, P., Laj, P., Aalto, P., Ogren, J. A., Swietlicki, E., Williams, P., Roldin, P., Quincey, P., Hüglin, C., Fierz-Schmidhauser, R., Gysel, M., Weingartner, E., Riccobono, F., Santos, S., Grüning, C., Faloon, K., Beddows, D., Harrison, R., Monahan, C., Jennings, S. G., O'Dowd, C. D., Marinoni, A., Horn, H.-G., Keck, L., Jiang, J., Scheckman, J., McMurry, P. H., Deng, Z., Zhao, C. S., Moerman, M., Henzing, B., de Leeuw, G., Löschau, G., and Bastian, S.: Mobility particle size spectrometers: harmonization of technical standards and data structure to facilitate high quality long-term observations of atmospheric particle number size distributions, Atmos. Meas. Tech., 5, 657–685, https://doi.org/10.5194/amt-5-657-2012, 2012.