the Creative Commons Attribution 4.0 License.
the Creative Commons Attribution 4.0 License.
 | 20 Jul 2021
On the drivers of droplet variability in alpine mixed-phase clouds
Paraskevi Georgakaki
Aikaterini Bougiatioti
Jörg Wieder
Claudia Mignani
Fabiola Ramelli
Zamin A. Kanji
Jan Henneberger
Maxime Hervo
Alexis Berne
Ulrike Lohmann
Athanasios Nenes
Droplet formation provides a direct microphysical link between aerosols and clouds (liquid or mixed-phase), and its adequate description poses a major challenge for any atmospheric model. Observations are critical for evaluating and constraining the process. To this end, aerosol size distributions, cloud condensation nuclei (CCN), hygroscopicity, and lidar-derived vertical velocities were observed in alpine mixed-phase clouds during the Role of Aerosols and Clouds Enhanced by Topography on Snow (RACLETS) field campaign in the Davos, Switzerland, region during February and March 2019. Data from the mountain-top site of Weissfluhjoch (WFJ) and the valley site of Davos Wolfgang are studied. These observations are coupled with a state-of-the-art droplet activation parameterization to investigate the aerosol–cloud droplet link in mixed-phase clouds. The mean CCN-derived hygroscopicity parameter, κ, at WFJ ranges between 0.2–0.3, consistent with expectations for continental aerosols. κ tends to decrease with size, possibly from an enrichment in organic material associated with the vertical transport of fresh ultrafine particle emissions (likely from biomass burning) from the valley floor in Davos. The parameterization provides a droplet number that agrees with observations to within ∼ 25 %. We also find that the susceptibility of droplet formation to aerosol concentration and vertical velocity variations can be appropriately described as a function of the standard deviation of the distribution of updraft velocities, σw, as the droplet number never exceeds a characteristic limit, termed the “limiting droplet number”, of ∼ 150–550 cm−3, which depends solely on σw. We also show that high aerosol levels in the valley, most likely from anthropogenic activities, increase the cloud droplet number, reduce cloud supersaturation (< 0.1 %), and shift the clouds to a state that is less susceptible to changes in aerosol concentrations and very sensitive to vertical velocity variations. The transition from an aerosol to velocity-limited regime depends on the ratio of cloud droplet number to the limiting droplet number, as droplet formation becomes velocity limited when this ratio exceeds 0.65. Under such conditions, droplet size tends to be minimal, reducing the likelihood that large drops are present that would otherwise promote glaciation through rime splintering and droplet shattering. Identifying regimes where droplet number variability is dominated by dynamical – rather than aerosol – changes is key for interpreting and constraining when and which types of aerosol effects on clouds are active.
- Article
(7264 KB) - Full-text XML
-
Supplement
(1197 KB) - BibTeX
- EndNote


Orographic clouds and the precipitation they generate play a major role in alpine weather and climate (e.g., Roe, 2005; Grubisic and Billings, 2008; Saleeby et al., 2013; Vosper et al., 2013; Lloyd et al., 2015). The formation and evolution of orographic clouds involves a rich set of interactions at different spatial and temporal scales encompassing fluid dynamics, cloud microphysics, and orography (Roe, 2005; Rotunno and Houze, 2007). Atmospheric aerosol particles modulate the microphysical characteristics of orographic clouds by serving as cloud condensation nuclei (CCN) that form droplets or ice nucleating particles (INPs) that form ice crystals (e.g., Pruppacher and Klett, 1980; Muhlbauer and Lohmann, 2009; Zubler et al., 2011; Saleeby et al., 2013).
Emissions of aerosol particles acting as CCN and INPs can affect the microphysical and radiative properties of clouds with strong (but highly uncertain) effects on local and regional climate (IPCC, 2013; Seinfeld et al., 2016). Aerosol interactions with orographic clouds are subject to even larger uncertainties, owing in part to the complex flows generated by the interaction of the large-scale flow with the mesoscale orographic lifting and condensation and complex anisotropic turbulent air motions that arise (Roe, 2005; Smith, 2006; Rotunno and Houze, 2007). Most importantly, orographic clouds are often mixed-phase clouds (MPCs), which are characterized by the simultaneous presence of supercooled liquid water droplets and ice crystals (Lloyd et al., 2015; Farrington et al., 2016; Lohmann et al., 2016; Henneberg et al., 2017). MPCs remain one of the least understood cloud types, due to the multiple and highly nonlinear cloud microphysical pathways that can affect their properties and evolution. MPCs tend to glaciate (i.e., transition to pure ice clouds) over time because of the Bergeron–Findeisen process, which is the rapid growth of ice crystals at the expense of the evaporating cloud droplets, owing to the higher saturation vapor pressure of liquid water over ice (Bergeron, 1935; Findeisen, 1938). Aerosol concentrations may also alter the microphysical pathways active in MPCs and ultimately drive their glaciation state. For instance, an increase in CCN concentrations leads to more numerous and smaller cloud droplets, reducing the riming efficiency of ice crystals and therefore the hydrometeor crystal mass and the amount of precipitation (Lohmann and Feichter, 2005; Lance et al., 2011; Lohmann, 2017). This mechanism counters the glaciation indirect effect, where increases in INP concentrations elevate ice crystal number concentration (ICNC) and promotes the conversion of liquid water to ice and therefore the amount of ice-phase precipitation (Lohmann, 2002). Increases in CCN can also decrease cloud droplet radius and impede cloud glaciation, owing to reductions in secondary ice production (SIP), which includes rime splintering, collisional break-up, and droplet shattering (Field et al., 2017; Sotiropoulou et al., 2020, 2021).
Cloud-scale updraft velocity (i.e., the part of the vertical velocity spectrum with positive values) is the major driver of droplet formation, owing to the supersaturation generated from adiabatic expansion and cooling (e.g., Nenes et al., 2001; Ghan et al., 2011). Despite its importance, the simulation of updraft velocity by atmospheric models is rarely constrained by observations, which can lead to large uncertainties in climate and numerical weather prediction models (Sullivan et al., 2016, 2018). Reutter et al. (2009) pointed out that droplet formation in clouds can be limited by the amount of CCN present (called the “aerosol-limited” regime) or by the vertical velocity that generates supersaturation in the cloudy updrafts (called the “velocity-limited” regime). Over the complex alpine terrain, vertical motions can be significantly shaped by the effects of orography (Lohmann et al., 2016). Orographic MPCs have been frequently observed in the Swiss Alps under high updraft velocity conditions, where supersaturation with respect to liquid water is formed faster than it is depleted by diffusional and collisional ice growth processes (Korolev and Isaac, 2003) leading to persistent MPCs (Lohmann et al., 2016).
Given the importance of droplet number for the radiative cloud properties and microphysical evolution of alpine MPCs, it is essential to understand the main aerosol and dynamics properties that drive droplet formation. A limited number of studies exist that discuss this very important topic, although they focus on liquid-phase clouds (Hammer et al., 2014, 2015; Hoyle et al., 2016). Hoyle et al. (2016) showed that 79 % of the variance in droplet number in warm clouds formed at the high-altitude research station of Jungfraujoch in the Swiss Alps (3450 m a.s.l.) is driven by variations in potential CCN concentration (i.e., aerosol particles with a dry diameter > 80 nm). Using a cloud parcel model, Hammer et al. (2015) also investigated the influence of updraft velocity, particle concentration, and hygroscopicity on liquid cloud formation in the alpine region and found that variations in vertical wind velocity have the strongest influence on the aerosol activation. We are not aware of existing in situ studies assessing cloud droplet closure in MPCs where the existence of ice crystals can deplete supersaturation or the low temperatures may decrease CCN activity through the formation of glassy aerosols.
Here we analyze observational data collected as part of the Role of Aerosols and Clouds Enhanced by Topography on Snow (RACLETS) field campaign, which was held in the region of Davos, Switzerland, during February and March 2019. This intensive field campaign aims to address questions related to the modulators of orographic precipitation, the drivers of the enhanced ice-crystal number concentrations observed in MPCs, as well as the human-caused pollution effects on cloud microphysical and optical properties. In this study we focus on a two-week period and seek to unravel the complex aerosol–droplet–updraft velocity interactions that occur in the orographic MPCs. For this, we combine CCN number concentrations with the particle size distributions to understand the variations in hygroscopicity over time and for sites located in the valley and a nearby mountain-top site. The in situ measurements are subsequently coupled with a state-of-the-art droplet parameterization to determine the potential droplet numbers and the corresponding maximum supersaturation achieved in cloudy updrafts. The predicted droplet numbers are evaluated against direct observations and the degree to which droplet formation is velocity or aerosol limited is determined for the whole time series.
2.1 Observational datasets
This analysis utilizes measurements collected during the RACLETS campaign, which took place from 8 February to 28 March 2019 (https://www.envidat.ch/group/about/raclets-field-campaign, last access: 17 December 2020) (Mignani et al., 2021; Ramelli et al., 2021a, b; Lauber et al., 2021). This joint research project offers a unique dataset of orographic clouds, precipitation, and snow measurements in an effort to shed light on some fundamental microphysical processes present in subsequent stages of the life cycle of clouds (i.e., cloud formation, precipitation onset, and cloud dissipation). All measurements presented in this paper were performed at two distinct observation stations near Davos, Switzerland (Fig. S1 in the Supplement). A measurement site is located at Davos Wolfgang, which is the pass between Davos (1560 m a.s.l.) in the south and Klosters (1200 m a.s.l.) in the north and is otherwise known as Wolfgang Pass (WOP; 1630 m a.s.l., 46∘50′08.076′′ N, 9∘51′12.939′′ E). Measurements were also conducted at the mountain-top station Weissfluhjoch (WFJ; 2700 m a.s.l., 46∘49′58.670′′ N, 9∘48′23.309′′ E), which is located ∼ 1 km above the valley floor in Davos, in the eastern part of the Swiss Alps. The current study primarily focuses on data collected during a two-week period of interest, which spans from 24 February to 8 March 2019. During the RACLETS campaign, a defective sheath air filter affected the CCN measurements collected at WFJ, thus inhibiting data usage from the instrument for a large duration of the campaign. Therefore, we limit our analysis to the abovementioned period when the CCN counter was fully operational. In addition, during the selected period two distinct weather patterns were observed (fair weather conditions interrupted by a precipitating period), allowing for a contrasting analysis of the observed scenarios. The following description refers to the measurements that provided the basis for the present analysis (see Table 1).
Table 1Overview of data sources from the RACLETS campaign used for this study. Along with the observed parameters, the corresponding instrumentation, measurements range, and time resolutions are listed.
2.1.1 Aerosol particle size distribution measurements
Particle size distributions were continuously monitored at WOP and WFJ using commercially available scanning mobility particle sizers (SMPS; Model 3938, TSI Inc., US). At both stations, the systems consisted of a differential mobility analyzer (Model 3081, TSI Inc., US), a soft X-ray neutralizer (Model 3088, TSI Inc., US), and a water-based condensation particle counter (Model 3787 at WOP, Model 3788 at WFJ, TSI Inc., US). Running the particle counters in low-flow mode (0.6 L min−1), using a sheath flow of 5.4 L min−1, and applying a total scanning time of 2 min (scan time: 97 s; retrace time: 3 s; purge time: 10 s), particle size distributions between 11.5 and 469.8 nm diameter were monitored.
2.1.2 CCN measurements
A Droplet Measurement Technologies (DMT) single-column continuous-flow streamwise thermal gradient chamber (CFSTGC; Roberts and Nenes, 2005) was used to carry out in situ measurements of CCN number concentrations for different supersaturations (SS). The CFSTGC consists of a cylindrical flow tube with wetted walls, inside which SS is developed by applying a linear streamwise temperature gradient between the column top and bottom. Owing to the greater mass diffusivity of water vapor than the thermal diffusivity of air, a constant and controlled SS is generated with a maximum at the centerline of the flow tube. The SS is mainly dependent on the applied temperature gradient, flow rate and pressure (Roberts and Nenes, 2005). An aerosol sample flow is introduced at the column centerline and those particles having a critical supersaturation lower than the instrument SS will activate to form droplets and will afterward be counted and sized by an optical particle counter (OPC) located at the base of the CFSTGC column. The SS developed within the instrument responds linearly to changes in pressure, since its operation relies on the difference between heat and mass diffusivity. Calibration of the instrument, which determines the output supersaturation, was performed by the manufacturer at ∼ 800 mbar, while throughout the campaign the CFSTGC was operating at a lower pressure ∼ 735 mbar, therefore the SS reported by the instrument is adjusted by a factor of , which accounts for the difference between the ambient and the calibration pressure (Roberts and Nenes, 2005). CCN concentrations were measured at a specific SS for approximately 10 min; the instrument was cycled between six discrete values ranging from 0.09 % to 0.74 % supersaturations, producing a full spectrum every hour. Each 10 min segment of the raw CCN data is filtered to discount periods of transient operation (during supersaturation changes) and whenever the room temperature housing the instrument changed sufficiently to induce a reset in column temperature (the instrument control software always sets the column temperature to be at least 1.5∘ above the room temperature to exclude spurious supersaturation generation in the column inlet). The CFSTGC was deployed on the mountain-top site of WFJ with the intention of relating the CCN measurements directly to the size distribution and total aerosol concentration data measured by the SMPS instrument at the same station.
2.1.3 Cloud microphysical measurements
In situ observations of the cloud microphysical properties were obtained with the tethered balloon system HoloBalloon (Ramelli et al., 2020). The main component of the measurement platform is the holographic cloud imager HOLIMO 3B, which uses digital in-line holography to image an ensemble of cloud particles in the size range from 6 µm to 2 mm diameter in a three-dimensional detection volume. Note that particles smaller than 6 µm are not detected by HOLIMO, which means that the droplet number concentration may be underestimated. Based on a set of two-dimensional images, information about the particle position, size, and shape can be obtained. The detected particles can be classified as cloud droplets and ice crystals using supervised machine learning (Fugal et al., 2009; Touloupas et al., 2020). The differentiation between cloud droplets (circular) and ice crystals (non-circular) is done for particles exceeding 25 µm diameter based on their shape (Henneberger et al., 2013). From the classification, the phase-resolved size distribution, concentration, and content can be derived (Henneberger et al., 2013; Ramelli et al., 2020). The HoloBalloon platform was flying at WOP and provided vertical profiles of the cloud properties within the lowest 300 m of the boundary layer (BL). The current analysis utilizes the cloud droplet number concentration and liquid water content (LWC) measurements. Note that the LWC is calculated based on the size distribution of the cloud droplets using a liquid water density (ρw) of 1000 kg m−3 and is therefore dominated by large cloud particles.
2.1.4 Meteorological data
During the measurement period, meteorological parameters (e.g., pressure, temperature, precipitation, and horizontal wind speed and direction) were continuously monitored by the permanent MeteoSwiss observation station at WFJ. Additionally, a weather station was installed on the OceaNet container (Griesche et al., 2020) deployed at WOP, which also hosted several remote sensing instruments (e.g., cloud radar, Raman lidar, and microwave radiometer) and a particle size velocity (Parsivel) disdrometer (Parsivel2, OTT HydroMet GmbH, Germany; Tokay et al., 2014) to measure precipitation. As there was no wind sensor included in the weather station on the OceaNet container, we utilized the horizontal wind speed and direction measurements from the nearby MeteoSwiss station in Davos, assuming that they provide a good proxy for the wind regime in the valley. Vertical wind speed profiles were obtained with a wind Doppler lidar (WindCube 100S, manufactured by Leosphere) at WOP. Throughout the campaign the wind lidar measured from 200 to 8100 m above ground level (a.g.l.) with high temporal (5 s max) and vertical resolution (50 m). The wind lidar operated following the Doppler beam switching technique with an elevation of 75∘. More information about the remote sensing measurements can be found in Ramelli et al. (2021a).
2.2 Aerosol hygroscopicity
The aerosol hygroscopicity parameter, κ, encompasses the impact of particle chemical composition on its subsaturated water uptake and CCN activity (Petters and Kreidenweis, 2007). Here, we determine κ similarly to the approach of Moore et al. (2011), Jurányi et al. (2011), Lathem et al. (2013), Kalkavouras et al. (2019), Kacarab et al. (2020), and others by combining the CCN measurements with the SMPS aerosol size distribution data as follows. For each SMPS scan, the particle size distribution is integrated backward starting from the bin with the largest-size particles, which corresponds to the CCN with the lowest critical supersaturation, Scr. We then successively add bins with smaller and smaller diameters until the aerosol number matches the CCN concentration observed for the same time period as the SMPS scan. The particles in the smallest size bin, which we call critical dry diameter, Dcr, correspond to the CCN with the highest Scr possible, which is the instrument supersaturation (SS). From Dcr and SS we determine κ from Köhler theory (Petters and Kreidenweis, 2007) assuming the particle chemical composition is internally mixed:
where is the Kelvin parameter, in which Mw (kg mol−1) is the molar mass of water, σ (J m−2) is the surface tension of the solution droplet, R is the universal gas constant, and T (K) is the ambient temperature. Here, we assume the surface tension of the solution droplet is equal to that of pure water (σ=σw) by convention. The κ determined above represents the composition of particles with diameter Dcr (large particles can have a different κ but still activate given that their Scr is lower than the prevailing SS in the CCN chamber). This means that over the course of an hour, over which a full SS cycle is completed, κ is determined for a range of Dcr, which in our case were in the range of 50–200 nm (Sect. 3.1). This size-resolved κ information provides insights on the possible origin and chemical components of the aerosol, which is important given that there is no other measurement available to constrain chemical composition during RACLETS. From κ, we infer an equivalent organic mass fraction, εorg, assuming that the aerosol is composed of an organic–inorganic mixture:
where κi=0.6 and κo=0.1 are characteristic hygroscopicity values for the inorganic fraction of an aerosol (represented by ammonium sulfate) and organic aerosol, respectively (Petters and Kreidenweis, 2007; Wang et al., 2008; Dusek et al., 2010). Note that these values for a continental aerosol are supported by observations and analyses (e.g., Andreae and Rosenfeld, 2008; Rose et al., 2008; Pringle et al., 2010).
2.3 Cloud droplet number and cloud maximum supersaturation
Here, we apply adiabatic cloud parcel theory to the observational datasets to determine the maximum in-cloud supersaturation (Smax) and cloud droplet number (Nd) that would form over both measurement sites throughout the observation period. Droplet calculations are carried out with the physically based aerosol activation parameterization of Nenes and Seinfeld (2003), with extensions introduced by Fountoukis and Nenes (2005), Barahona et al. (2010) and Morales Betancourt and Nenes (2014). Each Nd calculation requires knowledge of the observed pressure, temperature, vertical winds, aerosol size distribution, and hygroscopicity. For the WFJ site, all data are available as described in the sections above. For the WOP site, CCN (hence hygroscopicity) data are not available so we carry out Nd calculations at two κ values, 0.1 and 0.25, which are the upper and the lower limit determined from the WFJ analysis (Sect. 3.1). The ability to reproduce observed cloud droplet number concentrations (Sect. 3.2.1) further supports the selection of these values.
The wind lidar measurements conducted at WOP (Sect. 2.1.4) are used to determine the prevailing vertical velocities at both sites. Data extracted from the first bin of the lidar at 200 m a.g.l. are considered representative for WOP as the wind lidar has no values very close to the ground, while measurements extracted for 1100 m a.g.l. are used as a proxy for the vertical velocities at WFJ. The high-resolution wind lidar data are grouped by hour and each fitted to half-Gaussian probability density functions (PDFs) with zero mean and standard deviation σw. An hourly PDF of updraft velocities is provided in the Supplement as an example of the calculation method we followed here (Fig. S2 in the Supplement). Employing the “characteristic velocity” approach of Morales and Nenes (2010), the PDF-averaged values of Nd and Smax are calculated by applying the parameterization using a single characteristic velocity, . This approach has been shown to successfully predict cloud-scale values of Nd in field studies for cumulus and stratocumulus clouds (e.g., Conant et al., 2004; Meskhidze et al., 2005; Fountoukis et al., 2007; Kacarab et al., 2020). The droplet closure carried out in this study is also used to support the validity of this approach for alpine MPCs. To determine the σw values used in the closure study (Sect. 3.2.1), we isolated the segments of the wind lidar measurements that correspond to each cloud event observed by the HoloBalloon platform. The subsequent fitting of the measured updraft velocities to half-Gaussian PDFs revealed a σw value representative of each cloud. The accuracy of the wind lidar products is affected by precipitation, as the measured updraft velocities might be masked by the terminal fall velocity of the hydrometeors. We therefore use disdrometer measurements to identify and exclude precipitating periods from our analysis. Aiming to examine how Nd responds to different vertical velocity–aerosol situations, potential Nd for both sites are calculated at 10 values of σw between 0.1 and 1.0 m s−1 (Sect. 3.2.4). Note that we use the term “potential” droplet number throughout this study, as its calculation is performed regardless of the actual existence of clouds over the measurement sites.
3.1 Particle number, CCN concentration, and κ at WOP and WFJ
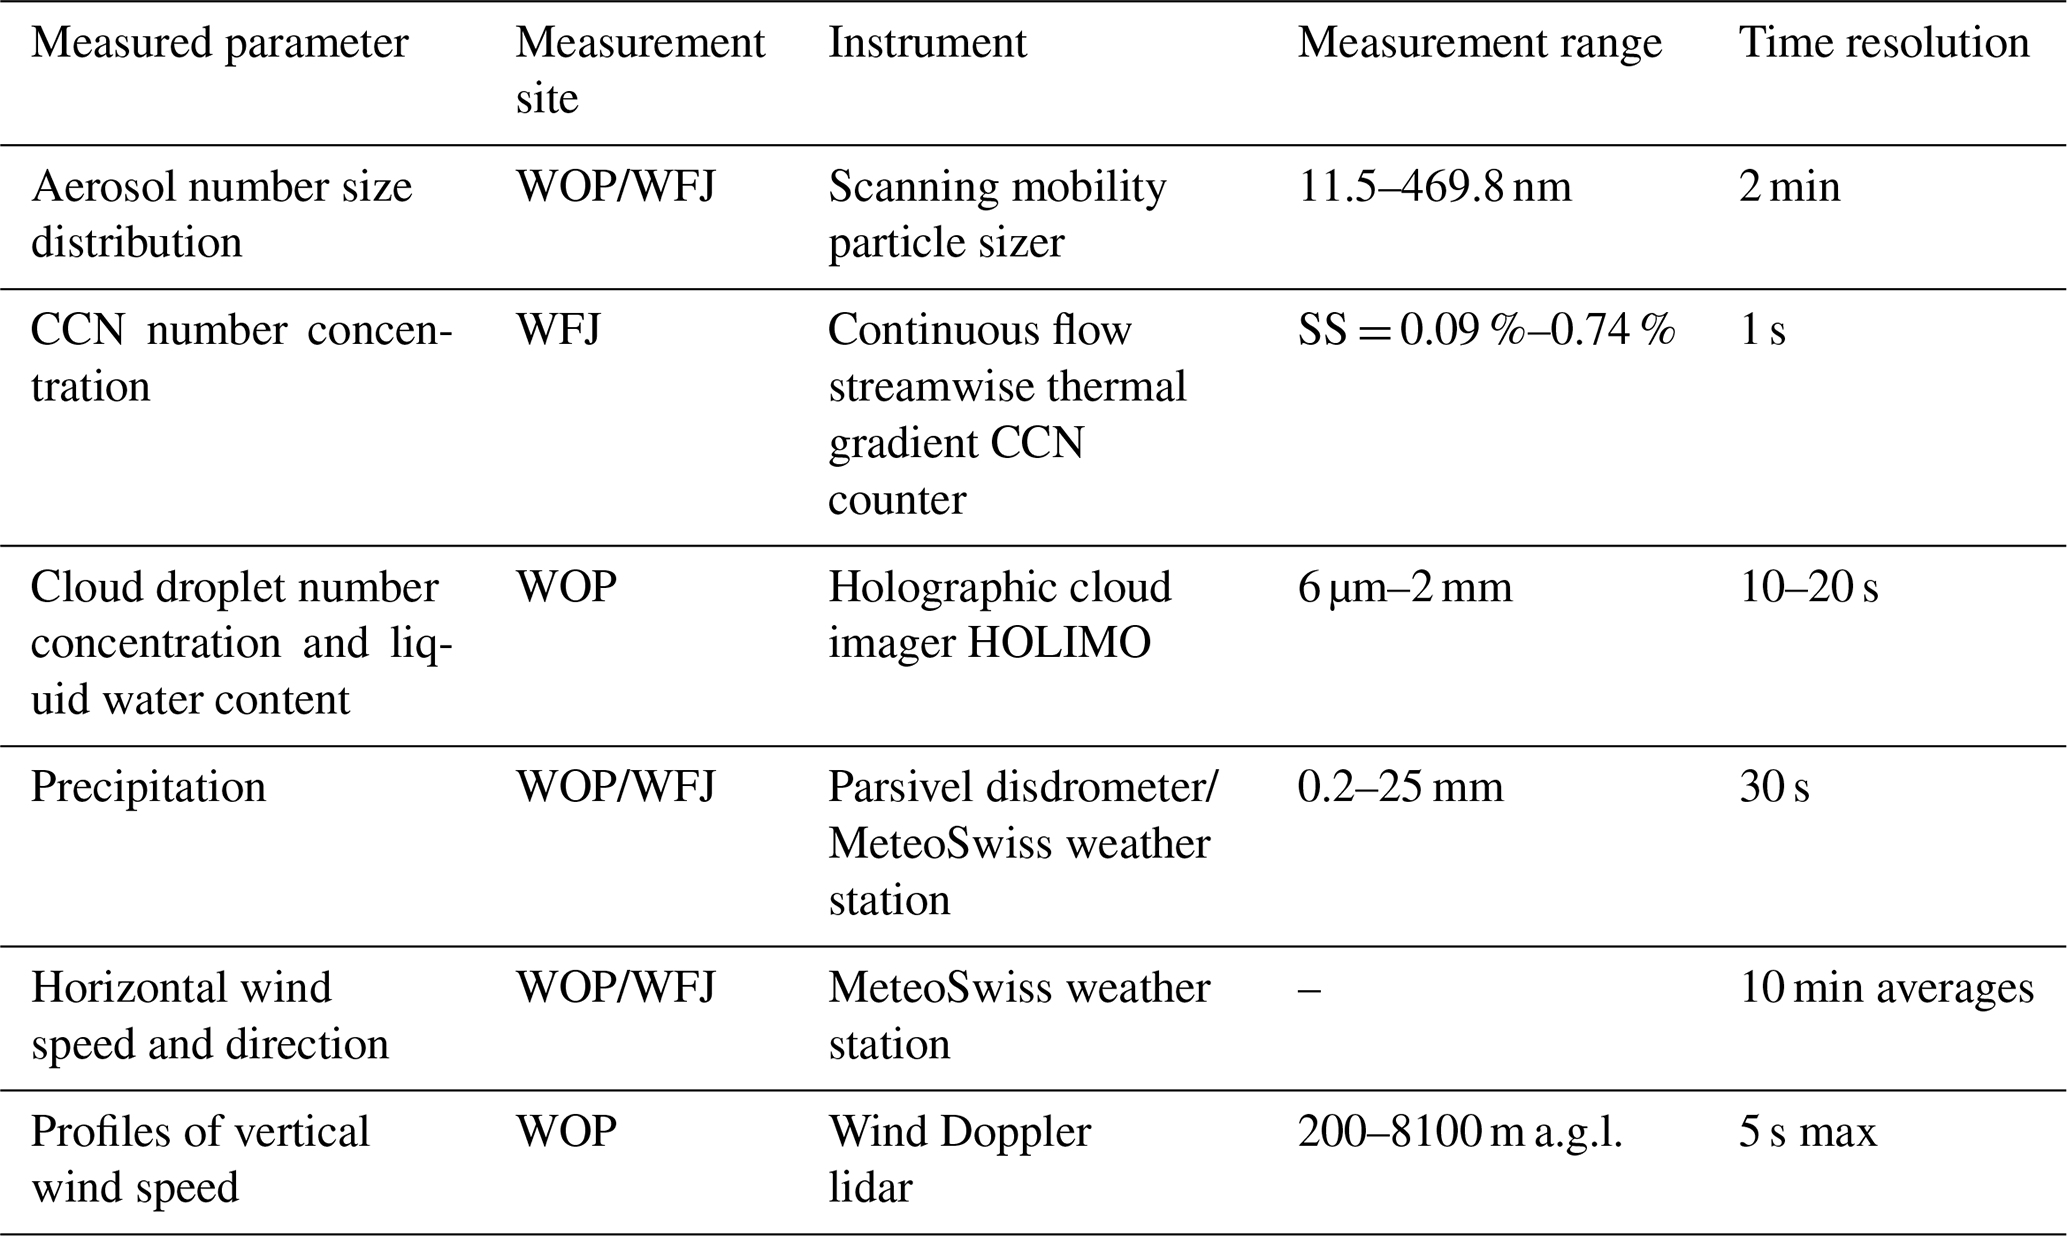
The total aerosol number concentration (Naer) time series (integrated aerosol size distribution) together with horizontal wind speed and direction measurements are depicted for both sites in Fig. 1. The Naer data points of WFJ are colored by κ (Sect. 2.2), while the orange solid line is used as a trace for WOP time series, as κ was not determined for the site owing to a lack of corresponding CCN measurements. Aiming to interpret the aerosol variations and the potential differences observed between valley and high-altitude measurements, the two-week period of interest is divided into two different sub-periods. During 24 and 28 February, a high-pressure system was dominant over Europe with clear skies and elevated temperatures (Fig. S3 in the Supplement). During this first sub-period, the Naer varies considerably and tends to follow a diurnal cycle that anticorrelates between the two sites (Fig. 1a). As expected, most of the time the concentrations at WOP are elevated with respect to WFJ because the Naer in the valley is influenced by local sources, which during this time of the year includes emissions from biomass burning (BB) (Lanz et al., 2010). Naer at WOP peaks in the evening, reaching up to ∼ 104 cm−3, presumably because of BB emissions in the valley, which seem to stop around midnight (Fig. 1a). Up to 2 orders of magnitude lower Naer is measured at the same time at the WFJ site. In the afternoon, Naer at WFJ approach those observed at WOP, indicating that the two sites are possibly experiencing similar air masses. The κ for WFJ seems to follow a clear temporal pattern as well, ranging between ∼ 0.1–0.4 with a minimum in the afternoon when the two sites experience the same air masses. Low Naer values are accompanied by higher κ, while at higher Naer conditions less hygroscopic aerosols are recorded (Fig. 1a).
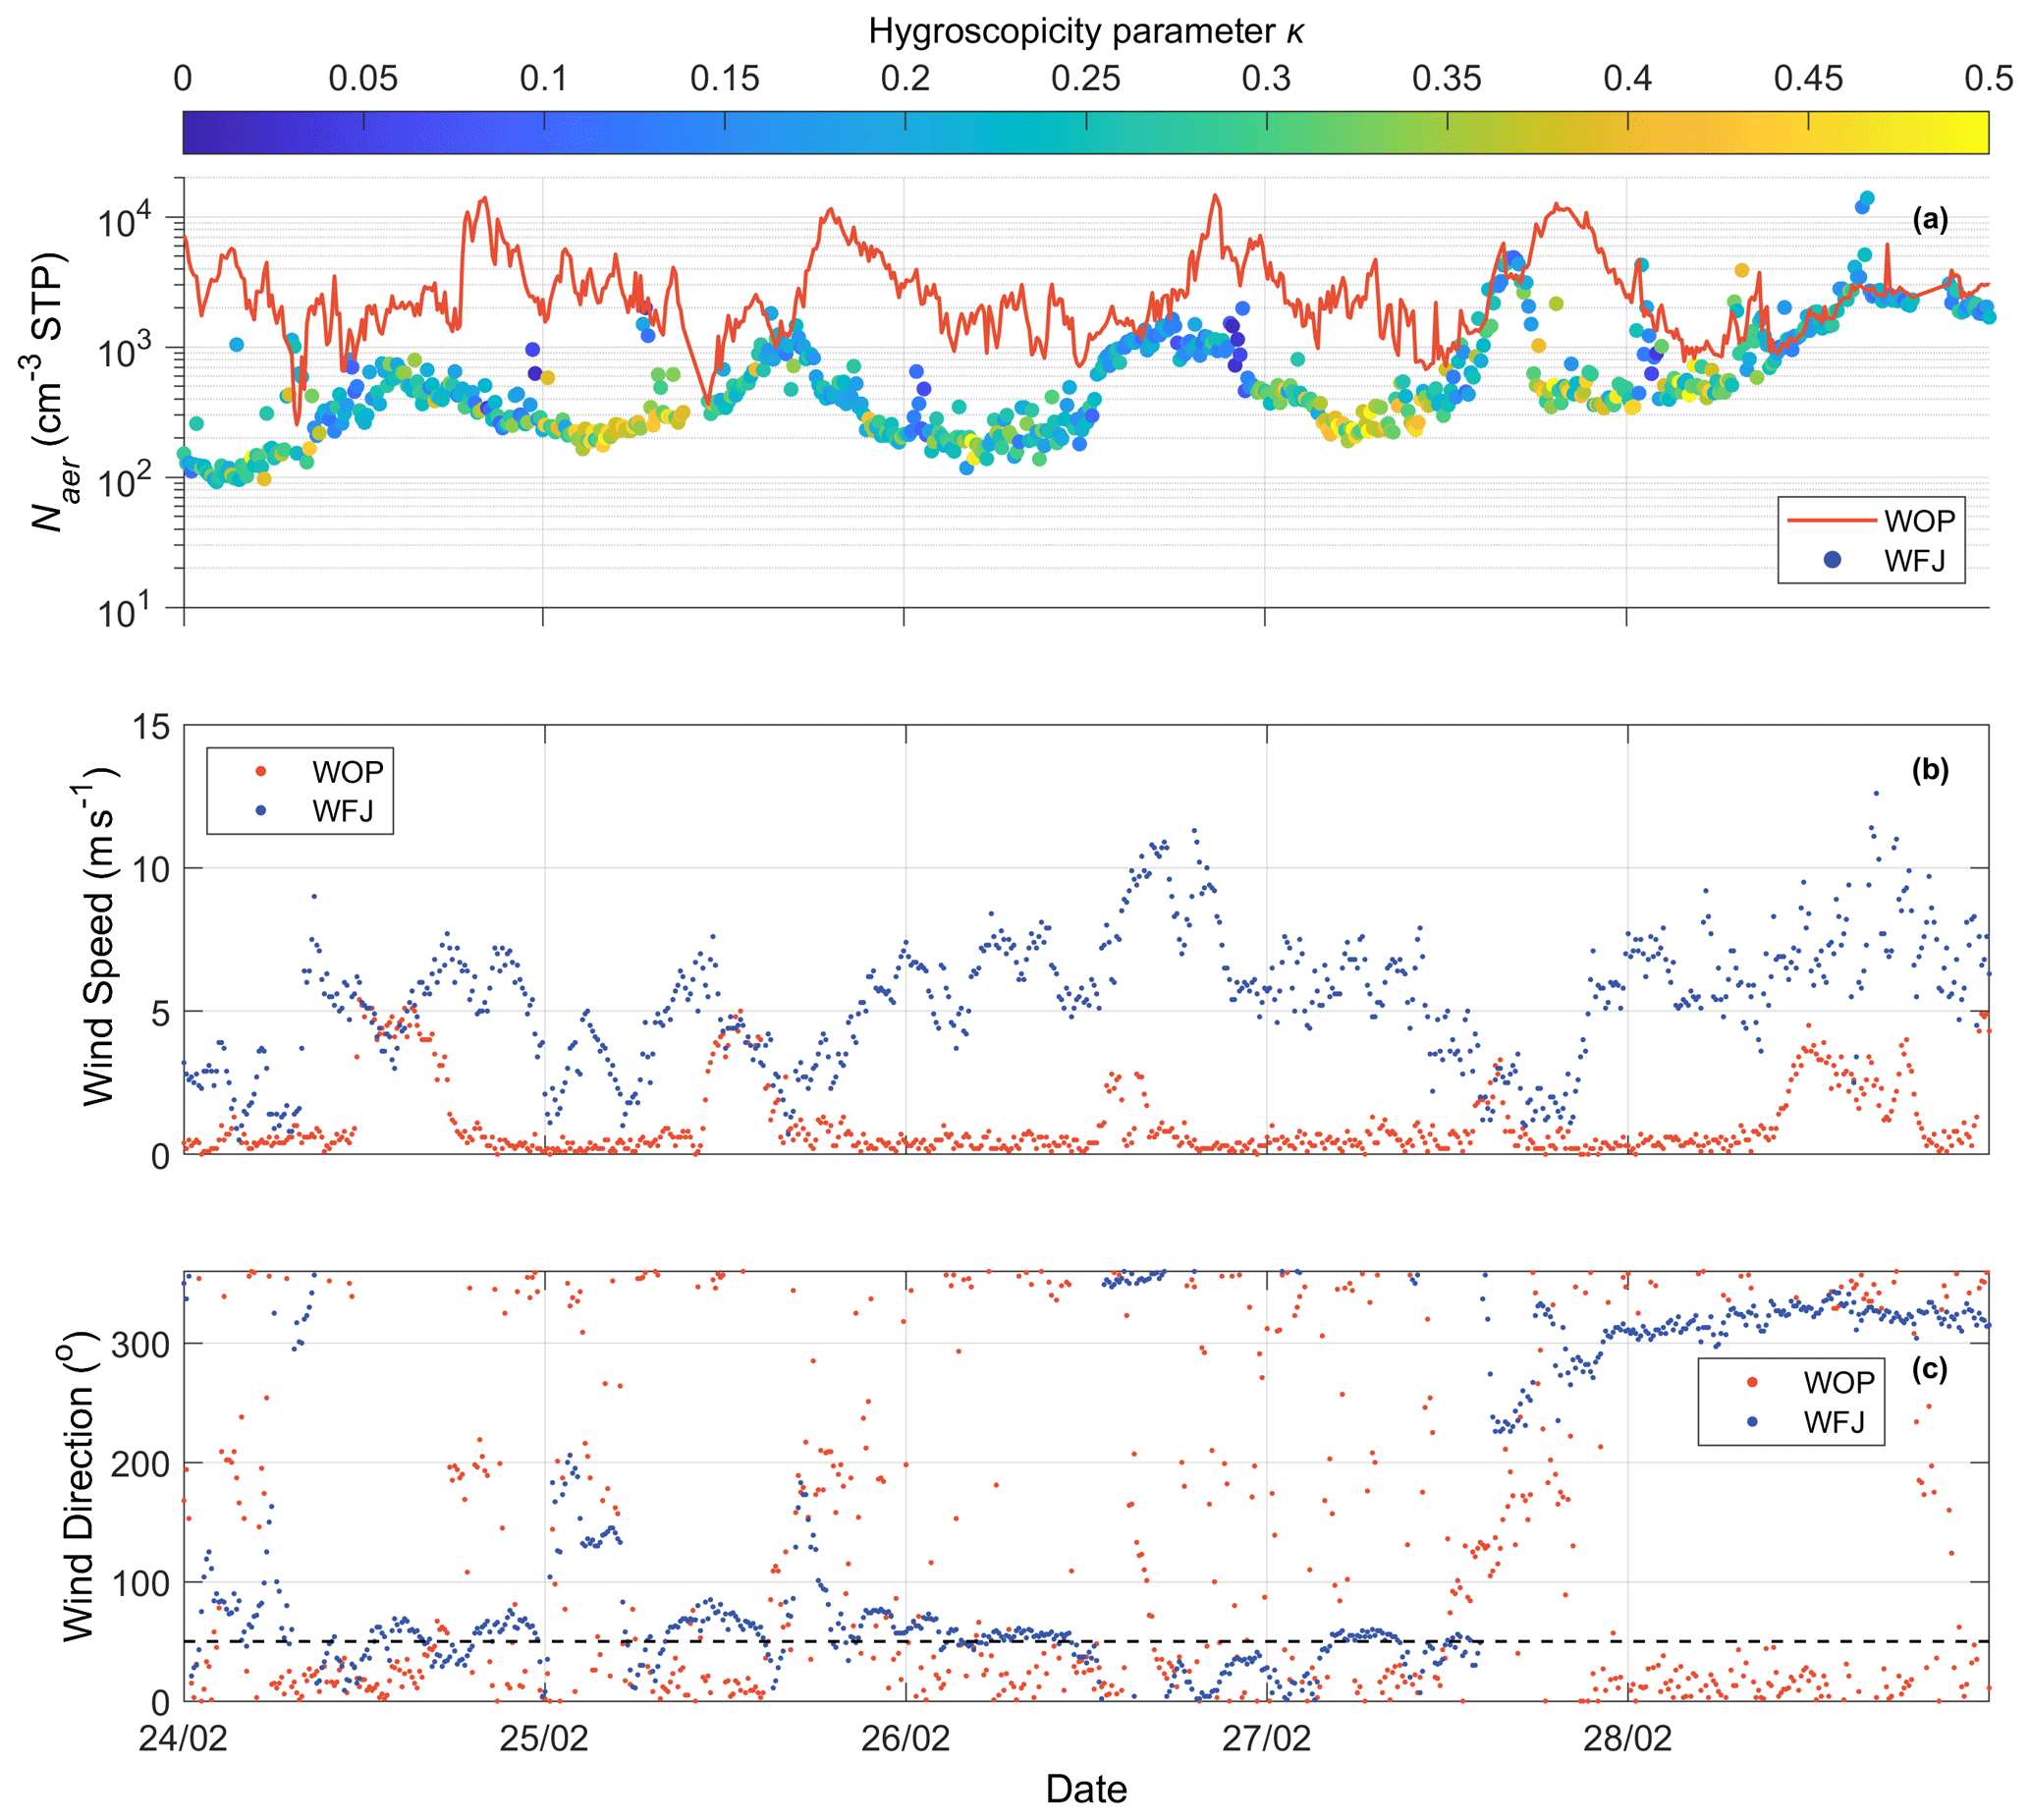
Figure 1(a) Naer under standard temperature and pressure conditions (cm−3 STP) at WOP (orange line) and at WFJ (circles colored by κ), (b) wind speed (m s−1), and (c) wind direction (in degrees) obtained from the MeteoSwiss observation stations at WFJ (blue dots) and Davos (orange dots) between 24 and 28 February 2019. The black dashed line indicates the relative direction of WOP to WFJ. Each day is referenced to 00:00 UTC.
The above diurnal cycles and their relationships can be understood in terms of BL dynamics typically occurring in mountain–valley systems (Chow et al., 2013). During daytime under clear sky conditions, the slopes and the valley itself are warmed by solar radiation, causing rising of the BL and additionally the production of buoyant air masses that rise up the slope toward the summit (through “upslope” and “up-valley” winds) (Okamoto and Tanimoto, 2016). This hypothesis can be further supported by the fair weather recorded by the weather station at WFJ until 28 February (Fig. S3 in the Supplement). The buoyant upslope flow could then transport polluted air masses originating from the BL of the valley up to the WFJ site, elevating the concentrations of less hygroscopic aerosols observed in the afternoon. The situation reverses during nighttime, when cold air descends from the slopes (downslope winds) and flows out of the valley (down-valley winds) due to the radiative cooling of the surface. The less polluted air observed during the early hours of the day before sunrise indicates that the WFJ station remained in the free troposphere (FT), with lower Naer and more aged air (i.e., larger κ) with a more prominent accumulation mode (Baltensperger et al., 1997; Seinfeld and Pandis, 2006, pp. 376–378; Kammermann et al., 2010; Jurányi et al., 2011).
Another consideration is that the upslope flow that “connects” the valley and the mountain-top site may not only be driven by thermal convection but also from mechanically forced lifting. The latter mechanism is caused by the deflection of strong winds by a steep mountain slope and it can be of great importance depending mainly on the height of the mountain and the mean speed of the wind (Kleissl et al., 2007). The local wind effects can be further interpreted looking at the MeteoSwiss time series of wind speed and direction for both stations (Fig. 1b, c). Wind measurements at the WFJ station recorded a strong wind speed reaching up to ∼ 11 m s−1 from the easterly–northeasterly directions between 24 and 28 February. The wind direction measured at WFJ coincides with the relative location of WOP site (see black dashed line in Fig. 1c). The steep orography over the Alps would transform part of this strong horizontal motion into vertical motion and transport air from WOP to WFJ, as seen in other alpine locations like Jungfraujoch (e.g., Hoyle et al., 2016). A detailed analysis, however, is out of the scope of this study.
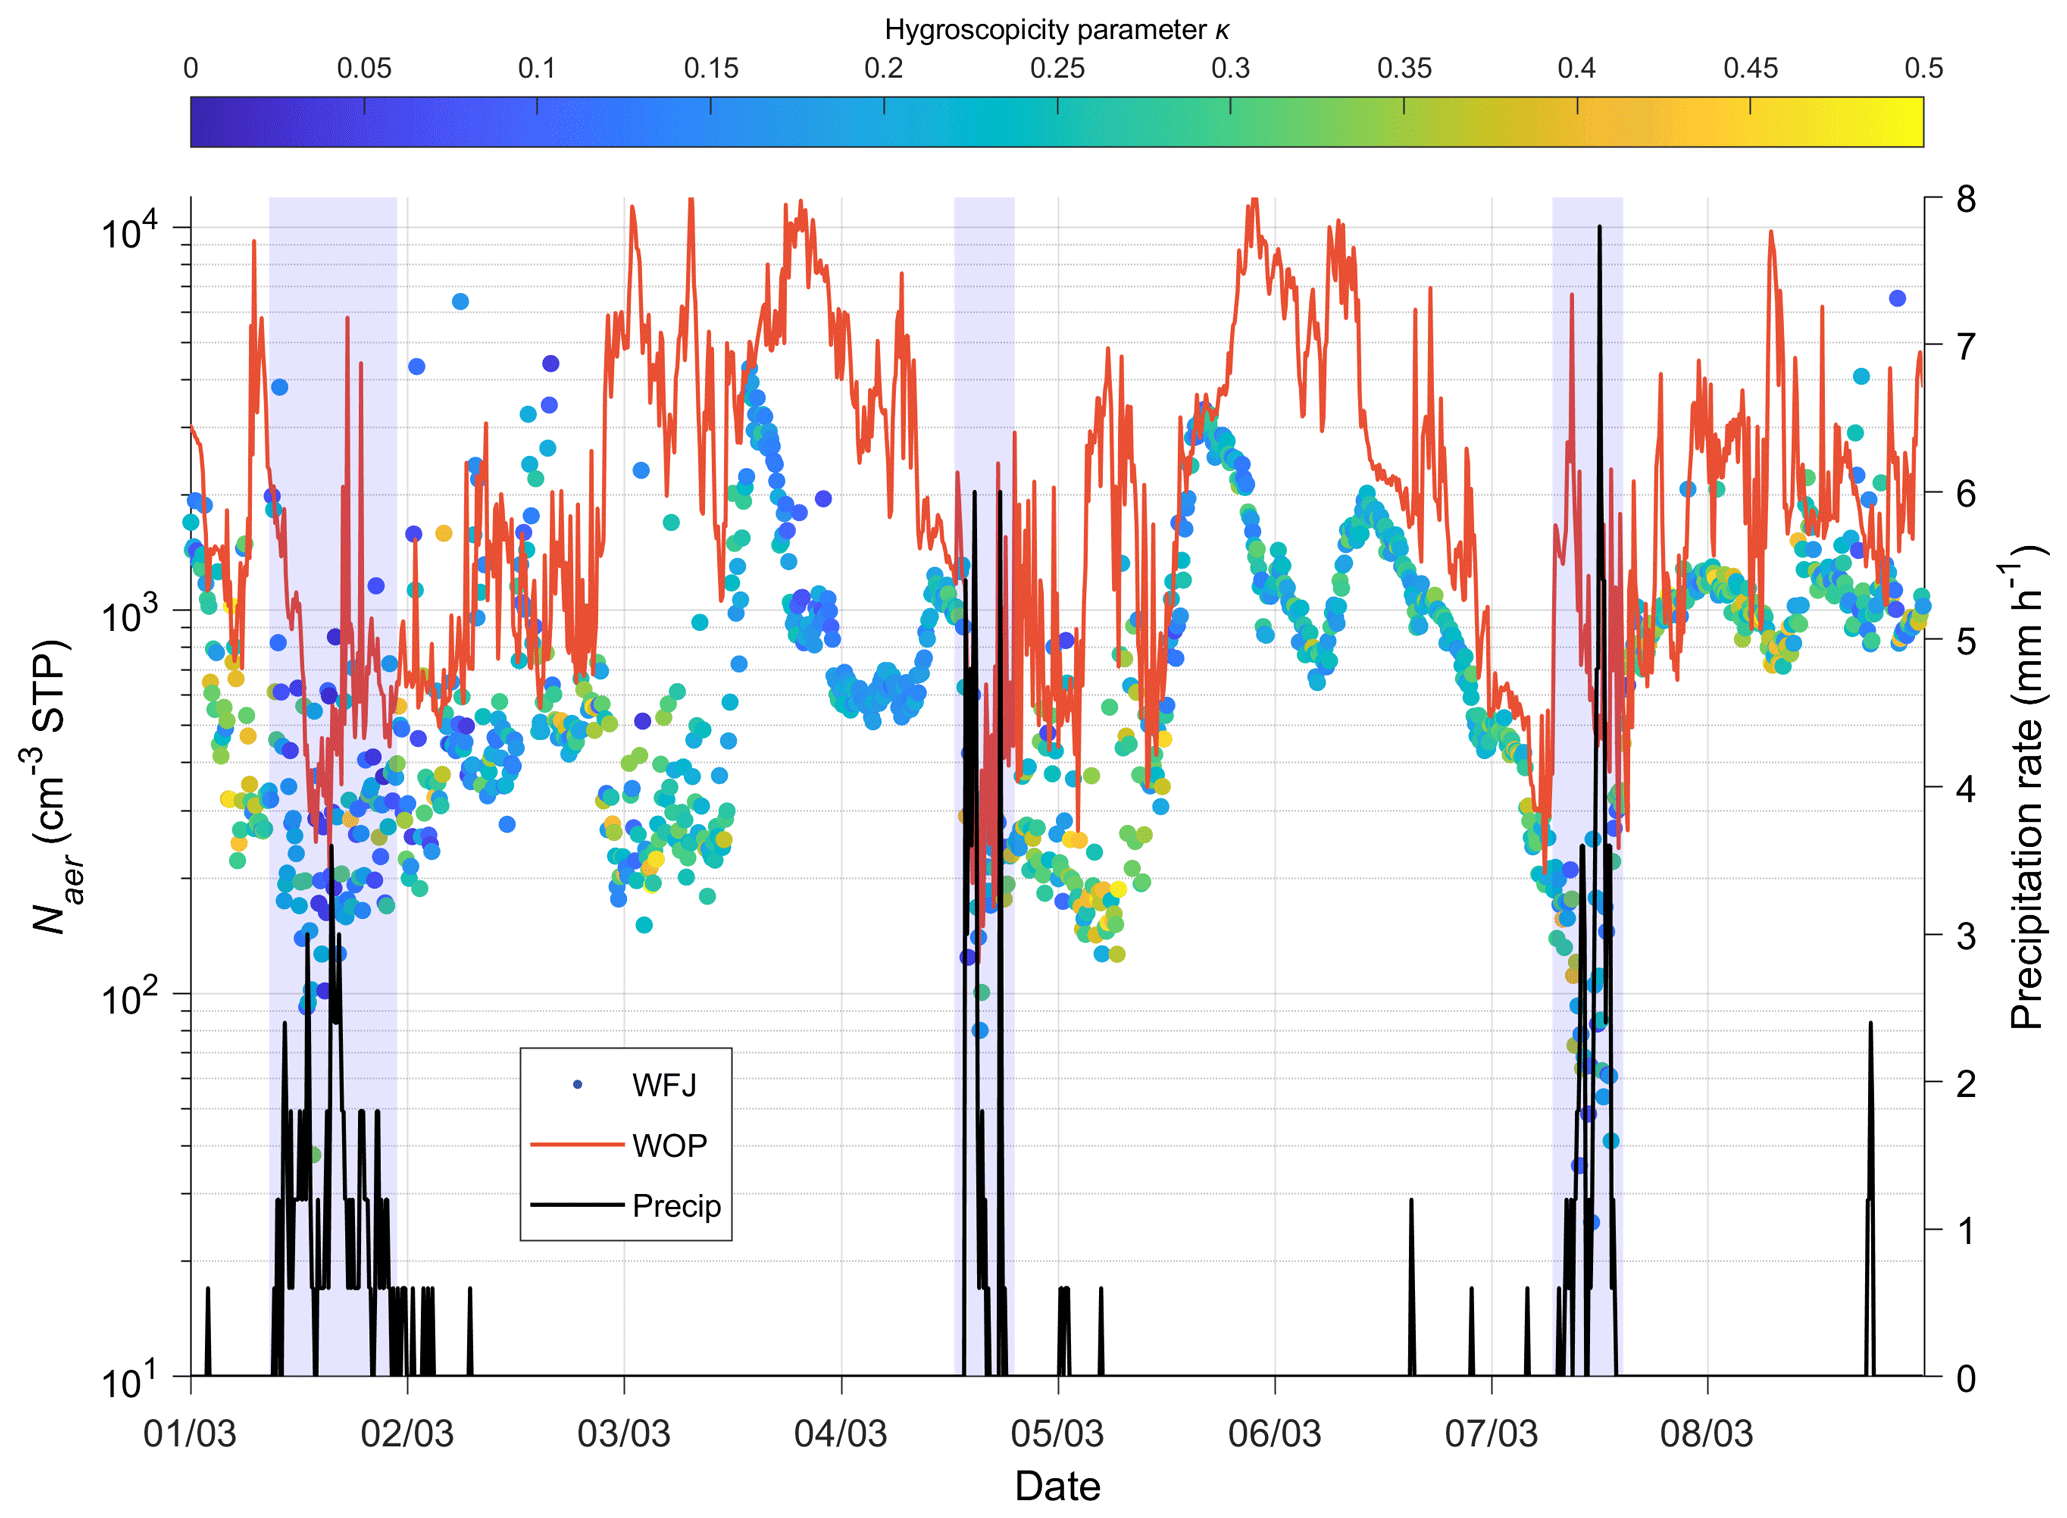
Figure 2Naer (cm−3 STP) at WOP (orange line) and at WFJ (circles colored by κ). The black solid line represents the precipitation rate (mm h−1) recorded from the MeteoSwiss observation station for each 10 min interval at WFJ between 1 and 8 March 2019. The blue shaded areas represent the periods when precipitation recorded at the WFJ site is most intense.
Similar to Fig. 1a, Fig. 2 illustrates the Naer time series measured at both sites along with the precipitation rate recorded by the MeteoSwiss station at WFJ during the time period between 1 and 8 March 2019. Meteorological observations show the pressure and temperature dropping (Fig. S3 in the Supplement) together with intense snow and rain events, associated with the passage of cold fronts over the region. Three intense precipitation events are visible in our dataset occurring on 1, 4, and 7 March 2019 (blue shaded areas in Fig. 2) creating up to 7.8 mm h−1 of precipitation. The most intense drop in Naer is seen to occur during and after the precipitation events, with the aerosol concentrations dropping to less than 200 cm−3 (100 cm−3) at WOP (WFJ). This is not the case for the last event, where a big “spike” of Naer is observed before the precipitation event in the WOP time series, which is in contrast with the concurrent sharp decrease in Naer (< 20 cm−3) observed at WFJ. This could be an indication of a local source affecting the Naer recorded in the valley. During dry weather conditions, we can notice again the aerosol time series correlating during the afternoon and anticorrelating later in the evening and early morning hours. On 3 March, a steep increase in Naer is seen in the WFJ time series reaching up to ∼ 4000 cm−3, which is followed by a period of several hours with low hygroscopicity values (κ < 0.2) indicating once more the influence of freshly emitted particles arriving at WFJ from the BL of lower altitudes. Additionally, between 1 and 8 March, the diurnal cycle of particle hygroscopicity is less pronounced compared to the period between 24 and 28 February. Especially on 1 and 7 March, less hygroscopic aerosols (κ < 0.1) – hence less effective CCN particles – are found at WFJ (Fig. 2). This is likely from either precipitation removing aerosol particles through diffusive and impaction processes or the removal of aerosol particles that first activate and then are removed by precipitation. Also, because Naer drops, fresh local emissions become more important, further justifying the predominance of low κ values.
Figure 3Time series of in situ CCN number concentrations (cm−3) at WFJ for different levels of supersaturation (SS) with respect to water between 24 February and 8 March 2019.
Figure 3 presents the CCN number concentration time series measured at ambient conditions at WFJ for all six supersaturations. Throughout the two-week measurement period the recorded CCN number concentrations do not seem to follow a clear temporal pattern. The absence of a diurnal cycle in CCN properties measured at Jungfraujoch during winter was also pointed out in the study by Jurányi et al. (2011) because the site is mainly in free tropospheric conditions during most of the winter. According to Fig. 3, the observed CCN concentrations tend to be low (∼ 102 cm−3) even at the highest SS (0.74 %), which is expected given that WFJ is a remote continental measurement site with CCN concentrations that are typical of free tropospheric continental air (Jurányi et al., 2010, 2011; Hoyle et al., 2016; Fanourgakis et al., 2019). This is again in line with the measured monthly median values of CCN (at SS = 0.71 %) reported by Jurányi et al. (2011) being equal to 79.1 and 143.4 cm−3 for February and March 2009, respectively. Some local CCN spikes are, however, recorded during the evening of 28 February and at the beginning of March (e.g., on 2, 4 and 6 March), with the observed values of CCN reaching up to 650 cm−3 at SS = 0.09 % (lowest SS) and 1361 cm−3 at SS = 0.74 % (highest SS). Considering that WFJ is a site frequently located in the FT, sudden fluctuations in the CCN concentrations could be related to the vertical transport of freshly emitted particles (e.g., wood burning or vehicle emissions) from the valley floor in Davos. It is also worth noting that some aerosol spikes observed on the 3 March (∼ 3350 cm−3) and the 5 March (∼ 2100 cm−3) in the WFJ time series (Fig. 2) are not accompanied by a corresponding peak in the CCN time series. This indicates the presence of small aerosol particles that activate above 0.74 % supersaturation (i.e., particles with a diameter smaller than ∼ 25 nm). This case could also be associated with new particle formation (NPF) events. A previous study by Herrmann et al. (2015) reported the aerosol number size distribution at Jungfraujoch over a 6-year period indicating that NPF was observed during 14.5 % of the time without a seasonal preference. Tröstl et al. (2016) also showed that NPF significantly adds to the total aerosol concentration at Jungfraujoch and is favored only under perturbed FT conditions (i.e., BL injections). Finally, during the three intense precipitation events (on 1, 4 and 7 March) we can identify again that the wet removal of the more hygroscopic aerosols (Fig. 2) suppresses the presence of cloud-activating particles, at times depleting the atmosphere almost completely from CCN (Fig. 3). This is clearly shown on 1 and 7 March, when the CCN number measured at 0.74 % supersaturation drops below 10 cm−3, which is extremely low for BL concentrations.

Figure 4(a) Time series of the hygroscopicity parameter κ at WFJ at different levels of SS (0.09 %–0.74 %) throughout the period of interest. The red solid line indicates the hourly averaged κ time series over a complete SS cycle. (b) Size-resolved aerosol hygroscopicity (blue squares) and the respective εorg (orange triangles) calculated for the WFJ site.
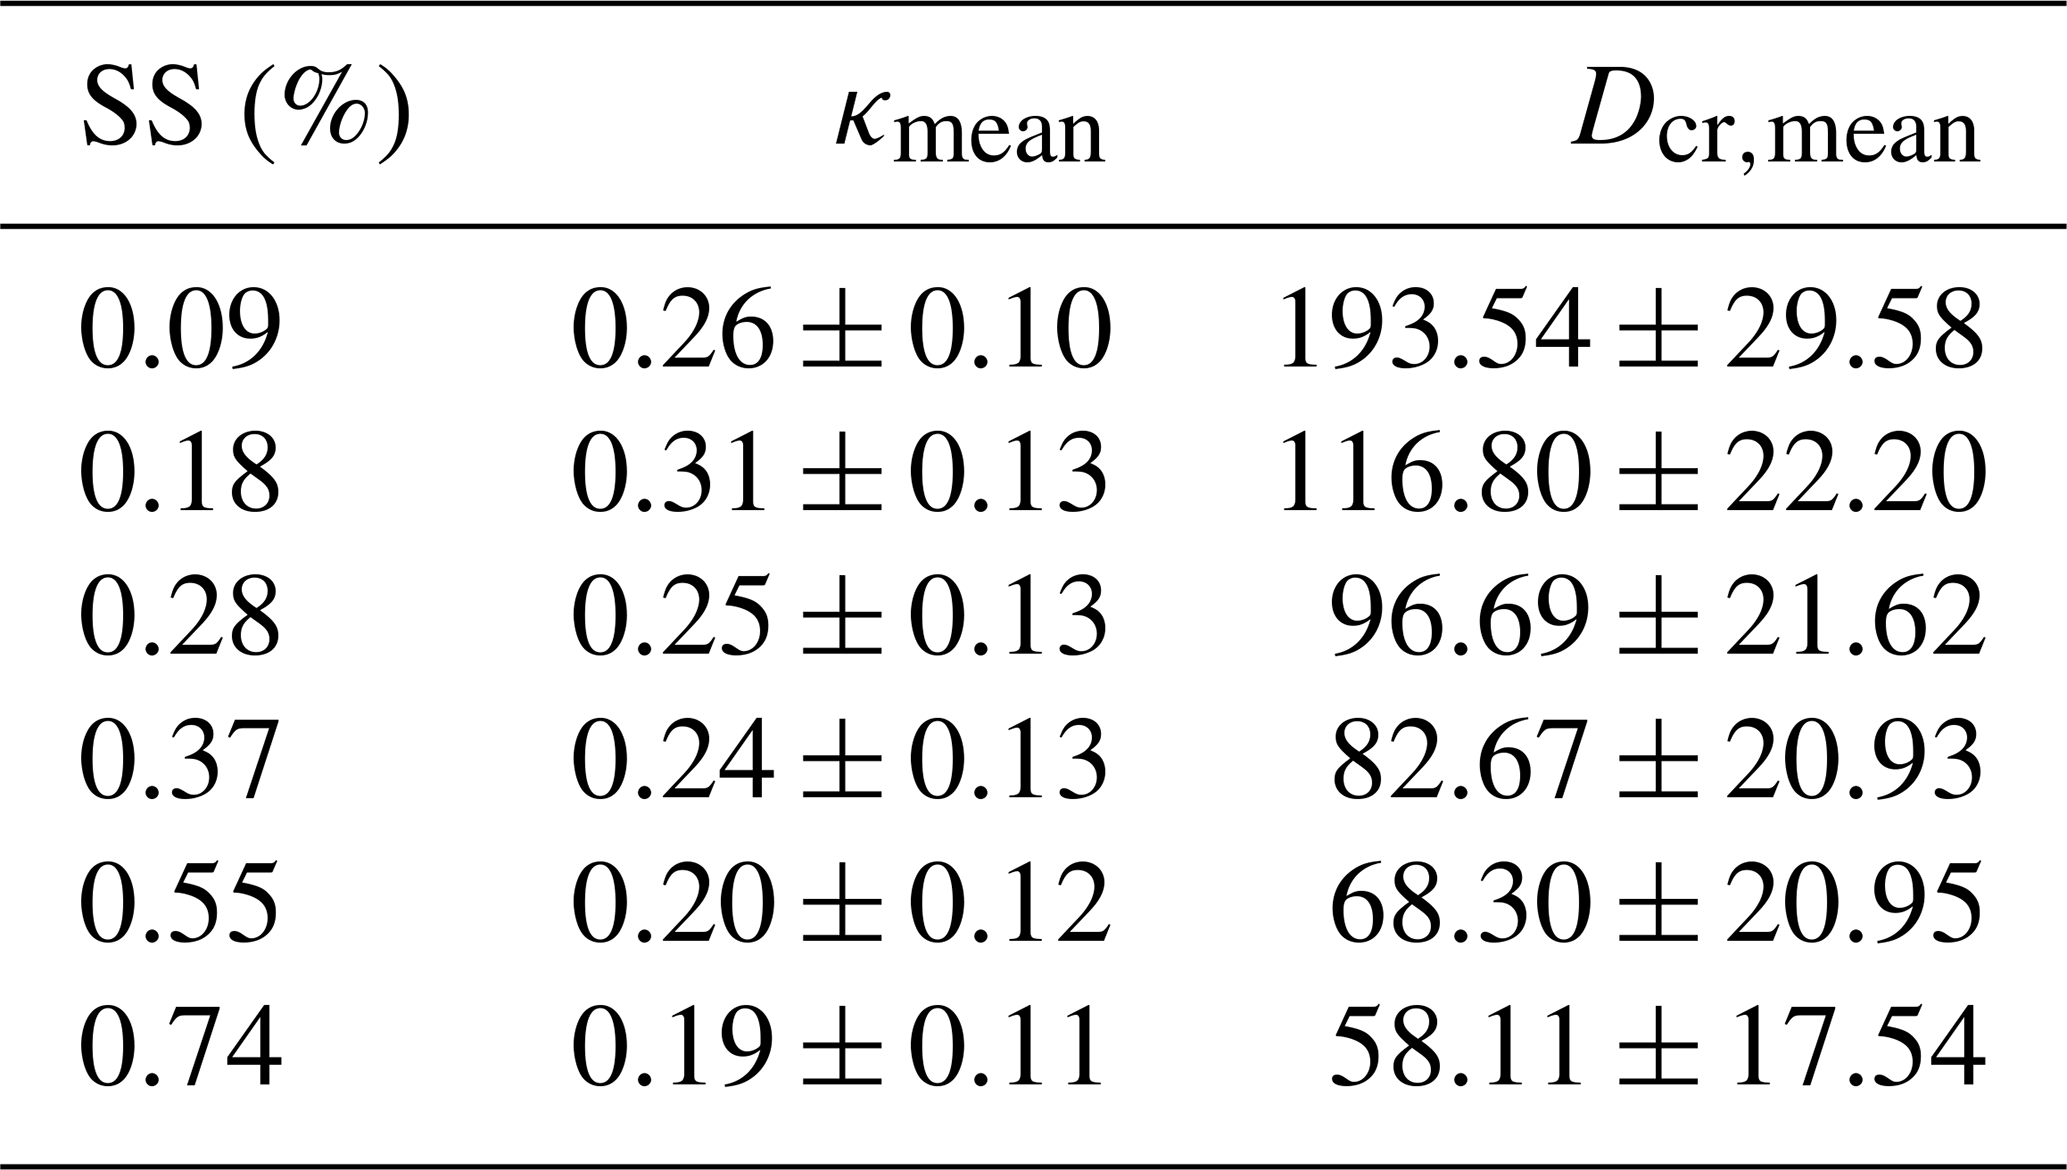
The aerosol hygroscopicity parameter derived from all CCN data collected between 24 February and 8 March is presented in Fig. 4a. The red solid line represents the hourly averaged hygroscopicity values over one complete instrument supersaturation cycle. The hygroscopic properties of the particles at WFJ vary as a function of supersaturation, exhibiting on average lower values (∼ 0.1) at high SS and higher values (∼ 0.3) at the lower SS. Since the supersaturation inversely depends on particle size, Fig. 4a indicates that the hygroscopicity of the particles drops by almost 60 % as the particles are getting smaller (i.e., as the supersaturation increases). Table 2 summarizes the mean values of κ and Dcr and their standard deviations, as calculated for each measured SS. The anticorrelation seen between the instrument SS and Dcr is reasonable if we consider that the latter represents the minimum activation diameter in a population of particles; therefore, only the particles with a Dcr > 193.54 nm are able to activate into cloud droplets at low SS values (0.09 %). The hourly averaged κ at each SS slot falls within a range of ∼ 0.2 and ∼ 0.3, which is a representative value of continental aerosols (Andreae and Rosenfeld, 2008; Rose et al., 2008).
Table 2Average κ and Dcr values at WFJ for each SS measured between 24 February and 8 March 2019. Uncertainty for each value is expressed by the standard deviation.
The hygroscopicity parameter κ along with the inferred εorg (Eq. 2) are shown in Fig. 4b as a function of particle size. Compared to smaller particles, the higher κ of larger particles (> 100 nm) is consistent with them being more aged and with a lower fraction of organics. The smaller particles are possibly enriched in organic species, which is consistent with the notion that air masses in the valley can contain large amounts of freshly emitted BB smoke with lower κ. Aerosol particles in the FT are considerably more aged (Seinfeld and Pandis, 2006, pp. 376–378) and exhibit higher values of κ and consequently lower values of εorg. The chemical composition of sub-100 nm particulate matter was therefore presumably dominated by organic material transported from the valley, while the higher κ values characterizing the larger particles are consistent with the more aged character of free tropospheric aerosols (e.g., Jurányi et al., 2011). The higher εorg inferred for the smaller particles suggests that mixing between fresh emissions in the valley and the free tropospheric aerosols might also be taking place at WFJ.
3.2 Droplet formation in the alpine region
3.2.1 Method evaluation against direct observations
During the RACLETS campaign, planar and dendritic ice particles were collected from supercooled clouds at WFJ aiming to examine their refreezing ability. A detailed description of the sampling methodology can be found in Mignani et al. (2019). Between 1 and 7 March, images of single dendrites were taken and analyzed visually for the degree of riming (Fig. S4 in the Supplement). The estimated riming degree varies from 1 (lightly rimed) to 4 (heavily rimed) following the categorization of Mosimann et al. (1994). Some representative images of each measured riming degree are shown in Fig. S4b in the Supplement. Although images were captured intermittently, they were taken within all three intense precipitating events occurring during the period of interest (blue shaded areas in Fig. 2). All dendrites captured were at least lightly rimed (i.e., riming degree = 1), which provides direct evidence for the co-existence of supercooled droplets and ice in clouds. Except the indirect evidence of the presence of MPCs over WFJ, Fig. 5 provides an overview of the direct microphysical measurements carried out by the HoloBalloon at WOP (Sect. 2.1.3). Three cloud events are sampled during 7 and 8 March, a more detailed description of which can be found in Ramelli et al. (2021a, b). The observed low-level clouds are likely produced by orographic lifting when the low-level flow is forced to ascent over the local topography from Klosters to WOP producing local updrafts and thus water supersaturated conditions. The cloud LWC measurements from the holographic imager display significant temporal variability that is also related to variations in the altitude of the tethered balloon system, as it tends to follow an adiabatic profile (Fig. 5a, b). Deviations from the adiabatic LWC profile are likely caused by entrainment of dry air within the low-level clouds. During the mixed-phase conditions recorded on 8 March (Fig. 5b), such deviations could also be attributed to the depletion of Nd through riming and depositional growth. These two processes are frequently found to enhance orographic precipitation in feeder clouds. Indeed, a large fraction of rimed ice particles and graupel were observed that day with HOLIMO between 17:00 and 17:40 UTC (Ramelli et al., 2021b). Throughout the two-day dataset presented in Fig. 5, the HoloBalloon system samples at altitudes lower than 300 m a.g.l., providing observations that are representative of BL conditions.
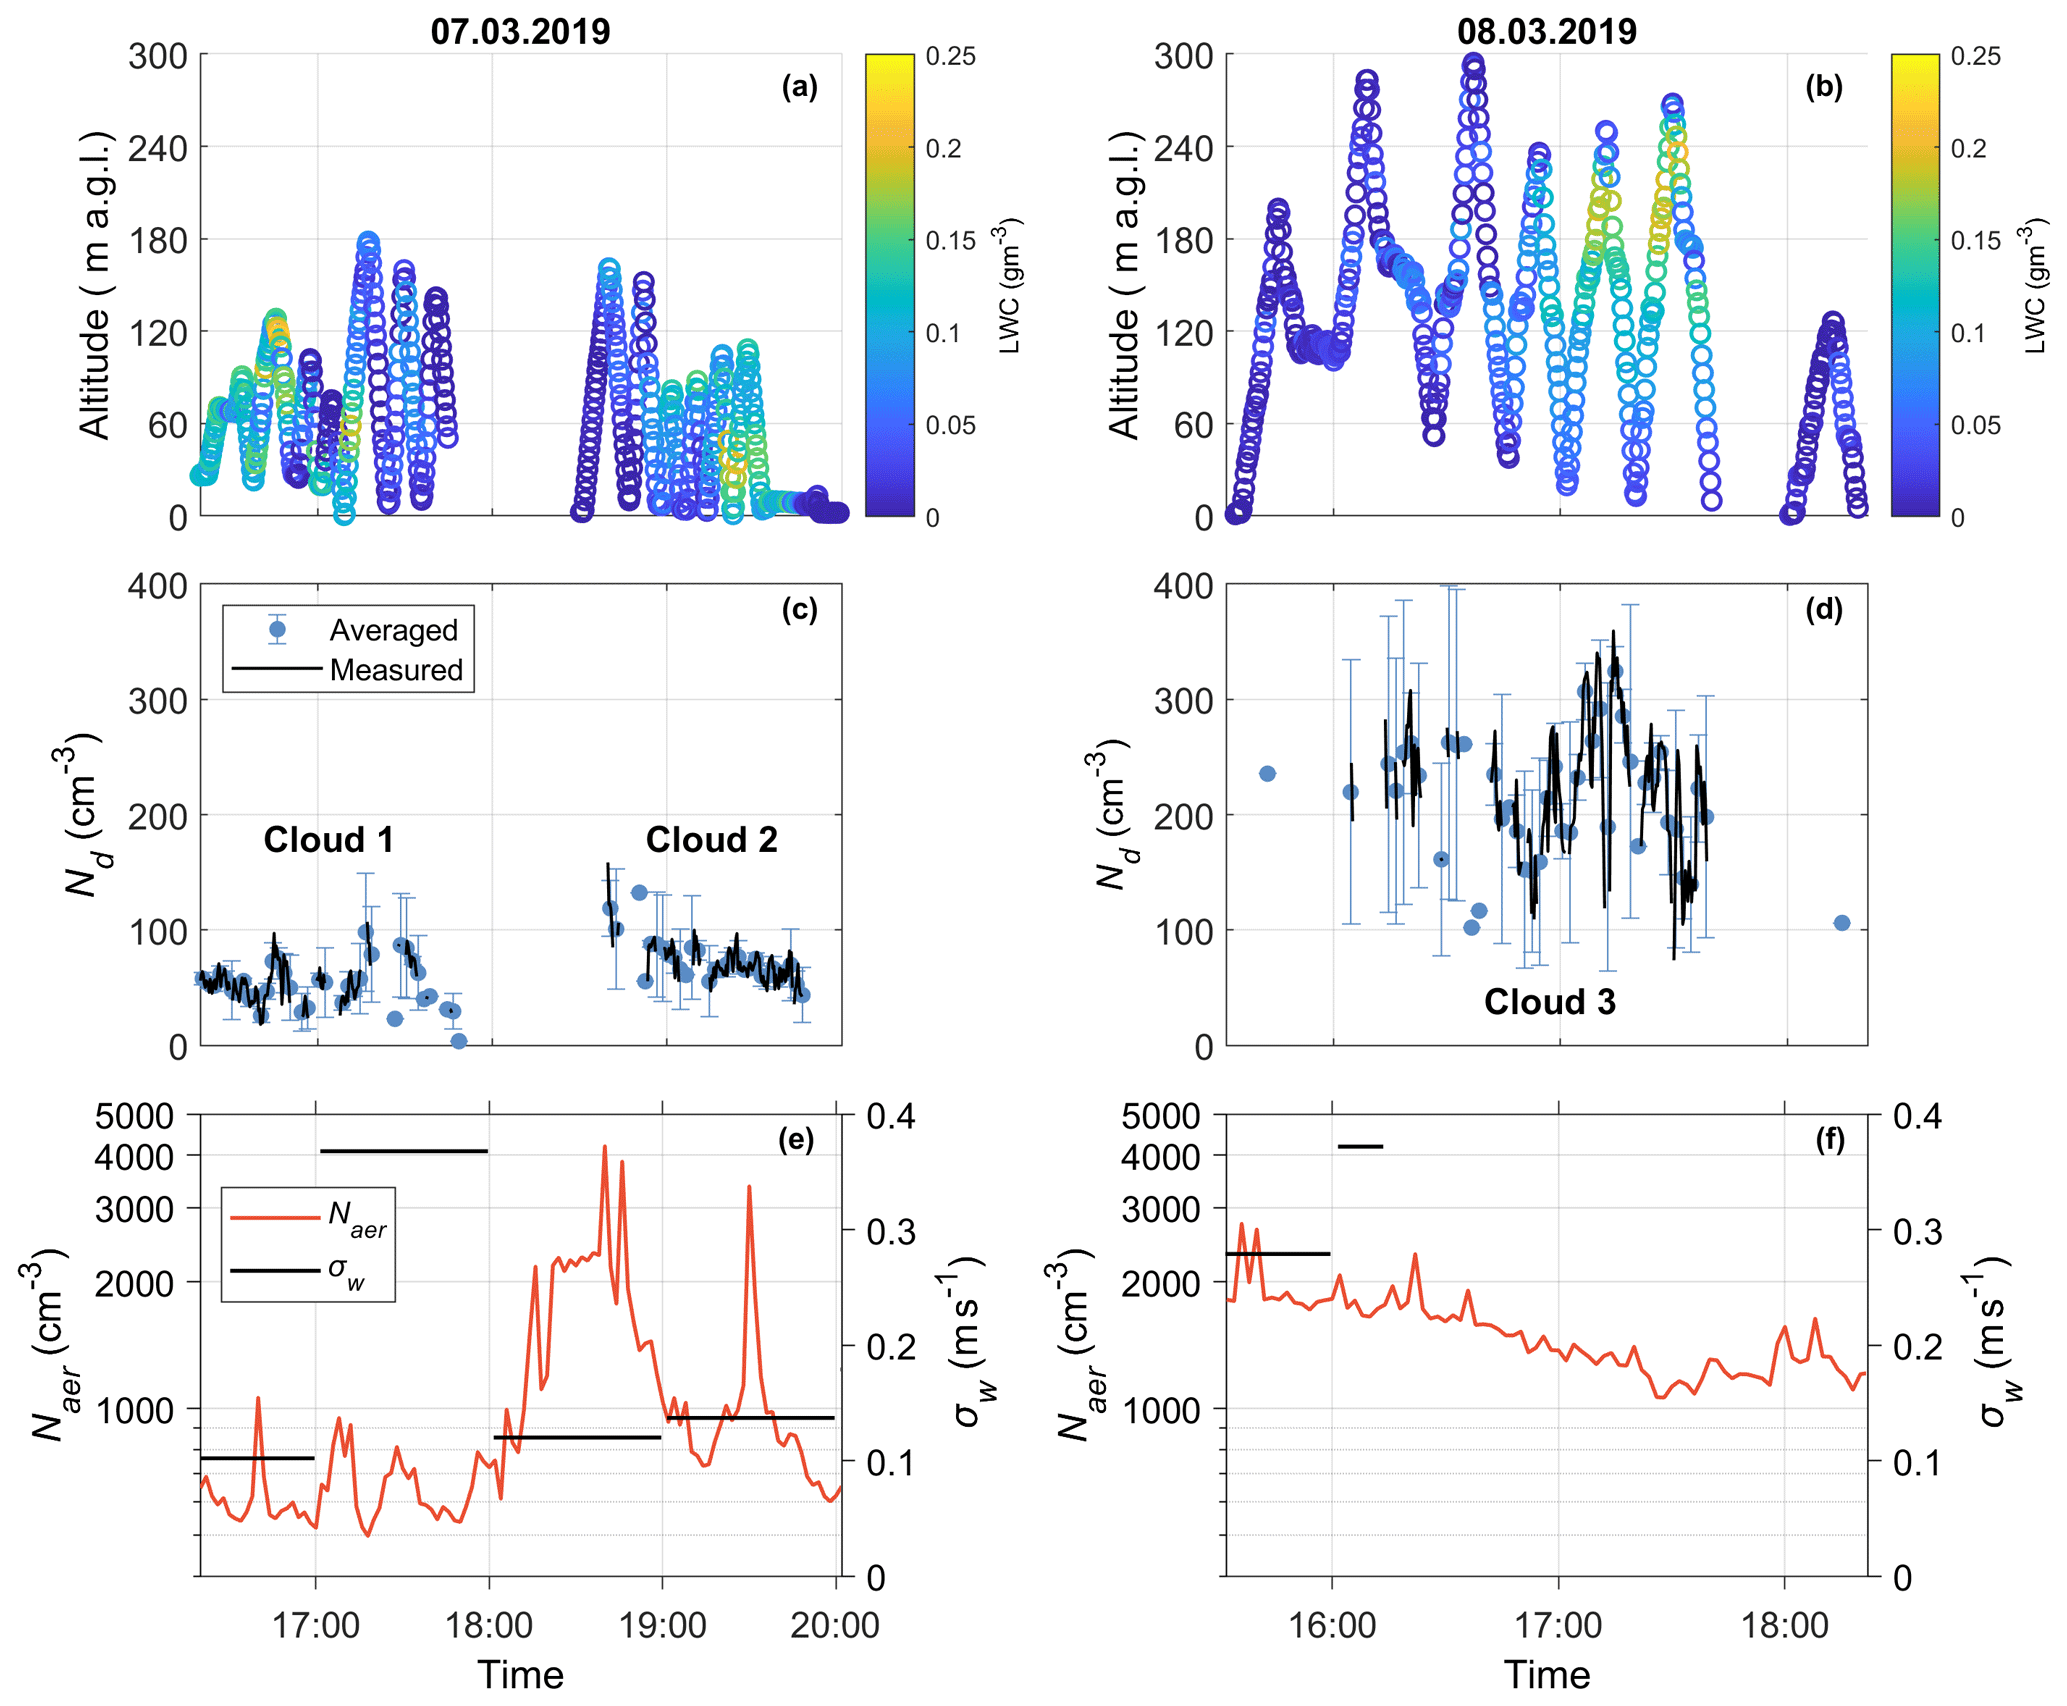
Figure 5Time series of 7 March (a, c, e) and 8 March (b, d, f) showing the vertical profiles of the LWC (g m−3) in panels (a) and (b), the filtered (black lines) and the 2 min averaged (cyan circles) Nd (cm−3) measured at WOP with the HoloBalloon platform in panels (c) and (d), and the corresponding SMPS aerosol concentrations (cm−3) (orange line) and the hourly wind lidar derived σw values (m s−1) (black line) in panels (e) and (f). Error bars represent the standard deviation of Nd during the averaging period.
The observed Nd time series collected at WOP are illustrated in Fig. 5c and d. The measurements corresponding to LWC < 0.05 g m−3 are filtered out from the analysis, assuming that they do not effectively capture in-cloud conditions. A similar criterion for LWC was also applied in Lloyd et al. (2015) to determine the periods when clouds were present over the alpine station of Jungfraujoch. Since the measured cloud properties have finer resolution (10–20 s) than the predicted ones, the observed dataset is averaged every 2 min. On 7 March, the balloon-borne measurements were taken in a post-frontal air mass (i.e., passage of a cold front in the morning) and indicated the formation of two low-level liquid layers (Fig. 5c) over WOP, which is attributed to low-level flow blocking (Ramelli et al., 2021a). Note that small droplets (< 6 µm) cannot be detected by HOLIMO (Sect. 2.3.1) and therefore the reported Nd should be considered a lower estimate. However, the influence of small cloud droplets on the reported LWC is minor, since the contribution of the larger cloud droplets dominates. During the first cloud event, an Nd of up to ∼ 100 cm−3 was recorded, while slightly increased Nd in the range of ∼ 50–120 cm−3 is visible during the second cloud event. On 8 March, a small-scale disturbance passed the measurement location Davos, which brought precipitation (Ramelli et al., 2021b). During the passage of the cloud system, the in situ measurements collected at WOP revealed the presence of a persistent low-level feeder cloud confined to the lowest 300 m of the cloud. The mixed-phase low-level cloud that is shown in Fig. 5d turned into an ice-dominated low-level cloud after 18:00 UTC (not shown). Throughout this event, Nd seems to range between ∼ 100–350 cm−3 (Fig. 5d), while the observed ICNC was in the range of ∼ 1–4 L−1 (see Fig. 6b in Ramelli et al., 2021b).
According to Fig. 5e and f, low Naer (< 103 cm−3) and highly variable σw values (∼ 4 times higher σw after 17:00 UTC) are representative of the period throughout which the first cloud formed, while up to 4 times higher Naer is observed during the following two cloud events, with relatively low σw values characterizing the second cloud compared to the third one. On 8 March, the disdrometer recorded rainfall over WOP, starting a few minutes after the development of the observed cloud system, which is reflected in the removal of updraft velocity measurements after 16:15 UTC (Fig. 5f). Note that the concentration measurements presented in Fig. 5 correspond to ambient temperature and pressure conditions. The contrasted aerosol and vertical velocity regimes, in which the observed clouds are formed, offer a great opportunity to test how the proposed methodology performs under a wide range of aerosol and velocity conditions. Indeed, the mean cloud droplet diameters exhibit a wide range of values, which for WOP range between 10 and 17 µm on 7 March and 8 to 12 µm on 8 March (not shown).
The Nd closure performed for the three cloud events observed over WOP during the last two days of the period of interest is presented in Fig. 6. Note that the predicted Nd is evaluated using the updraft velocity PDF calculated for each cloud period, rather than the hourly σw data shown in Fig. 5e and 5f (Sect. 2.3). Owing to the precipitation occurrence during 8 March, we focused on the 15 min time period between 16:00 and 16:15 UTC to determine a relevant updraft velocity from the wind lidar measurements representative of Cloud 3. The Gaussian fit to the updraft velocities gave a distribution with σw=0.24 and 0.16 m s−1 for the first two clouds present on 7 March and σw=0.37 m s−1 for the cloud system observed on 8 March. The w∗ values used to apply the droplet parameterization are therefore between 0.1–0.4 m s−1 (Sect. 2.3). Figure 6 indicates that the parameterization predictions agree to within 25 % with the in situ cloud droplet number concentrations. A similar degree of closure is frequently obtained for other in situ studies (e.g., Meskhidze et al., 2005; Fountoukis et al., 2007; Morales et al., 2011; Kacarab et al., 2020); however, these focused on liquid-phase clouds. Here we show that the methodology can also work for MPCs (i.e., Cloud 3 in Fig. 6). It is important to note here that part of the discrepancy between prediction and measurement could also be related to the underestimation of the measured Nd (Sect. 2.1.3). Hence, an even better degree of closure is likely. Also, the derived σw value used to calculate the predicted Nd for Cloud 1 might be biased low by the lower σw values recorded before 17:00 UTC (Fig. 5e). Nevertheless, the updraft averaging used in the droplet closure study corresponds to the measured Nd averaging time period and, therefore, we do not expect the degree of closure to be affected.
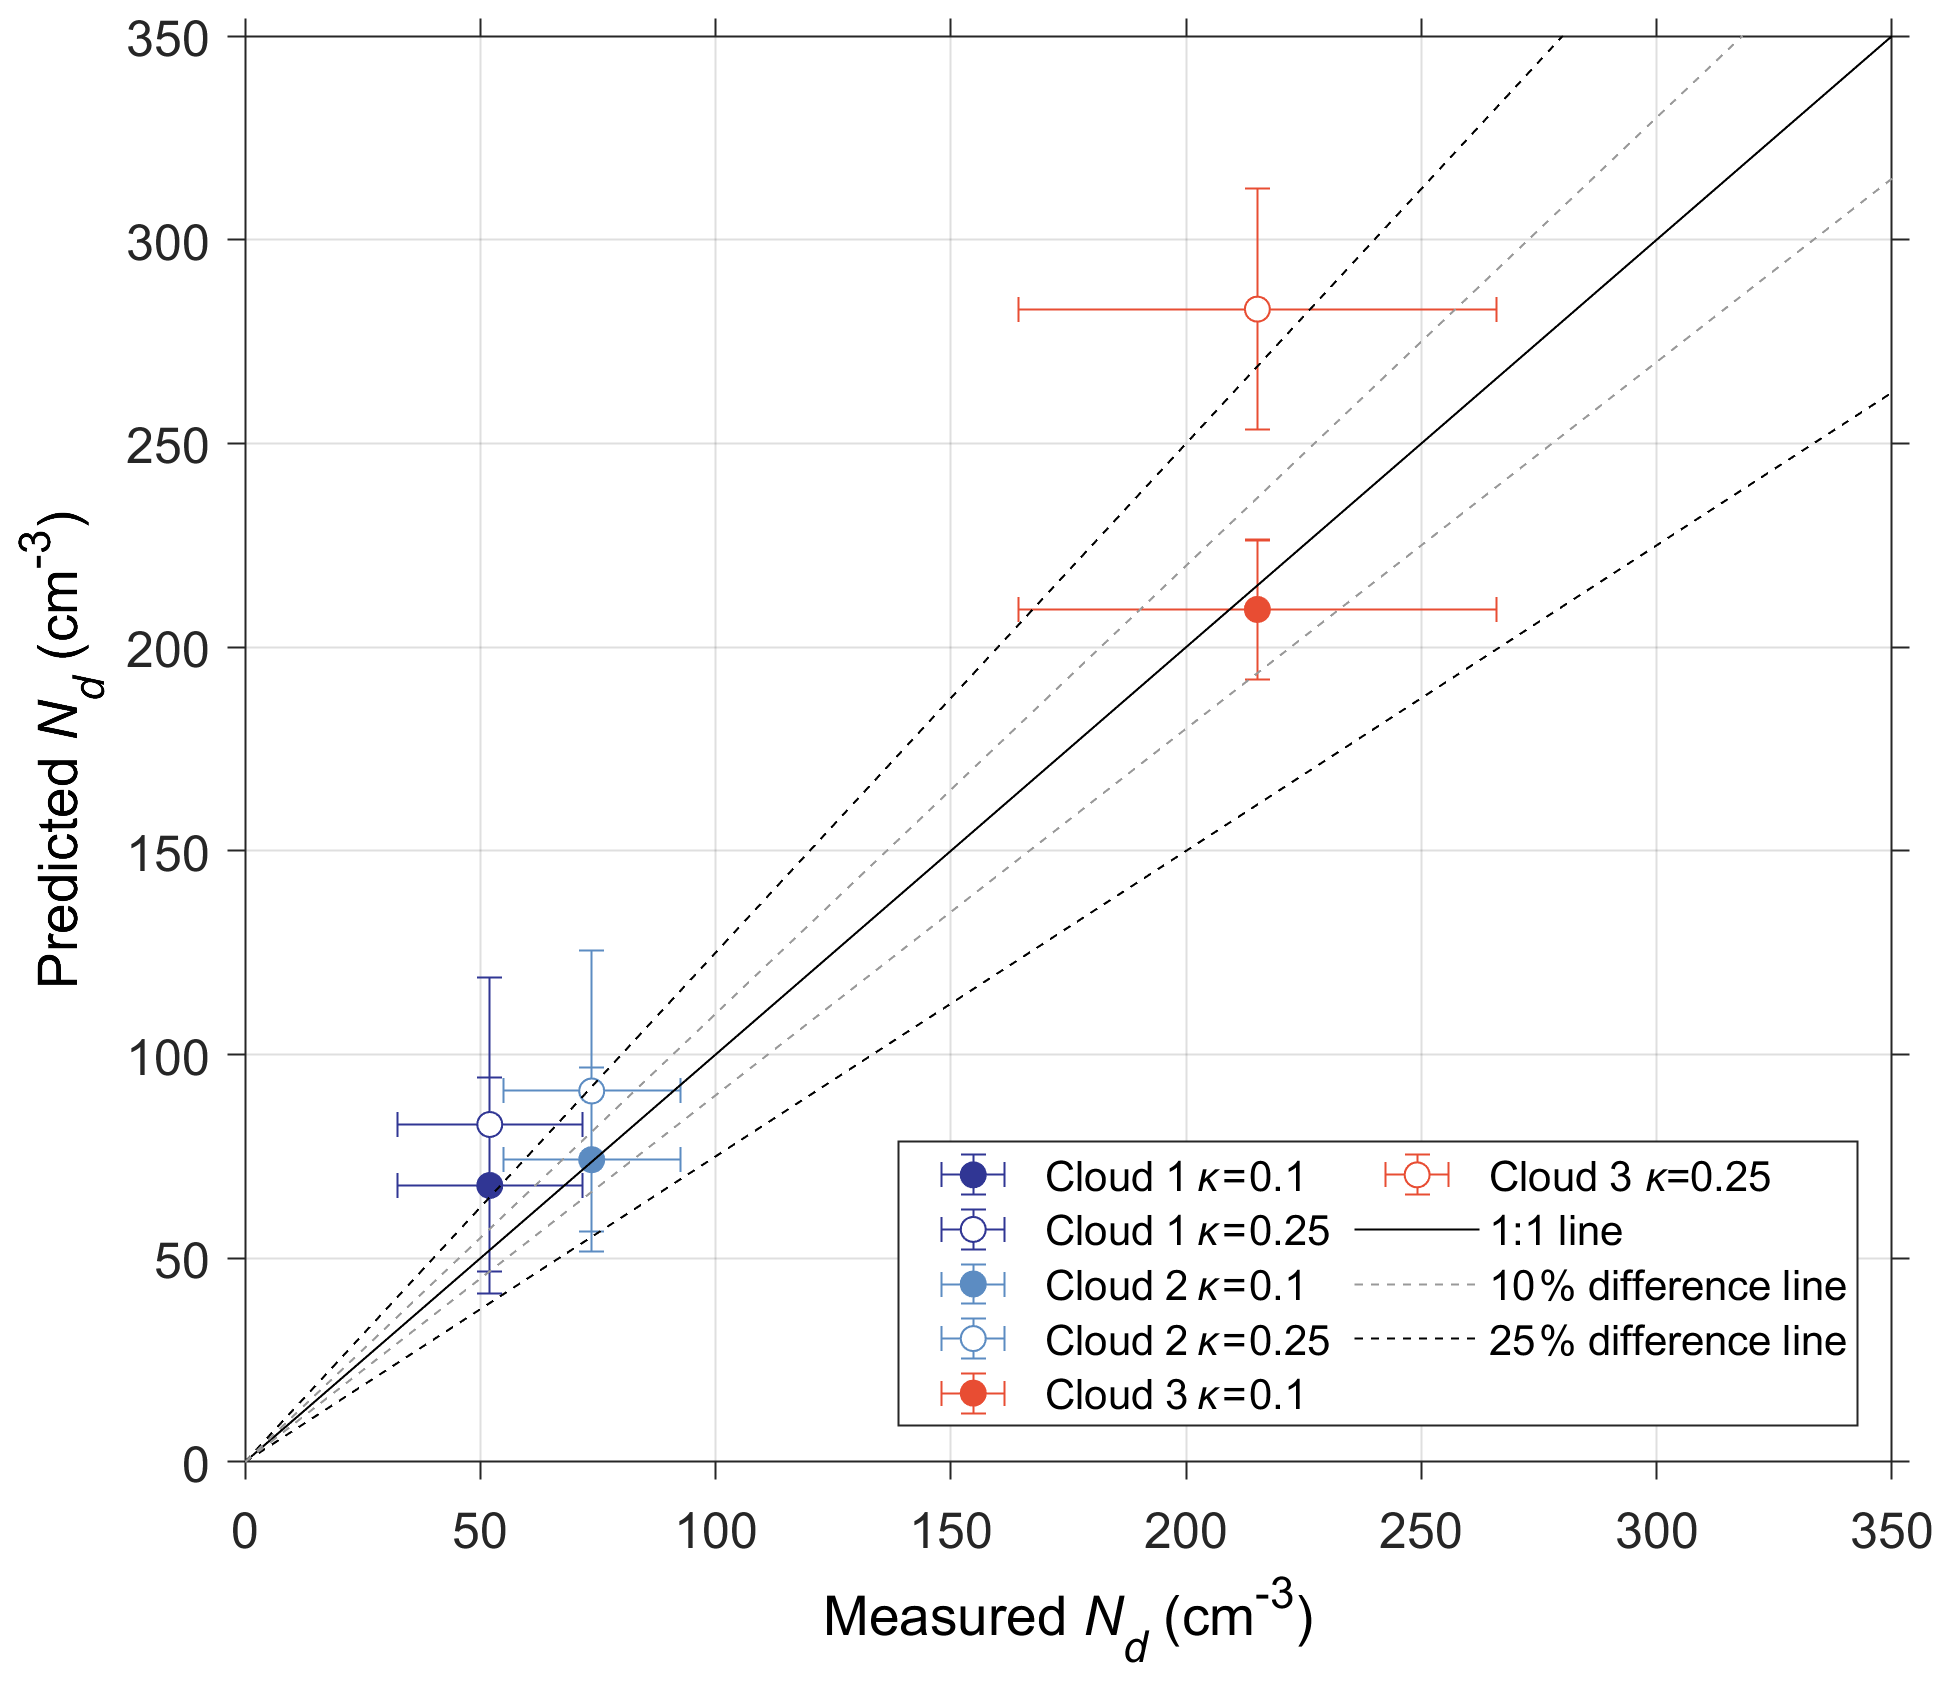
Figure 6Comparison between average predicted Nd (cm−3) with the droplet activation parameterization and observed Nd (cm−3) during the three cloud events on 7 March (blue and cyan circles) and 8 March (orange circles) 2019. For all three cloud events, droplet closure is performed assuming a κ parameter of 0.1 (filled circles) and 0.25 (empty circles). The error bars represent the standard deviation of Nd during each cloud event.
The good agreement between measurements and predictions – even under mixed-phase conditions – reveals that processes like condensation freezing and the removal of cloud droplets through riming and collision coalescence do not disturb the Smax and hence the Nd predicted by the parameterization, at least for the given clouds. That said, it is known that pre-existing liquid and ice hydrometeors falling to the activation region of clouds can deplete the supersaturation affecting the number of the activated droplets; such supersaturation depletion effects can be included in the droplet activation parameterization (Sud et al., 2013; Barahona et al., 2014) if needed. Furthermore, the parameterization predictions indicate that the best fit is achieved using a κ of ∼ 0.1 (Fig. 6). Naer at WOP is likely dominated by lower κ values, indicating that the particles are getting richer in organic material, compared to WFJ, which supports the aerosol analysis carried out in Sect. 3.1. These results are robust, indicating that for non-precipitating BL clouds the proposed calculation method captures cloud droplet formation at WOP and WFJ.
3.2.2 Potential droplet formation at WOP and WFJ
According to the methodology proposed in Sect. 2.3, using the in situ measured Naer, the estimated chemical composition, and the observed updraft velocity range, we determine the potential Nd and Smax that would form over both measurement sites. At WOP, clouds are formed locally due to the local topography (Ramelli et al., 2021a, b), supporting the use of surface measured aerosol to estimate the potential Nd over this site. This is further supported by the good agreement between predicted and measured Nd (Sect. 3.2.1). A similar closure study could not be repeated for WFJ owing to a lack of in situ data; however, the air masses sampled (i.e., those given as input to the parameterization) are often in the FT, so they should contain the same aerosol as the one used to form the clouds. This does not apply under perturbed FT conditions, which are, however, accompanied by the presence of less hygroscopic particles over the mountain-top site and are less likely related to cloud formation (Sect. 3.1). Here we assume a κ of 0.25 to calculate the potential droplets for WFJ according to our CCN-derived hygroscopicity values (Table 2) and given that Smax usually ranges between ∼ 0.1 %–0.3 %. In estimating the potential droplets for WOP, we use a κ of 0.1 given that the aerosol is likely strongly enriched in organics; the good degree of closure supports its selection (Sect. 3.2.1). Figure 7 depicts the potential Nd and the corresponding Smax time series calculated at ambient conditions for WOP (orange dots) and WFJ (blue dots) using cloud updraft velocities that are indicative of the observed σw range (Sect. 3.4), namely 0.1, 0.3, 0.6, and 0.9 m s−1. The same behavior is seen for all four σw values selected while, as expected, larger values of Nd and Smax are achieved at higher σw. During the first days of the period of interest, the calculated Nd at WOP (Fig. 7a, c, e, g) is up to 10 times larger than at WFJ, despite the lower κ values characterizing its aerosol population. WFJ tends to have lower Nd due to the lower Naer recorded. It is also important to highlight the anticorrelation between Smax and Nd values arising from the nonlinear response of droplet number and maximum cloud parcel supersaturation to fluctuations in the available aerosol and CCN concentrations (Reutter et al., 2009; Bougiatioti et al., 2016; Kalkavouras et al., 2019). Higher Naer elevates the potential Nd values. The available condensable water is then shared among more growing droplets, depleting the supersaturation. Even more interesting is the fact that until 28 February the calculated Nd time series at WOP show a pronounced diurnal cycle, similar to the total Naer time series (Sect. 3.1). Lower Nd values are visible after midnight, presumably due to a paucity of BB activities in the valley. Droplet concentrations at WFJ do not follow a diurnal pattern in contrast to the aerosol data (Fig. 1a). However, the activation fraction (i.e., ) at WFJ displays a clear diurnal variability until the end of February (Fig. S5 in the Supplement).
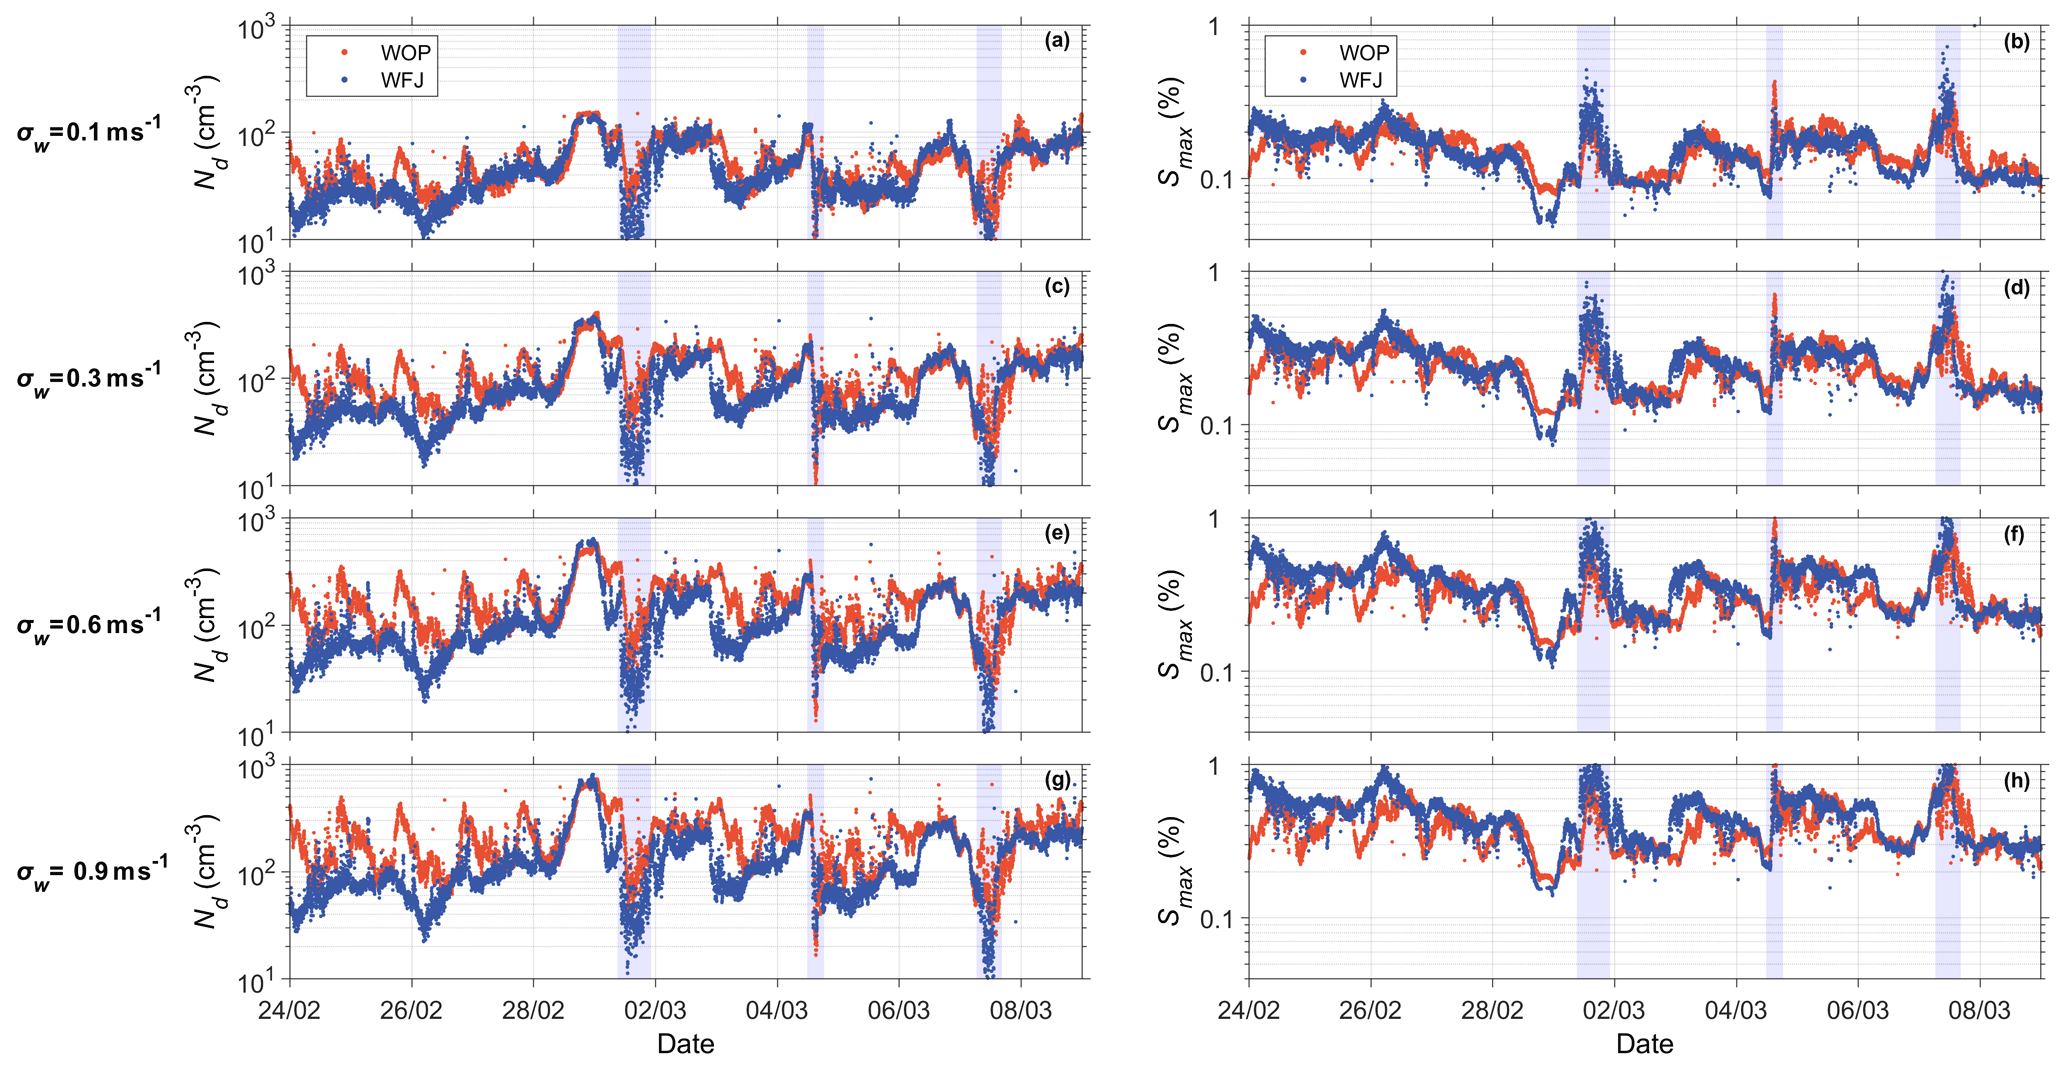
Figure 7Calculated time series of Nd (cm−3) (left panels) and Smax (%) (right panels) for updraft velocities of σw=0.1 m s−1 in panels (a) and (b), 0.3 m s−1 in panels (c) and (d), 0.6 m s−1 in panels (e) and (f), and 0.9 m s−1 in panels (g) and (h) during the period of interest at WOP (orange dots) and WFJ (blue dots). The blue shaded areas represent the intense precipitating periods shown in Fig. 2.
Through comparison with the MeteoSwiss precipitation measurements at WFJ (Fig. 2), it should be emphasized again that during the second sub-period of interest the occurrence of precipitation is followed by a depression in Nd (Fig. 7a, c, e, g) and a concurrent increase in Smax reaching up to ∼ 1 % (Fig. 7b, d, f, h). Especially at WFJ, Nd drops almost to zero on 1, 4, and 7 March, when precipitation is most intense (blue shaded areas in Figs. 2 and 7). These trends are related to the washout of hygroscopic material observed at WFJ (Fig. 2) leading to the extremely low CCN concentrations (∼ 10 cm−3) measured during these 3 d (Fig. 3). During the first two intense precipitation events, the Naer is relatively high compared to the third event, with concentrations reaching up to ∼ 300 cm−3 at both stations (Fig. 2). The small activation fraction (Fig. S5 in the Supplement) combined with the high Smax values indicate once more that small particles that activate into cloud droplets only above 0.3 % to 0.5 % of supersaturation are present at both stations. However, this behavior is not seen on 7 March at WFJ.
3.2.3 Droplet behavior under velocity-limited conditions
Combining the potential Nd and the corresponding Smax with the Naer data yields important information on whether clouds are sensitive to vertical velocity or aerosol changes. Cloud studies (e.g., Jensen and Charlson, 1984; Twomey, 1993; Ghan et al., 1998; Nenes et al., 2001; Reutter et al., 2009) have long recognized the role of water vapor competition on droplet formation, while the success of mechanistic parameterizations for climate models relies on the ability to capture this effect accurately (e.g., Ghan et al., 2011; Morales Betancourt and Nenes, 2014). Twomey (1993) discusses this conceptually and states that competition may be fierce enough to reduce Nd with increasing Naer, which was later demonstrated by Ghan et al. (1998) to occur for mixtures of sulfate aerosol and sea spray. Reutter et al. (2009) did not focus on such extreme conditions of water vapor competition, but rather situations that are consistent with dominance of anthropogenic pollution in clouds. Indeed, for high Naer, droplets in clouds become insensitive to aerosol perturbations, giving rise to the so-called “velocity-limited cloud formation”. Figure 8 displays this by presenting the response of the calculated Nd to changes in Naer for a representative range of updraft velocities prevailing over WOP (top panels) and WFJ (bottom panels). The data are colored by the respective Smax achieved in cloudy updrafts. For low σw values (Fig. 8a, d) we can identify that above an Naer of ∼ 300 cm−3, the Nd at both stations reaches a plateau where it becomes insensitive to further aerosol changes. At WFJ, the same behavior is seen for intermediate σw values and Naer 1000 cm−3 (Fig. 8f). Kacarab et al. (2020) and Bougiatioti et al. (2020) examined a wide range of ambient size distributions and proposed that clouds became velocity limited when Smax dropped below 0.1 %. This reflects the increasingly fierce competition for water vapor during droplet formation, which allows only a few particles to activate into cloud droplets.
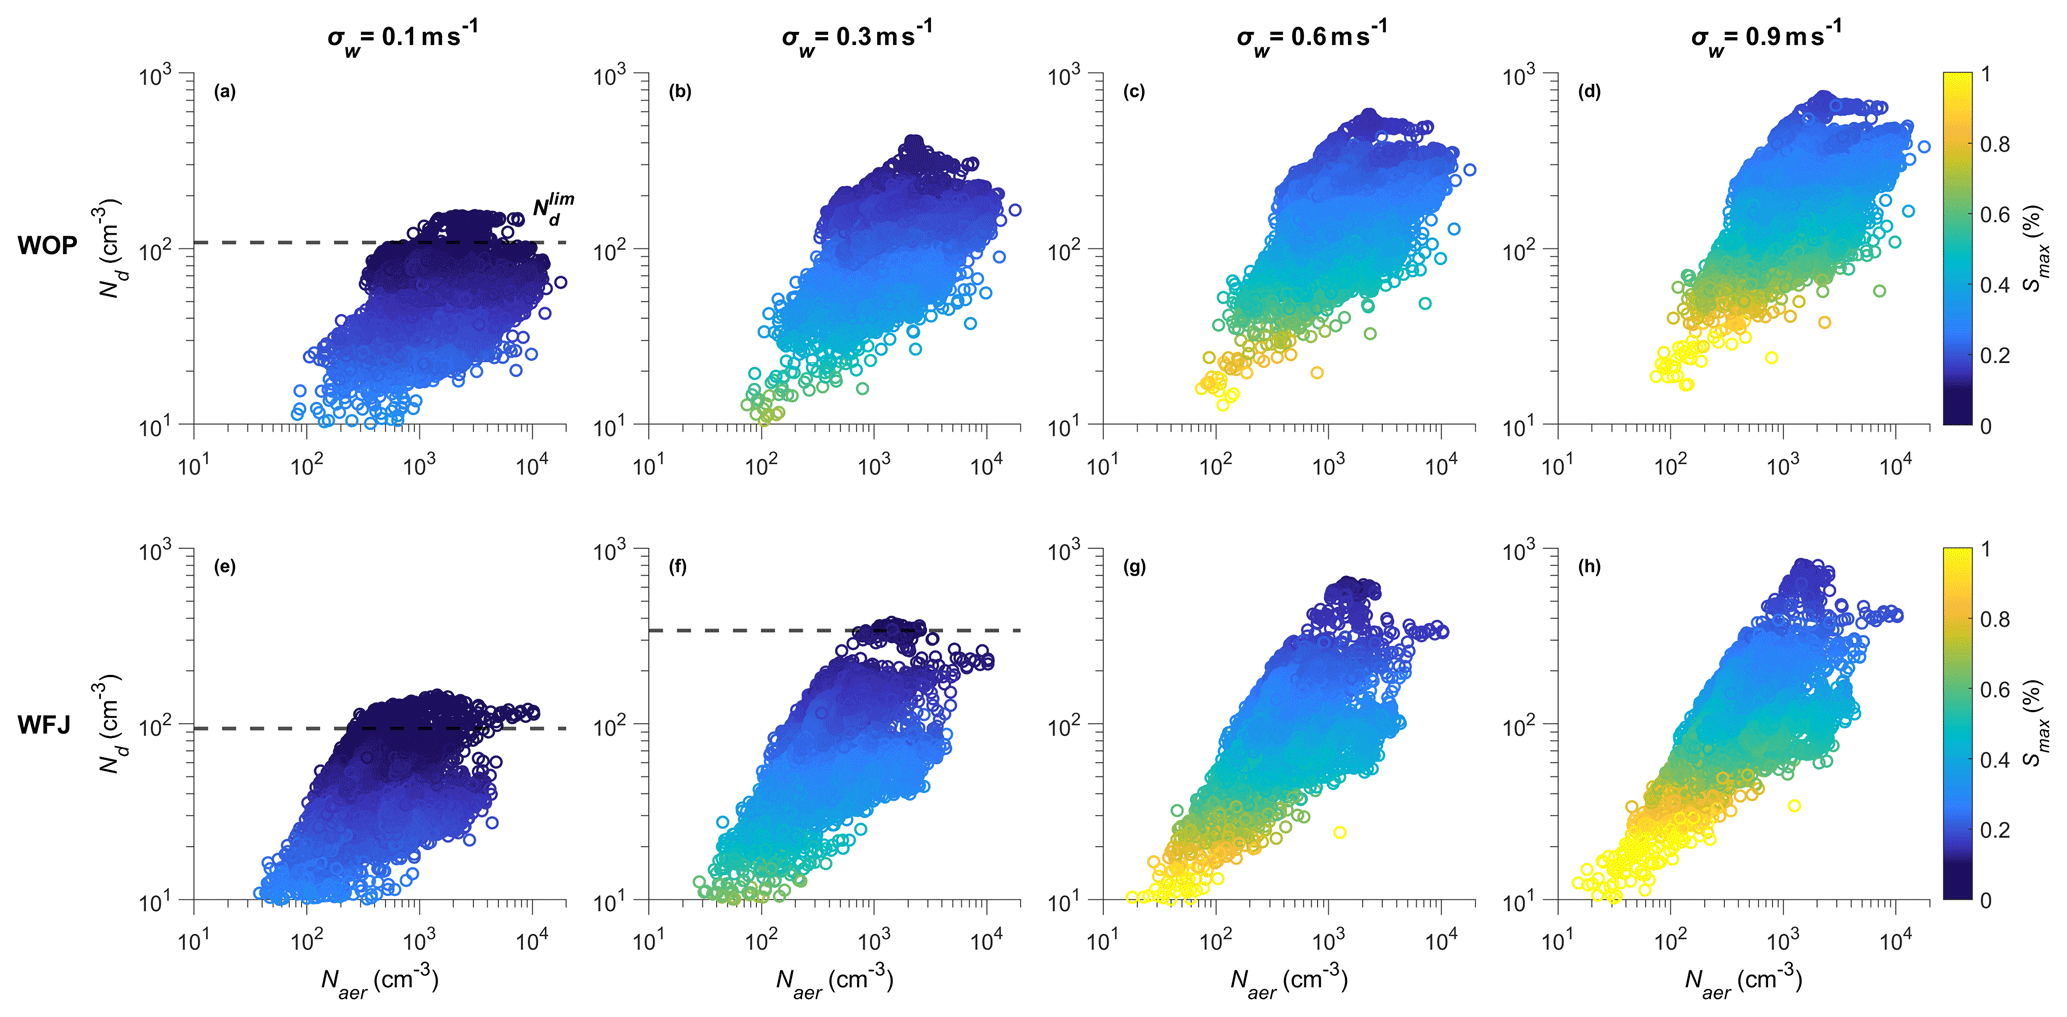
Figure 8In situ Nd (cm−3) vs. Naer (cm−3) for updraft velocities of σw=0.1 m s−1 in panels (a) and (e), 0.3 m s−1 in panels (b) and (f), 0.6 m s−1 in panels (c) and (g), and 0.9 m s−1 in panels (d) and (h) during the period of interest at WOP (top panels) and WFJ (bottom panels). Data are colored by Smax (%).
Building upon these findings, we used the calculated Smax as an indicator for aerosol- or velocity-limited conditions prevailing over the Alps. The horizontal dashed lines plotted in Fig. 8a, e, and f illustrate a plateau, where Smax < 0.1 % and the modulation of the Nd is driven mostly by the cloud dynamics, hence the updraft velocity variability, rather than aerosol variations. This plateau is termed the limiting droplet number (), following Kacarab et al. (2020), and is essentially the maximum Nd that can be formed under these vertical velocity conditions. The vertical-velocity regime is therefore strictly defined as whenever Smax drops below 0.1 % and Nd approaches . Conversely, when Smax in clouds exceeds 0.1 %, droplet formation in the BL of both measurement sites is in the aerosol-limited regime, as the Smax is high enough for clouds to be responsive to aerosol changes.
An alternative way of examining the response to changes in σw is shown in Fig. 9. It should be noted that the values shown on this figure are determined by calculating the averaged Nd achieved whenever Smax < 0.1 % for each examined σw value. At WOP, droplet formation is in the velocity-limited regime only for low σw values, namely 0.1 and 0.2 m s−1, when the activated particles have more time to deplete the gas phase and the Smax reached is that required to activate only the largest particles. At WFJ the prevailing dynamics create velocity-limited conditions even for more turbulent boundary layers when σw reaches up to 0.5 m s−1. (cm−3) is linearly correlated with σw (m s−1), which can be described as (Fig. 9). As a result, doubling σw from 0.1 to 0.2 m s−1 increases by ∼ 60 % for both sites, while transitioning from 0.2 to 0.4 ms−1 further increases by ∼ 45 % and finally an additional ∼ 20 % increase in occurs for WFJ for the 0.4–0.5 m s−1 velocity range. Remarkable agreement is seen for corresponding trends between and σw calculated for marine Stratocumulus clouds formed under extensive BB aerosol plumes over the Southeast Atlantic (SEA) Ocean (Kacarab et al., 2020), along with BL clouds formed in the Southeast United States (SEUS) (Bougiatioti et al., 2020). Both studies have followed the same probabilistic approach for computing Nd as the one followed here. This realization is important as it implies that for regions where velocity-limited conditions are expected (i.e., under particularly high particle loads), and the –σw relationship can be used to diagnose σw from retrievals of droplet number for virtually any type of BL cloud using a number of established methods (e.g., Snider et al., 2017; Grosvenor et al., 2018).
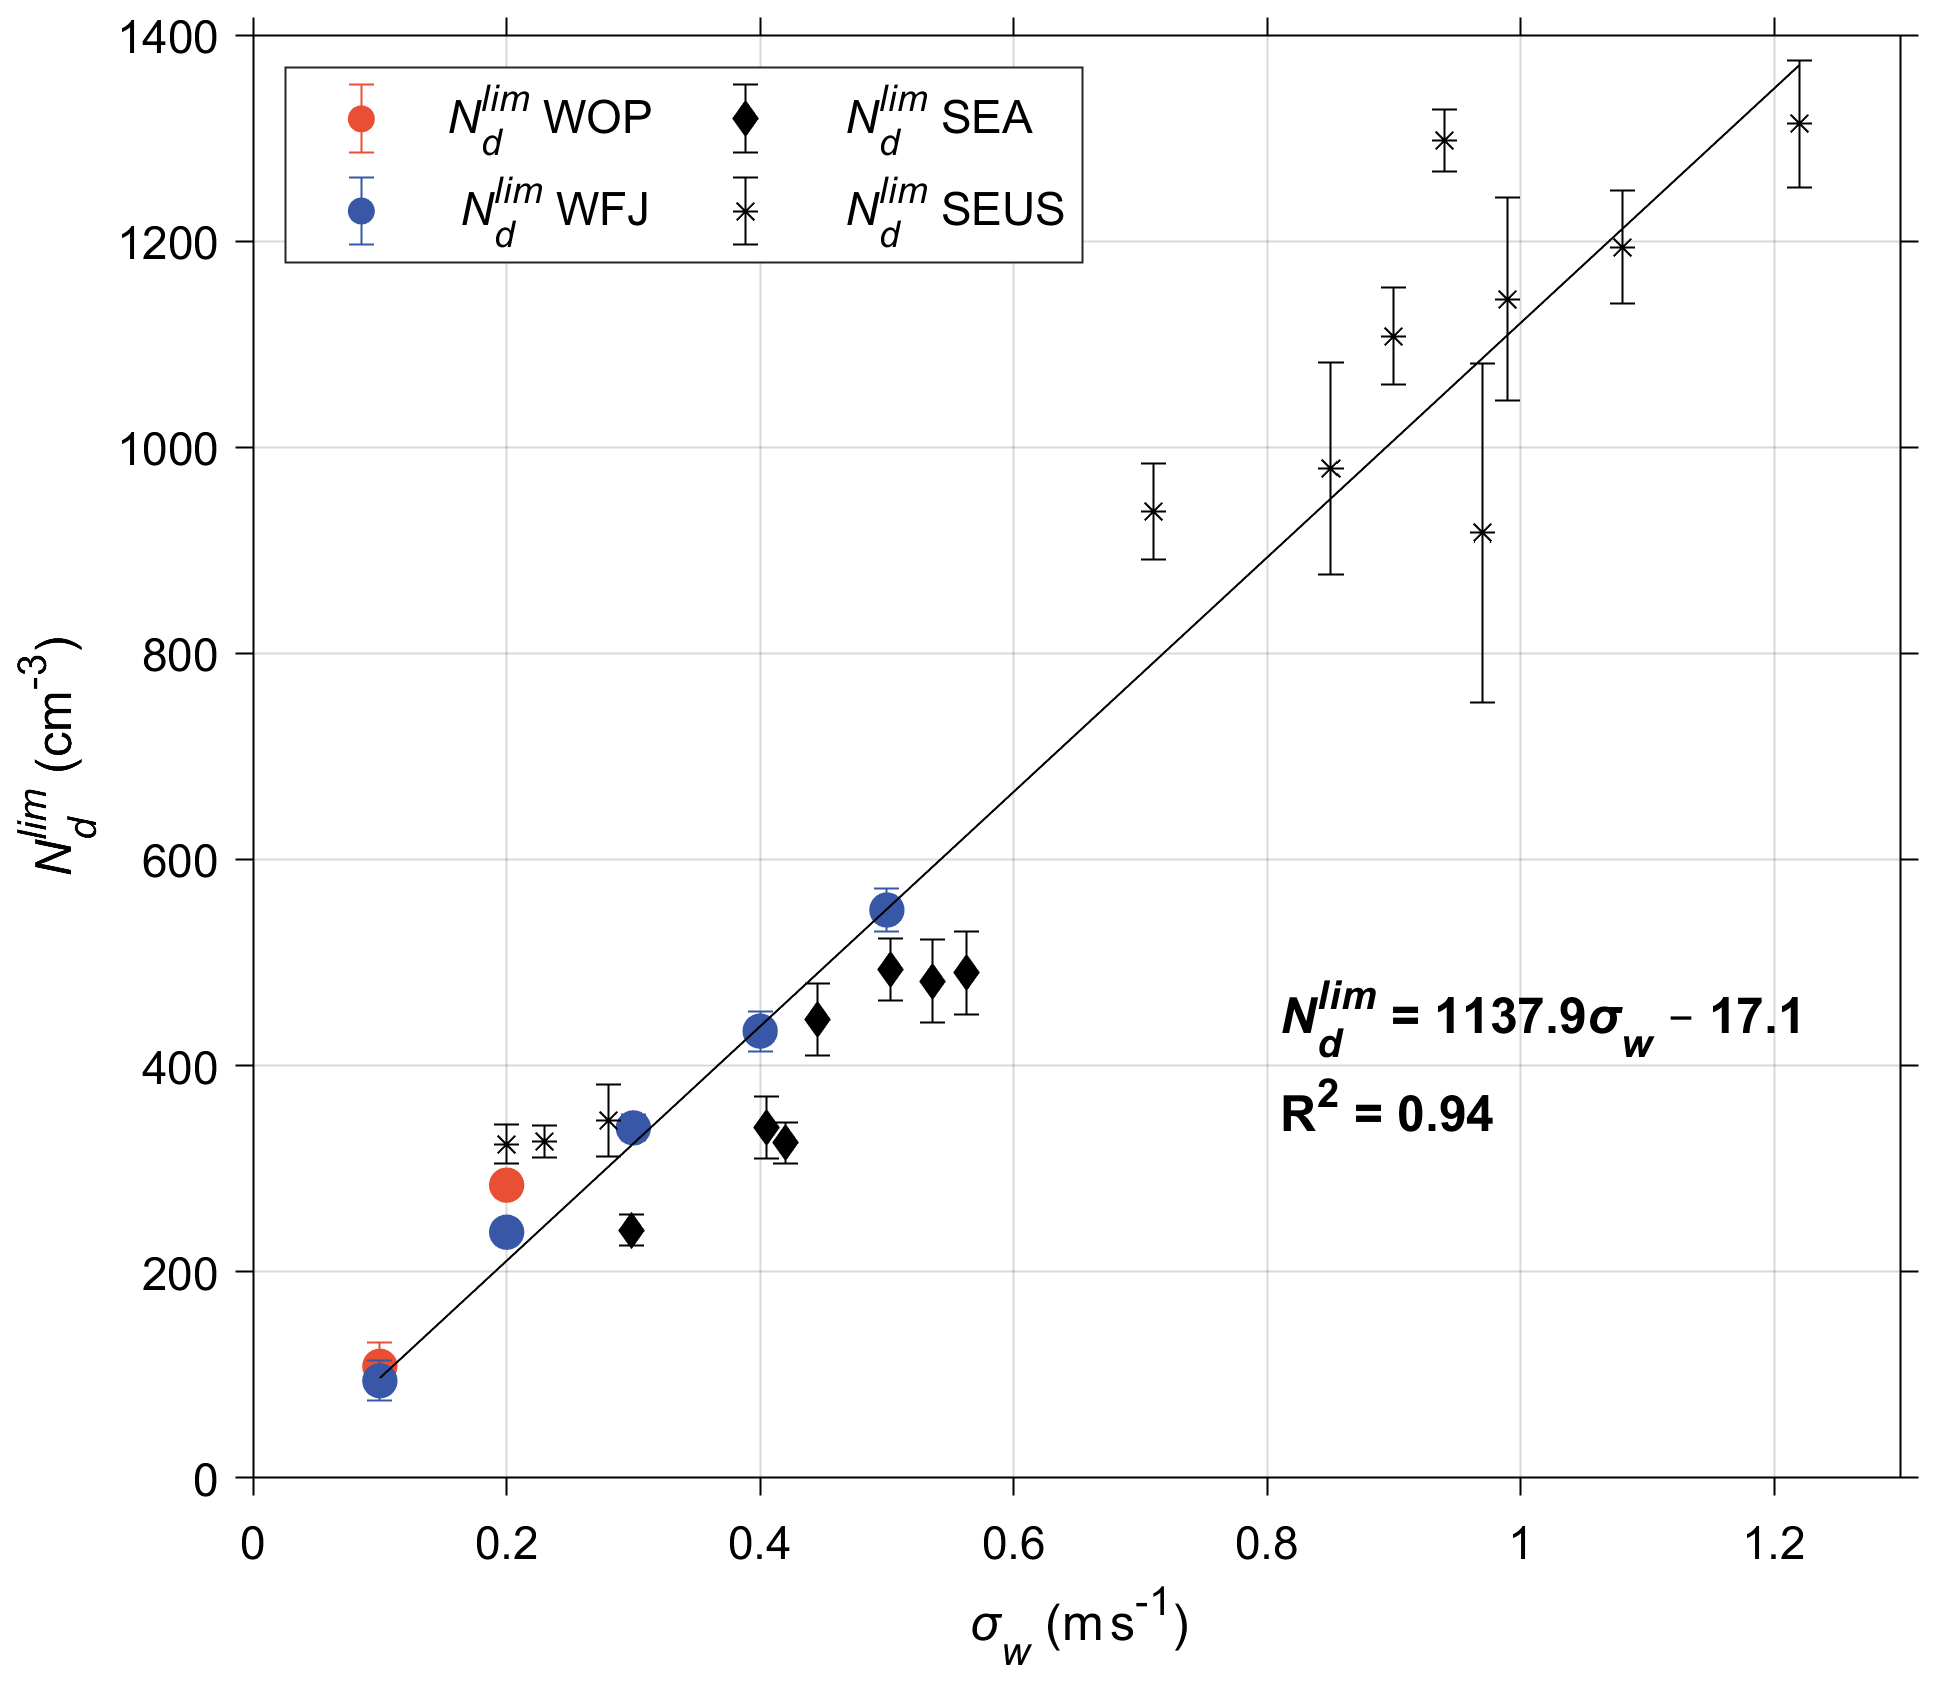
Figure 9 (cm−3) against σw (m s−1) calculated when velocity-limited conditions are met at WOP (orange circles) and WFJ (blue circles) throughout the period of interest. Superimposed are the corresponding values calculated for clouds forming over the SEA Ocean (rhombuses) and over the SEUS (asterisks).
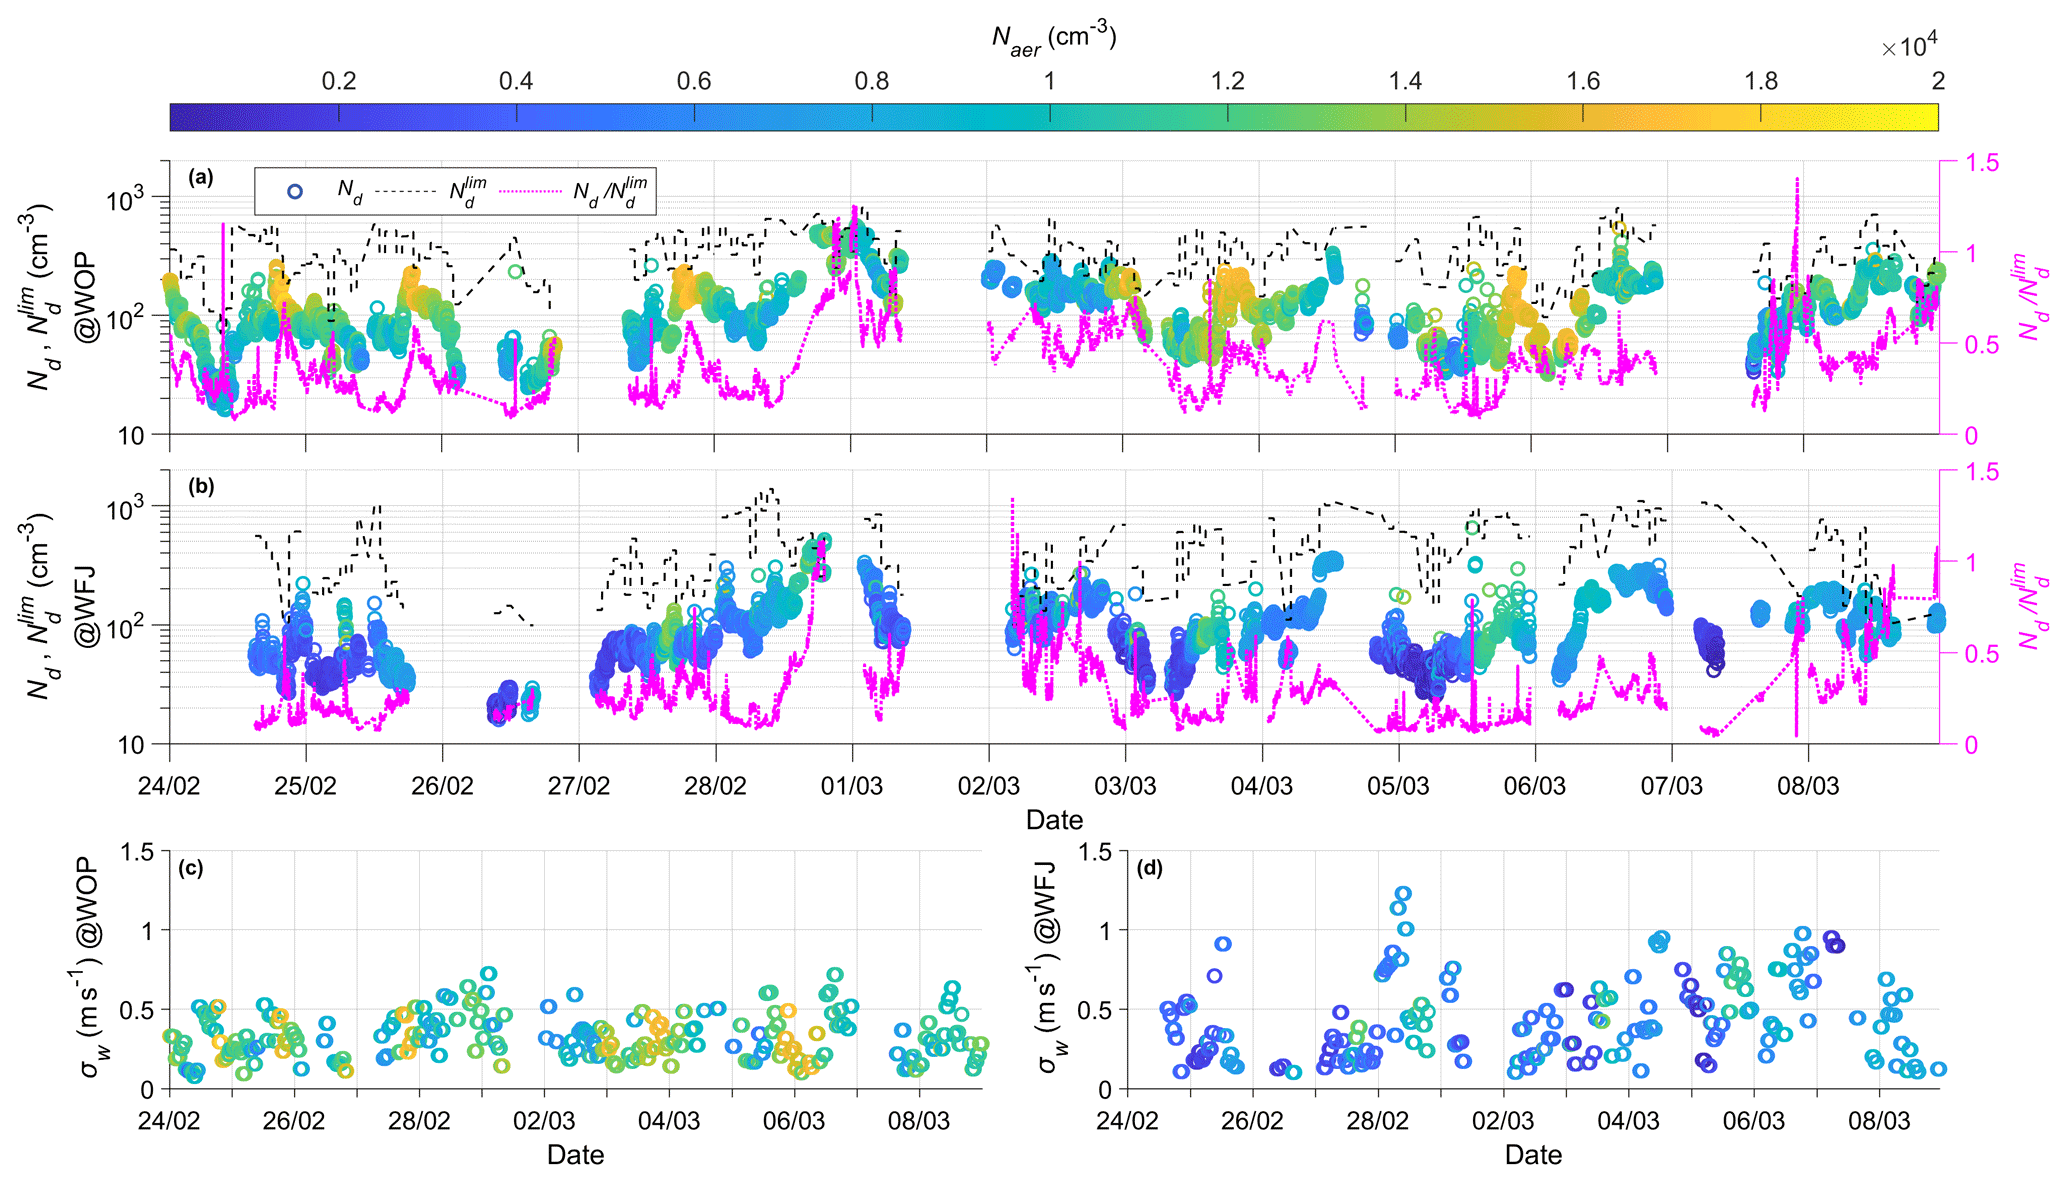
Figure 10Time series of potential Nd (cm−3) (circles colored by Naer) along with (cm−3) (black dashed line) and the ratio between those two (i.e., ) (magenta dotted line) together with the time series of the calculated σw (m s−1) (circles colored by Naer), as estimated for WOP (a, c) and WFJ (b, d).
3.2.4 σw and observed Nd determine if droplet formation is aerosol or velocity limited
Observations of Nd when compared against can potentially be used to deduce if droplet formation is velocity or aerosol limited. This is important because it indicates whether aerosol fluctuations are expected to result in substantial Nd responses in clouds. The strong correlation between σw and enables this comparison. From the σw time series together with the linear –σw relationship (Sect. 3.2.3; Fig. 9) we obtain estimates of for both measurement stations (black dashed line in Fig. 10a, b) and the ratio (magenta dotted lines in Fig. 10a, b). The Nd time series calculated for WOP tend to be approximately one third of for most of the observational period (colored circles in Fig. 10a, b), while for WFJ the same ratio is even lower (∼ ). Focusing on the relatively short periods when Smax values drop below 0.1 %, we estimate that droplet formation over both measurement sites enters a velocity-limited regime when the ratio exceeds a critical value of 0.65, with the most prevalent value being at ∼ 0.9 (Fig. S6 in the Supplement).
Throughout the period of interest, velocity-limited conditions are met at WOP (WFJ) with a frequency of ∼ 0.5 % (∼ 2.5 %) of the total time, again reflecting the sensitivity of droplet formation to aerosol fluctuations. During nighttime, however, when lower σw values (∼ 0.1 m s−1) are recorded at WOP (Fig. 10c), we can observe some short periods characterized by intermediate to high Naer (> 1000 cm−3) when the ratio exceeds ∼ 0.65, indicating that droplet variability is driven by updraft velocity. The σw values calculated at WFJ do not display a clear temporal pattern (Fig. 10d) but are generally higher than those recorded at the valley site. This is expected considering the steepness of the topography than can cause updraft velocities to be higher, especially for air masses approaching the site from the northeasterly directions. Over the high mountain-top site, cloud formation is in the velocity-limited regime (i.e., > 0.65) under high Naer (∼ 1500 cm−3) and higher σw conditions (∼ 0.8 m s−1). These conditions can be created when polluted air masses from the valley site are vertically transported to WFJ.
The current study focuses on the aerosol–CCN–cloud droplet interplay in alpine clouds sampled during the RACLETS field campaign over a two-week period of measurements conducted in the valley (WOP) and at the mountain-top station (WFJ). Our main objective was to investigate the drivers of droplet formation in MPCs formed in the region and understand in which situations Nd is sensitive to aerosol perturbations.
Overall, lower Naer was systematically recorded at WFJ, indicating that the site is influenced by FT conditions. Deviations from this behavior are observed during fair weather conditions, when injections from the BL of lower altitudes can cause up to an order of magnitude elevation in the Naer measured at WFJ. Combining the particle size distribution and CCN number concentration measured at WFJ, the average hygroscopicity parameter κ is about 0.25, consistent with expectations for continental aerosol. The size-dependent κ reveals that accumulation mode particles are more hygroscopic than the smaller ones, which we attribute to an enrichment in organic material associated with primary emissions in the valley. The hygroscopicity of the particles at WFJ exhibit variations until February 28, which could reflect BL injections from the valley. Precipitation events occurring between 1 and 8 March efficiently decrease Naer, sometimes leaving some less hygroscopic particles.
Wind lidar products collected at WOP constrain the PDF of updraft velocities, which combined with observed size distributions and hygroscopicity can be used to calculate the Nd in clouds. We show predictions to agree within 25 % with the limited observations of Nd available. While this degree of closure has been achieved in past studies for liquid-phase clouds, it has not been done at temperatures below freezing and with clouds containing ice, as has been done here.
Combining the potential Nd and the corresponding Smax with the aerosol size distribution data we sought to identify regimes where the clouds formed are aerosol or velocity limited. We found that when sufficient aerosol is present to decrease Smax below 0.1 %, alpine clouds become velocity limited with the Nd reaching an upper limit, ∼ 150–550 cm−3, that depends on σw. Velocity-limited conditions occur when is above 0.65. Based on this understanding, we deduce that droplet formation throughout the period of interest appears most of the time to be aerosol limited. More specifically, at the WOP valley site, clouds become sensitive to updraft velocity variations only during nighttime, when the BL turbulence is low. Conversely, velocity-limited conditions are encountered at WFJ during periods characterized by elevated aerosol and CCN concentrations (> 103 cm−3) and higher σw values (∼ 0.8 m s−1). Although variations in vertical velocity have not always been found to be the strongest factor influencing the cloud microphysical characteristics, correct consideration of updraft velocity fluctuations is crucial to fully understand the drivers of droplet formation and the role of aerosols as a driver of Nd variability.
Interestingly, we find that the same linear relationship between and σw that describes the droplet formation during RACLETS holds for warm boundary layer clouds formed in the SEUS (Bougiatioti et al., 2020) and in the SEA Ocean (Kacarab et al., 2020). This implies that the –σw relationship may be universal, given the wide range of cloud formation conditions it represents. If so, measurements (or remote sensing) of Nd and vertical velocity distribution alone may be used to determine if cloud droplet formation is susceptible to aerosol variations or solely driven by vertical velocity – without any additional aerosol information.
Approaching velocity-limited conditions also carries important implications for ice-formation processes in MPCs, as high Nd means that droplet size and the probability of riming becomes minimum. Indeed, Lance et al. (2011) saw that the concentration of large droplets exceeding 30 µm diameter – critical for rime splintering or droplet shattering to occur – drops considerably for polluted arctic MPCs with LWC ∼ 0.2 g m−3 and Nd ∼ 300–400 cm−3. Assuming that these levels of Nd reflects , the corresponding σw is 0.3–0.35 m s−1 (Fig. 9), which is characteristic for arctic stratus. The same phenomenon can also occur in the alpine clouds studied here, given that velocity-limited conditions ( > 0.65) occur especially during nighttime (Fig. 10). Therefore, observations of Nd and vertical velocity distribution (i.e., ) may possibly be used to determine if SIP from rime splintering and droplet shattering is impeded and, if they occur frequently enough, may help explain the existence of persistent MPCs.
The data used in this study can be downloaded from the EnviDat data portal at https://www.envidat.ch/group/about/raclets-field-campaign (last access: 17 December 2020) and are accessible via https://www.envidat.ch/dataset/ccn-hygroscopicity-predicted-cloud-droplet-numbers-weissfluhjoch (last access: 17 December 2020; https://doi.org/10.16904/envidat.198, Nenes et al., 2020a) and https://www.envidat.ch/dataset/predicted-cloud-droplet-numbers-davos-wolfgang (last access: 17 December 2020; https://doi.org/10.16904/envidat.199, Nenes et al., 2020b), respectively. Meteorological data of both stations are downloaded from the Swiss Federal Office of Meteorology and Climatology MeteoSwiss site (https://gate.meteoswiss.ch/idaweb/login.do, Meteosuisse, 2021). The Gaussian fits used for determining σw and the droplet parameterization used for the calculations in the study are available from Athanasios Nenes (athanasios.nenes@epfl.ch) upon request.
The supplement related to this article is available online at: https://doi.org/10.5194/acp-21-10993-2021-supplement.
PG and AN designed and initiated the study. The methodology and software were developed by AN. The analysis was carried out by PG and AN, with input from ABo, JW, CM, ZAK, JH, MH, ABe, and UL. The CCN instrumentation was setup by ABo, the aerosol instrumentation and inlet setup were done by JW, CM, and ZAK, the cloud data by FR and JH, and the lidar data by MH. Instrument maintenance during the field campaign was carried out by JW and CM. Data curation was provided by PG, AN, JW, CM, and FR. The original manuscript was written by PG and AN with input from all authors. All authors reviewed and commented on the manuscript.
The authors declare that they have no conflict of interest.
Publisher's note: Copernicus Publications remains neutral with regard to jurisdictional claims in published maps and institutional affiliations.
This study was supported by the European Research Council, the CoG-2016 project PyroTRACH (726165) funded by H2020-EU.1.1. – Excellent Science, and from the European Union Horizon 2020 project FORCeS under grant agreement no. 821205. Jörg Wieder, Fabiola Ramelli, Zamin A. Kanji, Jan Henneberger, and Ulrike Lohmann acknowledge funding from Swiss National Science Foundation (SNSF) grant number 200021_175824. Claudia Mignani acknowledges funding from SNSF grant number 200021_169620.
This research has been supported by the European Research Council project PyroTRACH (grant no. 726165), the Horizon 2020 project FORCeS (grant no. 821205), and the Swiss National Science Foundation (grant nos. 200021_175824 and 200021_169620).
This paper was edited by Xiaohong Liu and reviewed by Jefferson Snider and one anonymous referee.
Andreae, M. O. and Rosenfeld, D.: Aerosol-cloud-precipitation interactions. Part 1. The nature and sources of cloud-active aerosols, Earth-Sci. Rev., 89, 13–41, https://doi.org/10.1016/j.earscirev.2008.03.001, 2008.
Baltensperger, U., Gäggeler, H. W., Jost, D. T., Lugauer, M., Schwikowski, M., Weingartner, E., and Seibert, P.: Aerosol climatology at the high-alpine site Jungfraujoch, Switzerland, J. Geophys. Res., 102, 19707–19715, https://doi.org/10.1029/97JD00928, 1997.
Barahona, D., West, R. E. L., Stier, P., Romakkaniemi, S., Kokkola, H., and Nenes, A.: Comprehensively accounting for the effect of giant CCN in cloud activation parameterizations, Atmos. Chem. Phys., 10, 2467–2473, https://doi.org/10.5194/acp-10-2467-2010, 2010.
Barahona, D., Molod, A., Bacmeister, J., Nenes, A., Gettelman, A., Morrison, H., Phillips, V., and Eichmann, A.: Development of two-moment cloud microphysics for liquid and ice within the NASA Goddard Earth Observing System Model (GEOS-5), Geosci. Model Dev., 7, 1733–1766, https://doi.org/10.5194/gmd-7-1733-2014, 2014.
Bergeron, T.: On the physics of clouds and precipitation, Proc. 5th Assembly UGGI, 1935, Lisbon, Portugal, 156–180, 1935.
Bougiatioti, A., Bezantakos, S., Stavroulas, I., Kalivitis, N., Kokkalis, P., Biskos, G., Mihalopoulos, N., Papayannis, A., and Nenes, A.: Biomass-burning impact on CCN number, hygroscopicity and cloud formation during summertime in the eastern Mediterranean, Atmos. Chem. Phys., 16, 7389–7409, https://doi.org/10.5194/acp-16-7389-2016, 2016.
Bougiatioti, A., Nenes, A., Lin, J. J., Brock, C. A., de Gouw, J. A., Liao, J., Middlebrook, A. M., and Welti, A.: Drivers of cloud droplet number variability in the summertime in the southeastern United States, Atmos. Chem. Phys., 20, 12163–12176, https://doi.org/10.5194/acp-20-12163-2020, 2020.
Chow, F. K., De Wekker, Stephan, F. J., and Snyder, B. J.: Mountain weather research and forecasting: recent progress and current challenges, Springer, Dordrecht, the Netherlands, 2013.
Conant, W. C., VanReken, T. M., Rissman, T. A., Varutbangkul, V., Jonsson, H. H., Nenes, A., Jimenez, J. L., Delia, A. E., Bahreini, R., Roberts, G. C., Flagan, R. C., and Seinfeld, J. H.: Aerosol-cloud drop concentration closure in warm cumulus, J. Geophys. Res.-Atmos., 109, D13204, https://doi.org/10.1029/2003JD004324, 2004.
Dusek, U., Frank, G. P., Curtius, J., Drewnick, F., Schneider, J., Krten, A., Rose, D., Andreae, M. O., Borrmann, S., and Pöschl, U.: Enhanced organic mass fraction and decreased hygroscopicity of cloud condensation nuclei (CCN) during new particle formation events, Geophys. Res. Lett., 37, L03804, https://doi.org/10.1029/2009GL040930, 2010.
Fanourgakis, G. S., Kanakidou, M., Nenes, A., Bauer, S. E., Bergman, T., Carslaw, K. S., Grini, A., Hamilton, D. S., Johnson, J. S., Karydis, V. A., Kirkevåg, A., Kodros, J. K., Lohmann, U., Luo, G., Makkonen, R., Matsui, H., Neubauer, D., Pierce, J. R., Schmale, J., Stier, P., Tsigaridis, K., van Noije, T., Wang, H., Watson-Parris, D., Westervelt, D. M., Yang, Y., Yoshioka, M., Daskalakis, N., Decesari, S., Gysel-Beer, M., Kalivitis, N., Liu, X., Mahowald, N. M., Myriokefalitakis, S., Schrödner, R., Sfakianaki, M., Tsimpidi, A. P., Wu, M., and Yu, F.: Evaluation of global simulations of aerosol particle and cloud condensation nuclei number, with implications for cloud droplet formation, Atmos. Chem. Phys., 19, 8591–8617, https://doi.org/10.5194/acp-19-8591-2019, 2019.
Farrington, R. J., Connolly, P. J., Lloyd, G., Bower, K. N., Flynn, M. J., Gallagher, M. W., Field, P. R., Dearden, C., and Choularton, T. W.: Comparing model and measured ice crystal concentrations in orographic clouds during the INUPIAQ campaign, Atmos. Chem. Phys., 16, 4945–4966, https://doi.org/10.5194/acp-16-4945-2016, 2016.
Field, P. R., Lawson, R. P., Brown, P. R. A., Lloyd, G., Westbrook, C., Moisseev, D., Miltenberger, A., Nenes, A., Blyth, A., Choularton, T., Connolly, P., Buehl, J., Crosier, J., Cui, Z., Dearden, C., DeMott, P., Flossmann, A., Heymsfield, A., Huang, Y., Kalesse, H., Kanji, Z. A., Korolev, A., Kirchgaessner, A., Lasher-Trapp, S., Leisner, T., McFarquhar, G., Phillips, V., Stith, J., and Sullivan, S.: Chapter 7. Secondary Ice Production – current state of the science and recommendations for the future, Meteorol. Monogr., 58, 7.1–7.20, https://doi.org/10.1175/amsmonographs-d-16-0014.1, 2017.
Findeisen, W.: Die kolloidmeteorologischen vorgänge bei der niederschlagsbildung, Meteorol. Z., 55, 121–133, 1938.
Fountoukis, C. and Nenes, A.: Continued development of a cloud droplet formation parameterization for global climate models, J. Geophys. Res., 110, D1121, https://doi.org/10.1029/2004JD005591, 2005.
Fountoukis, C., Nenes, A., Meskhidze, N., Bahreini, R., Conant, W. C., Jonsson, H., Murphy, S., Sorooshian, A., Varutbangkul, V., Brechtel, F., Flagan, R. C., and Seinfeld, J. H.: Aerosol-cloud drop concentration closure for clouds sampled during the International Consortium for Atmospheric Research on Transport and Transformation 2004 campaign, J. Geophys. Res., 112, D10S30, https://doi.org/10.1029/2006JD007272, 2007.
Fugal, J. P., Schulz, T. J., and Shaw, R. A.: Practical methods for automated reconstruction and characterization of particles in digital in-line holograms, Meas. Sci. Technol., 20, 075501, https://doi.org/10.1088/0957-0233/20/7/075501, 2009.
Ghan, S., Guzman, G., and Abdul-Razzak, H.: Competition between sea salt and sulfate particles as cloud condensation nuclei, J. Atmos. Sci., 55, 3340–3347, 1998.
Ghan, S. J., Abdul-Razzak, H., Nenes, A., Ming, Y., Liu, X., Ovchinnikov, M., Shipway, B., Meskhidze, N., Xu, J., and Shi, X.: Droplet Nucleation: Physically-based Parameterization and Comparative Evaluation, J. Adv. Model. Earth Syst., 3, M10001, https://doi.org/10.1029/2011MS000074, 2011.
Griesche, H. J., Seifert, P., Ansmann, A., Baars, H., Barrientos Velasco, C., Bühl, J., Engelmann, R., Radenz, M., Zhenping, Y., and Macke, A.: Application of the shipborne remote sensing supersite OCEANET for profiling of Arctic aerosols and clouds during Polarstern cruise PS106, Atmos. Meas. Tech., 13, 5335–5358, https://doi.org/10.5194/amt-13-5335-2020, 2020.
Grosvenor, D. P., Sourdeval, O., Zuidema, P., Ackerman, A., Alexandrov, M. D., Bennartz, R., Boers, R., Cairns, B., Chiu, J. C., Christensen, M., Deneke, H., Diamond, M., Feingold, G., Fridlind, A., Hünerbein, A., Knist, C., Kollias, P., Marshak, A., McCoy, D., Merk, D., Painemal, D., Rausch, J., Rosenfeld, J., Russchenberg, H., Seifert, P., Sinclair, K., Stier, P., van Diedenhoven, B., Wendisch, M., Werner, F., Wood, R., Zhang, Z., and Quaas, J.: Remote sensing of droplet number concentration in warm clouds: A review of the current state of knowledge and perspectives, Rev. Geophys., 56, 409–453, https://doi.org/10.1029/2017RG000593, 2018.
Grubisic, V. and Billings, B. J.: Climatology of the Sierra Nevada mountain-wave events, Mon. Weather Rev., 136, 757–768, https://doi.org/10.1175/2007MWR1902.1, 2008.
Hammer, E., Bukowiecki, N., Gysel, M., Jurányi, Z., Hoyle, C. R., Vogt, R., Baltensperger, U., and Weingartner, E.: Investigation of the effective peak supersaturation for liquid-phase clouds at the high-alpine site Jungfraujoch, Switzerland (3580 m a.s.l.), Atmos. Chem. Phys., 14, 1123–1139, https://doi.org/10.5194/acp-14-1123-2014, 2014.
Hammer, E., Bukowiecki, N., Luo, B. P., Lohmann, U., Marcolli, C., Weingartner, E., Baltensperger, U., and Hoyle, C. R.: Sensitivity estimations for cloud droplet formation in the vicinity of the high-alpine research station Jungfraujoch (3580 m a.s.l.), Atmos. Chem. Phys., 15, 10309–10323, https://doi.org/10.5194/acp-15-10309-2015, 2015.
Henneberg, O., Henneberger, J., and Lohmann, U.: Formation and development of orographic mixed-phase clouds, J. Atmos. Sci., 74, 3703–3724, https://doi.org/10.1175/JAS-D-16-0348.1, 2017.
Henneberger, J., Fugal, J. P., Stetzer, O., and Lohmann, U.: HOLIMO II: a digital holographic instrument for ground-based in situ observations of microphysical properties of mixed-phase clouds, Atmos. Meas. Tech., 6, 2975–2987, https://doi.org/10.5194/amt-6-2975-2013, 2013.
Herrmann, E., Weingartner, E., Henne, S., Vuilleumier, L., Bukowiecki, N., Steinbacher, M., Conen, F., Collaud Coen, M., Hammer, E., Jurányi, Z., Baltensperger, U., and Gysel, M.: Analysis of long-term aerosol size distribution data from Jungfraujoch with emphasis on free tropospheric conditions, cloud influence, and air mass transport, J. Geophys. Res.-Atmos., 120, 9459–9480, https://doi.org/10.1002/2015JD023660, 2015.
Hoyle, C. R., Webster, C. S., Rieder, H. E., Nenes, A., Hammer, E., Herrmann, E., Gysel, M., Bukowiecki, N., Weingartner, E., Steinbacher, M., and Baltensperger, U.: Chemical and physical influences on aerosol activation in liquid clouds: a study based on observations from the Jungfraujoch, Switzerland, Atmos. Chem. Phys., 16, 4043–4061, https://doi.org/10.5194/acp-16-4043-2016, 2016.
IPCC: Climate Change 2013: The Physical Science Basis. Contribution of Working Group I to the Fifth Assessment Report of the Intergovernmental Panel on Climate Change, edited by: Stocker, T. F., Qin, D., Plattner, G.-K., Tignor, M., Allen, S. K., Boschung, J., Nauels, A., Xia, Y., Bex, V., and Midgley, P. M., Cambridge Univ. Press. Cambridge, UK, New York, NY, USA, 1535 pp., https://doi.org/10.1017/CBO9781107415324, 2013.
Jensen, J. B. and Charlson R. J.: On the efficiency of nucleation scavenging, Tellus, 36B, 367–375, https://doi.org/10.3402/tellusb.v36i5.14917, 1984.
Jurányi, Z., Gysel, M., Weingartner, E., DeCarlo, P. F., Kammermann, L., and Baltensperger, U.: Measured and modelled cloud condensation nuclei number concentration at the high alpine site Jungfraujoch, Atmos. Chem. Phys., 10, 7891–7906, https://doi.org/10.5194/acp-10-7891-2010, 2010.
Jurányi, Z., Gysel, M., Weingartner, E., Bukowiecki, N., Kammermann, L., and Baltensperger, U.: A 17 month climatology of the cloud condensation nuclei number concentration at the high alpine site Jungfraujoch, J. Geophys. Res., 116, D1020, https://doi.org/10.1029/2010JD015199, 2011.
Kacarab, M., Thornhill, K. L., Dobracki, A., Howell, S. G., O'Brien, J. R., Freitag, S., Poellot, M. R., Wood, R., Zuidema, P., Redemann, J., and Nenes, A.: Biomass burning aerosol as a modulator of the droplet number in the southeast Atlantic region, Atmos. Chem. Phys., 20, 3029–3040, https://doi.org/10.5194/acp-20-3029-2020, 2020.
Kalkavouras, P., Bougiatioti, A., Kalivitis, N., Stavroulas, I., Tombrou, M., Nenes, A., and Mihalopoulos, N.: Regional new particle formation as modulators of cloud condensation nuclei and cloud droplet number in the eastern Mediterranean, Atmos. Chem. Phys., 19, 6185–6203, https://doi.org/10.5194/acp-19-6185-2019, 2019.
Kammermann, L., Gysel, M., Weingartner, E., and Baltensperger, U.: 13-month climatology of the aerosol hygroscopicity at the free tropospheric site Jungfraujoch (3580 m a.s.l.), Atmos. Chem. Phys., 10, 10717–10732, https://doi.org/10.5194/acp-10-10717-2010, 2010.
Kleissl, J., Honrath, R. E., Dziobak, M. P., Tanner, D., Val Martín, M., Owen, R. C., and Helmig, D.: Occurrence of upslope flows at the Pico mountaintop observatory: A case study of orographic flows on a small, volcanic island, J. Geophys. Res.-Atmos., 112, D10S3, https://doi.org/10.1029/2006JD007565, 2007.
Korolev, A. and Isaac, G.: Phase transformation of mixed-phase clouds, Q. J. R. Meteorol. Soc., 129, 19–38, https://doi.org/10.1256/qj.01.203, 2003.
Lance, S., Shupe, M. D., Feingold, G., Brock, C. A., Cozic, J., Holloway, J. S., Moore, R. H., Nenes, A., Schwarz, J. P., Spackman, J. R., Froyd, K. D., Murphy, D. M., Brioude, J., Cooper, O. R., Stohl, A., and Burkhart, J. F.: Cloud condensation nuclei as a modulator of ice processes in Arctic mixed-phase clouds, Atmos. Chem. Phys., 11, 8003–8015, https://doi.org/10.5194/acp-11-8003-2011, 2011.
Lanz, V. A., Prévôt, A. S. H., Alfarra, M. R., Weimer, S., Mohr, C., DeCarlo, P. F., Gianini, M. F. D., Hueglin, C., Schneider, J., Favez, O., D'Anna, B., George, C., and Baltensperger, U.: Characterization of aerosol chemical composition with aerosol mass spectrometry in Central Europe: an overview, Atmos. Chem. Phys., 10, 10453–10471, https://doi.org/10.5194/acp-10-10453-2010, 2010.
Lathem, T. L., Beyersdorf, A. J., Thornhill, K. L., Winstead, E. L., Cubison, M. J., Hecobian, A., Jimenez, J. L., Weber, R. J., Anderson, B. E., and Nenes, A.: Analysis of CCN activity of Arctic aerosol and Canadian biomass burning during summer 2008, Atmos. Chem. Phys., 13, 2735–2756, https://doi.org/10.5194/acp-13-2735-2013, 2013.
Lauber, A., Henneberger, J., Mignani, C., Ramelli, F., Pasquier, J. T., Wieder, J., Hervo, M., and Lohmann, U.: Continuous secondary-ice production initiated by updrafts through the melting layer in mountainous regions, Atmos. Chem. Phys., 21, 3855–3870, https://doi.org/10.5194/acp-21-3855-2021, 2021.
Lloyd, G., Choularton, T. W., Bower, K. N., Gallagher, M. W., Connolly, P. J., Flynn, M., Farrington, R., Crosier, J., Schlenczek, O., Fugal, J., and Henneberger, J.: The origins of ice crystals measured in mixed-phase clouds at the high-alpine site Jungfraujoch, Atmos. Chem. Phys., 15, 12953–12969, https://doi.org/10.5194/acp-15-12953-2015, 2015.
Lohmann, U.: A glaciation indirect aerosol effect caused by soot aerosols, Geophys. Res. Lett., 29, 11–14, https://doi.org/10.1029/2001GL014357, 2002.
Lohmann, U.: Anthropogenic Aerosol Influences on Mixed-Phase Clouds, Curr. Clim. Chang. Reports, 3, 32–44, https://doi.org/10.1007/s40641-017-0059-9, 2017.
Lohmann, U. and Feichter, J.: Global indirect aerosol effects: a review, Atmos. Chem. Phys., 5, 715–737, https://doi.org/10.5194/acp-5-715-2005, 2005.
Lohmann, U., Henneberger, J., Henneberg, O., Fugal, J. P., Bühl, J., and Kanji, Z. A.: Persistence of orographic mixed-phase clouds, Geophys. Res. Lett., 43, 10512–10519, https://doi.org/10.1002/2016GL071036, 2016.
Meskhidze, N., Nenes, A., Conant, W. C., and Seinfeld, J. H.: Evaluation of a new cloud droplet activation parameterization with in situ data from CRYSTAL-FACE and CSTRIPE, J. Geophys. Res., 110, D1620, https://doi.org/10.1029/2004JD005703, 2005.
Meteosuisse: Meteorological Data, available at: https://gate.meteoswiss.ch/idaweb/login.do, last access: 28 June 2021.
Mignani, C., Creamean, J. M., Zimmermann, L., Alewell, C., and Conen, F.: New type of evidence for secondary ice formation at around −15 °C in mixed-phase clouds, Atmos. Chem. Phys., 19, 877–886, https://doi.org/10.5194/acp-19-877-2019, 2019.
Mignani, C., Wieder, J., Sprenger, M. A., Kanji, Z. A., Henneberger, J., Alewell, C., and Conen, F.: Towards parameterising atmospheric concentrations of ice-nucleating particles active at moderate supercooling, Atmos. Chem. Phys., 21, 657–664, https://doi.org/10.5194/acp-21-657-2021, 2021.
Moore, R. H., Bahreini, R., Brock, C. A., Froyd, K. D., Cozic, J., Holloway, J. S., Middlebrook, A. M., Murphy, D. M., and Nenes, A.: Hygroscopicity and composition of Alaskan Arctic CCN during April 2008, Atmos. Chem. Phys., 11, 11807–11825, https://doi.org/10.5194/acp-11-11807-2011, 2011.
Morales, R. and Nenes, A.: Characteristic updrafts for computing distribution-averaged cloud droplet number and stratocumulus cloud properties, J. Geophys. Res., 115, D1822, https://doi.org/10.1029/2009JD013233, 2010.
Morales, R., Nenes, A., Jonsson, H., Flagan, R. C., and Seinfeld, J. H.: Evaluation of a diabatic droplet activation parameterization using in-situ cloud data, J. Geophys. Res., 116, D15205, https://doi.org/10.1029/2010JD015324, 2011.
Morales Betancourt, R. and Nenes, A.: Droplet activation parameterization: the population-splitting concept revisited, Geosci. Model Dev., 7, 2345–2357, https://doi.org/10.5194/gmd-7-2345-2014, 2014.
Mosimann, L, Weingartner, E., and Waldvogel A.: An analysis of accreted drop sizes and mass on rimed snow crystals, J. Atmos. Sci., 51, 1548–1558, 1994.
Muhlbauer, A. and Lohmann, U.: Sensitivity studies of aerosol-cloud interactions in mixed-phase orographic precipitation, J. Atmos. Sci., 66, 2517–2538, https://doi.org/10.1175/2009JAS3001.1, 2009.
Nenes, A. and Seinfeld, J. H.: Parameterization of cloud droplet formation in global climate models, J. Geophys. Res., 108, 4415, https://doi.org/10.1029/2002jd002911, 2003.
Nenes, A., Ghan, S., Abdul-Razzak, H., Chuang, P. Y., and Seinfeld, J. H.: Kinetic Limitations on Cloud Droplet Formation and Impact on Cloud Albedo, Tellus, 53B, 133–149, 2001.
Nenes, A., Georgakaki, P., and Bougiatioti, A.: CCN, hygroscopicity, predicted cloud droplet numbers Weissfluhjoch, EnviDat, https://doi.org/10.16904/envidat.198, 2020a.
Nenes, A., Georgakaki, P., and Bougiatioti, A.: Predicted cloud droplet numbers Davos Wolfgang, EnviDat, https://doi.org/10.16904/envidat.199, 2020b.
Okamoto, S. and Tanimoto, H.: A review of atmospheric chemistry observations at mountain sites, Prog. Earth Planet. Sci., 3, 34, https://doi.org/10.1186/s40645-016-0109-2, 2016.
Petters, M. D. and Kreidenweis, S. M.: A single parameter representation of hygroscopic growth and cloud condensation nucleus activity, Atmos. Chem. Phys., 7, 1961–1971, https://doi.org/10.5194/acp-7-1961-2007, 2007.
Pringle, K. J., Tost, H., Pozzer, A., Pöschl, U., and Lelieveld, J.: Global distribution of the effective aerosol hygroscopicity parameter for CCN activation, Atmos. Chem. Phys., 10, 5241–5255, https://doi.org/10.5194/acp-10-5241-2010, 2010.
Pruppacher, H. R. and Klett, J. D.: Microphysics of clouds and precipitation, Nature, 284, 88–88, 1980.
Ramelli, F., Beck, A., Henneberger, J., and Lohmann, U.: Using a holographic imager on a tethered balloon system for microphysical observations of boundary layer clouds, Atmos. Meas. Tech., 13, 925–939, https://doi.org/10.5194/amt-13-925-2020, 2020.
Ramelli, F., Henneberger, J., David, R. O., Lauber, A., Pasquier, J. T., Wieder, J., Bühl, J., Seifert, P., Engelmann, R., Hervo, M., and Lohmann, U.: Influence of low-level blocking and turbulence on the microphysics of a mixed-phase cloud in an inner-Alpine valley, Atmos. Chem. Phys., 21, 5151–5172, https://doi.org/10.5194/acp-21-5151-2021, 2021a.
Ramelli, F., Henneberger, J., David, R. O., Bühl, J., Radenz, M., Seifert, P., Wieder, J., Lauber, A., Pasquier, J. T., Engelmann, R., Mignani, C., Hervo, M., and Lohmann, U.: Microphysical investigation of the seeder and feeder region of an Alpine mixed-phase cloud, Atmos. Chem. Phys., 21, 6681–6706, https://doi.org/10.5194/acp-21-6681-2021, 2021b.
Reutter, P., Su, H., Trentmann, J., Simmel, M., Rose, D., Gunthe, S. S., Wernli, H., Andreae, M. O., and Pöschl, U.: Aerosol- and updraft-limited regimes of cloud droplet formation: influence of particle number, size and hygroscopicity on the activation of cloud condensation nuclei (CCN), Atmos. Chem. Phys., 9, 7067–7080, https://doi.org/10.5194/acp-9-7067-2009, 2009.
Roberts, G. C. and Nenes, A.: A continuous-flow streamwise thermal-gradient CCN chamber for atmospheric measurements, Aerosol Sci. Technol., 39, 206–221, https://doi.org/10.1080/027868290913988, 2005.
Roe, G. H.: Orographic Precipitation, Annu. Rev. Earth Planet. Sci., 33, 645–671, https://doi.org/10.1146/annurev.earth.33.092203.122541, 2005.
Rose, D., Gunthe, S. S., Mikhailov, E., Frank, G. P., Dusek, U., Andreae, M. O., and Pöschl, U.: Calibration and measurement uncertainties of a continuous-flow cloud condensation nuclei counter (DMT-CCNC): CCN activation of ammonium sulfate and sodium chloride aerosol particles in theory and experiment, Atmos. Chem. Phys., 8, 1153–1179, https://doi.org/10.5194/acp-8-1153-2008, 2008.
Rotunno, R. and Houze, R. A.: Lessons on orographic precipitation from the Mesoscale Alpine Programme, Q. J. R. Meteorol. Soc., 133, 811–830, https://doi.org/10.1002/qj.67, 2007.
Saleeby, S. M., Cotton, W. R., Lowenthal, D., and Messina, J.: Aerosol impacts on the microphysical growth processes of orographic snowfall, J. Appl. Meteorol. Climatol., 52, 834–852, https://doi.org/10.1175/JAMC-D-12-0193.1, 2013.
Seinfeld, J. H. and Pandis, S. N.: Atmospheric Chemistry and Physics: From Air Pollution to Climate Change, 2nd edn., John Wiley, Hoboken, N.J., USA, 2006.
Seinfeld, J. H., Bretherton, C., Carslaw, K. S., Coe, H., DeMott, P. J., Dunlea, E. J., Feingold, G., Ghan, S., Guenther, A. B., Kahn, R., Kraucunas, I., Kreidenweis, S. M., Molina, M. J., Nenes, A., Penner, J. E., Prather, K. A., Ramanathan, V., Ramaswamy, V., Rasch, P. J., Ravishankara, A. R., Rosenfeld, D., Stephens, G., and Wood, R.: Improving our fundamental understanding of the role of aerosol-cloud interactions in the climate system, Proc. Natl. Acad. Sci. USA, 113, 5781–5790, https://doi.org/10.1073/pnas.1514043113, 2016.
Smith, R. B.: Progress on the theory of orographic precipitation, Spec. Pap. Geol. Soc. Am., 398, 1–16, https://doi.org/10.1130/2006.2398(01), 2006.
Snider, J. R., Leon, D., and Wang, Z.: Droplet concentration and spectral broadening in Southeast Pacific stratocumulus clouds, J. Atmos. Sci., 74, 719–749, https://doi.org/10.1175/JAS-D-16-0043.1, 2017.
Sotiropoulou, G., Sullivan, S., Savre, J., Lloyd, G., Lachlan-Cope, T., Ekman, A. M. L., and Nenes, A.: The impact of secondary ice production on Arctic stratocumulus, Atmos. Chem. Phys., 20, 1301–1316, https://doi.org/10.5194/acp-20-1301-2020, 2020.
Sotiropoulou, G., Vignon, É., Young, G., Morrison, H., O'Shea, S. J., Lachlan-Cope, T., Berne, A., and Nenes, A.: Secondary ice production in summer clouds over the Antarctic coast: an underappreciated process in atmospheric models, Atmos. Chem. Phys., 21, 755–771, https://doi.org/10.5194/acp-21-755-2021, 2021.
Sud, Y. C., Lee, D., Oreopoulos, L., Barahona, D., Nenes, A., and Suarez, M. J.: Performance of McRAS-AC in the GEOS-5 AGCM: aerosol-cloud-microphysics, precipitation, cloud radiative effects, and circulation, Geosci. Model Dev., 6, 57–79, https://doi.org/10.5194/gmd-6-57-2013, 2013.
Sullivan, S. C., Lee, D., Oreopoulos, L., and Nenesa, A.: Role of updraft velocity in temporal variability of global cloud hydrometeor number, Proc. Natl. Acad. Sci. USA, 113, 5791–5796, https://doi.org/10.1073/pnas.1514039113, 2016.
Sullivan, S. C., Barthlott, C., Crosier, J., Zhukov, I., Nenes, A., and Hoose, C.: The effect of secondary ice production parameterization on the simulation of a cold frontal rainband, Atmos. Chem. Phys., 18, 16461–16480, https://doi.org/10.5194/acp-18-16461-2018, 2018.
Tokay, A., Wolff, D. B., and Petersen, W. A.: Evaluation of the new version of the laser-optical disdrometer, OTT parsivel, J. Atmos. Ocean. Technol., 31, 1276–1288, https://doi.org/10.1175/JTECH-D-13-00174.1, 2014.
Touloupas, G., Lauber, A., Henneberger, J., Beck, A., and Lucchi, A.: A convolutional neural network for classifying cloud particles recorded by imaging probes, Atmos. Meas. Tech., 13, 2219–2239, https://doi.org/10.5194/amt-13-2219-2020, 2020.
Tröstl, J., Herrmann, E., Frege, C., Bianchi, F., Molteni, U., Bukowiecki, N., Hoyle, C. R., Steinbacher, M., Weingartner, E., Dommen, J., Gysel, M., and Baltensperger, U.: Contribution of new particle formation to the total aerosol concentration at the high-altitude site Jungfraujoch (3580masl, Switzerland), J. Geophys. Res.-Atmos., 121, 11692–11711, https://doi.org/10.1002/2015JD024637, 2016.
Twomey, S.: Radiative properties of clouds, in: Aerosol Effects on Climate, edited by: Jennings, S. G., The University of Arizona Press, Tucson, USA, 278–280, 1993.
Vosper, S. B., Wells, H., Sinclair, J. A., and Sheridan, P. F.: A climatology of lee waves over the UK derived from model forecasts, Meteorol. Appl., 20, 466–481, https://doi.org/10.1002/met.1311, 2013.
Wang, J., Lee, Y.-N., Daum, P. H., Jayne, J., and Alexander, M. L.: Effects of aerosol organics on cloud condensation nucleus (CCN) concentration and first indirect aerosol effect, Atmos. Chem. Phys., 8, 6325–6339, https://doi.org/10.5194/acp-8-6325-2008, 2008.
Zubler, E. M., Lohmann, U., Lüthi, D., Schär, C., and Muhlbauer, A.: Statistical analysis of aerosol effects on simulated mixed-phase clouds and precipitation in the Alps, J. Atmos. Sci., 68, 1474–1492, https://doi.org/10.1175/2011JAS3632.1, 2011.