the Creative Commons Attribution 4.0 License.
the Creative Commons Attribution 4.0 License.
 | 15 Jul 2021
Intensified modulation of winter aerosol pollution in China by El Niño with short duration
Liangying Zeng
Hailong Wang
Jing Wang
Lili Ren
Huimin Li
Yang Zhou
Pinya Wang
Hong Liao
El Niño–Southern Oscillation (ENSO), a phenomenon of periodic changes in sea surface temperature in the equatorial central-eastern Pacific Ocean, is the strongest signal of interannual variability in the climate system with a quasi-period of 2–7 years. El Niño events have been shown to have important influences on meteorological conditions in China. In this study, the impacts of El Niño with different durations on aerosol concentrations and haze days during December–January–February (DJF) in China are quantitatively examined using the state-of-the-art Energy Exascale Earth System Model version 1 (E3SMv1). We find that PM2.5 concentrations are increased by 1–2 µg m−3 in northeastern and southern China and decreased by up to 2.4 µg m−3 in central-eastern China during El Niño events relative to the climatological means. Compared to long-duration (LD) El Niño events, El Niño with short duration (SD) but strong intensity causes northerly wind anomalies over central-eastern China, which is favorable for aerosol dispersion over this region. Moreover, the anomalous southeasterly winds weaken the wintertime prevailing northwesterly in northeastern China and facilitate aerosol transport from southern and southeast Asia, enhancing aerosol increase in northeastern China during SD El Niño events relative to LD El Niño events. In addition, the modulation effect on haze days by SD El Niño events is 2–3 times more than that by LD El Niño events in China. The aerosol variations during El Niño events are mainly controlled by anomalous aerosol accumulation/dispersion and transport due to changes in atmospheric circulation, while El Niño-induced precipitation change has little effect. The occurrence frequency of SD El Niño events has been increasing significantly in recent decades, especially after the 1940s, suggesting that El Niño with short duration has exerted an increasingly intense modulation on aerosol pollution in China over the past few decades.
- Article
(13883 KB) - Full-text XML
- BibTeX
- EndNote


Since the beginning of the 21st century, China has experienced frequent events of heavy haze pollution (Yang et al., 2018). The excessive aerosol concentrations during the heavy haze events can cause a large decrease in atmospheric visibility (Han et al., 2013) and pose significant public health hazards, such as a dramatic increase in cardiovascular and respiratory diseases and associated mortality rates (Liu et al., 2019). PM2.5 (particulate matter less than 2.5 µm in diameter) has been reported to be the fifth leading risk factor for mortality, inducing 7.6 % of total deaths globally in 2015 (Cohen et al., 2017). In order to alleviate air pollution, a comprehensive and better scientific understanding of factors that can affect aerosol concentrations and haze pollution in China is required.
Undoubtedly, the rise of anthropogenic emissions is the fundamental reason for the increase in aerosol concentration and haze pollution events (Huang et al., 2014), but the unfavorable meteorological conditions, as one of the most important external factors, have been reported to have substantial influences on haze formation (Yang et al., 2016a; Wang et al., 2019; J. Wang et al., 2020a). With increasing greenhouse gases in the future (2050–2099), severe winter haze events in Beijing would become 50 % more frequent and 80 % longer in duration compared to the historical period (1950–1999), due to an accelerated warming of the lower atmosphere and weakening of the East Asian winter monsoon (Cai et al., 2017). In addition, external forcings, such as the Pacific Decadal Oscillation (Zhao et al., 2016) and Arctic sea ice (Wang et al., 2015; Zou et al., 2020), all have important impacts on aerosol concentrations and haze pollution in China. El Niño–Southern Oscillation (ENSO), as another prominent climate phenomenon caused by the coupled atmosphere–ocean interactions in the tropical Pacific Ocean (Trenberth, 2019), is a significant signal of interannual climate change on a global scale. It triggers atmospheric circulation and precipitation anomalies globally (Yang et al., 2016b, c) and certainly has an important impact on haze events and aerosol concentrations in China by modulating the East Asian winter monsoon system (Sakai and Kawamura, 2009; Wang et al., 2000; Zhang et al., 2017).
The ENSO cycle is composed of a warm phase (i.e., El Niño) and a cool phase (i.e., La Niña) of sea surface temperatures (SSTs) over the tropical eastern Pacific Ocean, which further cause precipitation, atmospheric circulation and temperature anomalies in much of the tropics and subtropics. Such changes also affect the spatiotemporal distribution of aerosols in China (Feng et al., 2017, 2020; Sun et al., 2018; Yang et al., 2014; Zhao et al., 2018; Zhu et al., 2012; J. Wang et al., 2020b). During a strong El Niño event in 2015/16, PM2.5 concentrations in winter were observed to increase by 20–100 µg m−3 in eastern China compared to that in 2014, which was attributed to the weakened wind speed in the North China Plain during the El Niño event (Chang et al., 2016; J. Wang et al., 2020a). PM2.5 concentrations in southern China were also decreased by about 20 µg m−3 during the 2015/16 El Niño event, which was attributed to an enhanced precipitation and aerosol wet scavenging over this region. Many studies counted haze days based on atmospheric visibility and found that El Niño events could induce more (fewer) winter haze days in northern (southern) China (Gao and Li, 2015; Li et al., 2017). In addition to surface observations, several studies have also analyzed the relationship between ENSO events and aerosol loading based on aerosol optical depth (AOD) data from satellite retrievals (Jeoung et al., 2014; Sun et al., 2018). Jeoung et al. (2014) analyzed the combined AOD data of MODIS (Moderate Resolution Imaging Spectroradiometer), MISR (Multi-angle Imaging SpectroRadiometer) and AERONET (AErosol RObotic NETwork) and found that, during the warm phase of ENSO, the fine-mode AOD increased in eastern coastal areas but decreased in some inland areas of China. Sun et al. (2018) studied the influence of ENSO events on the interannual variation of wintertime aerosol in China using AOD data (1980–2016) from MERRA-2 reanalysis (Modern-Era Retrospective analysis for Research and Applications, version 2) and found that AOD in the North China Plain increased significantly during El Niño events, with a 15 % increment in the Beijing-Tianjin-Hebei region compared to the long-term average. They also pointed out that AOD increased in eastern and southern China and decreased in southwestern China during El Niño events.
Although observational data showed that aerosols in China were largely perturbed during El Niño events, the individual impacts of atmospheric circulation and precipitation anomalies associated with El Niño could not be simply extracted with observations alone. Numerical simulations have been used to isolate the individual impacts of El Niño on aerosols in China through a superimposed SST perturbation method and explore the underlying mechanisms (Yu et al., 2019; Zhao et al., 2018). Based on an aerosol–climate coupling model, Zhao et al. (2018) suggested that El Niño increased the seasonal mean aerosol concentration in southern China in winter, which is mainly due to the increased aerosol transport from southern and southeast Asia. Using the same model, Yu et al. (2019) showed that, relative to the climatological mean, wintertime surface aerosol concentrations in northeastern and southeastern China (central and southwestern China) increased (decreased) during El Niño events, which was mainly attributed to anomalies in near-surface winds and the resulting aerosol mass flux divergences. Sun et al. (2018) used the aerosol–climate model CAM5 to simulate the impact of ENSO events on the interannual variability of AOD in China and found that El Niño events led to an increase in AOD in central and eastern China. They suggested that the change in AOD was mainly dominated by the change in meridional winds.
Some studies focused on the effects of different spatial types (e.g., eastern Pacific and central Pacific El Niño; Kao and Yu, 2009) and intensities of El Niño events on aerosol concentrations in China (e.g., Yu et al., 2019). Yu et al. (2019) found that, due to the difference in atmospheric circulation between the two types of El Niño, central Pacific El Niño events resulted in a larger increase in aerosol burden in southern China than eastern Pacific El Niño events. They also indicated that a moderate El Niño event led to an increase in seasonal mean near-surface aerosol concentrations throughout eastern China in winter, while a strong or weak El Niño event brought about a significant decrease in aerosol concentrations in northern China.
Apart from the spatial types with different intensities, El Niño can also be categorized as short duration (SD) and long duration (LD) according to the length of their decay periods (Boo et al., 2004; Chen et al., 2012; Guo and Tan, 2018). These two temporal types of El Niño events have been confirmed to have different impacts on the SSTs, vertical wind shear, relative humidity and precipitation in the South China Sea and Philippine Sea (Guo and Tan, 2018; Wu et al., 2019). The El Niño events with different durations are likely to have different impacts on the aerosol distribution in China. However, few studies explore the different impacts of SD and LD El Niño events on aerosol concentrations and haze days in China, as well as the associated mechanisms, which are essential for air pollution control in the near future.
In this study, the effects of SD and LD El Niño events on wintertime aerosols in China are investigated by using the state-of-the-art Energy Exascale Earth System Model (E3SM). The data, model and analysis methods used in this research are presented in Sect. 2. The influences of different durations of El Niño events on aerosols over China and the mechanisms involved are analyzed in Sect. 3. Summary of the main results and discussion of the implications for future research are provided in Sect. 4.
2.1 Data
We use the following datasets in this study.
-
The merged Hadley-NOAA/OI SST and sea ice concentration (SIC) datasets from 1870 to 2017 with a horizontal resolution of (Hurrell et al., 2008) are used to obtain the climatological mean SST and SIC pattern and the anomalies of SST during SD and LD El Niño events.
-
Monthly mean emissions of aerosols and their precursors in 2014 from the CMIP6 (Coupled Model Intercomparison Project Phase 6) (Hoesly et al., 2018; van Marle et al., 2017) with emissions in China replaced by the MEIC (Multi-resolution Emission Inventory for China) emission inventory are used as input datasets in model simulations.
-
Hourly observations of PM2.5 concentrations at 1657 stations over China from December 2014 to February 2015 derived from the China National Environmental Monitoring Centre (CNEMC) are applied to evaluate the model performance.
-
Monthly averaged ERA5 reanalysis data from 1950 to 2017 (Hersbach et al., 2020) provided by the European Centre for Medium-Range Weather Forecasts (ECMWF) are used to evaluate the simulated meteorological parameters during El Niño events.
2.2 SD and LD El Niño events
Here we first describe how the LD and SD El Niño events are defined. The year in which El Niño developed is denoted by year0, and the months of that year are denoted by Jan0, Feb0, … and Dec0, while the following year and months are year1 and Jan1, Feb1, … and Dec1, respectively. The Niño 3.4 index is the detrended SST anomaly over the Niño 3.4 region (170–120∘ W, 5∘ S–5∘ N). The El Niño event is firstly identified when a 3-month running mean Niño 3.4 index is greater than 0.75 ∘C in any month from Oct0 to Feb1 of its developing phase. If the Niño 3.4 index is higher than 0.5 ∘C in any month from Oct1 to Feb2 of its decaying phase, the El Niño event is an LD El Niño event; otherwise, it is an SD El Niño event (Wu et al., 2019).
Figure 1 shows the time series of the Niño 3.4 indices calculated based on the Hadley-NOAA/OI data for the period 1870–2017. According to the definition above, totally 30 El Niño events are identified in this time period, with 22 SD El Niño events (1877/78, 1885/86, 1888/89, 1896/97, 1902/03, 1911/12, 1923/24, 1925/26, 1930/31, 1951/52, 1957/58, 1963/64, 1965/66, 1972/73, 1982/83, 1991/92, 1994/95, 1997/98, 2002/03, 2006/07, 2009/10, 2015/16 as developing phase) and 8 LD El Niño events (1899/1900, 1904/05, 1913/14, 1918/19, 1939/40, 1968/69, 1976/77, 1986/87 as developing phase). The temporal evolution of the Niño 3.4 indices during the developing and decaying phases of SD and LD El Niño events is shown in Fig. 2. During the developing phase from Jul0 to Feb1, due to the fast accumulation of ocean heat content and rapid adjustments of the surrounding seas to the tropical Pacific Ocean warming (Wu et al., 2019), the Niño 3.4 indices are higher in SD El Niño events, but the SST anomaly decreases rapidly in the decaying phase, compared to those in LD events.
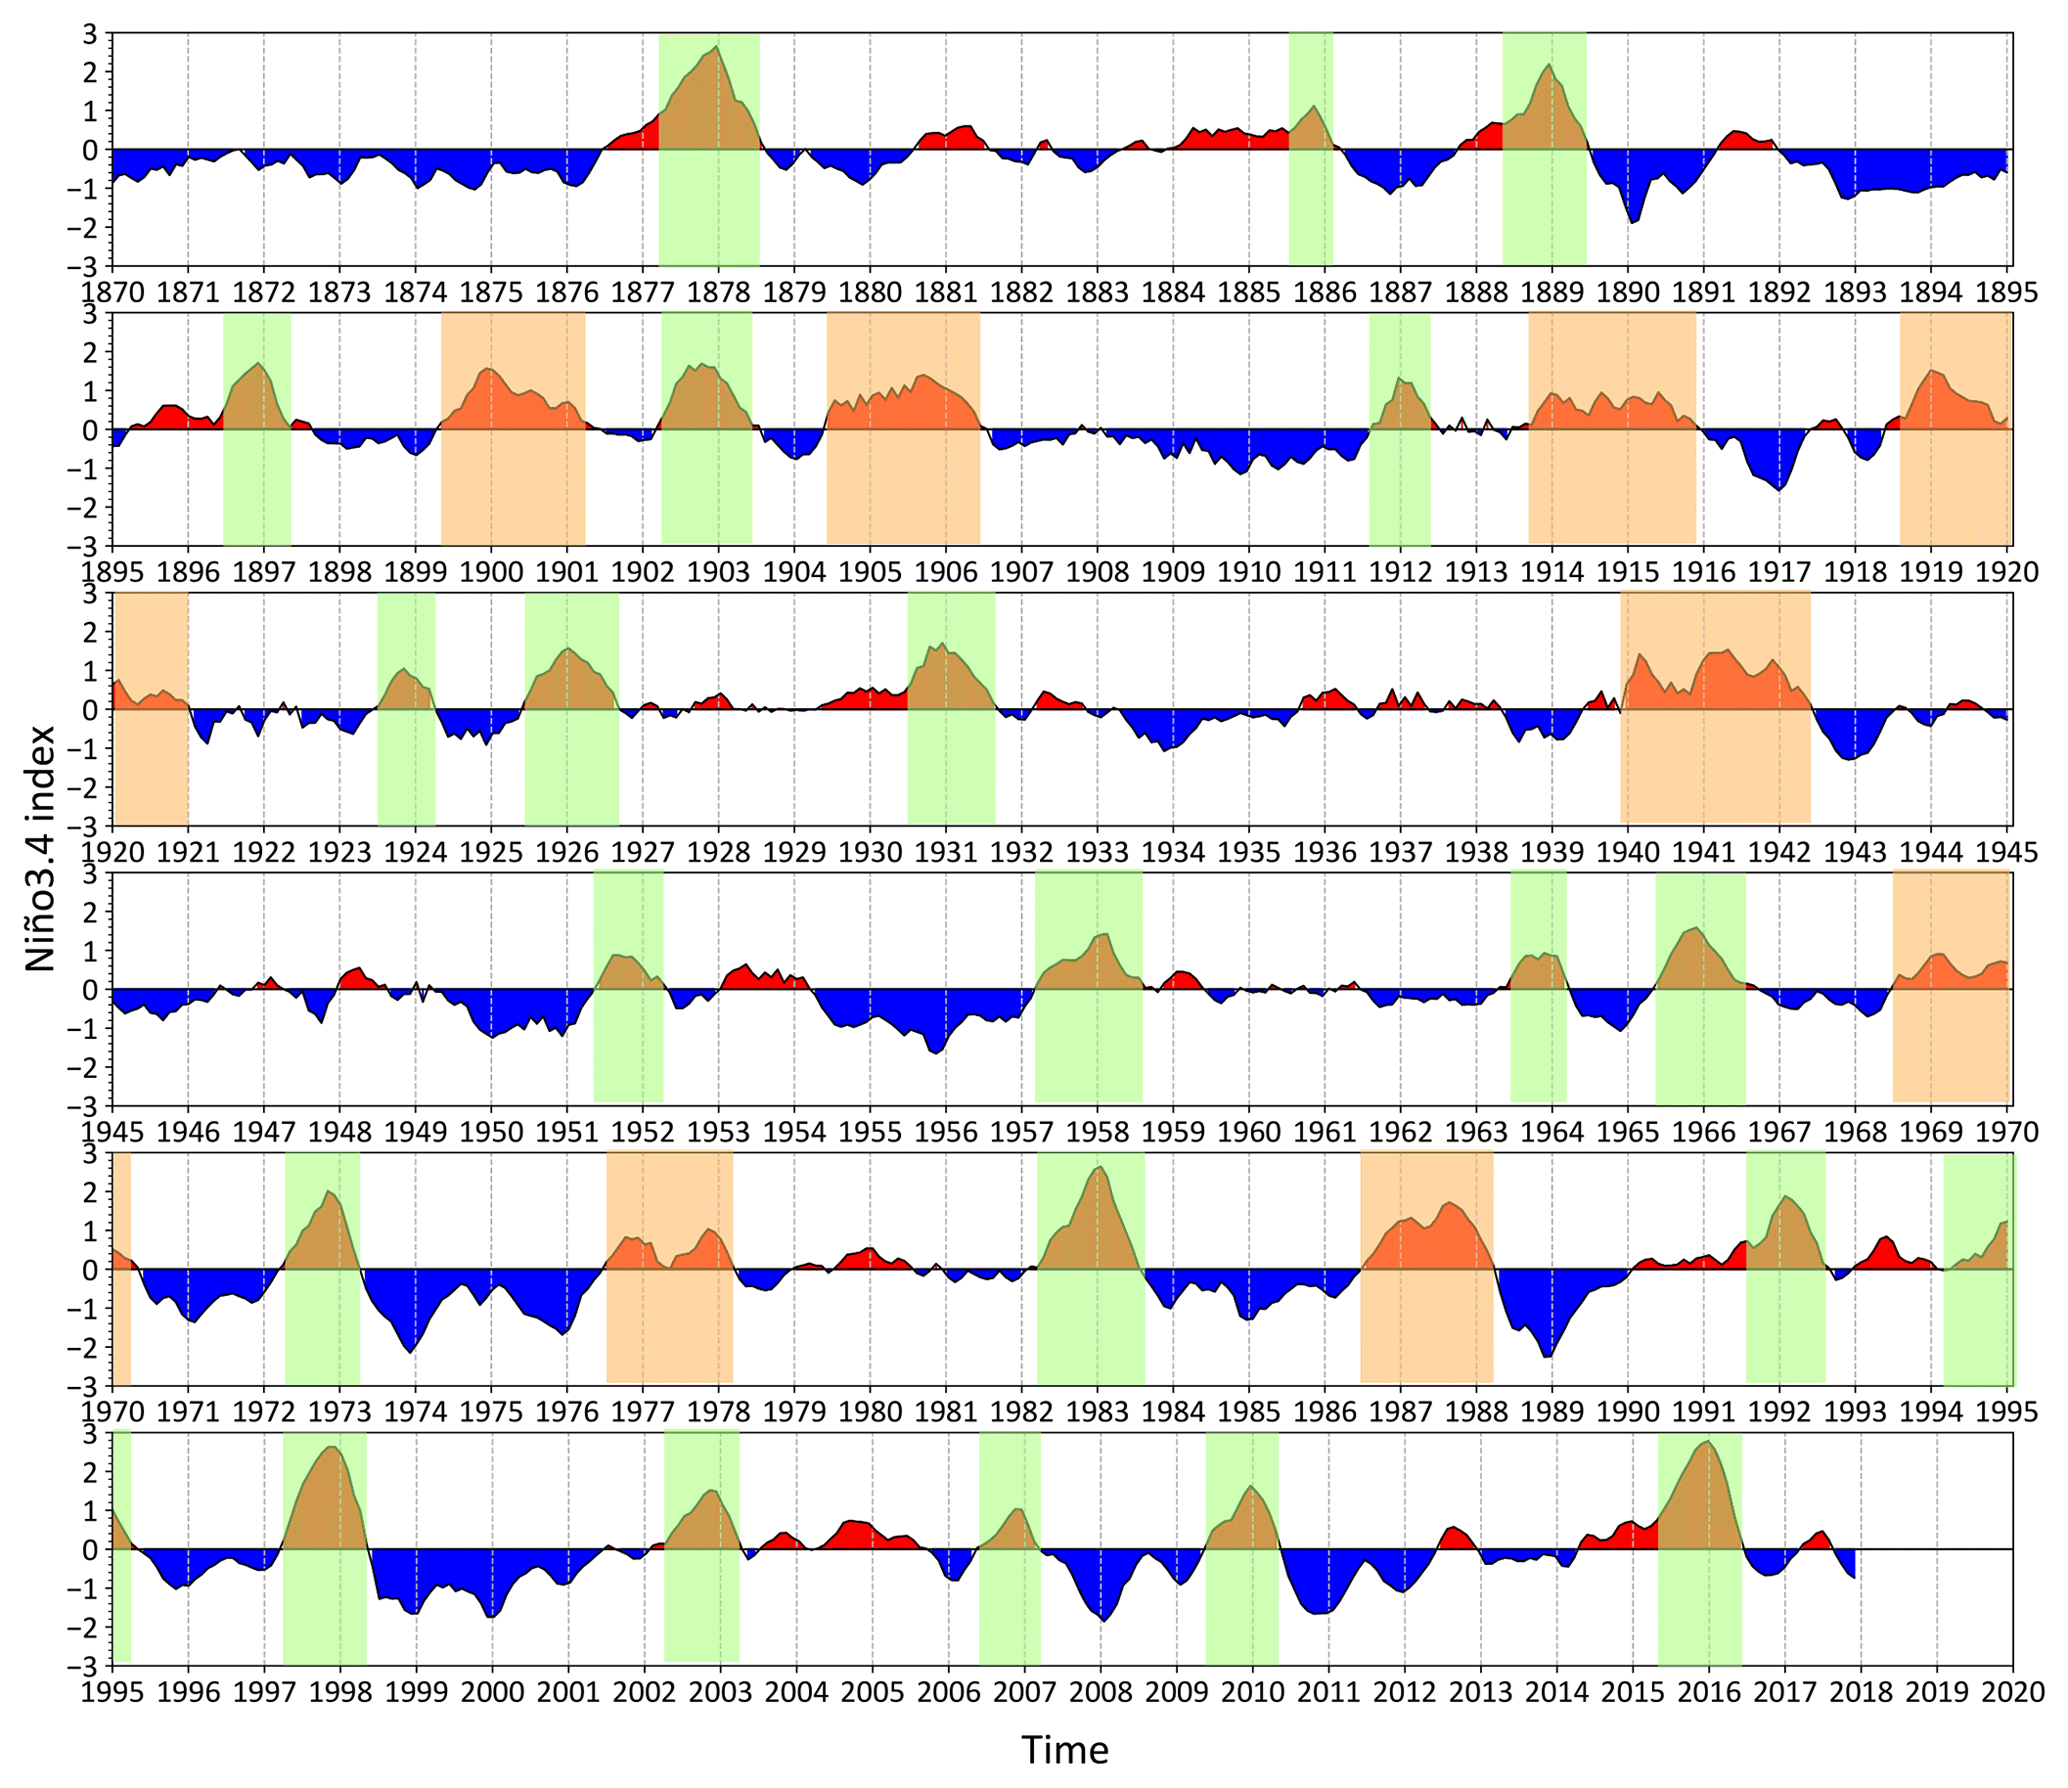
Figure 1Time series of the Niño 3.4 index (∘C) based on the merged Hadley-NOAA/OI SST dataset for 1870–2017. The time series were detrended and smoothed with a 3-month running average filter. Highlighted slots illustrate the SD (green) and LD (orange) El Niño events.
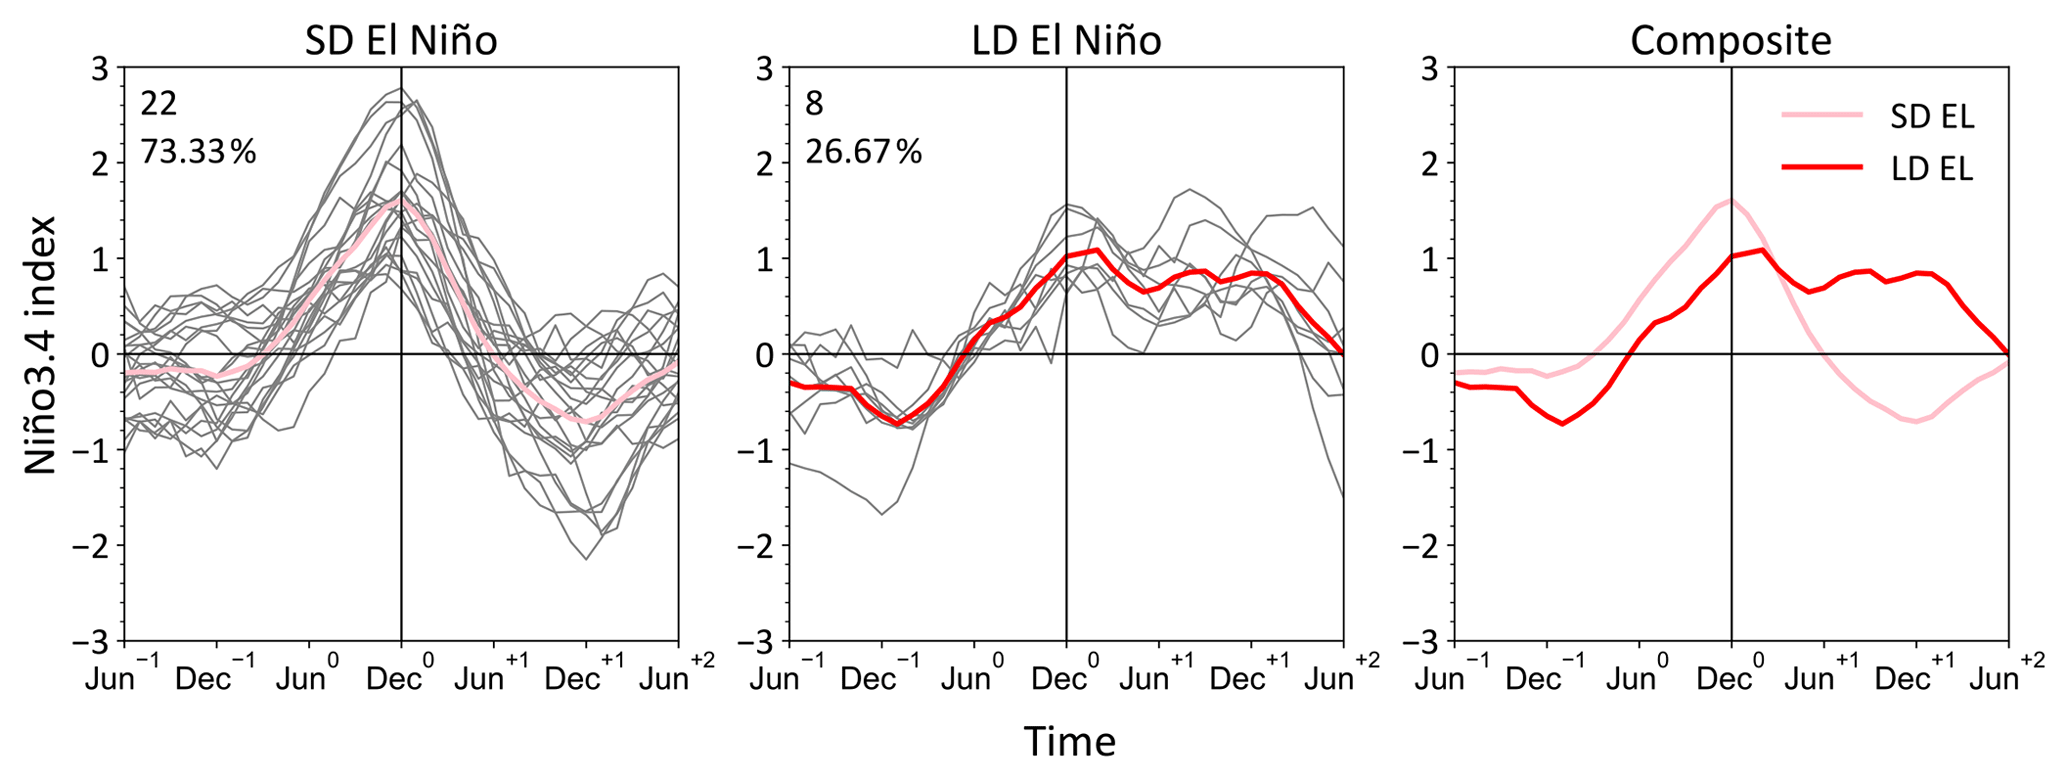
Figure 2Time series of the Niño 3.4 index (∘C) overlaid from Jun−1 to Jun+2 for (left) SD and (middle) LD El Niño events during 1870–2017. The individual and composite events are shown by thin gray and bold red curves, respectively. The total number and percentage of events are shown at the upper left corner of each panel. A comparison of the composite time series of Niño 3.4 index for SD and LD events is shown in the right panel.
2.3 Model description and experimental design
To quantify the influence of El Niño with various durations on aerosols in China, the U.S. Department of Energy (DOE) E3SM version 1 (E3SMv1) is utilized in this study, which includes atmosphere, land, ocean, sea ice and river components (Golaz et al., 2019). It was branched from the CESM1 (Community Earth System Model) but has been updated substantially since. The E3SM Atmosphere Model version 1 (EAMv1) is a descendant of the well-known CAM5.3 (Community Atmosphere Model version 5.3) (Rasch et al., 2019). It includes considerable upgrades to aerosols, turbulence, chemistry and cloud-related processes. EAMv1 provides various options of spatial resolution. In this study, the horizontal spatial resolution of approximately 1∘ and 30 vertical layers from the surface to 3.6 hPa are used in the model configuration. The model simulates aerosols including sulfate, black carbon (BC), primary organic aerosol (POA), secondary organic aerosol (SOA), sea salt and mineral dust in the four-mode Modal Aerosol Module (MAM4) (H. Wang et al., 2020).
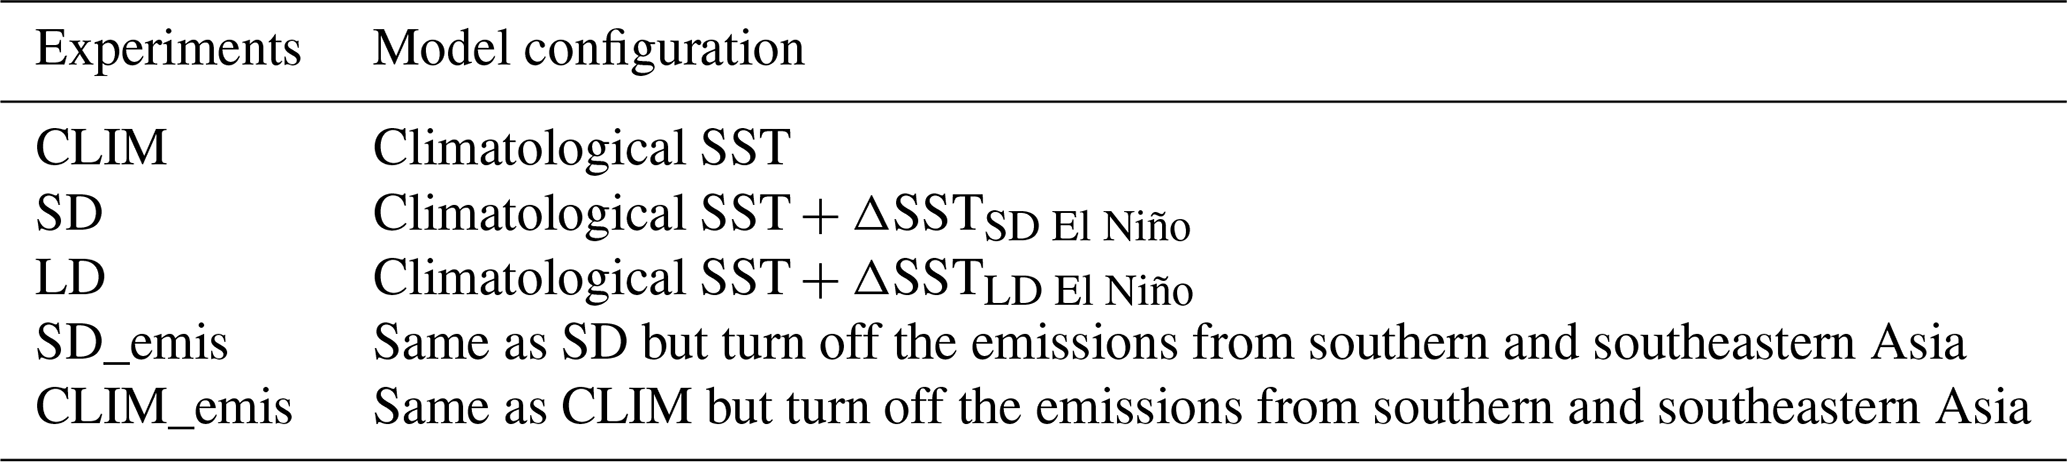
The following numerical experiments are conducted in this study. A “CLIM” experiment is driven by climatological average of monthly SST and SIC over 1870–2017 and integrated for 20 years. Two sets of sensitivity experiments, “SD” and “LD”, are, respectively, driven by the monthly SST representing composite SD and LD El Niño events. The monthly SSTs representing SD (LD) El Niño events are produced through superimposing the average of monthly SSTs from Jul0 to Jun1 of the 22 SD (8 LD) El Niño events selected in Sect. 2.2 on top of the climatological monthly SST over 60∘ S–60∘ N. Each set of sensitivity experiment has three ensemble members with different initial conditions branched from different years of the CLIM experiment. Each member of the sensitivity experiments is run for 8 years with the first 3 years used for spin-up and the last 5 years used for analysis. The differences in the monthly and daily mean model fields between SD, LD and CLIM are used to analyze the effects of duration of El Niño events on aerosols. To understand the potential mechanism of El Niño impacts on aerosol pollution in China, two additional experiments are also conducted. The “SD_emis” experiment is the same as the first ensemble member of SD experiment, except that the emissions of aerosols and precursor gases from southern and southeast Asia are turned off. The “CLIM_emis” experiment is same as the “SD_emis” experiment but driven by climatological average of monthly SST and SIC over 1870–2017. All other external forcings, including insolation, greenhouse gas concentrations, and emissions of aerosol and precursors are kept at present-day conditions (year 2014), In brief, the experiments performed are as follows (Table 1).
-
CLIM: control simulation driven by climatological SST;
-
SD: sensitivity simulation to quantify the impacts of El Niño events with short duration on aerosols in China. Same as CLIM except for the imposed SST pattern of short-duration El Niño (Fig. 3a);
-
LD: sensitivity simulation to quantify the impacts of El Niño events with long duration on aerosols in China that is the same as CLIM except for the imposed SST pattern of long-duration El Niño (Fig. 3b);
-
SD_emis: sensitivity simulation to quantify the role of regional transport of aerosols from southern and southeast Asia on aerosols in China during El Niño events with short duration that is the same as SD except that the emissions of aerosols and precursor gases from southern and southeast Asia are turned off;
-
CLIM_emis: sensitivity simulation to serve as the baseline for SD_emis. Same as SD_emis except for the use of climatological SST.
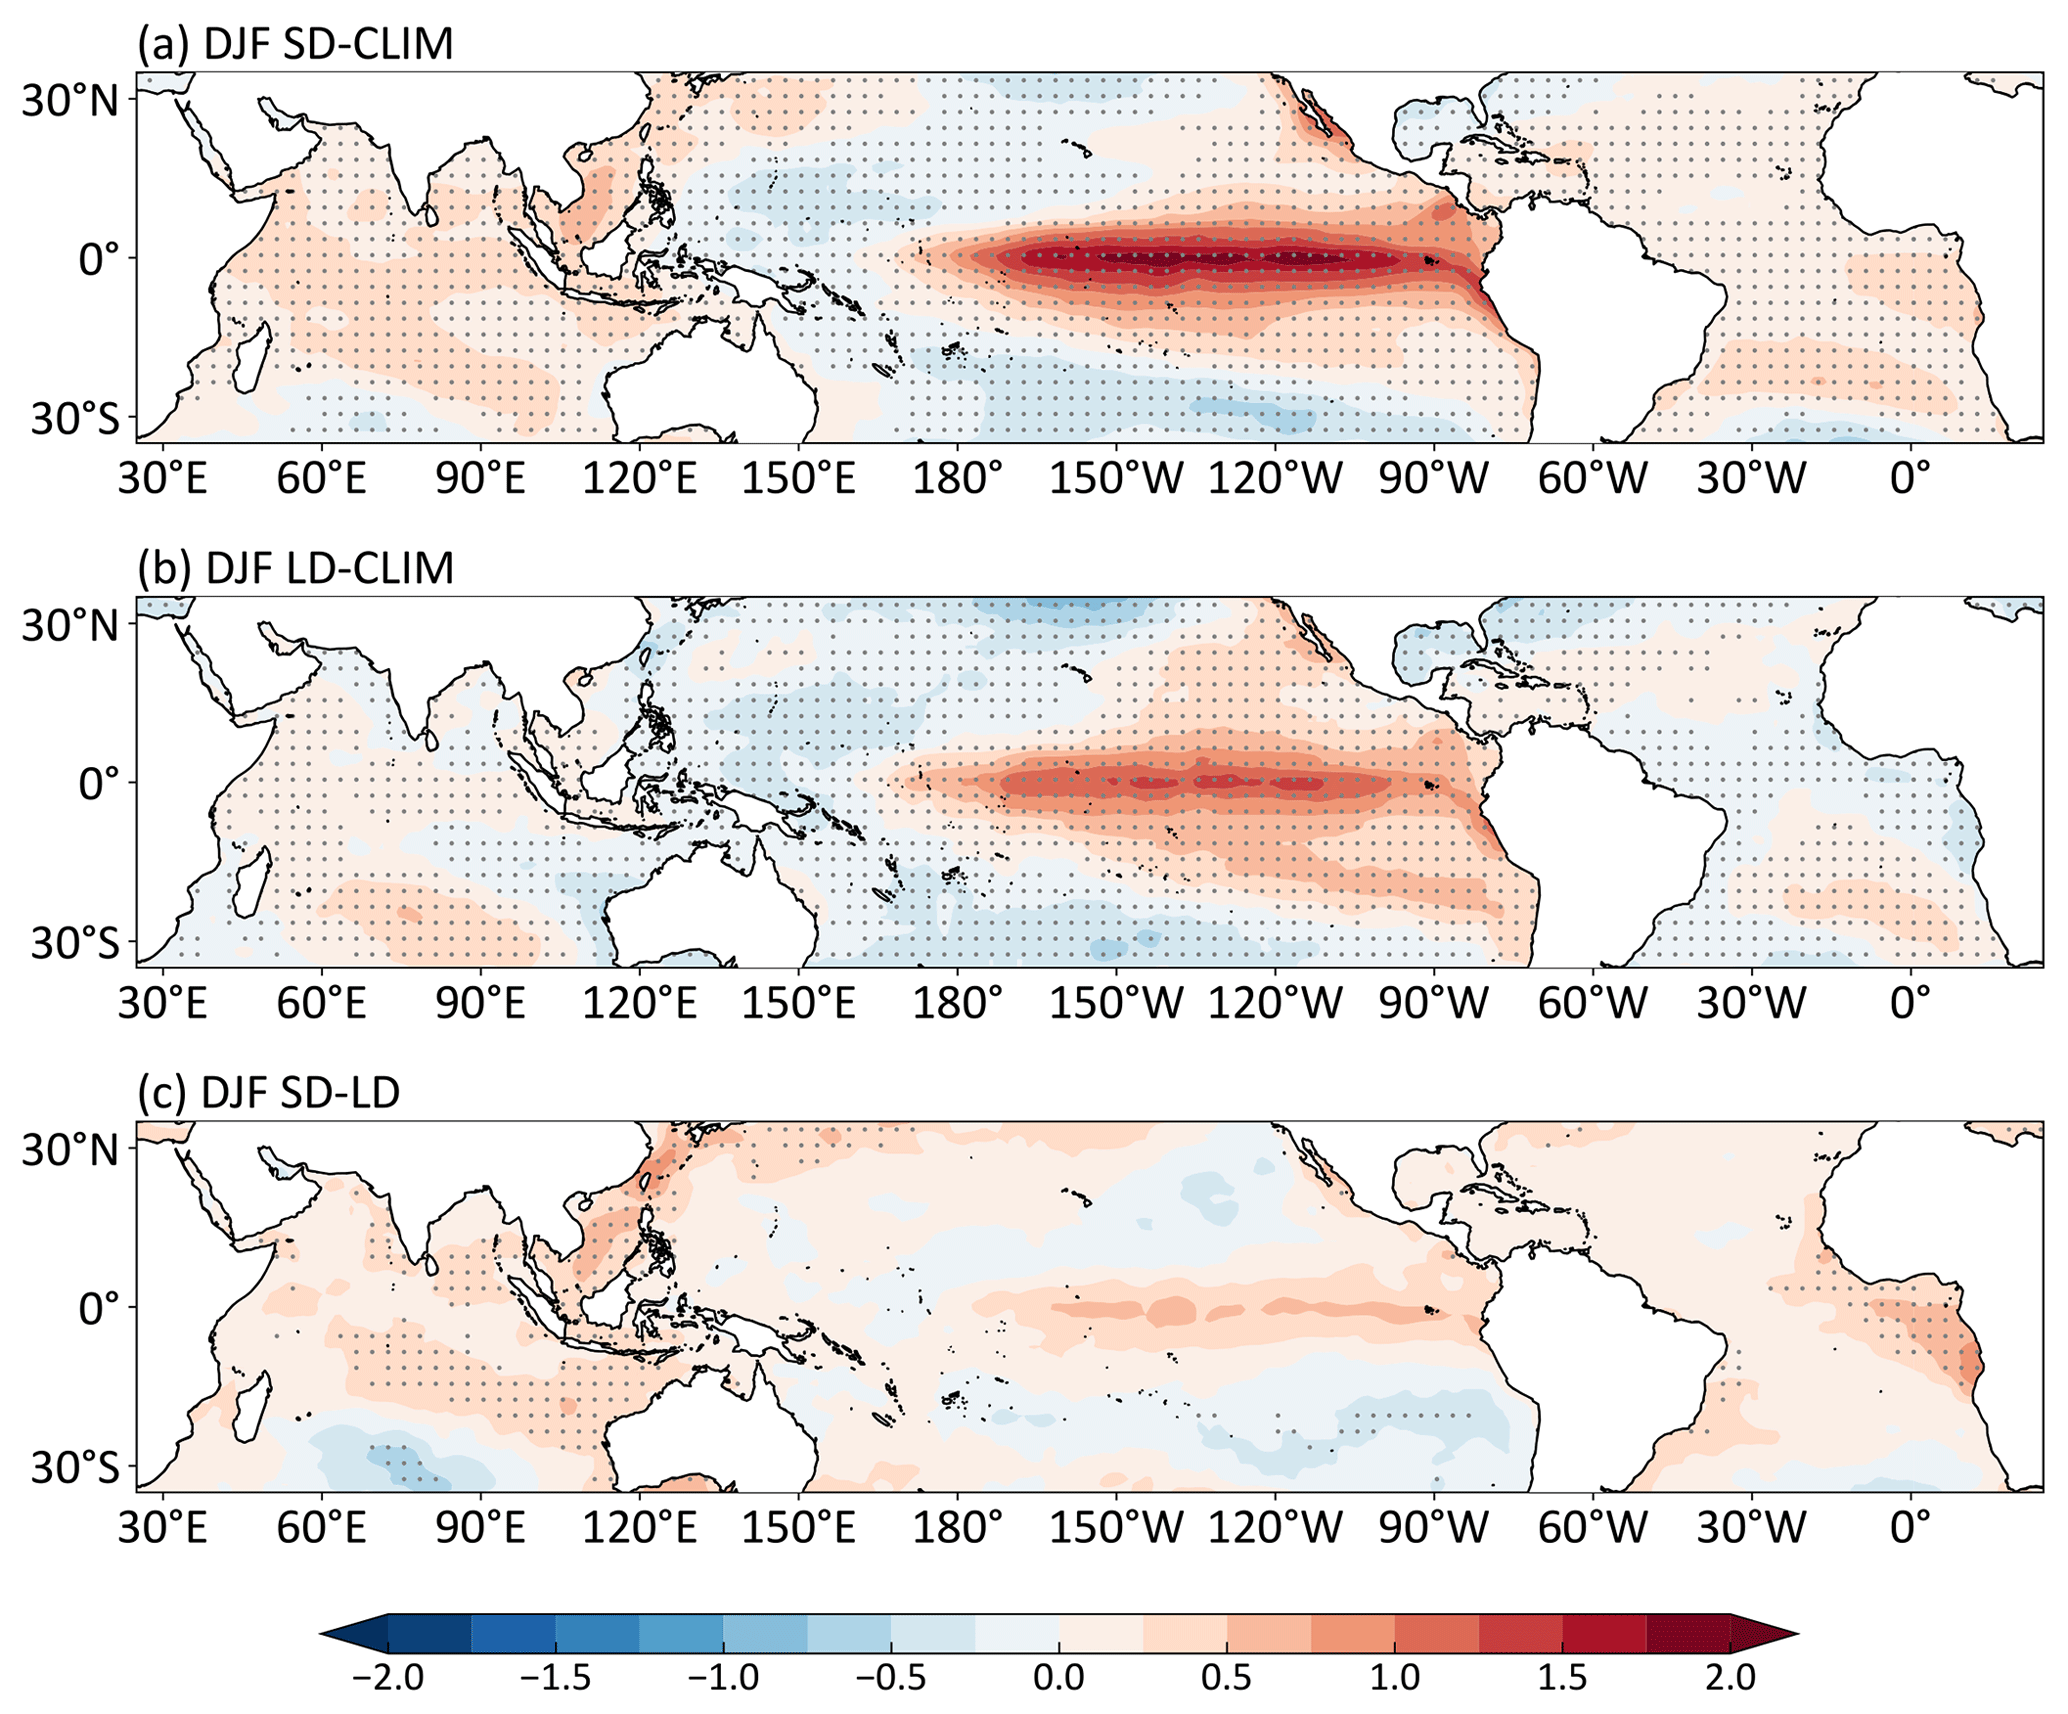
Figure 3Composite differences in DJF mean SST (∘C) between SD (a) or LD (b) El Niño events and climatological mean over 1870–2017 and between SD and LD (c) El Niño events. Differences that are statistically significant at 95 % from a two-tailed t test are stippled.
2.4 Model evaluation
To evaluate the model performance in simulating aerosol concentration and distribution in China, the simulated December–January–February (DJF) mean surface PM2.5 (sum of sulfate, BC, POA and SOA in model simulation) concentrations from the CLIM experiment is compared with the observed PM2.5 concentrations in Fig. 4. The model well reproduced the spatial distribution of wintertime aerosols in China, with high aerosol concentrations in eastern China (e.g., North China Plain, Fenwei Plain and Yangtze River Delta) and southwestern China (e.g., Sichuan Basin) and low aerosol levels in western China. The spatial correlation coefficient (R) between the E3SMv1 EAMv1 simulation and observations for near-surface PM2.5 concentrations is +0.43. However, the model underestimates the PM2.5 concentrations in China, with a normalized mean bias (NMB) of −65.74 % compared to the observed values, which was also reported in many studies using the CESM1 model (e.g., Yang et al., 2017a, b). The discrepancy could be due to many factors, including the lack of nitrate and ammonium aerosols in the model, strong wet scavenging simulated at the mid- and high latitudes, and less transformation from gas to particles. In addition, we focus on anthropogenic aerosols. If natural dust is considered in the modeled PM2.5 calculation, the NMB will drop to −6.38 %. Nevertheless, the aerosol concentrations in EAMv1 simulations are closer to the observations than previous ENSO–aerosol studies (e.g., Yu et al., 2019; Zhao et al., 2018), and the composite differences are analyzed in this study rather than the climatological mean concentration. We do not expect the systematic low biases in PM2.5 concentrations to affect our study on the impact of El Niño events. However, we should note that the aerosol changes in China during SD or LD El Niño events in the real world could be larger than the simulated values here.
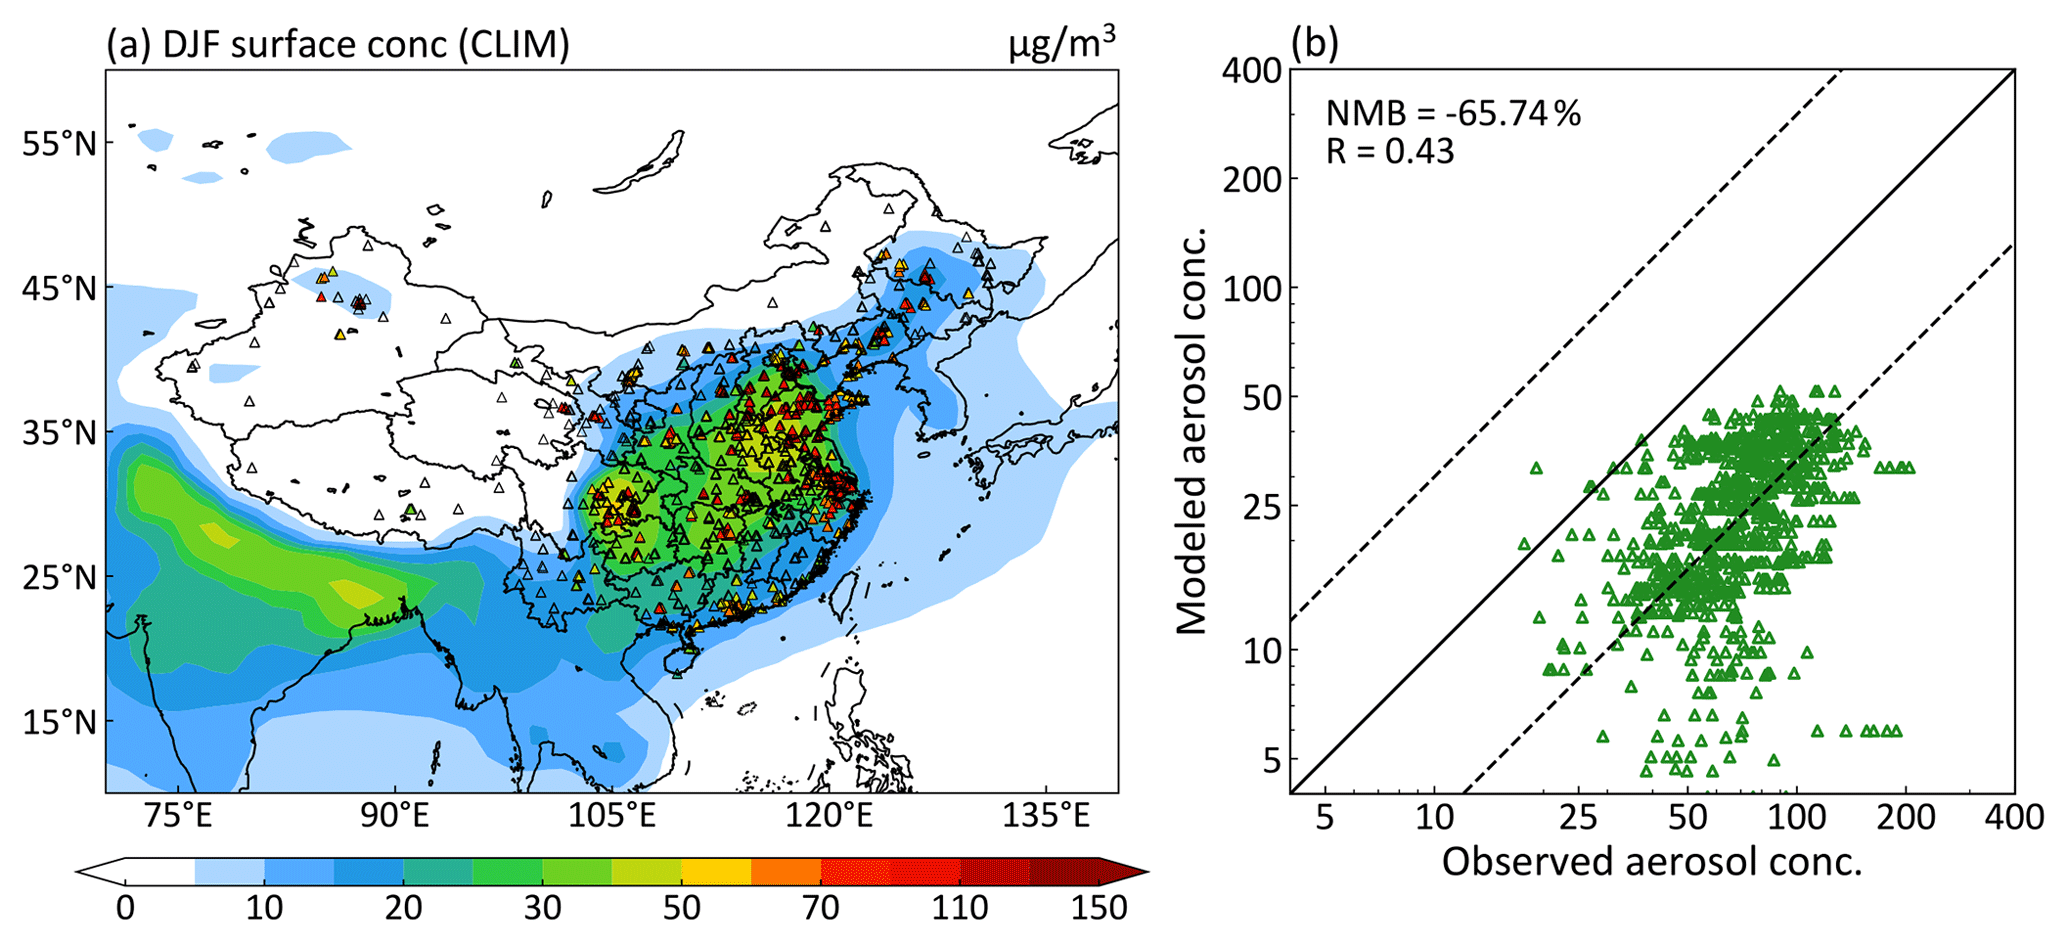
Figure 4Spatial distributions (a) and scatter plots (b) of observed and simulated DJF mean near-surface PM2.5 concentrations (µg m−3) from the CLIM experiment. Solid line represents 1:1 ratio, and dashed lines mark 1:3 and 3:1 ratios. The observed concentrations are derived from the CNEMC in December 2014–February 2015. The normalized mean deviation (NMB) and the correlation coefficient (R) between observations and simulation are shown in the upper left corner of (b). , where Mi and Oi are the simulated and observed values at site i, respectively.
3.1 Impacts of SD and LD El Niño events on aerosol concentrations
Figure 5 shows the absolute and relative impacts of the two types of El Niño events with different durations on the simulated DJF mean near-surface concentrations and column burdens of PM2.5 in China. The effects of the SD and LD El Niño events on near-surface aerosol concentrations over China are similar in the spatial pattern distribution, with increases in the northeastern and southern China by about 1–2 µg m−3 (5 %–15 % compared to the climatological mean) and decreases in central-eastern China during El Niño events relative to the climatological averages. This spatial pattern of aerosol changes is in accordance with previous modeling studies (Feng et al., 2016; Yu et al., 2019; Zhao et al., 2018). However, the modeling results are not exactly the same as the observed PM2.5 changes, which show increases in PM2.5 over northeastern China and the North China Plain and slightly decreases in southern China during the 2015/16 El Niño event (Chang et al., 2016). The discrepancy between the model simulations and observations can be attributed to the following reasons. First of all, instead of the El Niño impacts, observed aerosols can be affected by other factors including East Asian winter monsoon (Yang et al., 2016a), Arctic Oscillation (Zhang et al., 2019) and Pacific Decadal Oscillation (Zhao et al., 2017), whereas the modeled changes are purely caused by the El Niño impacts through the superimposed SST perturbation. Secondly, the time coverage of near-surface PM2.5 observations is limited in China, and only one extreme El Niño event (2015/16) was analyzed in previous El Niño–PM2.5 studies (e.g., Chang et al., 2016), which is not fully representative of the impact of general El Niño events.
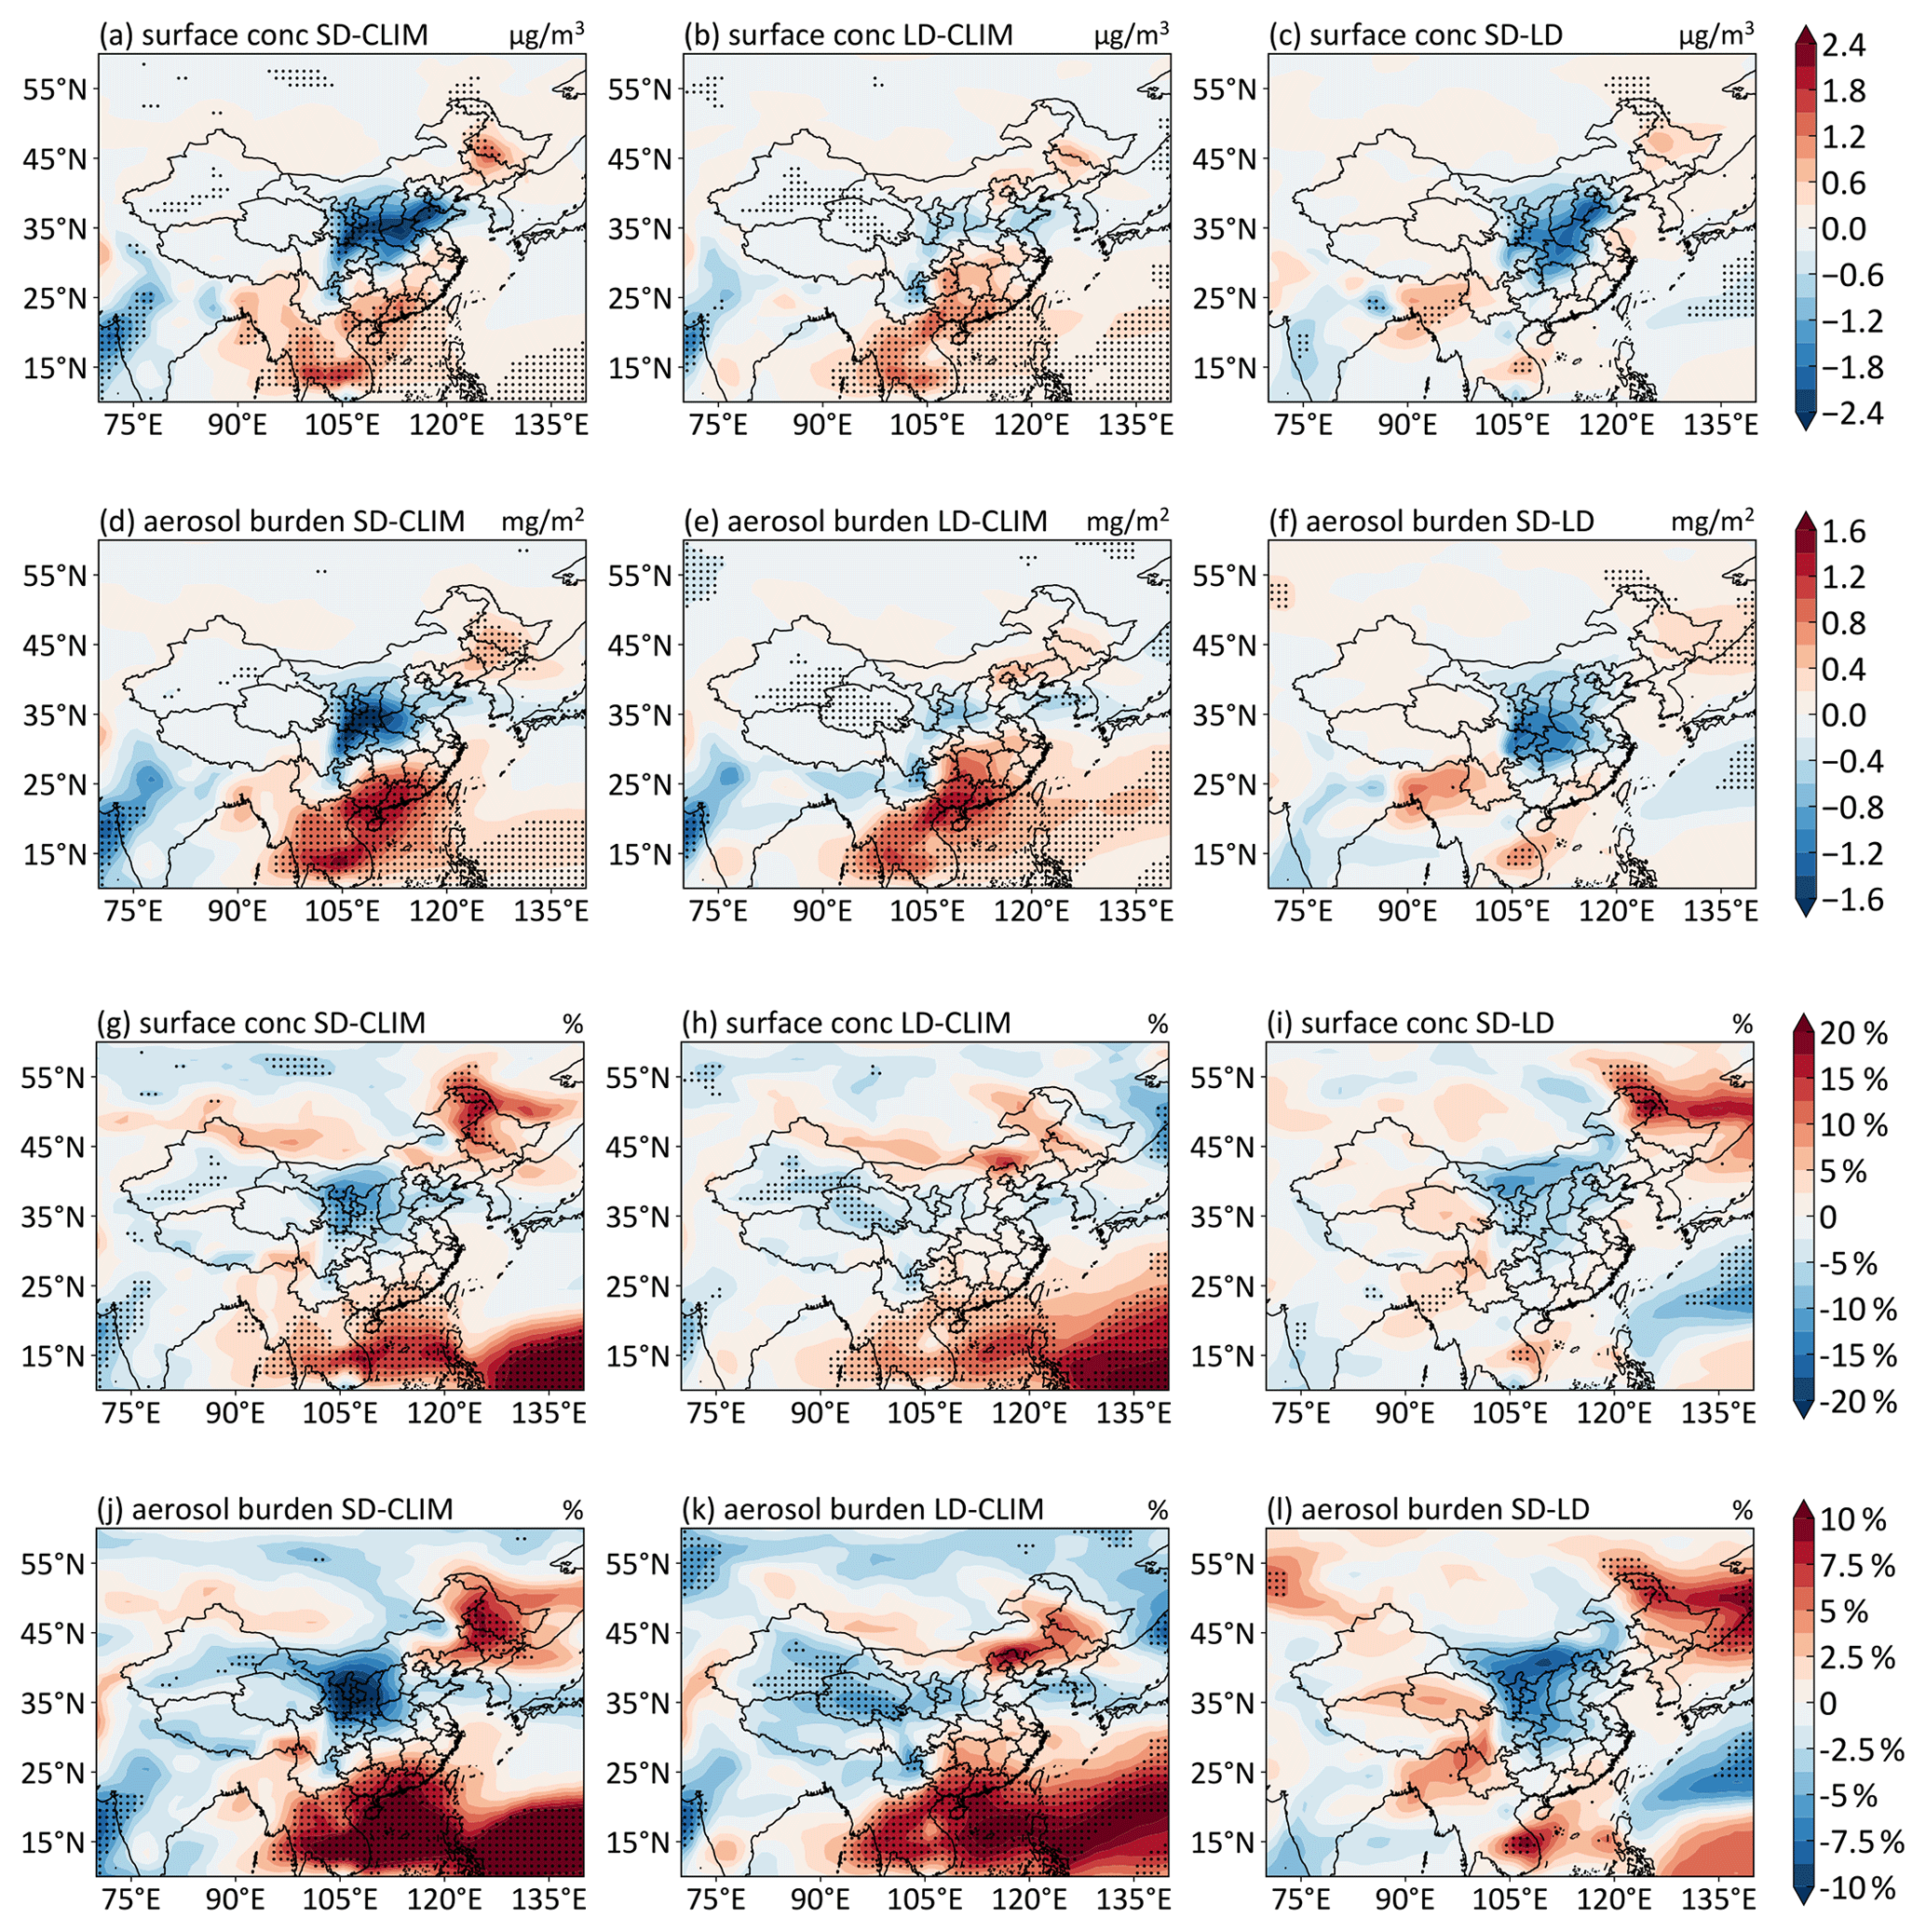
Figure 5The absolute (a–f) and relative (h–l) composite differences in DJF mean near-surface PM2.5 concentrations (µg m−3) and aerosol column burdens (mg m−2) between SD and CLIM (a, d, g, j), LD and CLIM (b, e, h, k), and SD and LD (c, f, i, l). The stippled areas indicate statistical significance with 90 % confidence from a two-tailed t test.
Although the spatial patterns of the SD and LD El Niño influences on the DJF PM2.5 concentrations in China resemble each other, the magnitudes of the influences are different. Central-eastern China experiences more reductions in near-surface PM2.5 concentrations during SD El Niño, with the concentration decreases of more than 2.4 µg m−3 (15 % relative to the climatological mean), which is much larger than the 0.6 µg m−3 (5 %) during LD El Niño. In southern China, the spatial coverage of the increase in PM2.5 concentration shrinks more during SD than LD El Niño events relative to the CLIM, but the intensities of the anomalies triggered by the two temporal types of El Niño events are similar. Moreover, SD El Niño induces a larger increase in PM2.5 concentrations in northeastern China by 1.2 µg m−3 (10 %) compared to that of 0.6 µg m−3 (5 %) during LD El Niño events.
The PM2.5 burden and near-surface concentration anomalies triggered by the El Niño events with short and long durations are basically the same in spatial distribution but with different magnitudes (Fig. 5). For example, the reduction in aerosol burden is much larger in central-eastern China during the SD El Niño events than during the LD El Niño events, with maximum negative anomalies reaching −1.6 and −0.6 mg m−2, respectively. Overall, SD El Niño events yield stronger impacts on aerosol pollution in China than LD El Niño events, especially in central-eastern China with negative pollution anomalies.
3.2 Mechanisms of SD and LD El Niño impacts on aerosols
Since aerosols and their precursor gas emissions are prescribed at the same rates in the control (CLIM) and sensitivity (SD or LD) simulations, changes in meteorological factors such as circulation and precipitation play dominant roles in altering aerosol concentrations by influencing the regional transport and wet removal of aerosols (Yang et al., 2016a). Previous studies also suggested that aerosol variations during ENSO events were controlled by ENSO-related circulation and precipitation changes (Yu et al., 2019; Zhao et al., 2018). Here, we examine the atmospheric circulation and precipitation anomalies and the associated aerosol processes during the SD and LD El Niño to explore the mechanisms of the two types of El Niño effects on aerosols in China.
Both the SD and LD El Niño events trigger negative anomalies in sea level pressure (SLP) over eastern China and East China Sea and positive anomalies over the Philippine Sea and Sea of Okhotsk (not shown), leading to anomalous cyclonic and anticyclonic circulations over these regions, respectively (Fig. 6a and b). At 850 hPa, the anomalous cyclonic circulation over the East China Sea causes anomalous northerly winds over central-eastern China, enhancing the prevailing northwesterly winds in winter. The enhanced winds favor the aerosol dispersion, which explains the decrease in PM2.5 concentrations over central-eastern China during El Niño events relative to the climatological mean. In addition, at 500 hPa, most areas over China have an anomalous low pressure (Fig. 6d and e), which increases the atmospheric instability and strengthens the aerosol vertical mixing and dispersion over central-eastern China. Over southern China, the aerosol variations are significantly affected by the regional transport of particles from southern and southeast Asia. During El Niño events, anomalous southwesterly winds at the northwest edge of the anomalous anticyclone over the Philippine Sea bring aerosols from southern and southeast Asia to southern China, contributing to the aerosol increases in southern China relative to the climatological mean (Fig. 6a and b). In northeastern China, anomalous southeasterly winds associated with the anomalous anticyclonic circulation over the Sea of Okhotsk weaken the wintertime prevailing northwesterly winds, giving rise to the aerosol increases in northeastern China during El Niño events. In addition, the anomalous anticyclone brings aerosols from southern and southeast Asia to northeastern China that will be discussed next, contributing to the aerosol pollution in northeastern China during El Niño events.
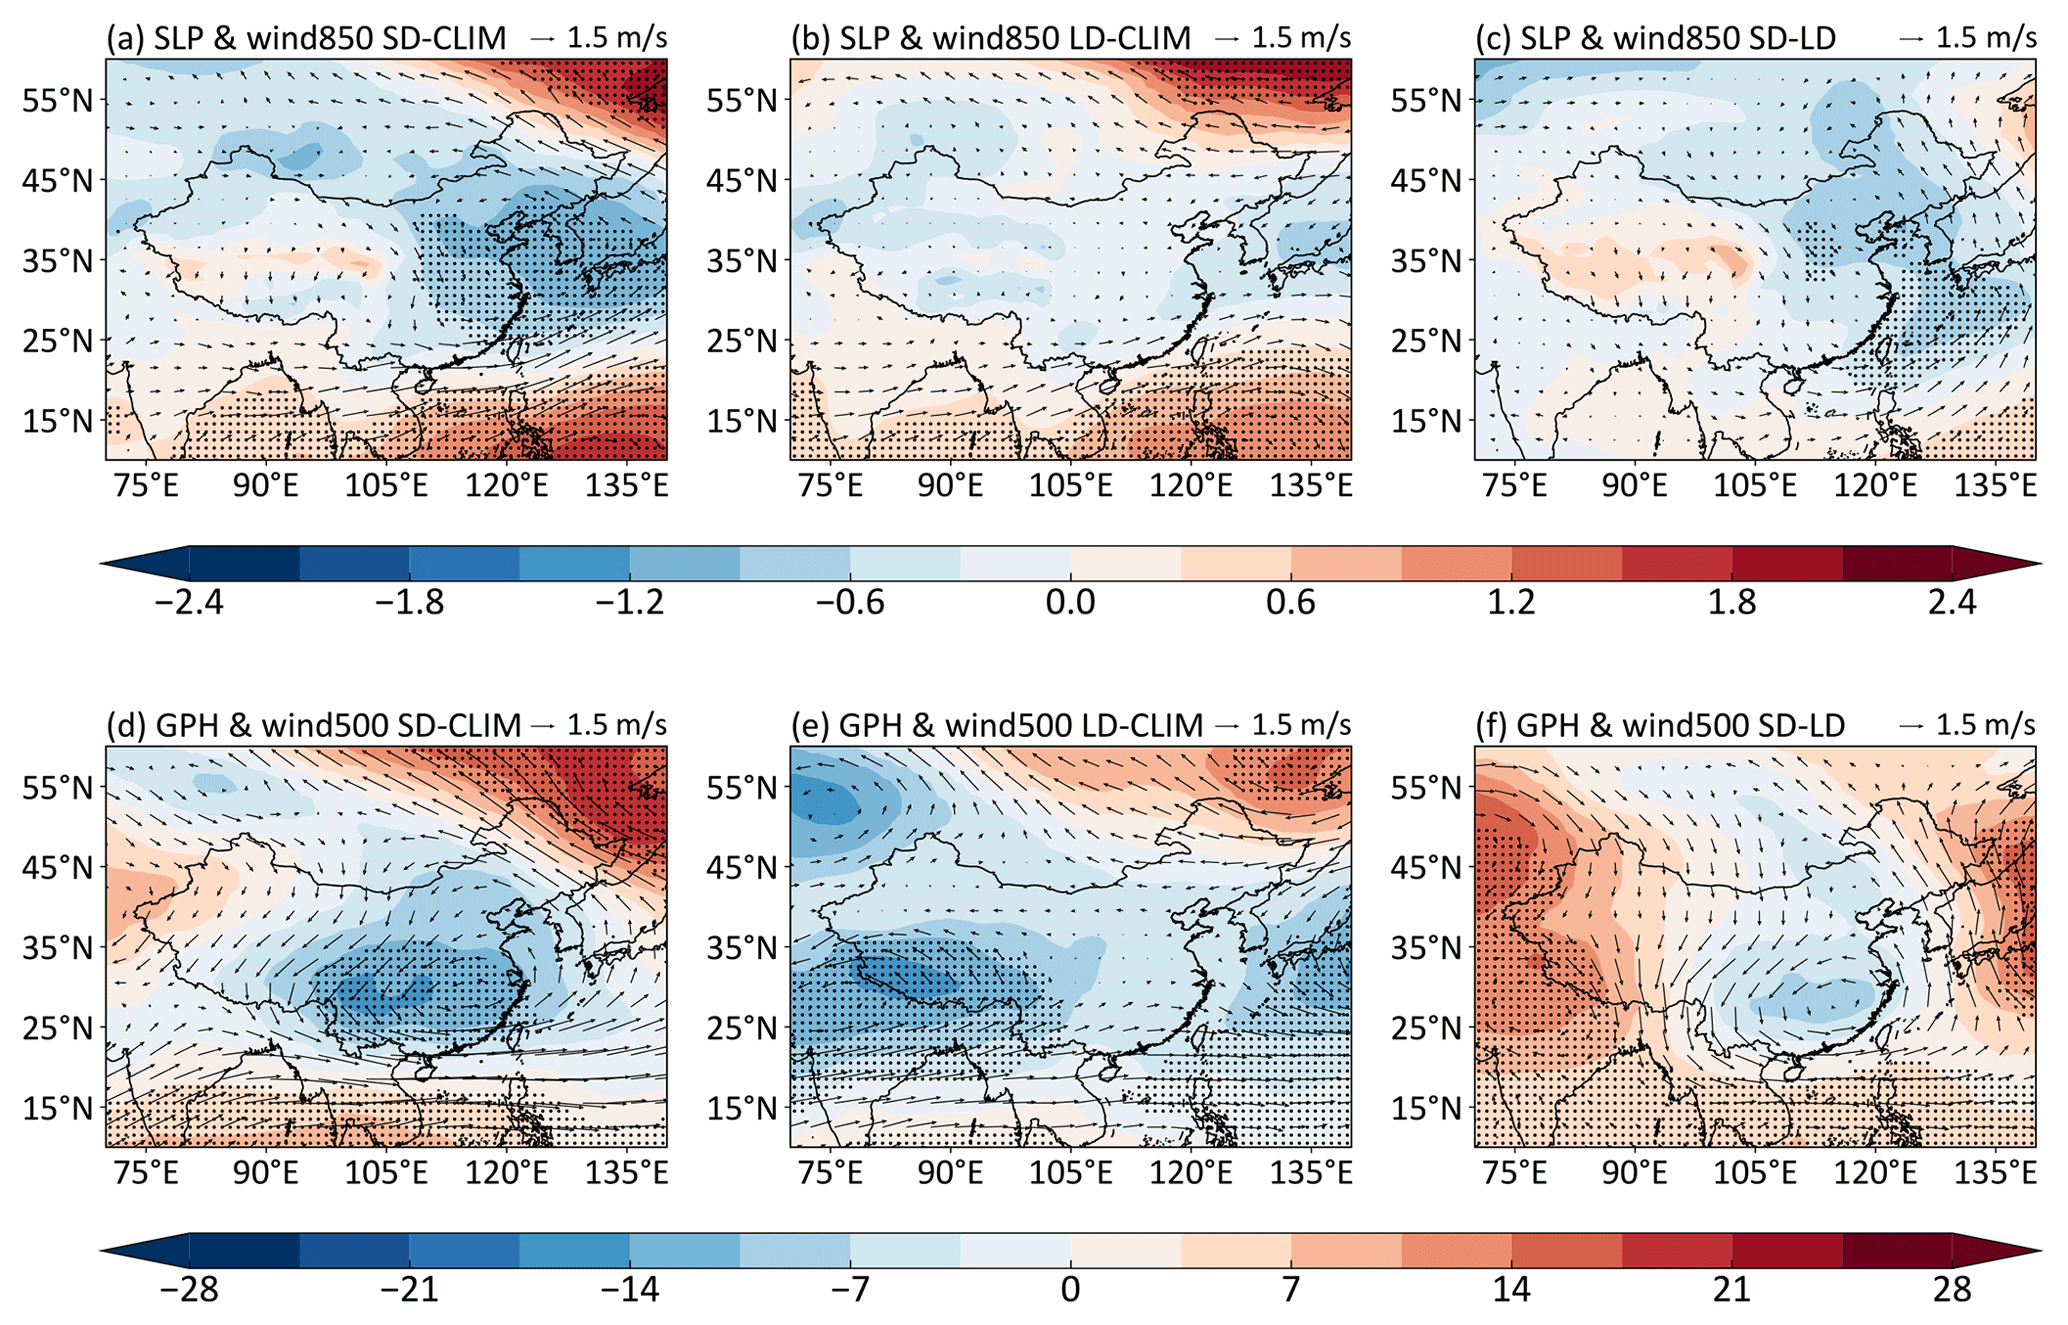
Figure 6Composite differences in DJF mean sea level pressure (SLP, shaded; unit: hPa) and wind at 850 hPa (WIND850, vector; unit: m s−1) (a)–(c) and geopotential height at 500 hPa (GPH500, shaded; unit: m) and wind at 500 hPa (WIND500, vector; unit: m s−1) (d)–(f) between SD and CLIM (a, d), LD and CLIM (b, e), and SD and LD (c, f). The stippled areas indicate statistical significance with 90 % confidence from a two-tailed t test.
Compared to LD El Niño events, the negative anomaly of SLP over the East China Sea during the SD El Niño events is stronger and extends deeply into central-eastern China, resulting in anomalous northerly winds over central-eastern China and southeasterly winds over northeastern China in the lower atmosphere (Fig. 6c). The wind anomalies intensify the aerosol dispersion in central-eastern China and accumulation in northeastern China, leading to a stronger effect of El Niño with short duration on the aerosol variation in China. Furthermore, the anomalous northerly winds in both the lower atmosphere and at 500 hPa over southern China (Fig. 6c and f) are not conducive to the regional transport of aerosols from southern and southeast Asia to central-eastern China.
To further verify the model simulations in capturing atmospheric circulation anomalies during SD and LD El Niño events, the wind fields are compared with those from ERA5 reanalysis data. The anomalous atmospheric circulation patterns in the latest SD El Niño event (2015/16) and LD El Niño event (1986/87) relative to the climatological mean (1950–2017) from the ERA5 are shown in Fig. 7. Overall, the SD and LD El Niño-induced anomalous atmospheric circulations over China simulated in E3SM are consistent with the reanalysis data. Both of them show the anomalous northerly winds over central-eastern China at 850 hPa during SD El Niño compared to LD El Niño. In addition, obvious anomalous cyclone at 500 hPa over most of China can be seen in both E3SM and ERA5.
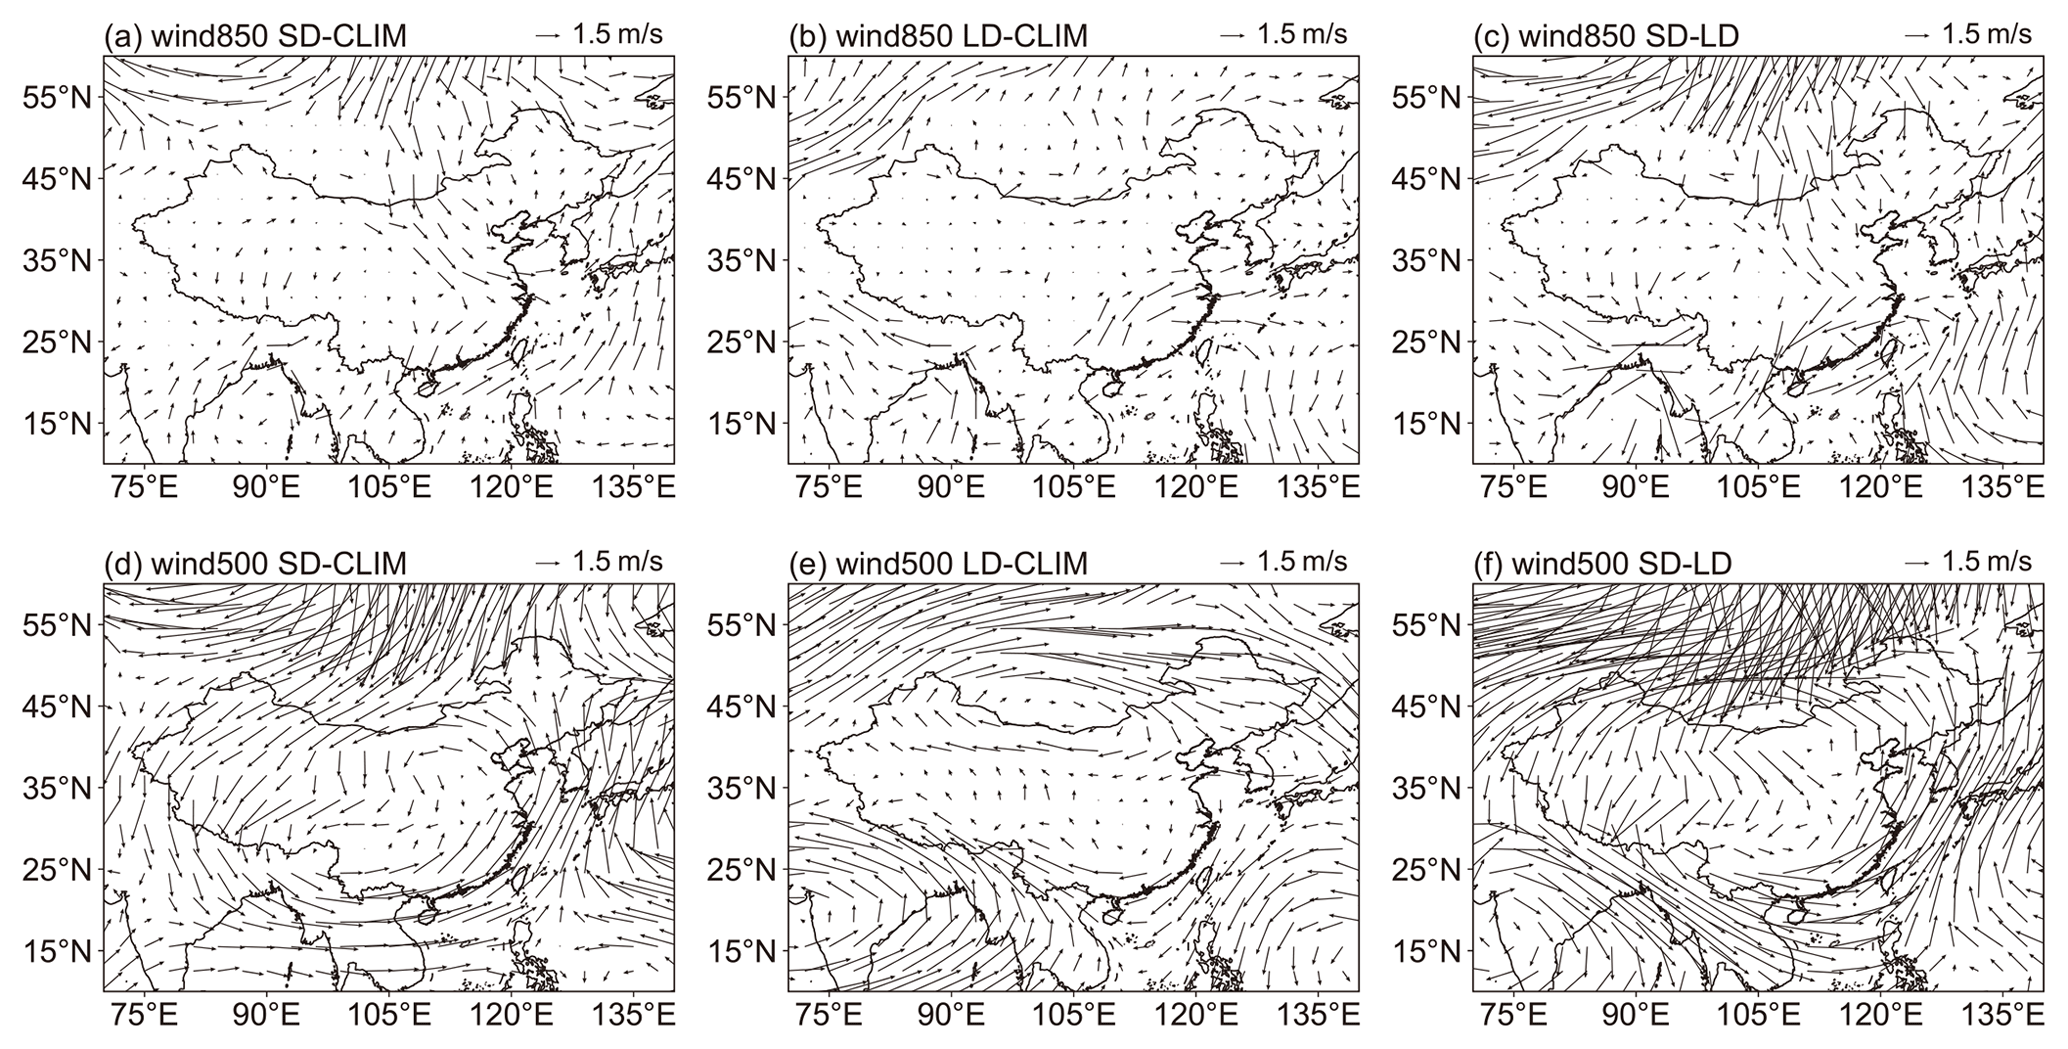
Figure 7Composite differences in DJF mean winds at 850 hPa (m s−1) (a–c) and 500 hPa (m s−1) (d–f) between 2015/16 SD El Niño and climatological mean (1950–2017) (a, d), 1986/87 LD El Niño and climatological mean (b, e) and 2015/16 SD El Niño and 1986/87 LD El Niño (c, f) from the EAR5 reanalysis data. The data were detrended over 1950–2017.
In addition to the regional transport prompted by anomalous atmospheric circulations, El Niño can influence aerosol wet removal through perturbing precipitation. As described in Fig. 8a and b, the spatial patterns of winter precipitation anomalies in China during SD and LD El Niño events are similar, with positive anomalies located along the southeastern coastal areas due to the additional moisture transport by anomalous southwesterly winds over the South China Sea. However, the two types of El Niño events differ in the magnitude of precipitation anomalies. In central-eastern China, precipitation decreases during SD El Niño events, compared to LD El Niño events, whereas precipitation increases over eastern coastal areas and northeastern China (Fig. 8c). This is linked to the anomalous cyclonic circulation over central-eastern China (Fig. 6c), which hinders moisture from the South China Sea to central-eastern China but brings in moisture from the Sea of Japan to northeastern China. Over the Pearl River Delta, precipitation decreases during SD El Niño events but increases during LD El Niño events, which is also associated with the anomalous northerly winds and corresponding impact on moisture transport over this region. In general, aerosol wet deposition decreases in central-eastern China and increases over southern and northeastern China during El Niño events (Fig. 8d and e). With short duration but strong intensity, El Niño events have larger impacts on aerosol wet removal than those with long duration (Fig. 8f). However, the wet removal shows a positive relationship with the aerosol concentration, which should be a negative relationship in theory if other conditions remain unchanged. Water vapor can accelerate the chemical transformation of secondary aerosols (Yang et al., 2015), but the primary aerosols showed the same spatial differences in near-surface concentration as PM2.5 (not shown), indicating that change in water vapor is also not the main reason for the aerosol changes in China during El Niño events. Therefore, the differences in aerosols triggered by El Niño events with different durations are primarily due to the impact of changes in atmospheric circulation on the accumulation and transport of aerosols rather than the impact of precipitation on aerosol removal.
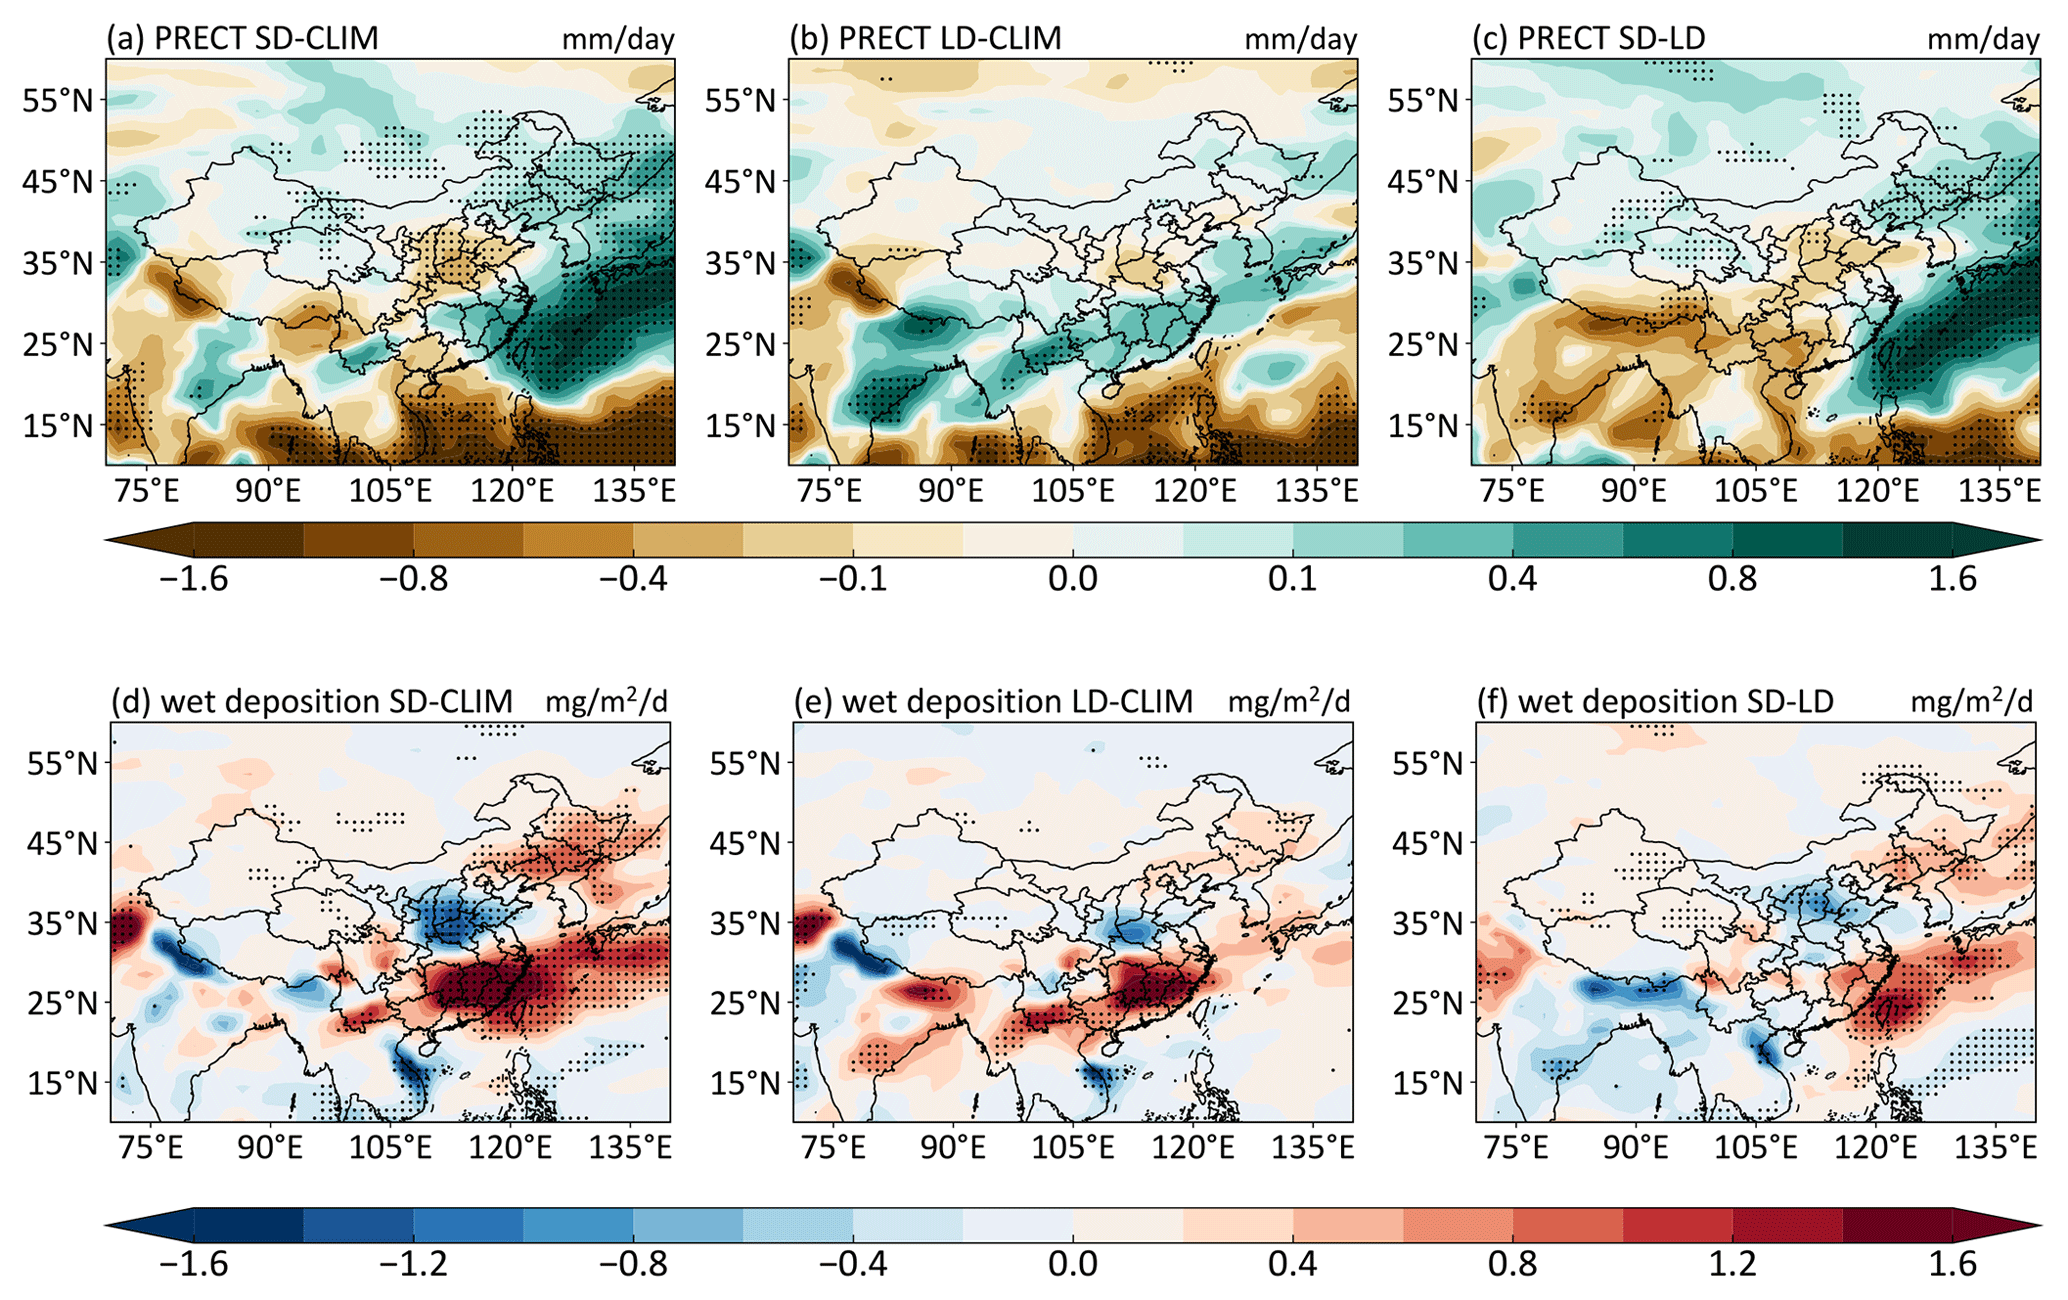
Figure 8Composite differences in DJF mean precipitation rate (a–c; unit: mm d−1) and wet deposition of PM2.5 (d–f; unit: ) between SD and CLIM (a, d), LD and CLIM (b, e), and SD and LD (c, f). The stippled areas indicate statistical significance with 90 % confidence from a two-tailed t test.
Both the accumulation/dispersion of local aerosols within China and regional transport of aerosols from southern and southeast Asia can contribute to the aerosol changes in China during El Niño events. With emissions of aerosols and precursor gases in southern and southeast Asia turned off, the decrease pattern of PM2.5 over central-eastern China does not change (Fig. 9), suggesting that accumulation/dispersion of local aerosols dominates the aerosol change over this region during El Niño events. Over southern China, the increase of PM2.5 burden is weakened when the southern and southeast Asian emissions are turned off, indicating that regional transport of aerosols from southern and southeast Asia have a large contribution to the aerosol variation over this region. It is interesting that, without emissions from southern and southeast Asia, both near-surface concentration and column burden of PM2.5 in northeastern China decrease during El Niño events relative to the climatological mean, but the change reverses to increase when the southern and southeast Asian emissions are considered. It indicates that the aerosol enhancements in northeastern China during the El Niño events are most likely influenced by aerosol transport from southern and southeast Asia due to anomalous southeasterly winds at the eastern edge of the anomalous cyclonic circulation in eastern China (Fig. 6c), which warrants further analysis using a source–receptor model such as CAM5-EAST (Ren et al., 2020; Yang et al., 2020).

Figure 9Composite differences in DJF mean near-surface PM2.5 concentration (µg m−3) and aerosol column burden (mg m−2) between SD_emis and CLIM_emis (a, c) SD and CLIM (b, d). The stippled areas indicate statistical significance with 90 % confidence from a two-tailed t test.
3.3 Quantitative impacts on regional PM2.5 concentrations and haze days
Figure 10 summarizes the simulated probability density distributions of PM2.5 concentrations, regional mean PM2.5 concentrations and number of haze days in DJF over the subregions in China, including the North China Plain (NCP; 35–41∘ N, 114–120∘ E), Sichuan Basin (SCB; 28–33∘ N, 103–108∘ E), Yangtze River Delta (YRD; 29–34∘ N, 118–121.5∘ E), Pearl River Delta (PRD; 21.5–25∘ N, 111–116∘ E), Northeast Plain (NEP; 41–48∘ N, 120–130∘ E), the Yunnan–Guizhou Plateau (YGP; 23–27∘ N, 100–110∘ E), and the Fenwei Plain (FWP; 33–35∘ N, 106–112∘ E and 35–38∘ N, 110–114∘ E) from CLIM, SD and LD simulations. Haze days are defined as days with daily near-surface PM2.5 concentrations above the 90th percentile of the CLIM PM2.5 concentrations in each subregion of China.
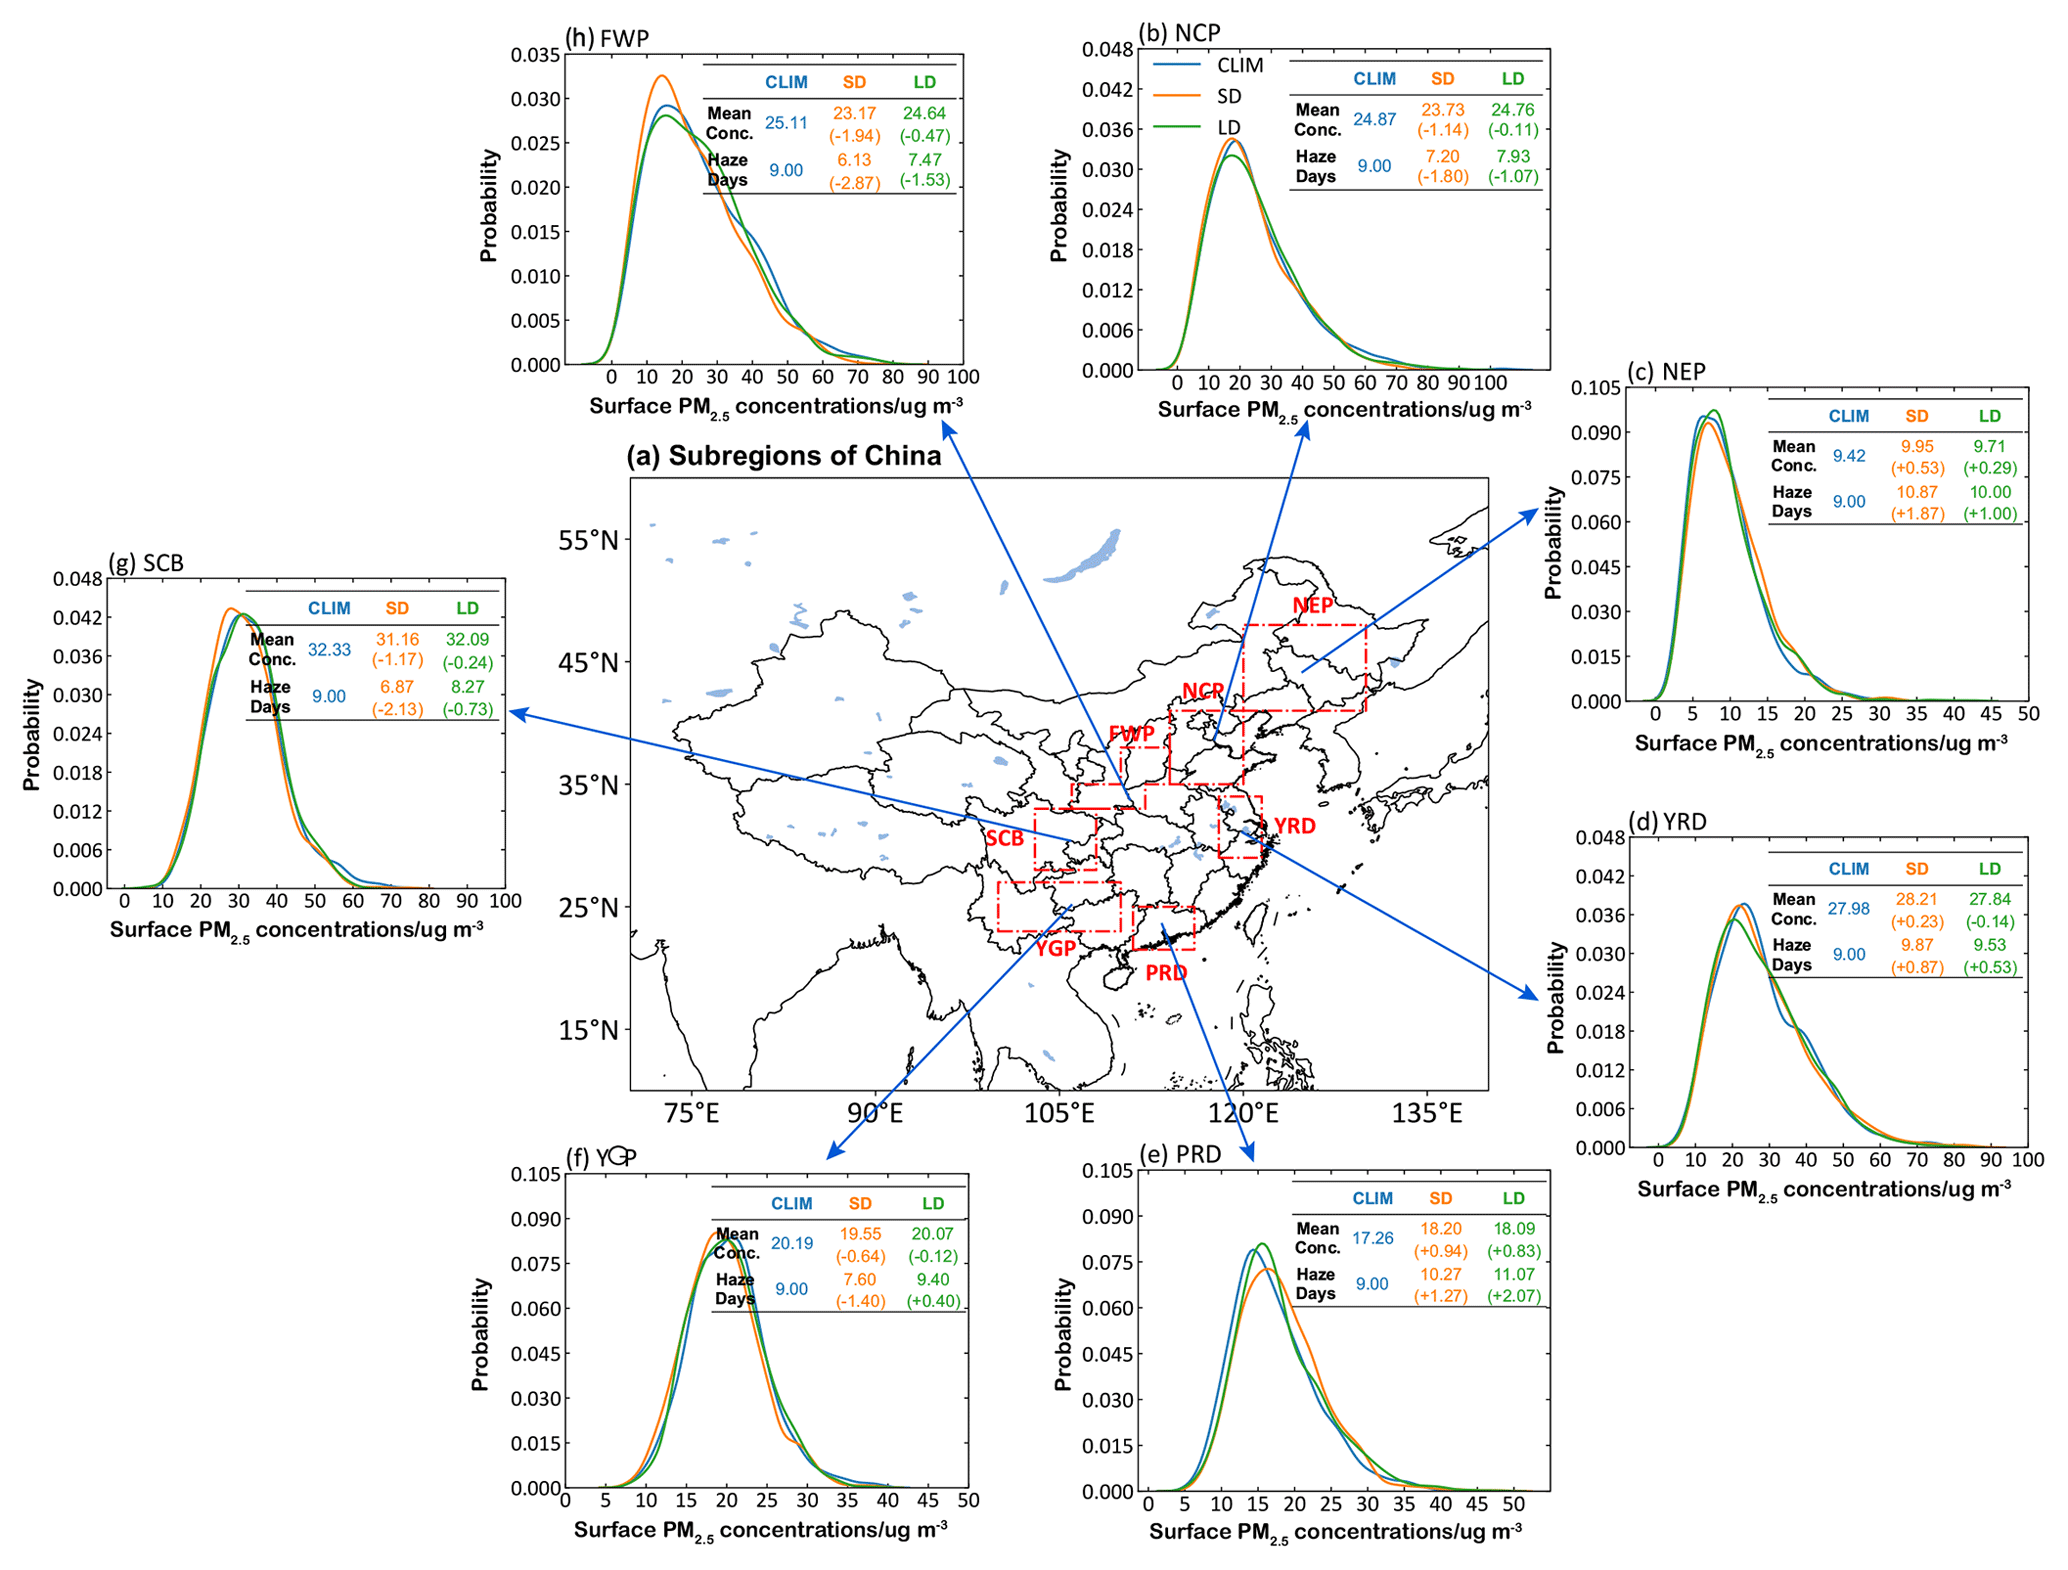
Figure 10(a) Subregions of China defined in this study, including the North China Plain (NCP, 35–41∘ N, 114–120∘ E), the Sichuan Basin (SCB, 28–33∘ N, 103–108∘ E), the Yangtze River Delta (YRD, 29–34∘ N, 118–121.5∘ E), the Pearl River Delta (PRD, 21.5–25∘ N, 111–116∘ E), the Northeast Plain (NEP, 41–48∘ N, 120–130∘ E), the Yunnan–Guizhou Plateau (YGP, 23–27∘ N, 100–110∘ E) and the Fenwei Plain (FWP, 33–35∘ N, 106–112∘ E and 35–38∘ N, 110–114∘ E). (b–h) Probability density distributions of daily near-surface PM2.5 concentrations (µg m−3) in DJF over various subregions of China. The seasonal mean aerosol concentrations (unit: µg m−3) and number of haze days in December–January–February (DJF) over various regions of China from CLIM, SD and LD experiments are shown in the corresponding table. Haze days are defined as days with daily average near-surface PM2.5 concentrations above the 90th percentile in each region. The values in brackets represent the anomalies in SD and LD relative to CLIM.
During El Niño events, DJF mean near-surface PM2.5 concentrations decrease over NCP, SCB, YGP, and FWP regions and increase over PRD and NEP in both SD and LD compared to CLIM. Although the PM2.5 concentrations show an increase in SD and a decrease in LD over the YRD region, the changes are statistically insignificant in this region (Fig. 5). SD El Niño events have a stronger modulation effect on aerosols in China than LD El Niño events. Over the regions with concentration decreases (NCP, SCB, YGP and FWP), regional mean near-surface PM2.5 concentration in LD is lower than CLIM by 0.24 µg m−3, while the reduction reaches 1.22 µg m−3 in SD, which is about 5 times as that of LD. Over the regions with concentration increases (PRD and NEP), the PM2.5 increase in SD relative to CLIM is 0.74 µg m−3, which is also higher than the 0.56 µg m−3 in LD.
Similar to the PM2.5 concentration, the modulation of SD El Niño events on haze days is 2–3 times as high as that of LD El Niño events. During LD El Niño events, the number of haze days in DJF at NCP, SCB and FWP is reduced by 1.14, 0.73 and 1.53 d, respectively, compared to the climatological mean, while the decrease in haze days during SD El Niño events is more substantial (1.87, 2.13 and 2.87 d). The probability density distributions of PM2.5 concentrations over NCP, SCB and FWP in SD and LD also shift to the left relative to CLIM (Fig. 10b, g and h). Consistent with the stronger modulation of SD El Niño events discussed above, the shift in SD is more than that in the LD simulation. In addition, YRD, PRD and NEP regions all have increases in haze days in DJF during SD and LD relative to CLIM. Similarly, during SD and LD El Niño events, the probability density distributions of high values of PM2.5 concentrations over YRD, PRD and NEP slightly shift to the right relative to CLIM (Fig. 10c–e). The number of haze days in DJF over YGP decreases during SD El Niño events by 1.4 d, but there is a slight increase of 0.4 d during LD El Niño events, likely due to the opposite aerosol changes in the eastern and western parts of the YGP region (Fig. 5). There are more (fewer) haze days in both SD and LD than in CLIM over YRD, PRD and NEP (NCP, SCB and FWP), which is inconsistent with the simulated greater (lesser) precipitation over these regions caused by El Niño events. It further indicates that anomalies in precipitation are not the most dominant factor modulating winter haze days in China during El Niño events, but rather the anomalous aerosol accumulation/dispersion and transport due to anomalous atmospheric circulation.
3.4 Historical increase in SD El Niño events
Many studies have suggested an increase in the variability of El Niño events under the greenhouse warming effect (Cai et al., 2018; Grothe et al., 2020). However, few studies have shown the historical changes in El Niño with different durations, which would further impact aerosol concentrations and haze days in China.
Here we show the occurrence of SD and LD El Niño events since the preindustrial era in Fig. 11. The number of SD El Niño events fluctuated but has increased significantly during the past few decades, especially after the 1940s. The occurrence of SD El Niño increased from one event every 15 years during 1941–1955 to four events every 15 years during 2001–2015, with the increase at confidence level of 92 %, while LD El Niño events did not present a significant trend in the historical period. Wu et al. (2019) found that the duration of El Niño is mainly influenced by the timing of onset, associated with the early onset of delayed negative oceanic feedback as well as the fast adjustments of the tropical Indian Ocean and Atlantic Ocean to the tropical Pacific Ocean warming. It is conjectured that the onset timing of El Niño events becomes earlier under greenhouse forcing, but the detailed analysis is out of the scope of this study. Nevertheless, because the frequency of the El Niño events with short duration increased significantly, the modulation by El Niño events on wintertime aerosols in China has intensified in the past few decades.
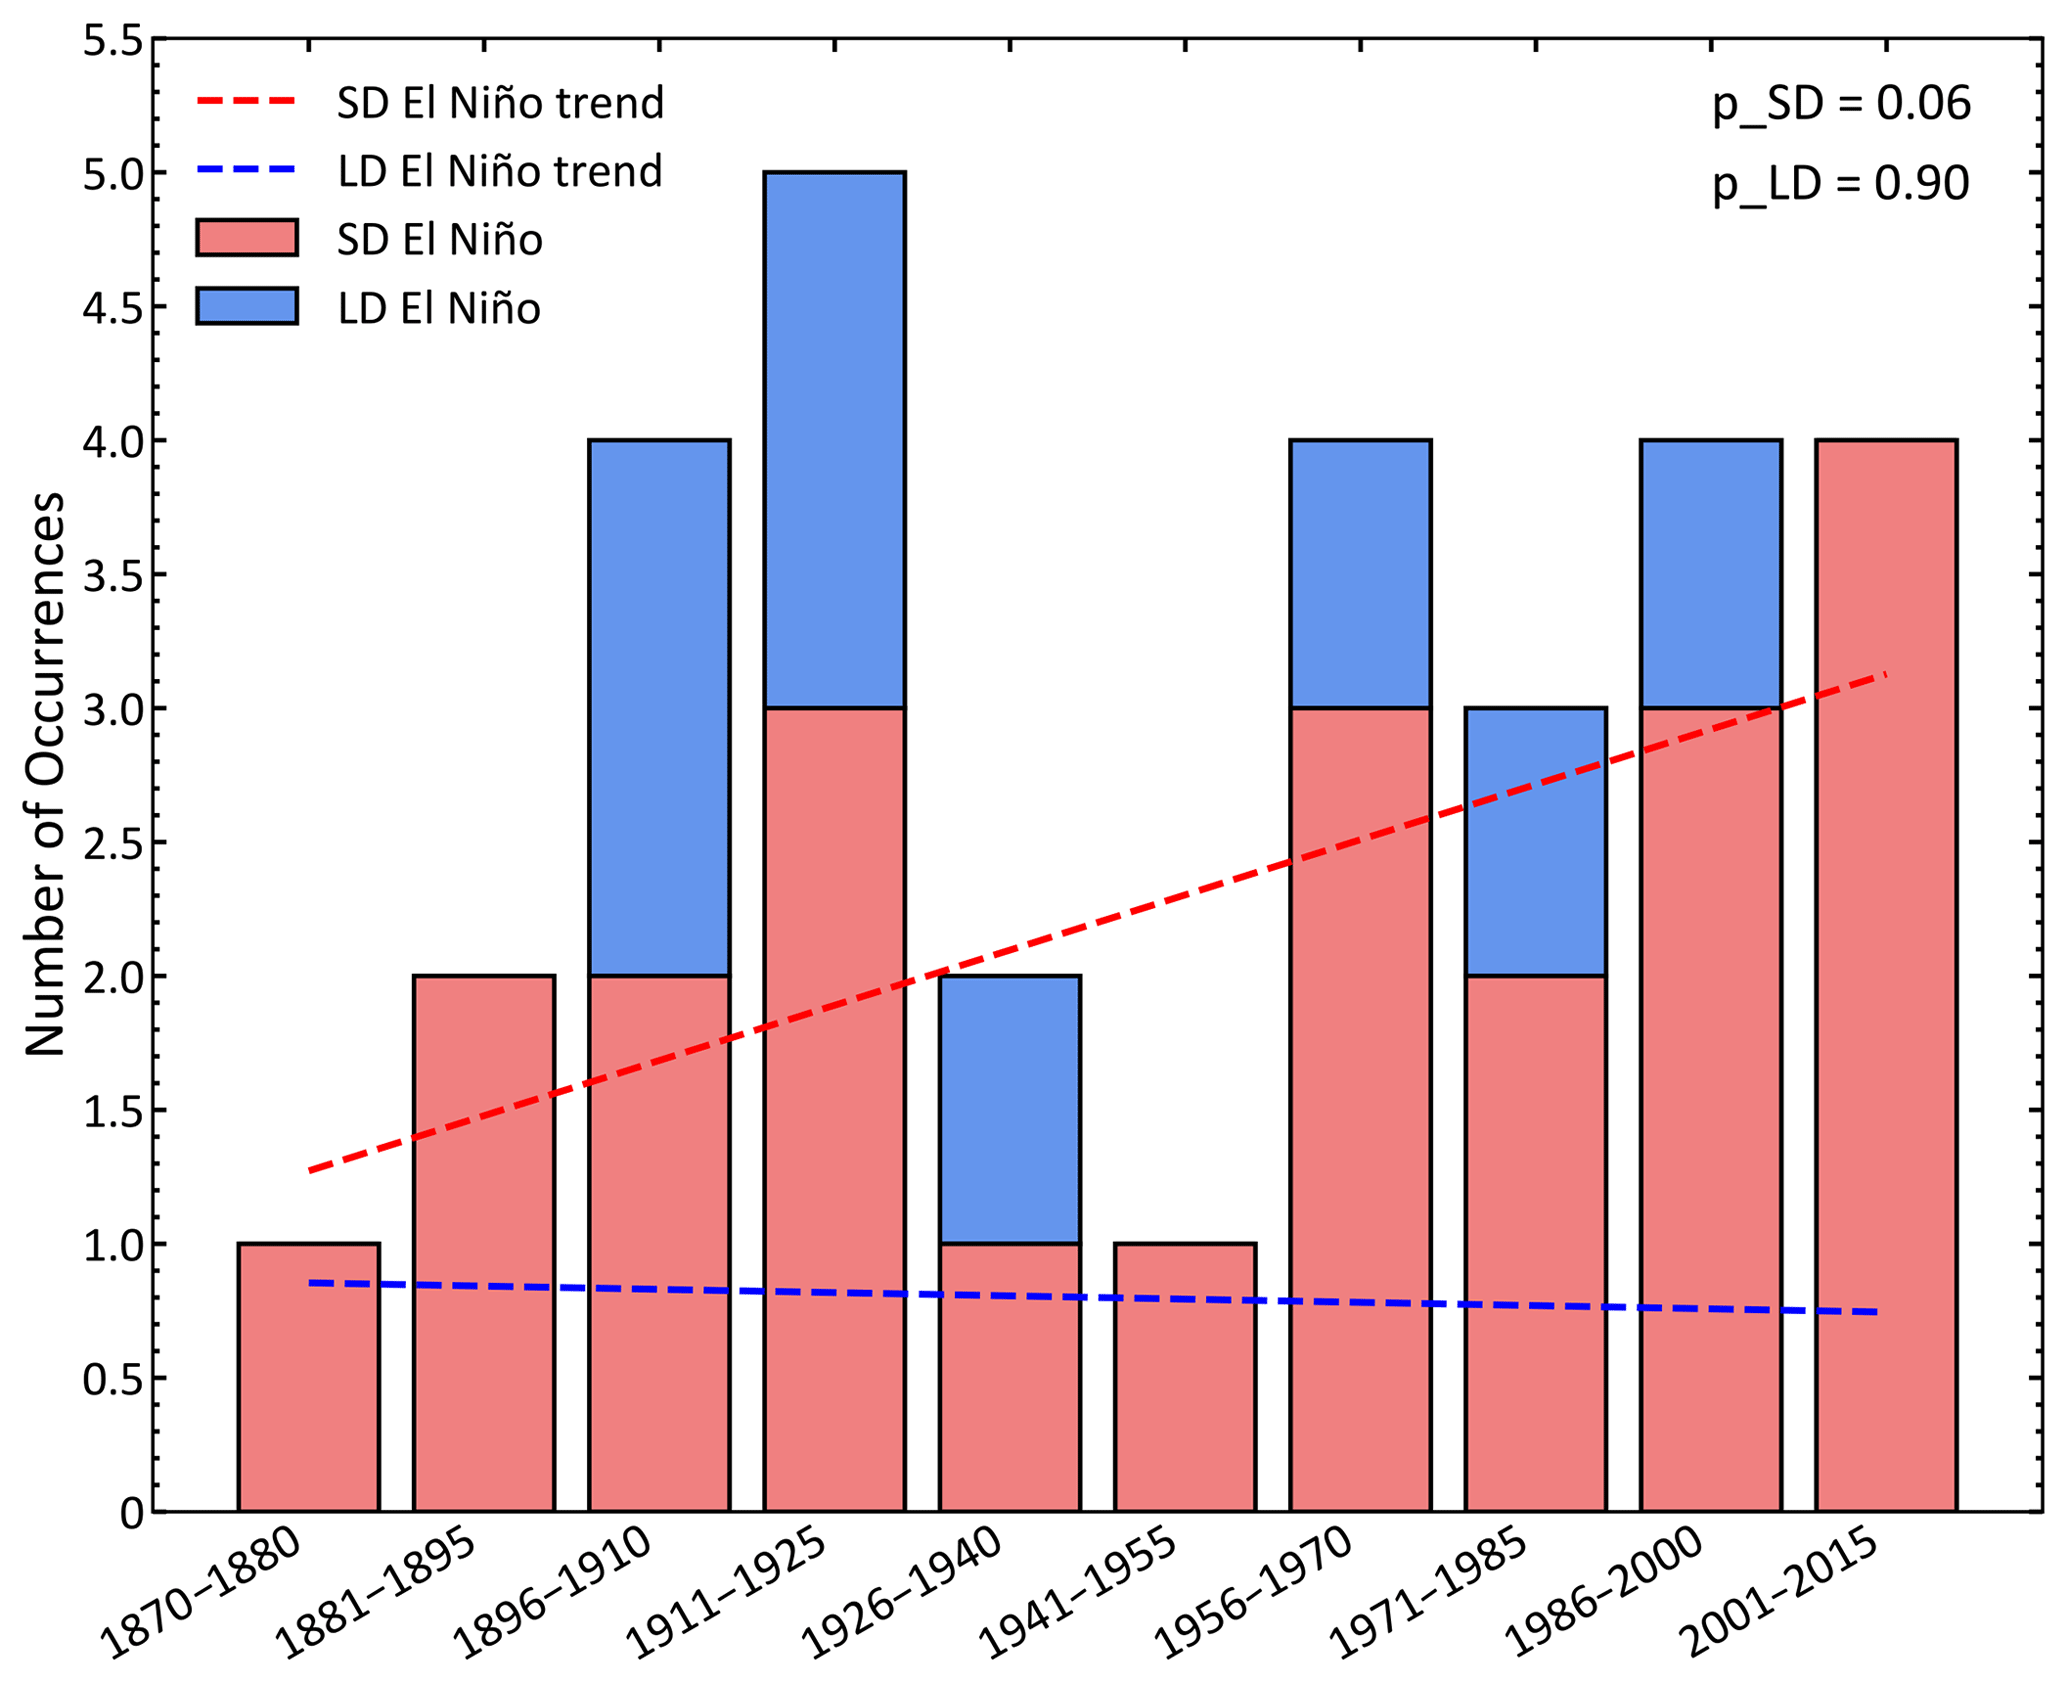
Figure 11Stacked histograms of the number of SD and LD El Niño events every 15 years (except 1870–1880 for 10 years) during 1870–2015. The red and blue dashed lines indicate linear trends in the number of SD and LD El Niño events, respectively. Their p values are shown in the upper right corner of the figure, which indicate the increasing trend of SD at a two-tailed t test confidence level of 94 % for 1870–2015 (87 % for 1880–2015 and 92 % for 1940–2015) statistical significance.
As a prominent climate phenomenon, El Niño triggers atmospheric circulation and precipitation anomalies on a global scale, thus having important effects on haze days and aerosol pollution in China. In this study, the impacts of different temporal types of El Niño events with short and long durations on aerosols in China are simulated using the state-of-the-art E3SM model.
For both SD and LD El Niño events, their changes to the DJF mean PM2.5 concentrations have similar spatial distributions over China, relative to the climatological mean. The anomalous anticyclonic circulation over the Sea of Okhotsk weakens the prevailing northwesterly winds in DJF in northeastern China and enhances the accumulation of locally emitted aerosols, along with the anomalous southeasterly winds at the eastern edge of the anomalous cyclonic circulation in eastern China that intensifies the aerosol transport from South and Southeast Asia to northeastern China. The near-surface PM2.5 concentration in northeastern China increases by 1–2 µg m−3 during El Niño events relative to the climatological conditions. In southern China, the anomalous anticyclonic circulation over the Philippine Sea facilitates the transport of aerosols from southern and southeast Asia to southern China; thus, the near-surface PM2.5 concentrations in southern China increase by 1–2 µg m−3. The decrease in near-surface PM2.5 concentrations in central-eastern China is mainly controlled by the enhanced northerly winds from the anomalous cyclonic circulation over eastern China and the East China Sea, leading to the dispersion of local aerosols, while precipitation change has little effect on aerosols here. Compared to LD El Niño events, due to the anomalous cyclonic circulation over eastern China, SD El Niño events exhibit a stronger reduction (1–2 µg m−3) in near-surface PM2.5 concentrations over central-eastern China and a larger increase (0.6 µg m−3) in northeastern China. Overall, El Niño with short duration has a stronger modulation effect on wintertime aerosols in China than El Niño with long duration.
Compared with CLIM, mean near-surface PM2.5 concentrations in DJF decrease over NCP, SCB, YGP and FWP regions and increase over PRD and NEP in both SD and LD, but the decrease over these regions in SD El Niño events reaches 1.22 µg m−3, which is about 5 times as large as that of LD. Similarly, both SD and LD El Niño events induce less (more) haze days in DJF than CLIM over NCP, SCB and FWP (YRD, PRD and NEP). However, the decreases in haze days in DJF at NCP, SCB and FWP during SD El Niño events are 2–3 times more than that during LD El Niño events.
We also found that the occurrence frequency of SD El Niño events increased from one event every 15 years during 1941–1955 to four events every 15 years during 2001–2015, whereas LD El Niño events did not exhibit a significant trend in the historical period. In particular, seven SD El Niño events have occurred since the 1990s, but no LD El Niño event occurred. Compared to LD El Niño events, SD El Niño events have a greater impact on wintertime aerosols over China. Therefore, the impact of El Niño events on wintertime aerosols in China has intensified in the past few decades due to their short durations.
Our results of the important effect of SD El Niño events and its recent intensification are of great significance for the understanding of El Niño on China's haze pollution, alleviating air pollution, and coping with climate change. The simulated spatial patterns of aerosol changes during El Niño events resemble those in previous studies (Feng et al., 2016; Yu et al., 2019; Zhao et al., 2018). However, there are still some inadequacies remaining to be improved. Natural aerosols including dust and sea salt were not considered in this study. The EAMv1 model largely underestimated PM2.5 concentration in China related to the lack of nitrate and ammonium aerosols and other model biases. We also found that, during El Niño events, more aerosols from southern and southeast Asia can be transported to northeastern China, leading to an increase in aerosol concentrations over there. Thus, more in-depth analysis is needed in future studies. In addition, during the cooling phase of ENSO, La Niña events may also have various durations and can have different impacts on air pollution in China, which merits further investigation. Since PM2.5 is more harmful to human health than PM10, in this study we focused on PM2.5 rather than PM10, which is largely contributed to by natural dust aerosol. The impacts of El Niño on dust will be investigated in our future work.
The E3SMv1 model is available at https://github.com/E3SM-Project/E3SM (last access: 25 May 2021) (http://doi.org/10.11578/E3SM/dc.20180418.36, E3SM project, 2021). Our results can be made available upon request. Hourly observations of PM2.5 concentrations over China can be derived from the China National Environmental Monitoring Centre (http://www.cnemc.cn, last access: 25 May 2021) (CNEMC, 2021). Monthly ERA5 reanalysis data can be downloaded at https://www.ecmwf.int/en/forecasts/datasets/reanalysis-datasets/era5 (ECMWF, 2021) (last access: 25 May 2021).
YY designed the research. LZ performed the model simulations and analyzed the data. All the authors discussed the results and wrote the paper.
The authors declare that they have no conflict of interest.
Publisher's note: Copernicus Publications remains neutral with regard to jurisdictional claims in published maps and institutional affiliations.
This study was supported by the National Natural Science Foundation of China (grant 41975159) and the National Key Research and Development Program of China (grant nos. 2020YFA0607803 and 2019YFA0606800). Hailong Wang acknowledges the support by the U.S. Department of Energy (DOE), Office of Science, Office of Biological and Environmental Research (BER), as part of the Earth and Environmental System Modeling program. The Pacific Northwest National Laboratory (PNNL) is operated for DOE by the Battelle Memorial Institute under contract DE-AC05-76RLO1830.
This study was supported by the National Natural Science Foundation of China (grant no. 41975159) and the National Key Research and Development Program of China (grant nos. 2020YFA0607803 and 2019YFA0606800).
This paper was edited by Yves Balkanski and reviewed by three anonymous referees.
Boo, K.-O., Lim, G.-H., and Kim, K.-Y.: On the low-level circulation over the western north Pacific in relation with the duration of El Niño, Geophys. Res. Lett., 31, L10202, https://doi.org/10.1029/2004GL019418, 2004.
Cai, W., Li, K., Liao, H., Wang, H., and Wu, L.: Weather conditions conducive to Beijing severe haze more frequent under climate change, Nat. Clim. Change, 7, 257–262, https://doi.org/10.1038/nclimate3249, 2017.
Cai, W., Wang, G., Dewitte, B., Wu, L., Santoso, A., Takahashi, K., Yang, Y., Carréric, A., and McPhaden, M. J.: Increased variability of eastern Pacific El Niño under greenhouse warming, Nature, 564, 201–206, https://doi.org/10.1038/s41586-018-0776-9, 2018.
Chang, L., Xu, J., Tie, X., and Wu, J.: Impact of the 2015 El Nino event on winter air quality in China, Sci. Rep.-UK, 6, 34275, https://doi.org/10.1038/srep34275, 2016.
Chen, W., Park, J.-K., Dong, B., Lu, R., and Jung, W.-S.: The relationship between El Niño and the western North Pacific summer climate in a coupled GCM: Role of the transition of El Niño decaying phases, J. Geophys. Res.-Atmos., 117, D12111, https://doi.org/10.1029/2011JD017385, 2012.
China National Environmental Monitoring Center (CNEMC): Homepage, available at: http://www.cnemc.cn, last access: 25 May 2021.
Cohen, A. J., Brauer, M., Burnett, R., Anderson, H. R., Frostad, J., Estep, K., Balakrishnan, K., Brunekreef, B., Dandona, L., Dandona, R., Feigin, V., Freedman, G., Hubbell, B., Jobling, A., Kan, H., Knibbs, L., Liu, Y., Martin, R., Morawska, L., Pope, C. A., Shin, H., Straif, K., Shaddick, G., Thomas, M., van Dingenen, R., van Donkelaar, A., Vos, T., Murray, C. J. L., and Forouzanfar, M. H.: Estimates and 25-year trends of the global burden of disease attributable to ambient air pollution: an analysis of data from the Global Burden of Diseases Study 2015, Lancet, 389, 1907–1918, https://doi.org/10.1016/s0140-6736(17)30505-6, 2017.
E3SM Project: Energy Exascale Earth System Model v1.0: Computer Software, DOE [data set], https://doi.org/10.11578/E3SM/dc.20180418.36, 2021.
ECMWF: ERA5, available at: https://www.ecmwf.int/en/forecasts/datasets/reanalysis-datasets/era5, last access: 25 May 2021.
Feng, J., Zhu, J., and Li, Y.: Influences of El Niño on aerosol concentrations over eastern China, Atmos. Sci. Lett., 17, 422–430, https://doi.org/10.1002/asl.674, 2016.
Feng, J., Li, J., Zhu, J., Liao, H., and Yang, Y.: Simulated contrasting influences of two La Niña Modoki events on aerosol concentrations over eastern China, J. Geophys. Res.-Atmos., 122, 2734–2749, https://doi.org/10.1002/2016JD026175, 2017.
Feng, J., Zhu, J., Li, J., and Liao, H.: Aerosol concentrations variability over China: two distinct leading modes, Atmos. Chem. Phys., 20, 9883–9893, https://doi.org/10.5194/acp-20-9883-2020, 2020.
Gao, H. and Li, X.: Influences of El Nino Southern Oscillation events on haze frequency in eastern China during boreal winters, Int. J. Climatol., 35, 2682–2688, https://doi.org/10.1002/joc.4133, 2015.
Golaz, J. C., Caldwell, P. M., Van Roekel, L. P., Petersen, M. R., Tang, Q., Wolfe, J. D., Abeshu, G., Anantharaj, V., Asay-Davis, X. S., Bader, D. C., Baldwin, S. A., Bisht, G., Bogenschutz, P. A., Branstetter, M., Brunke, M. A., Brus, S. R., Burrows, S. M., Cameron-Smith, P. J., Donahue, A. S., Deakin, M., Easter, R. C., Evans, K. J., Feng, Y., Flanner, M., Foucar, J. G., Fyke, J. G., Griffin, B. M., Hannay, C., Harrop, B. E., Hoffman, M. J., Hunke, E. C., Jacob, R. L., Jacobsen, D. W., Jeffery, N., Jones, P. W., Keen, N. D., Klein, S. A., Larson, V. E., Leung, L. R., Li, H. Y., Lin, W., Lipscomb, W. H., Ma, P. L., Mahajan, S., Maltrud, M. E., Mametjanov, A., McClean, J. L., McCoy, R. B., Neale, R. B., Price, S. F., Qian, Y., Rasch, P. J., Reeves Eyre, J. E. J., Riley, W. J., Ringler, T. D., Roberts, A. F., Roesler, E. L., Salinger, A. G., Shaheen, Z., Shi, X., Singh, B., Tang, J., Taylor, M. A., Thornton, P. E., Turner, A. K., Veneziani, M., Wan, H., Wang, H., Wang, S., Williams, D. N., Wolfram, P. J., Worley, P. H., Xie, S., Yang, Y., Yoon, J. H., Zelinka, M. D., Zender, C. S., Zeng, X., Zhang, C., Zhang, K., Zhang, Y., Zheng, X., Zhou, T., and Zhu, Q.: The DOE E3SM Coupled Model Version 1: Overview and Evaluation at Standard Resolution, J. Adv. Model. Earth Sy., 11, 2089–2129, https://doi.org/10.1029/2018MS001603, 2019.
Grothe, P. R., Cobb, K. M., Liguori, G., Di Lorenzo, E., Capotondi, A., Lu, Y., Cheng, H., Edwards, R. L., Southon, J. R., Santos, G. M., Deocampo, D. M., Lynch-Stieglitz, J., Chen, T., Sayani, H. R., Thompson, D. M., Conroy, J. L., Moore, A. L., Townsend, K., Hagos, M., O'Connor, G., and Toth, L. T.: Enhanced El Niño-Southern oscillation variability in recent decades, Geophys. Res. Lett., 46, e2019GL083906, https://doi.org/10.1029/2019GL083906, 2020.
Guo, Y. and Tan, Z.: Westward migration of tropical cyclone rapid-intensification over the Northwestern Pacific during short duration El Nino, Nat. Commun., 9, 1507, https://doi.org/10.1038/s41467-018-03945-y, 2018.
Han, X., Zhang, M., Tao, J., Wang, L., Gao, J., Wang, S., and Chai, F.: Modeling aerosol impacts on atmospheric visibility in Beijing with RAMS-CMAQ, Atmos. Environ., 72, 177–191, https://doi.org/10.1016/j.atmosenv.2013.02.030, 2013.
Hersbach, H., Bell, B., Berrisford, P., Hirahara, S., Horányi, A., Muñoz-Sabater, J., Nicolas, J., Peubey, C., Radu, R., Schepers, D., Simmons, A., Soci, C., Abdalla, S., Abellan, X., Balsamo, G., Bechtold, P., Biavati, G., Bidlot, J., Bonavita, M., Chiara, G. D., Dahlgren, P., Dee, D., Diamantakis, M., Dragani, R., Flemming, J., Forbes, R., Fuentes, M., Geer, A., Haimberger, L., Healy, S., Hogan, R. J., Hólm, E., Janisková, M., Keeley, S., Laloyaux, P., Lopez, P., Lupu, C., Radnoti, G., Rosnay, P. de, Rozum, I., Vamborg, F., Villaume, S., and Thépaut, J.-N.: The ERA5 Global Reanalysis, Q. J. Roy. Meteor. Soc., 146, 1999–2049, https://doi.org/10.1002/qj.3803, 2020.
Hoesly, R. M., Smith, S. J., Feng, L., Klimont, Z., Janssens-Maenhout, G., Pitkanen, T., Seibert, J. J., Vu, L., Andres, R. J., Bolt, R. M., Bond, T. C., Dawidowski, L., Kholod, N., Kurokawa, J.-I., Li, M., Liu, L., Lu, Z., Moura, M. C. P., O'Rourke, P. R., and Zhang, Q.: Historical (1750–2014) anthropogenic emissions of reactive gases and aerosols from the Community Emissions Data System (CEDS), Geosci. Model Dev., 11, 369–408, https://doi.org/10.5194/gmd-11-369-2018, 2018.
Huang, R.-J., Zhang, Y., Bozzetti, C., Ho, K.-F., Cao, J.-J., Han, Y., Daellenbach, K. R., Slowik, J. G., Platt, S. M., Canonaco, F., Zotter, P., Wolf, R., Pieber, S. M., Bruns, E. A., Crippa, M., Ciarelli, G., Piazzalunga, A., Schwikowski, M., Abbaszade, G., Schnelle-Kreis, J., Zimmermann, R., An, Z., Szidat, S., Baltensperger, U., Haddad, I. El, and Prevot, A. S. H.: High secondary aerosol contribution to particulate pollution during haze events in China, Nature, 514, 218–222, https://doi.org/10.1038/nature13774, 2014.
Hurrell, J. W., Hack, J. J., Shea, D., Caron, J. M., and Rosinski, J.: A new sea surface temperature and sea ice boundary dataset for the Community Atmosphere Model, J. Climate, 21, 5145–5153, https://doi.org/10.1175/2008jcli2292.1, 2008.
Jeoung, H., Chung, C. E., Van Noije, T., and Takemura, T.: Relationship between fine-mode AOD and precipitation on seasonal and interannual time scales, Tellus B, 66, 23037, https://doi.org/10.3402/tellusb.v66.23037, 2014.
Kao, H.-Y. and Yu, J.-Y.: Contrasting Eastern-Pacific and Central-Pacific Types of ENSO, J. Climate, 22, 615–632, https://doi.org/10.1175/2008jcli2309.1, 2009.
Li, S., Han, Z., and Chen, H.: A comparison of the effects of interannual Arctic sea ice loss and ENSO on winter haze days: Observational analyses and AGCM simulations, J. Meteorol. Res., 31, 820–833, https://doi.org/10.1007/s13351-017-7017-2, 2017.
Liu, C., Chen, R., Sera, F., Vicedo-Cabrera, A. M., Guo, Y., Tong, S., Coelho, M. S. Z. S., Saldiva, P. H. N., Lavigne, E., Matus, P., Valdes Ortega, N., Osorio Garcia, S., Pascal, M., Stafoggia, M., Scortichini, M., Hashizume, M., Honda, Y., Hurtado-Diaz, M., Cruz, J., Nunes, B., Teixeira, J. P., Kim, H., Tobias, A., Íñiguez, C., Forsberg, B., Åström, C., Ragettli, M. S., Guo, Y.-L., Chen, B.-Y., Bell, M. L., Wright, C. Y., Scovronick, N., Garland, R. M., Milojevic, A., Kyselý, J., Urban, A., Orru, H., Indermitte, E., Jaakkola, J. J. K., Ryti, N. R. I., Katsouyanni, K., Analitis, A., Zanobetti, A., Schwartz, J., Chen, J., Wu, T., Cohen, A., Gasparrini, A., and Kan, H.: Ambient Particulate Air Pollution and Daily Mortality in 652 Cities, New Engl. J. Med., 381, 705–715, https://doi.org/10.1056/NEJMoa1817364, 2019.
Rasch, P. J., Xie, S., Ma, P. L., Lin, W., Wang, H., Tang, Q., Burrows, S. M., Caldwell, P., Zhang, K., Easter, R. C., Cameron-Smith, P., Singh, B., Wan, H., Golaz, J. C., Harrop, B. E., Roesler, E., Bacmeister, J., Larson, V. E., Evans, K. J., Qian, Y., Taylor, M., Leung, L. R., Zhang, Y., Brent, L., Branstetter, M., Hannay, C., Mahajan, S., Mametjanov, A., Neale, R., Richter, J. H., Yoon, J. H., Zender, C. S., Bader, D., Flanner, M., Foucar, J. G., Jacob, R., Keen, N., Klein, S. A., Liu, X., Salinger, A. G., Shrivastava, M., and Yang, Y.: An Overview of the Atmospheric Component of the Energy Exascale Earth System Model, J. Adv. Model. Earth Sy., 11, 2377–2411, https://doi.org/10.1029/2019MS001629, 2019.
Ren, L., Yang, Y., Wang, H., Zhang, R., Wang, P., and Liao, H.: Source attribution of Arctic black carbon and sulfate aerosols and associated Arctic surface warming during 1980–2018, Atmos. Chem. Phys., 20, 9067–9085, https://doi.org/10.5194/acp-20-9067-2020, 2020.
Sakai, K. and Kawamura, R.: Remote response of the East Asian winter monsoon to tropical forcing related to El Niño-Southern Oscillation, J. Geophys. Res.-Atmos., 114, D06105, https://doi.org/10.1029/2008JD010824, 2009.
Sun, J., Li, H., Zhang, W., Li, T., Zhao, W., Zuo, Z., Guo, S., Wu, D., and Fan, S.: Modulation of the ENSO on Winter Aerosol Pollution in the Eastern Region of China, J. Geophys. Res.-Atmos., 123, 11,952–11,969, https://doi.org/10.1029/2018jd028534, 2018.
Trenberth, K. E.: El Niño Southern Oscillation (ENSO), in: Encyclopedia of Ocean Sciences, third edn., Academic Press, Oxford, 420–432, https://doi.org/10.1016/b978-0-12-409548-9.04082-3, 2019.
van Marle, M. J. E., Kloster, S., Magi, B. I., Marlon, J. R., Daniau, A.-L., Field, R. D., Arneth, A., Forrest, M., Hantson, S., Kehrwald, N. M., Knorr, W., Lasslop, G., Li, F., Mangeon, S., Yue, C., Kaiser, J. W., and van der Werf, G. R.: Historic global biomass burning emissions for CMIP6 (BB4CMIP) based on merging satellite observations with proxies and fire models (1750–2015), Geosci. Model Dev., 10, 3329–3357, https://doi.org/10.5194/gmd-10-3329-2017, 2017.
Wang, B., Wu, R., and Fu, X.: Pacifi-East Asian Teleconnection: How Does ENSO Affect East Asian Climate?, J. Climate, 13, 1517–1536, https://doi.org/10.1175/1520-0442(2000)013{<}1517:PEATHD{>}2.0.CO;2, 2000.
Wang, H., Chen, H., and Liu, J.: Arctic sea ice decline intensified haze pollution in eastern China, Atmos. Ocean. Sci. Lett. 8, 1–9, https://doi.org/10.3878/AOSL20140081, 2015.
Wang, H., Easter, R. C., Zhang, R., Ma, P.-L., Singh, B., Zhang, K., Ganguly, D., Rasch, P. J., Burrows, S. M., Ghan, S. J., Lou, S., Qian, Y., Yang, Y., Feng, Y., Flanner, M., Leung, L. R., Liu, X., Shrivastava, M., Sun, J., Tang, Q., Xie, S., and Yoon, J.-H., Aerosols in the E3SM Version 1: New developments and their impacts on radiative forcing, J. Adv. Model. Earth Sy., 12, e2019MS001851, https://doi.org/10.1029/2019MS001851, 2020.
Wang, J., Zhu, Z., Qi, L., Zhao, Q., He, J., and Wang, J. X. L.: Two pathways of how remote SST anomalies drive the interannual variability of autumnal haze days in the Beijing–Tianjin–Hebei region, China, Atmos. Chem. Phys., 19, 1521–1535, https://doi.org/10.5194/acp-19-1521-2019, 2019.
Wang, J., Liu, Y., Ding, Y., Wu, P., Zhu, Z., Xu, Y., Li, Q., Zhang, Y., He, J., Wang, J. X. L., and Qi, L.: Impacts of climate anomalies on the interannual and interdecadal variability of autumn and winter haze in North China: A review, Int. J. Climatol., 40, 4309–4325, https://doi.org/10.1002/joc.6471, 2020a.
Wang, J., Liu, Y., and Ding, Y.: On the connection between interannual variations of winter haze frequency over Beijing and different ENSO flavors, Sci. Total Environ., 740, 140109, https://doi.org/10.1016/j.scitotenv.2020.140109, 2020b.
Wu, X., Okumura, Y. M., and Dinezio, P. N.: What Controls the Duration of El Niño and La Niña Events?, J. Climate, 32, 5941–5965, https://doi.org/10.1175/jcli-d-18-0681.1, 2019.
Yang, Y., Liao, H., and Li, J.: Impacts of the East Asian summer monsoon on interannual variations of summertime surface-layer ozone concentrations over China, Atmos. Chem. Phys., 14, 6867–6879, https://doi.org/10.5194/acp-14-6867-2014, 2014.
Yang, Y., Liao, H., and Lou, S.: Increase in winter haze over eastern China in recent decades: Roles of variations in meteorological parameters and anthropogenic emissions, J. Geophys. Res.-Atmos., 121, 13050–13065, https://doi.org/10.1002/2016JD025136, 2016a.
Yang, Y., Russell, L. M., Xu, L., Lou, S., Lamjiri, M. A., Somerville, R. C. J., Miller, A. J., Cayan, D. R., DeFlorio, M. J., Ghan, S. J., Liu, Y., Singh, B., Wang, H., Yoon, J.-H., and Rasch, P. J.: Impacts of ENSO events on cloud radiative effects in preindustrial conditions: Changes in cloud fraction and their dependence on interactive aerosol emissions and concentrations, J. Geophys. Res.-Atmos., 121, 6321–6335, https://doi.org/10.1002/2015jd024503, 2016b.
Yang, Y., Russell, L. M., Lou, S., Liu, Y., Singh, B., and Ghan, S. J.: Rain-aerosol relationships influenced by wind speed, Geophys. Res. Lett., 43, 2267–2274, https://doi.org/10.1002/2016GL067770, 2016c.
Yang, Y., Wang, H., Smith, S. J., Easter, R., Ma, P.-L., Qian, Y., Yu, H., Li, C., and Rasch, P. J.: Global source attribution of sulfate concentration and direct and indirect radiative forcing, Atmos. Chem. Phys., 17, 8903–8922, https://doi.org/10.5194/acp-17-8903-2017, 2017a.
Yang, Y., Wang, H., Smith, S. J., Ma, P.-L., and Rasch, P. J.: Source attribution of black carbon and its direct radiative forcing in China, Atmos. Chem. Phys., 17, 4319–4336, https://doi.org/10.5194/acp-17-4319-2017, 2017b.
Yang, Y., Wang, H., Smith, S. J., Zhang, R., Lou, S., Qian, Y., Ma, P.-L., and Rasch, P. J.: Recent intensification of winter haze in China linked to foreign emissions and meteorology, Sci. Rep.-UK, 8, 2107, https://doi.org/10.1038/s41598-018-20437-7, 2018.
Yang, Y., Lou, S., Wang, H., Wang, P., and Liao, H.: Trends and source apportionment of aerosols in Europe during 1980–2018, Atmos. Chem. Phys., 20, 2579–2590, https://doi.org/10.5194/acp-20-2579-2020, 2020.
Yang, Y. R., Liu, X. G., Qu, Y., An, J. L., Jiang, R., Zhang, Y. H., Sun, Y. L., Wu, Z. J., Zhang, F., Xu, W. Q., and Ma, Q. X.: Characteristics and formation mechanism of continuous hazes in China: a case study during the autumn of 2014 in the North China Plain, Atmos. Chem. Phys., 15, 8165–8178, https://doi.org/10.5194/acp-15-8165-2015, 2015.
Yu, X., Wang, Z., Zhang, H., and Zhao, S.: Impacts of different types and intensities of El Nino events on winter aerosols over China, Sci. Total Environ., 655, 766–780, https://doi.org/10.1016/j.scitotenv.2018.11.090, 2019.
Zhang, G., Gao, Y., Cai, W., Leung, L. R., Wang, S., Zhao, B., Wang, M., Shan, H., Yao, X., and Gao, H.: Seesaw haze pollution in North China modulated by the sub-seasonal variability of atmospheric circulation, Atmos. Chem. Phys., 19, 565–576, https://doi.org/10.5194/acp-19-565-2019, 2019.
Zhang, Z., Gong, D., Mao, R., Kim, S.-J., Xu, J., Zhao, X., and Ma, Z.: Cause and predictability for the severe haze pollution in downtown Beijing in November–December 2015, Sci. Total Environ., 592, 627–638, https://doi.org/10.1016/j.scitotenv.2017.03.009, 2017.
Zhao, S., Li, J. P., and Sun, C.: Decadal variability in the occurrence of wintertime haze in central eastern China tied to the Pacific decadal oscillation, Sci. Rep.-UK, 6, 27424, https://doi.org/10.1038/srep27424, 2016.
Zhao, B., Wu, W., Wang, S., Xing, J., Chang, X., Liou, K.-N., Jiang, J. H., Gu, Y., Jang, C., Fu, J. S., Zhu, Y., Wang, J., Lin, Y., and Hao, J.: A modeling study of the nonlinear response of fine particles to air pollutant emissions in the Beijing–Tianjin–Hebei region, Atmos. Chem. Phys., 17, 12031–12050, https://doi.org/10.5194/acp-17-12031-2017, 2017.
Zhao, S., Zhang, H., and Xie, B.: The effects of El Niño–Southern Oscillation on the winter haze pollution of China, Atmos. Chem. Phys., 18, 1863–1877, https://doi.org/10.5194/acp-18-1863-2018, 2018.
Zhu, J., Liao, H., and Li, J.: Increases in aerosol concentrations over eastern China due to the decadal-scale weakening of the East Asian summer monsoon, Geophys. Res. Lett., 39, L09809, https://doi.org/10.1029/2012GL051428, 2012.
Zou, Y., Wang, Y., Xie, Z., Wang, H., and Rasch, P. J.: Atmospheric teleconnection processes linking winter air stagnation and haze extremes in China with regional Arctic sea ice decline, Atmos. Chem. Phys., 20, 4999–5017, https://doi.org/10.5194/acp-20-4999-2020, 2020.