the Creative Commons Attribution 4.0 License.
the Creative Commons Attribution 4.0 License.
 | 08 Jul 2021
Unexpected enhancement of ozone exposure and health risks during National Day in China
Peng Wang
Juanyong Shen
Shida Sun
Hongliang Zhang
Xinming Wang
China is confronting increasing ozone (O3) pollution that worsens air quality and public health. Extreme O3 pollution occurs more frequently under special events and unfavorable meteorological conditions. Here we observed significantly elevated maximum daily 8 h average (MDA8) O3 (up to 98 ppb) during the Chinese National Day holiday (CNDH) in 2018 throughout China, with a prominent rise by up to 120 % compared to the previous week. The air quality model shows that increased precursor emissions and regional transport are major contributors to the elevation. In the Pearl River Delta region, the regional transport contributed up to 30 ppb O3 during the CNDH. Simultaneously, aggravated health risk occurs due to high O3, inducing 33 % additional deaths throughout China. Moreover, in tourist cities such as Sanya, daily mortality even increases significantly from 0.4 to 1.6. This is the first comprehensive study to investigate O3 pollution during the CNDH at the national level, aiming to arouse more focus on the O3 holiday impact of the public.
- Article
(6489 KB) - Full-text XML
-
Supplement
(2038 KB) - BibTeX
- EndNote


Tropospheric ozone (O3) has become a major air pollutant in China, especially in urban areas such as the North China Plain (NCP), Yangtze River Delta (YRD), and Pearl River Delta (PRD) in recent years, with continuously increasing maximum daily 8 h average (MDA8) O3 levels (Fang et al., 2019; Li et al., 2019; Lu et al., 2018; H. Liu et al., 2018). Exacerbated O3 pollution aggravates health risks from a series of illnesses such as cardiovascular disease (CVD), respiratory disease (RD), hypertension, stroke, and chronic obstructive pulmonary disease (COPD) (H. Liu et al., 2018; Li et al., 2015; Brauer et al., 2016; Lelieveld et al., 2013; P. Wang et al., 2020). In China, the annual COPD mortality due to O3 reached up to 8.03×10⁴ in 2015 (H. Liu et al., 2018).
O3 is generated by nonlinear photochemical reactions of its precursors involving volatile organic compounds (VOCs) and nitrogen oxides (NOx) (Sillman, 1995; T. Wang et al., 2017). The VOC NOx ratio determines O3 sensitivity that is classified as VOC-limited, transition, and NOx-limited, which controls O3 formation (Sillman, 1995; Sillman and He, 2002; Cohan et al., 2005). Also, regional transport was reported as an important source of high O3 in China (Gao et al., 2016; P. Wang et al., 2020; Li et al., 2012a). For instance, Li et al. (2012b) showed that over 50 % of surface O3 was contributed from regional transport in the PRD during high-O3 episodes.
O3 concentration shows different patterns between holidays and workdays (Pudasainee et al., 2010; Xu et al., 2017). Elevated O3 has been observed during holidays in different regions, resulting from changes in precursor emissions related to intensive anthropogenic activities (Tan et al., 2009; Chen et al., 2019; Tan et al., 2013; Levy, 2013). In China, most studies focus on the Chinese New Year (CNY) to investigate the long-term holiday effect on O3 in southern areas (Chen et al., 2019). However, the Chinese National Day holiday (CNDH), a nationwide 7 d festival, is less studied. Xu et al. (2017) reported that the O3 production was influenced by enhanced VOCs during the CNDH in the YRD based on in situ observations. Previous studies mainly paid attention to developed regions/cities without nationwide consideration. In addition, the national O3-attributable health impact during the CNDH is also unclear. Consequently, a comprehensive study on O3 during the CNDH is urgently needed in China.
In this study, we used observation data and a source-oriented version of the Community Multiscale Air Quality (CMAQ) model (Wang et al., 2019b) to investigate O3 characteristics during the CNDH in 2018 in China. Daily premature death mortality was evaluated to determine health impacts attributed to O3 as well. We find a rapid increase by up to 120 % of the observational MDA8 O3 from previous periods to CNDH throughout China, which is attributed to increased precursors and regional transport. This study provides an in-depth investigation of elevated O3 and its adverse health impacts during the CNDH, which has important implications for developing effective control policies in China.
2.1 The CMAQ model setup and validation
The CMAQ model with three-regime (3R) approach, which attributed O3 to NOx and VOCs based on the NOx–VOC–O3 sensitivity regime, was applied to study O3 during the CNDH in China in 2018. The regime indicator R was calculated using Eq. (1):
where is the formation rate of hydrogen peroxide (H2O2), PROOH is the formation rate of organic peroxide (ROOH), and is the formation rate of nitric acid (HNO3) in each chemistry time step. The threshold values for the transition regime are 0.047 (Rts, change from VOC-limited to transition regime) and 5.142 (Rte, change from transition regime to NOx-limited regime) in this study (Wang et al., 2019a). The formed O3 is entirely attributed to NOx or VOC sources, when R values are located in a NOx-limited (R > Rte) or VOC-limited (R < Rts) regime. In contrast, when R values are in the transition regime (), the formed O3 is attributed to both NOx and VOC sources. Two non-reactive O3 species, O3_NOx and O3_VOC, are added to the CMAQ model to quantify the O3 attributable to NOx and VOCs, respectively. In particular, O3_NOx stands for the O3 formation being under NOx-limited control, and O3_VOC stands for the O3 formation being under VOC-limited control. The details of the 3R scheme and the calculation of O3_NOx and O3_VOC are described in Wang et al. (2019a). A domain with a horizontal resolution of 36×36 km2 was applied in this study, covering China and its surrounding areas (Supplement Fig. S1). The Weather Research and Forecasting (WRF) model version 3.9.1 was used to generate the meteorological inputs, and the initial and boundary conditions were based on the FNL reanalysis data from the National Centers for Environmental Prediction (NCEP). The anthropogenic emissions in China are from the Multiresolution Emission Inventory for China (MEIC; http://www.meicmodel.org/, last access: 1 July 2021) version 1.3 that lumped emissions into five sectors: agriculture, industries, residential, power plants, and transportation. The annual MEIC emission inventory was applied in this study, and the monthly profile of the anthropogenic emissions was based on Zhang et al. (2007) and Streets et al. (2003), as shown in Table S1, to represent the emissions changes between September and October. Higher emissions rates were found during October from the residential and industrial sectors, while the levels from transportation and power sectors stayed the same. Emissions from other countries were from the MIX Asian emission inventory (Li et al., 2017). Open burning emissions were from the Fire INventory from NCAR (FINN) (Wiedinmyer et al., 2011), and biogenic emissions were generated using the Model of Emissions of Gases and Aerosols from Nature version 2.1 (MEGAN2.1) (Guenther et al., 2012). The integrated process rate (IPR) in the process analysis (PA) tool in the CMAQ model was applied to quantify the contributions of atmospheric processes to O3 (Gipson, 1999) (for details, see Table S2 in the Supplement). In the CMAQ model, the IPR and integrated reaction rate analysis (IRR) were all defined as the PA. PA aims to provide quantitative information on the process of the chemical reactions and other atmospheric processes that are being simulated, illustrating how the CMAQ model calculated its predictions. The IPR was used to determine the relative contributions of individual atmospheric physical and chemical processes in the CMAQ model.
The simulation period was from 24 September to 31 October 2018 and was divided into three intervals: PRE-CNDH (24–30 September), CNDH (1–7 October), and AFT-CNDH (8–31 October). In this study, a total of 43 cities, including both megacities (such as Beijing and Shanghai) and popular tourist cities (such as Sanya), were selected to investigate the O3 issue during the CNDH in 2018 in China (Table S3). Locations of these cities cover developed (such as the YRD region) and also suburban/rural regions (such as Urumqi and Lhasa in western China), which provides a comprehensive perspective for this study (Fig. S1).
All the statistical results of the WRF model satisfy the benchmarks (Emery et al., 2001), except for the gross error (GE) of temperature at 2 m height (T2) and wind speed (WD), which went beyond the benchmark by 25 % and 46 %, respectively (Table S4). The WRF model performance is similar to previous studies (Zhang et al., 2012; Hu et al., 2016) that could provide robust meteorological inputs to the CMAQ model. The observation data of key pollutants obtained from the national air quality monitoring network (https://quotsoft.net/air/, last access: 5 August 2020; more than 1500 sites) were used to validate the CMAQ model performance. The model performance of O3 was within the criteria (US EPA, 2005), with a slight underestimation compared to observations, demonstrating our simulation is suitable for use in O3 study in China (Table S5).
2.2 Health impact estimation
Daily premature mortalities due to O3 from all non-accidental causes, CVD, RD, hypertension, stroke, and COPD are estimated in this study. The O3-related daily mortality is calculated based on Anenberg et al. (2010) and Cohen et al. (2004). In this study, the population data are from all age groups, which may induce higher daily mortality than expected (H. Liu et al., 2018). In this study, the daily premature mortality due to O3 is calculated from Eq. (2) (Anenberg et al., 2010; Cohen et al., 2004):
where ΔM is the daily premature mortality due to O3; y0 is the daily baseline mortality rate, collected from the China Health Statistical Yearbook 2018 (National Health and Family Planning Commission of China, 2018); β is the concentration–response function (CRF), which represents the increase in daily mortality with each 10 µg m−3 increase of MDA8 O3 concentration, cited from Yin et al. (2017); ΔX is the incremental concentration of O3 based on the threshold concentration (35.1 ppb) (Lim et al., 2012; H. Liu et al., 2018); and Pop is the population exposure to O3, obtained from China's Sixth Census data (Fig. S2) (National Bureau of Statistics of China, 2010). The daily y0 and β values for all non-accidental causes, CVD, RD, hypertension, stroke, and COPD are summarized in Table S6.
3.1 Observational O3 in China during the CNDH
MDA8 O3 levels have noticeably risen during the 2018 CNDH based on observations, from 43 ppb (PRE-CNDH) to 55 ppb (CNDH) among selected cities (Fig. 1a and Table S3). The most significant increase of MDA8 O3 (up to 56 %) is observed in South China (Fig. 1b). The PRD region has recorded 49 % of MDA8 O3 increase, and in most PRD cities (such as Shenzhen and Guangzhou), the number of exceeding days is as high as 5–7 d during the 7 d CNDH, which contributed to 50 %–86 % of days exceeding the Chinese national air quality standards (Grade II, ∼ 75 ppb) in the whole of October (Fig. 1c). Other regions exhibit less MDA8 O3 increase, which is 20 %, 16 %, and 3 % for East, North, and West China, respectively (Fig. 1b). Negligible MDA8 O3 increase in West China is consistent with vast rural areas and less anthropogenic impact (J. Wang et al., 2017). This result suggests that changes in anthropogenic emissions have significant impacts on MDA8 O3 during the CNDH in South, East, and North China, similar to a previous observation study (Xu et al., 2017).
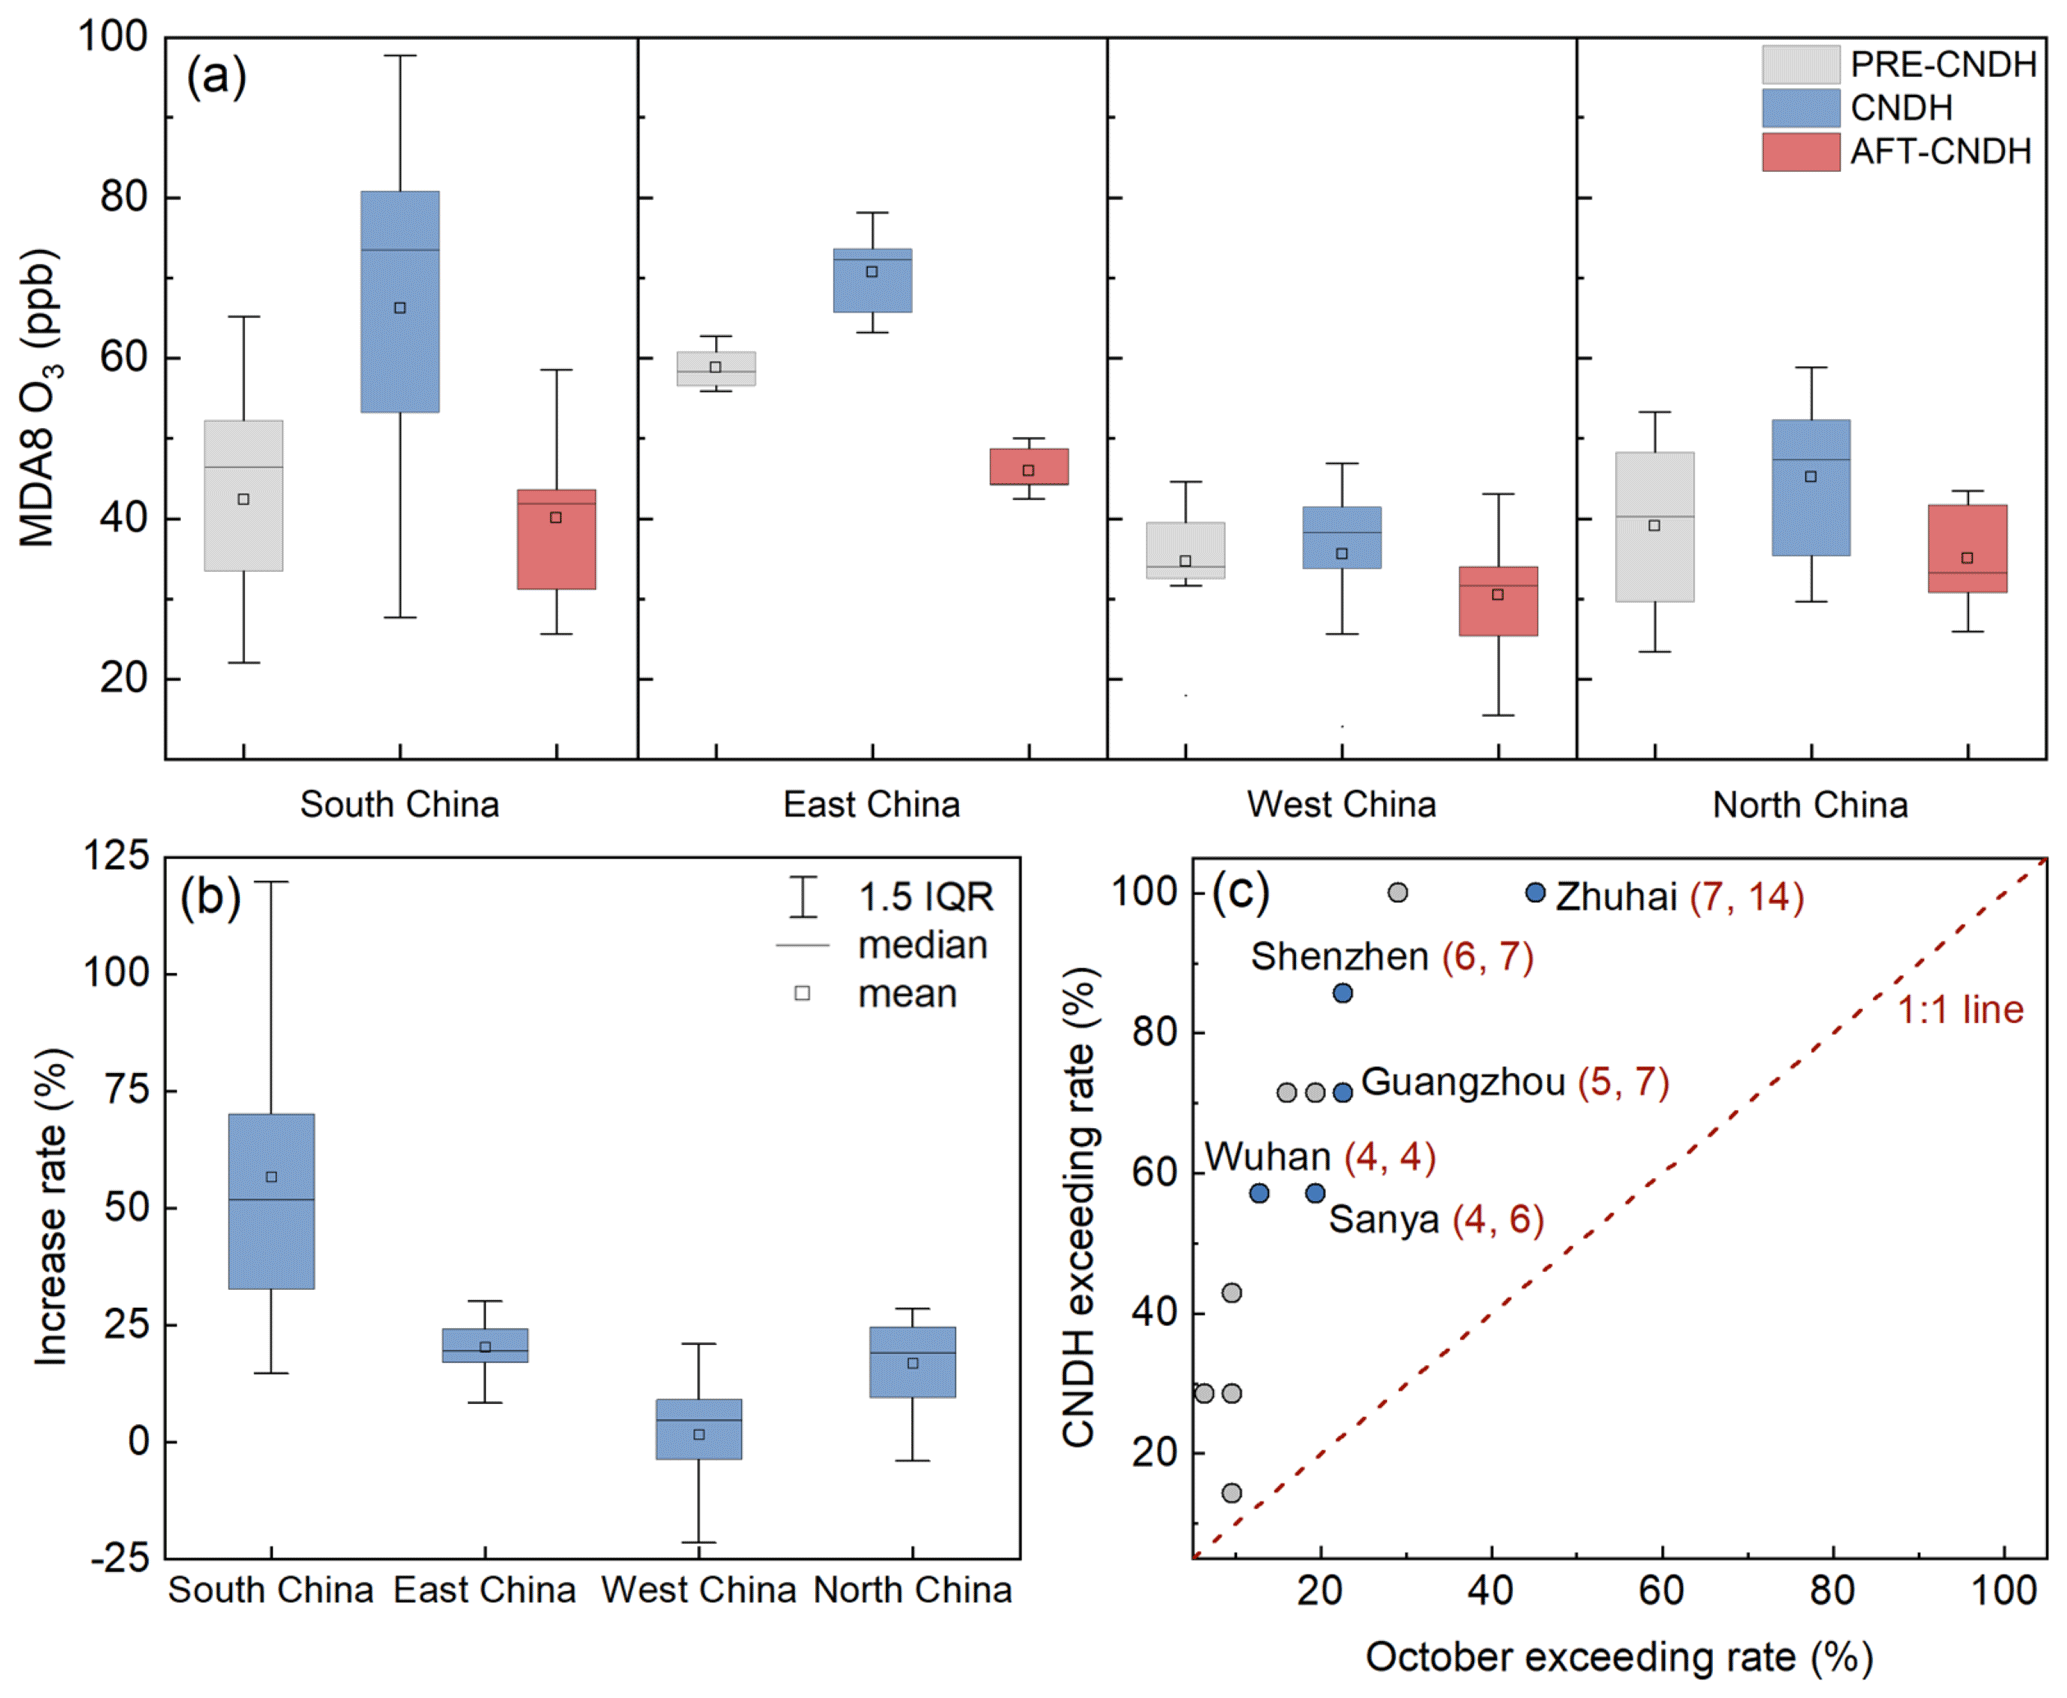
Figure 1(a) The observed average MDA8 O3 in PRE-CNDH, CNDH and AFT-CNDH in South, East, West and North China in 2018. (b) The increase rate of observed MDA8 O3 during the CNDH. (c) The exceeding rate of observed MDA8 O3 in CNDH and October (the exceeding days during the CNDH divided by those during October, i.e., exceeding_CNDH/exceeding_ October). Locations of these regions are shown in Fig. S3. Blue dots refer to the key cities, and grey dots represent other cities. The pairs of values in the parentheses following city names are the exceeding days in CNDH and October, respectively. IQR is the interquartile range.
Nine key cities are then selected for analyzing the causes and impacts of the significant MDA8 O3 rises. Comprehensive criteria were adopted in selection according to (1) acute MDA8 O3 increases (e.g., Changsha and Shenzhen) and (2) important provincial capitals (e.g., Beijing and Shanghai) and famous tourist cities (e.g., Sanya). The selected key cities are representative of the situation of broad regions in China except for West China (Fig. S1), which has an insignificant MDA8 O3 increase (Table S3) and fewer tourist cities. The MDA8 O3 increased by 48±37 % during the 2018 CNDH in these key cities. The highest MDA8 O3 is observed in Zhuhai, reaching 98 ppb on average, with a peak of 107 ppb. The MDA8 O3 in Sanya increases 2-fold compared to PRE-CNDH, which is unexpected because there is less focus on air pollution in Sanya, and it is known for less anthropogenic emissions (Wang et al., 2015). Other key cities show 8 %–70 % increases during the CNDH. The exact causes of substantial O3 increases in these cities are of high interest and are explored below.
3.2 Increased O3 precursor emissions during the CNDH
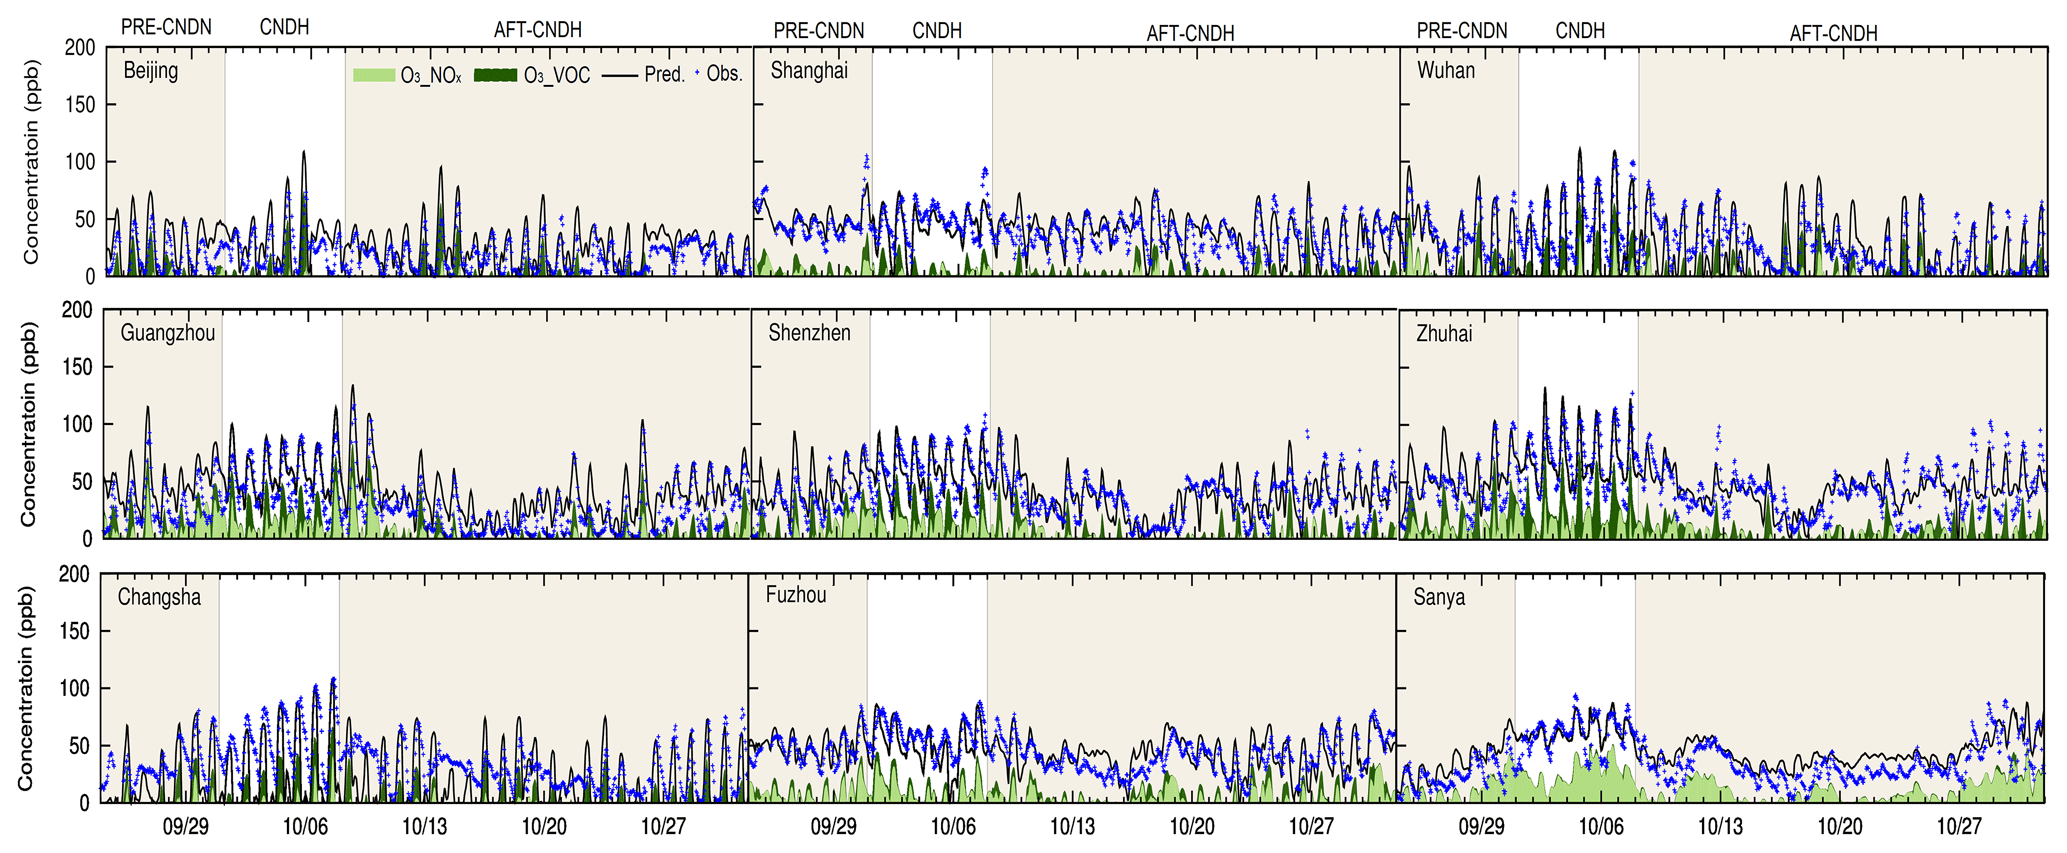
CMAQ is capable of representing the changes in observed MDA8 O3 (Fig. 2). Generally, increasing trends of MDA8 O3 are found in vast areas from PRE-CNDH to CNDH, suggesting the elevated O3 occurs on a regional-scale. In South China, the predicted MDA8 O3 reaches ∼90 ppb, which is approximately 1.2 times that of the Class II standard, with an average increase rate of 30 %. The highest MDA8 O3 drops sharply to 60 ppb in the same regions in AFT-CNDH. High O3_NOx and O3_VOC levels are also found during the CNDH with different spatial distributions (Fig. 2). The rising O3_NOx areas are mainly located in South China, covering Hubei, Hunan, Guangxi, Jiangxi, north Guangdong, and Fujian provinces, with an average increase of ∼5–10 ppb. In contrast, high O3_VOC regions are in developed city clusters such as the NCP, YRD, and PRD regions. In the PRD, peak O3_VOC is over 30 ppb during the CNDH, which is 1.5 times that in PRE-CNDH. Similar to MDA8 O3, decreases in both O3_NOx and O3_VOC are found in AFT-CNDH. For the nine key cities, O3_NOx and O3_VOC are also increased during the CNDH. In Sanya, non-background O3 during the CNDH is 2 times that in PRE-CNDH. The peak of non-background O3 (O3_NOx + O3_VOC) is over 80 ppb in Beijing and Zhuhai, indicating that O3 formation plays an important role during the CNDH (Fig. 3). In megacities such as Beijing, O3_VOC is the major contributor to elevated O3, while O3_NOx becomes significant in tourist cities such as Sanya.
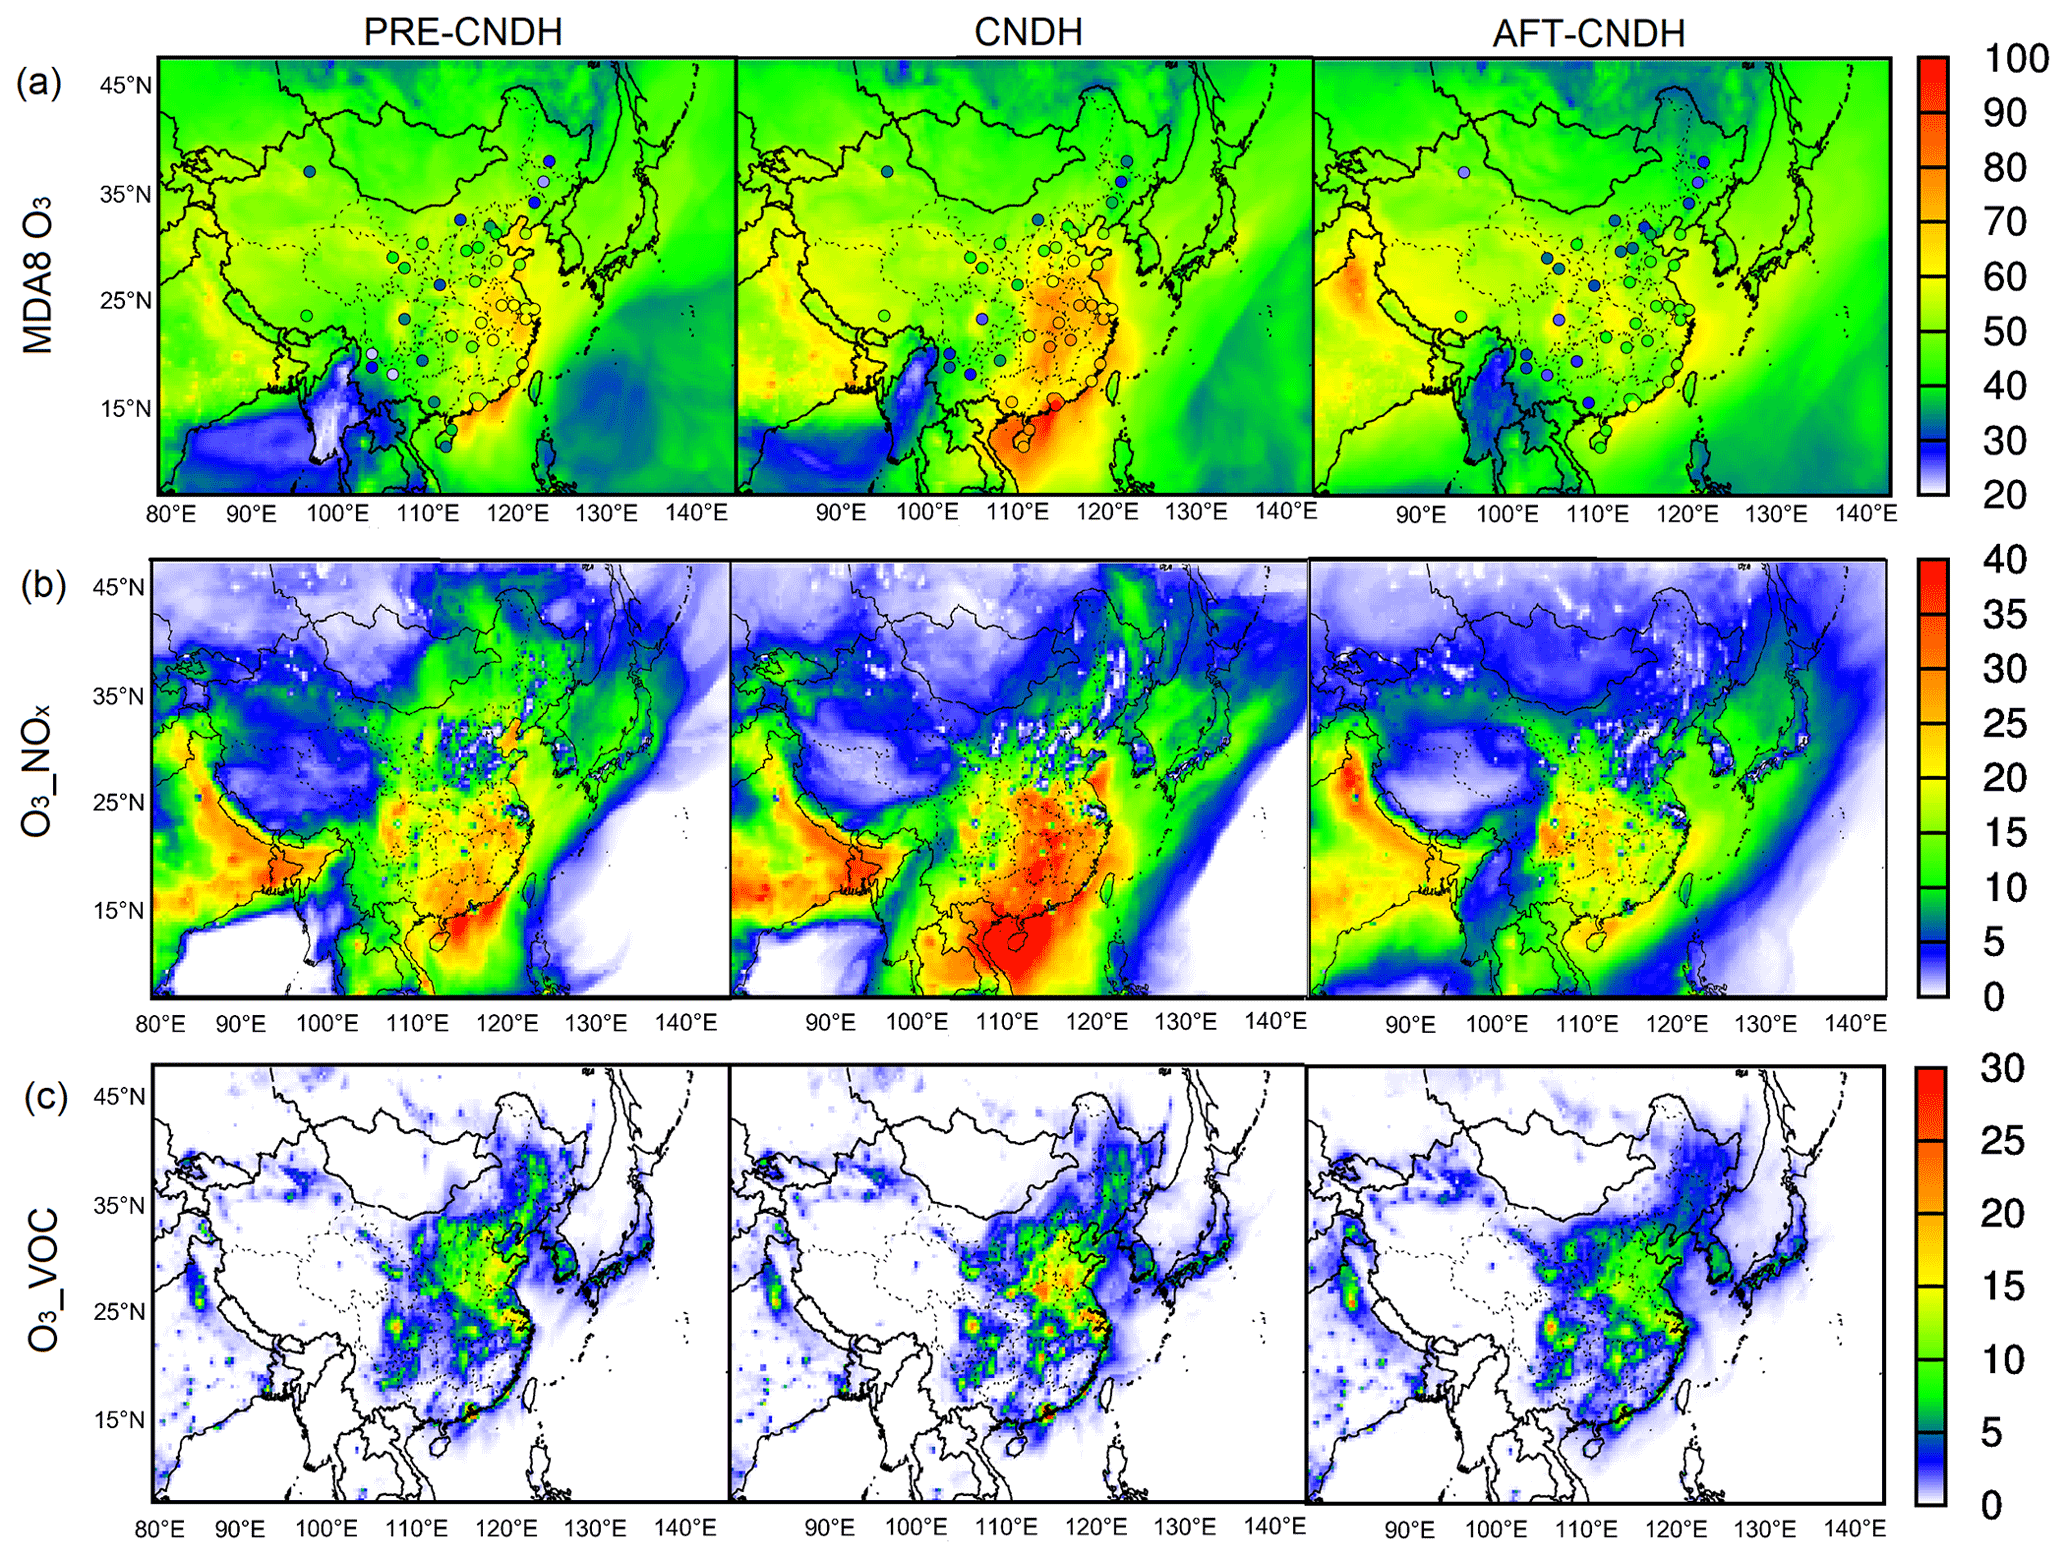
Figure 2(a) Comparison of observed (circle) and predicted MDA8 O3. (b) Spatial distribution of O3_NOx. (c) Spatial distribution of O3_VOC in China in PRE-CNDH, CNDH, and AFT-CNDH, respectively. Units are parts per billion (ppb). O3_NOx and O3_VOC are the O3 attributed to NOx and VOCs, respectively.
From Fig. 4, it is seen that the anthropogenic O3 precursor emissions (NOx and VOCs) increase throughout China. Increasing NOx emissions are observed in South China, especially in Guangxi and Guangdong, with a relative increase of up to 100 % during the CNDH. Considering O3 sensitivity regimes (determined by Eq. 1), no noticeable differences are observed between PRE-CNDH and CNDH (Fig. S4). During CNDH, the VOC-limited regions are mainly in the NCP and YRD, accompanied by high O3_VOC. In South China, O3 formation is under a transition regime in most regions, and NOx-limited areas are in Fujian and parts of Guangdong and Guangxi, where there are rising NOx emissions. This corresponds to an increase in O3 in these regions (Figs. 2 and 4). Simultaneously, higher anthropogenic VOC emissions are also observed during the CNDH in South China, leading to elevated O3 in the transition regime when VOCs and NOx jointly controlled O3 formation. These increasing O3 precursors emissions are mainly from the residential and transportation sectors (Table S1), indicating their important roles in the elevated O3 during the CNDH. In contrast, during AFT-CNDH, more areas develop into a transition regime in South China. The decreases in biogenic VOCs (BVOCs, compared to CNDH) (Fig. 4) due to temperature (Fig. S5) decrease MDA8 O3 for regions in a transition regime during AFT-CNDH. Accordingly, changes in O3 highly depend on its precursor (NOx and VOCs) emissions and the sensitivity regime.
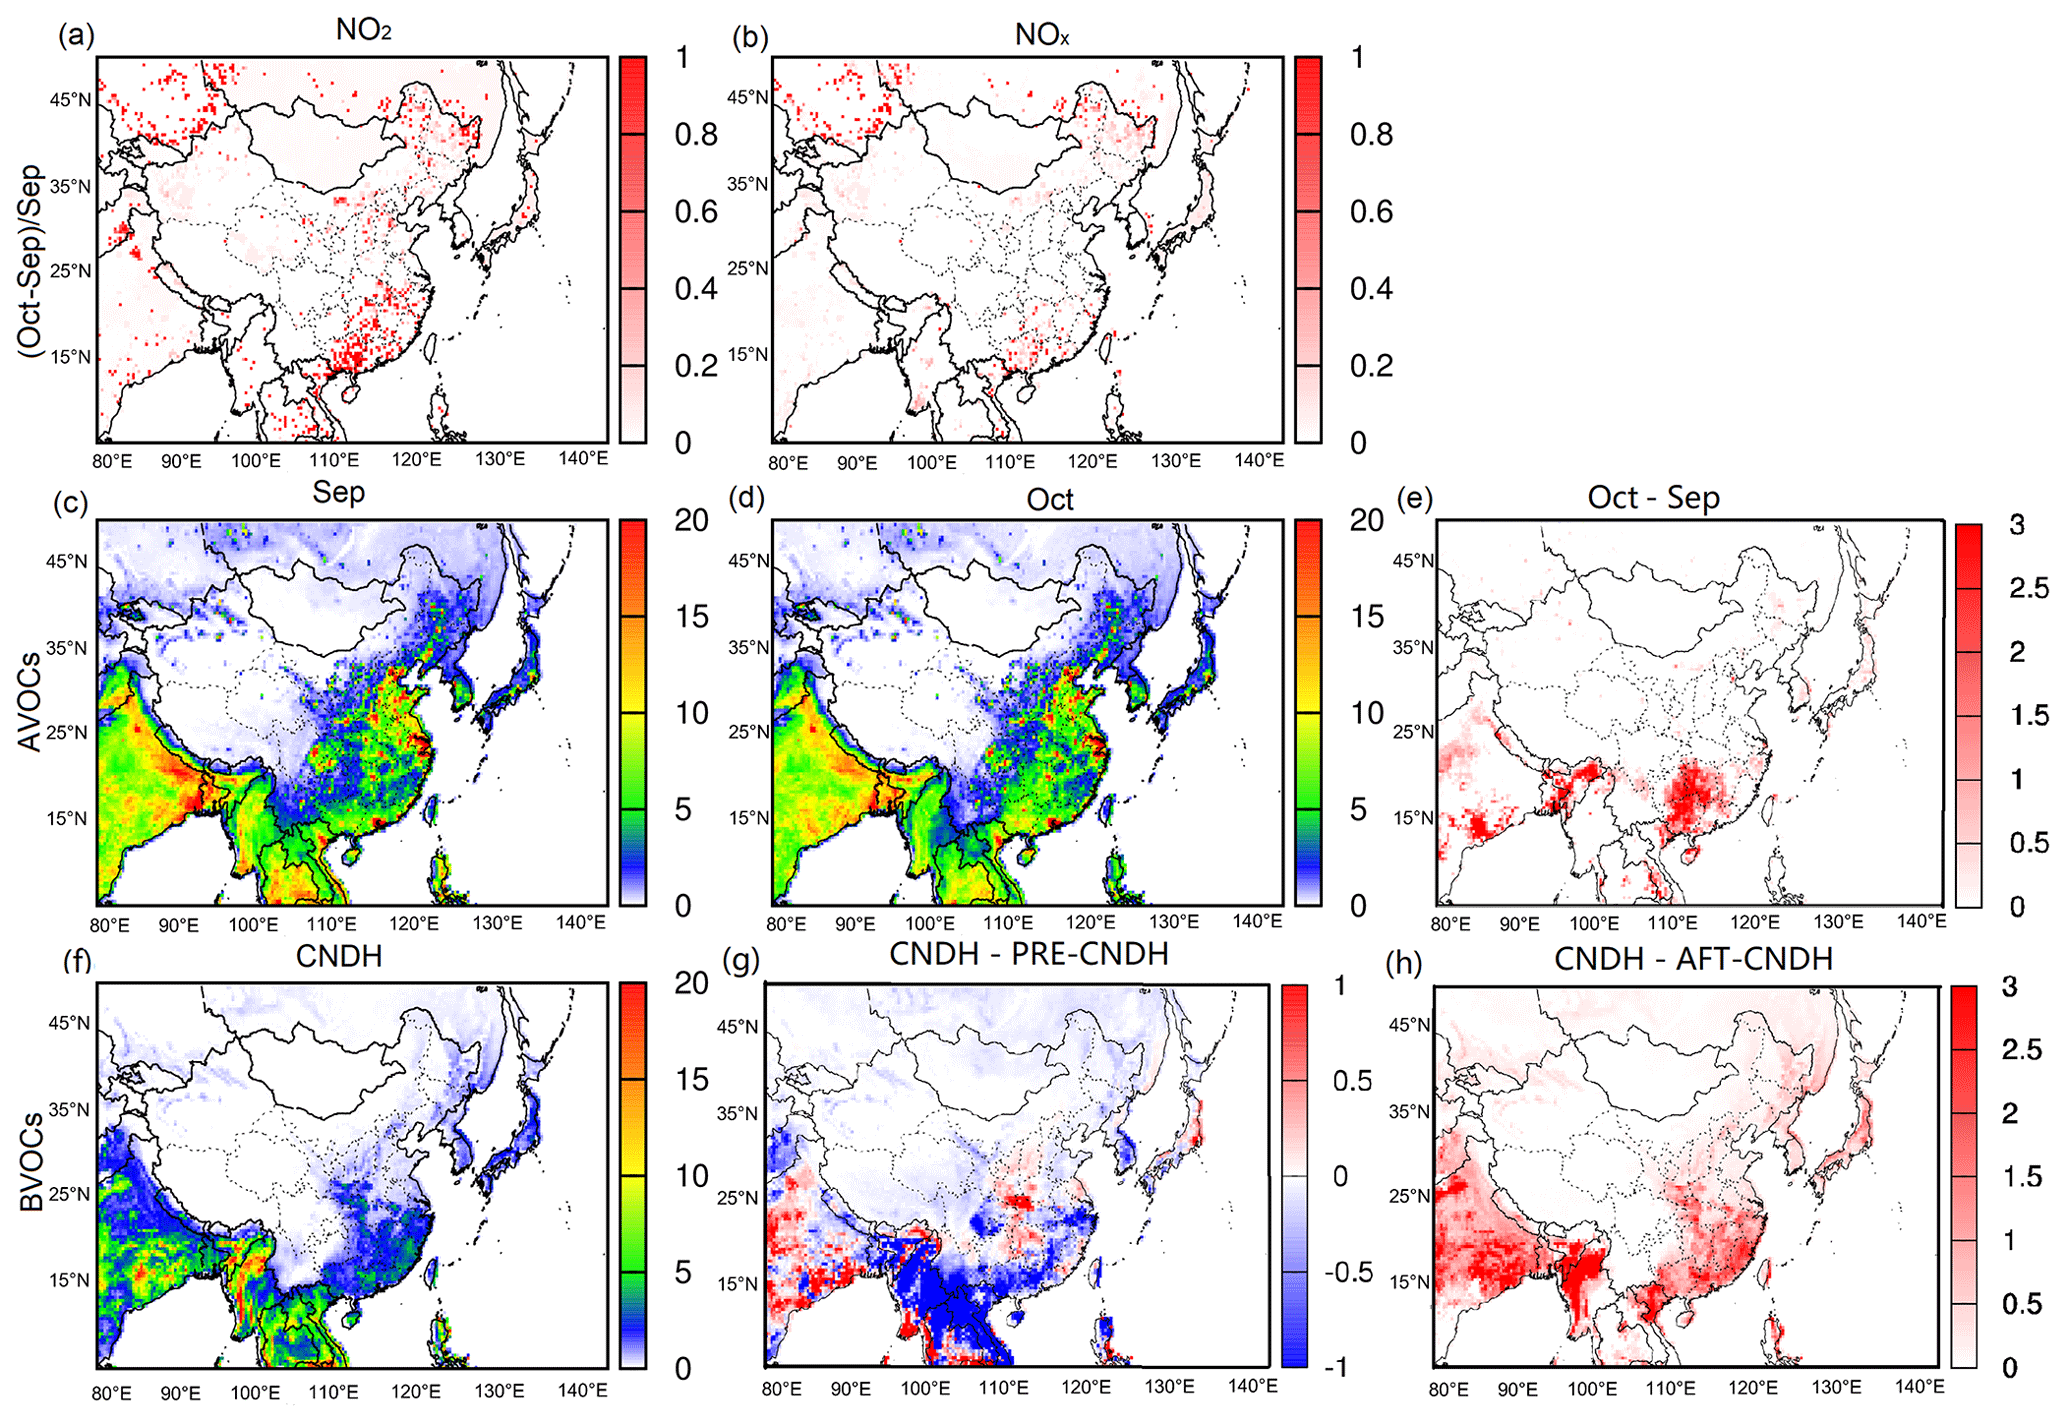
Figure 4Changes of emissions in relative differences ((October–September)/September) of (a) NO2 and (b) NOx. Averaged emissions rates of anthropogenic organic compounds (AVOCs) from the MEIC emission inventory in (c) September and (d) October and their difference (e). Averaged BVOCs emission rates from the MEGAN model in (f) CNDH and their differences: (g) CNDH minus PRD-CNDH and (h) CNDH minus AFT-CNDH. Units are moles per second (moles/s) for (c)–(h).
Transportation increase due to tourism is also a potential source of elevated O3 during holidays (Xu et al., 2017). However, changes in transportation emissions are not considered in this study due to a lack of related statistical data. Residents prefer to travel during the CNDH, and thus more significant impacts may be from mobile sources (Zhao et al., 2019). Traveling by private cars is the most common approach, leading to a significant increase in vehicle activities (Z. Wang et al., 2019). Time-varying coefficients are estimated to describe traffic flow according to a report by AMAP (2018) during the 2018 CNDH (Fig. S6). On average, during CNDH, the traffic flow is 2.2 times that of ordinary weeks. Heavy traffic flow occurs on 1 October (coefficient of 16.3 %) and 5 October (6.1 %) due to intensive departure and return. Hourly variations of traffic flow in CNDH are similar to weekends, having a flatter trend compared to workdays (Y. H. Liu et al., 2018). A real-time vehicle emission inventory should be developed in future to better predict O3 changes during the CNDH.
3.3 Impacts of regional transport during the CNDH
Regional transport is also a significant contributor to enhanced MDA8 O3 during the CNDH. As shown in Fig. S5, the lower temperature is predicted during the CNDH compared to the PRE-CNDH. In PRD, the average temperature drops from 25 to 23 ∘C, leading to a lower O3 level in previous studies (Fu et al., 2015; Bloomer et al., 2009; Pusede et al., 2015). Meanwhile, the increasing wind speed is predicted in the PRD, which is able to facilitate regional transport. The higher O3 production rates that are calculated by the PA process directly in the CMAQ model (increase rate up to ∼ 150 %) are predicted mainly in the urban regions (the NCP, YRD, and PRD) in China (Fig. S7). With north winds (Fig. S5), O3 is transported from the northern regions to downwind southern China to cause aggravated O3. In the nine key cites, enhanced regional transport (HADV, horizontal advection) of O3 in Beijing, Changsha, Fuzhou, Shenzhen, Sanya, and Shanghai is as high as 90 ppb (Fig. S8). The enhanced regional transport and the increasing anthropogenic emissions synergistically lead to the rising O3 during the CNDH, offsetting the impacts from the lower BVOCs emissions (Fig. 4).
A regional-source tracking simulation was conducted in the PRD that predicted significant O3 elevation to qualify the impacts of regional transport. The emissions were classified into seven regional types (Fig. S9): the local PRD (GD), northern part (NOR), southern part (SOU), central part (CEN), western part (WES), southeast part (SWE), and other countries (OTH). The detailed model description can be found in P. Wang et al. (2020). Although the local sector contributes more than 50 % non-background O3 from PRE-CNDH to AFT-CNDH, more significant O3 regional transport is predicted during the late PRE-CNDH and CNDH in the PRD, demonstrating its important role in O3 elevation (Figs. 5 and S10). The SOU sector is the most crucial contributor among all these regional sectors outside Guangdong due to the prevailing north wind.
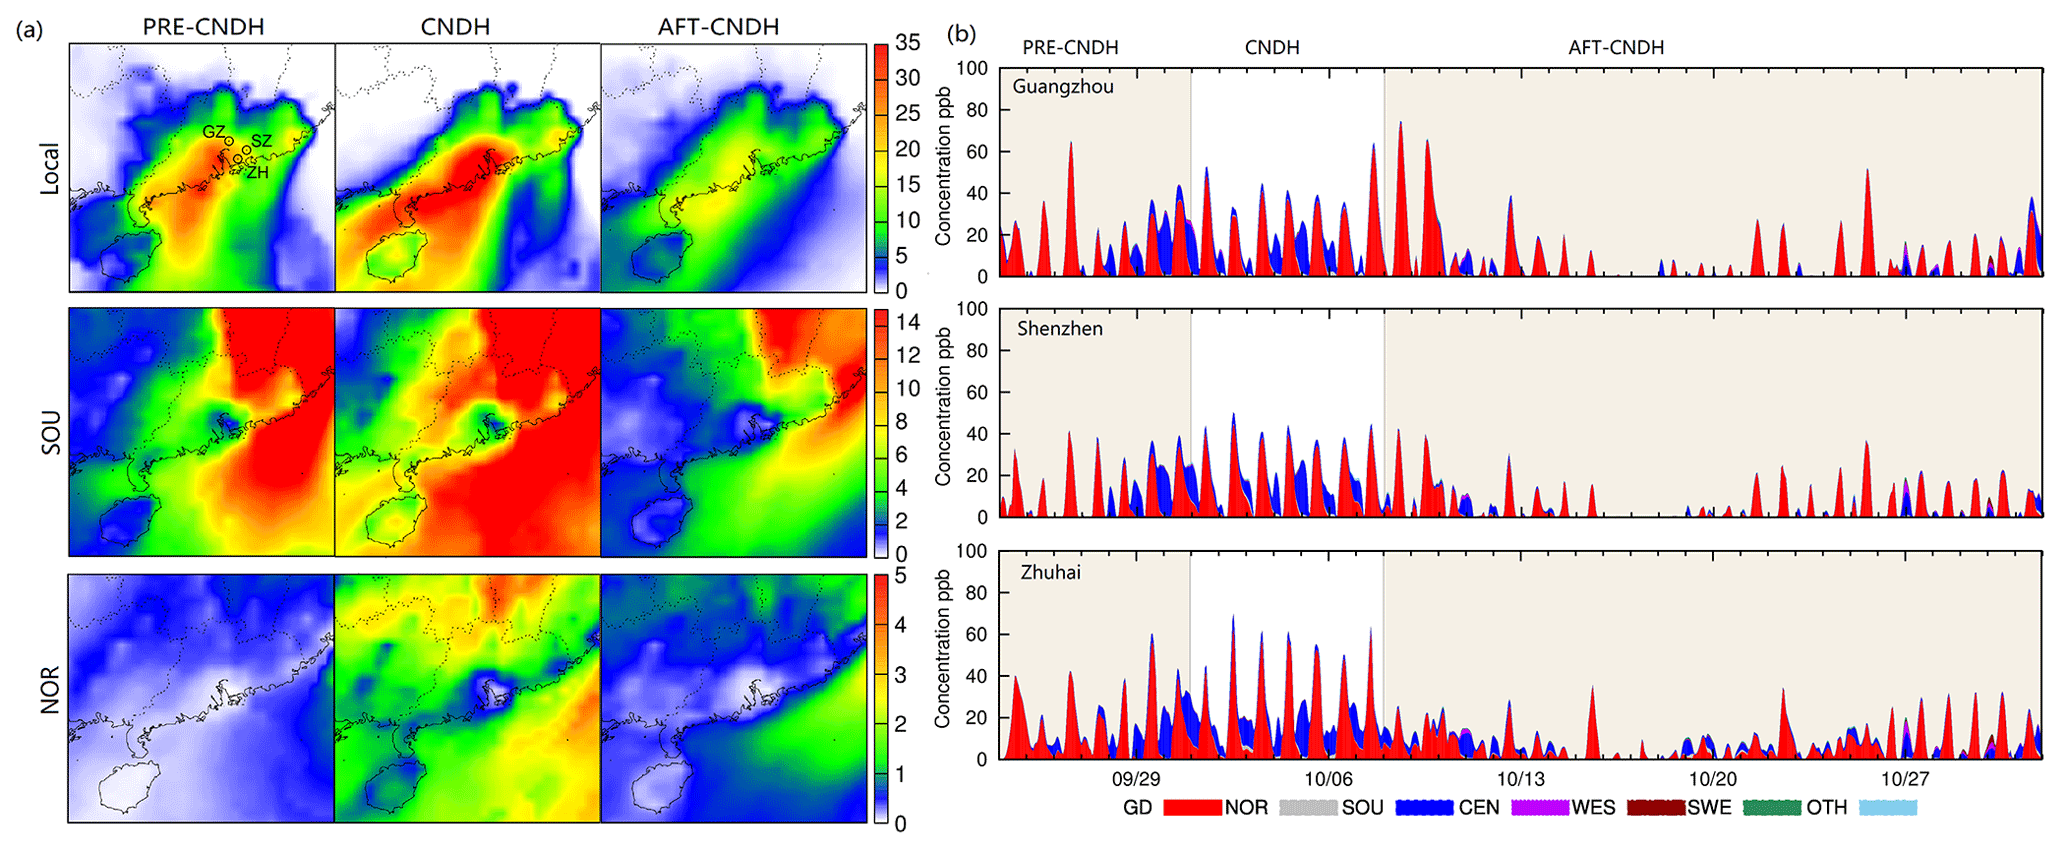
Figure 5(a) Average regional contributions to non-background O3 from the PRD local emissions and emissions in SOU and NOR sectors and (b) regional contributions from all sectors to non-background O3 in the key PRD cities (Guangzhou, Shenzhen, and Zhuhai) during the simulation periods. GZ: Guangzhou, SZ: Shenzhen, and ZH: Zhuhai.
In these key PRD cities (Guangzhou, Shenzhen, and Zhuhai), the contribution of the SOU sector in the non-background O3 is up to ∼ 30 ppb, mainly occurring in the nighttime and early morning (Fig. 5). In the noontime, ∼ 10 %–15 % non-background O3 is from the SOU sector during the CNDH compared to less than 5 % in other periods. The O3_NOx shows more significant regional transport characteristics than the O3_VOC (Figs. S11 and S12). During the late PRE-CNDH and the CNDH, the contribution from regional transport in the O3_NOx is up to 35 ppb. Due to the enhanced regional transport during the CNDH, the O3_NOx could be even transported from the long-distance sector as NOR to the PRD. The peak of O3_NOx due to regional transport is predicted at midnight, which is different from O3_VOC (peak at noontime).
3.4 Aggravated health risk during the CNDH
It is recognized that O3 pollution induces serious health risks from CVD, RD, COPD, hypertension, and stroke (Lelieveld et al., 2013; Yin et al., 2017; Huang et al., 2018; Krewski et al., 2009). Elevated MDA8 O3 during the CNDH leads to significantly higher health risks (Fig. 6). The estimated total national daily mortality (from all non-accidental causes) due to MDA8 O3 is 2629 during the CNDH, 33 % higher than that (1982) in PRE-CNDH. All above O3-related diseases have noticeable increases in national daily mortality during the CNDH. The highest health risk among these diseases is from CVD (674 during the CNDH), which is consistent with Yin et al. (2017), followed by RD (219), COPD (213), hypertension (189), and stroke (22). The COPD mortality due to O3 in this study is comparable with 152–220 in H. Liu et al. (2018). In AFT-CNDH, total daily mortality (drops to 1653) and mortality from all diseases decrease due to substantial O3 reduction. Also, a significant increase of the total daily mortality is shown throughout China during the CNDH, especially in densely populated regions (e.g., the YRD and PRD) (Fig. S11), which is consistent with previous studies (Chen et al., 2018; H. Liu et al., 2018; Y. Wang et al., 2020).
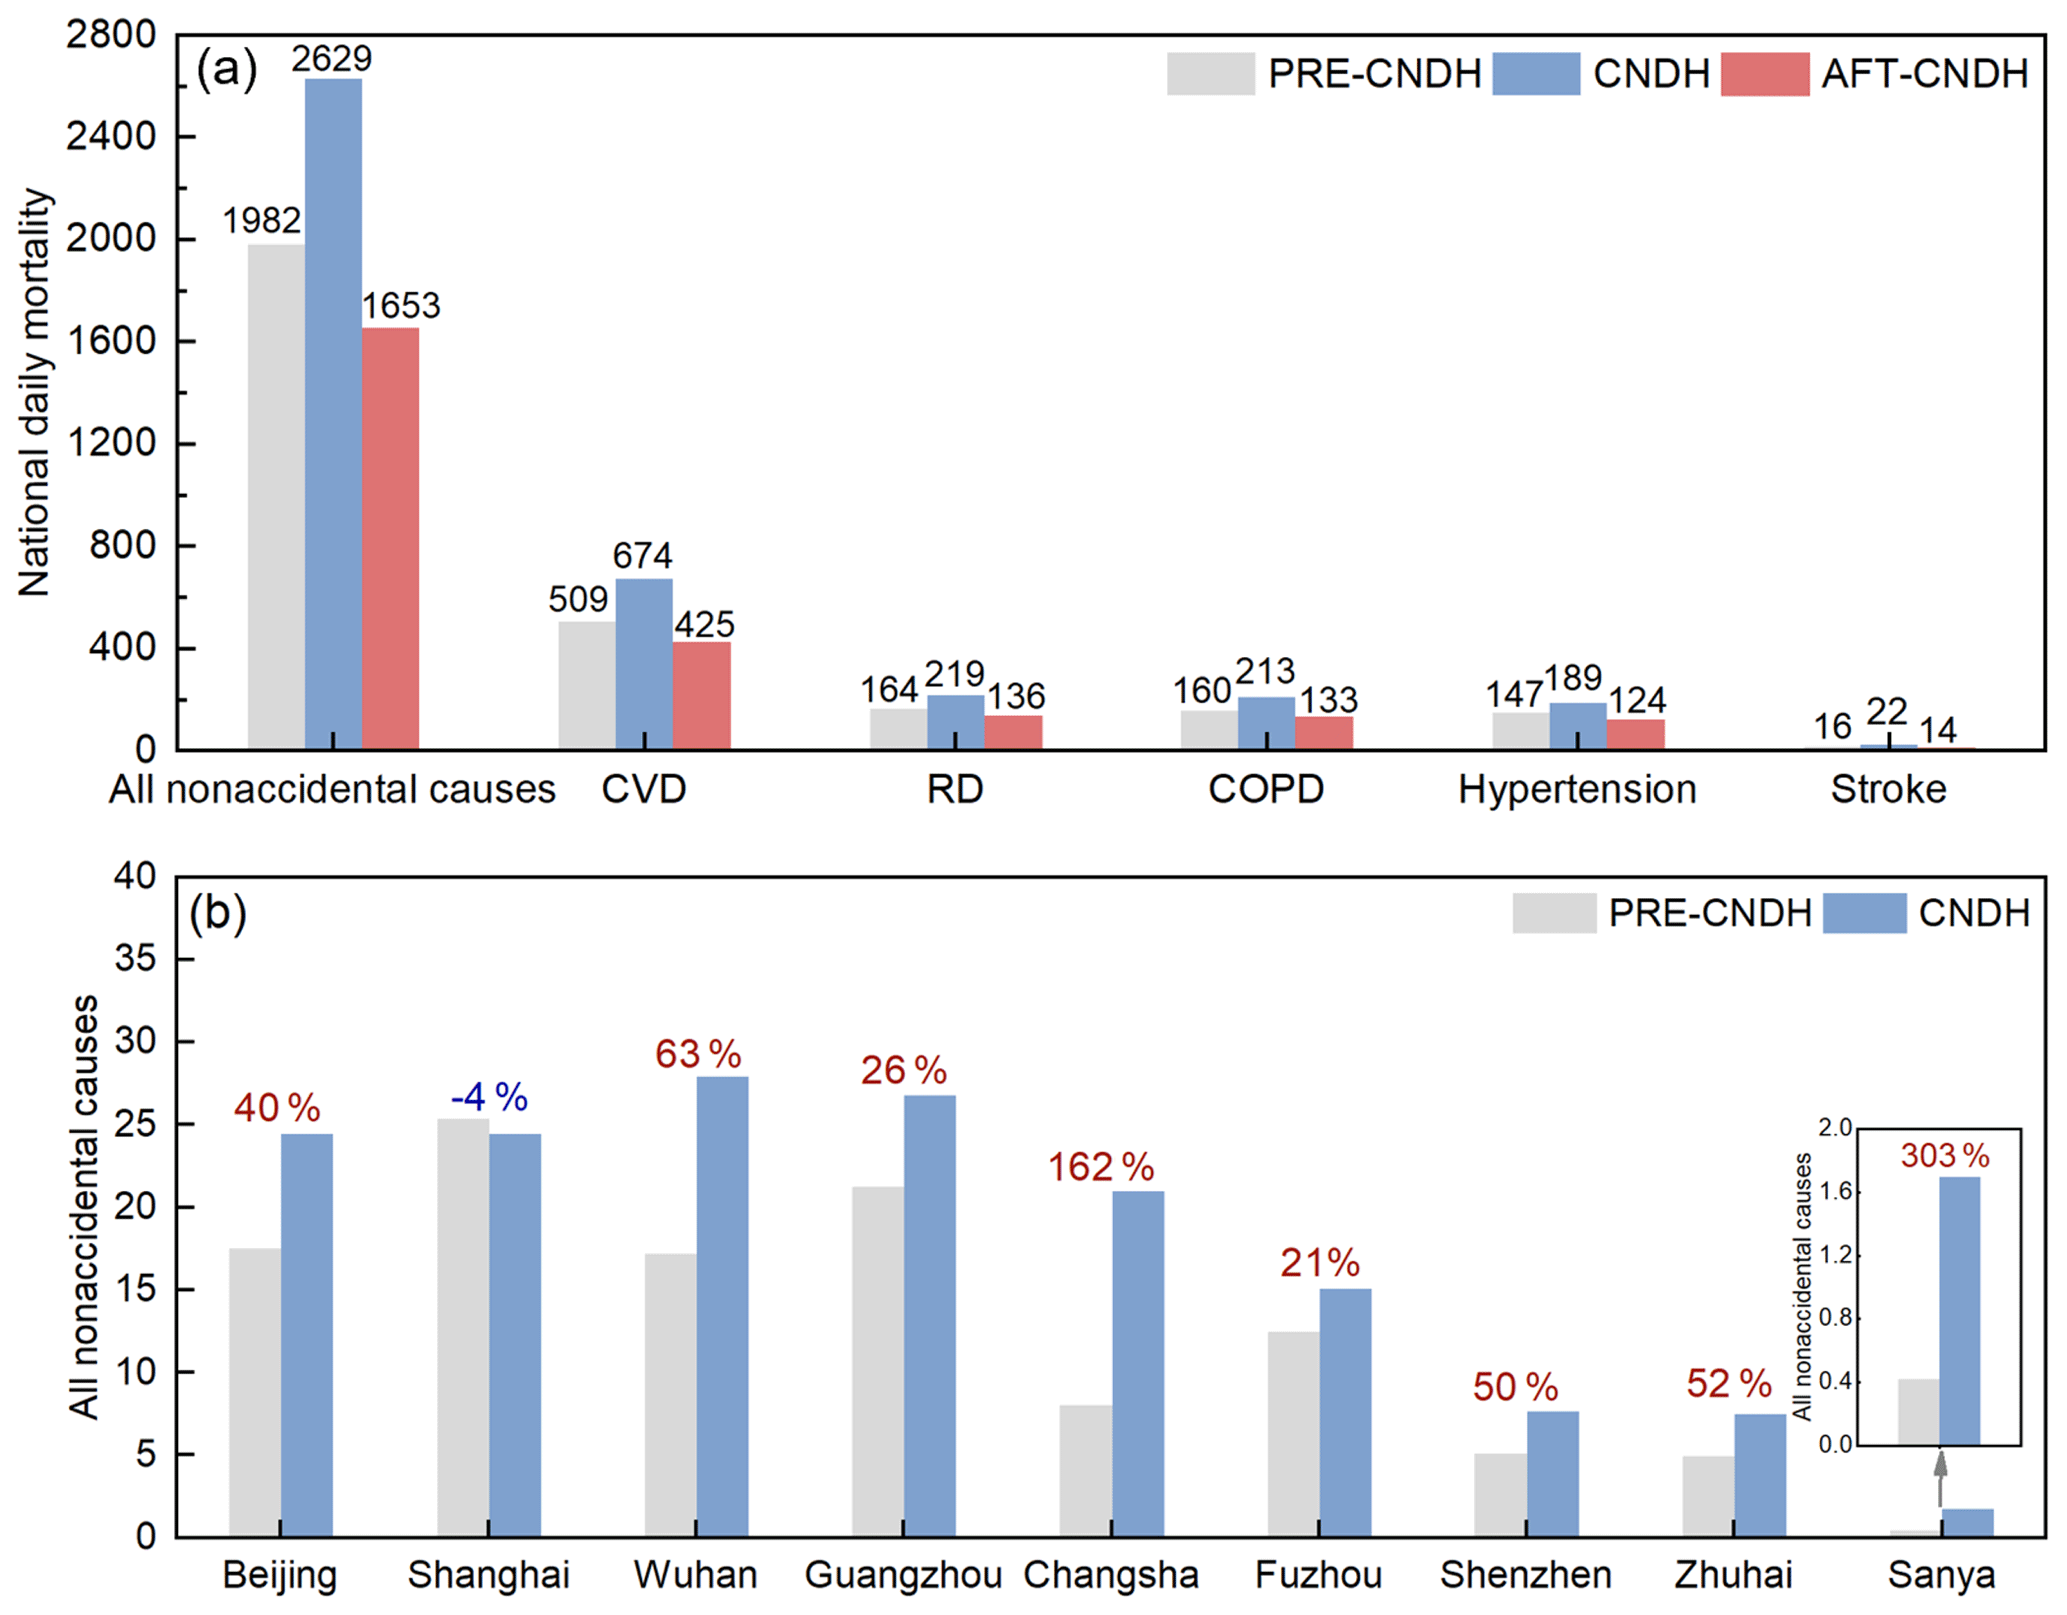
Figure 6(a) National daily mortality from all non-accidental causes, CVD, RD, COPD, hypertension, and stroke attributed to O3 in PRE-CNDH, CNDH, and AFT-CNDH and (b) daily mortality from all non-accidental causes due to O3 in the nine key cities. Red/blue values above the bars are the increase/decrease rates of daily mortality from PRE-CNDH to CNDH. CVD: cardiovascular disease; RD: respiratory disease; COPD: chronic obstructive pulmonary disease.
Except for Shanghai (in which O3 is slightly underestimated), the total daily mortality rates in the other eight key cities increased from PRE-CNDH to CNDH. Four megacities (Beijing, Shanghai, Wuhan, and Guangzhou) with enormous populations have the highest daily deaths (24–28) during the CNDH, 50 % larger than the mean level (16) in the other 272 Chinese cities (Chen et al., 2018; Yin et al., 2017). It is worth noting that a higher increase rate of daily mortality is found in tourist cities (Sanya and Changsha). In Sanya, daily deaths even increase by as much as 303 % from PRE-CNDH to CNDH. An even higher increase in health risk may occur in Sanya if a sharp increase in tourist flow during the CNDH is considered.
In this study, we find a significant increase in O3 during the CNDH throughout China, especially in the southern parts, which is attributed to the changes in precursor emissions, sensitivity regime, and enhanced regional transport. Moreover, elevated O3 also causes severe impacts on human health, with total daily mortality from all non-accidental causes increasing from 151 to 201 in China. More comprehensive studies should be conducted to understand better the long-term holiday impacts (such as during the CNDH) of O3 in the future, and here we suggest the following:
-
More strident emission control policies should be implemented in China before and during the CNDH to inhibit the elevated O3. And more localized control policies with the consideration of the O3 sensitivity regimes should be applied.
-
In order to reduce the health risk from the elevated O3, it is suggested to avoid traveling in rush hours, especially at midday during the CNDH.
-
Reducing the activities of private gasoline vehicles is effective in mitigating excess emissions during the CNDH. It is encouraged to travel by electric car or public transportation such as bus, subway, and train.
The datasets used in the study can be accessed from websites listed in the references or by contacting the corresponding author (zhang_yl86@gig.ac.cn). All data are available at Zenodo https://zenodo.org/record/5064149#.YOVZUEyxVjX (Wang, 2021).
The supplement related to this article is available online at: https://doi.org/10.5194/acp-21-10347-2021-supplement.
PW and YZ designed the research. PW, JS, MX, SS, and HZ analyzed the data. PW performed the air quality model. PW and YZ wrote the manuscript with comments from all co-authors.
The authors declare that they have no conflict of interest.
Publisher’s note: Copernicus Publications remains neutral with regard to jurisdictional claims in published maps and institutional affiliations.
This work was supported by the National Natural Science Foundation of China (42022023 and 41961144029), the National Key Research and Development Program (2017YFC02122802), the Chinese Academy of Sciences (XDA23020301 and QYZDJ-SSW-DQC032/XDPB1901), the Hong Kong Research Grants Council (T24-504/17-N/A-PolyU502/16), the Youth Innovation Promotion Association, CAS (2017406), and the Guangdong Foundation for Program of Science and Technology Research (2020B1212060053).
This research has been supported by the National Natural Science Foundation of China (42022023 and 41961144029), the National Key Research and Development Program (2017YFC02122802), the Chinese Academy of Sciences (XDA23020301 and QYZDJ-SSW-DQC032/XDPB1901), the Hong Kong Research Grants Council (T24-504/17-N/A-PolyU502/16), the Youth Innovation Promotion Association, CAS (2017406), and the Guangdong Foundation for Program of Science and Technology Research (2020B1212060053).
This paper was edited by John Orlando and reviewed by Maryam Abdi-Oskouei and two anonymous referees.
AMAP: Forecast report on travel index during Mid-Autumn Festival and National Day in 2018, https://report.amap.com/m/dist/#/reports (last access: 1 July 2021), 2018.
Anenberg, S. C., Horowitz, L. W., Tong, D. Q., and West, J. J.: An Estimate of the Global Burden of Anthropogenic Ozone and Fine Particulate Matter on Premature Human Mortality Using Atmospheric Modeling, Environ. Health Persp., 118, 1189–1195, 2010.
Bloomer, B. J., Stehr, J. W., Piety, C. A., Salawitch, R. J., and Dickerson, R. R.: Observed relationships of ozone air pollution with temperature and emissions, Geophys. Res. Lett., 36, L09803, https://doi.org/10.1029/2009GL037308, 2009.
Brauer, M., Freedman, G., Frostad, J., Van Donkelaar, A., Martin, R. V., Dentener, F., Van Dingenen, R., Estep, K., Amini, H., and Apte, J. S.: Ambient Air Pollution Exposure Estimation for the Global Burden of Disease 2013, Environ. Sci. Technol., 50, 79–88, 2016.
Chen, K., Fiore, A. M., Chen, R., Jiang, L., Jones, B., Schneider, A., Peters, A., Bi, J., Kan, H., and Kinney, P. L.: Future ozone-related acute excess mortality under climate and population change scenarios in China: A modeling study, PLOS Med., 15, e1002598, https://doi.org/10.1371/journal.pmed.1002598, 2018.
Chen, P., Tan, P., Chou, C. C. K., Lin, Y., Chen, W., and Shiu, C.: Impacts of holiday characteristics and number of vacation days on “holiday effect” in Taipei: Implications on ozone control strategies, Atmos. Environ., 202, 357–369, 2019.
Cohan, D. S., Hakami, A., Hu, Y., and Russell, A. G.: Nonlinear response of ozone to emissions: source apportionment and sensitivity analysis, Environ. Sci. Technol., 39, 6739–6748, 2005.
Cohen, A. J., Anderson, H. R., Ostro, B., Pandey, K. D., Krzyzanowski, M., Künzli, N., Gutschmidt, K., Pope, A., Romieu, I., Samet, J. M., and Smith, K.: Urban air pollution, in: Comparative quantification of health risks, Global and regional burden of disease attributable to selected major risk factors, Volume 1, World Health Organization, Geneva, 2004.
Emery, C., Tai, E., and Yarwood, G.: Enhanced meteorological modeling and performance evaluation for two Texas ozone episodes, Prepared for the Texas natural resource conservation commission, ENVIRON International Corporation, 2001.
Fang, X., Park, S., Saito, T., Tunnicliffe, R., Ganesan, A. L., Rigby, M., Li, S., Yokouchi, Y., Fraser, P. J., and Harth, C. M.: Rapid increase in ozone-depleting chloroform emissions from China, Nat. Geosci., 12, 89–93, 2019.
Fu, T.-M., Zheng, Y., Paulot, F., Mao, J., and Yantosca, R. M.: Positive but variable sensitivity of August surface ozone to large-scale warming in the southeast United States, Nat. Clim. Change, 5, 454–458, 2015.
Gao, J., Zhu, B., Xiao, H., Kang, H., Hou, X., and Shao, P.: A case study of surface ozone source apportionment during a high concentration episode, under frequent shifting wind conditions over the Yangtze River Delta, China, Sci. Total Environ., 544, 853–863, https://doi.org/10.1016/j.scitotenv.2015.12.039, 2016.
Gipson, G. L.: Process analysis. In science algorithms of the EPA models-3 Community Multiscale Air Quality (CMAQ) Modeling System, chap. 16, EPA/600/R-99/030, available at: https://www.cmascenter.org/cmaq/science_documentation/pdf/ch16.pdf (last access: 5 August 2020), 1999.
Guenther, A. B., Jiang, X., Heald, C. L., Sakulyanontvittaya, T., Duhl, T., Emmons, L. K., and Wang, X.: The Model of Emissions of Gases and Aerosols from Nature version 2.1 (MEGAN2.1): an extended and updated framework for modeling biogenic emissions, Geosci. Model Dev., 5, 1471–1492, https://doi.org/10.5194/gmd-5-1471-2012, 2012.
Hu, J., Chen, J., Ying, Q., and Zhang, H.: One-year simulation of ozone and particulate matter in China using WRF/CMAQ modeling system, Atmos. Chem. Phys., 16, 10333–10350, https://doi.org/10.5194/acp-16-10333-2016, 2016.
Huang, J., Pan, X., Guo, X., and Li, G.: Health impact of China's Air Pollution Prevention and Control Action Plan: an analysis of national air quality monitoring and mortality data, The Lancet Planetary Health, 2, E313–E323, https://doi.org/10.1016/S2542-5196(18)30141-4, 2018.
Krewski, D., Jerrett, M., Burnett, R. T., Ma, R., Hughes, E., Shi, Y., Turner, M. C., Pope, C. A., 3rd, Thurston, G., Calle, E. E., Thun, M. J., Beckerman, B., DeLuca, P., Finkelstein, N., Ito, K., Moore, D. K., Newbold, K. B., Ramsay, T., Ross, Z., Shin, H., and Tempalski, B.: Extended follow-up and spatial analysis of the American Cancer Society study linking particulate air pollution and mortality, Res. Rep. Health Eff. Inst., 5–114, 115–136, 2009.
Lelieveld, J., Barlas, C., Giannadaki, D., and Pozzer, A.: Model calculated global, regional and megacity premature mortality due to air pollution, Atmos. Chem. Phys., 13, 7023–7037, https://doi.org/10.5194/acp-13-7023-2013, 2013.
Levy, I.: A national day with near zero emissions and its effect on primary and secondary pollutants, Atmos. Environ., 77, 202–212, https://doi.org/10.1016/j.atmosenv.2013.05.005, 2013.
Li, K., Jacob, D. J., Liao, H., Shen, L., Zhang, Q., and Bates, K. H.: Anthropogenic drivers of 2013–2017 trends in summer surface ozone in China, P. Natl. Acad. Sci. USA, 116, 422-427, 10.1073/pnas.1812168116, 2019.
Li, M., Zhang, Q., Kurokawa, J.-I., Woo, J.-H., He, K., Lu, Z., Ohara, T., Song, Y., Streets, D. G., Carmichael, G. R., Cheng, Y., Hong, C., Huo, H., Jiang, X., Kang, S., Liu, F., Su, H., and Zheng, B.: MIX: a mosaic Asian anthropogenic emission inventory under the international collaboration framework of the MICS-Asia and HTAP, Atmos. Chem. Phys., 17, 935–963, https://doi.org/10.5194/acp-17-935-2017, 2017.
Li, T., Yan, M., Ma, W., Ban, J., Liu, T., Lin, H., and Liu, Z.: Short-term effects of multiple ozone metrics on daily mortality in a megacity of China, Environ. Sci. Pollut. Res., 22, 8738–8746, 2015.
Li, Y., Lau, A. K. H., Fung, J. C. H., Zheng, J., Zhong, L., and Louie, P. K. K.: Ozone source apportionment (OSAT) to differentiate local regional and super-regional source contributions in the Pearl River Delta region, China, J. Geophys. Res., 117, D15305, https://doi.org/10.1029/2011JD017340, 2012a.
Li, Y., Lau, A. K. H., Fung, J. C. H., Zheng, J. Y., Zhong, L. J., and Louie, P. K. K.: Ozone source apportionment (OSAT) to differentiate local regional and super-regional source contributions in the Pearl River Delta region, China, J. Geophys. Res.-Atmos., 117, D15305, https://doi.org/10.1029/2011JD017340, 2012b.
Lim, S. S., Vos, T., Flaxman, A. D., Danaei, G., Shibuya, K., Adairrohani, H., Almazroa, M. A., Amann, M., Anderson, H. R., and Andrews, K. G.: A comparative risk assessment of burden of disease and injury attributable to 67 risk factors and risk factor clusters in 21 regions, 1990–2010: a systematic analysis for the Global Burden of Disease Study 2010, Lancet, 380, 2224–2260, 2012.
Liu, H., Liu, S., Xue, B., Lv, Z., Meng, Z., Yang, X., Xue, T., Yu, Q., and He, K.: Ground-level ozone pollution and its health impacts in China, Atmos. Environ., 173, 223–230, https://doi.org/10.1016/j.atmosenv.2017.11.014, 2018.
Liu, Y. H., Ma, J. L., Li, L., Lin, X. F., Xu, W. J., and Ding, H.: A high temporal-spatial vehicle emission inventory based on detailed hourly traffic data in a medium-sized city of China, Environ. Pollut., 236, 324–333, https://doi.org/10.1016/j.envpol.2018.01.068, 2018.
Lu, X., Hong, J., Zhang, L., Cooper, O. R., Schultz, M. G., Xu, X., Wang, T., Gao, M., Zhao, Y., and Zhang, Y.: Severe Surface Ozone Pollution in China: A Global Perspective, Environ. Sci. Technol. Let., 5, 487–494, https://doi.org/10.1021/acs.estlett.8b00366, 2018.
National Health and Family Planning Commission of China: China health statistics yearbook, available at: https://www.yearbookchina.com/navibooklist-n3018112802-1.html (last access: 5 August 2020), 2018.
National Bureau of Statistics of China: Tabulation on the 2010 Population Census of the People's Republic of China, available at: http://www.stats.gov.cn/tjsj/pcsj/rkpc/6rp/indexch.htm (last access: 5 August 2020), 2010.
Pudasainee, D., Sapkota, B., Bhatnagar, A., Kim, S., and Seo, Y.: Influence of weekdays, weekends and bandhas on surface ozone in Kathmandu valley, Atmos. Res., 95, 150–156, 2010.
Pusede, S. E., Steiner, A. L., and Cohen, R. C.: Temperature and recent trends in the chemistry of continental surface ozone, Chem. Rev., 115, 3898–3918, 2015.
Sillman, S.: The use of NOy , H2O2, and HNO3 as indicators for ozone-NOx-hydrocarbon sensitivity in urban locations, J. Geophys. Res.-Atmos., 100, 14175–14188, https://doi.org/10.1029/94jd02953, 1995.
Sillman, S. and He, D.: Some theoretical results concerning O3-NOx-VOC chemistry and NOx-VOC indicators, J. Geophys. Res., 107, 4659, https://doi.org/10.1029/2001JD001123, 2002.
Streets, D. G., Bond, T. C., Carmichael, G. R., Fernandes, S. D., Fu, Q., He, D., Klimont, Z., Nelson, S. M., Tsai, N. Y., Wang, M. Q., Woo, J. H., and Yarber, K. F.: An inventory of gaseous and primary aerosol emissions in Asia in the year 2000, J. Geophys. Res.-Atmos., 108, 8809, https://doi.org/10.1029/2002JD003093, 2003.
Tan, P., Chou, C., Liang, J., Chou, C. C. K., and Shiu, C.: Air pollution ”holiday effect” resulting from the Chinese New Year, Atmos. Environ., 43, 2114–2124, 2009.
Tan, P.-H., Chou, C., and Chou, C. C. K.: Impact of urbanization on the air pollution “holiday effect” in Taiwan, Atmos. Environ., 70, 361–375, https://doi.org/10.1016/j.atmosenv.2013.01.008, 2013.
US EPA: Guidance on the Use of Models and Other Analyses in Attainment Demonstrations for the 8-hour Ozone NAAQS, EPA-454/R-05-002, available at: https://nepis.epa.gov/Exe/ZyPDF.cgi/P1006FPU.PDF?Dockey=P1006FPU.PDF (last access: 5 August 2020), 2005.
Wang, J., Ho, S. S. H., Cao, J., Huang, R., Zhou, J., Zhao, Y., Xu, H., Liu, S., Wang, G., Shen, Z., and Han, Y.: Characteristics and major sources of carbonaceous aerosols in PM2.5 from Sanya, China, Sci. Total Environ., 530–531, 110–119, https://doi.org/10.1016/j.scitotenv.2015.05.005, 2015.
Wang, J., Zhao, B., Wang, S., Yang, F., Xing, J., Morawska, L., Ding, A., Kulmala, M., Kerminen, V.-M., Kujansuu, J., Wang, Z., Ding, D., Zhang, X., Wang, H., Tian, M., Petäjä, T., Jiang, J., and Hao, J.: Particulate matter pollution over China and the effects of control policies, Sci. Total Environ., 584–585, 426–447, https://doi.org/10.1016/j.scitotenv.2017.01.027, 2017.
Wang, P., Chen, Y., Hu, J., Zhang, H., and Ying, Q.: Attribution of Tropospheric Ozone to NOx and VOC Emissions: Considering Ozone Formation in the Transition Regime, Environ. Sci. Technol., 53, 1404–1412, https://doi.org/10.1021/acs.est.8b05981, 2019a.
Wang, P., Chen, Y., Hu, J., Zhang, H., and Ying, Q.: Source apportionment of summertime ozone in China using a source-oriented chemical transport model, Atmos. Environ., 211, 79–90, https://doi.org/10.1016/j.atmosenv.2019.05.006, 2019b.
Wang, P., Wang, T., and Ying, Q.: Regional source apportionment of summertime ozone and its precursors in the megacities of Beijing and Shanghai using a source-oriented chemical transport model, Atmos. Environ., 224, 117337, https://doi.org/10.1016/j.atmosenv.2020.117337, 2020.
Wang, P.: Unexpected enhancement of ozone exposure and health risks duringNational Day in China. http://doi.org/10.5194/acp-2020-1302, Zenodo, https://zenodo.org/record/5064149#.YOVZUEyxVjX, 2021.
Wang, T., Xue, L., Brimblecombe, P., Lam, Y. F., Li, L., and Zhang, L.: Ozone pollution in China: A review of concentrations, meteorological influences, chemical precursors, and effects, Sci. Total Environ., 575, 1582–1596, https://doi.org/10.1016/j.scitotenv.2016.10.081, 2017.
Wang, Y., Wild, O., Chen, X., Wu, Q., Gao, M., Chen, H., Qi, Y., and Wang, Z.: Health impacts of long-term ozone exposure in China over 2013–2017, Environ. Int., 144, 106030, https://doi.org/10.1016/j.envint.2020.106030, 2020.
Wang, Z., Chen, Y., Su, J., Guo, Y., Zhao, Y., Tang, W., Zeng, C., and Chen, J.: Measurement and Prediction of Regional Traffic Volume in Holidays, 2019 IEEE Intelligent Transportation Systems Conference, ITSC 2019, 486–491, 2019.
Wiedinmyer, C., Akagi, S. K., Yokelson, R. J., Emmons, L. K., Al-Saadi, J. A., Orlando, J. J., and Soja, A. J.: The Fire INventory from NCAR (FINN): a high resolution global model to estimate the emissions from open burning, Geosci. Model Dev., 4, 625–641, https://doi.org/10.5194/gmd-4-625-2011, 2011.
Xu, Z., Huang, X., Nie, W., Chi, X., Xu, Z., Zheng, L., Sun, P., and Ding, A.: Influence of synoptic condition and holiday effects on VOCs and ozone production in the Yangtze River Delta region, China, Atmos. Environ., 168, 112–124, https://doi.org/10.1016/j.atmosenv.2017.08.035, 2017.
Yin, P., Chen, R., Wang, L., Meng, X., Liu, C., Niu, Y., Lin, Z., Liu, Y., Liu, J., and Qi, J.: Ambient Ozone Pollution and Daily Mortality: A Nationwide Study in 272 Chinese Cities, Environ. Health Persp., 125, 117006, https://doi.org/10.1289/EHP1849, 2017.
Zhang, H., Li, J., Ying, Q., Yu, J. Z., Wu, D., Cheng, Y., He, K., and Jiang, J.: Source apportionment of PM2.5 nitrate and sulfate in China using a source-oriented chemical transport model, Atmos. Environ., 62, 228–242, https://doi.org/10.1016/j.atmosenv.2012.08.014, 2012.
Zhang, Q., Streets, D. G., He, K., Wang, Y., Richter, A., Burrows, J. P., Uno, I., Jang, C. J., Chen, D., Yao, Z., and Lei, Y.: NOx emission trends for China, 1995–2004: The view from the ground and the view from space, J. Geophys. Res.-Atmos., 112, D22306, https://doi.org/10.1029/2007JD008684, 2007.
Zhao, J., Cui, J., Zhang, Y., and Luo, T.: Impact of holiday-free policy on traffic volume of freeway: An investigation in Xi'an, in: 8th International Conference on Green Intelligent Transportation Systems and Safety, 2017, edited by: Wang, W., Jiang, X., and Bengler, K., Springer Verlag, 117–124, 2019.