the Creative Commons Attribution 4.0 License.
the Creative Commons Attribution 4.0 License.
 | 08 Jul 2021
Characterization of primary and aged wood burning and coal combustion organic aerosols in an environmental chamber and its implications for atmospheric aerosols
Amir Yazdani
Nikunj Dudani
Satoshi Takahama
Amelie Bertrand
André S. H. Prévôt
Ann M. Dillner
Particulate matter (PM) affects visibility, climate, and public health. Organic matter (OM), a uniquely complex portion of PM, can make up more than half of total atmospheric fine PM mass. We investigated the effect of aging on secondary organic aerosol (SOA) concentration and composition for wood burning (WB) and coal combustion (CC) emissions, two major atmospheric OM sources, using mid-infrared (MIR) spectroscopy and aerosol mass spectrometry (AMS). For this purpose, primary emissions were injected into an environmental chamber and aged using hydroxyl (diurnal aging) and nitrate (nocturnal aging) radicals to reach an atmospherically relevant oxidative age. A time-of-flight AMS instrument was used to measure the high-time-resolution composition of non-refractory fine PM, while fine PM was collected on PTFE filters before and after aging for MIR analysis. AMS and MIR spectroscopy indicate an approximately 3-fold enhancement of organic aerosol (OA) concentration after aging (not wall-loss corrected). The OM:OC ratios also agree closely between the two methods and increase, on average, from 1.6 before aging to 2 during the course of aging. MIR spectroscopy, which is able to differentiate among oxygenated groups, shows a distinct functional group composition for aged WB (high abundance of carboxylic acids) and CC OA (high abundance of non-acid carbonyls) and detects aromatics and polycyclic aromatic hydrocarbons (PAHs) in emissions of both sources. The MIR spectra of fresh WB and CC aerosols are reminiscent of their parent compounds with differences in specific oxygenated functional groups after aging, consistent with expected oxidation pathways for volatile organic compounds (VOCs) of each emission source. The AMS mass spectra also show variations due to source and aging that are consistent with the MIR functional group (FG) analysis. Finally, a comparison of the MIR spectra of aged chamber WB OA with that of ambient samples affected by residential wood burning and wildfires reveals similarities regarding the high abundance of organics, especially acids, and the visible signatures of lignin and levoglucosan. This finding is beneficial for the source identification of atmospheric aerosols and interpretation of their complex MIR spectra.
- Article
(3073 KB) - Full-text XML
- Companion paper
-
Supplement
(3164 KB) - BibTeX
- EndNote


Particulate matter (PM) affects visibility and climate (Hallquist et al., 2009). For example, fine PM can play the role of cloud condensation nuclei (CCN) impacting cloud formation (McFiggans et al., 2004). PM can also considerably perturb the transfer of different wavelengths of electromagnetic radiation by scattering or absorption phenomena (Seinfeld and Pandis, 2016). In addition, exposure to ambient fine PM is estimated to have caused 8.9 million premature deaths worldwide per year (in 2015; Burnett et al., 2018). Organic matter (OM), which constitutes up to 90 % of total fine atmospheric PM, is a key factor in aerosol-related phenomena (Russell, 2003; Shiraiwa et al., 2017). However, its chemical composition and formation mechanisms have not yet been fully characterized due to its compositional complexity (Kanakidou et al., 2005; Turpin et al., 2000).
Biomass burning particulate emissions (including those from residential wood burning, WB, prescribed burning, and wildfire) are major contributors to total atmospheric OM with an increasing importance due to rising wildfire activities (Westerling, 2016; DeCarlo et al., 2008; Sullivan et al., 2008). Biomass burning primary organic aerosols (POAs) account for 16 % to 68 % of total OM mass in Europe (Puxbaum et al., 2007). Coal combustion (for electricity and heat generation) is another major POA source in China and some regions of Europe (Haque et al., 2019; Junninen et al., 2009), emitting considerable amounts of carcinogenic and mutagenic polycyclic aromatic hydrocarbons (PAHs) (Sauvain et al., 2003). Approximately 40 % of the world's electricity (and up to 66 % in China) is generated in coal-fueled power plants (World Coal Association, World Coal Association, 2020). Biomass burning and coal combustion are also believed to be responsible for a large fraction of secondary organic aerosol (SOA), especially in winter when biogenic emissions are largely absent (Qi et al., 2019; Lanz et al., 2010; Zhang et al., 2020). Recent studies highlight the contribution of biomass burning by showing the predominance of carbon from non-fossil-fuel origins in SOA even in industrial regions (Haddad et al., 2013; Beekmann et al., 2015). To date, primary biomass burning emissions have been investigated in several works (e.g., Johansson et al., 2004; Bäfver et al., 2011; Alves et al., 2011). However, SOAs and their chemical compositions have not been studied extensively until recently (e.g., Bertrand et al., 2017; Tiitta et al., 2016; Bruns et al., 2015) due to sophisticated experimental setup requirements.
The determination of organic aerosol (OA) and SOA chemical compositions involves a large range of analytical and computational techniques. Aerosol mass spectrometry (AMS) and mid-infrared (MIR) spectroscopy are two methods capable of analyzing most of the OA mass in addition to providing information about chemical class or the functional groups (FGs) (Hallquist et al., 2009). In AMS, non-refractory aerosol is first vaporized (normally at 600 ∘C). Thereafter, the vaporized fraction is turned to ionized fragments and is then detected by the mass spectrometer to obtain online atomic composition of non-refractory aerosol. This method is well characterized for its capability to estimate elemental composition with a high time resolution and detection limit (Canagaratna et al., 2007). There are, however, some known challenges: particle collection efficiency of aerodynamic lens section (Canagaratna et al., 2007); particle bounce back in the vaporizer (Kumar et al., 2018); potential reactions occurring in ion chamber (Faber et al., 2017); and, most importantly, extensive molecule fragmentation (Faber et al., 2017; Canagaratna et al., 2007) with the common ionization method (i.e., electron ionization, EI) that makes the interpretation of the AMS mass spectrum difficult.
MIR spectroscopy, which is commonly performed off-line on polytetrafluoroethylene (PTFE) filters, provides direct information about FG abundances in OA collected on the filters. This information can be converted to OM, OC (organic carbon), and the OM:OC ratio with the aid of statistical models and laboratory standards with a few assumptions (Boris et al., 2019; Ruthenburg et al., 2014; Reggente et al., 2016; Coury and Dillner, 2008). Recent studies show good agreement between MIR OM and OC estimates and the thermal optical reflectance (TOR) OC and residual OM methods for monitoring networks (Boris et al., 2019). The main advantage of MIR spectroscopy over other common methods is that it is relatively fast, inexpensive, and non-destructive to the filter sample during analysis (Ruthenburg et al., 2014). However, sampling for MIR spectroscopy is usually performed for at least several minutes, resulting in lower temporal resolution (Faber et al., 2017). Moreover, the presence of overlapping peaks complicates the interpretation of the MIR spectrum. Collocated AMS and MIR measurements can combine the advantages of both techniques and provide high-time-resolution measurements with FG quantification (e.g., Faber et al., 2017; Chen et al., 2016; Frossard et al., 2014; Russell et al., 2009a; Chhabra et al., 2011b). The uncertainties of OC and OA mass concentrations derived based on Fourier-transform infrared spectroscopy (FTIR) and AMS have been reported to be within 35 % (Dillner and Takahama, 2015; Gilardoni et al., 2009; Russell et al., 2009b; Frossard et al., 2011; Liu et al., 2011; Corrigan et al., 2013a; Frossard et al., 2014; Reggente et al., 2019a) and 25 %, respectively (Canagaratna et al., 2007). Precision for replicate measurements with the same instrument has been shown to be substantially higher (e.g., Debus et al., 2019b).
This study is one of the few examples of AMS and MIR spectroscopy being combined to provide a superior chemical resolution for analyzing burning emissions in an environmental chamber and in the atmosphere. In this work, a series of wood burning (WB) and coal combustion (CC) experiments were conducted in an environmental chamber at the Paul Scherrer Institute (PSI). An AMS measured the chemical composition of OA throughout the aging process, while fresh and aged fine aerosols were collected on separate PTFE filters, making it possible to combine the measurements of the two methods. We investigated the MIR spectra and FG composition of POA and SOA formed after diurnal and nocturnal aging processes in relation to their parent compounds and the oxidation products of their identified volatile organic compounds (VOCs). These results were combined with the high-resolution AMS mass spectra to evaluate the consistency of the two techniques and to better understand differences in the chemical composition caused by different emission sources and aging. Finally, the MIR spectra of the chamber biomass burning samples were compared to those of some atmospheric burning-influenced aerosols collected at the Interagency Monitoring of PROtected Visual Environments (IMPROVE, IMPROVE, 2019) network http://vista.cira.colostate.edu/improve/ (last access: 20 April 2020) to understand their similarities and to develop a method for the identification of atmospheric burning-influenced samples using MIR spectroscopy.
In the following sections, the experimental setup (Sect. 2.1), online and off-line measurement techniques (Sect. 2.2 and 2.3), and atmospheric sample collection (Sect. 2.4) are described in detail. Thereafter, the statistical methods used for postprocessing are discussed in Sect. 2.5 and 2.6.
2.1 Laboratory experimental setup and procedure
Four wood burning (WB) and six coal combustion (CC) experiments were conducted in a collapsible Teflon chamber of 6 m3 at the Paul Scherrer Institute (PSI). We studied the effects of fuel source and diurnal/nocturnal aging on the chemical composition of the emissions. The experimental setup in this work was similar to that used by Bertrand et al. (2017) (Fig. S1 in the Supplement).
For the WB experiments, we have followed the procedures developed in Bertrand et al. (2017, 2018a) which favor smoldering-dominated wood fires. Three beech wood logs (approximately 2.5 kg) without bark and an additional 300 g of kindling (beech) were burned in a modern wood stove (2010 model). The logs were ignited using three fire starters composed of wood shavings, paraffin, and natural resins. The moisture content of the logs was measured to be around 11 %. Each burning experiment was started with a lighter followed by immediate closing of the burner door. Emissions past the ignition, in which kindling wood and starters were fully combusted, were injected into the chamber.
In the CC experiments, 300 g of bituminous coal from Inner Mongolia (63 % carbon content) was burned. First, the ash drawer of the stove was loaded with kindling wood (beech), which was ignited and served to ignite the coal. The wood was removed from the drawer after proper ignition of the coal. The emissions past the ignition phase were injected in the chamber via a single injection. Klein et al. (2018) have shown that the temperature in the stove at the starting phase significantly affects the total emission rates of SOA precursors and to a lesser extent their composition. Here, the ignition temperature spanned a similar range as in Klein et al. (2018). Control experiments were performed to evaluate the effect of kindling wood on the emissions, for which we followed a similar procedure as for the real experiments but without putting coal in the stove. The resulting emissions after removing the ignited kindling were not different from background emissions for both particle and gas phases.
In both CC and WB experiments, the injection was continued (from 5 to 25 min) until the measured concentration of primary organic aerosol by the high-resolution time-of-flight (HR-TOF) AMS reached values of approximately 20 µg m−3. WB and CC samples were extracted from the chimney and diluted using an ejector diluter (DI-1000, Dekati Ltd.) before being injected into the chamber. The lines from the chimney to the environmental chamber were heated to 413 K to limit semi-volatile compound condensation in the lines. The average temperature and relative humidity of the chamber after injection were maintained at 293 K and 55 %–60 %, respectively. The emissions were left static for 30 min in the chamber after injection to ensure proper mixing and for sampling and characterizing the primary organic aerosol. Thereafter, emissions were aged using the hydroxyl or nitrate radical for simulating diurnal and nocturnal aging mechanisms.
The OH radical was produced by the photolysis of nitrous acid (HONO) continuously injected into the chamber, using UV lights (40×100 W, Cleo Performance, Philips). HONO was generated by reacting constant flows of diluted sulfuric acid (H2SO4) and sodium nitrite (NaNO2) in a custom gas flask. Pure air passed through the flask and then a PTFE membrane filter before being injected into the chamber to ensure particle-free flow of HONO (the procedure is explained by Taira and Kanda, 1990; Platt et al., 2013). Before aging, 1 µL of deuterated butanol-D9 (98 %, Cambridge Isotope Laboratories) was injected into the chamber to measure the OH radical exposure (Barmet et al., 2012). The concentration of butanol-D9 was monitored by a proton transfer reaction time-of-flight mass spectrometer (PTR-TOF-MS 8000, Ionicon Analytik). Emissions were aged for around 4 h to reach OH exposures of (2–3)×107 molec cm−3 h corresponding to 20–30 h of aging in the atmosphere (assuming a 24 h average OH concentration of 1×10⁶ molec cm−3 in the atmosphere; Seinfeld and Pandis, 2016). For the nocturnal aging experiments, the NO3 radical was produced by a single injection of O3 and NO2 in the chamber. The NO2:O3 ratio we have used is approximately 1, and their concentrations were approximately 50 ppb. The contribution of NOx from combustion was less than 10 ppb. The concentration of NO3 was inferred from the reactivity of phenol ( 96.058, [C6H7OH]H+) emitted from wood burning and coal combustion ( ). We calculated an initial concentration of NO3 of 1–2.5 × 10⁷ molec cm−3. The effects of vapor wall losses of primary semi-volatile species and of oxidized vapors in our chamber are detailed in Bertrand et al. (2018a) and in Jiang et al. (2020), respectively, and are beyond the scope of this paper.
After each experiment, the chamber was cleaned by injecting O3 for 1 h and irradiating with a set of UV lights while flushing with pure air. Then, the chamber was flushed with pure air in the dark for at least 12 h (similar to the procedure described by Bruns et al., 2015). The pure air injection system consists of a generator (Atlas Copco SF 1 oil-free scroll compressor with 270 L container, Atlas Copco AG, Switzerland) coupled to an air purifier (AADCO 250 series, AADCO Instruments, Inc., USA) which provides a hydrocarbon background of sub 10 ppb C. The background particle- and gas-phase concentrations were measured in the clean chamber before each experiment. Blank experiments were performed, in which the chamber was filled with either pure air or a mix of pure air and ambient air sampled through the heated sampling system and the lights were switched on. In these experiments, approximately 1 µg m−3 of organic aerosol was formed.
2.2 Online PM measurement
After the primary emission injections, PM emissions in the chamber were monitored using two online techniques. Non-refractory particle composition was measured at a temporal resolution of 30 s by a HR-TOF AMS (Aerodyne Research Inc.; DeCarlo et al., 2006) operating in V mode (mass resolution ), with a vaporizer temperature of 600 ∘C and pressure of approximately 10−5 Pa, and EI operating at 70 eV, equipped with a 2.5 µm inlet aerodynamic lens. Data postprocessing was performed in Igor Pro 6.3 (Wave Metrics) using SQUIRREL (Sequential Igor Data Retrieval) 1.57 and PIKA (Peak Integration by Key Analysis) 1.15Z routines. The elemental and OM:OC ratios were determined according to Canagaratna et al. (2015). The reported OA concentrations were not wall-loss corrected. The AMS ionization efficiency was calibrated using NH4NO3 particles. A condensation particle counter (CPC; 3025A TSI) measured total particle number concentrations, and a scanning mobility particle sizer (SMPS; CPC 3022, TSI) measured particle size distribution. Particles were dried (Nafion, Perma Pure LLC) upstream of the AMS, SMPS, and CPC. The AMS collection efficiency was verified using SMPS and ranged between 0.7–1.1 and therefore was assumed to be approximately 1 for our conditions.
2.3 Off-line PM sampling and measurement
Primary and aged PM emissions were collected on separate PTFE filters (47 mm diameter Teflo® membrane, Pall Corporation) for 20 min after the injection of primary emissions into the chamber and after 4 h of aging. The aerosol collection area was limited to a circle with a diameter of 1 cm in the center of the filter using PTFE masking elements placed above and below the filters (Russell et al., 2009b). Sampling on PTFE filters was performed at a flow rate of 8 L min−1 using a flow system composed of a sharp-cut-off cyclone (1 µm at a nominal flow rate of 16 L min−1) and a silica gel denuder. Hereafter, these PTFE filters are referred to by their fuel and oxidant: e.g., WB_OH refers to the filters corresponding to the WB experiments aged with OH. After sampling, filters were immediately stored in filter petri dishes at 253 K before MIR analysis to minimize volatilization and chemical reactions. The PTFE filters were analyzed using a Bruker Vertex 80 FT-IR instrument equipped with an α deuterated lanthanum alanine doped triglycine sulfate (DLaTGS) detector at a resolution of 4 cm−1. The FTIR sample chamber was continuously purged with dry air treated with a purge gas generator (Puregas GmbH) to minimize water vapor and carbon dioxide interferences.
2.4 Atmospheric samples (IMPROVE network)
Particulate matter with diameter less than 2.5 µm (PM2.5) was collected on PTFE filters (25 mm diameter Teflo® membrane, Pall Corporation) every third day for 24 h, midnight to midnight, at a nominal flow rate of 22.8 L min−1 during 2011 and 2013 at selected sites in the IMPROVE network (approximately 3050 samples from 1 urban and 6 rural sites in 2011 and 4 urban and 12 rural sites in 2013). The PTFE filters were analyzed using a Bruker Tensor 27 FT-IR instrument equipped with a liquid-nitrogen-cooled, wide-band mercury–cadmium–telluride (MCT) detector, at a resolution of 4 cm−1. In this work, atmospheric samples were divided into four mutually exclusive subgroups: urban, rural, residential wood burning, and wildfire (residential wood burning and wildfire samples were identified by Bürki et al., 2020). Bürki et al. (2020) separated and identified the burning-influenced samples in the same dataset using cluster analysis and subsequent analysis of the clusters. They divided the burning-influenced samples into residential wood burning and wildfire subcategories by extending further down the hierarchical tree. The residential wood burning subcategory was labeled according to its occurrence during winter months in Phoenix, AZ (Bürki et al., 2020), where residential wood burning commonly takes place (Pope et al., 2017). The wildfire subcategory was labeled due to its occurrence during a known fire event (Rim Fire, CA, 2013).
2.5 Postprocessing of MIR spectra to identify and quantify functional groups in laboratory and IMPROVE samples
After obtaining the MIR spectra of the laboratory and ambient samples, they were processed the same. The postprocessing enabled the quantification of alcohol COH (aCOH), carboxylic acid (COOH), aliphatic CH (aCH), and non-acid-carbonyl (naCO) functional groups and the identification of PAHs, organonitrates, levoglucosan, inorganic sulfate, and nitrate. In this section, the methods used for spectral postprocessing are described in detail.
2.5.1 Baseline correction
Baseline correction was performed to eliminate the contribution of background drift, light scattering by filter membrane and particles, and absorption by carbonaceous material due to electronic transitions (Russo et al., 2014; Parks et al., 2019). For this purpose, we used a smoothing spline method similar to the approach taken by Kuzmiakova et al. (2016). In this method, a cubic smoothing spline was fitted to the raw spectra (excluding organic FG bands) and then was subtracted from them to obtain the net absorption due to FG vibrations at each wavelength. The current version extends the baseline correction algorithm by Kuzmiakova et al. (2016) (limited to 1500–4000 cm−1) to the 400–4000 cm−1 range.
2.5.2 Blank subtraction
Although PTFE filters are optically thin in the MIR range, they have several absorbing bands due to the C−F bond vibrational modes (e.g., at 1000–1320 cm−1; Quarti et al., 2013). These bands overlap with some organic and inorganic function group bands and limit the information that can be extracted from the analysis of OA on PTFE filters. To mitigate this issue, a scaled version of a baseline-corrected blank filter spectrum (the contribution of filter membrane scattering was excluded, and only PTFE absorptions were maintained) was subtracted from the baseline-corrected sample spectra to retrieve some of the overlapping features (Fig. S2). The scaling procedure compensates for the variation in blank filter absorbances due to factors such as non-uniformity in PTFE membrane morphology due to manufacturing variability and/or aerosol loading differences between filters and within the same filter (Debus et al., 2019a; Quarti et al., 2013) by scaling the C−F peak at 1210 cm−1. This approach is different from those taken by Takahama et al. (2013) and Maria et al. (2003) that subtracted a scaled raw spectrum of a blank filter from sample spectra before baseline correction. The blank subtraction algorithm allowed us to identify bands related to aromatics and PAHs at 690–900 cm−1 (Centrone et al., 2005), organonitrates (RONO2) at 850 cm−1, alcohol CO stretching at 1050 cm−1, levoglucosan bands at 860–1050 cm−1, and inorganic sulfate and nitrate bands at 620 and 1400 cm−1, and it also allowed us to better quantify the carbonyl absorbances at around 1700 cm−1.
2.5.3 Quantifying organic functional groups
After baseline correction and blank subtraction, the multiple peak-fitting algorithm described by Takahama et al. (2013) and implemented by Reggente et al. (2019b), functioning based on nonlinear least squares analysis, was applied to the spectra to obtain major FG abundances of aCOH, COOH, aCH, and naCO (Yazdani et al., 2021a). The RONO2 group abundances were not quantified due to the extensive overlap of its absorbances with other compounds and in order to keep the MIR estimates consistent with those of AMS, for which only total (organic plus inorganic) nitrate was estimated. After estimating FG abundances, the O:C, H:C, and OM:OC ratios were calculated with a few assumptions about the number of carbon atoms attached to each FG (refer to Chhabra et al., 2011b; Russell, 2003; Maria et al., 2002). The peak attributed to aromatics and PAHs was analyzed qualitatively due to the lack of calibration models. In addition to the common FG analysis, we used MIR fingerprint features to identify relevant substances to biomass burning (e.g., levoglucosan and lignin). Levoglucosan was quantified using its fingerprint features.
2.6 Dimensionality reduction of AMS mass spectra
While AMS provides a well-characterized, time-resolved measurement of OA aging, the extensive fragmentation of molecules, high number of ion fragments, and collinearity of ion fragment intensities make the interpretation of AMS mass spectra complex (Faber et al., 2017; Canagaratna et al., 2007). We used principal component analysis (PCA; Hotelling, 1933) to reduce the dimensionality of the AMS mass spectra in order to identify the most important drivers of variability in the spectral data and their connection with the FG composition of OA. The advantage of PCA analysis over analysis of the normalized conventional mass fragments (e.g., f43 and f44 in Fig. 5) is that PCA loads the highly correlated fragment ions onto the same principal components (PCs) that are orthogonally oriented to each other, thereby reducing redundancy among dimensions. Furthermore, PCA describes the range of variability spanned specifically by this dataset, accentuating smaller variations that might be lost using the conventional ranges spanned by normalized mass fragment analysis.
Before applying PCA, mass spectra at each measurement were normalized using the corresponding OA concentrations to eliminate signal variability due to changes in OA concentration. The correlation matrix of the normalized AMS mass spectra (correlation of ion intensities at different values) shows that signals at several values are correlated (Fig. S3). Thus, the dimensionality of the mass spectra can be reduced considerably without significant loss of information. Our data matrix, X, is a i×j matrix with i observations (2979 AMS measurements) and j variables (335 fragment ions) with a rank l (). The columns of X are centered to avoid intercepts in scores. The PCA calculation was performed by singular value decomposition of the centered data matrix (Abdi and Williams, 2010), X=PΔQT, where P is the i×j matrix of left singular vectors, Q is the j×l matrix of right singular vectors, known as loadings, and Δ is the diagonal matrix of singular values (Δ2 is the diagonal matrix of eigenvalues of covariance matrix, XTX). The i×l matrix of factor scores, F, is obtained as F=PΔ.
In this section, peak fitting is applied to MIR spectra to estimate major FG concentrations. Thereafter, relative FG abundances are compared in different OAs to understand compositional differences arising due to the aerosol source and age (Sect. 3.1 and 3.3). In addition, the MIR spectra of primary and aged OAs are compared to those of the fuel sources for identifying the chemical similarities between POA and fuel sources and for better understanding the important oxidation pathways for SOA formation (Sect. 3.2 and 3.4). In Sect. 3.5, AMS mass spectra are analyzed using PCA to understand the factors driving the spectral variability and how they relate to FG composition. Finally, the MIR spectra of chamber WB aerosols are compared to those of previously identified atmospheric burning-influenced samples, and a new method for identifying biomass burning aerosols using MIR spectroscopy is proposed (Sect. 3.6).
3.1 Wood burning – functional group composition
The primary WB aerosols have a high abundance of the aCH group (Figs. 1a and S5a). This FG, which absorbs in the 2800–3000 cm−1 region in the MIR spectrum (Fig. 2a), constitutes around 50 % of the total mass of fresh WB OA (Fig. 1a). The aCOH group, which appears as a broad peak around 3400 cm−1 (Fig. 2a), has the second highest concentration (around 30 % of the total mass; Fig. 1a). This FG is also ubiquitous in hemicellulose, cellulose, and lignin – three main components that constitute 20 wt %–40 wt %, 40 wt %–60 wt %, and 10 wt %–25 wt % of lignocellulosic biomass, respectively (McKendry, 2002). The COOH group, which appears as a broad peak at 2400–3400 cm−1 and a sharp carbonyl peak at approximately 1700 cm−1 (Fig. 2a), is the third most abundant FG in fresh WB aerosols and constitutes 10 %–20 % of the OA mass (Figs. 1 and 2a). The primary WB samples have OM:OC ratios ranging from 1.6 to 1.8 (Figs. 2b and S5b).

Figure 1(a) Bar plot of averaged MIR (separated by functional group) and AMS OA concentration estimates without wall-loss correction. The contribution of each functional group (with contribution >5 %) to total OA, the type of aerosol (P: primary), emission source (WB and CC), and oxidant used for aging (OH: hydroxyl radical, NO3: nitrate radical) are indicated for each category. (b) Bar plot of averaged MIR and AMS OM:OC estimates separated by the contribution of each functional group. The error bars show the maximum and minimum concentrations and OM:OC values for each category. For the estimates of each individual experiment refer to Fig. S5.
AMS and MIR estimates of OA concentration are highly correlated (R2=0.92; refer to Yazdani et al., 2021a, for detailed comparison) and show an almost 3-fold increase in OA mass concentration with aging. The relative aCH abundance decreases substantially (by up to 30 %) in WB aerosols with aging (Figs. 1a and S5a). The relative decrease in the aCH abundance is less prominent when aerosols are aged with the nitrate radical probably due to the fact that organonitrates are excluded from quantitative analysis, thus the total OA concentration being underestimated, and also because only a limited number of precursors react with the nitrate radical, leading to different SOA species. The aCH profile changes from the superposition of sharp peaks (observed for long-chain hydrocarbons) in primary WB spectra to broad peaks (observed in the spectra of oxygenated species) in aged WB spectra (Fig. 2a; Yazdani et al., 2020). The aCOH relative abundance in WB aerosols also decreases with aging (Fig. 1a). The relative abundance of COOH increases significantly in WB aerosols with aging, suggesting carboxylic acid formation to be the dominant VOC oxidation pathway for biomass burning (Fig. 1). The aged WB samples with high carboxylic acid concentration have a broad OH peak ranging from 2400 to 3400 cm−1, and their carbonyl absorption frequency is on the lower end of its range (approximately 1708 cm−1 compared to 1715 cm−1 for ketone carbonyl; Fig. 2a) due to the weakening of the C=O bond in dimerized acids (Pavia et al., 2008). Phenol, methoxyphenols, and naphthalene are among the most important SOA precursors, based on their SOA yields, present in wood smoke reported by Bruns et al. (2016) and Stefenelli et al. (2019). The high abundance of COOH in the aged WB OA of this study is consistent with the considerable carboxylic acid formation reported from these precursors (Chhabra et al., 2011a; Kautzman et al., 2010; George et al., 2015). The aged WB samples have the highest OM:OC, ranging from 1.8 to 2.1 (Figs. 2b and S5b), with high concentrations of COOH.
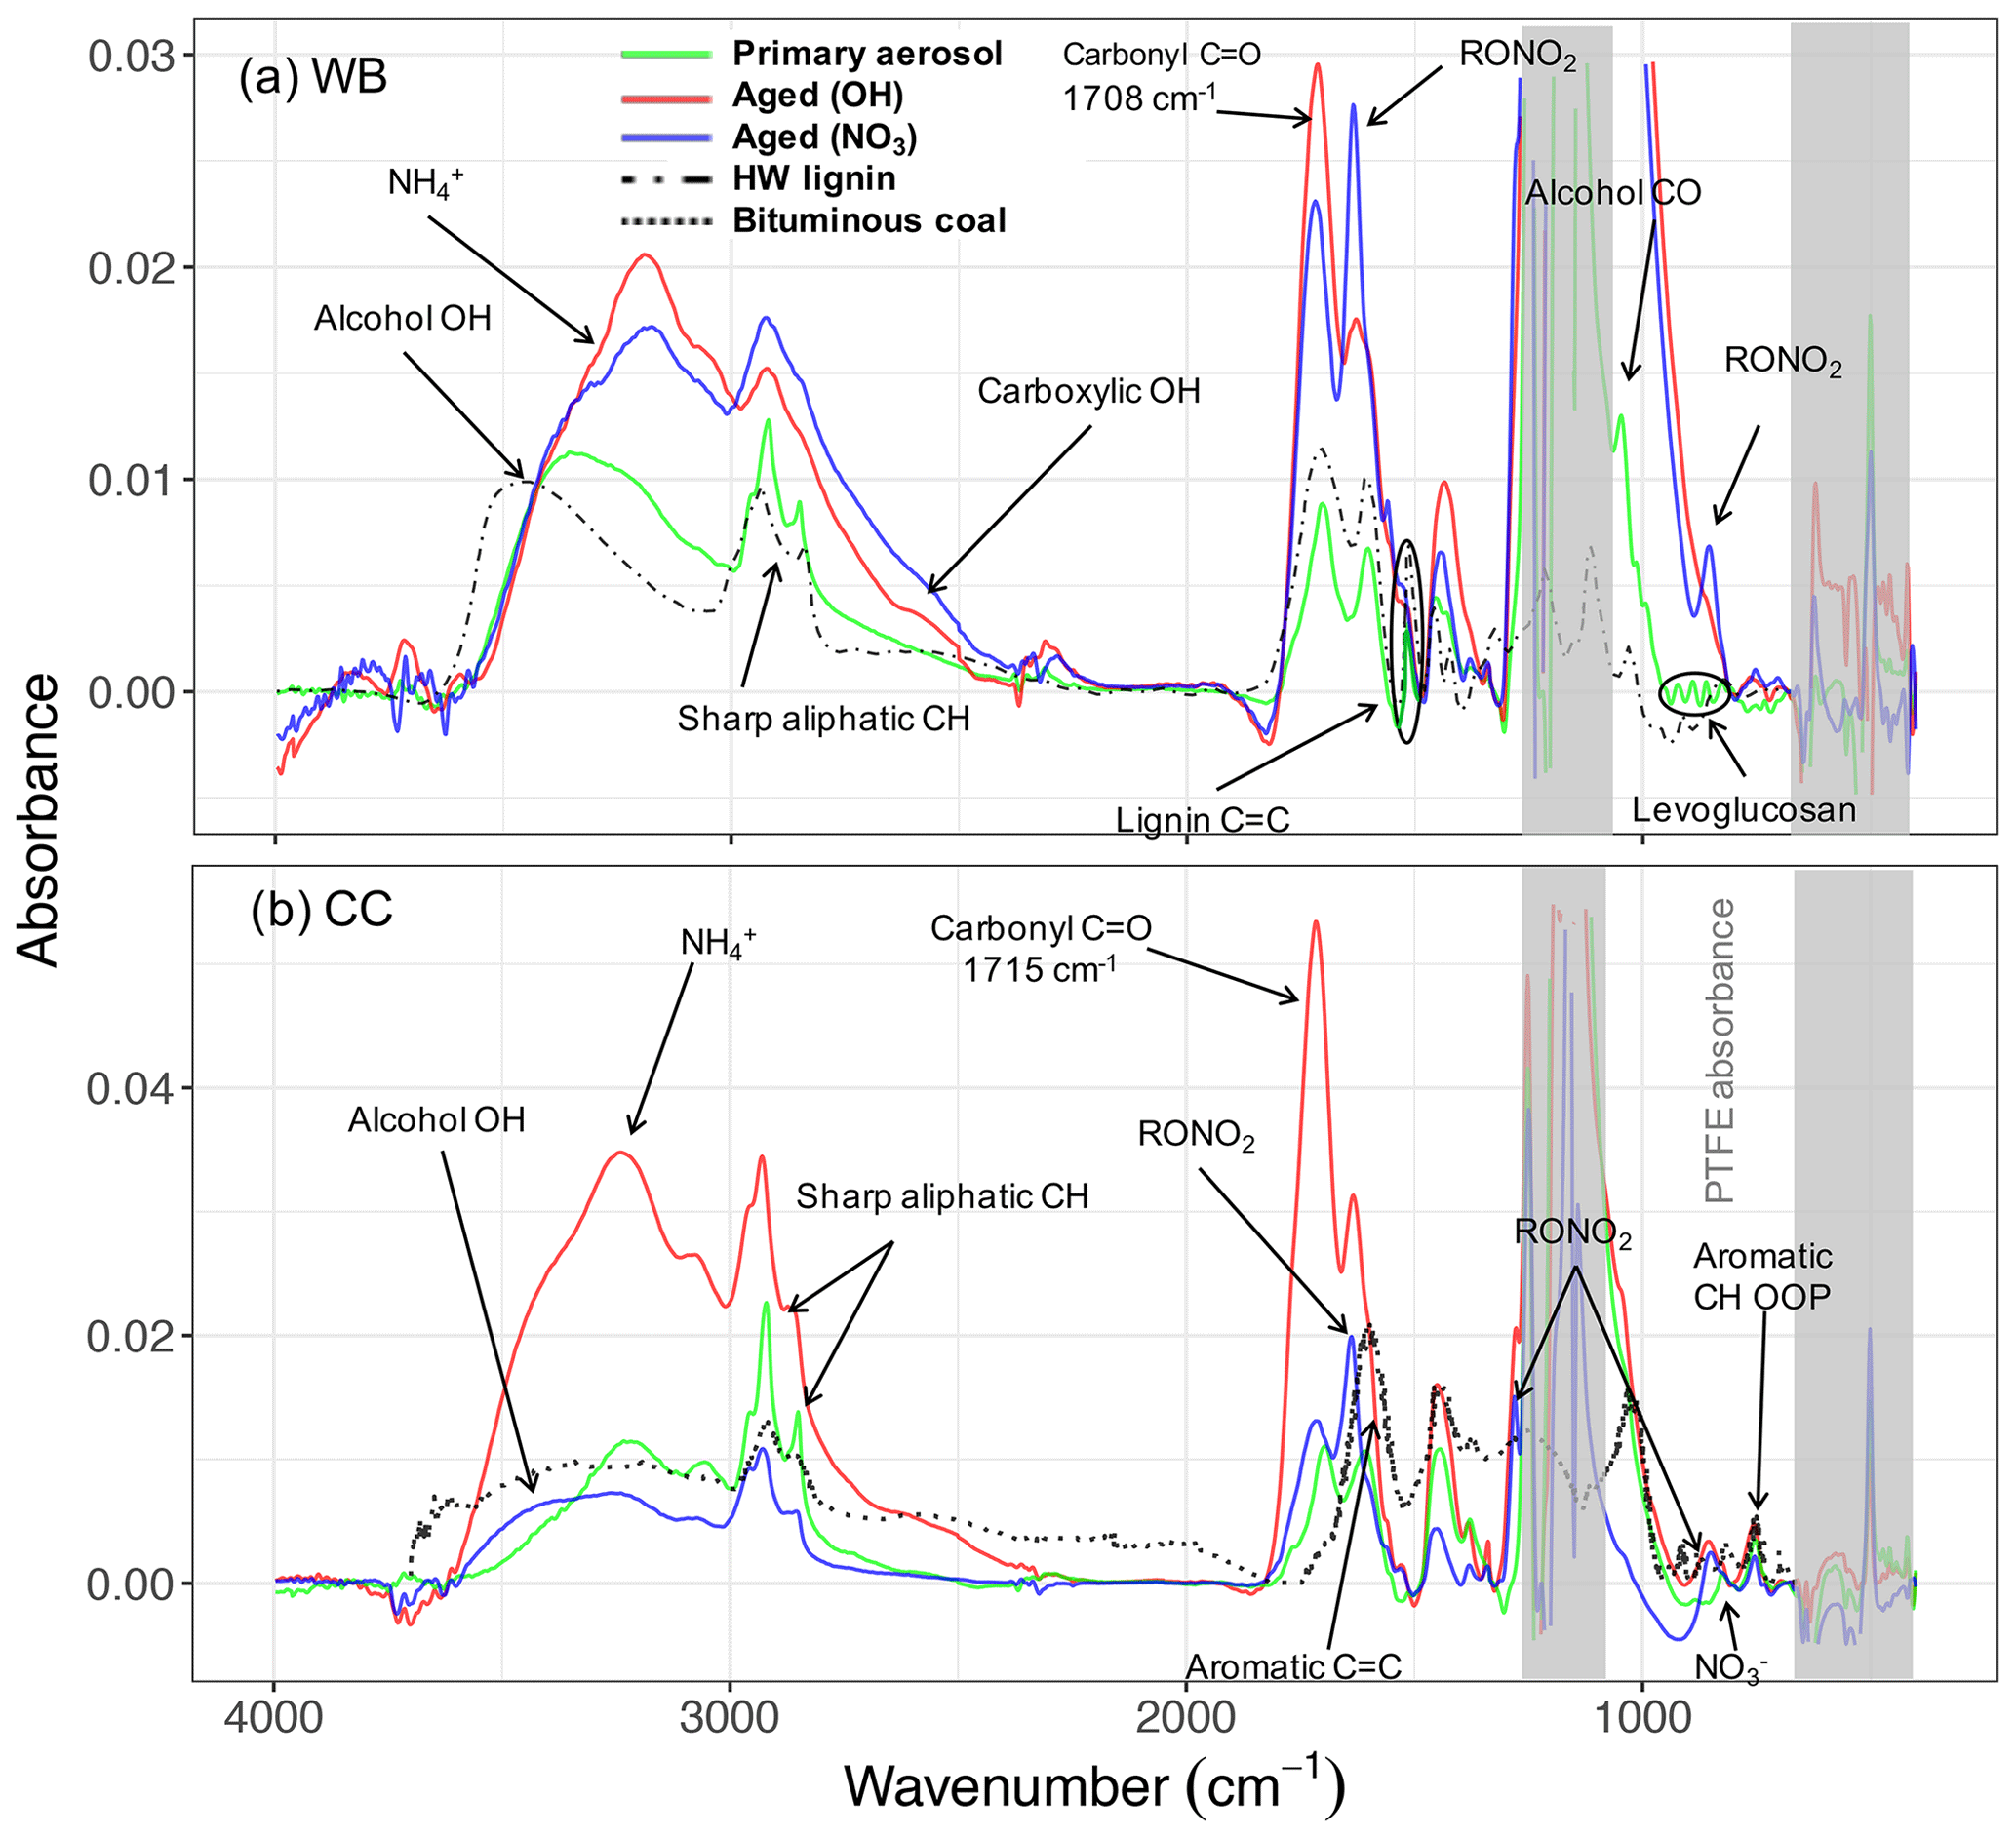
Figure 2The MIR spectra of primary and aged (with OH and NO3) wood burning (WB) and coal combustion (CC) OAs and their parent compounds: lignin and bituminous coal. The dash-dotted line demonstrates the spectrum of solvent-extracted hardwood (HW) lignin (in KBr pellets) taken from Boeriu et al. (2004). The dotted line shows the spectrum of pulverized bituminous coal taken from Zhang et al. (2015).
MIR spectroscopy is able to distinguish between organic and inorganic nitrates due to differences in their absorption frequencies (Day et al., 2010). In this work, we have investigated the variations in the RONO2 bands qualitatively by analyzing their absorbances at 1630, 1273, and 850 cm−1 (Day et al., 2010). These peaks are negligible in the MIR spectra of primary WB aerosols. However, their absorbances (thus the abundance of organonitrates) increase in the MIR spectra of WB aerosols aged by both hydroxyl and nitrate radicals with much more prominent contributions when the nitrate radical is used (Fig. 2a). This suggests that the RONO2 formation could be an important SOA formation pathway from WB emissions, which, nevertheless, we do not account for quantitatively. A relatively small peak at 1560 cm−1 is also observed in WB aerosols aged by the nitrate radical, which can be attributed to nitroaromatics (Pavia et al., 2008). Weak signatures of aromatics or PAHs are visible at 690–900 cm−1 in the MIR spectra of both primary and aged WB aerosols. The absorption in this region appears as a single peak centered around 754 cm−1. The intensity of this peak is correlated (R2=0.70) to the concentration of fragments in the AMS mass spectra that were reported to be attributed to aromatics (Bruns et al., 2015; Pavia et al., 2008) (Fig. S9). AMS results suggest aromatics and PAHs in WB aerosols constitute up to 8 % of total OAs. However, underestimation is possible due to the incomplete list of ion fragments considered in this work and fragmentation of oxygenated aromatics and PAHs during EI ionization (Supplement Sect. S5).
3.2 Wood burning – primary signatures
Using the MIR signatures of levoglucosan in primary WB aerosols (Sect. S6 and Fig. S10), it is estimated that 22 %–48 % of the aCOH absorbance and 15 %–29 % of total OA mass is due to the presence of levoglucosan as a main product of high temperature pyrolysis of cellulose and an important biomass burning marker (Shen and Gu, 2009; Puxbaum et al., 2007; Hennigan et al., 2010). The reported range is consistent with measurements by a thermal desorption aerosol gas chromatograph coupled to a HR-TOF AMS (TAG-AMS) TAG-AMS obtained by Bertrand et al. (2018a). The abundance of the AMS 60 fragment ion, related to levoglucosan fragmentation, (Schneider et al., 2006) and its MIR absorbances (used for the first time in this work) are highly correlated (R2=0.76; Fig. S11), both showing a consistent decrease in levoglucosan absolute concentration with aging regardless of the type of oxidant (Fig. S11). The contribution of levoglucosan to total OA mass is estimated to decrease to less than 5 % after aging. This is consistent with the significant enhancement in OA mass with SOA formation and the degradation of levoglucosan through its reaction with OH and its loss to the chamber walls (Bertrand et al., 2018b; Hennigan et al., 2010; Zhao et al., 2014).
The MIR spectra of hard wood lignin and fresh WB aerosols are very similar, suggesting the presence of similar molecular structures between the primary WB aerosol composition and its parent compound, lignin (Fig. 2a). One specific aspect of this similarity is the high absorbances of the aCOH group in both samples. By comparing the MIR spectra of fresh WB aerosols with that of lignin (Supplement Sect. S7), it can be inferred that the sharp peak at 1515 cm−1 and a part of the broader peak at 1600 cm−1 are attributed to aromatic rings in lignin structure (Hergert, 1960; Yang et al., 2007; Derkacheva and Sukhov, 2008) observed also in the spectrum of lignin monomers such as coniferyl alcohol (Bock and Gierlinger, 2019) and pyrolysis products of lignin with the same substitution pattern (Duarte et al., 2007; Simoneit et al., 1993). The peak at 1515 cm−1, however, diminishes with aging, implying a change in aromatic ring substitution or ring opening by oxidant attack. The peak around 1600 cm−1 is suppressed by the RONO2 peak around 1630 cm−1 after aging. Overall, our analysis shows that the large majority of the primary OA from WB emissions is composed of anhydrous sugars and lignin pyrolysis products.
3.3 Coal combustion – functional group composition
Peak fitting analysis suggests that the aCH group from all compounds containing this FG (alkanes and other compounds) constitutes around 60 wt %–80 wt % of primary CC OA – a larger fraction compared to fresh WB OA (Figs. 1b and S5b). An abundance of short and long-chain alkanes has also been reported in VOC emissions of bituminous coal (Liu et al., 2017; Klein et al., 2018). The naCO group is the second most abundant FG in the fresh CC OA, constituting, on average, 15 % of its mass (Fig. 1a), much higher than its contribution to WB emissions. This functional group has been reported to constitute 5 wt %–15 wt % of bituminous coal VOC emissions (Liu et al., 2017; Klein et al., 2018). The concentration of the COOH group is usually low in the primary CC aerosols (around 10 %; Fig. 1a). The primary CC aerosols are estimated to have the lowest OM:OC ratios (1.35–1.5) among all samples, which is justified by their strong aCH absorbances (Fig. 2b). Inorganics (ammonium, sulfate, and nitrate) have prominent absorbances in the MIR spectra of fresh (and aged) CC aerosols, which have not been observed in the case of WB aerosols. The high abundance of inorganic salts can be attributed to the sulfur and nitrogen that are present in bituminous coal (Vasireddy et al., 2011).
In the aged CC aerosols, the relative abundance of the aCH group decreases drastically (on average 40 %), especially when the hydroxyl radical is used as oxidant, despite an almost 3-fold increase in the OA mass concentration (without wall-loss correction; Figs. 1a and S5a). On the other hand, the abundance of the naCO carbonyl group increases by up to 40 %, suggesting that carbonyl production is the dominant oxidation pathway for VOCs of CC emissions predominantly when the hydroxyl radical is used (Fig. 1a). This observation is consistent with the high carbonyl abundance in SOA formed from the OH oxidation of alkane precursors, which are abundant in CC VOCs, at close OH exposures to those in this work (Lambe et al., 2012; Lim and Ziemann, 2009). This does not, however, preclude the contribution of oxidation products of aromatic compounds, which are also abundant in CC VOCs (Liu et al., 2017; Klein et al., 2018), in aged CC OA. The absence of the broad carboxylic acid OH peak for these samples and the peak location of the carbonyl group (1715 cm−1) in their MIR spectra (Fig. 2b) suggest that the majority of the carbonyl group in the OH-aged CC aerosols is ketone (Pavia et al., 2008). An increase in the aCOH abundance is also observed in the CC aerosols with aging. This increase is more remarkable than that in the WB aerosols (Fig. 1).
The RONO2 signature becomes clearly visible in aged CC aerosols when the nitrate radial is used as oxidant (Fig. 2b) or when the hydroxyl radical is used in the presence of NOx (>50 ppb). This observation is consistent with VOC oxidation pathways proposed by Kroll and Seinfeld (2008) and measured by Ayres et al. (2015). In addition, a new peak at 1350 cm−1 that can be attributed to the S=O group in sulfonates (Pavia et al., 2008) appears in some aged CC aerosols (Fig. 2b).
The aromatic CH out-of-plane (OOP) absorption appears as a relatively stronger peak at 754 cm−1 compared to WB aerosols in the spectra of CC aerosols and bituminous coal (Fig. 2b; Sobkowiak and Painter, 1992, 1995). The normalized CH OOP absorbances by total OA mass are, on average, higher for CC aerosols compared WB, suggesting a higher contribution of this FG. The concentration of AMS fragment ions corresponding to PAHs suggest that aromatics and PAHs of CC aerosols account for up to 7 % of total OA mass, although some underestimation is possible due to the limited number of fragment ions considered and the fragmentation of oxygenated aromatics and PAHs upon ionization (Supplement Sect. S5). These measurements suggest lower concentrations of aromatic compounds in CC OA compared to CC VOC emissions measured by Liu et al. (2017) and Klein et al. (2018).
The aged CC aerosols have slightly lower OM:OC ratios compared to the aged WB aerosols (Fig. 1b). For both emission sources, aerosols aged with the hydroxyl radial have higher OM:OC ratios (approximately 0.2) than those aged with the nitrate radical (Fig. 1b). This can be attributed to the different rate constants of VOC reactions with nitrate and hydroxyl radicals (Ziemann and Atkinson, 2012). Furthermore, organonitrates, which are abundant when aerosols are aged with the nitrate radical, are not considered either in AMS OA estimates or in MIR peak fitting. This exclusion causes the underprediction of both the OM:OC ratio and OA concentration estimates when the nitrate radical is used.
3.4 Coal combustion – primary signatures
Bituminous coal contains 69 wt %–86 wt % carbon, and its chemical structure is formed by highly substituted rings that are connected by alkyl or ether bridges (oxygen or sulfur) (Vasireddy et al., 2011). The MIR spectra of primary CC aerosols have weaker aromatic C=C absorbances at 1610 cm−1 than bituminous coal (Fig. 2b). This peak is suppressed by the RONO2 peak at 1630 cm−1 with aging (Fig. 2b). The carbonyl peak (1710 cm−1) observed in the spectra of the primary CC aerosols is absent in that of bituminous coal (Fig. 2b), suggesting carbonyl formation during coal combustion. Zhang et al. (2015) also reported a similar carbonyl generation for coal oxidation at high temperatures. We also observe that the aCH peaks are considerably sharper in the spectra of fresh CC aerosols than the pulverized coal (Fig. 2b), suggesting a higher relative contribution of this FG in primary CC OA than in bituminous coal.
The analyses of Sect. 3.1–3.4 suggest that aerosol source (WB and CC) and type (primary and aged with different oxidants) are both drivers of variability in the MIR spectra. These changes are substantially higher than uncertainties associated with OA mass concentrations derived based on FTIR and AMS. Furthermore, we found that aged aerosols of WB and CC have distinguishable functional group compositions, suggesting that MIR spectra retain source class information at least up to the studied levels of aging.
3.5 Comparison between AMS mass spectra and FG composition of OA
In this section, we investigate the main differences in bulk chemical composition of the primary and aged emissions measured by the AMS and their FG content. We applied PCA to the AMS mass spectra to facilitate their interpretation and to better understand the major sources of variability in the spectra and their connection with the FG composition of OA. Moreover, we projected AMS PMF (positive matrix factorization) factors obtained by Elser et al. (2016) and Aiken et al. (2009) (High Resolution AMS Spectral Database: http://cires.colorado.edu/jimenez-group/HRAMSsd/, last access: 20 April 2020) onto the PC space to compare and contrast the AMS spectra obtained from the chamber experiments with AMS PMF factors of atmospheric samples. By applying PCA, the dimensionality of the normalized AMS mass spectra was reduced from 330 fragment ions to 3 PCs while explaining around 91 % of the variance in the mass spectra (Table 1).
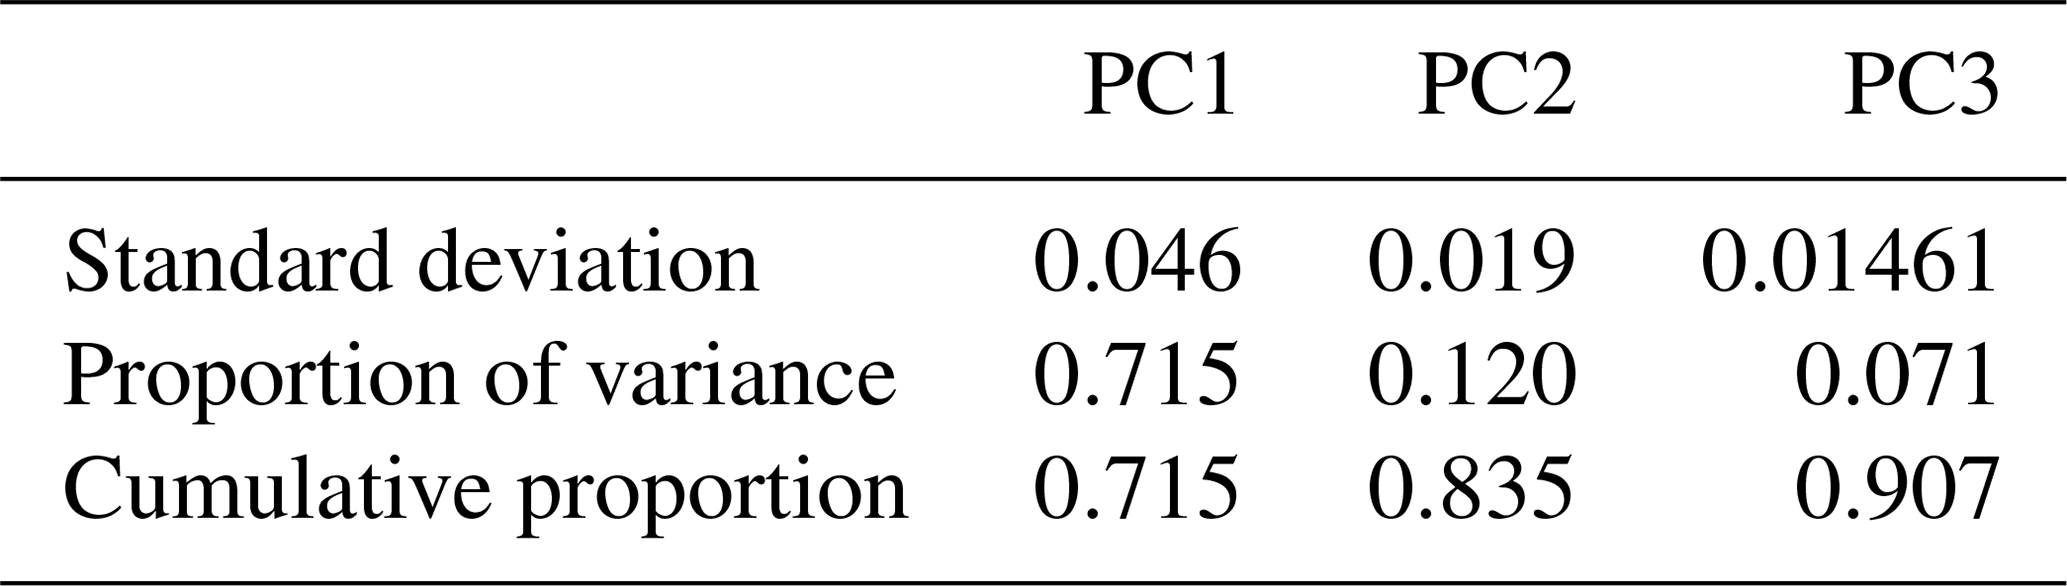
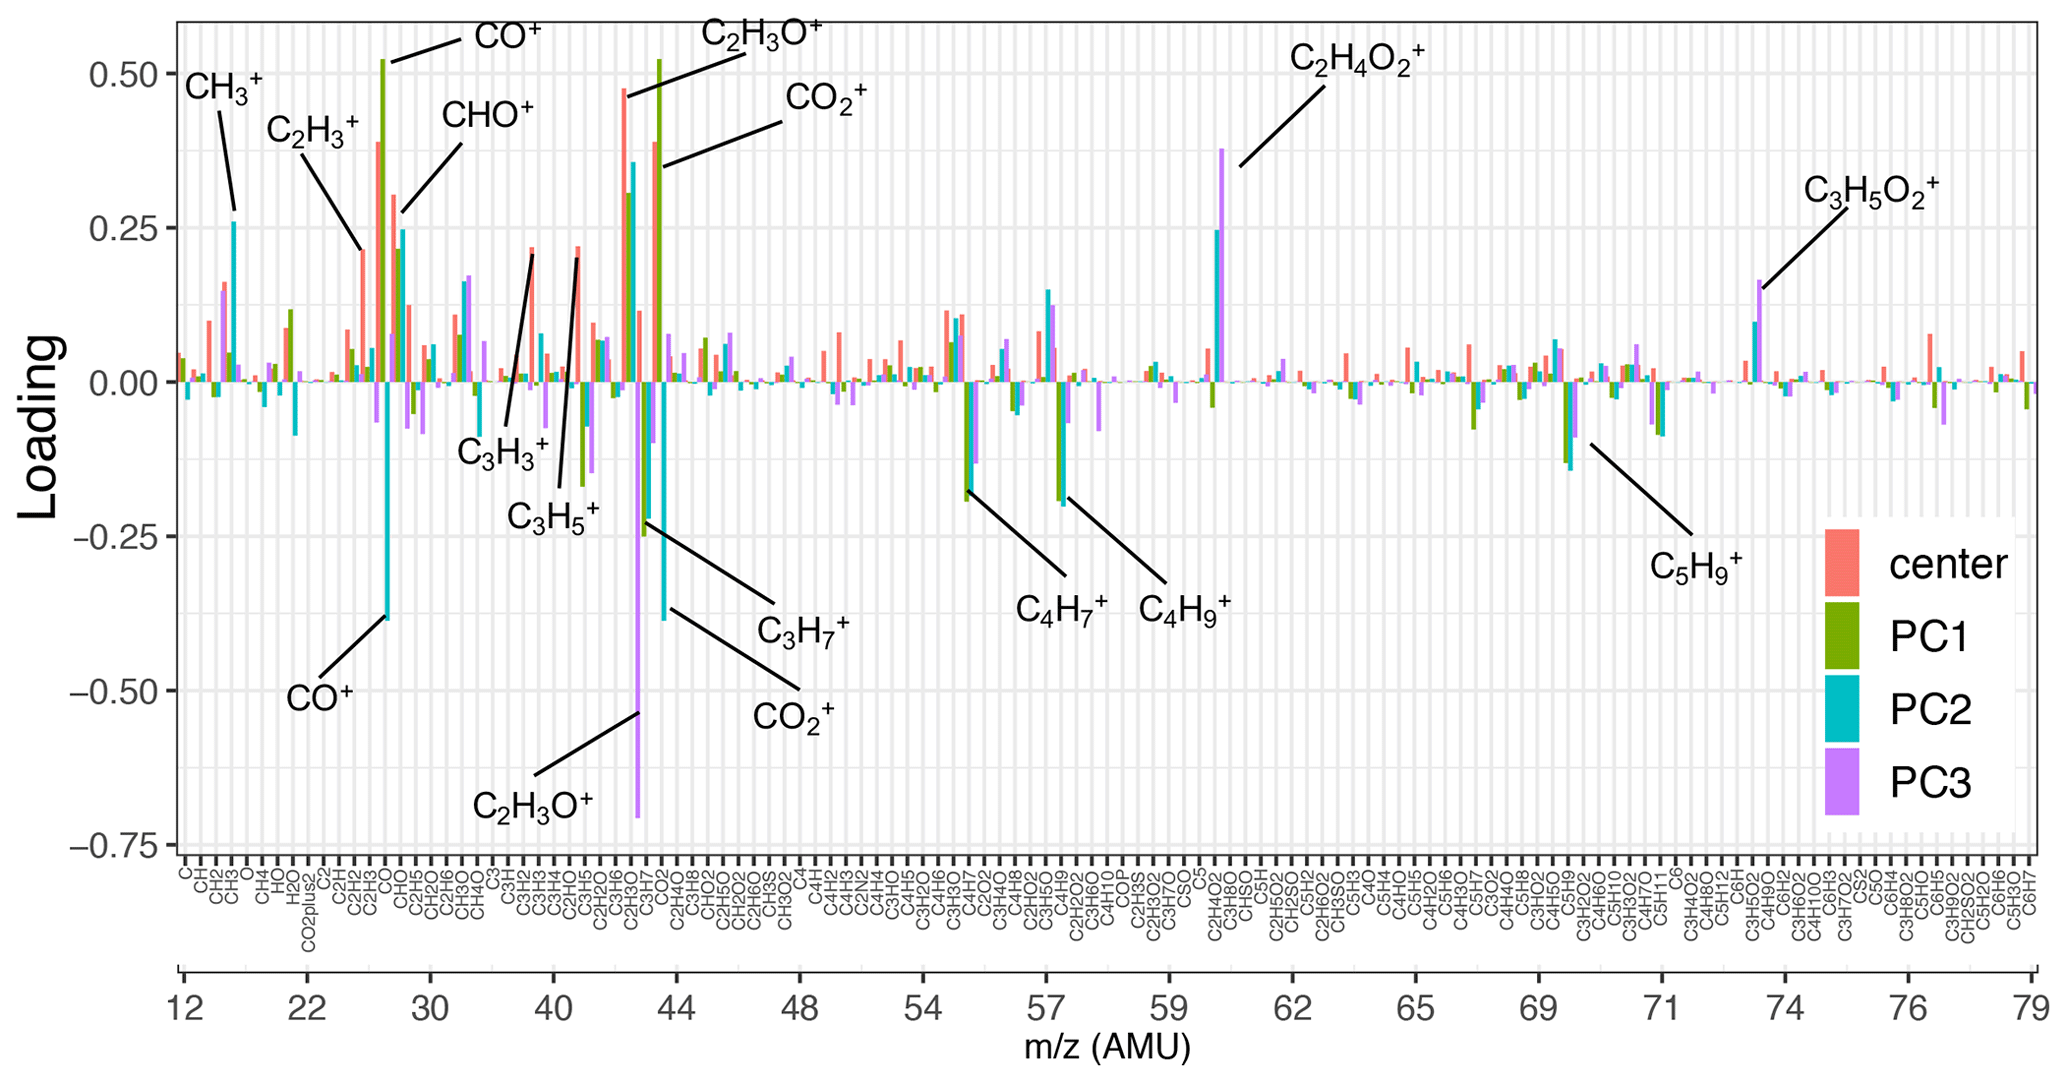
Figure 3Loadings of the first three principal components and the normalized mean AMS mass spectrum (shown up to 80). Fragment ions with high positive/negative loadings are indicated by their formula. Refer to Fig. S6 for the heavier fragments.
As can be seen from Fig. 3, the mean (center) mass spectrum, which represents the average of all mass spectra, has its highest values at a few ion fragments: C2H3O+, CO+, , CHO+, , , and . The loadings, which are informative about the most important variations in the mass spectra, have also high values at a few mass fragments, making their interpretation simple. The first PC, which explains around 72 % of the variance alone, has high positive loadings of and CO+, CHO+, and C2H3O+ fragment ions (Fig. 3). The fragment has been previously ascribed to mono- and dicarboxylic acids (Canagaratna et al., 2007; Faber et al., 2017; Russell et al., 2009a; Frossard et al., 2014). The CO+ fragment is estimated directly from (Aiken et al., 2008), and the other mentioned ion fragments represent other oxygenated species (Faber et al., 2017; Chhabra et al., 2011a). The high loadings of major oxygenated ion fragments and the empirical observation that primary and aged samples are separated along the PC1 axis (Fig. 4) suggest that the first PC indicates the general direction of aging and the extent of oxidation, which appear to be the major sources of variation in the data (based on the high explained variance by PC1). As can be seen from Fig. 4, PC1 scores are the lowest for primary CC and WB aerosols and increase with aging for both WB and CC samples. The higher oxidation state of aged WB aerosols compared to aged CC (i.e., higher PC1 score) aerosols is consistent with the high abundance of COOH and naCO FGs in the aged WB and CC aerosols, respectively. The WB and CC samples that are aged with the hydroxyl radical have higher PC1 scores than those aged with the nitrate radical, indicating the former are more oxidized. The order of PC1 scores across the samples is reminiscent of the order of OM:OC ratios discussed earlier.
The second PC, which explains about 12 % of the variance, mainly contrasts primary WB (with high abundance of levoglucosan and lignin) with primary CC (with high abundance of aCH) aerosols by high positive loadings of , representing levoglucosan fragmentation (Schneider et al., 2006), and (Fig. S6), representing lignin fragmentation (Tolbert and Ragauskas, 2017; Saito et al., 2005), and negative loadings of fragments, attributed to the aCH group (Faber et al., 2017). In addition, this PC has high positive loadings of C2H3O+, CHO+ mass fragments, and high negative loadings CO+ and (Fig. 3), differentiating between the COOH group and other oxygenated FGs such as aCOH (Faber et al., 2017). The primary CC aerosols have the lowest PC2 scores due to high aCH content. Their PC2 scores increase with aging (Fig. 4a), indicating production of CHO+ and C2H3O+ fragments (non-acid oxygenated FGs, such as the naCO and the aCOH groups) and decrease slightly before the end of aging probably due to the production of (the COOH group) outweighing other oxygenated fragments. On the other hand, the primary WB aerosols have the highest PC2 scores (Fig. 4a) due to the high abundance of aCOH, levoglucosan, and lignin. The PC2 scores reduce drastically with aging for WB aerosols, especially when the hydroxyl radical is used, suggesting the formation of the COOH group and degradation of levoglucosan and lignin (Fig. 4a). PC2 scores are higher for WB and CC samples aged with the nitrate radical compared to those aged with the hydroxyl radical (Fig. 4a) due to the lower concentration of the fragment ion (Figs. 5 and S7).
The first two principal components, which together explain 84 % of total variance, are able to separate aerosols according to their oxidation state (PC1) and their source (PC2) and show that the trajectories of CC and WB OA start to converge, especially when aged with the hydroxyl radical (Fig. 4a). This observation implies that the spectral differences between samples of the same or different categories decrease with aging despite the higher oxidation state (contribution to PC1) of the aged WB compared to the aged CC aerosols. The primary WB aerosols on PC1–PC2 biplot (Fig. 4a) are located close to biomass burning OA (BBOA), factors obtained by Aiken et al. (2009) and Elser et al. (2016), highlighting their chemical similarity. The same is observed for CC aerosols with coal combustion OA (CCOA) and hydrocarbon-like OA (HOA) factors. The OH-aged aerosols are, however, more similar to the semi-volatile oxygenated OA (SV-OOA) factor, representing less oxygenated OA (Fig. 4a), and have considerably lower PC1 compared to the aged OA (OOA) factor by Aiken et al. (2009), which represents aged SOA (i.e., more aged than SV-OOA; not in the range of Fig. 4). The location of the samples in the f44–f43 plot (far from the triangle vertex; Fig. 5) also suggests a moderate extent of oxidation for the aged WB and CC samples.
The third PC, which explains 7 % of the variance, mainly separates the aged aerosols based on the type of oxidant used and has high negative loading of C2H3O+ and positive loadings of the and fragments (Fig. 3). PC3 scores have the highest values for the primary WB aerosols due to the abundance of levoglucosan and decrease with aging (Fig. 4b) due to the degradation of levoglucosan and the generation of the C2H3O+ fragment (Fig. 5). PC3 scores are lower for the primary CC aerosols due to the absence of levoglucosan and decrease further with aging due to the generation of the C2H3O+ fragment. For both sources, the aerosols aged with the nitrate radical have considerably lower PC3 scores (Fig. 4b) due to the high relative abundance of the C2H3O+ fragment (Figs. 5 and S7). The aged CC aerosols with a high abundance of naCO also have relatively low PC3 scores (Fig. S8b), suggesting a higher C2H3O+ concentration for those samples (also observed from Fig. 5). This observation suggests that the species formed during aging with the nitrate radical and the naCO group produce higher concentrations of the C2H3O+ fragment.
The PCA analysis shows that both aerosol source (WB and CC) and type (primary and aged with different oxidants) are responsible for variability in the AMS mass spectra (similar to the MIR spectra). We also found that the primary WB and CC aerosols have similar mass spectra to the BBOA and HOA factors, respectively, and OH-aged OAs of both sources are similar to the SV-OOA factor. Furthermore, the spectral variations are consistent with our functional group analysis via FTIR, suggesting that the AMS mass spectra maintain some functional group and source class information even after aging and in spite of the extensive fragmentation (discussed further by Yazdani et al., 2021a). However, even at the moderate levels of aging of this work, a part of this information only exists in higher PCs, which explain the lower variance in the data (e.g., PC2 explains 12 % of the variance across source classes and oxidative aging studied in this work and distinguishes OH-aged CC and NO3-aged WB). These findings are consistent with past reports suggesting that AMS is most sensitive to aging (Jimenez et al., 2009) and underscores the challenges in identifying source classes in highly aged atmospheric OA using AMS.
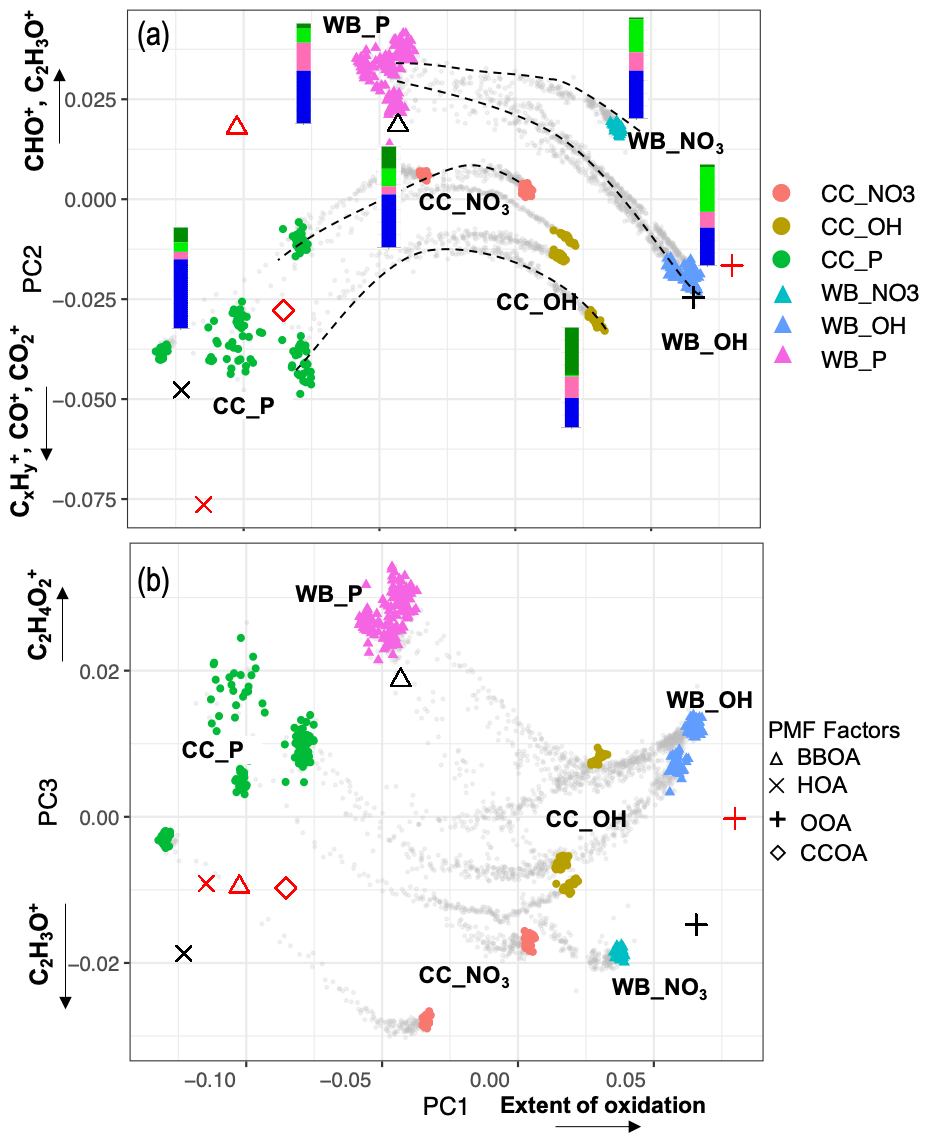
Figure 4Biplots of PC2–PC1 (a), and PC3–PC1 (b) scores. The AMS measurements corresponding to filter sampling periods are color-coded by category. The AMS measurements out of filter sampling periods are illustrated by gray dots and some oxidation trajectories are indicated by dashed curves. AMS BBOA, CCOA, HOA, and SV-OOA factors from Elser et al. (2016) (red) Aiken et al. (2009) (black) are projected onto PCs for comparison. Average FG composition for each category estimated from the MIR spectra is shown beside the category with the same color scheme as Fig. 1.
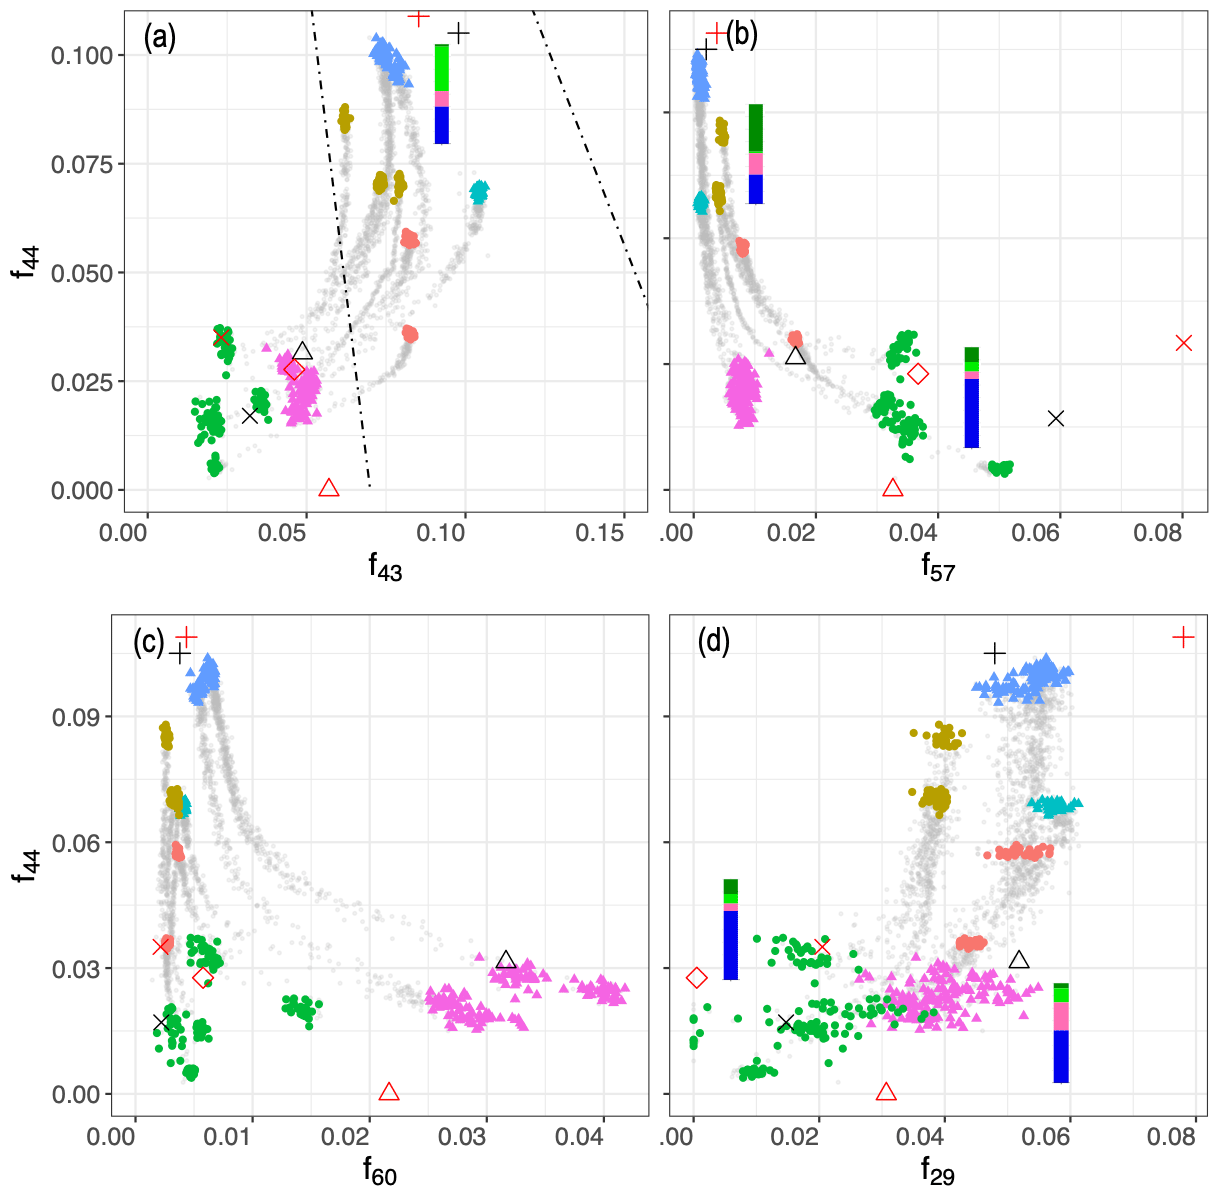
Figure 5Scatter plots of f44 () against f43 (), f57 (), f60 (), and f29 (). Dashed lines show the outline of the triangle (Ng et al., 2010), and the black shapes show the location of PMF factors (Elser et al., 2016; Aiken et al., 2009; Ulbrich et al., 2009). Average FG composition for each category estimated from the MIR spectra are shown beside the category. Figure 4 legend is applicable here.
3.6 Atmospheric biomass-burning-influenced aerosols
One of the main purposes of chamber experiments is understanding the characteristics of biomass burning aerosols in the atmosphere. We present a simplified comparison of the MIR spectra of WB aerosols in the chamber with the mean spectra of atmospheric samples affected by burning and other sources. Although the nitrate radical exposures in the chamber experiments were comparable to those of atmospheric samples, no comparable RONO2 bands were observed in ambient samples. This observation implies that organonitrates potentially degrade later in the sequence of reactions due to thermal decomposition (Barnes et al., 1990; Kroll and Seinfeld, 2008) or due to hydrolysis in the particle phase (Day et al., 2010; Ng et al., 2017; Liu et al., 2012). As a result, the chamber WB aerosols aged with the nitrate radical were excluded from this comparison due to their very prominent RONO2 bands.
3.6.1 Mean spectra
The atmospheric samples were divided into four subgroups: urban, rural, residential wood burning, and wildfire as described in Sect. 2.4. The individual spectra were baseline-corrected and blank-subtracted and then were normalized (Euclidean norm) based on their absorbances in the 1300–4000 cm−1 range. This procedure allowed us to make the spectra with different absorbance magnitudes (i.e., different aerosol mass concentrations) comparable. Thereafter, a single mean spectrum was calculated for each subgroup and used as its average representation. These spectra were compared to those of fresh and aged WB OAs in the chamber. Since major inorganic compounds of fine aerosols (ammonium, sulfate, and nitrate) are also IR-active and their absorbances overlap with those of organic FGs (especially aCOH), the analysis of organic FGs in ambient samples is not always straightforward. To mitigate this problem, ammonium absorbances were subtracted from the mean spectra to obtain the pure contribution of organic compounds.
As can be seen from Fig. 6a, the mean spectrum of rural samples has strong absorptions in the ammonium (doublets at 3200 and 3050 cm−1), nitrate (1400 cm−1), and sulfate (620 cm−1) regions, while the peaks attributed to organic compounds are relatively weak (e.g., very weak aCH and carbonyl CO peaks and indistinguishable aCOH absorption due to strong inorganic absorptions; Fig. 6a). The urban mean spectrum also has strong ammonium and sulfate absorptions, suggesting the abundance of inorganic compounds in urban sites. The organic signatures in the urban spectrum, however, are slightly stronger than those of rural sites with the clear presence of broad carboxylic acid absorption (Fig. 6b). Neither rural nor urban mean spectra are similar to those of chamber WB spectra.
The mean spectrum of residential wood burning samples has prominent absorptions of ammonium, sulfate, and also nitrate. Cold weather and high concentrations of nitric acid resulting from fossil fuel combustion and biomass burning are believed to be the primary reasons for the presence of ammonium nitrate on the filters in spite of being relatively volatile (Chow et al., 2005; Seinfeld and Pandis, 2016). This spectrum has considerably stronger signatures of organic compounds (Fig. 6b). Very sharp aCH peaks, strong acid COOH absorptions, and a visible aCOH absorption on the left shoulder of the ammonium peak can be seen in the mean spectrum of residential wood burning. Comparing this spectrum with that of aged WB in the chamber reveals their striking similarities. Both spectra have close inorganic-to-organic ratios that result in similar profiles in Fig. 6a. In addition, both spectra have visible alcohol and acid signatures, which are identified to be important in biomass burning aerosol composition (Corrigan et al., 2013b; Takahama et al., 2011; Russell et al., 2011; Hawkins and Russell, 2010). Nevertheless, the aCH absorption in the mean spectrum of residential wood burning is stronger than that in the mean spectrum of aged WB in the chamber. This observation might be attributed to the long-chain hydrocarbons existing in the cuticle wax of vegetation detritus that is absent in these chamber WB experiments (Hawkins and Russell, 2010). The spectral comparison of residential wood burning aerosols and fresh WB aerosols in the chamber shows that fresh WB lacks inorganics compared to residential wood burning. Moreover, the relative abundance of aCOH is significantly higher in WB aerosol, indicating the residential wood burning samples are aged to some degree.
In addition to FG identification, we can discuss the presence of specific marker compounds. A weak signature of lignin C=C (at 1515 cm−1) can be observed in the mean spectrum of residential wood burning (Fig. 6a). In addition, weak levoglucosan absorbances are visible in some residential spectra. Both mentioned signatures in burning-influenced atmospheric samples are stronger than that of aged chamber WB and weaker than that of fresh chamber WB aerosols, suggesting that most of these atmospheric samples have, on average, experienced aging within the range explored by our chamber experiments.
The mean spectrum of wildfire samples is also very similar to that of residential wood burning except having slightly weaker aCH absorbances. Consequently, the strong COOH absorption and the visible lignin and levoglucosan signatures are also the characteristics of the wildfire mean spectrum as they were for that of residential wood burning. The mean spectra of aged chamber WB, residential wood burning, and also wildfire aerosols (Fig. 6b) are similar to the biomass burning PMF factor obtained by Hawkins and Russell (2010).
Finally, the samples affected by wildfire are the only atmospheric samples in the IMPROVE network (2011 and 2013) that have visible (but weak) PAH signatures, possibly leading to a higher PAH-related toxicity. The areal density of atmospheric and chamber aerosols collected on PTFE filters is comparable in this work (approximately 10 µg cm−2). As a result, the low absorbance of PAHs in the atmospheric samples implies that most of these compounds are degraded in the atmosphere or during the filter transportation and storage.
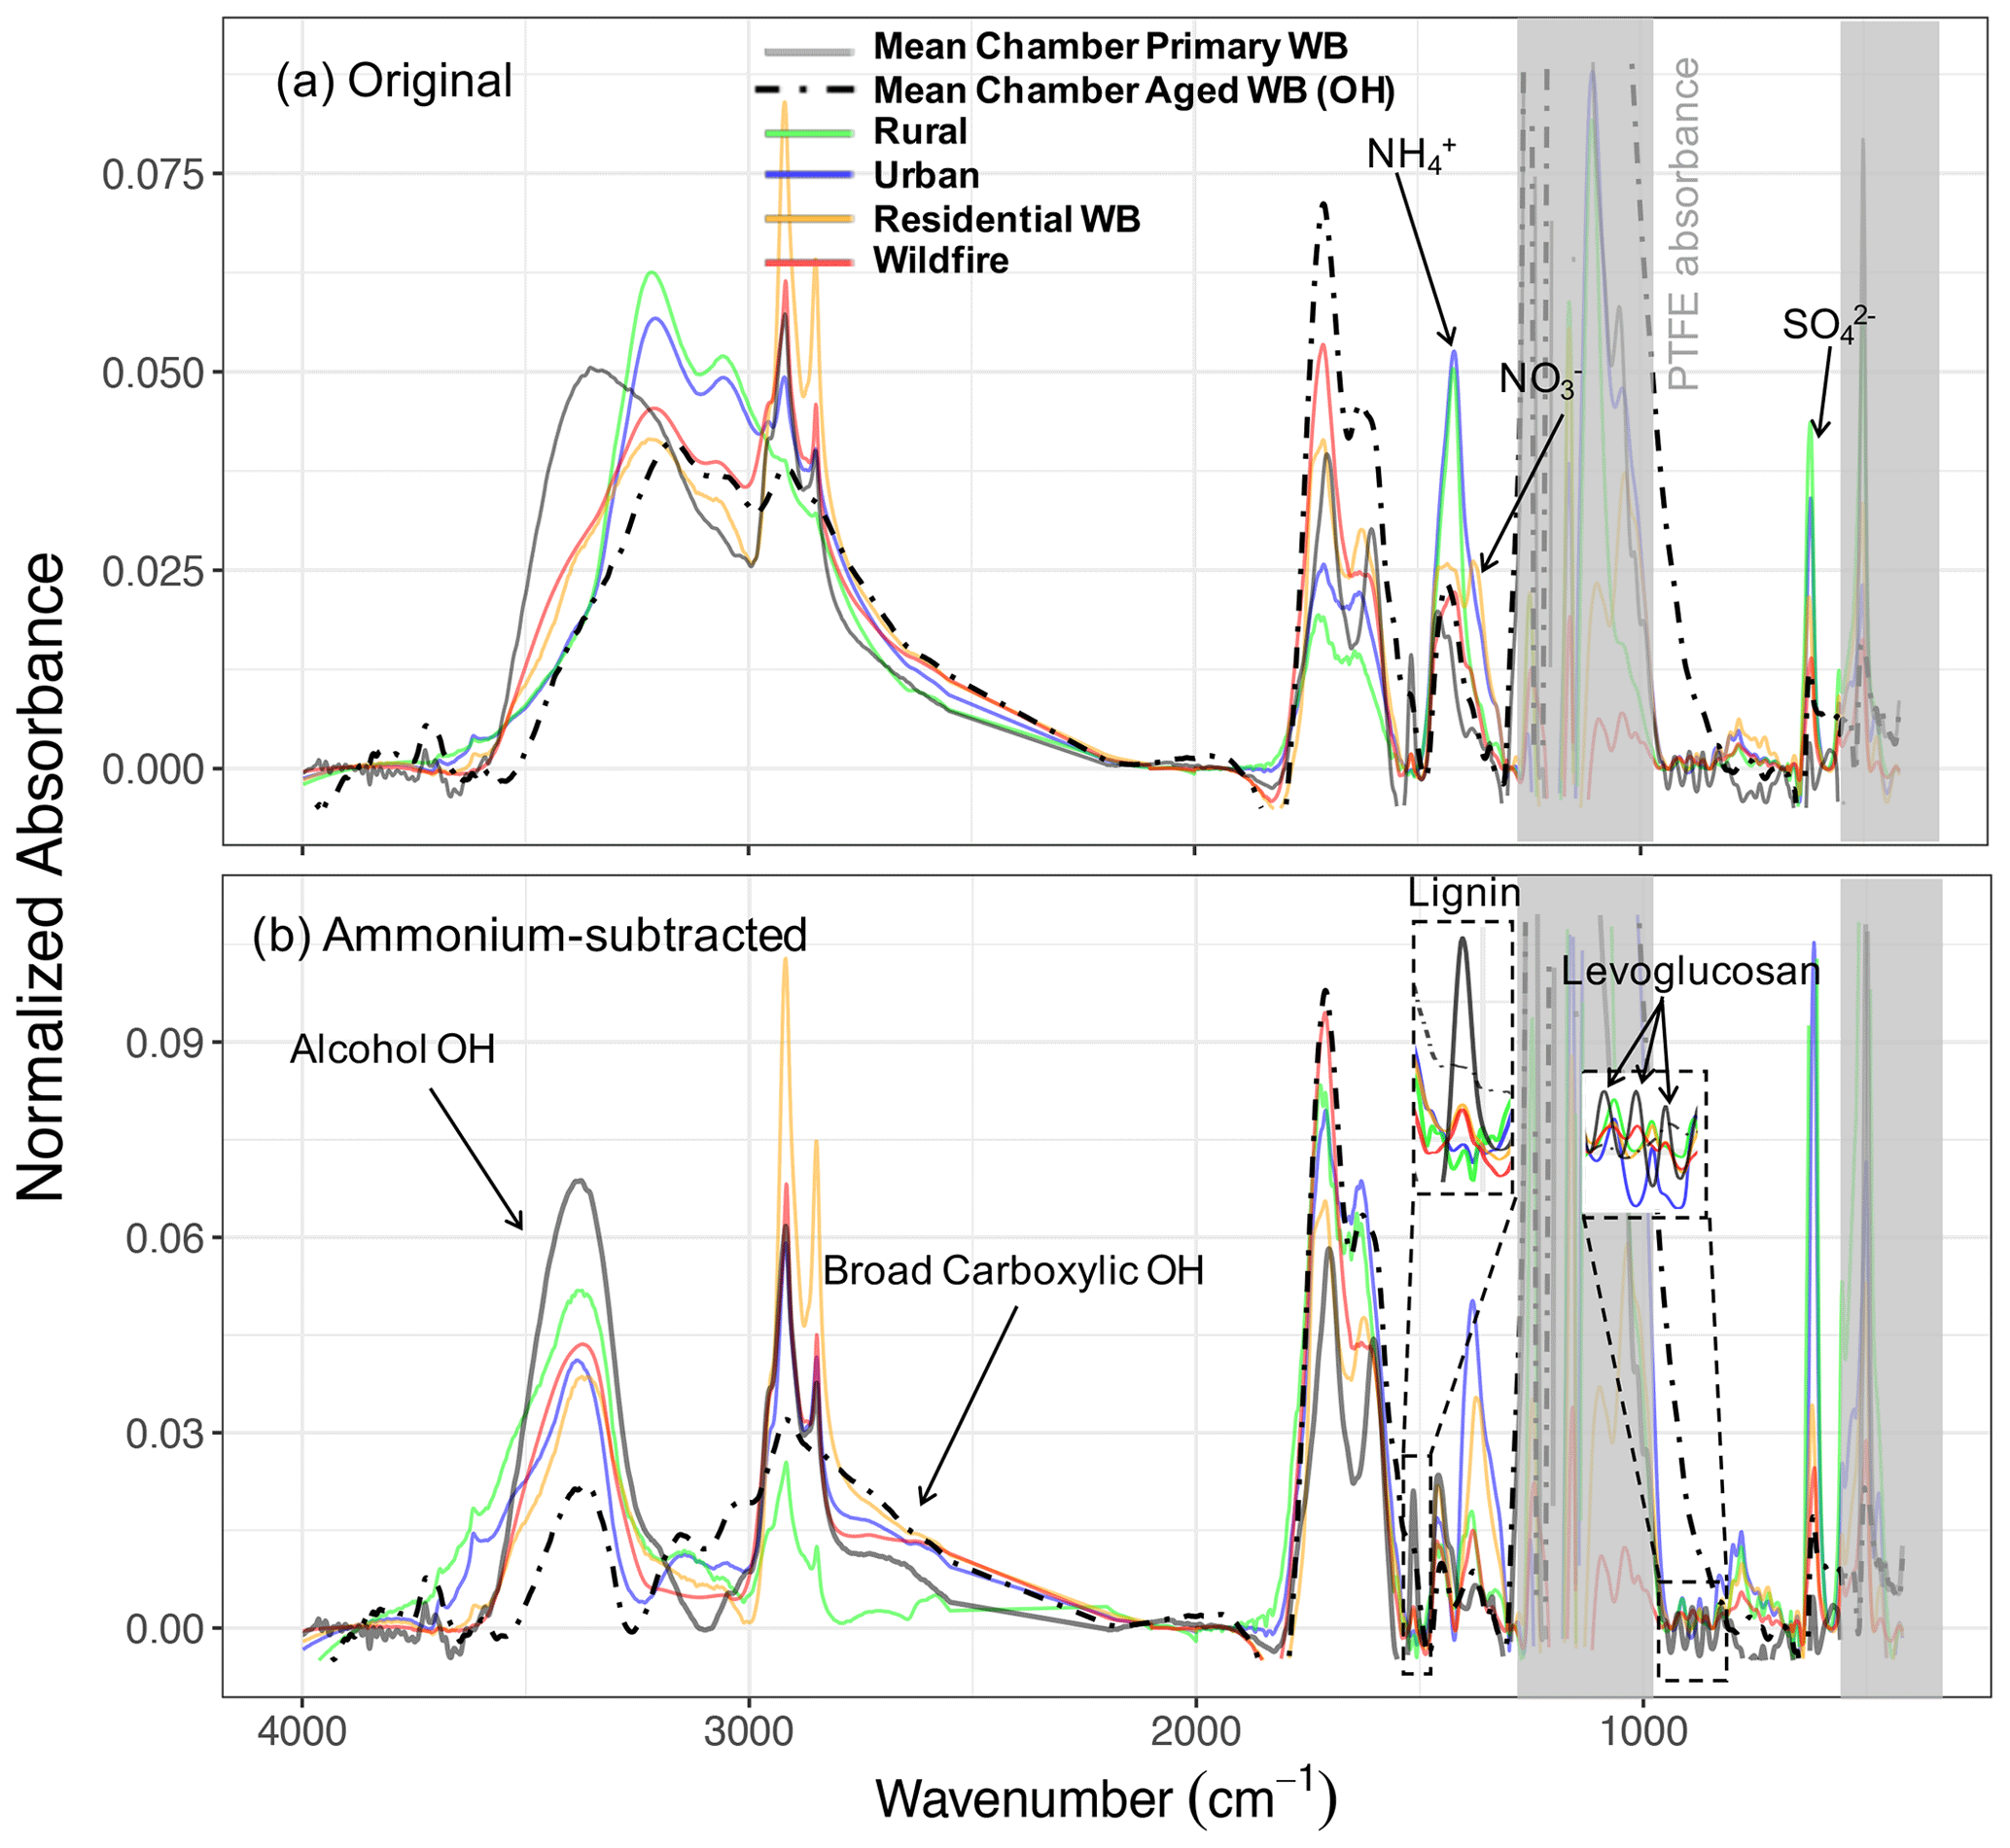
Figure 6Normalized (Euclidean norm) mean spectra of ambient aerosols (rural, urban, residential wood burning, and wildfire) and chamber WB aerosols before (a) and after (b) subtraction of ammonium profile. Inorganic nitrate and sulfate absorbances still exist in panel (b).
3.6.2 OM:OC ratios
The OM:OC ratio is an important parameter often reported for aerosols collected at monitoring networks (Boris et al., 2019; Ruthenburg et al., 2014; Bürki et al., 2020; Yazdani et al., 2020; Hand et al., 2019; Reggente et al., 2019a). We compared OM:OC ratios from these chamber samples to burning samples identified by Bürki et al. (2020). They used a probabilistic framework on MIR spectra, which resulted in OC estimates that were consistent with those from collocated TOR measurements. The average OM:OC estimates for samples influenced by wildfires and residential wood burning were reported to be 1.65 and 1.45, respectively (Bürki et al., 2020), compared to 1.65 and 2 (AMS and MIR spectroscopy obtained close values) for primary and aged WB aerosols in this work. The average OM:OC estimates for these atmospheric burning-influenced samples are clearly closer to that of primary WB aerosols in chamber. Although some biases may exist between the two methods due to different estimation methods and calibration standards (Reggente et al., 2019a), this observation is believed to be mainly due to two reasons. First, identified burning-influenced samples in the atmosphere are not as oxidized as the aged WB aerosols in the chamber are. Second, sharp aCH peaks, attributed to cuticle wax, are observed in the MIR spectra of ambient fire-influenced samples (Hawkins and Russell, 2010) while being absent in that of chamber WB aerosols (without bark). The high abundance of the aCH group might lower the OM:OC estimate of atmospheric burning-influenced samples.
3.6.3 Identification of burning-influenced samples
Biomass burning aerosol composition and its molecular markers continually evolve with aging as discussed in previous sections. This constant evolution poses a substantial challenge to identify the burning-influenced aerosols in the atmosphere and to quantify the contribution of biomass burning OM to the PM mass. In this section, we assess two different approaches for the identification of atmospheric burning-influenced aerosols using MIR spectroscopy.
While each FG is not a marker for any specific source, their proportions could possibly be informative when used with multivariate methods. Cluster analysis by Bürki et al. (2020), for example, identified 45 burning-influenced samples (in 3050 samples) based on their spectral similarity (i.e., FG proportions and organic-to-inorganic ratio), which were supported, to some extent, by matching their collection time and location with the known burning events (e.g., Rim Fire in California in 2013 and residential wood burning in Phoenix in winter). Nevertheless, the signatures of parent compounds (e.g., lignin) and specific biomass burning markers (e.g., levoglucosan) – direct identifiers of burning – were not considered in their approach. This is because the extended baseline correction and filter subtraction introduced in this work are necessary for identifying these signatures. Moreover, the contribution of these signatures to total variations in the MIR spectra is too minor to be featured for spectral separation when selecting only a limited number of clusters.
In contrast to FG proportions, tracers are less ambiguous for source identification, but they eventually degrade with aging as discussed in Sect. 3.2. In the tracer approach developed in this work, samples with lignin absorbances above a certain threshold were labeled burning-influenced (absorbances >0.0006 in Euclidean normalized spectra to account for samples with a non-negligible contribution of lignin and absorbances >0.0004 in non-normalized spectra to discard samples with low mass loadings and noisy spectra). Samples with levoglucosan mass (estimated from MIR spectroscopy) contributing more than 5 % to total OM (1.8 times the collocated TOR OC estimates) were also labeled burning-influenced (ranging from 5 % to 15 % of total OM). We identified in total 173 samples (out of 3050 samples) with the tracer approach, which included the majority of the previously identified burning sample using cluster analysis (38 out of 45) (Fig. 7), suggesting that most of the atmospheric samples with a MIR spectrum similar to that of burning aerosols have also visible tracer molecule signatures. There were, however, 135 samples with levoglucosan and/or lignin signatures above the defined threshold that were not identified by the cluster analysis. The relatively high number of false negatives (i.e., missing burning label when levoglucosan and lignin peaks were present) in the cluster analysis suggests that uncertainties can be high with this approach. There were also seven samples with negligible levoglucosan and lignin signatures (not identified by the tracer method) that were identified to be burning-influenced by the cluster analysis. The latter discrepancy might exist due to misidentification by the cluster analysis or because the discussed signatures diminish with extensive aging and cannot be detected by the tracer method. The same could be true for cluster 10 of Bürki et al. (2020), which was proposed to be possibly influenced by burning, but only 3 out of 28 samples have identifiable levoglucosan or lignin signatures.
The atmospheric burning-influenced samples identified by both methods have a high relative abundance of OM. OM constitutes more than 50 % of fine PM mass for the majority of these sample even at low PM loadings as observed in Fig. 7. However, a high OM:PM ratio cannot always be a reliable indicator of burning alone since it is not unique to biomass burning and there are many non-burning samples with a high OM:PM ratio (Fig. 7). Potassium is considered a good inorganic tracer of biomass burning (Sullivan et al., 2011). Bürki et al. (2020) showed a higher-than-average K:PM2.5 ratio for the residential wood burning samples identified in the IMPROVE network (2011 and 2013). However, as also mentioned by Sullivan et al. (2011), high K is not observed in wildfire samples. In addition, there are some non-biomass-burning sources of potassium more likely to be found in urban areas such as incinerators and fly ash. The burning-influenced samples identified by the tracer method in this work have higher concentrations of potassium compared to the majority of other atmospheric samples (Fig. S15). However, there are also some samples with relatively high K concentrations that are not impacted by burning and are most probably affected by mineral dust due to having a prominent peak above 3500 cm−1 (Bürki et al., 2020).
In summary, the tracer method appears to be able to identify the atmospheric burning-influenced samples including the majority of those identified by the cluster analysis. However, a definitive identification of burning periods is needed to better assess this new approach. Quantifying the contribution of biomass burning OM (fresh and aged) to the PM mass is another remaining challenge that needs to be addressed in the future work.

Figure 7Scatter plot comparing total PM2.5 and OM mass in atmospheric samples. Red circles indicate residential wood burning and wildfire samples identified by cluster analysis (Bürki et al., 2020). Green crosses show burning samples identified based on lignin and levoglucosan signatures. Black circles indicate the existing atmospheric samples in the IMPROVE network (2011 and 2013; approximately 3050 samples). The dash-dotted lines delineate the range of OM mass fractions for samples designated as burning-influenced (the slope of 0.5 is arbitrarily chosen to guide the eye). OM was estimated by multiplying OC by 1.8 (assuming an average OM:OC ratio of 1.8). Refer to Fig. S14 for a more detailed classification.
In this work, we used MIR spectroscopy and AMS to obtain complementary information about WB and CC aerosols. MIR spectroscopy provides a detailed characterization of functional groups and implies that primary aerosols and their parent compounds have similar chemical compositions. This similarity diminishes after aging with the appearance of the peaks attributed to oxygenated species and disappearance of the peaks attributed to the parent compounds. We observed distinct FG compositions for OA based on the emission source (WB and CC), aerosol type (primary and aged), oxidant type, and NOx concentration. The observed FG composition is informative about the dominant oxidation pathways of WB and CC VOCs and can be used to verify and improve the results of the chemically resolved SOA formation models.
Dimensionality reduction of the AMS mass spectra reveals similarities between the AMS mass spectra of the primary CC OA and HOA factor, the primary WB OA and BBOA factor, and the CC and WB OA aged with OH and SV-OOA factor. In addition, this analysis suggests that both aerosol source and type are major drivers of variability in the AMS mass spectra. These variations are also consistent with our FG analysis, implying that AMS mass spectra maintain some functional group information in spite of the extensive fragmentation. However, variations due to the change in FG composition occasionally constitute a small fraction of total variation (stored in higher PCs).
We also found that the MIR spectra of WB aerosols in the environmental chamber are similar to those of ambient samples affected by wildfires and residential wood burning. The high abundance of organics (especially acids) and the existence of peaks attributed to lignin and levoglucosan are the main aspects of this similarity. This result helped us better interpret the MIR spectra of atmospheric samples and was used to aid identification of ambient burning-influenced aerosols.
Finally, it was found that PAHs and aromatics are quantifiable in chamber aerosols using MIR spectroscopy but are not visible in the spectra of atmospheric samples except for a few burning-influenced instances. Considering the fact that the areal density of aerosols collected on PTFE filters is similar in the atmospheric and chamber samples, this observation suggests that either the chamber conditions (e.g., fuel, aging, VOC and OA concentrations) are more conductive to PAHs or most aromatics and PAHs are degraded in the atmosphere or during the transportation and storage.
Codes and data for baseline correction and PCA analysis are available at https://doi.org/10.5281/zenodo.4882967 (Yazdani et al., 2021b).
The supplement related to this article is available online at: https://doi.org/10.5194/acp-21-10273-2021-supplement.
IEH, ST, and AY conceived of the project and manuscript. AB and IEH performed the chamber experiments. AB provided AMS spectra. ND prepared and assembled the filter sampling setup and took the FT-IR spectra. AMD provided atomized compounds and ambient sample spectra. AY wrote the code for data analysis and postprocessing, performed the data analysis, prepared laboratory standards and analyzed samples, and wrote the manuscript. ST edited the manuscript and provided regular feedback on the analysis. IEH, ASHP, AB, AMD, and ND provided input on the analysis and the further editing of the manuscript. ST and IEH provided overall supervision of the project.
The authors declare that they have no conflict of interest.
This research has been supported by the Swiss National Foundation (grant nos. 200021_172923 and 200021_169787) and the IMPROVE program (National Park Service cooperative agreement P11AC91045).
This paper was edited by Joel Thornton and reviewed by two anonymous referees.
Abdi, H. and Williams, L. J.: Principal Component Analysis, Wiley Interdiscip. Rev. Comput. Stat., 2, 433–459, https://doi.org/10.1002/wics.101, 2010. a
Aiken, A. C., DeCarlo, P. F., Kroll, J. H., Worsnop, D. R., Huffman, J. A., Docherty, K. S., Ulbrich, I. M., Mohr, C., Kimmel, J. R., Sueper, D., Sun, Y., Zhang, Q., Trimborn, A., Northway, M., Ziemann, P. J., Canagaratna, M. R., Onasch, T. B., Alfarra, M. R., Prevot, A. S. H., Dommen, J., Duplissy, J., Metzger, A., Baltensperger, U., and Jimenez, J. L.: O/C and OM/OC Ratios of Primary, Secondary, and Ambient Organic Aerosols with High-Resolution Time-of-Flight Aerosol Mass Spectrometry, Environ. Sci. Technol., 42, 4478–4485, https://doi.org/10.1021/es703009q, 2008. a
Aiken, A. C., Salcedo, D., Cubison, M. J., Huffman, J. A., DeCarlo, P. F., Ulbrich, I. M., Docherty, K. S., Sueper, D., Kimmel, J. R., Worsnop, D. R., Trimborn, A., Northway, M., Stone, E. A., Schauer, J. J., Volkamer, R. M., Fortner, E., de Foy, B., Wang, J., Laskin, A., Shutthanandan, V., Zheng, J., Zhang, R., Gaffney, J., Marley, N. A., Paredes-Miranda, G., Arnott, W. P., Molina, L. T., Sosa, G., and Jimenez, J. L.: Mexico City aerosol analysis during MILAGRO using high resolution aerosol mass spectrometry at the urban supersite (T0) – Part 1: Fine particle composition and organic source apportionment, Atmos. Chem. Phys., 9, 6633–6653, https://doi.org/10.5194/acp-9-6633-2009, 2009. a, b, c, d, e
Alves, C., Gonçalves, C., Fernandes, A. P., Tarelho, L., and Pio, C.: Fireplace and Woodstove Fine Particle Emissions from Combustion of Western Mediterranean Wood Types, Atmos. Res., 101, 692–700, https://doi.org/10.1016/j.atmosres.2011.04.015, 2011. a
Ayres, B. R., Allen, H. M., Draper, D. C., Brown, S. S., Wild, R. J., Jimenez, J. L., Day, D. A., Campuzano-Jost, P., Hu, W., de Gouw, J., Koss, A., Cohen, R. C., Duffey, K. C., Romer, P., Baumann, K., Edgerton, E., Takahama, S., Thornton, J. A., Lee, B. H., Lopez-Hilfiker, F. D., Mohr, C., Wennberg, P. O., Nguyen, T. B., Teng, A., Goldstein, A. H., Olson, K., and Fry, J. L.: Organic nitrate aerosol formation via NO biogenic volatile organic compounds in the southeastern United States, Atmos. Chem. Phys., 15, 13377–13392, https://doi.org/10.5194/acp-15-13377-2015, 2015. a
Bäfver, L. S., Leckner, B., Tullin, C., and Berntsen, M.: Particle Emissions from Pellets Stoves and Modern and Old-Type Wood Stoves, Biomass Bioenergy, 35, 3648–3655, https://doi.org/10.1016/j.biombioe.2011.05.027, 2011. a
Barmet, P., Dommen, J., DeCarlo, P. F., Tritscher, T., Praplan, A. P., Platt, S. M., Prévôt, A. S. H., Donahue, N. M., and Baltensperger, U.: OH clock determination by proton transfer reaction mass spectrometry at an environmental chamber, Atmos. Meas. Tech., 5, 647–656, https://doi.org/10.5194/amt-5-647-2012, 2012. a
Barnes, I., Bastian, V., Becker, K. H., and Tong, Z.: Kinetics and Products of the Reactions of Nitrate Radical with Monoalkenes, Dialkenes, and Monoterpenes, J. Phys. Chem., 94, 2413–2419, https://doi.org/10.1021/j100369a041, 1990. a
Beekmann, M., Prévôt, A. S. H., Drewnick, F., Sciare, J., Pandis, S. N., Denier van der Gon, H. A. C., Crippa, M., Freutel, F., Poulain, L., Ghersi, V., Rodriguez, E., Beirle, S., Zotter, P., von der Weiden-Reinmüller, S.-L., Bressi, M., Fountoukis, C., Petetin, H., Szidat, S., Schneider, J., Rosso, A., El Haddad, I., Megaritis, A., Zhang, Q. J., Michoud, V., Slowik, J. G., Moukhtar, S., Kolmonen, P., Stohl, A., Eckhardt, S., Borbon, A., Gros, V., Marchand, N., Jaffrezo, J. L., Schwarzenboeck, A., Colomb, A., Wiedensohler, A., Borrmann, S., Lawrence, M., Baklanov, A., and Baltensperger, U.: In situ, satellite measurement and model evidence on the dominant regional contribution to fine particulate matter levels in the Paris megacity, Atmos. Chem. Phys., 15, 9577–9591, https://doi.org/10.5194/acp-15-9577-2015, 2015. a
Bertrand, A., Stefenelli, G., Bruns, E. A., Pieber, S. M., Temime-Roussel, B., Slowik, J. G., Prévôt, A. S. H., Wortham, H., El Haddad, I., and Marchand, N.: Primary Emissions and Secondary Aerosol Production Potential from Woodstoves for Residential Heating: Influence of the Stove Technology and Combustion Efficiency, Atmos. Environ., 169, 65–79, https://doi.org/10.1016/j.atmosenv.2017.09.005, 2017. a, b, c
Bertrand, A., Stefenelli, G., Jen, C. N., Pieber, S. M., Bruns, E. A., Ni, H., Temime-Roussel, B., Slowik, J. G., Goldstein, A. H., El Haddad, I., Baltensperger, U., Prévôt, A. S. H., Wortham, H., and Marchand, N.: Evolution of the chemical fingerprint of biomass burning organic aerosol during aging, Atmos. Chem. Phys., 18, 7607–7624, https://doi.org/10.5194/acp-18-7607-2018, 2018a. a, b, c
Bertrand, A., Stefenelli, G., Pieber, S. M., Bruns, E. A., Temime-Roussel, B., Slowik, J. G., Wortham, H., Prévôt, A. S. H., El Haddad, I., and Marchand, N.: Influence of the vapor wall loss on the degradation rate constants in chamber experiments of levoglucosan and other biomass burning markers, Atmos. Chem. Phys., 18, 10915–10930, https://doi.org/10.5194/acp-18-10915-2018, 2018b. a
Bock, P. and Gierlinger, N.: Infrared and Raman Spectra of Lignin Substructures: Coniferyl Alcohol, Abietin, and Coniferyl Aldehyde, J. Raman Spectrosc., 50, 778–792, https://doi.org/10.1002/jrs.5588, 2019. a
Boeriu, C. G., Bravo, D., Gosselink, R. J. A., and van Dam, J. E. G.: Characterisation of Structure-Dependent Functional Properties of Lignin with Infrared Spectroscopy, Ind. Crops Prod., 20, 205–218, https://doi.org/10.1016/j.indcrop.2004.04.022, 2004. a
Boris, A. J., Takahama, S., Weakley, A. T., Debus, B. M., Fredrickson, C. D., Esparza-Sanchez, M., Burki, C., Reggente, M., Shaw, S. L., Edgerton, E. S., and Dillner, A. M.: Quantifying organic matter and functional groups in particulate matter filter samples from the southeastern United States – Part 1: Methods, Atmos. Meas. Tech., 12, 5391–5415, https://doi.org/10.5194/amt-12-5391-2019, 2019. a, b, c
Bruns, E. A., Krapf, M., Orasche, J., Huang, Y., Zimmermann, R., Drinovec, L., Močnik, G., El-Haddad, I., Slowik, J. G., Dommen, J., Baltensperger, U., and Prévôt, A. S. H.: Characterization of primary and secondary wood combustion products generated under different burner loads, Atmos. Chem. Phys., 15, 2825–2841, https://doi.org/10.5194/acp-15-2825-2015, 2015. a, b, c
Bruns, E. A., El Haddad, I., Slowik, J. G., Kilic, D., Klein, F., Baltensperger, U., and Prévôt, A. S. H.: Identification of Significant Precursor Gases of Secondary Organic Aerosols from Residential Wood Combustion, Sci. Rep., 6, 1–9, https://doi.org/10.1038/srep27881, 2016. a
Bürki, C., Reggente, M., Dillner, A. M., Hand, J. L., Shaw, S. L., and Takahama, S.: Analysis of functional groups in atmospheric aerosols by infrared spectroscopy: method development for probabilistic modeling of organic carbon and organic matter concentrations, Atmos. Meas. Tech., 13, 1517–1538, https://doi.org/10.5194/amt-13-1517-2020, 2020. a, b, c, d, e, f, g, h, i, j, k
Burnett, R., Chen, H., Szyszkowicz, M., Fann, N., Hubbell, B., Pope, C. A., Apte, J. S., Brauer, M., Cohen, A., Weichenthal, S., Coggins, J., Di, Q., Brunekreef, B., Frostad, J., Lim, S. S., Kan, H., Walker, K. D., Thurston, G. D., Hayes, R. B., Lim, C. C., Turner, M. C., Jerrett, M., Krewski, D., Gapstur, S. M., Diver, W. R., Ostro, B., Goldberg, D., Crouse, D. L., Martin, R. V., Peters, P., Pinault, L., Tjepkema, M., van Donkelaar, A., Villeneuve, P. J., Miller, A. B., Yin, P., Zhou, M., Wang, L., Janssen, N. A. H., Marra, M., Atkinson, R. W., Tsang, H., Thach, T. Q., Cannon, J. B., Allen, R. T., Hart, J. E., Laden, F., Cesaroni, G., Forastiere, F., Weinmayr, G., Jaensch, A., Nagel, G., Concin, H., and Spadaro, J. V.: Global Estimates of Mortality Associated with Long-Term Exposure to Outdoor Fine Particulate Matter, P. Natl. Acad. Sci. USA, 115, 9592–9597, https://doi.org/10.1073/pnas.1803222115, 2018. a, b
Canagaratna, M. R., Jayne, J. T., Jimenez, J. L., Allan, J. D., Alfarra, M. R., Zhang, Q., Onasch, T. B., Drewnick, F., Coe, H., Middlebrook, A., Delia, A., Williams, L. R., Trimborn, A. M., Northway, M. J., DeCarlo, P. F., Kolb, C. E., Davidovits, P., and Worsnop, D. R.: Chemical and Microphysical Characterization of Ambient Aerosols with the Aerodyne Aerosol Mass Spectrometer, Mass Spectrom. Rev., 26, 185–222, https://doi.org/10.1002/mas.20115, 2007. a, b, c, d, e, f
Canagaratna, M. R., Jimenez, J. L., Kroll, J. H., Chen, Q., Kessler, S. H., Massoli, P., Hildebrandt Ruiz, L., Fortner, E., Williams, L. R., Wilson, K. R., Surratt, J. D., Donahue, N. M., Jayne, J. T., and Worsnop, D. R.: Elemental Ratio Measurements of Organic Compounds Using Aerosol Mass Spectrometry: Characterization, Improved Calibration, and Implications, Atmos. Chem. Phys., 15, 253–272, https://doi.org/10.5194/acp-15-253-2015, 2015. a
Centrone, A., Brambilla, L., Renouard, T., Gherghel, L., Mathis, C., Müllen, K., and Zerbi, G.: Structure of New Carbonaceous Materials: The Role of Vibrational Spectroscopy, Carbon, 43, 1593–1609, https://doi.org/10.1016/j.carbon.2005.01.040, 2005. a
Chen, Q., Ikemori, F., Higo, H., Asakawa, D., and Mochida, M.: Chemical Structural Characteristics of HULIS and Other Fractionated Organic Matter in Urban Aerosols: Results from Mass Spectral and FT-IR Analysis, Environ. Sci. Technol., 50, 1721–1730, https://doi.org/10.1021/acs.est.5b05277, 2016. a
Chhabra, P. S., Ng, N. L., Canagaratna, M. R., Corrigan, A. L., Russell, L. M., Worsnop, D. R., Flagan, R. C., and Seinfeld, J. H.: Elemental composition and oxidation of chamber organic aerosol, Atmos. Chem. Phys., 11, 8827–8845, https://doi.org/10.5194/acp-11-8827-2011, 2011a. a, b
Chhabra, P. S., Ng, N. L., Canagaratna, M. R., Corrigan, A. L., Russell, L. M., Worsnop, D. R., Flagan, R. C., and Seinfeld, J. H.: Elemental composition and oxidation of chamber organic aerosol, Atmos. Chem. Phys., 11, 8827–8845, https://doi.org/10.5194/acp-11-8827-2011, 2011. a, b
Chow, J. C., Watson, J. G., Lowenthal, D. H., and Magliano, K. L.: Loss of PM2.5 Nitrate from Filter Samples in Central California, J. Air Waste Manage., 55, 1158–1168, https://doi.org/10.1080/10473289.2005.10464704, 2005. a
Corrigan, A. L., Russell, L. M., Takahama, S., Äijälä, M., Ehn, M., Junninen, H., Rinne, J., Petäjä, T., Kulmala, M., Vogel, A. L., Hoffmann, T., Ebben, C. J., Geiger, F. M., Chhabra, P., Seinfeld, J. H., Worsnop, D. R., Song, W., Auld, J., and Williams, J.: Biogenic and biomass burning organic aerosol in a boreal forest at Hyytiälä, Finland, during HUMPPA-COPEC 2010, Atmos. Chem. Phys., 13, 12233–12256, https://doi.org/10.5194/acp-13-12233-2013, 2013a. a
Corrigan, A. L., Russell, L. M., Takahama, S., Äijälä, M., Ehn, M., Junninen, H., Rinne, J., Petäjä, T., Kulmala, M., Vogel, A. L., Hoffmann, T., Ebben, C. J., Geiger, F. M., Chhabra, P., Seinfeld, J. H., Worsnop, D. R., Song, W., Auld, J., and Williams, J.: Biogenic and biomass burning organic aerosol in a boreal forest at Hyytiälä, Finland, during HUMPPA-COPEC 2010, Atmos. Chem. Phys., 13, 12233–12256, https://doi.org/10.5194/acp-13-12233-2013, 2013b. a
Coury, C. and Dillner, A. M.: A Method to Quantify Organic Functional Groups and Inorganic Compounds in Ambient Aerosols Using Attenuated Total Reflectance FTIR Spectroscopy and Multivariate Chemometric Techniques, Atmos. Environ., 42, 5923–5932, https://doi.org/10.1016/j.atmosenv.2008.03.026, 2008. a
Day, D. A., Liu, S., Russell, L. M., and Ziemann, P. J.: Organonitrate Group Concentrations in Submicron Particles with High Nitrate and Organic Fractions in Coastal Southern California, Atmos. Environ., 44, 1970–1979, https://doi.org/10.1016/j.atmosenv.2010.02.045, 2010. a, b, c
Debus, B., Takahama, S., Weakley, A. T., Seibert, K., and Dillner, A. M.: Long-Term Strategy for Assessing Carbonaceous Particulate Matter Concentrations from Multiple Fourier Transform Infrared (FT-IR) Instruments: Influence of Spectral Dissimilarities on Multivariate Calibration Performance, Appl. Spectrosc., 73, 271–283, 2019a. a
Debus, B., Takahama, S., Weakley, A. T., Seibert, K., and Dillner, A. M.: Long-Term Strategy for Assessing Carbonaceous Particulate Matter Concentrations from Multiple Fourier Transform Infrared (FT-IR) Instruments: Influence of Spectral Dissimilarities on Multivariate Calibration Performance, Applied Spectroscopy, 73, 271–283, https://doi.org/10.1177/0003702818804574, 2019b. a
DeCarlo, P. F., Kimmel, J. R., Trimborn, A., Northway, M. J., Jayne, J. T., Aiken, A. C., Gonin, M., Fuhrer, K., Horvath, T., Docherty, K. S., Worsnop, D. R., and Jimenez, J. L.: Field-Deployable, High-Resolution, Time-of-Flight Aerosol Mass Spectrometer, Anal. Chem., 78, 8281–8289, https://doi.org/10.1021/ac061249n, 2006. a
DeCarlo, P. F., Dunlea, E. J., Kimmel, J. R., Aiken, A. C., Sueper, D., Crounse, J., Wennberg, P. O., Emmons, L., Shinozuka, Y., Clarke, A., Zhou, J., Tomlinson, J., Collins, D. R., Knapp, D., Weinheimer, A. J., Montzka, D. D., Campos, T., and Jimenez, J. L.: Fast airborne aerosol size and chemistry measurements above Mexico City and Central Mexico during the MILAGRO campaign, Atmos. Chem. Phys., 8, 4027–4048, https://doi.org/10.5194/acp-8-4027-2008, 2008. a
Derkacheva, O. and Sukhov, D.: Investigation of Lignins by FTIR Spectroscopy, Macromol. Symp., 265, 61–68, https://doi.org/10.1002/masy.200850507, 2008. a
Dillner, A. M. and Takahama, S.: Predicting ambient aerosol thermal-optical reflectance (TOR) measurements from infrared spectra: organic carbon, Atmos. Meas. Tech., 8, 1097–1109, https://doi.org/10.5194/amt-8-1097-2015, 2015. a
Duarte, R. M. B. O., Santos, E. B. H., Pio, C. A., and Duarte, A. C.: Comparison of Structural Features of Water-Soluble Organic Matter from Atmospheric Aerosols with Those of Aquatic Humic Substances, Atmos. Environ., 41, 8100–8113, https://doi.org/10.1016/j.atmosenv.2007.06.034, 2007. a
Elser, M., Huang, R.-J., Wolf, R., Slowik, J. G., Wang, Q., Canonaco, F., Li, G., Bozzetti, C., Daellenbach, K. R., Huang, Y., Zhang, R., Li, Z., Cao, J., Baltensperger, U., El-Haddad, I., and Prévôt, A. S. H.: New insights into PM2.5 chemical composition and sources in two major cities in China during extreme haze events using aerosol mass spectrometry, Atmos. Chem. Phys., 16, 3207–3225, https://doi.org/10.5194/acp-16-3207-2016, 2016. a, b, c, d
Faber, P., Drewnick, F., Bierl, R., and Borrmann, S.: Complementary Online Aerosol Mass Spectrometry and Offline FT-IR Spectroscopy Measurements: Prospects and Challenges for the Analysis of Anthropogenic Aerosol Particle Emissions, Atmos. Environ., 166, 92–98, https://doi.org/10.1016/j.atmosenv.2017.07.014, 2017. a, b, c, d, e, f, g, h, i
Frossard, A. A., Shaw, P. M., Russell, L. M., Kroll, J. H., Canagaratna, M. R., Worsnop, D. R., Quinn, P. K., and Bates, T. S.: Springtime Arctic Haze Contributions of Submicron Organic Particles from European and Asian Combustion Sources, J. Geophys. Res.-Atmos., 116, D05205, https://doi.org/10.1029/2010JD015178, 2011. a
Frossard, A. A., Russell, L. M., Massoli, P., Bates, T. S., and Quinn, P. K.: Side-by-Side Comparison of Four Techniques Explains the Apparent Differences in the Organic Composition of Generated and Ambient Marine Aerosol Particles, Aerosol Sci. Tech., 48, v–x, https://doi.org/10.1080/02786826.2013.879979, 2014. a, b, c
George, K. M., Ruthenburg, T. C., Smith, J., Yu, L., Zhang, Q., Anastasio, C., and Dillner, A. M.: FT-IR Quantification of the Carbonyl Functional Group in Aqueous-Phase Secondary Organic Aerosol from Phenols, Atmos. Environ., 100, 230–237, https://doi.org/10.1016/j.atmosenv.2014.11.011, 2015. a
Gilardoni, S., Liu, S., Takahama, S., Russell, L. M., Allan, J. D., Steinbrecher, R., Jimenez, J. L., De Carlo, P. F., Dunlea, E. J., and Baumgardner, D.: Characterization of organic ambient aerosol during MIRAGE 2006 on three platforms, Atmos. Chem. Phys., 9, 5417–5432, https://doi.org/10.5194/acp-9-5417-2009, 2009. a
El Haddad, I., D'Anna, B., Temime-Roussel, B., Nicolas, M., Boreave, A., Favez, O., Voisin, D., Sciare, J., George, C., Jaffrezo, J.-L., Wortham, H., and Marchand, N.: Towards a better understanding of the origins, chemical composition and aging of oxygenated organic aerosols: case study of a Mediterranean industrialized environment, Marseille, Atmos. Chem. Phys., 13, 7875–7894, https://doi.org/10.5194/acp-13-7875-2013, 2013. a
Hallquist, M., Wenger, J. C., Baltensperger, U., Rudich, Y., Simpson, D., Claeys, M., Dommen, J., Donahue, N. M., George, C., Goldstein, A. H., Hamilton, J. F., Herrmann, H., Hoffmann, T., Iinuma, Y., Jang, M., Jenkin, M. E., Jimenez, J. L., Kiendler-Scharr, A., Maenhaut, W., McFiggans, G., Mentel, Th. F., Monod, A., Prévôt, A. S. H., Seinfeld, J. H., Surratt, J. D., Szmigielski, R., and Wildt, J.: The formation, properties and impact of secondary organic aerosol: current and emerging issues, Atmos. Chem. Phys., 9, 5155–5236, https://doi.org/10.5194/acp-9-5155-2009, 2009. a, b
Hand, J. L., Prenni, A. J., Schichtel, B. A., Malm, W. C., and Chow, J. C.: Trends in Remote PM2.5 Residual Mass across the United States: Implications for Aerosol Mass Reconstruction in the IMPROVE Network, Atmos. Environ., 203, 141–152, https://doi.org/10.1016/j.atmosenv.2019.01.049, 2019. a
Haque, Md. M., Kawamura, K., Deshmukh, D. K., Fang, C., Song, W., Mengying, B., and Zhang, Y.-L.: Characterization of organic aerosols from a Chinese megacity during winter: predominance of fossil fuel combustion, Atmos. Chem. Phys., 19, 5147–5164, https://doi.org/10.5194/acp-19-5147-2019, 2019. a
Hawkins, L. N. and Russell, L. M.: Oxidation of Ketone Groups in Transported Biomass Burning Aerosol from the 2008 Northern California Lightning Series Fires, Atmos. Environ., 44, 4142–4154, https://doi.org/10.1016/j.atmosenv.2010.07.036, 2010. a, b, c, d
Hennigan, C. J., Sullivan, A. P., Collett, J. L., and Robinson, A. L.: Levoglucosan Stability in Biomass Burning Particles Exposed to Hydroxyl Radicals, Geophys. Res. Lett., 37, L09806, https://doi.org/10.1029/2010GL043088, 2010. a, b
Hergert, H. L.: Infrared Spectra of Lignin and Related Compounds. II. Conifer Lignin and Model Compounds, J. Org. Chem., 25, 405–413, https://doi.org/10.1021/jo01073a026, 1960. a
Hotelling, H.: Analysis of a Complex of Statistical Variables into Principal Components, J. Educ. Psychol., 24, 417–441, https://doi.org/10.1037/h0071325, 1933. a
IMPROVE: Interagency Monitoring of Protected Visual Environments, available at: http://vista.cira.colostate.edu/improve/, last access: 26 December 2019. a
Jiang, J., El Haddad, I., Aksoyoglu, S., Stefenelli, G., Bertrand, A., Marchand, N., Canonaco, F., Petit, J.-E., Favez, O., Gilardoni, S., Baltensperger, U., and Prévôt, A. S. H.: Influence of biomass burning vapor wall loss correction on modeling organic aerosols in Europe by CAMx v6.50, Geosci. Model Dev., 14, 1681–1697, https://doi.org/10.5194/gmd-14-1681-2021, 2021. a
Jimenez, J. L., Canagaratna, M. R., Donahue, N. M., Prevot, A. S. H., Zhang, Q., Kroll, J. H., DeCarlo, P. F., Allan, J. D., Coe, H., Ng, N. L., Aiken, A. C., Docherty, K. S., Ulbrich, I. M., Grieshop, A. P., Robinson, A. L., Duplissy, J., Smith, J. D., Wilson, K. R., Lanz, V. A., Hueglin, C., Sun, Y. L., Tian, J., Laaksonen, A., Raatikainen, T., Rautiainen, J., Vaattovaara, P., Ehn, M., Kulmala, M., Tomlinson, J. M., Collins, D. R., Cubison, M. J., E, Dunlea, J., Huffman, J. A., Onasch, T. B., Alfarra, M. R., Williams, P. I., Bower, K., Kondo, Y., Schneider, J., Drewnick, F., Borrmann, S., Weimer, S., Demerjian, K., Salcedo, D., Cottrell, L., Griffin, R., Takami, A., Miyoshi, T., Hatakeyama, S., Shimono, A., Sun, J. Y., Zhang, Y. M., Dzepina, K., Kimmel, J. R., Sueper, D., Jayne, J. T., Herndon, S. C., Trimborn, A. M., Williams, L. R., Wood, E. C., Middlebrook, A. M., Kolb, C. E., Baltensperger, U., and Worsnop, D. R.: Evolution of Organic Aerosols in the Atmosphere, Science, 326, 1525–1529, https://doi.org/10.1126/science.1180353, 2009. a
Johansson, L. S., Leckner, B., Gustavsson, L., Cooper, D., Tullin, C., and Potter, A.: Emission Characteristics of Modern and Old-Type Residential Boilers Fired with Wood Logs and Wood Pellets, Atmos. Environ., 38, 4183–4195, https://doi.org/10.1016/j.atmosenv.2004.04.020, 2004. a
Junninen, H., Mønster, J., Rey, M., Cancelinha, J., Douglas, K., Duane, M., Forcina, V., Müller, A., Lagler, F., Marelli, L., Borowiak, A., Niedzialek, J., Paradiz, B., Mira-Salama, D., Jimenez, J., Hansen, U., Astorga, C., Stanczyk, K., Viana, M., Querol, X., Duvall, R. M., Norris, G. A., Tsakovski, S., Wåhlin, P., Horák, J., and Larsen, B. R.: Quantifying the Impact of Residential Heating on the Urban Air Quality in a Typical European Coal Combustion Region, Environ. Sci. Technol., 43, 7964–7970, https://doi.org/10.1021/es8032082, 2009. a
Kanakidou, M., Seinfeld, J. H., Pandis, S. N., Barnes, I., Dentener, F. J., Facchini, M. C., Van Dingenen, R., Ervens, B., Nenes, A., Nielsen, C. J., Swietlicki, E., Putaud, J. P., Balkanski, Y., Fuzzi, S., Horth, J., Moortgat, G. K., Winterhalter, R., Myhre, C. E. L., Tsigaridis, K., Vignati, E., Stephanou, E. G., and Wilson, J.: Organic aerosol and global climate modelling: a review, Atmos. Chem. Phys., 5, 1053–1123, https://doi.org/10.5194/acp-5-1053-2005, 2005. a
Kautzman, K. E., Surratt, J. D., Chan, M. N., Chan, A. W. H., Hersey, S. P., Chhabra, P. S., Dalleska, N. F., Wennberg, P. O., Flagan, R. C., and Seinfeld, J. H.: Chemical Composition of Gas- and Aerosol-Phase Products from the Photooxidation of Naphthalene, J. Phys. Chem. A, 114, 913–934, https://doi.org/10.1021/jp908530s, 2010. a
Klein, F., Pieber, S. M., Ni, H., Stefenelli, G., Bertrand, A., Kilic, D., Pospisilova, V., Temime-Roussel, B., Marchand, N., El Haddad, I., Slowik, J. G., Baltensperger, U., Cao, J., Huang, R.-J., and Prévôt, A. S. H.: Characterization of Gas-Phase Organics Using Proton Transfer Reaction Time-of-Flight Mass Spectrometry: Residential Coal Combustion, Environ. Sci. Technol., 52, 2612–2617, https://doi.org/10.1021/acs.est.7b03960, 2018. a, b, c, d, e, f
Kroll, J. H. and Seinfeld, J. H.: Chemistry of Secondary Organic Aerosol: Formation and Evolution of Low-Volatility Organics in the Atmosphere, Atmos. Environ., 42, 3593–3624, https://doi.org/10.1016/j.atmosenv.2008.01.003, 2008. a, b
Kumar, N. K., Corbin, J. C., Bruns, E. A., Massabó, D., Slowik, J. G., Drinovec, L., Močnik, G., Prati, P., Vlachou, A., Baltensperger, U., Gysel, M., El-Haddad, I., and Prévôt, A. S. H.: Production of particulate brown carbon during atmospheric aging of residential wood-burning emissions, Atmos. Chem. Phys., 18, 17843–17861, https://doi.org/10.5194/acp-18-17843-2018, 2018. a
Kuzmiakova, A., Dillner, A. M., and Takahama, S.: An automated baseline correction protocol for infrared spectra of atmospheric aerosols collected on polytetrafluoroethylene (Teflon) filters, Atmos. Meas. Tech., 9, 2615–2631, https://doi.org/10.5194/amt-9-2615-2016, 2016. a, b
Lambe, A. T., Onasch, T. B., Croasdale, D. R., Wright, J. P., Martin, A. T., Franklin, J. P., Massoli, P., Kroll, J. H., Canagaratna, M. R., Brune, W. H., Worsnop, D. R., and Davidovits, P.: Transitions from Functionalization to Fragmentation Reactions of Laboratory Secondary Organic Aerosol (SOA) Generated from the OH Oxidation of Alkane Precursors, Environ. Sci. Technol., 46, 5430–5437, https://doi.org/10.1021/es300274t, 2012. a
Lanz, V. A., Prévôt, A. S. H., Alfarra, M. R., Weimer, S., Mohr, C., DeCarlo, P. F., Gianini, M. F. D., Hueglin, C., Schneider, J., Favez, O., D'Anna, B., George, C., and Baltensperger, U.: Characterization of aerosol chemical composition with aerosol mass spectrometry in Central Europe: an overview, Atmos. Chem. Phys., 10, 10453–10471, https://doi.org/10.5194/acp-10-10453-2010, 2010. a
Lim, Y. B. and Ziemann, P. J.: Chemistry of Secondary Organic Aerosol Formation from OH Radical-Initiated Reactions of Linear, Branched, and Cyclic Alkanes in the Presence of NOx, Aerosol Sci. Tech., 43, 604–619, https://doi.org/10.1080/02786820902802567, 2009. a
Liu, C., Zhang, C., Mu, Y., Liu, J., and Zhang, Y.: Emission of Volatile Organic Compounds from Domestic Coal Stove with the Actual Alternation of Flaming and Smoldering Combustion Processes, Environ. Pollut., 221, 385–391, https://doi.org/10.1016/j.envpol.2016.11.089, 2017. a, b, c, d
Liu, S., Day, D. A., Shields, J. E., and Russell, L. M.: Ozone-driven daytime formation of secondary organic aerosol containing carboxylic acid groups and alkane groups, Atmos. Chem. Phys., 11, 8321–8341, https://doi.org/10.5194/acp-11-8321-2011, 2011. a
Liu, S., Shilling, J. E., Song, C., Hiranuma, N., Zaveri, R. A., and Russell, L. M.: Hydrolysis of Organonitrate Functional Groups in Aerosol Particles, Aerosol Sci. Tech., 46, 1359–1369, https://doi.org/10.1080/02786826.2012.716175, 2012. a
Maria, S. F., Russell, L. M., Turpin, B. J., and Porcja, R. J.: FTIR Measurements of Functional Groups and Organic Mass in Aerosol Samples over the Caribbean, Atmos. Environ., 36, 5185–5196, https://doi.org/10.1016/S1352-2310(02)00654-4, 2002. a
Maria, S. F., Russell, L. M., Turpin, B. J., Porcja, R. J., Campos, T. L., Weber, R. J., and Huebert, B. J.: Source Signatures of Carbon Monoxide and Organic Functional Groups in Asian Pacific Regional Aerosol Characterization Experiment (ACE-Asia) Submicron Aerosol Types, J. Geophys. Res.-Atmos., 108, 8637, https://doi.org/10.1029/2003JD003703, 2003. a
McFiggans, G., Coe, H., Burgess, R., Allan, J., Cubison, M., Alfarra, M. R., Saunders, R., Saiz-Lopez, A., Plane, J. M. C., Wevill, D., Carpenter, L., Rickard, A. R., and Monks, P. S.: Direct evidence for coastal iodine particles from Laminaria macroalgae – linkage to emissions of molecular iodine, Atmos. Chem. Phys., 4, 701–713, https://doi.org/10.5194/acp-4-701-2004, 2004. a
McKendry, P.: Energy Production from Biomass (Part 1): Overview of Biomass, Bioresour. Technol., 83, 37–46, https://doi.org/10.1016/s0960-8524(01)00118-3, 2002. a
Ng, N. L., Canagaratna, M. R., Zhang, Q., Jimenez, J. L., Tian, J., Ulbrich, I. M., Kroll, J. H., Docherty, K. S., Chhabra, P. S., Bahreini, R., Murphy, S. M., Seinfeld, J. H., Hildebrandt, L., Donahue, N. M., DeCarlo, P. F., Lanz, V. A., Prévôt, A. S. H., Dinar, E., Rudich, Y., and Worsnop, D. R.: Organic aerosol components observed in Northern Hemispheric datasets from Aerosol Mass Spectrometry, Atmos. Chem. Phys., 10, 4625–4641, https://doi.org/10.5194/acp-10-4625-2010, 2010. a
Ng, N. L., Brown, S. S., Archibald, A. T., Atlas, E., Cohen, R. C., Crowley, J. N., Day, D. A., Donahue, N. M., Fry, J. L., Fuchs, H., Griffin, R. J., Guzman, M. I., Herrmann, H., Hodzic, A., Iinuma, Y., Jimenez, J. L., Kiendler-Scharr, A., Lee, B. H., Luecken, D. J., Mao, J., McLaren, R., Mutzel, A., Osthoff, H. D., Ouyang, B., Picquet-Varrault, B., Platt, U., Pye, H. O. T., Rudich, Y., Schwantes, R. H., Shiraiwa, M., Stutz, J., Thornton, J. A., Tilgner, A., Williams, B. J., and Zaveri, R. A.: Nitrate radicals and biogenic volatile organic compounds: oxidation, mechanisms, and organic aerosol, Atmos. Chem. Phys., 17, 2103–2162, https://doi.org/10.5194/acp-17-2103-2017, 2017. a
Parks, D. A., Raj, K. V., Berry, C. A., Weakley, A. T., Griffiths, P. R., and Miller, A. L.: Towards a Field-Portable Real-Time Organic and Elemental Carbon Monitor, Mining, Metall. Expl., 36, 765–772, https://doi.org/10.1007/s42461-019-0064-8, 2019. a
Pavia, D. L., Lampman, G. M., Kriz, G. S., and Vyvyan, J. A.: Introduction to Spectroscopy, Brooks Cole, Belmont, CA, 4th Edn., 2008. a, b, c, d, e
Platt, S. M., El Haddad, I., Zardini, A. A., Clairotte, M., Astorga, C., Wolf, R., Slowik, J. G., Temime-Roussel, B., Marchand, N., Ježek, I., Drinovec, L., Močnik, G., Möhler, O., Richter, R., Barmet, P., Bianchi, F., Baltensperger, U., and Prévôt, A. S. H.: Secondary organic aerosol formation from gasoline vehicle emissions in a new mobile environmental reaction chamber, Atmos. Chem. Phys., 13, 9141–9158, https://doi.org/10.5194/acp-13-9141-2013, 2013. a
Pope, R., Stanley, K. M., Domsky, I., Yip, F., Nohre, L., and Mirabelli, M. C.: The Relationship of High PM2.5 Days and Subsequent Asthma-Related Hospital Encounters during the Fireplace Season in Phoenix, AZ, 2008–2012, Air Qual. Atmos. Hlth., 10, 161–169, https://doi.org/10.1007/s11869-016-0431-2, 2017. a
Puxbaum, H., Caseiro, A., Sánchez-Ochoa, A., Kasper-Giebl, A., Claeys, M., Gelencsér, A., Legrand, M., Preunkert, S., and Pio, C.: Levoglucosan Levels at Background Sites in Europe for Assessing the Impact of Biomass Combustion on the European Aerosol Background, J. Geophys. Res.-Atmos., 112, D23S05, https://doi.org/10.1029/2006JD008114, 2007. a, b
Qi, L., Chen, M., Stefenelli, G., Pospisilova, V., Tong, Y., Bertrand, A., Hueglin, C., Ge, X., Baltensperger, U., Prévôt, A. S. H., and Slowik, J. G.: Organic aerosol source apportionment in Zurich using an extractive electrospray ionization time-of-flight mass spectrometer (EESI-TOF-MS) – Part 2: Biomass burning influences in winter, Atmos. Chem. Phys., 19, 8037–8062, https://doi.org/10.5194/acp-19-8037-2019, 2019. a
Quarti, C., Milani, A., and Castiglioni, C.: Ab Initio Calculation of the IR Spectrum of PTFE: Helical Symmetry and Defects, J. Phys. Chem. B, 117, 706–718, https://doi.org/10.1021/jp3102145, 2013. a, b
Reggente, M., Dillner, A. M., and Takahama, S.: Predicting ambient aerosol thermal–optical reflectance (TOR) measurements from infrared spectra: extending the predictions to different years and different sites, Atmos. Meas. Tech., 9, 441–454, https://doi.org/10.5194/amt-9-441-2016, 2016. a
Reggente, M., Dillner, A. M., and Takahama, S.: Analysis of functional groups in atmospheric aerosols by infrared spectroscopy: systematic intercomparison of calibration methods for US measurement network samples, Atmos. Meas. Tech., 12, 2287–2312, https://doi.org/10.5194/amt-12-2287-2019, 2019a. a, b, c
Reggente, M., Höhn, R., and Takahama, S.: An open platform for Aerosol InfraRed Spectroscopy analysis – AIRSpec, Atmos. Meas. Tech., 12, 2313–2329, https://doi.org/10.5194/amt-12-2313-2019, 2019b. a
Russell, L. M.: Aerosol Organic-Mass-to-Organic-Carbon Ratio Measurements, Environ. Sci. Technol., 37, 2982–2987, https://doi.org/10.1021/es026123w, 2003. a, b
Russell, L. M., Bahadur, R., Hawkins, L. N., Allan, J., Baumgardner, D., Quinn, P. K., and Bates, T. S.: Organic Aerosol Characterization by Complementary Measurements of Chemical Bonds and Molecular Fragments, Atmos. Environ., 43, 6100–6105, https://doi.org/10.1016/j.atmosenv.2009.09.036, 2009a. a, b
Russell, L. M., Takahama, S., Liu, S., Hawkins, L. N., Covert, D. S., Quinn, P. K., and Bates, T. S.: Oxygenated Fraction and Mass of Organic Aerosol from Direct Emission and Atmospheric Processing Measured on the R/V Ronald Brown during TEXAQS/GoMACCS 2006, J. Geophys. Res.-Atmos., 114, D00F05, https://doi.org/10.1029/2008JD011275, 2009b. a, b
Russell, L. M., Bahadur, R., and Ziemann, P. J.: Identifying Organic Aerosol Sources by Comparing Functional Group Composition in Chamber and Atmospheric Particles, P. Natl. Acad. Sci. USA, 108, 3516–3521, https://doi.org/10.1073/pnas.1006461108, 2011. a
Russo, C., Stanzione, F., Tregrossi, A., and Ciajolo, A.: Infrared Spectroscopy of Some Carbon-Based Materials Relevant in Combustion: Qualitative and Quantitative Analysis of Hydrogen, Carbon, 74, 127–138, https://doi.org/10.1016/j.carbon.2014.03.014, 2014. a
Ruthenburg, T. C., Perlin, P. C., Liu, V., McDade, C. E., and Dillner, A. M.: Determination of Organic Matter and Organic Matter to Organic Carbon Ratios by Infrared Spectroscopy with Application to Selected Sites in the IMPROVE Network, Atmos. Environ., 86, 47–57, https://doi.org/10.1016/j.atmosenv.2013.12.034, 2014. a, b, c
Saito, K., Kato, T., Takamori, H., Kishimoto, T., and Fukushima, K.: A New Analysis of the Depolymerized Fragments of Lignin Polymer Using ToF-SIMS, Biomacromolecules, 6, 2688–2696, https://doi.org/10.1021/bm050147o, 2005. a
Sauvain, J.-J., Vu Duc, T., and Guillemin, M.: Exposure to Carcinogenic Polycyclic Aromatic Compounds and Health Risk Assessment for Diesel-Exhaust Exposed Workers, Int. Arch. Occup. Environ. Health, 76, 443–455, https://doi.org/10.1007/s00420-003-0439-4, 2003. a
Schneider, J., Weimer, S., Drewnick, F., Borrmann, S., Helas, G., Gwaze, P., Schmid, O., Andreae, M. O., and Kirchner, U.: Mass Spectrometric Analysis and Aerodynamic Properties of Various Types of Combustion-Related Aerosol Particles, Int. J. Mass Spectrom., 258, 37–49, https://doi.org/10.1016/j.ijms.2006.07.008, 2006. a, b
Seinfeld, J. H. and Pandis, S. N.: Atmospheric Chemistry and Physics: From Air Pollution to Climate Change, John Wiley & Sons, Hoboken, NJ, 2016. a, b, c
Shen, D. K. and Gu, S.: The Mechanism for Thermal Decomposition of Cellulose and Its Main Products, Bioresour. Technol., 100, 6496–6504, https://doi.org/10.1016/j.biortech.2009.06.095, 2009. a
Shiraiwa, M., Ueda, K., Pozzer, A., Lammel, G., Kampf, C. J., Fushimi, A., Enami, S., Arangio, A. M., Fröhlich-Nowoisky, J., Fujitani, Y., Furuyama, A., Lakey, P. S. J., Lelieveld, J., Lucas, K., Morino, Y., Pöschl, U., Takahama, S., Takami, A., Tong, H., Weber, B., Yoshino, A., and Sato, K.: Aerosol Health Effects from Molecular to Global Scales, Environ. Sci. Technol., 51, 13545–13567, https://doi.org/10.1021/acs.est.7b04417, 2017. a
Simoneit, B. R. T., Rogge, W. F., Mazurek, M. A., Standley, L. J., Hildemann, L. M., and Cass, G. R.: Lignin Pyrolysis Products, Lignans, and Resin Acids as Specific Tracers of Plant Classes in Emissions from Biomass Combustion, Environ. Sci. Technol., 27, 2533–2541, https://doi.org/10.1021/es00048a034, 1993. a
Sobkowiak, M. and Painter, P.: Determination of the Aliphatic and Aromatic CH Contents of Coals by FT-i.r.: Studies of Coal Extracts, Fuel, 71, 1105–1125, https://doi.org/10.1016/0016-2361(92)90092-3, 1992. a
Sobkowiak, M. and Painter, P.: A Comparison of DRIFT and KBr Pellet Methodologies for the Quantitative Analysis of Functional Groups in Coal by Infrared Spectroscopy, Energy Fuels, 9, 359–363, https://doi.org/10.1021/ef00050a022, 1995. a
Stefenelli, G., Jiang, J., Bertrand, A., Bruns, E. A., Pieber, S. M., Baltensperger, U., Marchand, N., Aksoyoglu, S., Prévôt, A. S. H., Slowik, J. G., and El Haddad, I.: Secondary organic aerosol formation from smoldering and flaming combustion of biomass: a box model parametrization based on volatility basis set, Atmos. Chem. Phys., 19, 11461–11484, https://doi.org/10.5194/acp-19-11461-2019, 2019. a
Sullivan, A. P., Holden, A. S., Patterson, L. A., McMeeking, G. R., Kreidenweis, S. M., Malm, W. C., Hao, W. M., Wold, C. E., and Collett, J. L.: A Method for Smoke Marker Measurements and Its Potential Application for Determining the Contribution of Biomass Burning from Wildfires and Prescribed Fires to Ambient PM2.5 Organic Carbon, J. Geophys. Res.-Atmos., 113, D22302, https://doi.org/10.1029/2008JD010216, 2008. a
Sullivan, A. P., Frank, N., Onstad, G., Simpson, C. D., and Collett, J. L.: Application of High-Performance Anion-Exchange Chromatography–Pulsed Amperometric Detection for Measuring Carbohydrates in Routine Daily Filter Samples Collected by a National Network: 1. Determination of the Impact of Biomass Burning in the Upper Midwest, J. Geophys. Res.-Atmos., 116, D08302, https://doi.org/10.1029/2010JD014166, 2011. a, b
Taira, M. and Kanda, Y.: Continuous Generation System for Low-Concentration Gaseous Nitrous Acid, Anal. Chem., 62, 630–633, https://doi.org/10.1021/ac00205a018, 1990. a
Takahama, S., Schwartz, R. E., Russell, L. M., Macdonald, A. M., Sharma, S., and Leaitch, W. R.: Organic functional groups in aerosol particles from burning and non-burning forest emissions at a high-elevation mountain site, Atmos. Chem. Phys., 11, 6367–6386, https://doi.org/10.5194/acp-11-6367-2011, 2011. a
Takahama, S., Johnson, A., and Russell, L. M.: Quantification of Carboxylic and Carbonyl Functional Groups in Organic Aerosol Infrared Absorbance Spectra, Aerosol Sci. Tech., 47, 310–325, https://doi.org/10.1080/02786826.2012.752065, 2013. a, b
Tiitta, P., Leskinen, A., Hao, L., Yli-Pirilä, P., Kortelainen, M., Grigonyte, J., Tissari, J., Lamberg, H., Hartikainen, A., Kuuspalo, K., Kortelainen, A.-M., Virtanen, A., Lehtinen, K. E. J., Komppula, M., Pieber, S., Prévôt, A. S. H., Onasch, T. B., Worsnop, D. R., Czech, H., Zimmermann, R., Jokiniemi, J., and Sippula, O.: Transformation of logwood combustion emissions in a smog chamber: formation of secondary organic aerosol and changes in the primary organic aerosol upon daytime and nighttime aging, Atmos. Chem. Phys., 16, 13251–13269, https://doi.org/10.5194/acp-16-13251-2016, 2016. a
Tolbert, A. and Ragauskas, A. J.: Advances in Understanding the Surface Chemistry of Lignocellulosic Biomass via Time-of-Flight Secondary Ion Mass Spectrometry, Energy Sci. Eng., 5, 5–20, https://doi.org/10.1002/ese3.144, 2017. a
Turpin, B. J., Saxena, P., and Andrews, E.: Measuring and Simulating Particulate Organics in the Atmosphere: Problems and Prospects, Atmos. Environ., 34, 2983–3013, https://doi.org/10.1016/S1352-2310(99)00501-4, 2000. a
Ulbrich, I. M., Canagaratna, M. R., Zhang, Q., Worsnop, D. R., and Jimenez, J. L.: Interpretation of organic components from Positive Matrix Factorization of aerosol mass spectrometric data, Atmos. Chem. Phys., 9, 2891–2918, https://doi.org/10.5194/acp-9-2891-2009, 2009. a
Vasireddy, S., Morreale, B., Cugini, A., Song, C., and Spivey, J. J.: Clean Liquid Fuels from Direct Coal Liquefaction: Chemistry, Catalysis, Technological Status and Challenges, Energy Environ. Sci., 4, 311–345, https://doi.org/10.1039/C0EE00097C, 2011. a, b
Westerling, A. L.: Increasing Western US Forest Wildfire Activity: Sensitivity to Changes in the Timing of Spring, Philos. Trans. R. Soc. B, 371, 20150178, https://doi.org/10.1098/rstb.2015.0178, 2016. a
World Coal Association: Coal Facts, available at: https://www.worldcoal.org/coal/uses-coal/coal-electricity, last access: 25 March 2020. a
Yang, H., Yan, R., Chen, H., Lee, D. H., and Zheng, C.: Characteristics of Hemicellulose, Cellulose and Lignin Pyrolysis, Fuel, 86, 1781–1788, https://doi.org/10.1016/j.fuel.2006.12.013, 2007. a
Yazdani, A., Dillner, A. M., and Takahama, S.: Estimating mean molecular weight, carbon number, and OM/OC with mid-infrared spectroscopy in organic particulate matter samples from a monitoring network, Atmos. Meas. Tech. Discuss. [preprint], https://doi.org/10.5194/amt-2020-79, in review, 2020. a, b
Yazdani, A., Dudani, N., El Haddad, I., Bertrand, A., Prévôt, A. S. H., and Dillner, A. M.: Statistical Analysis of Mass Fragment-Functional Group Relationships in Organic Particulate Matter Using Mid-Infrared Spectroscopy and Aerosol Mass Spectrometry, Atmos. Meas. Tech. Discuss., in preparation, 2021a. a, b, c
Yazdani, A., Dudani, N., Takahama, S., Bertrand, A., Prévôt, A. S. H., El Haddad, I., and Dillner, A. M.: AMS and FTIR spectra of primary and aged fine PM from wood burning and coal combustion, Zenodo [Data set], https://doi.org/10.5281/zenodo.4882967, 2021b. a
Zhang, F., Shang, X., Chen, H., Xie, G., Fu, Y., Wu, D., Sun, W., Liu, P., Zhang, C., Mu, Y., Zeng, L., Wan, M., Wang, Y., Xiao, H., Wang, G., and Chen, J.: Significant Impact of Coal Combustion on VOCs Emissions in Winter in a North China Rural Site, Sci. Total Environ., 720, 137617, https://doi.org/10.1016/j.scitotenv.2020.137617, 2020. a
Zhang, W., Jiang, S., Wang, K., Wang, L., Xu, Y., Wu, Z., Shao, H., Wang, Y., and Miao, M.: Thermogravimetric Dynamics and FTIR Analysis on Oxidation Properties of Low-Rank Coal at Low and Moderate Temperatures, Int. J. Coal Prep. Util., 35, 39–50, https://doi.org/10.1080/19392699.2013.873421, 2015. a, b
Zhao, R., Mungall, E. L., Lee, A. K. Y., Aljawhary, D., and Abbatt, J. P. D.: Aqueous-phase photooxidation of levoglucosan – a mechanistic study using aerosol time-of-flight chemical ionization mass spectrometry (Aerosol ToF-CIMS), Atmos. Chem. Phys., 14, 9695–9706, https://doi.org/10.5194/acp-14-9695-2014, 2014. a
Ziemann, P. J. and Atkinson, R.: Kinetics, Products, and Mechanisms of Secondary Organic Aerosol Formation, Chem. Soc. Rev., 41, 6582–6605, https://doi.org/10.1039/C2CS35122F, 2012. a