the Creative Commons Attribution 4.0 License.
the Creative Commons Attribution 4.0 License.
 | 07 Jul 2021
Seasonal analysis of submicron aerosol in Old Delhi using high-resolution aerosol mass spectrometry: chemical characterisation, source apportionment and new marker identification
James M. Cash
Ben Langford
Chiara Di Marco
Neil J. Mullinger
James Allan
Ernesto Reyes-Villegas
Ruthambara Joshi
Mathew R. Heal
W. Joe F. Acton
C. Nicholas Hewitt
Pawel K. Misztal
Will Drysdale
Tuhin K. Mandal
Shivani
Ranu Gadi
Bhola Ram Gurjar
We present the first real-time composition of submicron particulate matter (PM1) in Old Delhi using high-resolution aerosol mass spectrometry (HR-AMS). Old Delhi is one of the most polluted locations in the world, and PM1 concentrations reached ∼ 750 µg m−3 during the most polluted period, the post-monsoon period, where PM1 increased by 188 % over the pre-monsoon period. Sulfate contributes the largest inorganic PM1 mass fraction during the pre-monsoon (24 %) and monsoon (24 %) periods, with nitrate contributing most during the post-monsoon period (8 %). The organics dominate the mass fraction (54 %–68 %) throughout the three periods, and, using positive matrix factorisation (PMF) to perform source apportionment analysis of organic mass, two burning-related factors were found to contribute the most (35 %) to the post-monsoon increase. The first PMF factor, semi-volatility biomass burning organic aerosol (SVBBOA), shows a high correlation with Earth observation fire counts in surrounding states, which links its origin to crop residue burning. The second is a solid fuel OA (SFOA) factor with links to local open burning due to its high composition of polyaromatic hydrocarbons (PAHs) and novel AMS-measured marker species for polychlorinated dibenzodioxins (PCDDs) and polychlorinated dibenzofurans (PCDFs). Two traffic factors were resolved: one hydrocarbon-like OA (HOA) factor and another nitrogen-rich HOA (NHOA) factor. The N compounds within NHOA were mainly nitrile species which have not previously been identified within AMS measurements. Their PAH composition suggests that NHOA is linked to diesel and HOA to compressed natural gas and petrol. These factors combined make the largest relative contribution to primary PM1 mass during the pre-monsoon and monsoon periods while contributing the second highest in the post-monsoon period. A cooking OA (COA) factor shows strong links to the secondary factor, semi-volatility oxygenated OA (SVOOA). Correlations with co-located volatile organic compound (VOC) measurements and AMS-measured organic nitrogen oxides (OrgNO) suggest SVOOA is formed from aged COA. It is also found that a significant increase in chloride concentrations (522 %) from pre-monsoon to post-monsoon correlates well with SVBBOA and SFOA, suggesting that crop residue burning and open waste burning are responsible. A reduction in traffic emissions would effectively reduce concentrations across most of the year. In order to reduce the post-monsoon peak, sources such as funeral pyres, solid waste burning and crop residue burning should be considered when developing new air quality policy.
- Article
(13328 KB) - Full-text XML
-
Supplement
(5278 KB) - BibTeX
- EndNote


The number of premature deaths linked to fine particulate matter (PM2.5) globally was estimated at 4.1 million in 2016, and 10.6 % were in India alone (Gakidou et al., 2017). Some of the most polluted cities in the world are in India, with Delhi being in the top 10 cities listed by the World Health Organization based on available annual PM2.5 measurements in 2018 (World Health Organization, https://www.who.int/data/gho/data/themes/topics/topic-details/GHO/ambient-air-pollution, last access: 20 April 2021). This has a significant effect on the health of its population (26 million), and in 2016 it was estimated that fine particulate matter (PM2.5) accounted for ∼ 15 000 premature deaths per year (Maji et al., 2018). Therefore, it is important to investigate the sources of PM to improve air quality mitigation strategies.
The composition of submicron PM (PM1) is a mixture of organic aerosol (OA), black carbon (BC) and inorganic aerosols including ammonium, sulfate, chloride and nitrate. The high-resolution aerosol mass spectrometer (HR-AMS) has helped to improve measurements of PM1 as it gives detailed information on its chemical composition through elemental analysis and high-resolution compound identification. Combining these measurements with positive matrix factorisation (PMF) allows for the apportionment of aerosol mass into different sources (or factors). This provides detailed information needed to inform effective air quality interventions. To date, relatively few measurements of PM composition have been made by HR-AMS in India, with measurements made in Kanpur a notable exception (Chakraborty et al., 2015, 2016a, b, 2018). These HR-AMS measurements however give multiple factor solutions, often of six or greater, which highlights the complexity of the source mix. Typical sources identified include components considered to be primary, such as hydrocarbon-like organic aerosol (HOA) and biomass burning organic aerosol (BBOA), as well as components usually considered to be secondary, such as low-volatility oxygenated organic aerosol (LVOOA), semi-volatility oxygenated organic aerosol (SVOOA) and oxidised BBOA (O-BBOA). Throughout these studies there are multiple versions of the same source, and this requires additional auxiliary measurements to pin down their origin. This study aims to better assign factors to their original sources using additional measurements of volatile organic compounds (VOCs), black carbon (BC), carbon monoxide (CO), nitrogen oxides (NOx) and Earth observations.
A growing number of studies in Delhi, and other locations in India, have reported large concentrations of chloride, especially during the morning hours at ∼ 07:00–09:00 (Sudheer et al., 2014; Chakraborty et al., 2018; Gani et al., 2019; Acharja et al., 2020; Reyes-Villegas et al., 2020; Tobler et al., 2020; Lalchandani et al., 2021). The source of this chloride is still widely debated, and there are several possibilities, including aluminium pickling, industrial activity, municipal waste burning and biomass burning. The aluminium pickling industry in the north-west of Delhi is thought to directly emit HCl and be the main contributor to chloride during the winter months when average concentrations increase from 1.5 µg m−3 in the summer to 23 µg m−3 in the winter (Gani et al., 2019). Studies in Mexico City suggest a substantial amount of chloride is from biomass and municipal waste burning, and they also observe high concentrations from crop residue burning (Christian et al., 2010; Li et al., 2012). In Delhi, these sources may also be high contributors as it would explain why chloride concentrations show a larger elevation during the colder post-monsoon and winter months than other compounds.
During the post-monsoon period, large-scale crop residue burning occurs along with large numbers of Delhi residents burning municipal waste to keep warm and clean streets. These open burning sources produce chloride in different organic and inorganic forms. Inorganic NH4Cl is related to biomass burning through the release of particulate KCl that forms HCl and ultimately NH4Cl once reacted with ammonia (Sullivan et al., 2007; Wang et al., 2017). Emissions of HCl are often associated with plastic burning, but there are also organic species of chloride, such as polychlorinated dibenzofurans (PCDFs) and dibenzodioxins (PCDDs), that form readily from chloride-rich plastics such as polyvinyl chloride (PVC) and polychlorinated biphenyls (PCBs) (Minh et al., 2003; Chakraborty et al., 2013; Stewart et al., 2021). Large-scale plastic burning practises in Delhi, such as electronic waste recycling centres situated in the north-west, could therefore be high contributors to chloride mass. The measurement of plastic burning markers is therefore important to understand the contribution of such practises to chloride concentrations.
This study focuses on the high-resolution aspect of the high-resolution time-of-flight aerosol mass spectrometer (HR-TOF-AMS) and investigates the detailed composition of aerosol. Using positive matrix factorisation (PMF), the PM1 source mass profiles in Delhi are compared to auxiliary measurements, including measurements of VOCs using a high-resolution proton-transfer-reaction time-of-flight mass spectrometer with a quadrupole ion guide (PTR-QiTOF), giving us a detailed picture of the origin of PMF factors. The polyaromatic hydrocarbon (PAH) composition of each factor is also investigated and helps to distinguish factors based on the combustion of different fuel types. A focus is also placed on investigating the origin of the high chloride concentrations observed in Delhi, where compositional aids help to establish a mixture of chloride sources and an indication to their contribution. There are two companion papers which use the HR-TOF-AMS measurement data from the Indira Gandhi Delhi Technical University for Women (IGDTUW). One study compares AMS datasets measured at different sites in Delhi and creates a city-wide perspective of PM1 composition over an entire year (Reyes-Villegas et al., 2020). The other study (which will be published separately) uses the unit mass resolution measurements to calculate compositional aerosol fluxes for the first time and compares measurements in Delhi to measurements taken in two cities: London and Beijing. The three studies combine to produce a more comprehensive picture of PM1 aerosol composition, concentrations and sources in Delhi.
2.1 Measurement location and instrumentation
Measurements were undertaken on the campus of the Indira Gandhi Delhi Technical University for Women (IGDTUW), which is located to the north of Old Delhi (28∘39′51.8′′ N, 77∘13′55.2′′ E). The measurements were made in three campaigns corresponding to three periods of the year in Delhi where the seasonal differences cause significant changes in meteorology. Here, we refer to the measurements taken during the summer months as the pre-monsoon period (26 May–28 June 2018), when average temperatures were high (36 ∘C) and relative humidity (RH) was low (43 %). During the monsoon campaign (3–18 August 2018) the temperatures dropped slightly (31 ∘C) and RH was high (76 %), coinciding with large rainfall events. The post-monsoon campaign (9 October–23 November 2018) encompassed the periods of the 5 d of Diwali (5–10 November 2018) and the seasonal stubble burning for rice crops in the neighbouring states of Punjab and Haryana situated to the NW. These two activities are combined with unfavourable meteorology where boundary layer height, temperatures (24 ∘C) and wind speeds are generally lower, causing a shallow inversion layer.
A high-resolution time-of-flight aerosol mass spectrometer (HR-TOF-AMS, Aerodyne Research Inc.) was used in V mode to measure 5 min average mass spectra of non-refractory PM1. The principle of operation of the instrument is described in detail elsewhere (DeCarlo et al., 2006; Canagaratna et al., 2007). Briefly, particles are sampled via a ∼ PM1 aerodynamic lens, and their size is measured using a time-of-flight chamber. Particles are then vaporised on a heated plate (600 ∘C), the non-refractory species are ionised using a 70 eV electron impact source and the values of the resultant ions are determined with a time-of-flight analyser.
The HR-TOF-AMS was calibrated fortnightly over the three campaigns (11 calibrations in total) for its ionisation efficiency of nitrate (IE) and the relative ionisation efficiency (RIE) of other inorganic compounds using nebulised 300 nm ammonium nitrate, sulfate and chloride. A collection efficiency (CE) of 0.5 was confirmed through comparisons with gravimetric PM2.5 filter measurements taken throughout the pre- and post-monsoon campaigns by University of Birmingham. The AMS measurements were added to the BC measurements to give total PM1, which was averaged to match the sample intervals of the filters (6 and 12 h). The comparison gave PM1 vs. PM2.5 gradients of 0.9 using a CE of 0.5 during most of the measurement campaigns. Considering the increased mass collected due to a higher size fraction for PM2.5, the CE was set to 0.5 for these periods. However, for Diwali and a few days after (5–14 November 18) a higher CE of 0.8 was applied to obtain a similar PM1 vs. PM2.5 gradient of ∼ 0.9. The reasons for this change are not the purpose of this study, and further compositional analysis is required to understand the change. All CE, RIEs and IEs are summarised in Table S2 for the different measurement periods.
The HR-TOF-AMS data were analysed using the IGOR Pro (WaveMetrics, Inc., Portland, OR, USA) based software SQUIRREL (Sequential Igor data Retrieval) v.1.62B and PIKA (Peak Integration by Key Analysis) v.1.22B, and a total of 2725 ions were fitted (including isotopes) in the range of 12–328. This range extends to larger than is typically used for ambient measurements and certainly for high-resolution PMF calculations using AMS data (Aiken et al., 2009; Docherty et al., 2011; Sun et al., 2016; Zhang et al., 2018). This becomes possible due to the high concentration loading in Delhi (up to ∼ 750 µg m−3) providing considerable signal at high . The fitting of heavier ions has also been shown to improve the strength of PMF solutions and their correlations with external tracers, as demonstrated in the Supplement Sect. S1. However, fragment identification becomes increasingly ambiguous at higher . The PIKA software allows the user to fit peaks based on a reduction in the residuals between the measured signal and the fit. There are measured signals for open (when the chopper is open), closed (when the chopper is closed) and difference (= open − closed), meaning there are also three sets of residuals. Neighbouring peaks may overlap and cause the difference residuals to improve whilst not improving the open and closed residuals. This becomes more relevant when moving to higher ions as peaks become broader. Therefore, only peaks which significantly improved the open and closed signal residuals were fitted. Peaks were also fitted based on signal intensity, where peaks with an average signal of less than 10 Hz ns−1 were not included.
The extended range included ions identified as polyaromatic hydrocarbons (PAHs) which were fitted according to the protocol set out by Herring et al. (2015). Elemental analysis was also performed to derive oxygen-to-carbon (O : C), hydrogen-to-carbon (H : C), nitrogen-to-carbon (N : C) and organic-mass-to-organic-carbon (OM : OC) ratios using the Improved-Ambient (IA) method developed by Canagaratna et al. (2015) as implemented in PIKA.
The concentrations of organic nitrogen oxide species (OrgNO) have been estimated using the NOx ratio method described in detail by Farmer et al. (2010) and Kiendler-Scharr et al. (2016). The method involves calculating the fraction of OrgNO (OrgNOfrac) using the equation
where Robs is the measured NO NO+ ratio, Rcal is the NO NO+ ratio observed during NH4NO3 calibrations and RON is a fixed value (0.1) that has been determined as the lowest Robs in multiple datasets (Kiendler-Scharr et al., 2016). The NO NO+ ratio described in Kiendler-Scharr et al. (2016) is used instead of NO+ NO to allow for signal reaching the limit of detection to approach zero rather than infinity because NO is often the higher signal. The calculated OrgNOfrac is then multiplied by the total nitrate concentration to give an estimate of the OrgNO mass (OrgNOmass).
The ISORROPIA II model was used to estimate the liquid water content (LWC) in aerosol using the input parameter of temperature and relative humidity along with AMS measurements of ammonium, sulfate, chloride and nitrate (Fountoukis and Nenes, 2007).
The AMS measurements were compared to a number of co-located instruments including black carbon (BC) measurements which were taken using an Aethalometer AE-31. The BC measurements were corrected using the Weingartner method (Weingartner et al., 2003) and by using reference measurements from a single-particle soot photometer (SP2; Droplet Measurement Technologies, Boulder, CO) which was co-located for ∼ 7 d (Reyes-Villegas et al., 2020). Volatile organic compounds (VOCs) were measured using a high-resolution proton-transfer-reaction time-of-flight mass spectrometer with a quadrupole ion guide (PTR-QiTOF, Ionicon Analytik GmbH, Innsbruck, Austria). A 5 min average of the concentrations was used within this work, and details of the setup are described in Acton et al. (2020). CO and NOx concentrations were measured using an Aerolaser AL 5002 UVU and a dual-channel high-resolution chemiluminescence instrument (Air Quality Designs Inc., Colorado), respectively. Meteorological measurements were taken using a HS-50 Gill research ultrasonic anemometer and a Vaisala weather transmitter (WXT530 Series) from the 11 November 2018 onwards. All measurements before this date were taken from the Indira Gandhi International Airport (available at: https://www.ncdc.noaa.gov/cdo-web/, last access: 20 April 2021).
2.2 Source apportionment
Positive matrix factorisation (PMF) is a bilinear receptor model which is used as a multivariate analysis tool to separate the total measured mass spectrum and its corresponding time series into individual sources or “factors” (Paatero and Tapper, 1994). The model can be summarised as
where X is the total measured matrix containing m rows of mass spectra for each time stamp and n columns of measured ions. The factor mass spectral profiles are contained within the m×p matrix F, and the time series contribution of each factor is expressed by the p×n matrix G. The residuals of the model are represented by the m×n matrix E, and the number of factors, p, are chosen by the model user, but it requires no a priori information for matrices F and G. The model iteratively fits F and G to the data in order to minimise the fitting parameter, Q, through a least-squares algorithm as
Here the elements of the residual, eij, and uncertainty, σij, matrices have rows, i, and columns, j, where in ideal circumstances Q=1 and the model would create a minimised solution that would explain all the measured data and leave the uncertainty within the residual matrix.
The analysis was carried out using the PMF Evaluation Tool (PET, v3.00) using the PMF2 algorithm in robust mode (Ulbrich et al., 2009). The error matrix was down-weighted based on the signal-to-noise ratio (SNR), where columns with an SNR < 2 were down-weighted by a factor of 2 and SNR < 0.2 by a factor of 10. Down-weighting of CO and its associated (derived) ions, CO+, H+, OH− and H2O, was also included to account for the influence of overcounting.
The primary PMF analysis was conducted on the organic matrix (2.39673×10⁷ data points), and a seven-factor solution was chosen following the procedure and rationale set out in Sects. S1 and S2. The procedure also includes multilinear regression analysis to help determine the chosen solution. The solution chosen is from PMF analysis carried out on all the measurement periods combined, as multilinear regressions showed this to fit more closely with external tracers (see Sect. S1 for more details).
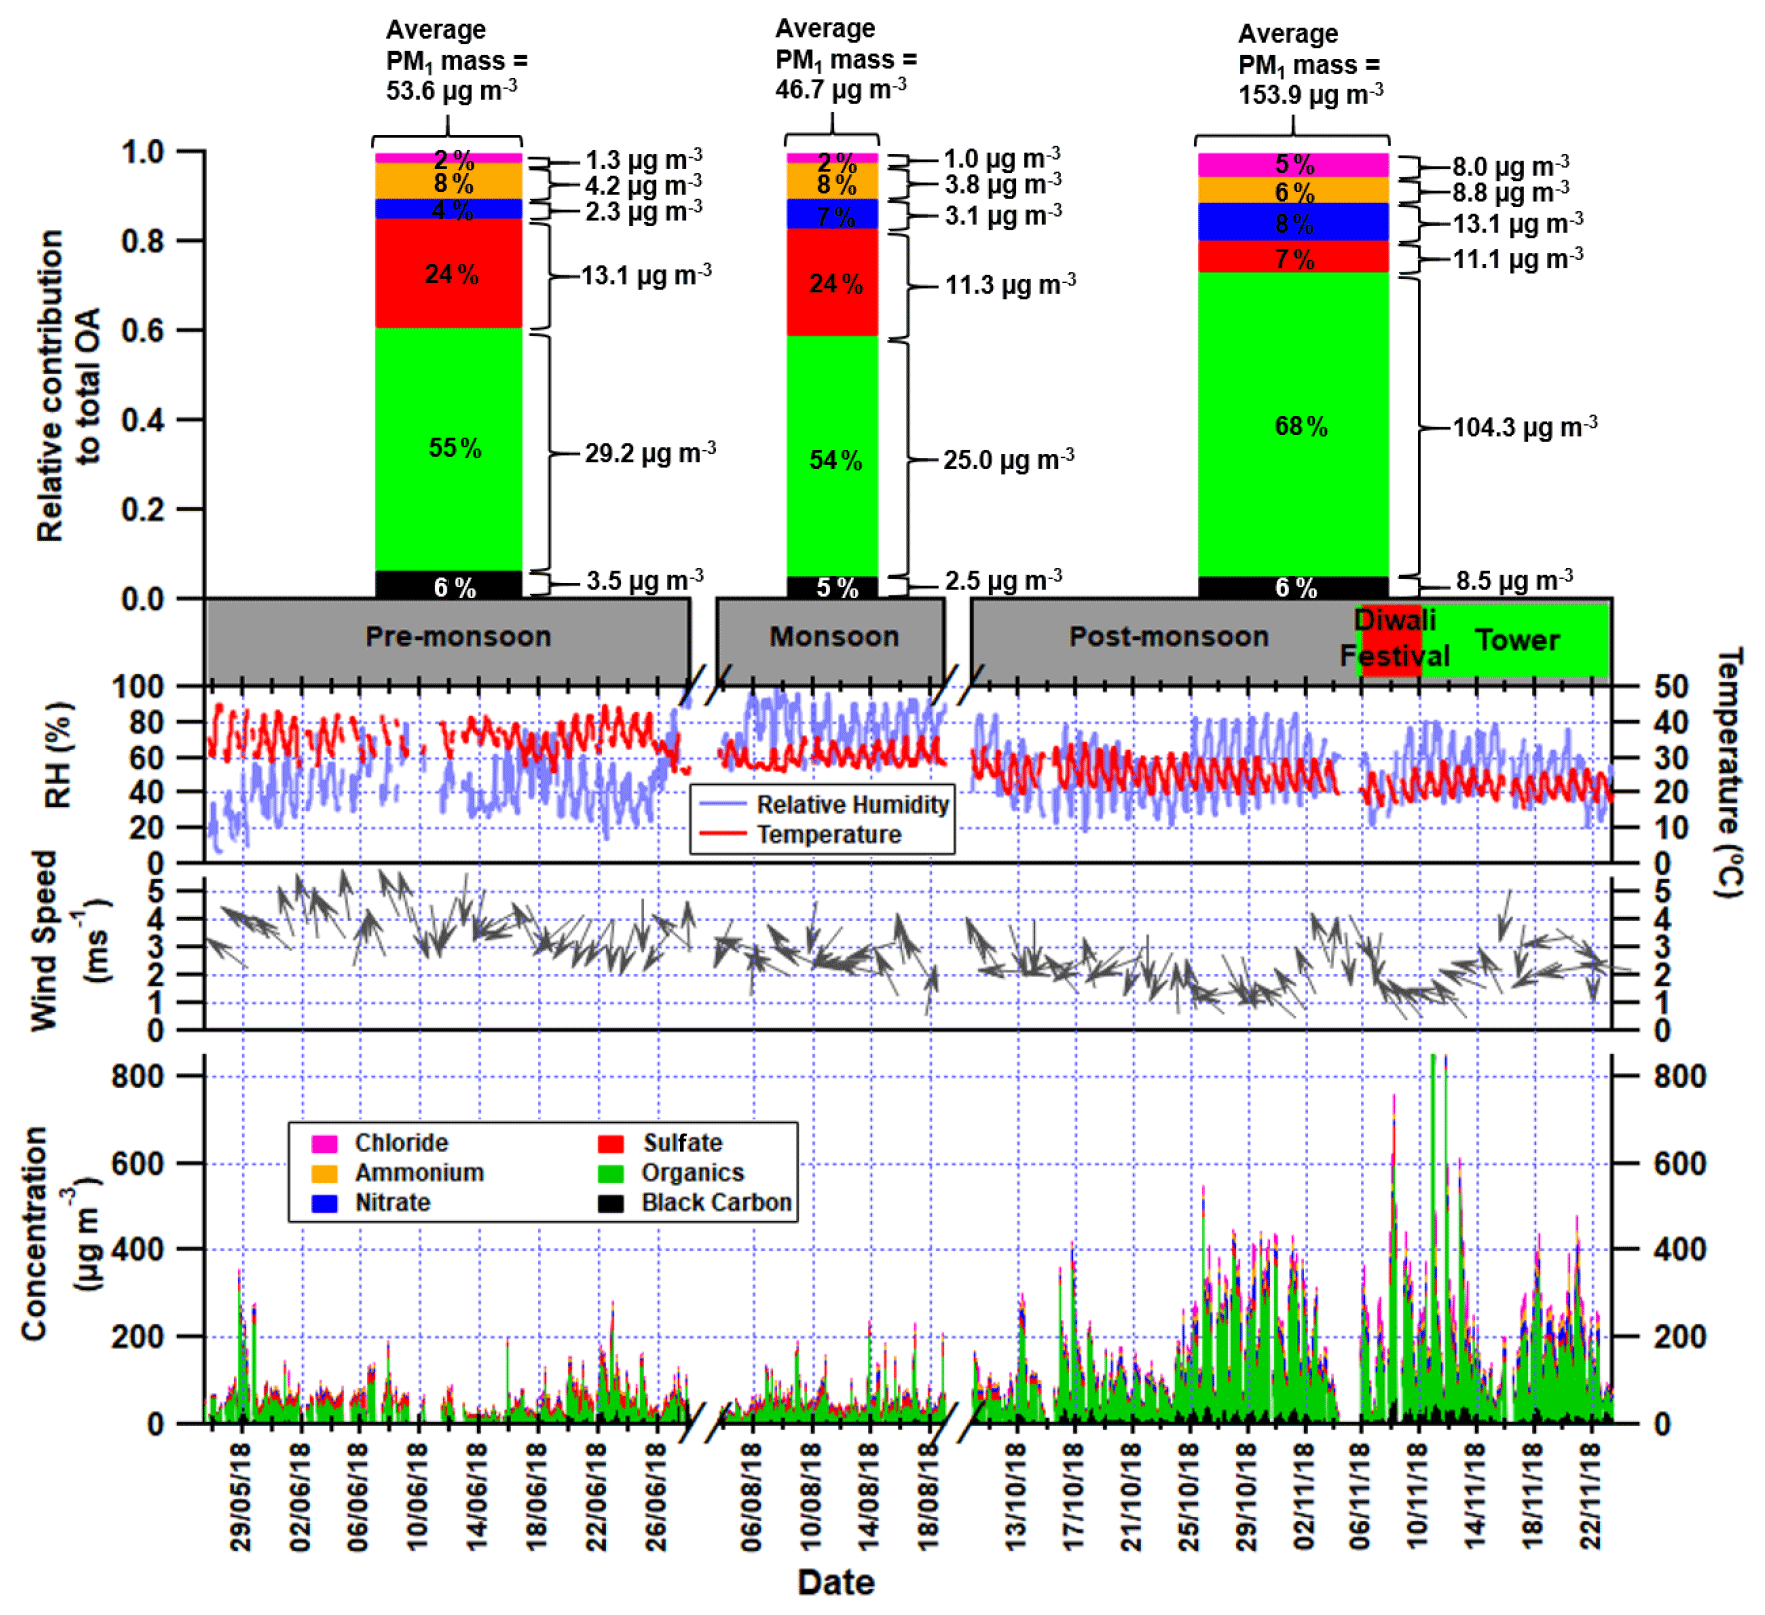
Figure 1First panel: average relative contributions of chloride, ammonium, nitrate, sulfate, organic aerosol and black carbon to the total PM1 mass loadings in the pre-monsoon, monsoon and post-monsoon periods; the average concentrations of each species are shown to the right of each bar (see Table S5 for values and statistics). Second panel: Gantt chart showing the measurement periods, where the red region shows the Diwali festival and the green region shows when the inlet was moved to a 30 m tower. Third panel: time series of the relative humidity and the temperature for the three measurement periods. Fourth panel: time series of the wind speed with arrows showing wind direction. Fifth panel: time series of stacked concentrations of aerosol species showing total PM1.
An alternative PMF solution was obtained, introducing inorganic species into the data matrix using the method set out by Sun et al. (2012). Briefly, selected ions for chloride (Cl+ 35, HCl+ 36), ammonium (NH+ 15, NH 16, NH 17), nitrate (NO+ 30, NO 46) and sulfate (SO+ 48, SO 64, SO 80, HSO 81, H2SO 98) were chosen, and it was confirmed that once combined to form one time series they correlated almost perfectly with the measured total mass of their represented inorganic species (r2∼ 1). All adjustments for relative ionisation and collection efficiencies were applied to the data before PMF analysis in order to determine accurate uncertainties and allow reasonable mixing of the organic and inorganic data. After PMF analysis, the selected ions were then divided by the total mass fraction of their represented inorganic species. This time a nine-factor solution was chosen (Sect. S3) and was developed partly to provide an analysis product that would be comparable with the earlier Aerosol Chemical Speciation Monitor (ACSM) PMF results for Delhi of Bhandari et al. (2020). Additionally, it provides information on the association between the organic factors and the ions that are normally associated with inorganic compounds.
Although there is some ambiguity in the choice of the ideal solutions, PMF was chosen over the more advanced multilinear engine (ME2; Canonaco et al., 2013), which allows individual factors to be constrained with a priori information because, for India, reference spectra have not yet been established and especially not for high-resolution spectra covering the wide range of used in our analysis.
3.1 Inorganic and organic PM concentrations
The concentrations of PM species during the pre-monsoon and monsoon periods are similar although slightly lower in the latter, presumably due to increased rainfall and associated washout (Fig. 1). However, most PM component concentrations were considerably higher during the post-monsoon period, and total-PM1 mass increases by 188 % over the pre-monsoon period. Chloride and nitrate concentrations increase the most, by a factor of ∼ 5–6, suggesting there is a significant additional source of chloride and nitrate during the post-monsoon period. This is also consistent with increased partitioning of (semi-)volatile aerosol compounds into the aerosol phase during the cooler post-monsoon period. Ammonium and organic aerosol underwent a ∼ 2–3 fold increase, whereas sulfate is the only species whose absolute concentrations did not increase during the post-monsoon period. This has also been noted in previous measurements taken in Delhi using an ACSM where sulfate was on average 10 µg m−3 across spring, summer and the monsoon period (Gani et al., 2019).
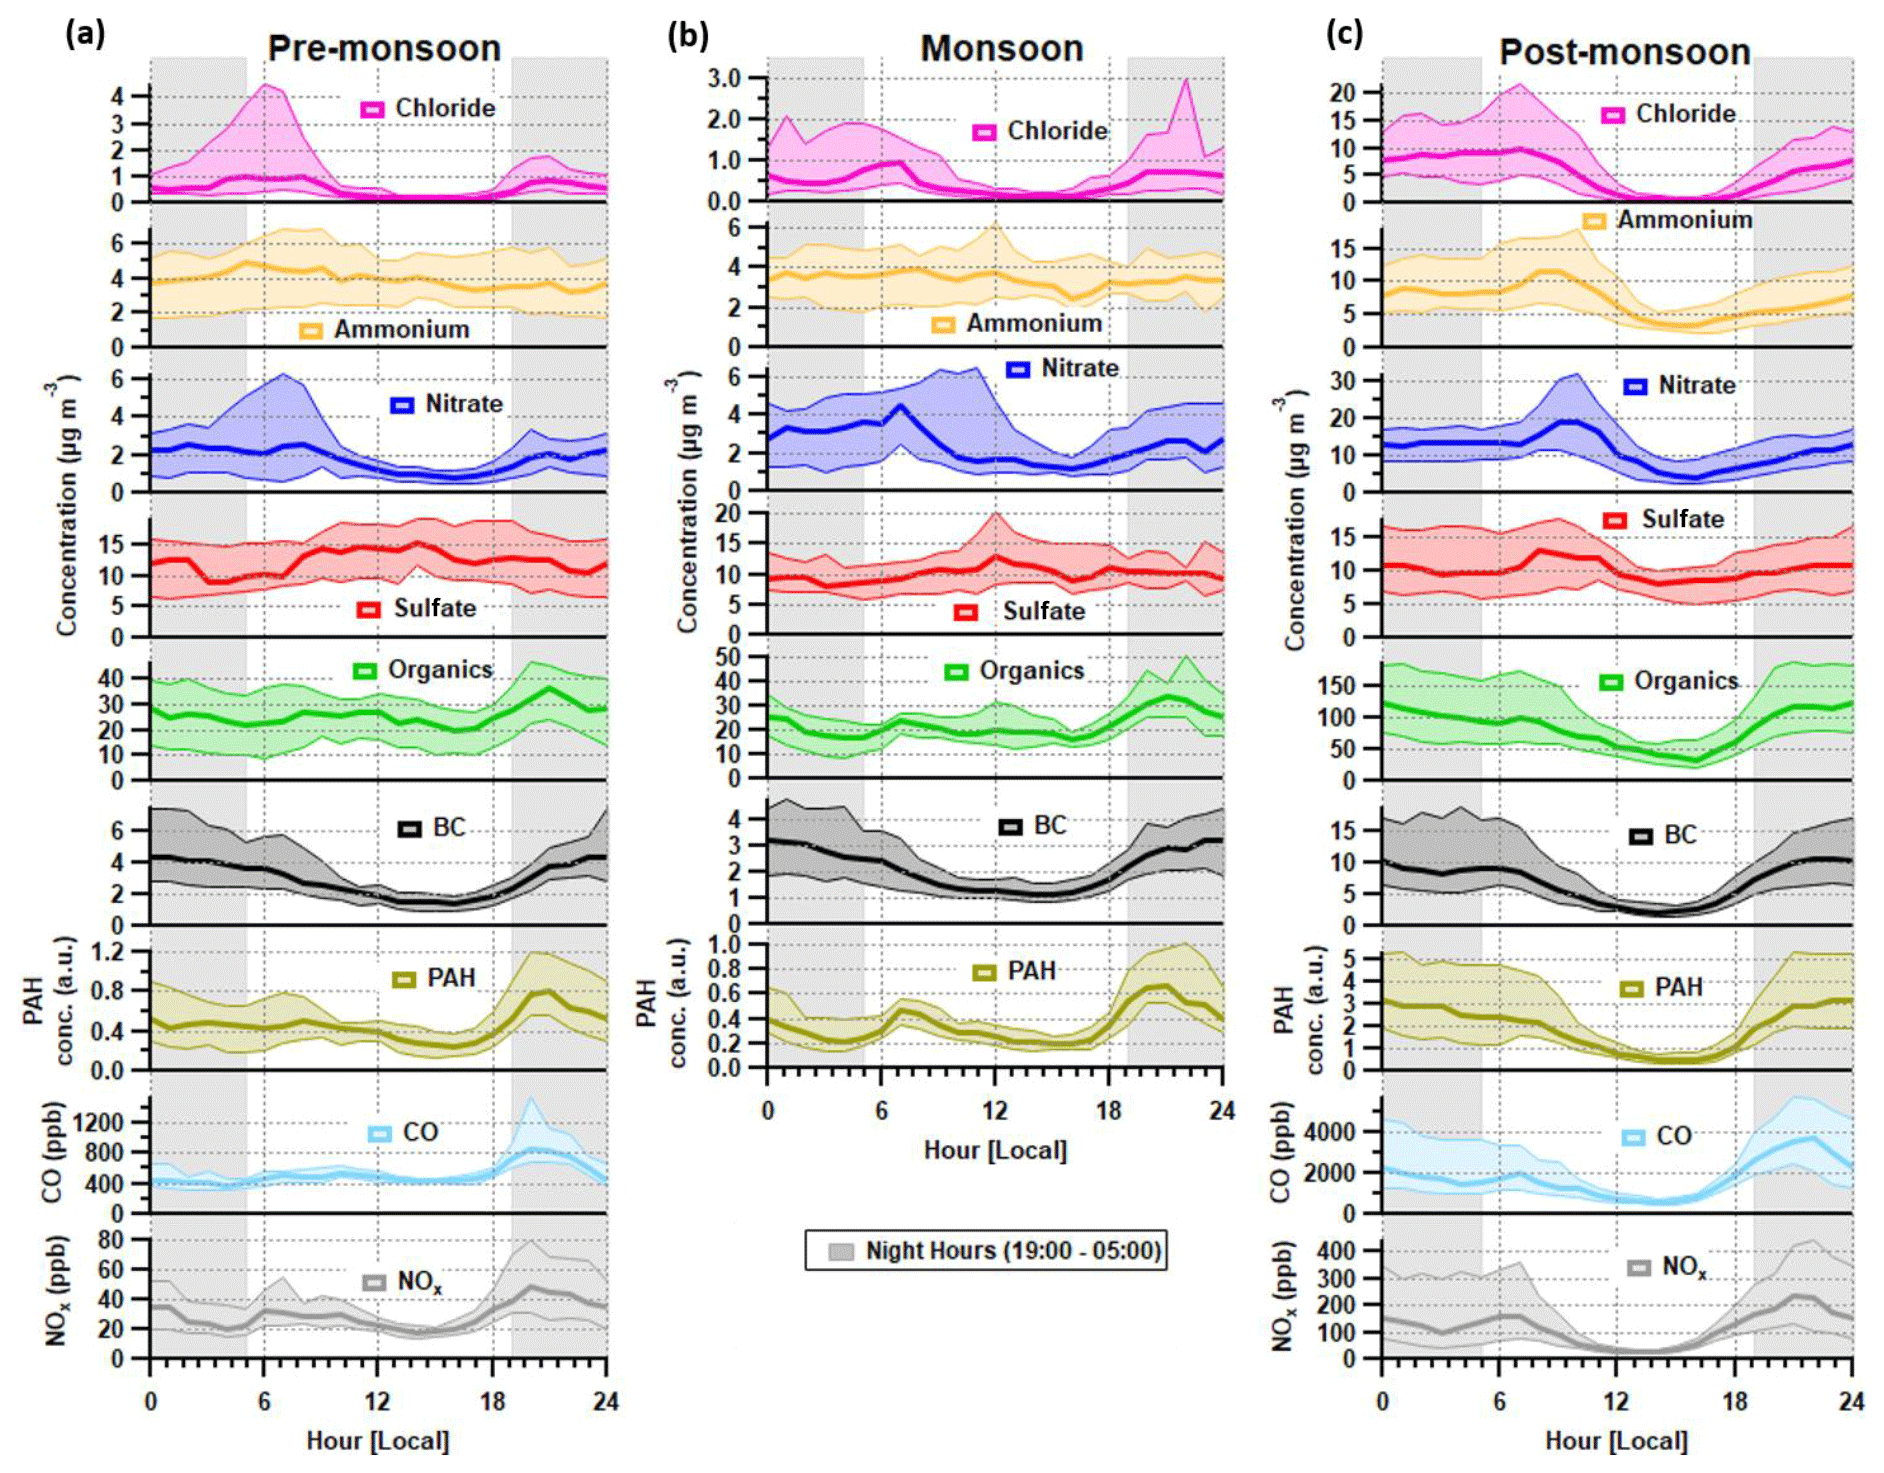
Figure 2Median diurnal cycles for aerosol chemical species and for BC, CO and NOx during the (a) pre-monsoon, (b) monsoon and (c) post-monsoon periods. The median concentration is represented by the thick line, and the interquartile range is represented by the shading. Regions shaded in grey are night hours. Data for CO and NOx are not available for the monsoon period.
Preliminary analyses of the eddy-covariance flux measurements (Di Marco et al., 2019) made during the post-monsoon tower period suggest that whilst concentrations peaked at night, local emissions peaked during the late morning and afternoon, suggesting that boundary-layer dynamics exercised a dominant control over surface concentrations. Concentrations of all species, with the possible exception of sulfate, decreased significantly in the afternoon during the post-monsoon period (Fig. 2). This was mainly due to the contraction of the boundary layer during the night and early hours of the morning being more pronounced, which removes possible afternoon peaks from specific sources, e.g. lunch hour cooking activities (Nakoudi et al., 2019; Reyes-Villegas et al., 2020). The pre-monsoon and monsoon diurnal cycles show species concentrations, excluding nitrate and chloride, were less affected by the higher boundary layer in the afternoon. The monsoon period is the least affected period as there were midday peaks for sulfate, ammonium and organic aerosol.
Morning peaks were observed in the diurnal cycle for nitrate, ammonium and chloride (Fig. 2). The nitrate peaks are earlier in the morning during the pre-monsoon period compared to other periods, which may relate to an earlier rise in temperature compared to monsoon and post-monsoon periods. The diurnal cycle for chloride shows a regular peak at ∼ 06:00–08:00, and the details of possible sources will be discussed in Sect. 4.3.1.
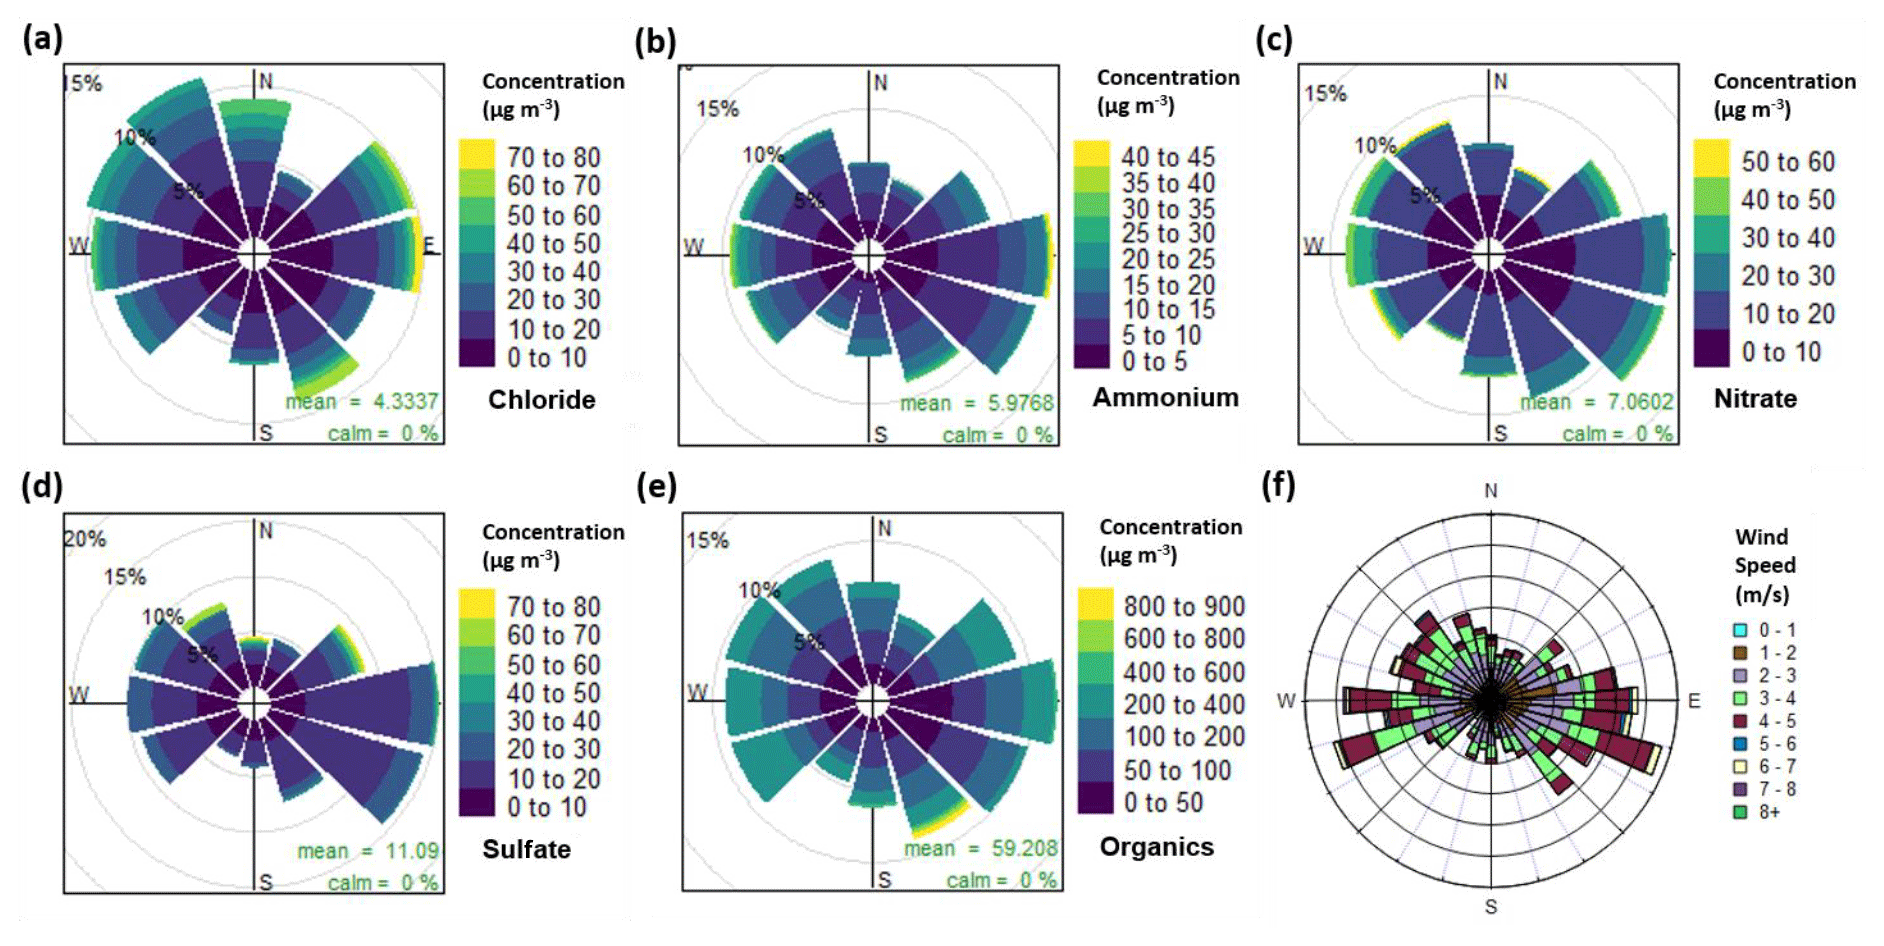
Figure 3Pollution roses for (a) chloride, (b) ammonium, (c) nitrate, (d) sulfate and (e) organic aerosol, along with (f) a wind rose plot for all measurement periods combined. The pollution roses show 30∘ wind vectors, and their size is proportional to the percentage contribution to the mean concentration. The vectors are divided into concentration bins based on the colour scale in the legend.
The pollution roses (showing the concentration distribution by wind sector, Fig. 3) for nitrate and ammonium show higher contributions to PM1 mass with a south-westerly wind direction, but there is no clear pattern. Figure S8 shows polar graphs (i.e. the wind-sector distribution of the raw 30 min measurements) which in particular illustrate the wind direction corresponding to maximum concentrations. Nitrate and ammonium show scattered polar graphs, which indicates no clear source directions were associated with extreme concentrations. The sulfate pollution rose shows a higher mass contribution with a south-easterly wind, but its polar graph shows maximum concentrations originated from the north and north-east.
The pollution rose and polar graph for organic aerosol are highly spread. The pollution rose suggests there is a slight increase in the organic mass when originating from the east and south-east, but this is closely followed by contributions from the west and north-west (Fig. 3e). Its polar graph also shows some extreme values existing from the south-east (Fig. S8). This spread can be explained by a low wind speed and a low boundary layer height causing a significant increase in concentrations. In Fig. 1, PM1 shows a large increase during periods of low wind speed and an exponential decay in PM1 concentration with increasing wind speed. Meteorology therefore plays an important role during the high concentration periods.
The chloride pollution rose (Fig. 3a) shows no clear pattern in its wind direction but there is a slightly higher contribution originating from the west, north-west and the east. The chloride polar graph in Fig. S8 is also spread, showing large peaks which coincide with the south-east, east, north-east and north. The pollution roses for each diurnal hour in Fig. S9 show the directional trend of chloride in more detail. Here, the large peak in the morning (06:00–08:00) corresponds to a mixed spread of wind directions with a slight preference for the west, south-west, south-east and north-west, which suggests mixed sources of chloride.
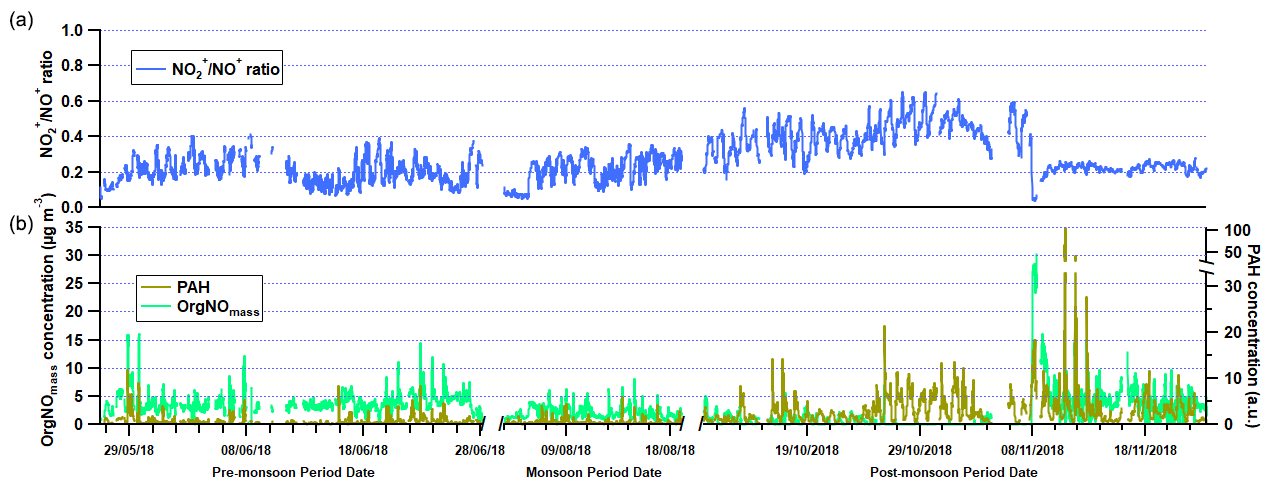
Figure 4(a) Time series of NO NO+ ratio in the three measurement periods. (b) Time series of polyaromatic hydrocarbon (PAH) uncalibrated concentrations and organic nitrogen oxide species (OrgNOmass) concentrations.
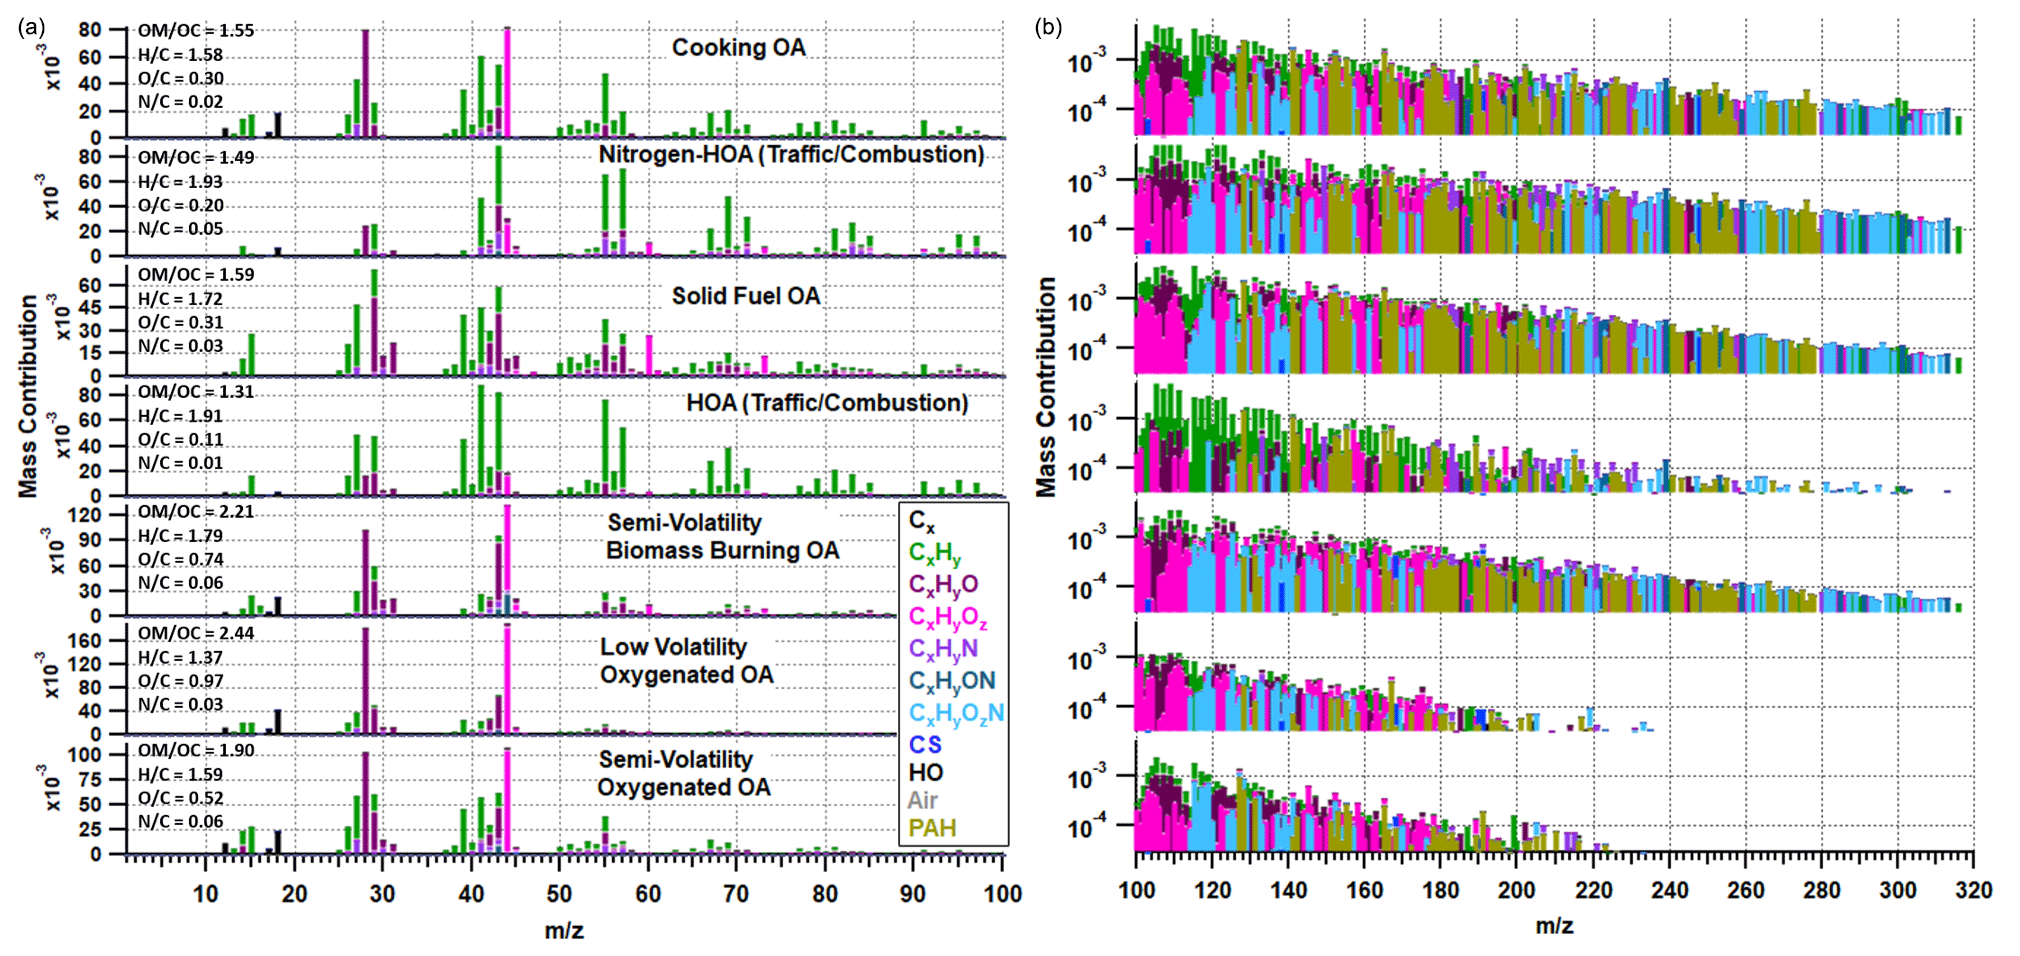
Figure 5Organic-only PMF solution with elemental ratios shown for each factor in the left-hand corner of each spectrum. The mass spectra on the left show 12–100 on a linear scale, while the spectra to the right show 100–320 on a logarithmic scale. The peaks are coloured based on the chemical families shown in the legend.
3.2 Concentrations of polyaromatic hydrocarbons and OrgNO
The presence of OrgNO species is evident in Fig. 4, and there is a gradual drop in concentration with time over the pre-monsoon, monsoon and earlier half of the post-monsoon period. This may suggest an increase in temperature and a decrease in relative humidity are key to OrgNO formation in Delhi. During Diwali (7 November 2018) there is also a sharp increase in OrgNO concentrations to > 20 µg m−3, and this is likely due to large amounts of pyrotechnical emissions. Similar peaks in AMS-measured OrgNO have been seen during a large pyrotechnical event in the UK called bonfire night (Reyes-Villegas et al., 2018b).
The time series of PAH concentrations in Fig. 4 are uncalibrated concentrations, and further lab work (such as the work carried out in Herring et al., 2015) is required to establish absolute concentrations, which goes beyond the scope of this study. However, the data do show the relative change in PAHs is small between the pre-monsoon and monsoon periods, suggesting consistent sources are responsible, such as traffic, solid fuel burning or cooking activities. There is also a large increase in PAHs during the post-monsoon period when the burning of the rice crop residue begins (Kulkarni et al., 2020), but it is also likely a result of a lower boundary layer. Three large peaks are observed during the week of the Diwali holiday, and each peak occurs during the late hours of the night (∼ 22:00–24:00), suggesting an infrequent local source. It is uncertain what this source is, and through source apportionment analysis (see Sect. 3.3 below) the PAH contribution to these peaks is split between sources, suggesting they cannot be resolved through PMF without the unknown source occurring more often than these three occasions.
3.3 Source apportionment concentrations
The organic-only PMF solution is presented in Figs. 5 and 6, while the organic–inorganic solution is presented in the Supplement (Sect. S8). The organic–inorganic solution is not considered the most representative of sources, as it may be influenced by thermodynamic effects; i.e. factors may be resolved based on similarities in volatility rather than source. However, the organic–inorganic solution is referred to within this section as it provides insight into the combined behaviour of inorganic and organic species.
The seven-factor organic solution includes two hydrocarbon-like organic aerosol (HOA) factors relating to traffic, where one contains more nitrogen (NHOA) and is characterised by a larger contribution from higher ions including PAHs (see below). Such N-rich HOA factors are rarely reported in the literature, but it was a persistent feature in our PMF sensitivity studies (see Sect. S2). There are also two burning-related factors separated mainly by their oxygenation and source origin, which we interpret to reflect primary solid fuel organic aerosol (SFOA) and a semi-volatility biomass burning organic aerosol (SVBBOA), also on the basis of the correlation with regional fire counts (see Sect. 4.3 below). A cooking organic aerosol (COA) factor is also resolved along with two oxygenated organic aerosol factors (OOAs) which are separated based on their volatility: low-volatility OOA (LVOOA) and semi-volatility OOA (SVOOA). Using multilinear regressions, the traffic and burning factors were determined to better correlate with external tracers when separated (see Sect. S2). This is further supported by a PMF study on PTR-MS measurements taken in Delhi, which also resolved two traffic and two burning factors (Wang et al., 2020). A summary of Pearson's r correlation coefficients for the combined and separated factors is shown in Table S4.
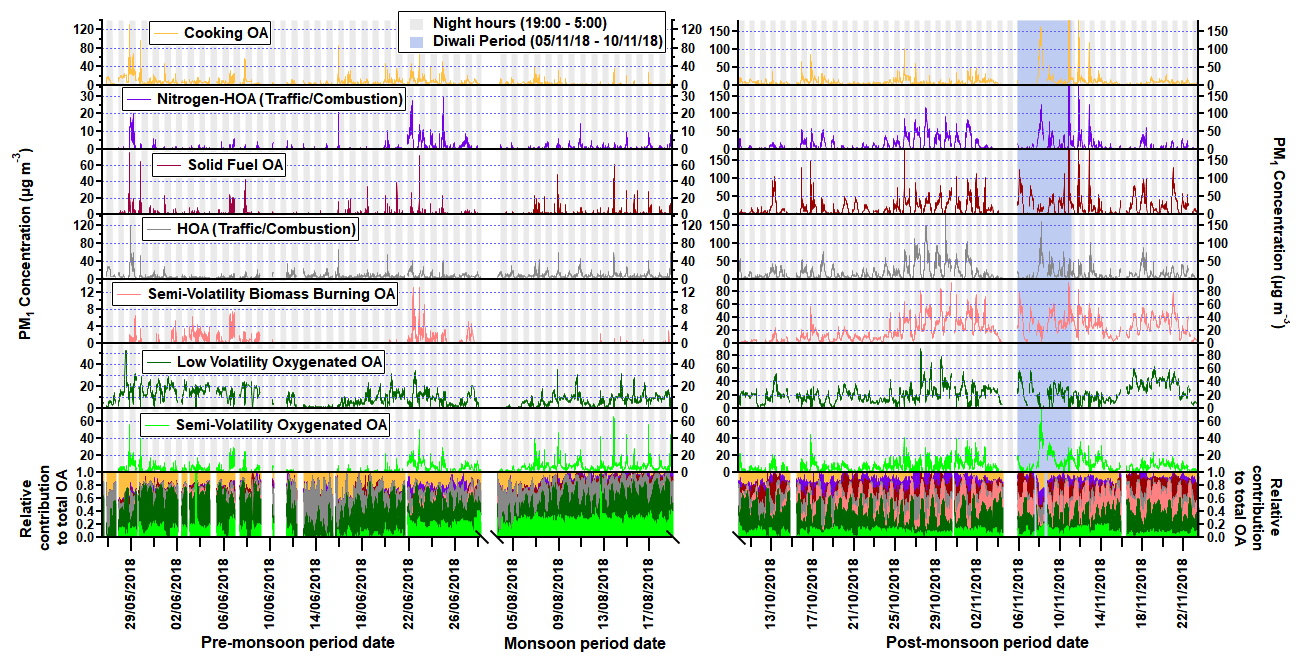
Figure 6Time series for each factor where the x axis is broken to show each measurement period. Regions shaded in grey are night hours, and the Diwali period is shaded in light blue. The time series of the normalised concentrations are also shown in the bottom section of the graph.
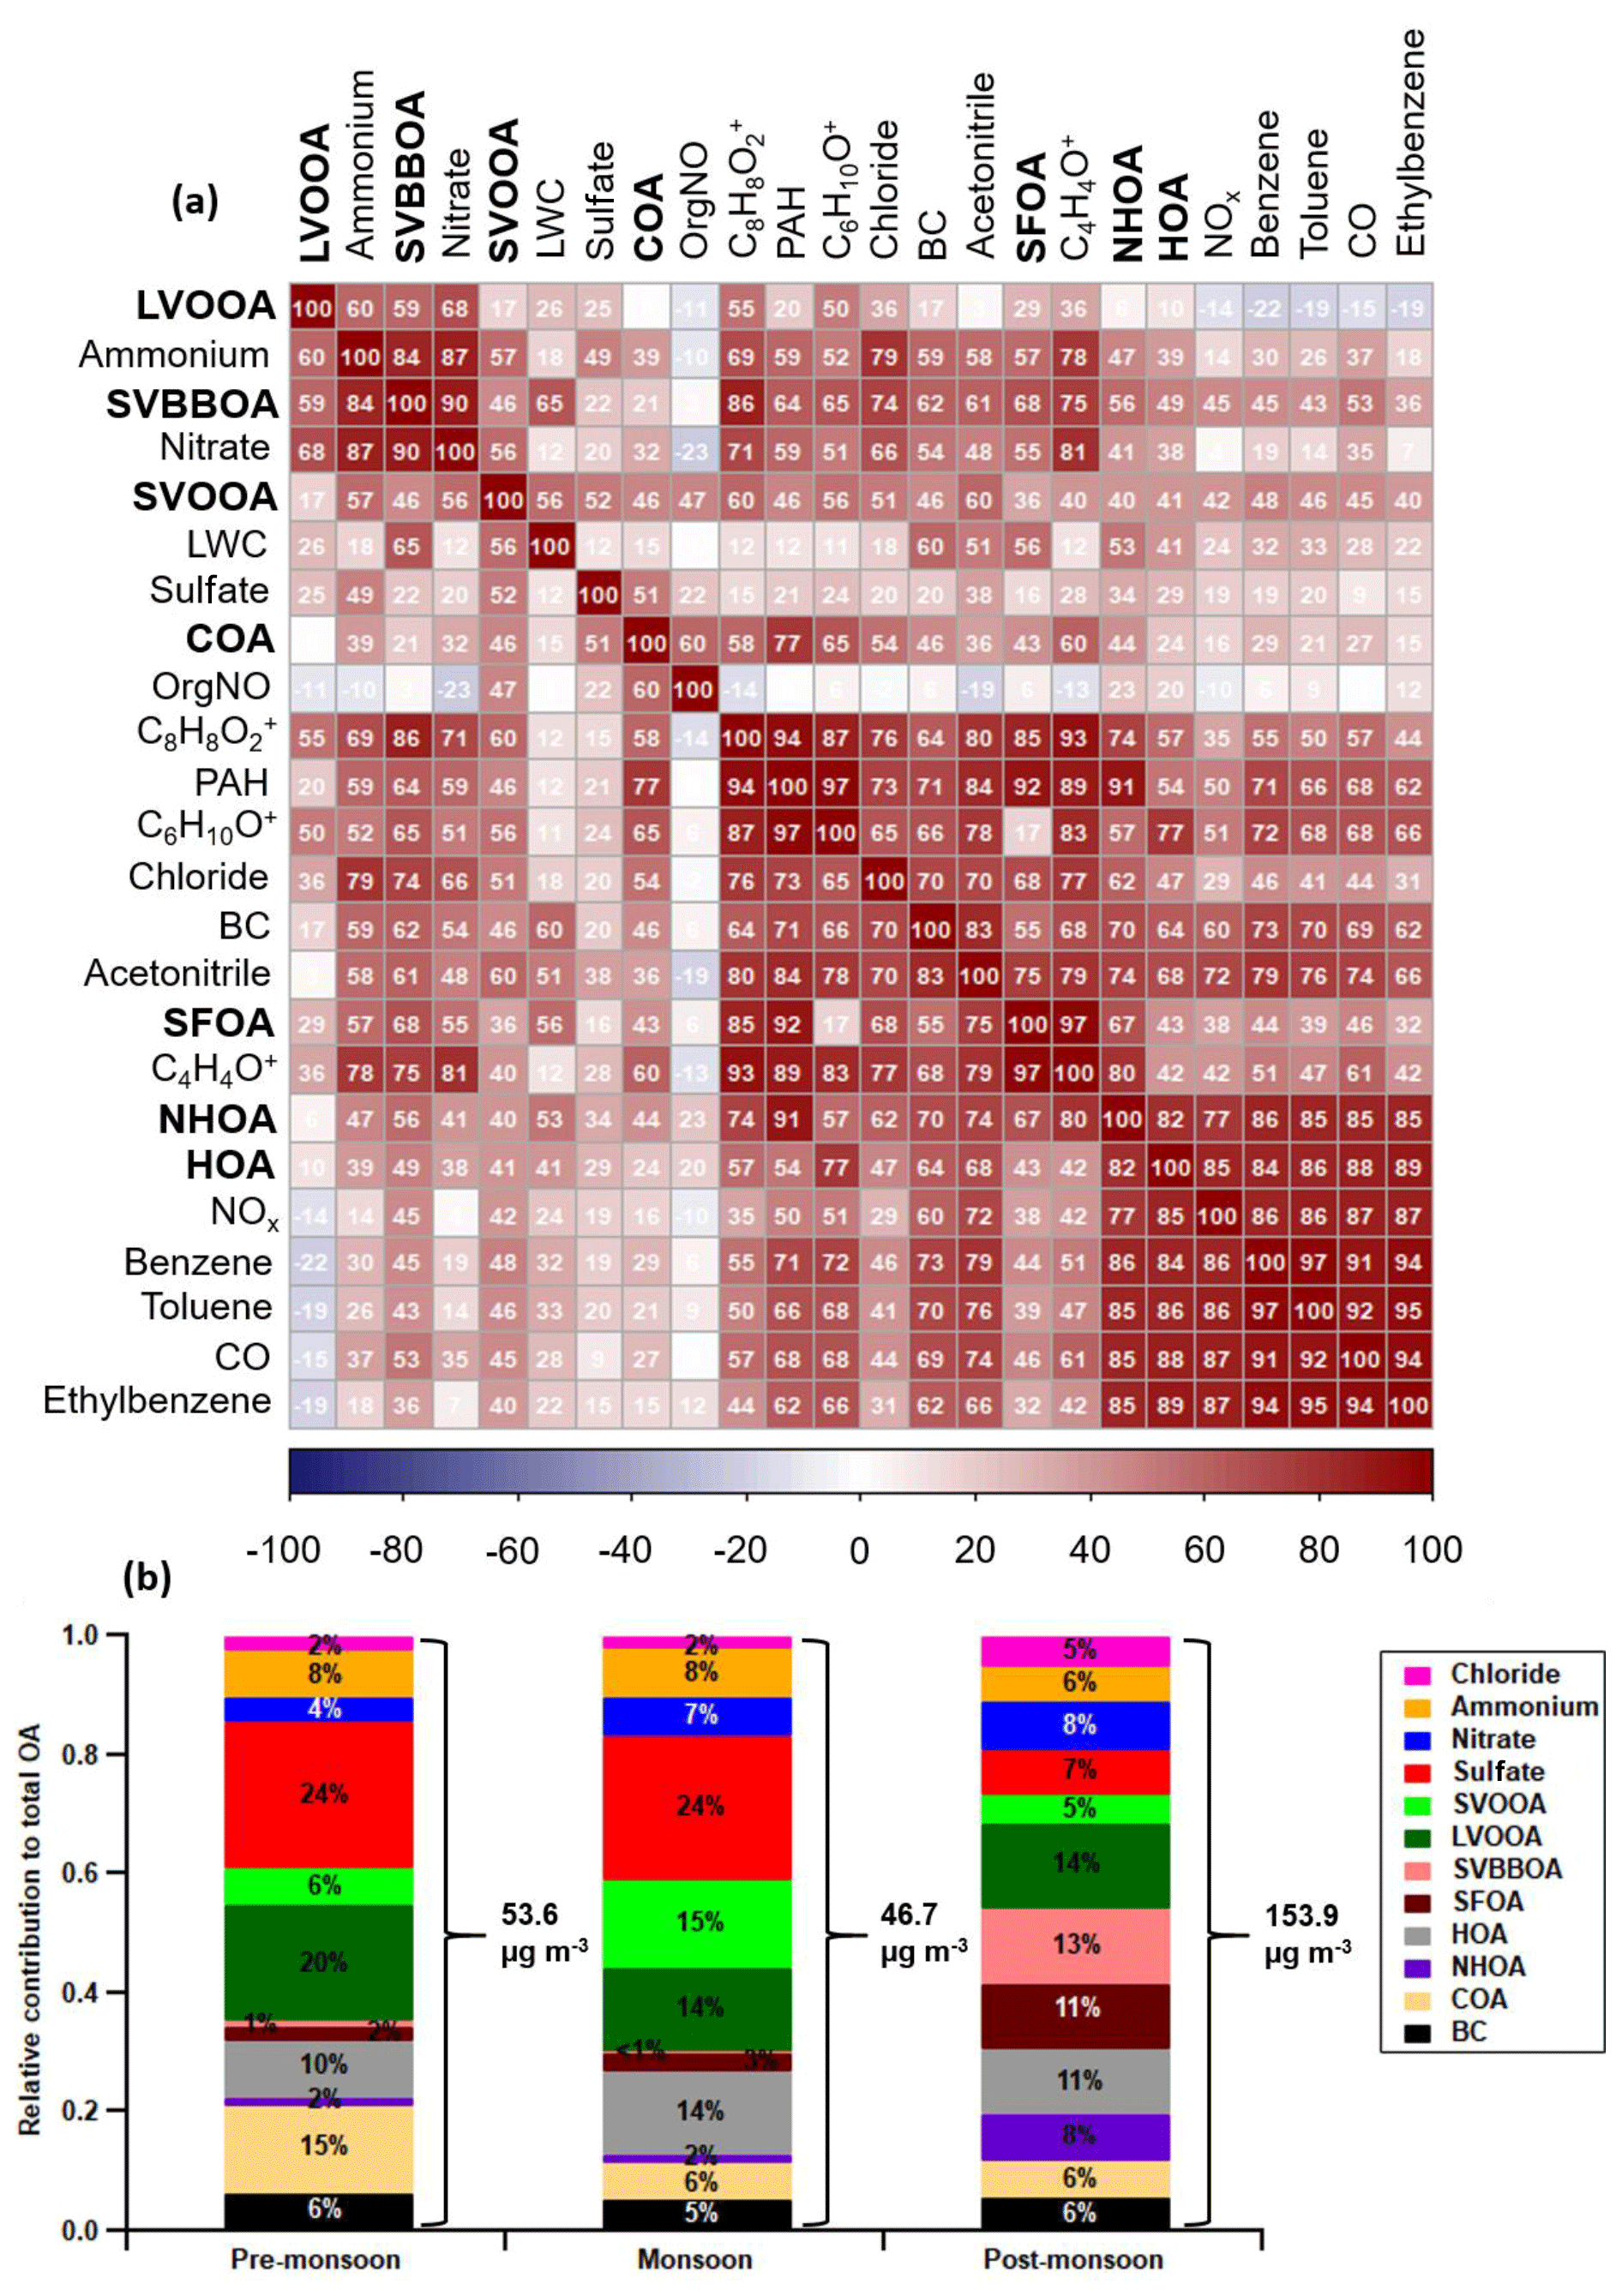
Figure 7Correlation matrix (a) between the AMS OA factors (bold), internal tracers and external tracers for the combined dataset (all seasons). The correlation coefficients are ordered using hierarchical cluster analysis. The relative contribution of OA factors, BC and inorganic species to total PM1 for each period (b) where the total average PM1 is shown using right curly brackets (see Table S5 for values and statistics). The three ions [C6H10O]+, [C8H8O2]+ and [C4H4O]+ are, respectively, an organic acid fragment used for COA determination, a fragment of dibenzodioxin called benzodioxan, and a fragment of dibenzofuran called furan.
3.3.1 Hydrocarbon-like organic aerosol (HOA)
Both HOA and NHOA have characteristically large peaks at 55 and 57 along with little evidence of oxidation (Fig. 5). Their H : C values are the highest amongst the identified factors, and they have the strongest correlations with measurements of BC, CO and NOx (Fig. 7). The diurnal cycle for both factors shows a clear peak in the evening when traffic is busy (Fig. 8). The two factors are therefore assigned as traffic sources, which is supported by strong correlations with co-located measurements of benzene, toluene and ethylbenzene, which are commonly used as tracers for traffic emissions (Slowik et al., 2010; Crippa et al., 2013).
From Fig. 9, a large fraction of HOA mass follows a south-westerly wind which points towards a nearby train station ∼ 0.5 km from the measurement site. There is also a preference for westerly and north-westerly winds which coincide with busy motorway intersections (∼ 0.1 and ∼ 0.7 km). NHOA shows a similar preference for both the north-west and south-west; however, there is a much larger spread of mass between wind directions. A larger spread for NHOA when compared to HOA could suggest that atmospheric processing is occurring, as both have similar traffic origins. NHOA could, therefore, be a result of aged or oxidised traffic emissions allowing it to be transported further and causing a mixture of wind directional preferences.
One of the main compositional differences between NHOA and HOA is a higher nitrogen content in NHOA which is evident in the mass profiles (Fig. 5). Peaks at 41 ([C2H3N]+), 43 ([C2H5N]+), 55 ([C3H5N]+), 57 ([C3H7N]+), 83 ([C5H9N]+), and 97 ([C6H11N]+) are all prominent in NHOA but not in HOA. The PAH content of NHOA and HOA is also very different, with the fraction of PAHs within NHOA being high at 3.17 % compared with HOA at 1.00 %. The chemical functionality of the PAH fraction within each factor is shown in Fig. 10. The NHOA factor contributes the highest relative amounts of amino PAHs (APAHs) and nitrogen–oxygen-substituted PAHs (NOPAHs), which coincides with this factor containing more nitrogen. NHOA also has the second highest relative concentrations of oxidised PAH (OPAH), after SFOA. A large percentage of OPAH mass is due to the species dibenzodioxin, dibenzopyran and acenaphthoquinone (Fig. S13). The presence of dibenzodioxin is also supported by a significant correlation with its mass spectral fragment, benzodioxan ([C8H8O2]+) (Pearson's r=0.80) (Fig. 7).
The total mass of traffic-related factors (HOA + NHOA) is the largest of the primary sources (compared with burning equals SFOA + SVBBOA and cooking equals COA) during the pre-monsoon and monsoon periods. It is also the joint second largest, similar to secondary organic aerosol (LVOOA + SVOOA), in the post-monsoon period where its average concentration reaches 29.13 µg m−3 (Fig. 7).
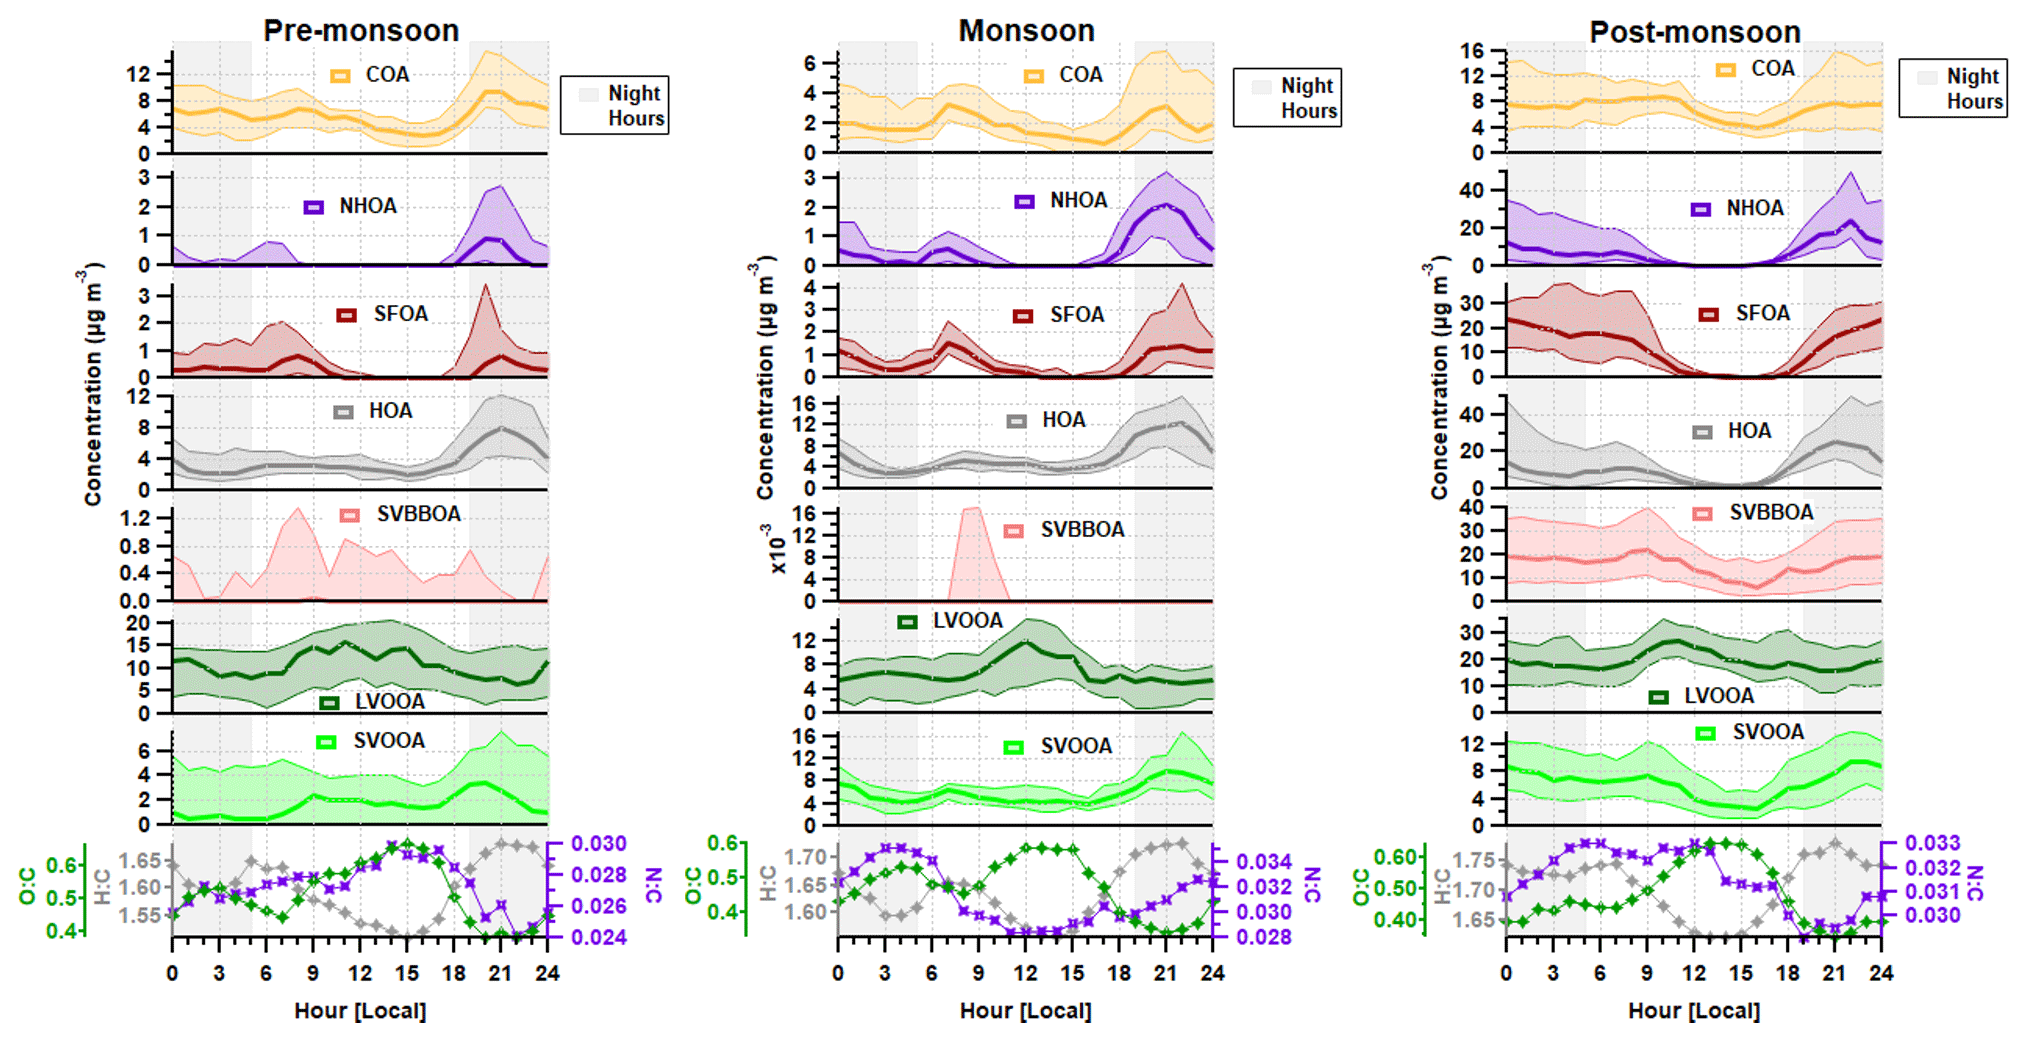
Figure 8Median diurnal cycles of the factor solutions for the three measurement periods (interquartile range indicated by the shading) along with the elemental ratios. Regions shaded in grey are night hours.
3.3.2 Cooking organic aerosol (COA)
The COA mass profile in Fig. 5 has a characteristically high 55 : 57 nominal mass ratio (2.87) and high 41 and 43 as seen in previous studies (Allan et al., 2010; Mohr et al., 2012; Sun et al., 2016). The COA time series also has a moderate correlation with the AMS-measured [C6H10O]+ peak (Pearson's r=0.65), which is often used as an internal tracer for cooking-related factors (Sun et al., 2016). The mass spectrum has an uncharacteristically large peak at 44 (and the inferred 28) and as a consequence a large O : C ratio (0.33) when compared to literature values presented in Table S6. There is also a deviation from literature when observing the Van Krevelen (VK) diagram in Fig. S15 as the high O : C pulls it away from a gradient of −2 and towards a gradient of −1. This relates to a difference in composition from the normal aldehydes and ketones to carboxylic acids. The reasons for this are discussed in Sect. 4.3.
The diurnal cycle for COA has a clear morning peak across the three periods, but it is hard to interpret the midday dynamics because of the pronounced boundary layer affect, whereas in other studies there is a clear lunchtime peak (Fig. 8). There is a slight rise in the median at 24:00 for the pre-monsoon and monsoon periods, but the post-monsoon period shows a more defined lunchtime peak and supports this factor being related to cooking activities.
The wind rose for COA (Fig. 9) is one of the few factors to have a clear pattern and shows that the majority of its mass is coming from the north-east, east and south-east. This is likely from food kiosks, shelters and vendors situated outside the grounds of IGDTUW. The polar graph shows a spread of large peaks matching a northerly wind (Fig. S10), which coincides with the location of shared student kitchens at IGDTUW. The same observations were made by a study measuring n-alkanoic acids at IGDTUW (Gadi et al., 2019). The polar graph also shows maximum concentrations coincide with a south-easterly direction (Fig. S10h). The timing of these peaks matches with maxima seen in polar graphs for PAH, SFOA and NHOA (Fig. S10), which suggests a common source.
The COA factor accounts for 23 % of the total PAH mass and has a particularly high peak at 91 which is seen in the majority of studies with COA measurements (Mohr et al., 2012; Dall'Osto et al., 2013). The PAH composition of COA is mainly unsubstituted PAHs (UnSubPAHs) and also contributes the largest amount of UnSubPAHs out of all factors (Fig. 10). Its defining peaks described in Sect. S6 are similar to species seen in literature linked to cooking activities, although it is shown that they largely depend on the fuel used such as dung cake and wood (Singh et al., 2010, 2016; Masih et al., 2012; Shivani et al., 2019).
The largest percentage mass contribution of COA to total OA was during the pre-monsoon period (15 %), which equates to an average concentration of 7.84 µg m−3. There was a relatively small (22 %) increase to 9.60 µg m−3 in the post-monsoon period, the lowest relative increase out of all factors and aerosol species (Fig. 7). This suggests cooking activities were relatively consistent throughout the year. The monsoon period is, however, inconsistent with this interpretation as there was a large 64 % decrease in COA, which is the largest percentage drop of all factors and aerosol species. This may be linked to meteorology or a decrease in outside cooking emissions as is discussed later.
3.3.3 Solid fuel organic aerosol and semi-volatility biomass burning organic aerosol (SFOA and SVBBOA)
The SFOA factor has a strong correlation with gas-phase acetonitrile (Pearson's r=0.75) and has large peaks at 60 and 73 which are the typical AMS biomass burning tracers (Weimer et al., 2008). SVBBOA shares the same peaks at 60 and 73; however, it has a weaker correlation with acetonitrile (Pearson's r=0.61). This may be due to the level of oxidation within SVBBOA as its mass spectrum has a large peak at 44 (and consequently 28), showing evidence that the aerosol is aged.
The O : C ratio for SVBBOA is relatively high (O : C = 0.74) and fits between the ratios for LVOOA and SVOOA (Fig. 5), suggesting it is secondary in nature. This is consistent with the VK diagram in Fig. S15 which shows SVBBOA lies between the oxidation states ( of −1 and 0, typically where LVOOA and SVOOA literature values overlap. SVBBOA also appears to be closer to the alcohol functional group gradient (m=0), which may explain the high correlation with LWC (Pearson's r=0.65) due to alcohol functionalised compounds being more water-soluble. Additionally, SVBBOA has a particularly high N : C value (0.06) and has prominent CxHyNzOt peaks which show similarities to primary amides through mass spectral comparisons described in Sect. S5. This shows SVBBOA has a complex composition of oxidised species.
The lower volatility of SVBBOA is also evident in its post-monsoon diurnal cycle as it is less affected in the afternoon by the temperature and boundary layer changes that appear to affect primary emitting factors significantly (Fig. 8). SFOA however has more defined peaks in the morning and evening, which is consistent with its aliphatic mass spectral composition, indicating it is fresh primary organic aerosol.
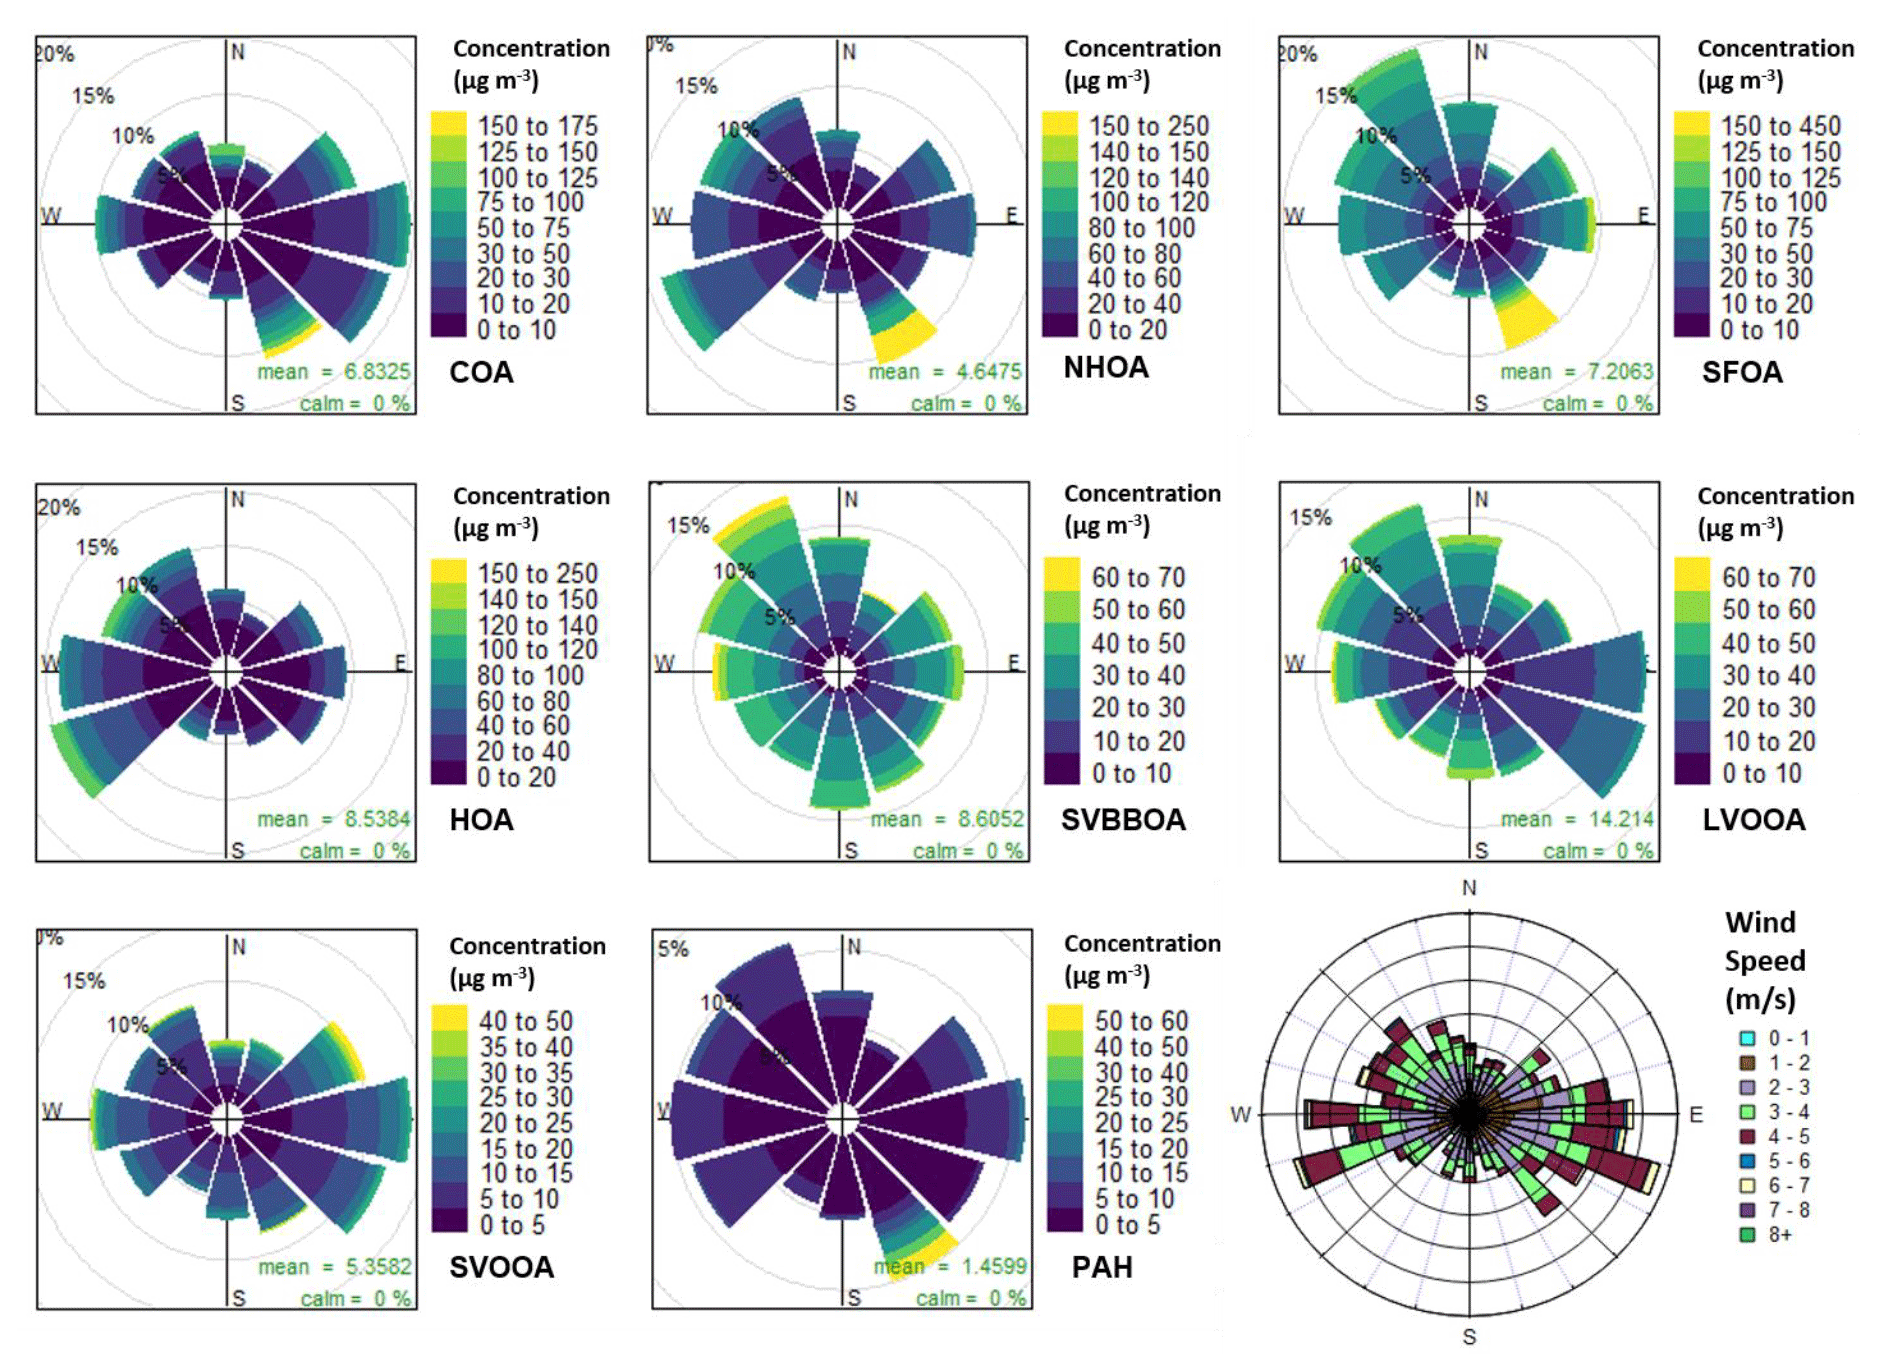
Figure 9Pollution roses for each factor and uncalibrated PAH concentrations along with a wind rose. The pollution roses show 30∘ wind vectors, and their size is proportional to the percentage contribution to the mean concentration. The vectors are divided into concentration bins based on the colour scale in the legend.
The pollution rose for SFOA shows the majority of its mass originates from the north-west but high concentrations also originate from the east and south-east (Fig. 9). This can be seen more clearly in Fig. S10, showing large peaks in SFOA originating from the south-east and east. These observations coincide with a large cremation site located east along the Yamuna river (∼ 500–750 m), which likely contributes to SFOA mass (Fig. S16). Conversely, SVBBOA mass shows a slight preference for a westerly and north-westerly wind, but overall there is a larger spread. This further supports that SVBBOA is more secondary in origin.
SFOA and SVBBOA have the strongest correlations with chloride (Pearson's r=0.68 and 0.74, respectively), which suggests they have an affinity with chloride sources (Fig. 7). The application of the second PMF analysis where inorganic AMS measurements were combined with the organic matrix (Sect. S10) resulted in a biomass burning factor which included the majority of the ammonium chloride mass (Fig. S17). Additionally, SVBBOA has the strongest correlations with ammonium and nitrate, out of all factors (Pearson's r=0.84 and 0.90, respectively). These results suggest that the high levels of ammonium nitrate, and particularly ammonium chloride, in the post-monsoon period are associated with SVBBOA.
SFOA and SVBBOA have substantially different correlations with PAHs (Pearson's r=0.92 and 0.64, respectively). In fact, SFOA has the greatest contribution from PAHs (3.3 %) and contributes 26 % to the total PAH mass (Fig. 10). A large portion of its PAH mass is OPAH, and the same is seen for SVBBOA. They both also have prominent UnSubPAHs; however, SFOA has a larger naphthalene ( 127 and 128) content (Fig. S13). This is also seen in the PTR-QiTOF correlation mass spectrum where SFOA has a significantly stronger correlation with VOC furan and naphthalene when compared to SVBBOA (Fig. S14).
One of the strongest correlations of AMS ions with SFOA (Fig. S14) is the dibenzodioxin fragment, benzodioxan [C8H8O2]+, and this coincides with high correlations with furan ([C4H4O]+) and chloride (Fig. 7), which indicates SFOA may have a strong association with polychlorinated dibenzofurans (PCDFs) and dibenzodioxins (PCDDs).
The two factors SFOA and SVBBOA represent the overall burning-related aerosol. During the pre-monsoon and monsoon periods they are low in concentration and contribute ∼ 3 % to the total organic aerosol mass (Fig. 7). During the post-monsoon period, however, they combine to contribute 24 % to the organic aerosol mass, with the largest contributor of the two being SVBBOA at ∼ 13 % of total PM1 mass, equivalent to ∼ 19.6 µg m−3. This increase means burning-related aerosol is the largest single contributor to the observed organic aerosol mass during the post-monsoon period.
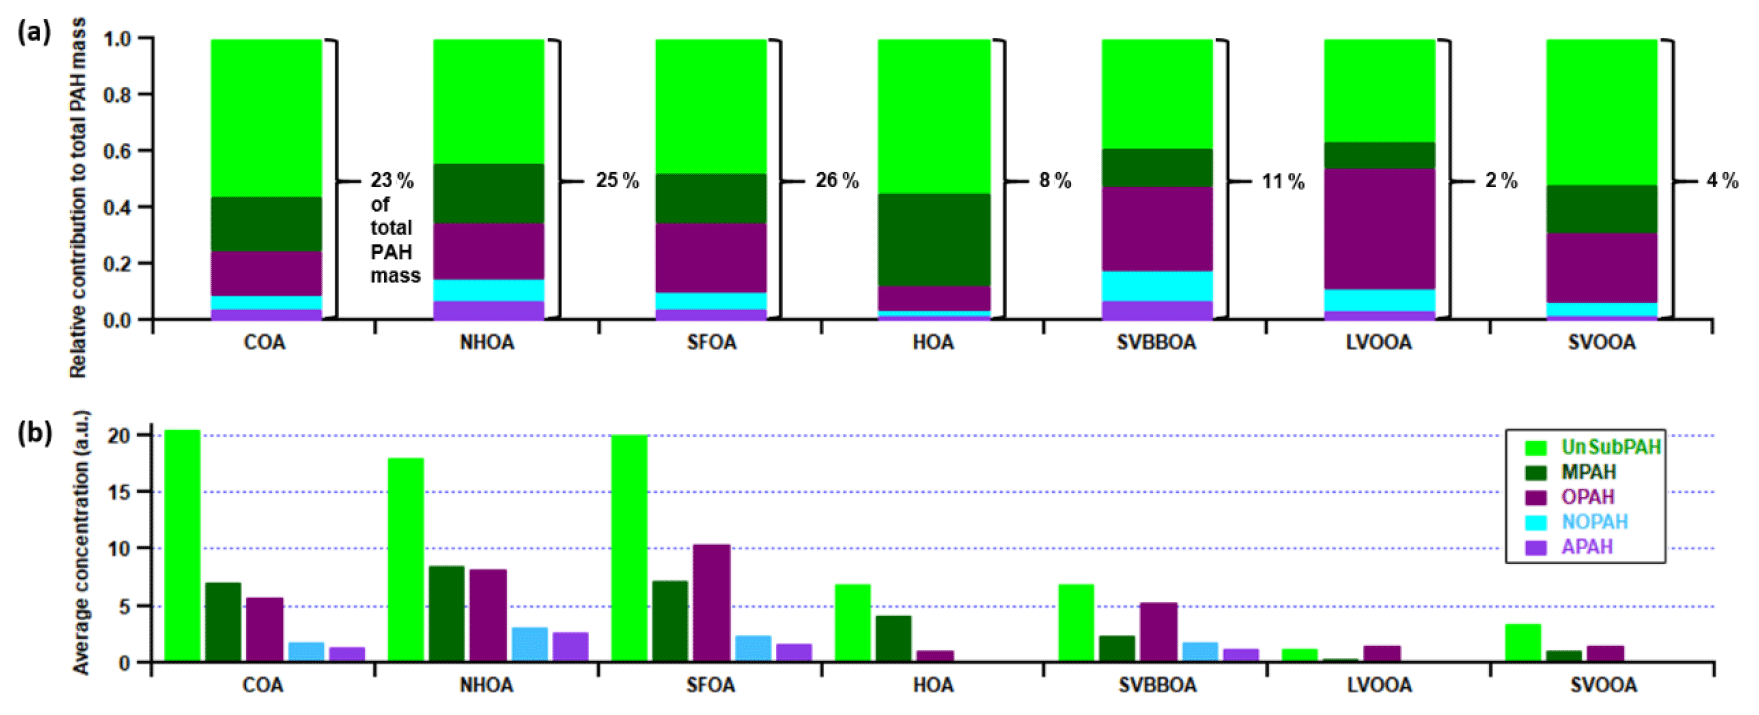
Figure 10Relative contribution of PAH families to total PAH factor mass (a) and the PAH family average uncalibrated concentrations (b). The PAH families – UnSubPAH, MPAH, OPAH, NOPAH and APAH – are described within Sect. S6 and in Herring et al. (2015).
3.3.4 Semi-volatility oxygenated organic aerosol and low-volatility oxygenated organic aerosol (SVOOA and LVOOA)
LVOOA and SVOOA are separated based on their volatility and oxygenation and serve as proxies for aged and less aged secondary organic aerosol (SOA) (Jimenez et al., 2009). The large peak at 44 in LVOOA (Fig. 5) implies a high level of oxygenation which coincides with the highest O : C ratio (0.97) out of the resolved factors. It is also the only factor that consistently peaks in the afternoon, defying the pronounced boundary layer effect, demonstrating that it is low in volatility and forms through photochemistry (Fig. 8). This is further supported by overall poor correlations with the PTR-QiTOF mass spectrum, where its strongest correlations are mostly with CxHyOx family VOC species, such as methyl glyoxal and methacrolein (Fig. S14). SVOOA has slightly stronger correlations with VOCs, but the majority are still comparatively poor (Pearson's r<0.6). The strongest correlations are with ions from the CxHyNx and CxHyNxOt families, which coincides with SVOOA having the second strongest correlation with OrgNO; however, it is very low (Pearson's r=0.47).
There is also a substantial drop in LVOOA concentrations in the monsoon period, suggesting a decrease in light due to cloud cover could be responsible or increased washout from rainfall (Fig. 7). In contrast, SVOOA increases significantly during this period, which may be caused by the increase in relative humidity and LWC, leading to increased aqueous-phase aerosol uptake. This is supported by SVOOA having the second strongest correlation with liquid water content (LWC), after SVBBOA for the combined dataset (all seasons) (Pearson's r=0.56). Furthermore, it has the strongest correlation out of all factors with LWC during the monsoon period (Pearson's r for COA is 0.27, for NHOA is 0.02, for SFOA is 0.42, for HOA is 0.04, for SVBBOA is −0.07, for LVOOA is 0.24 and for SVOOA is 0.49).
Both SVOOA and LVOOA have the lowest PAH content, and their PAH mass spectra are a mixture of peaks also seen in factors corresponding to primary aerosol composition. LVOOA is more oxygenated and has a large benzofuran peak ( 167), along with a naphthoquinone peak ( 158) which distinguishes it from the other factors. SVOOA conversely has a mixture of peaks seen in most primary factors, but the difference is a particularly large amount of naphthalene ( 127 and 128).
The sum of LVOOA and SVOOA is considered the total PM1-SOA, and when compared to the total primary OA (POA = HOA + NHOA + SFOA + SVBBOA + BC), it is lower in concentration during all periods (Fig. 7).

Figure 11Van Krevelen (VK) diagrams and median diurnal cycles for elemental ratios during each measurement period. Each VK diagram contains the H : C vs O : C data for the PMF solutions and the raw AMS measurements which are coloured based on the time of the measurement. The carbon oxidation states ( 2O C − H C) are shown using grey dashed lines, and the functional group gradients are shown using solid grey lines. The blue and red dashed lines demarcate the region where published ambient OOA measurements are commonly found (Ng et al., 2011).
3.4 Elemental analysis
The measurements of elemental ratios are shown in Fig. 11, where the VK diagram for each period can be used to determine the level of oxidation and chemical functionalisation within the aerosol composition. Here, there is a similar aerosol composition between the pre-monsoon and monsoon periods, which is a consistent theme throughout these analyses. There are however slight differences in gradient where the data for the pre-monsoon period mainly fall across a gradient of −1. This equates to an increase in carboxylic acid or a simultaneous increase in carbonyl and alcohol functional groups. The formation of photooxidation products likely explains this because concentrations of LVOOA are particularly high (Sect. 3.3.4). The pre-monsoon period has periods of low carbon oxidation states () which can be explained by simultaneous low concentrations in SOA and high primary OA concentrations. For example, the period ∼ 12–16 June 2018 relates to low concentrations in both SVOOA and LVOOA and high concentrations in HOA (Fig. 6). There is also evidence of higher concentrations of aged aerosol during the pre-monsoon period as higher carbon oxidation states ( are observed. This shows higher levels of ageing and oxygenation, which is likely due to photochemistry (Heald et al., 2010). During the start of the monsoon period, the data fall on a gradient of −1, but they gradually increase to a gradient which is similar to the post-monsoon period. This shift is most likely due to the increase in SVOOA, which suggests it is composed of alcohol and peroxide functionalities. The same can be said for the post-monsoon period where the gradient increase will likely be due to the influence of SVBBOA and SVOOA.
The diurnal profile for H : C almost perfectly mirrors that of O : C and follows the primary factors (HOA, NHOA and SFOA) for all three measurement periods (Figs. 8 and 11). The N : C however is highly variable across the three periods, with significant changes in its diurnal pattern. During the pre-monsoon period, nitrogen is mainly within the SOA fraction as the N : C ratio follows the O : C ratio in the diurnal cycle and peaks in the afternoon with LVOOA (Fig. 11). This changes during the monsoon period as there is an early morning (00:00–06:00) peak in N : C. This simultaneous increase in N : C and O : C may suggest that dark oxidation via nitrate radicals is occurring. This is supported by the OrgNO diurnal cycle for the monsoon period (Fig. S20), which shows a small rise in the interquartile range during the morning hours (00:00–07:00) and could tentatively be linked to the same rise in N : C. There is also an increase in LVOOA during these hours showing that it is composed of dark oxidation products. A small rise in N : C is also seen during the morning of the post-monsoon period; however, this is likely flattened due to the large increases in N-rich factor concentrations, such as NHOA and SVBBOA (Fig. 8).

Figure 12(a) Time series for SVBBOA along with the daily average fire counts from the NASA Visible Infrared Imaging Radiometer Suite (VIIRS) sensor on the Suomi National Polar-orbiting Partnership (S-NPP) satellite. (b) Pearson's r correlations between daily average factor concentrations and the daily average fire counts. The VIIRS data cover all days displayed along the x axis, while the AMS measurements cover the grey shaded regions.
4.1 Traffic sources: the existence of nitrile compounds and the separation of NHOA and HOA based on fuel type
The existence of nitrile compounds (R-C ≡ N) within NHOA is evident through mass spectral comparisons as explained in Sect. S5. VOC measurements also support this observation as the graph in Fig. S14 shows correlations between PTR-QiTOF measurements of CxHyNz species and PMF factors. Several of these species have previously been identified as nitrile compounds by Brilli et al. (2014). These species have a stronger correlation with NHOA over all factors, which suggests possible partitioning of nitrile VOCs into the particle phase or vice versa. These compounds have not been identified in published AMS spectra; however, many have published amine peaks within factors. Most studies name these factors nitrogen organic aerosol (NOA); however, some relate to specific local organic aerosol (LOA) (Aiken et al., 2009; Docherty et al., 2011; Sun et al., 2011; Saarikoski et al., 2012; Hayes et al., 2013; Bottenus et al., 2018; Zhang et al., 2018). The main difference between Delhi measured NHOA and literature NOA (or LOA) is the absence of even amine peaks in NHOA such as 56 ([C3H6N]+), 58 ([C3H8N]+) and 84 ([C5H10N]+). The Van Krevelen (VK) diagram in Fig. S15 shows four examples of what is collectively termed here as NOA and shows a large variety of elemental compositions. Most studies relate the amine content to secondary sources or specific local sources. Ye et al. (2017) report a NHOA factor which they suggest is also composed of amines; however, they state this is inconsistent with their findings that NHOA was related to fossil fuel combustion. The NHOA factor they measured is the closest factor within the VK diagram to NHOA measured in Delhi. They also measured similar odd nitrogen peaks at 41 ([C2H3N]+), 43 ([C2H5N]+), 55 ([C3H5N]+) and 57 ([C3H7N]+), and it is therefore suggested that this factor may also contain nitrile compounds.
Nitrile compounds within PM are usually considered a sign of nitrogen-rich fuel combustion, and these findings provide useful tracers for biomass burning such as acetonitrile (Simoneit et al., 2003; Weimer et al., 2008). However, there appear to be no publications reporting ambient atmospheric nitriles being linked to traffic sources. High-molecular-weight nitrile compounds with 7 to 22 carbon atoms (C7-C22) have been measured during high emission episodes of ammonia and “fatty carboxylic” or alkanoic acids (Abas et al., 2004; Ozel et al., 2010; Simoneit et al., 2003). These observations are supported by laboratory studies which show atmospheric ammonia and alkanoic acids react to form alkyl cyanides via an amide intermediate (Simoneit et al., 2003; Zhao et al., 2009). The characteristically high ammonia concentrations in Delhi could therefore make this a viable reaction pathway (Saraswati et al., 2018; Nakoudi et al., 2019).
Studies that have measured C9-C30 alkanoic acids suggest they originate from fossil fuel combustion, biomass burning, cooking and microbial activities (Abas et al., 2004; Kang et al., 2016; Gupta et al., 2018; Gadi et al., 2019). A substantial amount has been shown to be emitted from diesel engines where the majority originates from the engine lubricant (Lim et al., 2015). Emissions also increase with the use of biodiesel, which is becoming a common fuel type in Delhi (Cheung et al., 2010). Two previous studies measured PM10 composition at IGDTUW and found a large fraction of the organic aerosol is composed of n-alkanoic acids (Gupta et al., 2018; Gadi et al., 2019). They suggest that cooking and traffic emissions influence the n-alkanoic acid abundance, and their concentrations are higher during the post-monsoon and winter months. This is a similar trend to NHOA, and there are numerous studies which show traffic to be a large source of ammonia emissions in Delhi, in different cities in India and in different cities worldwide (Sharma et al., 2014; Sun et al., 2017; Elser et al., 2018; Saraswati et al., 2018). It is therefore possible that the nitrile compounds within NHOA are formed through the reaction of alkanoic acids and ammonia.
The large differences in the PAH composition of NHOA and HOA described in Sect. 3.3.1 are a key characteristic which separates these two traffic factors. From the 100–320 mass spectra in Fig. 5, it is clear that masses are much higher in the later part of the NHOA spectrum than for HOA. These include (but are not restricted to) higher-molecular-weight UnSubPAHs and methyl-substituted PAHs (MPAHs) (Fig. 10), and these are diagnostic markers for a diesel source (Singh et al., 2010). This suggests that HOA may originate from less dense traffic fuel types that have much lower aromatic content, such as petrol and compressed natural gas (CNG). What weakens this hypothesis is the absence of NHOA in the pre-monsoon and monsoon periods as diesel vehicles and trains are in operation throughout the year, although the additional contribution from diesel generators may vary throughout the year. This could, therefore, suggest NHOA is influenced by meteorology and forms during favourable conditions for aerosol partitioning in the post-monsoon period. These conditions allow for the partitioning of more volatile fractions of NHOA, such as the nitriles. Diesel vehicles are not normally permitted on the roads directly adjacent to the measurement site. Thus, the low boundary layer post-monsoon may also result in more efficient advection and build-up of diesel emissions to the measurement site at low height, whilst emissions may be more efficiently dispersed during the other seasons.
Similar UnSubPAH and MPAH species in NHOA have been observed in laboratory studies measuring PAHs from diesel engines, but the ratios of these species largely depend on the mix of biodiesel and the running conditions of the engine (He et al., 2010; Tsai et al., 2011; Zheng et al., 2017). There is, however, a study which took place in Taj, India, which measured both indoor and outdoor PAH concentrations in homes along roadsides or in residential areas. Through principal component analysis, the authors were able to separate factors based on different fuel types (Masih et al., 2012). At all measurement sites, factors were resolved relating to diesel and others relating to petrol and CNG. The latter is widely used in Delhi and is mandatory for public transport vehicles (taxis, motor rickshaws). The diesel-related factors were high in acenaphthylene ( 151 and 152), acenaphthene ( 153 and 154), fluorene ( 165), anthracene and phenanthrene ( 178), and carbazole ( 216 and 217), which is consistent with NHOA. The petrol and CNG-related factors were also consistent with HOA where methyl-naphthalene ( 141 and 142) and dimethyl-naphthalene ( 155 and 156) were particularly high, and these are the distinguishing peaks in the PAH spectrum for HOA. The evidence gathered therefore suggests that NHOA and HOA are separated based on fuel type, where NHOA is influenced by diesel emissions and HOA by petrol and compressed natural gas. The separation of factors based on fuel type is not often observed due to the almost identical diurnal patterns they often share. In Delhi, however, this separation is most likely possible due to the restrictions of heavy goods vehicles during the day (07:00–23:00), which increases diesel emissions at night.
There is a strong correlation between NHOA and the dibenzodioxin fragment ion, benzodioxan ([C8H8O2]+) (Pearson's r=0.80), and this is consistent with dibenzodioxin peaks seen in its PAH spectrum (Fig. S13). There is also a mild correlation with chloride (Pearson's r=0.62), which could be explained by the presence of polychlorinated dibenzodioxins (PCDDs). It is well known that diesel combustion is a source of PCDDs and therefore could be a form of organic chloride associated with NHOA (Laroo et al., 2012; Wang et al., 2012). However, NHOA could also be similar in volatility to ammonium chloride, which could also explain this.
Traffic-related organic aerosol (NHOA + HOA) amounts to the largest primary source of PM1 across the pre-monsoon and monsoon periods (Fig. 7). It is also the joint second highest source (with SOA) during the post-monsoon period, which suggest that a reduction in its emissions will result in a drop in PM1 organic aerosol across the majority of the year. This conclusion is consistent with the analysis of unit mass resolution measurements from this and other AMS instruments operated in Delhi (Reyes-Villegas et al., 2020), which also found traffic to be the largest contributor to PM1. Targeting emissions from traffic can therefore be viewed as the highest priority when developing air quality mitigation strategies for PM1, especially considering that traffic sources also supply some of the precursor gases for the formation of the SOA components.
4.2 Sources of cooking activities and their link to OrgNO
The COA time series has a moderate correlation with the AMS-measured [C6H10O]+ peak (Pearson's r=0.65), which is often used as an internal tracer for cooking-related factors (Sun et al., 2016). This tracer has previously been used on AMS measurements taken in western and East Asian countries. The reason for the reduced correlation in this study may be a difference in the style of cooking in Delhi and/or the contribution of other sources to this peak. Western and East Asian cooking is shown to produce short-chained organic acids through rapid and shallow frying (Reyes-Villegas et al., 2018a). In Delhi, however, food is generally cooked on a low heat and over a longer period of time. It is therefore hypothesised that longer-chained oxygenated fatty acids are associated with cooking activities in Delhi. This is supported by measurements taken at IGDTUW showing long-chained fatty acids being linked to cooking sources (Gupta et al., 2018; Gadi et al., 2019).
This difference in cooking style might also explain why the mass spectrum has an uncharacteristically large peak at 44 [CO2]+, which is considered to be mainly due to carboxylic acid groups (Duplissy et al., 2011; Ng et al., 2011). Long chains of CxHy atoms along with an increased number of –COOH groups fragment in the AMS, resulting in mainly aliphatic ions and increased 44. As a result, the COA factor has a particularly large O : C ratio (0.33) when compared to literature values (Table S6), which pulls it towards a carboxylic acid composition gradient on the VK diagram in Figure S15. Additionally, some of the strongest correlations of VOCs with COA in the lower m/z part of the PTR-QiTOF spectrum relate to the CxHyNz and CxHyOz families (Fig. S14). These observations also support COA being composed of long-chained carboxylic acids and could also suggest that COA is influenced by the oxidation of organic acid VOCs.
The CxHyNzOt family in both the AMS ( 210–300) and PTR-QiTOF ( 120–210) correlation mass spectra is most closely correlated with COA (Fig. S14). This coincides with the OrgNO having the strongest correlation with COA (Pearson's r=0.60), out of all PMF factors (Fig. 7). Furthermore, the COA spectrum for the inorganic–organic combined PMF solution shows a large NO+ ( 30) peak with no associated ammonium peaks, which implies the nitrate is organic (Fig. S17). The evidence gathered therefore suggests emissions associated with food preparation in Delhi are nitrogen-rich and contribute the most to OrgNO concentrations. The presence of N-containing aromatic compounds (NACs) in PM2.5 from wood- and charcoal-fuelled cooking stoves has also recently been measured experimentally (Xie et al., 2020). Again, the majority of the NACs identified in these measurements were of the CxHyNzOt family. COA could also be influenced by the emissions of fuels used for food preparation as this would correlate highly in space and time. Äijälä et al. (2017) published a similar COA spectrum containing high 44 (and 28) peaks and found their measured COA is influenced by biomass burning. This could also be true for Delhi as residents, roadside stalls and restaurants (e.g. Dhabas) cook on open fire pits using fuels such as wood and dung cakes and would explain a mixed factor profile of COA with BBOA influence.
The strong association of PAHs with cooking activities is well established and is an important component of cooking aerosol to consider due to its carcinogenicity (Svedahl, 2018; Lin et al., 2019). COA has a particularly high peak at 91 (Fig. 5), which is seen in the majority of studies with COA measurements but is not often highlighted (Mohr et al., 2012; Dall'Osto et al., 2013). The fragment ion responsible is [C7H7]+ and is observed when measuring PAHs (McLafferty and Turecek, 1993). It is also one of five AMS-measured PAH fragment ions ([C6H6]+, [C9H9]+, [C10H9]+ and [C11H9]+) that give some of the highest correlations with COA in the AMS correlation mass spectra (Fig. S14). This is consistent with the PAH composition of COA, which is mainly UnSubPAHs (Fig. 10), and shows that UnSubPAHs are a defining part of a COA signature. As the COA spectrum has strong similarities with SVOOA spectra (due to 44), its high PAH composition could help future studies. For AMS measurements in Delhi, 91 could be a useful indicator of COA along with the 55 : 57 ratio for studies that do not quantify .
Unlike other source factors, COA does not significantly increase in concentration during the post-monsoon period (Fig. 7). Cooking activities are therefore relatively constant across the year in Old Delhi although there is a substantial drop in COA during the monsoon period. This is likely because of the increased rainfall and RH (monsoon average ∼ 76 %) causing increased rates of below-cloud scavenging or washout. The propensity of this happening to COA over other organic aerosol could be down to composition as its high fatty acid content will increase its hygroscopicity, making it more likely to be scavenged. This could explain the reason for the low correlation with LWC (Pearson's r=0.15) as an increase in water content and RH will most likely increase wet deposition. An alternate reason could simply be due to a decrease in outside cooking activity as more residents likely cook indoors to escape the rain.
4.3 Sources of burning
The results indicate the two burning-related PMF factors SFOA and SVBBOA are fresh and aged organic aerosol, respectively. The higher afternoon concentrations of SVBBOA and a high signal at 44 are key indicators of its lower volatility and oxidation. This is also consistent with the analysis of AMS flux measurements taken during the post-monsoon period (Di Marco et al., 2019). From the analysis, two burning factors were resolved, where one had higher emissions during the morning and evening, suggesting it to be localised and a primary source. The other factor showed a lower and broader emission in the morning, suggesting it is secondary. A similarly aged PMF factor to SVBBOA, named oxidised BBOA, was also resolved from AMS measurements in Kanpur. They suggest this O-BBOA mainly formed through photochemical oxidation of primary emitted BBOA in the local area (Chakraborty et al., 2018). This may be the case in Delhi; however, there are peaks in the time series of SFOA which coincide with an absence of SVBBOA, particularly during peak photochemical conditions in the pre-monsoon period (Fig. 6). The origin of this source therefore may not be local to Delhi, and instead the aerosol could have travelled from further afield.
The contribution of SVBBOA to the total PM1 mass is insignificant during the pre-monsoon (∼ 1 %) and monsoon (∼ 0 %) periods. However, during the post-monsoon period it is the second largest contributing factor (∼ 13 %) (Fig. 7). This suggests a specific source that only occurs during the post-monsoon period. The most likely cause is large-scale crop residue burning after paddy fields are harvested in October and November, which has been widely blamed for poor air quality in Delhi (Liu et al., 2018; Jethva et al., 2019; Beig et al., 2020; Mukherjee et al., 2020). In Fig. 12, the SVBBOA time series is compared with fire count data from the NASA Visible Infrared Imaging Radiometer Suite (VIIRS) sensor on the Suomi National Polar-orbiting Partnership (S-NPP) satellite (available at: https://earthdata.nasa.gov/earth-observation-data/near-real-time/firms, last access: 20 April 2021). The daily average fire counts are taken from a custom polygon of the Haryana region from which the city of Delhi itself has been removed. The strong correlation of SVBBOA with fire counts (Pearson's r=0.73) suggests the source of this factor is mainly regional crop residue burning outside of Delhi. Whilst other factors, and particularly SFOA, also correlate significantly with the fire counts (as a result of all concentrations increasing post-monsoon), the PMF analysis identifies some SFOA but very little SVBBOA during monsoon (Figs. 6 and 7). This suggests that the distinction between SFOA and SVBBOA is fairly robust in quantifying the contribution of crop residue burning to Delhi's PM1.
These findings show that crop burning is a major source of air pollution during the post-monsoon period when PM concentrations are at their highest. In 2018 a government initiative was introduced to improve air quality in Delhi by encouraging farmers outside the national capital region (NCR) to supply their agricultural waste for conversion to bioenergy (Bhuvaneshwari et al., 2019). Our measurements reveal that, despite this intervention, the burning of crop residues in the post-monsoon period still accounted for ∼ 19 % of the total PM1 increment over the pre-monsoon period. Our measurements suggest that in 2018 there was still scope for further reductions from the agricultural sector.
Studies have observed KNO3 formation in aged smoke from biomass burning via the reaction of KCl with gaseous HNO3 (Li et al., 2003; Wang et al., 2017). A subsequent substitution reaction with NH3 forms NH4NO3, and this formation pathway could explain why SVBBOA has the strongest correlation with nitrate and ammonium (Fig. 7). SFOA, however, is weakly correlated with nitrate, which suggests it may not be linked to crop residue or wood burning. The defined morning and evening peaks in the SFOA diurnal cycle, and a less-oxidised composition, show SFOA is more likely to be linked to freshly emitted local area sources. It could, therefore, be due to municipal waste burning, which is a common practice in Delhi, particularly during the morning and evening (Nagpure et al., 2015). Municipal waste burning is also often found to produce higher PCDD and PCDF concentrations than biomass burning or traffic sources (Lavric et al., 2004; Chakraborty et al., 2013; Verma et al., 2016; Zhang et al., 2017; Stewart et al., 2021). The high dibenzodioxin and dibenzofuran peaks in the SFOA mass spectrum (Fig. S13) coincide with strong correlations with our proposed novel tracers for PCDDs and PCDFs, benzodioxan [C8H8O2]+ and furan [C4H4O]+ (Fig. 7). This shows SFOA has the strongest link to PCDDs and PCDFs, which suggests a substantial fraction of its mass may be due to the burning of highly chlorinated municipal waste.
Although the results suggest strong links between SFOA and municipal waste burning, it is likely that this factor contains other solid fuel burning sources as well. The high correlation with acetonitrile (Fig. 7) and mass spectral peaks at 60 and 73 (Fig. 5) show that SFOA includes a significant amount of organic aerosol from biomass burning. This will most likely include emissions from solid fuels such as dung cakes and wood, which are used for cooking and warmth in Delhi (Sen et al., 2014; Pervez et al., 2019).
The measurement site is also positioned near large cremation grounds (∼ 500–750 m) in the east along the Yamuna river where open funeral pyres and furnaces are used frequently. The largest of the two is directly east and coincides with frequent peaks in SFOA and PAH concentrations (Fig. 9). Studies have shown that funeral pyres in India emit organic carbon and organic aerosol on a comparable level to transport emissions, where it was estimated to be equivalent to ∼ 10 %–23 % of organic aerosol mass emitted from regional fossil fuel and biofuel burning (Chakrabarty et al., 2013; Pervez et al., 2015). It is also shown that funeral pyres emit a significant amount of PAHs that are particularly high in benzene ring count (Dewangan et al., 2014), which is consistent with the high peaks later in the PAH mass spectrum for SFOA (Fig. S13). SFOA is therefore also likely to include aerosol emitted from funeral pyres.
The large south-easterly peaks in the polar plots for SFOA, COA, NHOA and PAH are concurrent, which suggests a common source (Fig. S10). These peaks occurred during the late hours of the night (∼ 22:00–24:00) and on three consecutive occasions, which indicates the source is infrequent. They also occur during the Diwali festival, and it is likely that they are due to pyrotechnical activity. A possible explanation is the PMF algorithm is unable to resolve these peaks into a single factor due to their infrequency. Further AMS studies on pyrotechnical activity may help to provide characteristic mass spectra which could be used, along with ME-2, to separate factors on occasions such as this.
Combining the two factors, SFOA and SVBBOA, shows that organic aerosol associated with burning-related sources contributes the highest PM1 mass during the post-monsoon period (Fig. 7). This is coincidentally the period when concentrations are the largest by a significant amount, in part, due to accentuated boundary layer dynamics. The post-monsoon period is therefore a critical period which detrimentally decreases the health of Delhi's population. Combustion sources, including crop residue, municipal waste, funeral pyre cremations and solid fuel burning, therefore need to be considered when creating new air quality mitigation strategies.
4.4 Sources of chloride
The concentrations of chloride in Delhi are particularly large relative to levels reported in other megacities, and a number of studies have linked it to biomass burning and industrial activities (Stone et al., 2010; Gani et al., 2019). There are possible industrial sources of chloride to the north-west of Delhi, and these include steel pickling and electronic waste recycling sites that are suggested to emit gaseous HCl (Gani et al., 2019). The same early morning chloride peak reported by Gani et al. (2019) was measured at IGDTUW and occurs around 07:00–08:00 (Fig. 2). This morning peak is however also seen using a HR-TOF-AMS in Kanpur, India, which suggests that this may not be linked to the same industrial sources (Chakraborty et al., 2018). Furthermore, there is no particular wind directional preference for the morning peak at IGDTUW (Fig. S9), whereas Gani et al. (2019) show a preferred north-westerly wind. Our findings instead suggest a nocturnal area source of HCl which preferentially partitions into the particle phase at night, accumulates in the shallow nocturnal boundary layer and eventually evaporates in the morning. This is consistent with thermodynamic modelling results showing partitioning of HCl into aerosol water due to excess ammonia and a decrease in temperature and RH during the early morning (Gunthe et al., 2021). There is also no evidence to suggest the steel pickling and electronic waste recycling industries are more active during the post-monsoon and winter months when chloride concentrations are at their highest.
In both Delhi and Kanpur, residents burn refuse either for warmth or to clear the streets, and this is likely to be a significant source of chloride. Three Indian-based studies show that aerosol emitted from burning waste is composed of chlorine-associated PAHs formed mainly from plastics such as polyvinylchloride (PVCs) and polychlorinated biphenyls (PCBs) (Chakraborty et al., 2013; Vreeland et al., 2016; Shivani et al., 2019). At IGDTUW, chloride has a strong correlation with the PAH time series (Pearson's r=0.72), which is significantly stronger than that of nitrate (Pearson's r=0.58), sulfate (Pearson's r=0.21) and ammonium (Pearson's r=0.59). The diurnal cycle for PAHs also shares a similar temporal behaviour in the morning to chloride where the median peaks at ∼ 07:00–08:00. This coincides with the regular occurrence of residents sweeping the previous day's waste into piles and burning them. One study indicates that this behaviour results in larger amounts of municipal waste being burnt in the morning compared to the evening (Nagpure et al., 2015). Additionally, the temperature in Delhi does not drop until later in the evening, making it less likely that residents burn refuse to stay warm in the earlier parts of the evening.
SFOA is strongly related to both PAHs and chloride, and although SFOA concentrations in the pre-monsoon and monsoon periods are comparatively low (Fig. 7), they are still comparable with chloride concentrations. The link with burning plastics through PCDDs and PCDFs further supports this, and the results gathered therefore suggest that municipal waste burning may be the largest source of PM1 chloride during the pre-monsoon and monsoon periods.
Another possible source of chloride is from the annual crop burning that occurs during the post-monsoon period. It is well known that wood burning is a strong source of particulate KCl (Li et al., 2003; Lanz et al., 2008; Weimer et al., 2008), and while KCl itself is not quantifiable by the AMS, it goes on to form NH4Cl via the intermediate reaction of HCl with NH3 (Sullivan et al., 2007; Wang et al., 2017). SVBBOA has a strong correlation with chloride (Fig. 7), and the additional results from the second (organic–inorganic) PMF analysis, which included the inorganic components, associate the majority of the post-monsoon ammonium chloride with SVBBOA (Fig. S17). There are many studies which support this conclusion and show crop residue burning to be a significant source of chloride (Li et al., 2003; Sullivan et al., 2007; Lanz et al., 2008; Weimer et al., 2008; Christian et al., 2010; Wang et al., 2017). However, how much of this association is down to the PMF algorithm resolving similarities in thermodynamics and thus reflect the volatile nature of both components is uncertain. Furthermore, SFOA has a strong correlation with chloride, which suggests localised burning is an equally significant source. Crop burning therefore likely explains a significant fraction of the high levels of chloride in the post-monsoon period, while municipal waste burning is likely the dominant source during the pre-monsoon and monsoon periods.
4.5 Secondary organic aerosol
The two SOA factors LVOOA and SVOOA compare well with literature in the VK diagram (Fig. S15), and they lie in areas which are consistent with their respective aged and less-aged SOA profiles. When compared to a few AMS studies measuring PM from around the world, only measurements in China gave an LVOOA factor with a larger O : C ratio (Table S6). This reflects how oxidised LVOOA is in Delhi and suggests a large amount of atmospheric processing. LVOOA is influenced mainly by photochemical oxidation as suggested by its afternoon peak (Fig. 8) and its correlations with oxidised VOCs (Fig. S14). SVOOA however may instead be more influenced by gas–aerosol partitioning and aqueous-phase aerosol uptake as it has a higher correlation with LWC (Pearson's r=0.56, Fig. 7).
The SVOOA mass spectrum is similar to the primary factor, COA, shown by a similarly high 55 : 57 ratio (2.87) (Fig. 5). They also share a similar affinity with OrgNO as both have the strongest correlations with OrgNO (Fig. 7) and similar correlations with CxHyOzNt VOC species (Fig. S14). This is supported by the organic–inorganic PMF solution giving similar COA and SVOOA spectra, which includes both having a high NO+ (30 ) peak (Fig. S17). The largest difference between the two factors is the level of oxygenation where SVOOA has an O : C ratio of 0.52 and could suggest SVOOA may be formed via oxidised COA. The pollution rose plots support this as both COA and SVOOA show a similar wind directional preference (Fig. 9). This may also explain the simultaneous drop in COA and increase in SVOOA during the monsoon period as COA is oxidised through aqueous-phase chemistry to form SVOOA.
The diurnal cycles for N : C and O : C (Fig. 8) appear to show a close relationship during the pre-monsoon period, indicating that nitrogen content is being driven by photochemistry. This suggests that the organic nitrogen species are mainly of the CxHyNzOt family rather than the CxHyNz family during this period. A similar pattern is also seen in Kanpur where the N : C ratio closely follows the O : C ratio (Chakraborty et al., 2016a). There is however an increase in N-rich factors such as NHOA, SFOA and SVBBOA during the post-monsoon period which breaks the similarities in N : C and O : C diurnal cycles (Fig. 8). NHOA and SVBBOA are shown to contain nitrogen in the form of nitrile and/or amine compounds which are of the CxHyNz family (see Sect. 4.1 and 4.3). This shows the post-monsoon nitrogen species composition is a mixture of CxHyNzOt and CxHyNz chemical families. During the monsoon period, however, the concentrations of N-rich factors (NHOA, SFOA and SVBBOA) are low, which removes their influence on N : C during the night. This allows for the N : C ratio to be driven by dark oxidation via nitrate radicals, which is seen in the early morning peak (Fig. 11). The overall contribution of dark oxidation to SOA formation however is relatively small in Old Delhi, evidence of which is shown by the coinciding rise in LVOOA concentrations, which is small when compared to the following photochemically produced afternoon peak (Fig. 8).
PM1 measurements were taken using a HR-TOF-AMS in Old Delhi for the first time, covering three seasons (pre-monsoon, monsoon and post-monsoon). Results show large concentrations of aerosol species, particularly during the post-monsoon period when ammonium and organic aerosol increase by a factor of ∼ 2–3 and chloride and nitrate increase by a factor of ∼ 5–6. These high post-monsoon concentrations have been linked to an increase in the boundary layer height effect and an increase in burning emissions, mainly from crop residue and solid fuel.
A seven-factor solution was resolved from source apportionment analysis using PMF, and this included two traffic-related factors (NHOA and HOA), two burning-related factors (SFOA and SVBBOA), a cooking factor (COA) and two SOA factors (LVOOA and SVOOA). NHOA is separated from HOA by the presence of what we believe to be nitrile species within its composition, and their existence is previously unpublished in AMS literature. These nitrile compounds are hypothesised to form from the reaction of alkanoic acids and ammonia. Using a unique view of AMS factor PAH peaks, we establish that NHOA, unlike HOA, also includes higher mass PAHs. This suggests NHOA is heavily influenced by diesel engine emissions and coincides with the easing of heavy-goods vehicle restrictions during the night. HOA, however, was characterised by low-molecular-weight PAHs including key PAH species markers which suggest it, instead, originates from CNG and petrol engine emissions.
The existence of OrgNO species is evident with concentrations peaking at ∼ 25 µg m−3 during the Diwali festival when large-scale pyrotechnical activity occurred. It was also found that COA is closely related to OrgNO through correlations with OrgNO and CxHyNzOt PTR-QiTOF ions. This may suggest that in Delhi OrgNO is formed mostly from cooking activities.
The same associations with OrgNO are also seen with the secondary SVOOA factor, which shares similarities in its mass spectrum to COA. This suggests it is formed from oxidised COA. The simultaneous loss of COA and increase in SVOOA during the monsoon period also indicate aqueous-phase oxidation occurs. LVOOA, however, is shown to form mainly through photochemistry, but a small contribution is also made through dark oxidation via nitrate radicals.
The COA mass spectrum was found to have an unusually high degree of oxygenation. This may be explained by the difference in cooking style in Delhi as food is cooked slowly and on a low heat which emits long-chained oxygenated fatty acids. PAHs are also shown to be an important component of COA composition, and it contributes a large proportion to the total PAH mass. A particularly high PAH fragment ion [C7H7]+ peak ( 91), along with the literature established high 55 : 57 marker, could be used as an additional indicator of COA in Delhi for future AMS studies, especially those measuring below 120.
Chloride showed the largest relative increase out of the four inorganic species and organic aerosol, increasing 522 % from an average of 1.29 µg m−3 in the pre-monsoon period to 8.03 µg m−3 in the post-monsoon period. Two burning-related factors, SFOA and SVBBOA, both show strong associations with chloride for different reasons. Using Earth observations, SVBBOA is tightly linked to regional crop residue burning and is more secondary in character. A similar spectrum to SVBBOA was resolved using an alternative inorganic–organic PMF analysis but with large ammonium chloride peaks. This suggests that considerable amounts of ammonium chloride are linked with crop residue burning. We introduce novel AMS-measured tracers which show the presence of polychlorinated dibenzofurans (PCDF) and dibenzodioxins (PCDD). This offers a new way to associate sources to plastic or Cl-rich fuel burning. Using these tracers, SFOA was found to have significant links to municipal waste burning. With SVBBOA concentrations being insignificant during the pre-monsoon and monsoon periods, municipal waste burning is therefore likely the most significant source of chloride during the pre-monsoon and monsoon periods. During the post-monsoon period, however, it is concluded that both crop residue burning and municipal waste burning are key contributors to the large increase in chloride.
SFOA was also linked to other sources of solid fuel burning such as wood and dung cakes which are commonly used in Delhi, particularly during the post-monsoon (and winter) period when Delhi residents burn solid fuel to keep warm. Wind directional data also suggest funeral pyres situated east of the measurement site likely contribute to SFOA as frequent excursions point in this direction.
Overall, the burning-related sources (SFOA + SVBBOA) are the largest primary source of PM1 during the post-monsoon period. The high concentrations of SVBBOA suggest that there is further scope to mitigate PM1 concentrations through strategies aimed at reducing crop residue burning. This, combined with reductions in other solid fuel burning sources, could significantly decrease the large peaks in PM1 concentrations during the post-monsoon period. However, overall, our measurements suggest that reducing traffic emissions will have the greatest reduction on PM1 organic aerosol concentrations across the majority of the year, as total traffic aerosol (NHOA + HOA) is shown to be the highest primary contributor during the pre-monsoon and monsoon periods.
Time series data for AMS-measured organics, nitrate, ammonium, chloride and sulfate, along with PMF factors, are available online at https://catalogue.ceda.ac.uk/uuid/5631c55a2caa4cd2bcdf1bf75365bcc8 (last access: 20 April 2021, Cash et al., 2021).
The supplement related to this article is available online at: https://doi.org/10.5194/acp-21-10133-2021-supplement.
JMC, BL, CDM, NJM, S and EN made the PM1 measurements using the HR-TOF-AMS. JA and ER measured co-located PM1 using C-TOF-AMS, along with black carbon measurements using the Aethalometer AE-31. RJ and JA measured black carbon using the SP2. WJFA measured VOCs by PTR-QiTOF, supported by BL, CNH and PKM. WD measured CO and NOx using an Aerolaser AL 5002 UVU and a dual-channel high-resolution chemiluminescence instrument. JMC, BL, CDM, JA, MRH and EN contributed to the data interpretation. NJM, TKM, S, RG, BRG and EN provided overall guidance with setup and logistics. EN, BRG, TKM, CNH and JA conceived the overall DelhiFlux project. All authors contributed to the discussion, writing and editing of the article.
The authors declare that they have no conflict of interest.
The paper does not discuss policy issues, and the conclusions drawn in the paper are based on interpretation of results by the authors and in no way reflect the viewpoint of the funding agency or institutions authors are affiliated to.
This work was supported by UK NERC project DelhiFlux under the Newton Bhabha Fund programme Air Pollution and Human Health in a Developing Megacities (APHH-India), NERC reference numbers NE/P016502/1 and NE/P016472/1. The NERC National Capability award SUNRISE (NE/R000131/1) supported the monsoon measurements, and James M. Cash is supported by a NERC E3 DTP studentship (NE/L002558/1). Tuhin K. Mandal is thankful to the director of CSIR-National Physical Laboratory for allowing us to carry out this research. Authors gratefully acknowledge the financial support provided by the Earth System Science Organization, Ministry of Earth Sciences, Government of India, under the Indo-UK joint collaboration grant no. MoES/16/19/2017-APHH (DelhiFlux) to conduct the research.
This research has been supported by the Natural Environment Research Council (grant nos. NE/P016502/1 and NE/R000131/1) and the Natural Environment Research Council (grant nos. NE/P016472/1 and NE/L002558/1).
This paper was edited by Roya Bahreini and reviewed by two anonymous referees.
Abas, M. R. B., Rahman, N. A., Omar, N. Y. M. J., Maah, M. J., Samah, A. A., Oros, D. R., Otto, A., and Simoneit, B. R. T.: Organic composition of aerosol particulate matter during a haze episode in Kuala Lumpur, Malaysia, Atmos. Environ., 38, 4223–4241, https://doi.org/10.1016/j.atmosenv.2004.01.048, 2004.
Acharja, P., Ali, K., Trivedi, D. K., Safai, P. D., Ghude, S., Prabhakaran, T., and Rajeevan, M.: Characterization of atmospheric trace gases and water soluble inorganic chemical ions of PM1 and PM2.5 at Indira Gandhi International Airport, New Delhi during 2017–18 winter, Sci. Total Environ., 729, 138800, https://doi.org/10.1016/j.scitotenv.2020.138800, 2020.
Acton, W. J. F., Huang, Z., Davison, B., Drysdale, W. S., Fu, P., Hollaway, M., Langford, B., Lee, J., Liu, Y., Metzger, S., Mullinger, N., Nemitz, E., Reeves, C. E., Squires, F. A., Vaughan, A. R., Wang, X., Wang, Z., Wild, O., Zhang, Q., Zhang, Y., and Hewitt, C. N.: Surface–atmosphere fluxes of volatile organic compounds in Beijing, Atmos. Chem. Phys., 20, 15101–15125, https://doi.org/10.5194/acp-20-15101-2020, 2020.
Äijälä, M., Heikkinen, L., Fröhlich, R., Canonaco, F., Prévôt, A. S. H., Junninen, H., Petäjä, T., Kulmala, M., Worsnop, D., and Ehn, M.: Resolving anthropogenic aerosol pollution types – deconvolution and exploratory classification of pollution events, Atmos. Chem. Phys., 17, 3165–3197, https://doi.org/10.5194/acp-17-3165-2017, 2017.
Aiken, A. C., Salcedo, D., Cubison, M. J., Huffman, J. A., DeCarlo, P. F., Ulbrich, I. M., Docherty, K. S., Sueper, D., Kimmel, J. R., Worsnop, D. R., Trimborn, A., Northway, M., Stone, E. A., Schauer, J. J., Volkamer, R. M., Fortner, E., de Foy, B., Wang, J., Laskin, A., Shutthanandan, V., Zheng, J., Zhang, R., Gaffney, J., Marley, N. A., Paredes-Miranda, G., Arnott, W. P., Molina, L. T., Sosa, G., and Jimenez, J. L.: Mexico City aerosol analysis during MILAGRO using high resolution aerosol mass spectrometry at the urban supersite (T0) – Part 1: Fine particle composition and organic source apportionment, Atmos. Chem. Phys., 9, 6633–6653, https://doi.org/10.5194/acp-9-6633-2009, 2009.
Allan, J. D., Williams, P. I., Morgan, W. T., Martin, C. L., Flynn, M. J., Lee, J., Nemitz, E., Phillips, G. J., Gallagher, M. W., and Coe, H.: Contributions from transport, solid fuel burning and cooking to primary organic aerosols in two UK cities, Atmos. Chem. Phys., 10, 647–668, https://doi.org/10.5194/acp-10-647-2010, 2010.
Beig, G., Sahu, S. K., Singh, V., Tikle, S., Sobhana, S. B., Gargeva, P., Ramakrishna, K., Rathod, A., and Murthy, B. S.: Objective evaluation of stubble emission of North India and quantifying its impact on air quality of Delhi, Sci. Total Environ., 709, 136126, https://doi.org/10.1016/j.scitotenv.2019.136126, 2020.
Bhandari, S., Gani, S., Patel, K., Wang, D. S., Soni, P., Arub, Z., Habib, G., Apte, J. S., and Hildebrandt Ruiz, L.: Sources and atmospheric dynamics of organic aerosol in New Delhi, India: insights from receptor modeling, Atmos. Chem. Phys., 20, 735–752, https://doi.org/10.5194/acp-20-735-2020, 2020.
Bhuvaneshwari, S., Hettiarachchi, H., and Meegoda, J. N.: Crop residue burning in India: Policy challenges and potential solutions, Int. J. Environ. Res. Public Health, 16, 832, https://doi.org/10.3390/ijerph16050832, 2019.
Bottenus, C. L. H., Massoli, P., Sueper, D., Canagaratna, M. R., VanderSchelden, G., Jobson, B. T., and VanReken, T. M.: Identification of amines in wintertime ambient particulate material using high resolution aerosol mass spectrometry, Atmos. Environ., 180, 173–183, https://doi.org/10.1016/j.atmosenv.2018.01.044, 2018.
Brilli, F., Gioli, B., Ciccioli, P., Zona, D., Loreto, F., Janssens, I. A., and Ceulemans, R.: Proton Transfer Reaction Time-of-Flight Mass Spectrometric (PTR-TOF-MS) determination of volatile organic compounds (VOCs) emitted from a biomass fire developed under stable nocturnal conditions, Atmos. Environ., 97, 54–67, https://doi.org/10.1016/j.atmosenv.2014.08.007, 2014.
Canagaratna, M. R., Jayne, J. T., Jimenez, J. L., Allan, J. D., Alfarra, M. R., Zhang, Q., Onasch, T. B., Drewnick, F., Coe, H., Middlebrook, A., Delia, A., Williams, L. R., Trimborn, A. M., Northway, M. J., DeCarlo, P. F., Kolb, C. E., Davidovits, P., and Worsnop, D. R.: Chemical and microphysical characterization of ambient aerosols with the aerodyne aerosol mass spectrometer, Mass Spectrom. Rev., 26, 185–222, https://doi.org/10.1002/mas.20115, 2007.
Canagaratna, M. R., Jimenez, J. L., Kroll, J. H., Chen, Q., Kessler, S. H., Massoli, P., Hildebrandt Ruiz, L., Fortner, E., Williams, L. R., Wilson, K. R., Surratt, J. D., Donahue, N. M., Jayne, J. T., and Worsnop, D. R.: Elemental ratio measurements of organic compounds using aerosol mass spectrometry: characterization, improved calibration, and implications, Atmos. Chem. Phys., 15, 253–272, https://doi.org/10.5194/acp-15-253-2015, 2015.
Canonaco, F., Crippa, M., Slowik, J. G., Baltensperger, U., and Prévôt, A. S. H.: SoFi, an IGOR-based interface for the efficient use of the generalized multilinear engine (ME-2) for the source apportionment: ME-2 application to aerosol mass spectrometer data, Atmos. Meas. Tech., 6, 3649–3661, https://doi.org/10.5194/amt-6-3649-2013, 2013.
Cash, J., Langford, B., Di Marco, C., and Nemitz, E.: APHH: High Resolution Time of Flight Mass Spectrometer measurements made at the Indira Gandhi Delhi Technical University for Women (IGDTUW) site during the DelhiFlux field campaigns, Centre for Environmental Data Analysis, available at: https://catalogue.ceda.ac.uk/uuid/5631c55a2caa4cd2bcdf1bf75365bcc8, last access: 20 April 2021.
Chakrabarty, R. K., Pervez, S., Chow, J. C., Watson, J. G., Dewangan, S., Robles, J., and Tian, G.: Funeral Pyres in South Asia: Brown Carbon Aerosol Emissions and Climate Impacts, Environ. Sci. Technol. Lett., 1, 44–48, https://doi.org/10.1021/ez4000669, 2013.
Chakraborty, A., Bhattu, D., Gupta, T., Tripathi, S. N., and Canagaratna, M. R.: Real-time measurements of ambient aerosols in a polluted Indian city: Sources, characteristics, and processing of organic aerosols during foggy and nonfoggy periods, J. Geophys. Res., 120, 9006–9019, https://doi.org/10.1002/2015JD023419, 2015.
Chakraborty, A., Gupta, T., and Tripathi, S. N.: Chemical composition and characteristics of ambient aerosols and rainwater residues during Indian summer monsoon: Insight from aerosol mass spectrometry, Atmos. Environ., 136, 144–155, https://doi.org/10.1016/j.atmosenv.2016.04.024, 2016a.
Chakraborty, A., Gupta, T., and Tripathi, S. N.: Combined effects of organic aerosol loading and fog processing on organic aerosols oxidation, composition, and evolution, Sci. Total Environ., 573, 690–698, https://doi.org/10.1016/j.scitotenv.2016.08.156, 2016b.
Chakraborty, A., Mandariya, A. K., Chakraborti, R., Gupta, T., and Tripathi, S. N.: Realtime chemical characterization of post monsoon organic aerosols in a polluted urban city: Sources, composition, and comparison with other seasons, Environ. Pollut., 232, 310–321, https://doi.org/10.1016/j.envpol.2017.09.079, 2018.
Chakraborty, P., Zhang, G., Eckhardt, S., Li, J., Breivik, K., Lam, P. K. S., Tanabe, S., and Jones, K. C.: Atmospheric polychlorinated biphenyls in Indian cities: Levels, emission sources and toxicity equivalents, Environ. Pollut., 182, 283–290, https://doi.org/10.1016/j.envpol.2013.07.032, 2013.
Cheung, K. L., Ntziachristos, L., Tzamkiozis, T., Schauer, J. J., Samaras, Z., Moore, K. F., and Sioutas, C.: Emissions of particulate trace elements, metals and organic species from gasoline, diesel, and biodiesel passenger vehicles and their relation to oxidative potential, Aerosol Sci. Technol., 44, 500–513, https://doi.org/10.1080/02786821003758294, 2010.
Christian, T. J., Yokelson, R. J., Cárdenas, B., Molina, L. T., Engling, G., and Hsu, S.-C.: Trace gas and particle emissions from domestic and industrial biofuel use and garbage burning in central Mexico, Atmos. Chem. Phys., 10, 565–584, https://doi.org/10.5194/acp-10-565-2010, 2010.
Crippa, M., Canonaco, F., Slowik, J. G., El Haddad, I., DeCarlo, P. F., Mohr, C., Heringa, M. F., Chirico, R., Marchand, N., Temime-Roussel, B., Abidi, E., Poulain, L., Wiedensohler, A., Baltensperger, U., and Prévôt, A. S. H.: Primary and secondary organic aerosol origin by combined gas-particle phase source apportionment, Atmos. Chem. Phys., 13, 8411–8426, https://doi.org/10.5194/acp-13-8411-2013, 2013.
Dall'Osto, M., Ovadnevaite, J., Ceburnis, D., Martin, D., Healy, R. M., O'Connor, I. P., Kourtchev, I., Sodeau, J. R., Wenger, J. C., and O'Dowd, C.: Characterization of urban aerosol in Cork city (Ireland) using aerosol mass spectrometry, Atmos. Chem. Phys., 13, 4997–5015, https://doi.org/10.5194/acp-13-4997-2013, 2013.
DeCarlo, P. F., Kimmel, J. R., Trimborn, A., Northway, M. J., Jayne, J. T., Aiken, A. C., Gonin, M., Fuhrer, K., Horvath, T., Docherty, K. S., Worsnop, D. R., and Jimenez, J. L.: Field-Deployable, High-Resolution, Time-of-Flight Aerosol Mass Spectrometer, Anal. Chem., 78, 8281–8289, https://doi.org/10.1021/ac061249n, 2006.
Di Marco, C. D., Langford, B., Cash, J. M., Mullinger, N., Helfter, C., and Nemitz, E.: Source apportionment analysis applied to aerosol eddy-covariance fluxes in Delhi, European Aerosol Conference, Gothenburg, Sweden, 25–30 August 2019, available at: https://www.costcolossal.eu/specialsessioneac2019/ (last access: 20 April 2021), 2019.
Dewangan, S., Pervez, S., Chakrabarty, R., and Zielinska, B.: Uncharted sources of particle bound polycyclic aromatic hydrocarbons from South Asia: Religious/ritual burning practices, Atmos. Pollut. Res., 5, 283–291, https://doi.org/10.5094/apr.2014.034, 2014.
Docherty, K. S., Aiken, A. C., Huffman, J. A., Ulbrich, I. M., DeCarlo, P. F., Sueper, D., Worsnop, D. R., Snyder, D. C., Peltier, R. E., Weber, R. J., Grover, B. D., Eatough, D. J., Williams, B. J., Goldstein, A. H., Ziemann, P. J., and Jimenez, J. L.: The 2005 Study of Organic Aerosols at Riverside (SOAR-1): instrumental intercomparisons and fine particle composition, Atmos. Chem. Phys., 11, 12387–12420, https://doi.org/10.5194/acp-11-12387-2011, 2011.
Duplissy, J., DeCarlo, P. F., Dommen, J., Alfarra, M. R., Metzger, A., Barmpadimos, I., Prevot, A. S. H., Weingartner, E., Tritscher, T., Gysel, M., Aiken, A. C., Jimenez, J. L., Canagaratna, M. R., Worsnop, D. R., Collins, D. R., Tomlinson, J., and Baltensperger, U.: Relating hygroscopicity and composition of organic aerosol particulate matter, Atmos. Chem. Phys., 11, 1155–1165, https://doi.org/10.5194/acp-11-1155-2011, 2011.
Elser, M., El-Haddad, I., Maasikmets, M., Bozzetti, C., Wolf, R., Ciarelli, G., Slowik, J. G., Richter, R., Teinemaa, E., Hüglin, C., Baltensperger, U., and Prévôt, A. S. H.: High contributions of vehicular emissions to ammonia in three European cities derived from mobile measurements, Atmos. Environ., 175, 210–220, https://doi.org/10.1016/j.atmosenv.2017.11.030, 2018.
Farmer, D. K., Matsunaga, A., Docherty, K. S., Surratt, J. D., Seinfeld, J. H., Ziemann, P. J., and Jimenez, J. L.: Response of an aerosol mass spectrometer to organonitrates and organosulfates and implications for atmospheric chemistry, P. Natl. Acad. Sci. USA, 107, 6670–6675, https://doi.org/10.1073/pnas.0912340107, 2010.
Fountoukis, C. and Nenes, A.: ISORROPIA II: a computationally efficient thermodynamic equilibrium model for K+–Ca2+–Mg2+–NH–Na+–SO–NO–Cl−–H2O aerosols, Atmos. Chem. Phys., 7, 4639–4659, https://doi.org/10.5194/acp-7-4639-2007, 2007.
Gadi, R., Shivani, Sharma, S. K., and Mandal, T. K.: Source apportionment and health risk assessment of organic constituents in fine ambient aerosols (PM2.5): A complete year study over National Capital Region of India, Chemosphere, 221, 583–596, https://doi.org/10.1016/j.chemosphere.2019.01.067, 2019.
Gakidou, E., Afshin, A., Abajobir, A. A., Abate, K. H., Abbafati, C., Abbas, K. M., Abd-Allah, F., Abdulle, A. M., Abera, S. F., Aboyans, V., Abu-Raddad, L. J., Abu-Rmeileh, N. M. E., Abyu, G. Y., Adedeji, I. A., Adetokunboh, O., Afarideh, M., Agrawal, A., Agrawal, S., Ahmad Kiadaliri, A., Ahmadieh, H., Ahmed, M. B., Aichour, A. N., Aichour, I., Aichour, M. T. E., Akinyemi, R. O., Akseer, N., Alahdab, F., Al-Aly, Z., Alam, K., Alam, N., Alam, T., Alasfoor, D., Alene, K. A., Ali, K., Alizadeh-Navaei, R., Alkerwi, A., Alla, F., Allebeck, P., Al-Raddadi, R., Alsharif, U., Altirkawi, K. A., Alvis-Guzman, N., Amare, A. T., Amini, E., Ammar, W., Amoako, Y. A., Ansari, H., Antó, J. M., Antonio, C. A. T., Anwari, P., Arian, N., Ärnlöv, J., Artaman, A., Aryal, K. K., Asayesh, H., Asgedom, S. W., Atey, T. M., Avila-Burgos, L., Avokpaho, E. F. G. A., Awasthi, A., Azzopardi, P., Bacha, U., Badawi, A., Balakrishnan, K., Ballew, S. H., Barac, A., Barber, R. M., Barker-Collo, S. L., Bärnighausen, T., Barquera, S., Barregard, L., Barrero, L. H., Batis, C., Battle, K. E., Baune, B. T., Beardsley, J., Bedi, N., Beghi, E., Bell, M. L., Bennett, D. A., Bennett, J. R., Bensenor, I. M., Berhane, A., Berhe, D. F., Bernabé, E., Betsu, B. D., Beuran, M., Beyene, A. S., Bhansali, A., Bhutta, Z. A., Bikbov, B., Birungi, C., Biryukov, S., Blosser, C. D., Boneya, D. J., Bou-Orm, I. R., Brauer, M., Breitborde, N. J. K., Brenner, H., et al.: Global, regional, and national comparative risk assessment of 84 behavioural, environmental and occupational, and metabolic risks or clusters of risks, 1990–2016: A systematic analysis for the Global Burden of Disease Study 2016, Lancet, 390, 1345–1422, https://doi.org/10.1016/S0140-6736(17)32366-8, 2017.
Gani, S., Bhandari, S., Seraj, S., Wang, D. S., Patel, K., Soni, P., Arub, Z., Habib, G., Hildebrandt Ruiz, L., and Apte, J. S.: Submicron aerosol composition in the world's most polluted megacity: the Delhi Aerosol Supersite study, Atmos. Chem. Phys., 19, 6843–6859, https://doi.org/10.5194/acp-19-6843-2019, 2019.
Gunthe, S. S., Liu, P., Panda, U., Raj, S. S., Sharma, A., Darbyshire, E., Reyes-Villegas, E., Allan, J., Chen, Y., Wang, X., Song, S., Pöhlker, M. L., Shi, L., Wang, Y., Kommula, S. M., Liu, T., Ravikrishna, R., McFiggans, G., Mickley, L. J., Martin, S. T., Pöschl, U., Andreae, M. O., and Coe, H.: Enhanced aerosol particle growth sustained by high continental chlorine emission in India, Nat. Geosci., 14, 77–84, https://doi.org/10.1038/s41561-020-00677-x, 2021.
Gupta, S., Gadi, R., Sharma, S. K., and Mandal, T. K.: Characterization and source apportionment of organic compounds in PM10 using PCA and PMF at a traffic hotspot of Delhi, Sustain. Cities Soc., 39, 52–67, https://doi.org/10.1016/j.scs.2018.01.051, 2018.
Hayes, P. L., Ortega, A. M., Cubison, M. J., Froyd, K. D., Zhao, Y., Cliff, S. S., Hu, W. W., Toohey, D. W., Flynn, J. H., Lefer, B. L., Grossberg, N., Alvarez, S., Rappenglück, B., Taylor, J. W., Allan, J. D., Holloway, J. S., Gilman, J. B., Kuster, W. C., De Gouw, J. A., Massoli, P., Zhang, X., Liu, J., Weber, R. J., Corrigan, A. L., Russell, L. M., Isaacman, G., Worton, D. R., Kreisberg, N. M., Goldstein, A. H., Thalman, R., Waxman, E. M., Volkamer, R., Lin, Y. H., Surratt, J. D., Kleindienst, T. E., Offenberg, J. H., Dusanter, S., Griffith, S., Stevens, P. S., Brioude, J., Angevine, W. M., and Jimenez, J. L.: Organic aerosol composition and sources in Pasadena, California, during the 2010 CalNex campaign, J. Geophys. Res.-Atmos., 118, 9233–9257, https://doi.org/10.1002/jgrd.50530, 2013.
He, C., Ge, Y., Tan, J., You, K., Han, X., and Wang, J.: Characteristics of polycyclic aromatic hydrocarbons emissions of diesel engine fueled with biodiesel and diesel, Fuel, 89, 2040–2046, https://doi.org/10.1016/j.fuel.2010.03.014, 2010.
Heald, C. L., Kroll, J. H., Jimenez, J. L., Docherty, K. S., Decarlo, P. F., Aiken, A. C., Chen, Q., Martin, S. T., Farmer, D. K., and Artaxo, P.: A simplified description of the evolution of organic aerosol composition in the atmosphere, Geophys. Res. Lett., 37, L08803, https://doi.org/10.1029/2010GL042737, 2010.
Herring, C. L., Faiola, C. L., Massoli, P., Sueper, D., Erickson, M. H., McDonald, J. D., Simpson, C. D., Yost, M. G., Jobson, B. T., and Van Reken, T. M.: New Methodology for Quantifying Polycyclic Aromatic Hydrocarbons (PAHs) Using High-Resolution Aerosol Mass Spectrometry, Aerosol Sci. Technol., 49, 1131–1148, https://doi.org/10.1080/02786826.2015.1101050, 2015.
Jethva, H., Torres, O., Field, R. D., Lyapustin, A., Gautam, R., and Kayetha, V.: Connecting Crop Productivity, Residue Fires, and Air Quality over Northern India, Sci. Rep., 9, 1–11, https://doi.org/10.1038/s41598-019-52799-x, 2019.
Jimenez, J. L., Canagaratna, M. R., Donahue, N. M., Prevot, A. S. H., Zhang, Q., Kroll, J. H., DeCarlo, P. F., Allan, J. D., Coe, H., Ng, N. L., Aiken, A. C., Docherty, K. S., Ulbrich, I. M., Grieshop, A. P., Robinson, A. L., Duplissy, J., Smith, J. D., Wilson, K. R., Lanz, V. A., Hueglin, C., Sun, Y. L., Tian, J., Laaksonen, A., Raatikainen, T., Rautiainen, J., Vaattovaara, P., Ehn, M., Kulmala, M., Tomlinson, J. M., Collins, D. R., Cubison, M. J., Dunlea, E. J., Huffman, J. A., Onasch, T. B., Alfarra, M. R., Williams, P. I., Bower, K., Kondo, Y., Schneider, J., Drewnick, F., Borrmann, S., Weimer, S., Demerjian, K., Salcedo, D., Cottrell, L., Griffin, R., Takami, A., Miyoshi, T., Hatakeyama, S., Shimono, A., Sun, J. Y., Zhang, Y. M., Dzepina, K., Kimmel, J. R., Sueper, D., Jayne, J. T., Herndon, S. C., Trimborn, A. M., Williams, L. R., Wood, E. C., Middlebrook, A. M., Kolb, C. E., Baltensperger, U., and Worsnop, D. R.: Evolution of organic aerosols in the atmosphere, Science, 326, 1525–1529, https://doi.org/10.1126/science.1180353, 2009.
Kang, M., Fu, P., Aggarwal, S. G., Kumar, S., Zhao, Y., Sun, Y., and Wang, Z.: Size distributions of n-alkanes, fatty acids and fatty alcohols in springtime aerosols from New Delhi, India, Environ. Pollut., 219, 957–966, https://doi.org/10.1016/j.envpol.2016.09.077, 2016.
Kiendler-Scharr, A., Mensah, A. A., Friese, E., Topping, D., Nemitz, E., Prevot, A. S. H., Äijälä, M., Allan, J., Canonaco, F., Canagaratna, M., Carbone, S., Crippa, M., Dall Osto, M., Day, D. A., De Carlo, P., Di Marco, C. F., Elbern, H., Eriksson, A., Freney, E., Hao, L., Herrmann, H., Hildebrandt, L., Hillamo, R., Jimenez, J. L., Laaksonen, A., McFiggans, G., Mohr, C., O'Dowd, C., Otjes, R., Ovadnevaite, J., Pandis, S. N., Poulain, L., Schlag, P., Sellegri, K., Swietlicki, E., Tiitta, P., Vermeulen, A., Wahner, A., Worsnop, D., and Wu, H. C.: Ubiquity of organic nitrates from nighttime chemistry in the European submicron aerosol, Geophys. Res. Lett., 43, 7735–7744, https://doi.org/10.1002/2016GL069239, 2016.
Kulkarni, S. H., Ghude, S. D., Jena, C., Karumuri, R. K., Sinha, B., Sinha, V., Kumar, R., Soni, V. K., and Khare, M.: How Much Does Large-Scale Crop Residue Burning Affect the Air Quality in Delhi?, Environ. Sci. Technol., 54, 4790–4799, https://doi.org/10.1021/acs.est.0c00329, 2020.
Lalchandani, V., Kumar, V., Tobler, A., M. Thamban, N., Mishra, S., Slowik, J. G., Bhattu, D., Rai, P., Satish, R., Ganguly, D., Tiwari, S., Rastogi, N., Tiwari, S., Močnik, G., Prévôt, A. S. H., and Tripathi, S. N.: Real-time characterization and source apportionment of fine particulate matter in the Delhi megacity area during late winter, Sci. Total Environ., 770, 145324, https://doi.org/10.1016/j.scitotenv.2021.145324, 2021.
Lanz, V. A., Alfarra, M. R., Baltensperger, U., Buchmann, B., Hueglin, C., Szidat, S., Wehrli, M. N., Wacker, L., Weimer, S., Caseiro, A., Puxbaum, H., and Prevot, A. S. H.: Source Attribution of Submicron Organic Aerosols during Wintertime Inversions by Advanced Factor Analysis of Aerosol Mass Spectra, Environ. Sci. Technol., 42, 214–220, https://doi.org/10.1021/es0707207, 2008.
Laroo, C. A., Schenk, C. R., Sanchez, L. J., McDonald, J., and Smith, P. L.: Emissions of PCDD/Fs, PCBs, and PAHs from legacy on-road heavy-duty diesel engines, Chemosphere, 89, 1287–1294, https://doi.org/10.1016/j.chemosphere.2012.05.022, 2012.
Lavric, E. D., Konnov, A. A., and De Ruyck, J.: Dioxin levels in wood combustion – A review, Biomass and Bioenergy, 26, 115–145, https://doi.org/10.1016/S0961-9534(03)00104-1, 2004.
Li, G., Lei, W., Bei, N., and Molina, L. T.: Contribution of garbage burning to chloride and PM2.5 in Mexico City, Atmos. Chem. Phys., 12, 8751–8761, https://doi.org/10.5194/acp-12-8751-2012, 2012.
Li, J., Pósfai, M., Hobbs, P. V., and Buseck, P. R.: Individual aerosol particles from biomass burning in southern Africa: 2. Compositions and aging of inorganic particles, J. Geophys. Res.-Atmos., 108, 1–12, https://doi.org/10.1029/2002jd002310, 2003.
Lim, J., Lim, C., Kim, S., and Hong, J.: Characterizations of organic compounds in diesel exhaust particulates, J. Environ. Sci., 34, 171–183, https://doi.org/10.1016/j.jes.2015.03.013, 2015.
Lin, P. C., Peng, C. Y., Pan, C. H., Lin, P. I. D., and Wu, M. T.: Gender differences and lung cancer risk in occupational chefs: analyzing more than 350,000 chefs in Taiwan, 1984–2011, Int. Arch. Occup. Environ. Health, 92, 101–109, https://doi.org/10.1007/s00420-018-1358-8, 2019.
Liu, T., Marlier, M. E., DeFries, R. S., Westervelt, D. M., Xia, K. R., Fiore, A. M., Mickley, L. J., Cusworth, D. H., and Milly, G.: Seasonal impact of regional outdoor biomass burning on air pollution in three Indian cities: Delhi, Bengaluru, and Pune, Atmos. Environ., 172, 83–92, https://doi.org/10.1016/j.atmosenv.2017.10.024, 2018.
Maji, K. J., Arora, M., and Dikshit, A. K.: Premature mortality attributable to PM2.5 exposure and future policy roadmap for “airpocalypse” affected Asian megacities, Process Saf. Environ. Prot., 118, 371–383, https://doi.org/10.1016/j.psep.2018.07.009, 2018.
Masih, J., Singhvi, R., Kumar, K., Jain, V. K., and Taneja, A.: Seasonal variation and sources of polycyclic aromatic hydrocarbons (PAHs) in indoor and outdoor air in a semi arid tract of Northern India, Aerosol Air Qual. Res., 12, 515–525, https://doi.org/10.4209/aaqr.2011.11.0192, 2012.
McLafferty, W. F. and Turecek, F.: Interpretation of Mass Spectra, 4th edn., Univ. Science Books, 371 pp., 1993.
Minh, N. H., Minh, T. B., Watanabe, M., Kunisue, T., Monirith, I., Tanabe, S., Sakai, S., Subramanian, A., Sasikumar, K., Viet, P. H., Tuyen, B. C., Tana, T. S., and Prudente, M. S.: Open dumping site in Asian developing countries: A potential source of polychlorinated dibenzo-p-dioxins and polychlorinated dibenzofurans, Environ. Sci. Technol., 37, 1493–1502, https://doi.org/10.1021/es026078s, 2003.
Mohr, C., DeCarlo, P. F., Heringa, M. F., Chirico, R., Slowik, J. G., Richter, R., Reche, C., Alastuey, A., Querol, X., Seco, R., Peñuelas, J., Jiménez, J. L., Crippa, M., Zimmermann, R., Baltensperger, U., and Prévôt, A. S. H.: Identification and quantification of organic aerosol from cooking and other sources in Barcelona using aerosol mass spectrometer data, Atmos. Chem. Phys., 12, 1649–1665, https://doi.org/10.5194/acp-12-1649-2012, 2012.
Mukherjee, T., Vinoj, V., Midya, S. K., Puppala, S. P., and Adhikary, B.: Numerical simulations of different sectoral contributions to post monsoon pollution over Delhi, Heliyon, 6, e03548, https://doi.org/10.1016/j.heliyon.2020.e03548, 2020.
Nagpure, A. S., Ramaswami, A., and Russell, A.: Characterizing the Spatial and Temporal Patterns of Open Burning of Municipal Solid Waste (MSW) in Indian Cities, Environ. Sci. Technol., 49, 12911–12912, https://doi.org/10.1021/acs.est.5b03243, 2015.
Nakoudi, K., Giannakaki, E., Dandou, A., Tombrou, M., and Komppula, M.: Planetary boundary layer height by means of lidar and numerical simulations over New Delhi, India, Atmos. Meas. Tech., 12, 2595–2610, https://doi.org/10.5194/amt-12-2595-2019, 2019.
Ng, N. L., Canagaratna, M. R., Jimenez, J. L., Chhabra, P. S., Seinfeld, J. H., and Worsnop, D. R.: Changes in organic aerosol composition with aging inferred from aerosol mass spectra, Atmos. Chem. Phys., 11, 6465–6474, https://doi.org/10.5194/acp-11-6465-2011, 2011.
Ozel, M. Z., Ward, M. W., Hamilton, J. F., Lewis, A. C., Raventos-Duran, T., and Harrison, R. M.: Analysis of organic nitrogen compounds in Urban aerosol samples using GCxGC-TOF/MS, Aerosol Sci. Technol., 44, 109–116, https://doi.org/10.1080/02786820903410105, 2010.
Paatero, P. and Tapper, U.: Positive matrix factorization: A non-negative factor model with optimal utilization of error estimates of data values, Environmetrics, 5, 111–126, https://doi.org/10.1002/env.3170050203, 1994.
Pervez, S., Chakrabarty, R., Dewangan, S., Watson, J. G., Chow, J. C., Lal Matawle, J., and Pervez, Y.: Cultural and ritual burning emission factors and activity levels in india, Aerosol Air Qual. Res., 15, 72–80, https://doi.org/10.4209/aaqr.2014.01.0022, 2015.
Pervez, S., Verma, M., Tiwari, S., Chakrabarty, R. K., Watson, J. G., Chow, J. C., Panicker, A. S., Deb, M. K., Siddiqui, M. N., and Pervez, Y. F.: Household solid fuel burning emission characterization and activity levels in India, Sci. Total Environ., 654, 493–504, https://doi.org/10.1016/j.scitotenv.2018.11.019, 2019.
Reyes-Villegas, E., Bannan, T., Le Breton, M., Mehra, A., Priestley, M., Percival, C., Coe, H., and Allan, J. D.: Online Chemical Characterization of Food-Cooking Organic Aerosols: Implications for Source Apportionment, Environ. Sci. Technol., 52, 5308–5318, https://doi.org/10.1021/acs.est.7b06278, 2018a.
Reyes-Villegas, E., Priestley, M., Ting, Y.-C., Haslett, S., Bannan, T., Le Breton, M., Williams, P. I., Bacak, A., Flynn, M. J., Coe, H., Percival, C., and Allan, J. D.: Simultaneous aerosol mass spectrometry and chemical ionisation mass spectrometry measurements during a biomass burning event in the UK: insights into nitrate chemistry, Atmos. Chem. Phys., 18, 4093–4111, https://doi.org/10.5194/acp-18-4093-2018, 2018b.
Reyes-Villegas, E., Panda, U., Darbyshire, E., Cash, J. M., Joshi, R., Langford, B., Di Marco, C. F., Mullinger, N., Acton, W. J. F., Drysdale, W., Nemitz, E., Flynn, M., Voliotis, A., McFiggans, G., Coe, H., Lee, J., Hewitt, C. N., Heal, M. R., Gunthe, S. S., Shivani, Gadi, R., Singh, S., Soni, V., and Allan, J. D.: PM1 composition and source apportionment at two sites in Delhi, India across multiple seasons, Atmos. Chem. Phys. Discuss. [preprint], https://doi.org/10.5194/acp-2020-894, in review, 2020.
Saarikoski, S., Carbone, S., Decesari, S., Giulianelli, L., Angelini, F., Canagaratna, M., Ng, N. L., Trimborn, A., Facchini, M. C., Fuzzi, S., Hillamo, R., and Worsnop, D.: Chemical characterization of springtime submicrometer aerosol in Po Valley, Italy, Atmos. Chem. Phys., 12, 8401–8421, https://doi.org/10.5194/acp-12-8401-2012, 2012.
Saraswati, Sharma, S. K., and Mandal, T. K.: Five-year measurements of ambient ammonia and its relationships with other trace gases at an urban site of Delhi, India, Meteorol. Atmos. Phys., 130, 241–257, https://doi.org/10.1007/s00703-017-0512-2, 2018.
Sen, A., Mandal, T. K., Sharma, S. K., Saxena, M., Gupta, N. C., Gautam, R., Gupta, A., Gill, T., Rani, S., Saud, T., Singh, D. P., and Gadi, R.: Chemical properties of emission from biomass fuels used in the rural sector of the western region of India, Atmos. Environ., 99, 411–424, https://doi.org/10.1016/j.atmosenv.2014.09.012, 2014.
Sharma, S. K., Kumar, M., Rohtash, Gupta, N. C., Saraswati, Saxena, M., and Mandal, T. K.: Characteristics of ambient ammonia over Delhi, India, Meteorol. Atmos. Phys., 124, 67–82, https://doi.org/10.1007/s00703-013-0299-8, 2014.
Shivani, Gadi, R., Sharma, S. K., and Mandal, T. K.: Seasonal variation, source apportionment and source attributed health risk of fine carbonaceous aerosols over National Capital Region, India, Chemosphere, 237, 124500, https://doi.org/10.1016/j.chemosphere.2019.124500, 2019.
Simoneit, B. R. T., Rushdi, A. I., Abas, M. R. B., and Didyk, B. M.: Alkyl amides and nitriles as novel tracers for biomass burning, Environ. Sci. Technol., 37, 16–21, https://doi.org/10.1021/es020811y, 2003.
Singh, A., Kamal, R., Mudiam, M. K. R., Gupta, M. K., Satyanarayana, G. N. V., Bihari, V., Shukla, N., Khan, A. H., and Kesavachandran, C. N.: Heat and PAHs emissions in indoor kitchen air and its impact on kidney dysfunctions among kitchen workers in Lucknow, North India, PLoS One, 11, 1–16, https://doi.org/10.1371/journal.pone.0148641, 2016.
Singh, D. P., Gadi, R., and Mandal, T. K.: Emissions of polycyclic aromatic hydrocarbons in the atmosphere: An indian perspective, Hum. Ecol. Risk Assess., 16, 1145–1168, https://doi.org/10.1080/10807039.2010.512258, 2010.
Slowik, J. G., Vlasenko, A., McGuire, M., Evans, G. J., and Abbatt, J. P. D.: Simultaneous factor analysis of organic particle and gas mass spectra: AMS and PTR-MS measurements at an urban site, Atmos. Chem. Phys., 10, 1969–1988, https://doi.org/10.5194/acp-10-1969-2010, 2010.
Stewart, G. J., Nelson, B. S., Acton, W. J. F., Vaughan, A. R., Farren, N. J., Hopkins, J. R., Ward, M. W., Swift, S. J., Arya, R., Mondal, A., Jangirh, R., Ahlawat, S., Yadav, L., Sharma, S. K., Yunus, S. S. M., Hewitt, C. N., Nemitz, E., Mullinger, N., Gadi, R., Sahu, L. K., Tripathi, N., Rickard, A. R., Lee, J. D., Mandal, T. K., and Hamilton, J. F.: Emissions of intermediate-volatility and semi-volatile organic compounds from domestic fuels used in Delhi, India, Atmos. Chem. Phys., 21, 2407–2426, https://doi.org/10.5194/acp-21-2407-2021, 2021.
Stone, E., Schauer, J., Quraishi, T. A., and Mahmood, A.: Chemical characterization and source apportionment of fine and coarse particulate matter in Lahore, Pakistan, Atmos. Environ., 44, 1062–1070, https://doi.org/10.1016/j.atmosenv.2009.12.015, 2010.
Sudheer, A. K., Rengarajan, R., Deka, D., Bhushan, R., Singh, S. K., and Aslam, M. Y.: Diurnal and seasonal characteristics of aerosol ionic constituents over an urban location in Western India: Secondary aerosol formation and meteorological influence, Aerosol Air Qual. Res., 14, 1701–1713, https://doi.org/10.4209/aaqr.2013.09.0288, 2014.
Sullivan, R. C., Guazzotti, S. A., Sodeman, D. A., Tang, Y., Carmichael, G. R., and Prather, K. A.: Mineral dust is a sink for chlorine in the marine boundary layer, Atmos. Environ., 41, 7166–7179, https://doi.org/10.1016/j.atmosenv.2007.05.047, 2007.
Sun, K., Tao, L., Miller, D. J., Pan, D., Golston, L. M., Zondlo, M. A., Griffin, R. J., Wallace, H. W., Leong, Y. J., Yang, M. M., Zhang, Y., Mauzerall, D. L., and Zhu, T.: Vehicle Emissions as an Important Urban Ammonia Source in the United States and China, Environ. Sci. Technol., 51, 2472–2481, https://doi.org/10.1021/acs.est.6b02805, 2017.
Sun, Y., Du, W., Fu, P., Wang, Q., Li, J., Ge, X., Zhang, Q., Zhu, C., Ren, L., Xu, W., Zhao, J., Han, T., Worsnop, D. R., and Wang, Z.: Primary and secondary aerosols in Beijing in winter: sources, variations and processes, Atmos. Chem. Phys., 16, 8309–8329, https://doi.org/10.5194/acp-16-8309-2016, 2016.
Sun, Y.-L., Zhang, Q., Schwab, J. J., Demerjian, K. L., Chen, W.-N., Bae, M.-S., Hung, H.-M., Hogrefe, O., Frank, B., Rattigan, O. V., and Lin, Y.-C.: Characterization of the sources and processes of organic and inorganic aerosols in New York city with a high-resolution time-of-flight aerosol mass apectrometer, Atmos. Chem. Phys., 11, 1581–1602, https://doi.org/10.5194/acp-11-1581-2011, 2011.
Sun, Y. L., Zhang, Q., Schwab, J. J., Yang, T., Ng, N. L., and Demerjian, K. L.: Factor analysis of combined organic and inorganic aerosol mass spectra from high resolution aerosol mass spectrometer measurements, Atmos. Chem. Phys., 12, 8537–8551, https://doi.org/10.5194/acp-12-8537-2012, 2012.
Svedahl, S. R.: Cooks, work environment and health Experimental studies of exposure to cooking fumes, and epidemiological investigations in a cohort [Doctoral thesis], Norwegian University of Science and Technology, 2018.
Tobler, A., Bhattu, D., Canonaco, F., Lalchandani, V., Shukla, A., Thamban, N. M., Mishra, S., Srivastava, A. K., Bisht, D. S., Tiwari, S., Singh, S., Močnik, G., Baltensperger, U., Tripathi, S. N., Slowik, J. G., and Prévôt, A. S. H.: Chemical characterization of PM2.5 and source apportionment of organic aerosol in New Delhi, India, Sci. Total Environ., 745, 140924, https://doi.org/10.1016/j.scitotenv.2020.140924, 2020.
Tsai, J. H., Chen, S. J., Huang, K. L., Lee, W. J., Kuo, W. C., and Lin, W. Y.: Characteristics of particulate emissions from a diesel generator fueled with varying blends of biodiesel and fossil diesel, J. Environ. Sci. Heal. A, 46, 204–213, https://doi.org/10.1080/10934529.2011.532444, 2011.
Ulbrich, I. M., Canagaratna, M. R., Zhang, Q., Worsnop, D. R., and Jimenez, J. L.: Interpretation of organic components from Positive Matrix Factorization of aerosol mass spectrometric data, Atmos. Chem. Phys., 9, 2891–2918, https://doi.org/10.5194/acp-9-2891-2009, 2009.
Verma, R., Vinoda, K. S., Papireddy, M., and Gowda, A. N. S.: Toxic Pollutants from Plastic Waste- A Review, Procedia Environ. Sci., 35, 701–708, https://doi.org/10.1016/j.proenv.2016.07.069, 2016.
Vreeland, H., Schauer, J. J., Russell, A. G., Marshall, J. D., Fushimi, A., Jain, G., Sethuraman, K., Verma, V., Tripathi, S. N., and Bergin, M. H.: Chemical characterization and toxicity of particulate matter emissions from roadside trash combustion in urban India, Atmos. Environ., 147, 22–30, https://doi.org/10.1016/j.atmosenv.2016.09.041, 2016.
Wang, H., Wang, X., Yang, X., Li, W., Xue, L., Wang, T., Chen, J., and Wang, W.: Mixed chloride aerosols and their atmospheric implications: A review, Aerosol Air Qual. Res., 17, 878–887, https://doi.org/10.4209/aaqr.2016.09.0383, 2017.
Wang, L., Slowik, J. G., Tripathi, N., Bhattu, D., Rai, P., Kumar, V., Vats, P., Satish, R., Baltensperger, U., Ganguly, D., Rastogi, N., Sahu, L. K., Tripathi, S. N., and Prévôt, A. S. H.: Source characterization of volatile organic compounds measured by proton-transfer-reaction time-of-flight mass spectrometers in Delhi, India, Atmos. Chem. Phys., 20, 9753–9770, https://doi.org/10.5194/acp-20-9753-2020, 2020.
Wang, W. C., Lin, W. H., Kuo, C. P., and Wu, J. Y.: The relation between dioxin concentration from exhaust gas of diesel engine and chlorine content, J. Anal. Appl. Pyrolysis, 94, 10–16, https://doi.org/10.1016/j.jaap.2011.12.010, 2012.
Weimer, S., Alfarra, M. R., Schreiber, D., Mohr, M., Prévôt, A. S. H., and Baltensperger, U.: Organic aerosol mass spectral signatures from wood-burning emissions: Influence of burning conditions and type, J. Geophys. Res. Atmos., 113, D10304, https://doi.org/10.1029/2007JD009309, 2008.
Weingartner, E., Saathoff, H., Schnaiter, M., Streit, N., Bitnar, B., and Baltensperger, U.: Absorption of light by soot particles: determination of the absorption coefficient by means of aethalometers, J. Aerosol Sci., 34, 1445–1463, https://doi.org/10.1016/S0021-8502(03)00359-8, 2003.
Xie, M., Zhao, Z., Holder, A. L., Hays, M. D., Chen, X., Shen, G., Jetter, J. J., Champion, W. M., and Wang, Q.: Chemical composition, structures, and light absorption of N-containing aromatic compounds emitted from burning wood and charcoal in household cookstoves, Atmos. Chem. Phys., 20, 14077–14090, https://doi.org/10.5194/acp-20-14077-2020, 2020.
Ye, Z., Liu, J., Gu, A., Feng, F., Liu, Y., Bi, C., Xu, J., Li, L., Chen, H., Chen, Y., Dai, L., Zhou, Q., and Ge, X.: Chemical characterization of fine particulate matter in Changzhou, China, and source apportionment with offline aerosol mass spectrometry, Atmos. Chem. Phys., 17, 2573–2592, https://doi.org/10.5194/acp-17-2573-2017, 2017.
Zhang, M., Buekens, A., and Li, X.: Open burning as a source of dioxins, Crit. Rev. Environ. Sci. Technol., 47, 543–620, https://doi.org/10.1080/10643389.2017.1320154, 2017.
Zhang, X., Xu, J., Kang, S., Liu, Y., and Zhang, Q.: Chemical characterization of long-range transport biomass burning emissions to the Himalayas: insights from high-resolution aerosol mass spectrometry, Atmos. Chem. Phys., 18, 4617–4638, https://doi.org/10.5194/acp-18-4617-2018, 2018.
Zhao, J., Peng, P., Song, J., Ma, S., Sheng, G., and Fu, J.: Characterization of organic matter in total suspended particles by thermodesorption and pyrolysis-gas chromatography-mass spectrometry, J. Environ. Sci., 21, 1658–1666, https://doi.org/10.1016/S1001-0742(08)62470-5, 2009.
Zheng, X., Wu, Y., Zhang, S., Hu, J., Zhang, K. M., Li, Z., He, L., and Hao, J.: Characterizing particulate polycyclic aromatic hydrocarbon emissions from diesel vehicles using a portable emissions measurement system, Sci. Rep., 7, 1–12, https://doi.org/10.1038/s41598-017-09822-w, 2017.