the Creative Commons Attribution 4.0 License.
the Creative Commons Attribution 4.0 License.
 | 27 Aug 2020
Numerical analysis of agricultural emissions impacts on PM2.5 in China using a high-resolution ammonia emission inventory
Xiao Han
Lingyun Zhu
Mingxu Liu
Yu Song
China is one of the largest agricultural countries in the world. Thus, NH3 emission from agricultural activities in China considerably affects the country's regional air quality and visibility. In this study, a high-resolution agricultural NH3 emission inventory compiled on 1 km × 1 km horizontal resolution was applied to calculate the NH3 mass burden in China and reliably estimate the influence of NH3 on agriculture. The key parameter emission factors of this inventory were enhanced by considering many experiment results, and the dynamic data of spatial and temporal information were updated using statistical data of 2015. In addition to fertilizers and husbandry, farmland ecosystems, livestock waste, crop residue burning, wood-based fuel combustion, and other NH3 emission sources were included in this inventory. Furthermore, a source apportionment tool, namely, the Integrated Source Apportionment Method (ISAM) coupled with the air quality modeling system Regional Atmospheric Modeling System and Community Multiscale Air Quality, was applied to capture the contribution of NH3 emitted from total agriculture (Tagr) in China. The aerosol mass concentration in 2015 was simulated, and results showed that the high mass concentration of NH3 exceeded 10 µg m−3 and mainly appeared in the North China Plain, Central China, the Yangtze River Delta, and the Sichuan Basin. Moreover, the annual average contribution of Tagr NH3 to PM2.5 mass burden was 14 %–22 % in China. Specific to the PM2.5 components, Tagr NH3 contributed dominantly to ammonium formation (87.6 %) but trivially to sulfate formation (2.2 %). In addition, several brute-force sensitivity tests were conducted to estimate the impact of Tagr NH3 emission reduction on PM2.5 mass burden. In contrast to the result of ISAM, even though the Tagr NH3 only provided 10.1 % contribution to nitrate under the current emission scenario, the reduction of nitrate could reach 95.8 % upon removal of the Tagr NH3 emission. This deviation occurred because the contribution of NH3 to nitrate should be small under a “rich NH3”environment and large under a “poor NH3” environment. Thus, the influence of NH3 on nitrate formation would be enhanced with the decrease in ambient NH3 mass concentration.
- Article
(15226 KB) - Full-text XML
- BibTeX
- EndNote


Ammonia (NH3) is an important pollution species that is a principal neutralizing agent for acid aerosols, and , which are formed from SO2 and NOx (Chang, 1989; McMurry et al., 1983). In addition, NH3 influences the rate of particle nucleation (Ball et al., 1999; Kulmala et al., 2002) and enhances secondary organic aerosol (SOA) yield (Babar et al., 2017). Widespread haze events have frequently occurred in most regions of eastern China in recent years, and several studies have reported that secondary inorganic salts, including sulfate, nitrate, and ammonium, form the majority of total aerosols in the urban and rural regions (Tao et al., 2014; G. Wang et al., 2016; Zhang et al., 2012; K. Zhang et al., 2018; Lai et al., 2016). Therefore, in addition to the heavy emissions of SO2 and NO2, NH3 emissions from agricultural activities are non-negligible.
China is one of the largest agricultural countries in the world. Even though a decrease appeared from 2006 to 2012, the annual NH3 emission budget, which reached 9.7–12 Tg (Kang et al., 2016; Xu et al., 2016; Zhou et al., 2015), remains huge and leads to high NH3 ambient concentration. This massive NH3 emission considerably affects regional air quality and horizontal visibility. First, the major PM2.5 components, (NH4)2SO4, (NH4)3H(SO4)2, NH4HSO4, and NH4NO3, were partially or fully yielded from neutralizing H2SO4 and HNO3 via NH3 reaction (Tanner et al., 1981; Brost et al., 1988; Quan et al., 2014; Zhao et al., 2013; Zhang et al., 2014). Studies also showed that NH3 improves H2SO4 nucleation by 1–10 times (Benson et al., 2011) and provides enough new particles to alter the number and size distributions. Thus, NH3 and its secondary product play an important role in the formation of air pollution and haze days. Some research has shown that approximately 80 % of total anthropogenic NH3 emissions is derived from agricultural sources and that livestock manure provides more contributions than that of synthetic fertilizers (Kang et al., 2016; Zhou et al., 2016). The Chinese government has taken several control strategies to reduce particle pollution and its precursors; some examples of these systems include catalytic reduction systems in the power sector (Xia et al., 2016) and measures to change coal to gas for residents' life and heating (Ren et al., 2014). Related observations have shown that the mass burden of SO2 and NOx have distinctly decreased in recent years (De Foy et al., 2016; Wang et al., 2015; Zheng et al., 2018). However, no specific measure for the control of agricultural NH3 emission has yet been implemented, and the total agricultural NH3 emission budget was not considerably changed from 2010 to 2017 (Zheng et al., 2018).
In addition, accurate information of agriculture NH3 emission is important for estimating the NH3 mass burden and its environmental effect. Several studies have focused on NH3 emissions from agricultural activities in China or East Asia. The second version of the Regional Emission Inventory in Asia (REAS) has established an anthropogenic emission inventory, which includes the source of agricultural NH3 (fertilizer application and livestock) (Kurokawa et al., 2013). This inventory, which targeted the years 2000–2008, has a 0.25×0.25∘ spatial resolution with monthly variation. MASAGE_NH3 (Magnitude and Seasonality of Agricultural Emissions model for NH3) developed a bottom-up NH3 emission inventory by using the adjoint of the GEOS-Chem chemical transport model (Paulot et al., 2014). The network data for wet deposition fluxes from 2005 to 2008 were inversed to optimize China's NH3 emission in this inventory. Fu et al. (2015) used the Community Multiscale Air Quality (CMAQ) model coupled with an agroecosystem to estimate the NH3 emissions with high spatial and temporal resolution in 2011; the model could obtain hourly emission features through online model calculations. These NH3 emission inventories have provided useful datasets for understanding the distribution features of NH3 mass burden in China. However, with the migration of population, economic growth, and the increase in the consumption of agricultural products, the spatial distribution and strength of agricultural NH3 emission changed remarkably in China during the last decade (Xu et al., 2017); thus, a reliable emission information based on the recent year is also necessary for estimating the NH3 mass burden.
Previous studies have investigated the influence of NH3 emission on aerosol loading in several areas of China. Wu et al. (2008) conducted sensitivity studies to assess the impact of livestock NH3 emissions on the PM2.5 mass concentration in North China by using MM5-CMAQ modeling system. The results showed that livestock NH3 provides >20 % contribution to nitrate and ammonium but provides minimal contribution to sulfate. Wang et al. (2011) used the response surface modeling technique to estimate the contribution of NH3 emission in eastern China and found that the total NH3 emission contributes 8 %–11 % to PM2.5 concentration and that the nonlinear effects are significant during the transition between NH3 rich and poor conditions. Fu et al. (2017) and Zhao et al. (2017) also investigated the impact of NH3 emission on PM2.5 in eastern China and the Hai River Basin. However, related research remains scarce and is mainly focused on the local regions, and most of it generally uses the brute-force sensitivity method to estimate the NH3 impact on the basis of the chemistry model, which reflects the particle concentration change with emission reduction (Koo et al., 2009).
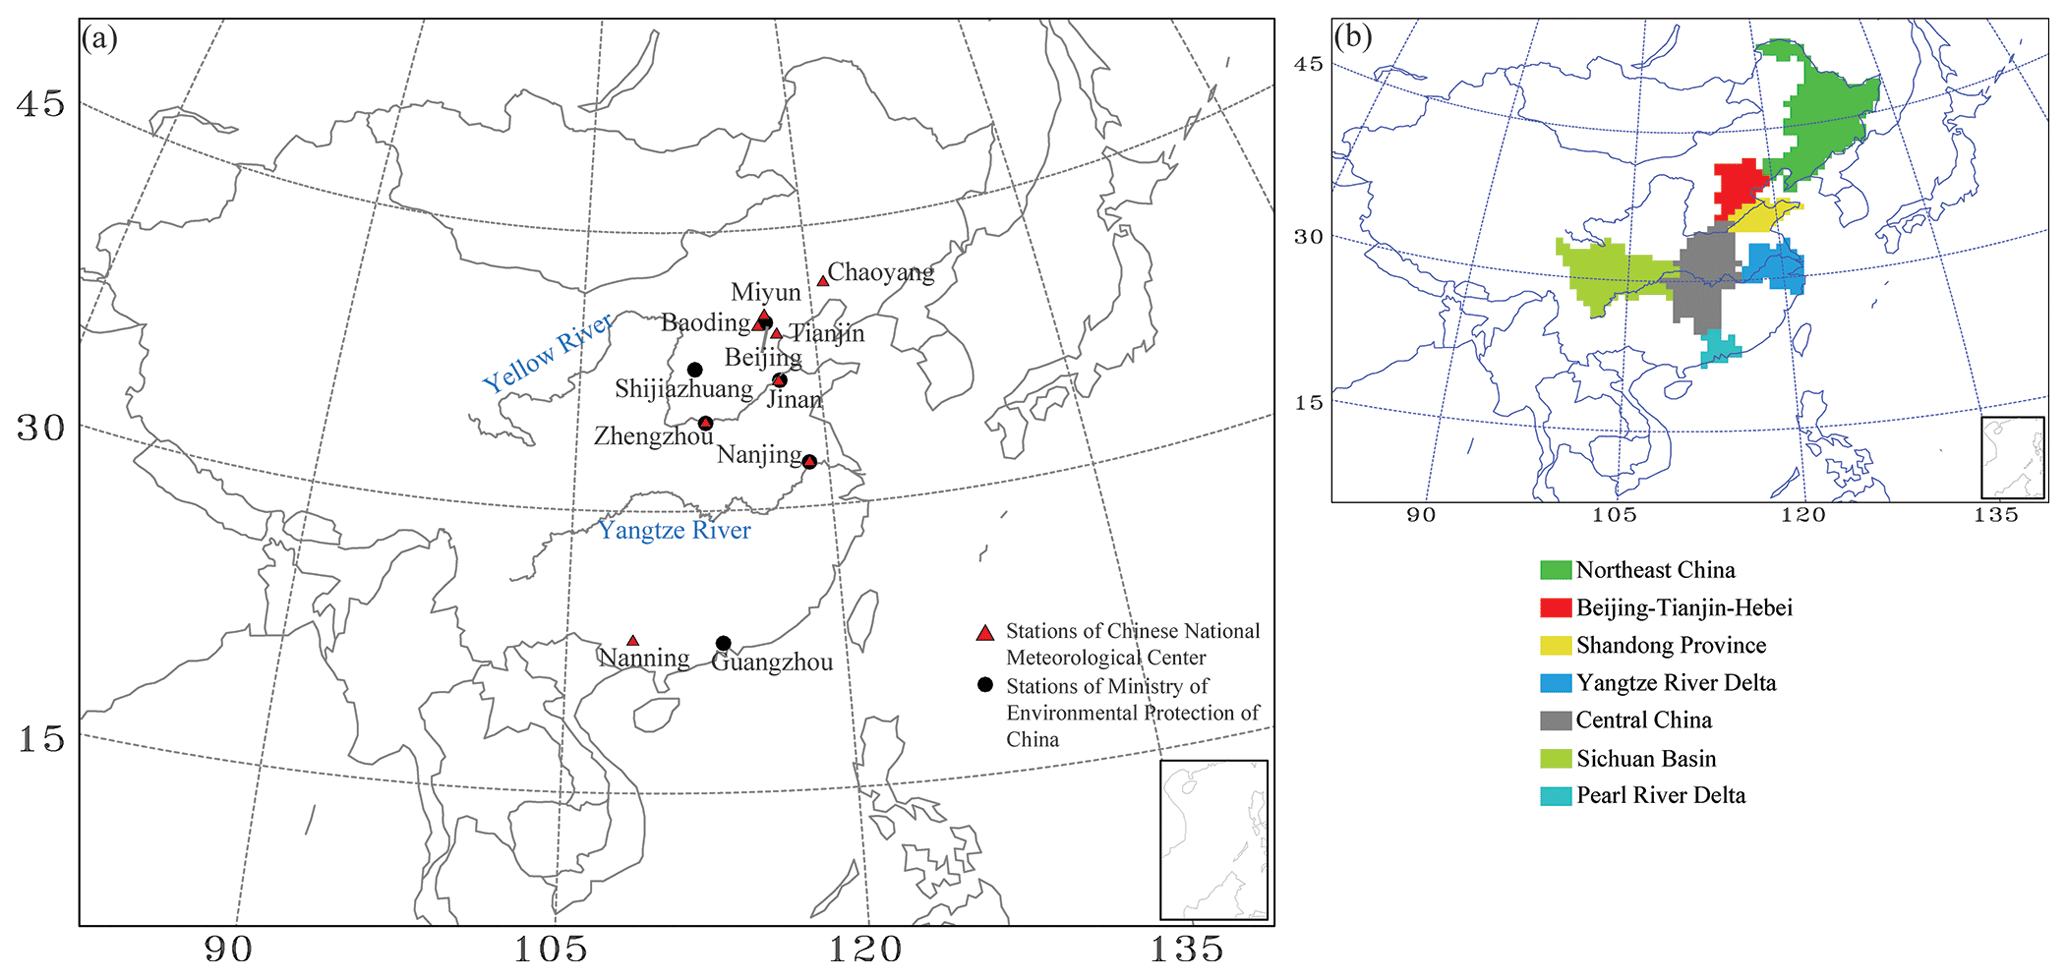
Figure 1Model domain used in this study and the geographic locations of Beijing–Tianjin–Hebei (BTH), Northeast China (NEC), Yangtze River Delta (YRD), Pearl River Delta (PRD), Sichuan Basin (SCB), Central China (CNC), and Shandong Province (SDP). The locations of observation data are also shown in the model domain.
A comprehensive high-resolution NH3 emission inventory PKU-NH3, which is based on the year 2015, is applied in this study to capture the agricultural NH3 mass concentration in China. In addition, the contribution to PM2.5 particle is estimated via the air quality modeling system Regional Atmospheric Modeling System (RAMS)–CMAQ, coupled with the online source tagged module Integrated Source Apportionment Method (ISAM). Compared with previous studies, this high-resolution agricultural NH3 emission inventory is more accurate and reflects the latest spatial and temporal distribution features (Liu et al., 2019). Major trace gases and aerosol species in 2015 are simulated via the modeling system and evaluated using substantial observation data. The contribution to pollutant concentrations can be tagged and quantified by RAMS–CMAQ–ISAM under the current scenario (Wang et al., 2009). Then, several brute-force sensitivity tests are conducted to estimate the effect of reducing agricultural NH3 emission on the PM2.5 mass burden. The results from the source apportionment simulation and brute-force sensitivity tests in January, April, July, and October are presented, and the detailed features of seven major populated areas (as shown in Fig. 1) of China are discussed.
The emission inventory is described as follows: first, the NH3 emission data in China were provided by the PKU-NH3 emission inventory (Kang et al., 2016; L. Zhang et al., 2018). This inventory was developed on the basis of previous studies (Huang et al., 2012) and improved horizontal resolution and accuracy. It was compiled on 1 km × 1 km horizontal resolution with monthly statistical data in 2015. One of the most uncertain parameters of the emission factors applied in this inventory was enhanced by considering as many native experiment results as possible with ambient temperature, soil acidity, and other factors of change. In addition, this inventory not only includes the fertilizer and husbandry emissions from agricultural activities but also collects the emission data of farmland ecosystems, livestock waste, biomass burning (forest and grassland fires, crop residue burning, and fuel wood combustion), and other sources (excrement waste from rural populations, the chemical industry, waste disposal, NH3 escape from thermal power plants, and traffic sources). Second, the anthropogenic emission of primary aerosols and the precursors were obtained from the MIX Asian emission inventory (base year 2012) prepared by the Model Inter-Comparison Study for Asia (MICS-ASIA III) (Lu et al., 2011; Lei et al., 2011). The anthropogenic emission sources of SO2, NOx, volatile organic compounds (VOCs), black carbon, organic carbon, primary PM2.5, and PM10 were obtained from the monthly MIX inventory with 0.25∘ × 0.25∘ spatial resolution. The REAS version 2 (Kurokawa et al., 2013) and Global Fire Emissions Database version 3 (van der Werf et al., 2010) were used to provide data on VOCs, nitrogen oxides from flight exhaust, lighting, paint, wildfires, savanna burning, and slash-and-burn agriculture.
The modeling system RAMS–CMAQ was applied to simulate the transformation and transport of pollutants in the atmosphere. The CMAQ (version 5.0.2) released by the US Environmental Protection Agency (Eder et al., 2009; Mathur et al., 2008) was the major component of the RAMS–CMAQ modeling system. In this model, the CB05 (version CB05tucl) chemical mechanism (Whitten, 2010) was used to treat the gas-phase chemical mechanism. The simulation of O3 in urban plumes, which could impact the NOx chemical transformation and fine particle mass predictions, was updated in this version to obtain reasonable results. The sixth-generation model CMAQ aerosol model (AERO6), which added nine new PM2.5 species and updated the SOA yield parametrization and primary organic aerosol aging processes, was used to simulate the formation and dynamic processes of aerosols. The ISORROPIA model (version 2.1) (Fountoukis and Nenes, 2007) was used to describe the thermodynamic equilibrium of gas–particle transformation. The highly versatile numerical model RAMS, which can capture the boundary layer and the underlying surface well, was applied to provide the meteorological fields for CMAQ (Cotton et al., 2003). The European Centre for Medium-Range Weather Forecasts reanalysis datasets (1∘ × 1∘ spatial resolution) were used to supply the background fields and sea surface temperatures. The model domain (Fig. 1) is 6654 km × 5440 km with 64 km2 fixed grid cells and uses a rotated polar stereographic map projection, which covers the entire mainland of China and its surrounding regions. The model has 15 vertical layers, and half of them are located in the lowest 2 km to provide a precise simulation of the atmospheric boundary layer.
The ISAM is a flexible and efficient online source apportionment implementation that was used to track multiple pollutants emitted from different geographic regions and source types. Compared with its previous version (i.e., tagged species source apportionment), the processes of tracking tagged tracer transport and precursor reaction were optimized to balance the computational requirements and reliable representation of physical and chemical evolution. To reduce the nonlinear effect during phase transformation and relative chemical interactions, a stand-alone subroutine “wrapper” approach was applied in ISAM to apportion the secondary PM species and their precursor gases during the thermodynamic equilibrium simulation; a hybrid approach, which uses LU decomposition triangular matrices (Yang et al., 1997), was developed for describing gas-phase chemical interactions. In this study, ISAM was coupled into RAMS–CMAQ and set to trace the transport and chemical reactions of NH3 from the fertilizer and husbandry emission sectors and quantitatively estimate the contribution of agriculture NH3 emission to the PM2.5 mass concentration in China.
To evaluate the performance of the model, substantial observation data are used for comparison with the simulation results. Meteorological factors are important to capture the formation processes and transport of secondary aerosols. Thus, in this study, the observed meteorological data from surface stations of the Chinese National Meteorological Center were collected to evaluate the performance of the model. Detailed information is provided in Appendix A. Furthermore, the observed SO2, NO2, and PM2.5 released from the Ministry of Environmental Protection of China were applied to evaluate the modeled mass concentration of these pollutants. The hourly observation data in January, April, July, and October at six stations located in Beijing, Jinan, Shijiazhuang, Nanjing, Guangzhou, and Zhengzhou were collected in this study. The scatterplots of comparison are shown in Fig. 2, and the statistical parameters between the observations and simulations are listed in Tables 1–3. Most of the scatter points broadly gather around the 1 : 1 solid line. Most of the correlation coefficients in Tables 1–3 are higher than 0.5, indicating that the model can capture the regional variation features of measurements. The standard deviations between the observed and simulated results are similar in most cases as well. The simulation results performed better in winter compared with those in summer because the diffusion condition was strong and the mass concentration changed noticeably during summer. The modeled PM2.5 generally performed well due to relatively high correlation coefficients. The evident deviation of the modeled mean, which was higher than that of the observation, was between the observed and modeled SO2. The emission of SO2 reduced rapidly because of the control measures from 2013 in China. However, the emission inventory may not reflect this feature and may slightly overestimate the mass burden.
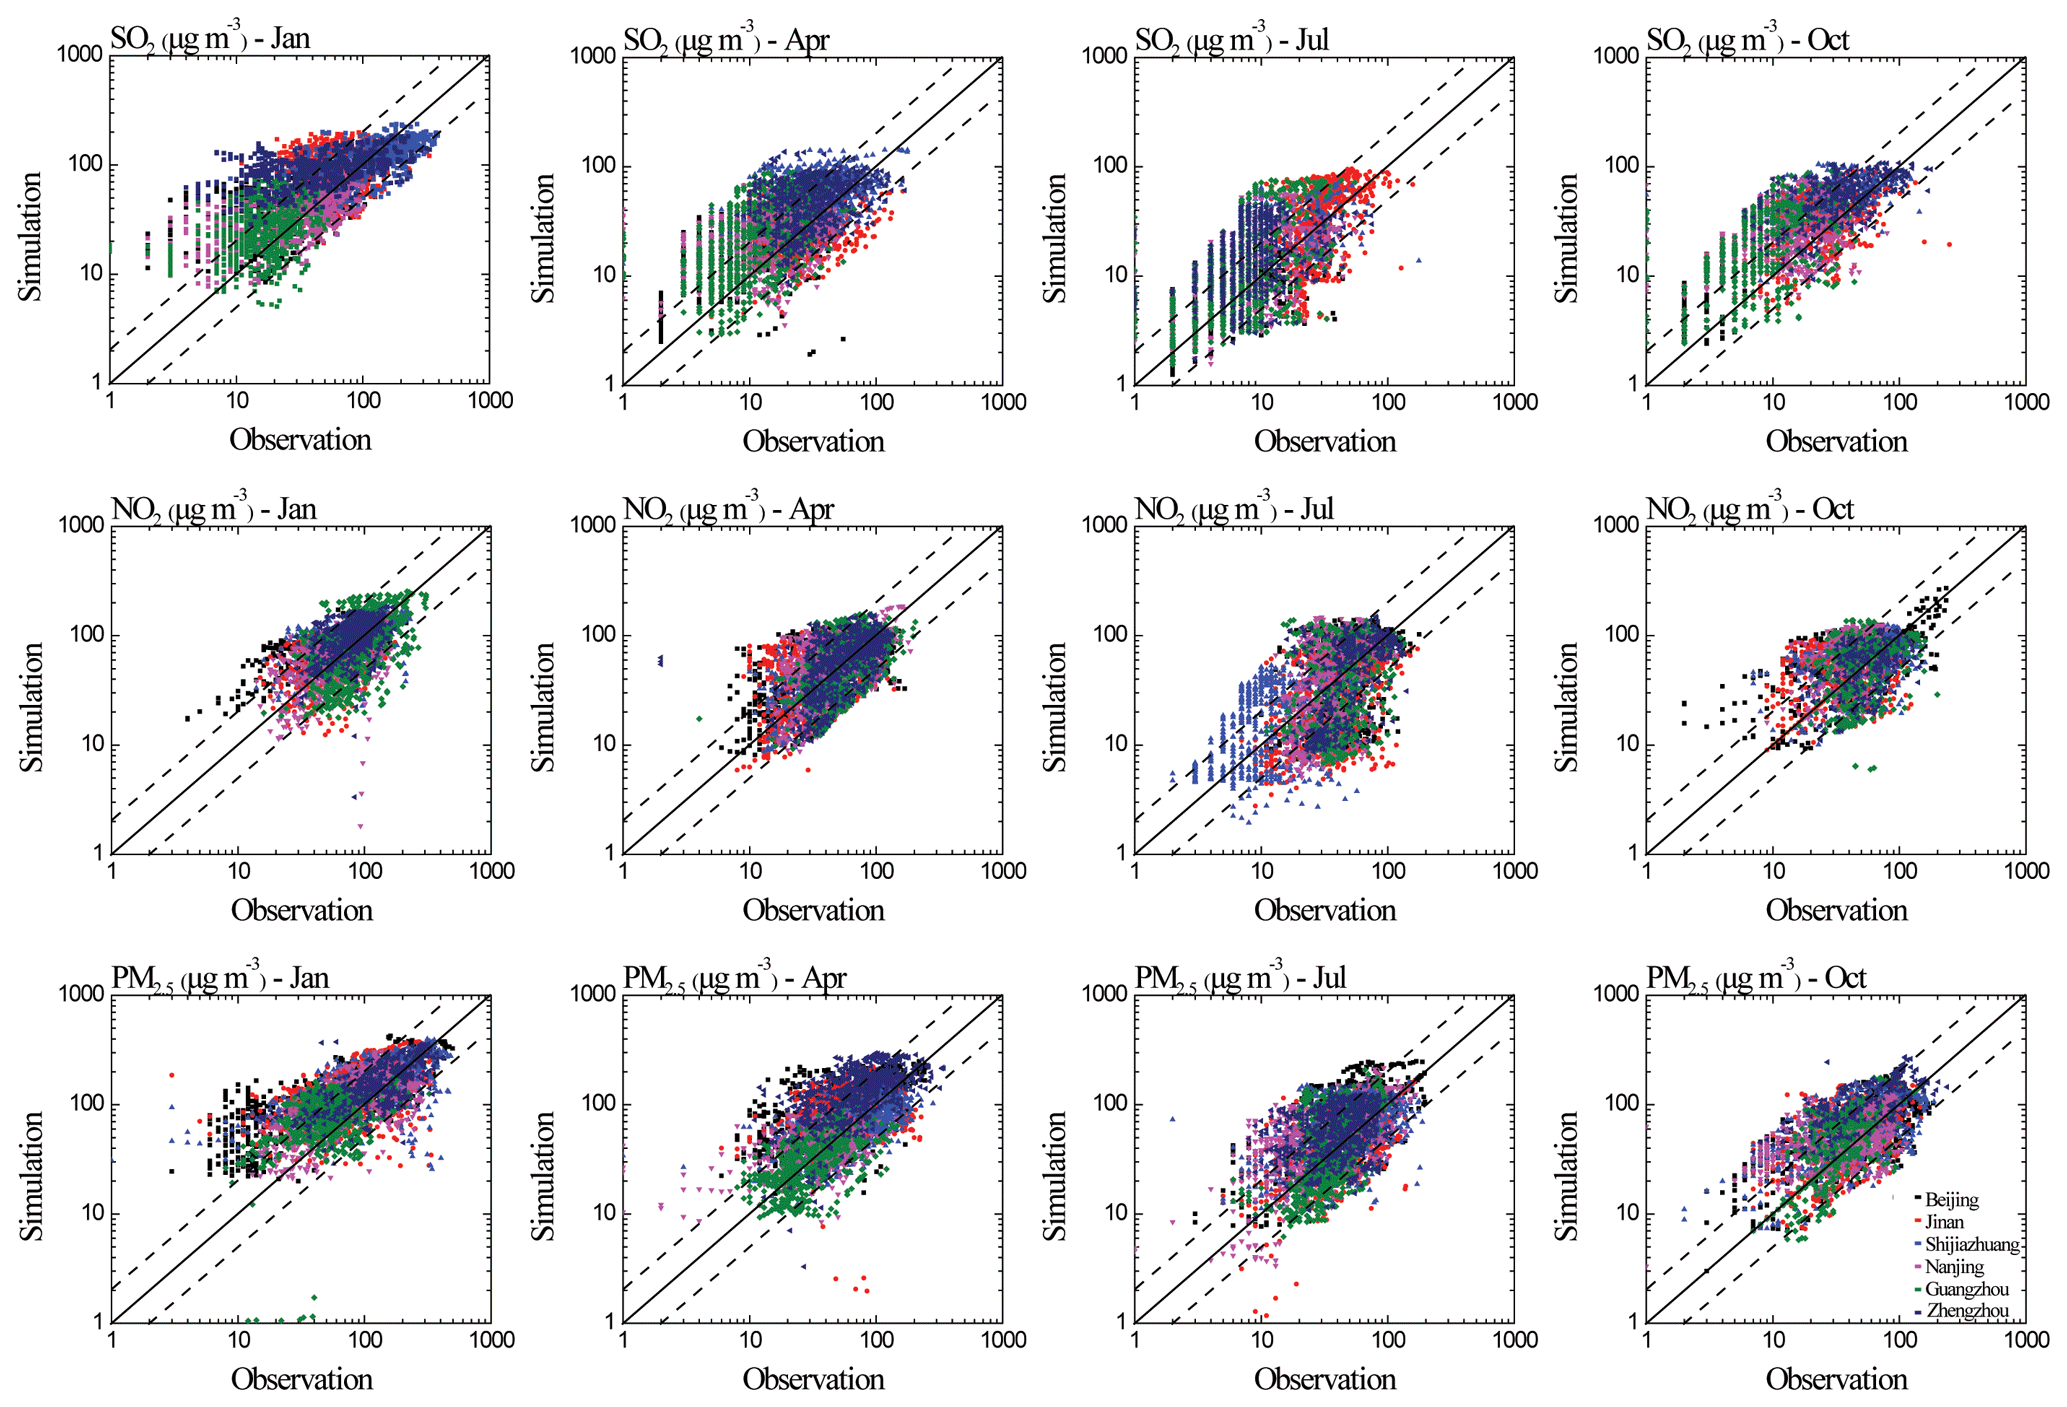
Figure 2The scatterplots between the modeled and the observed hourly SO2, NO2, and PM2.5 in January, April, July, and October 2015. The solid lines are 1 : 1, and the dashed lines are 2 : 1 or 1 : 2.
Table 1Statistical summary of the comparisons of the monthly average PM2.5 between simulation and observation.
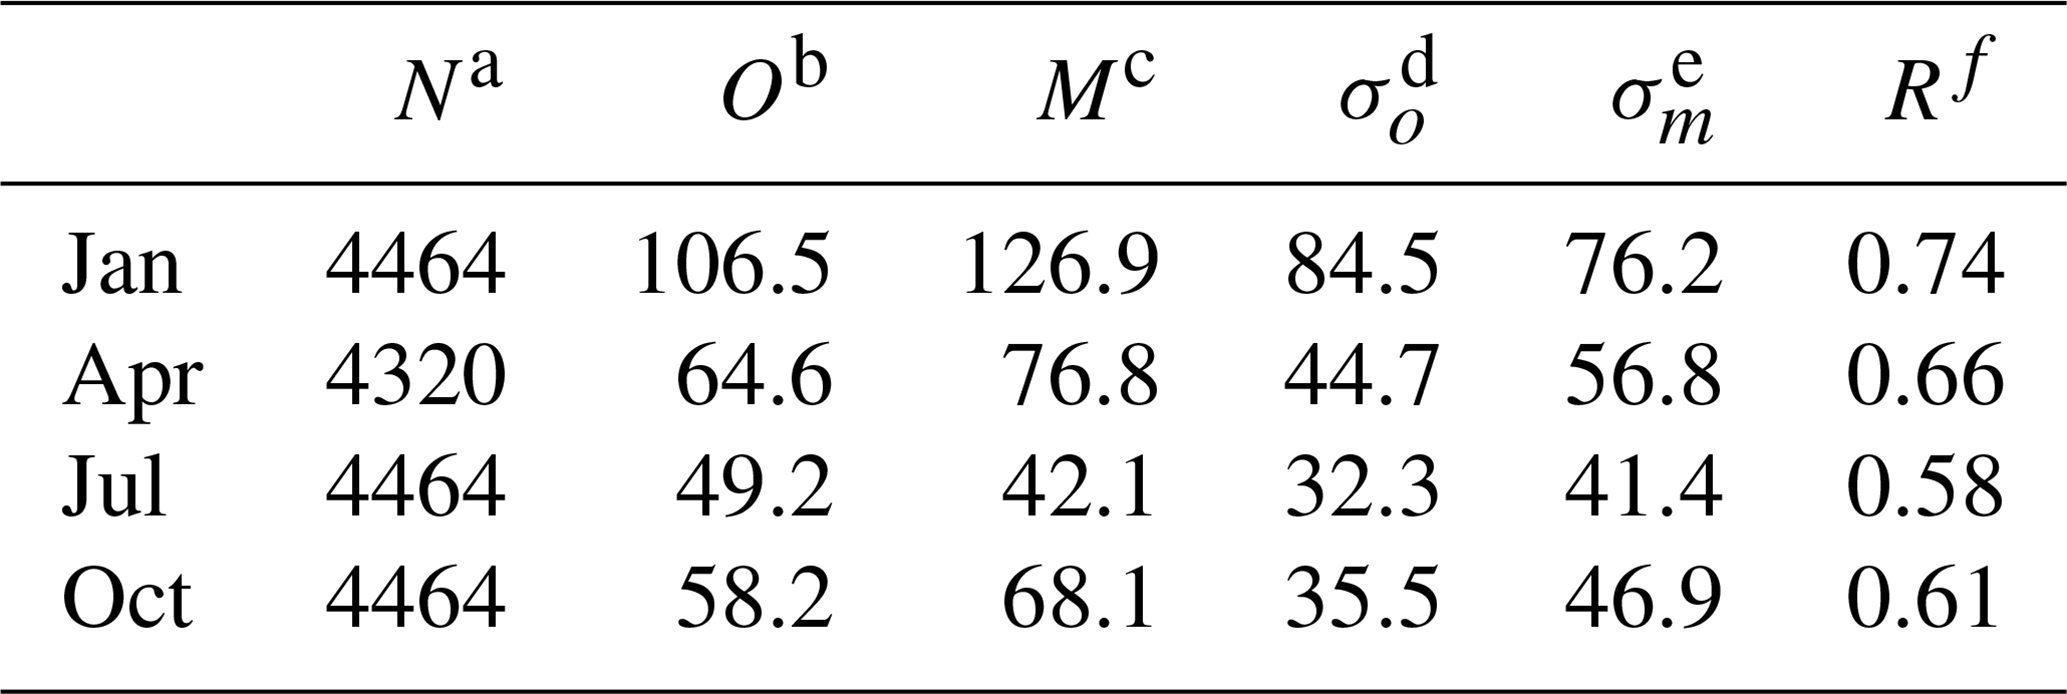
a Number of samples. b Total mean of observation. c Total mean of simulation. d Standard deviation of observation. e Standard deviation of simulation. f Correlation coefficient between daily observation and simulation.
Table 2Statistical summary of the comparisons of the monthly average NO2 between simulation and observation.
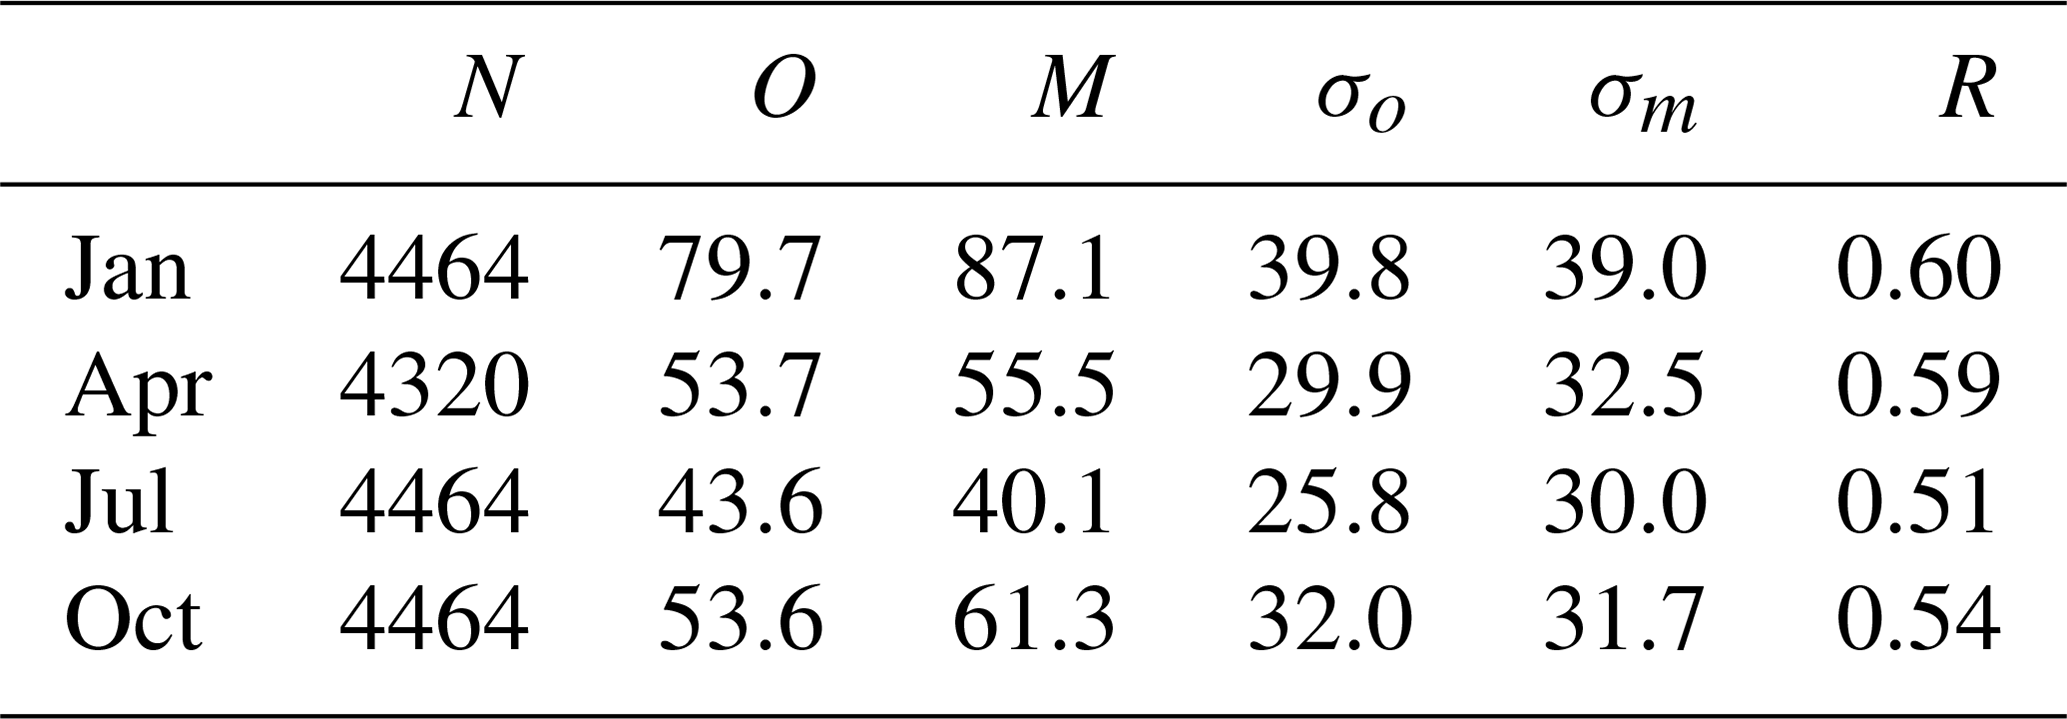
Table 3Statistical summary of the comparisons of the monthly average SO2 between simulation and observation.
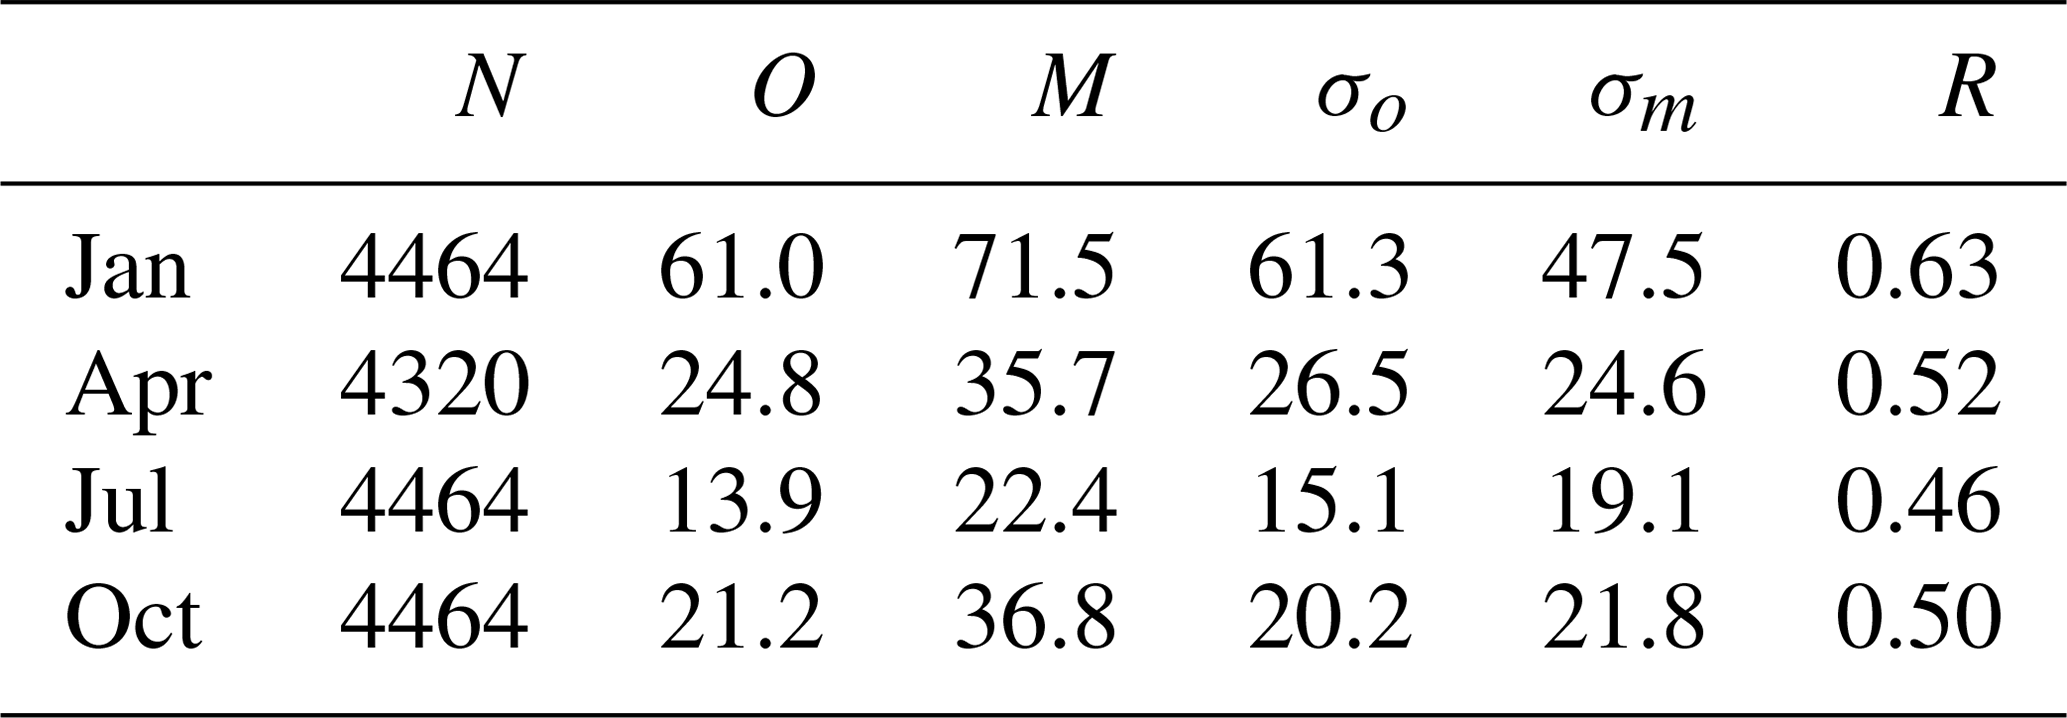
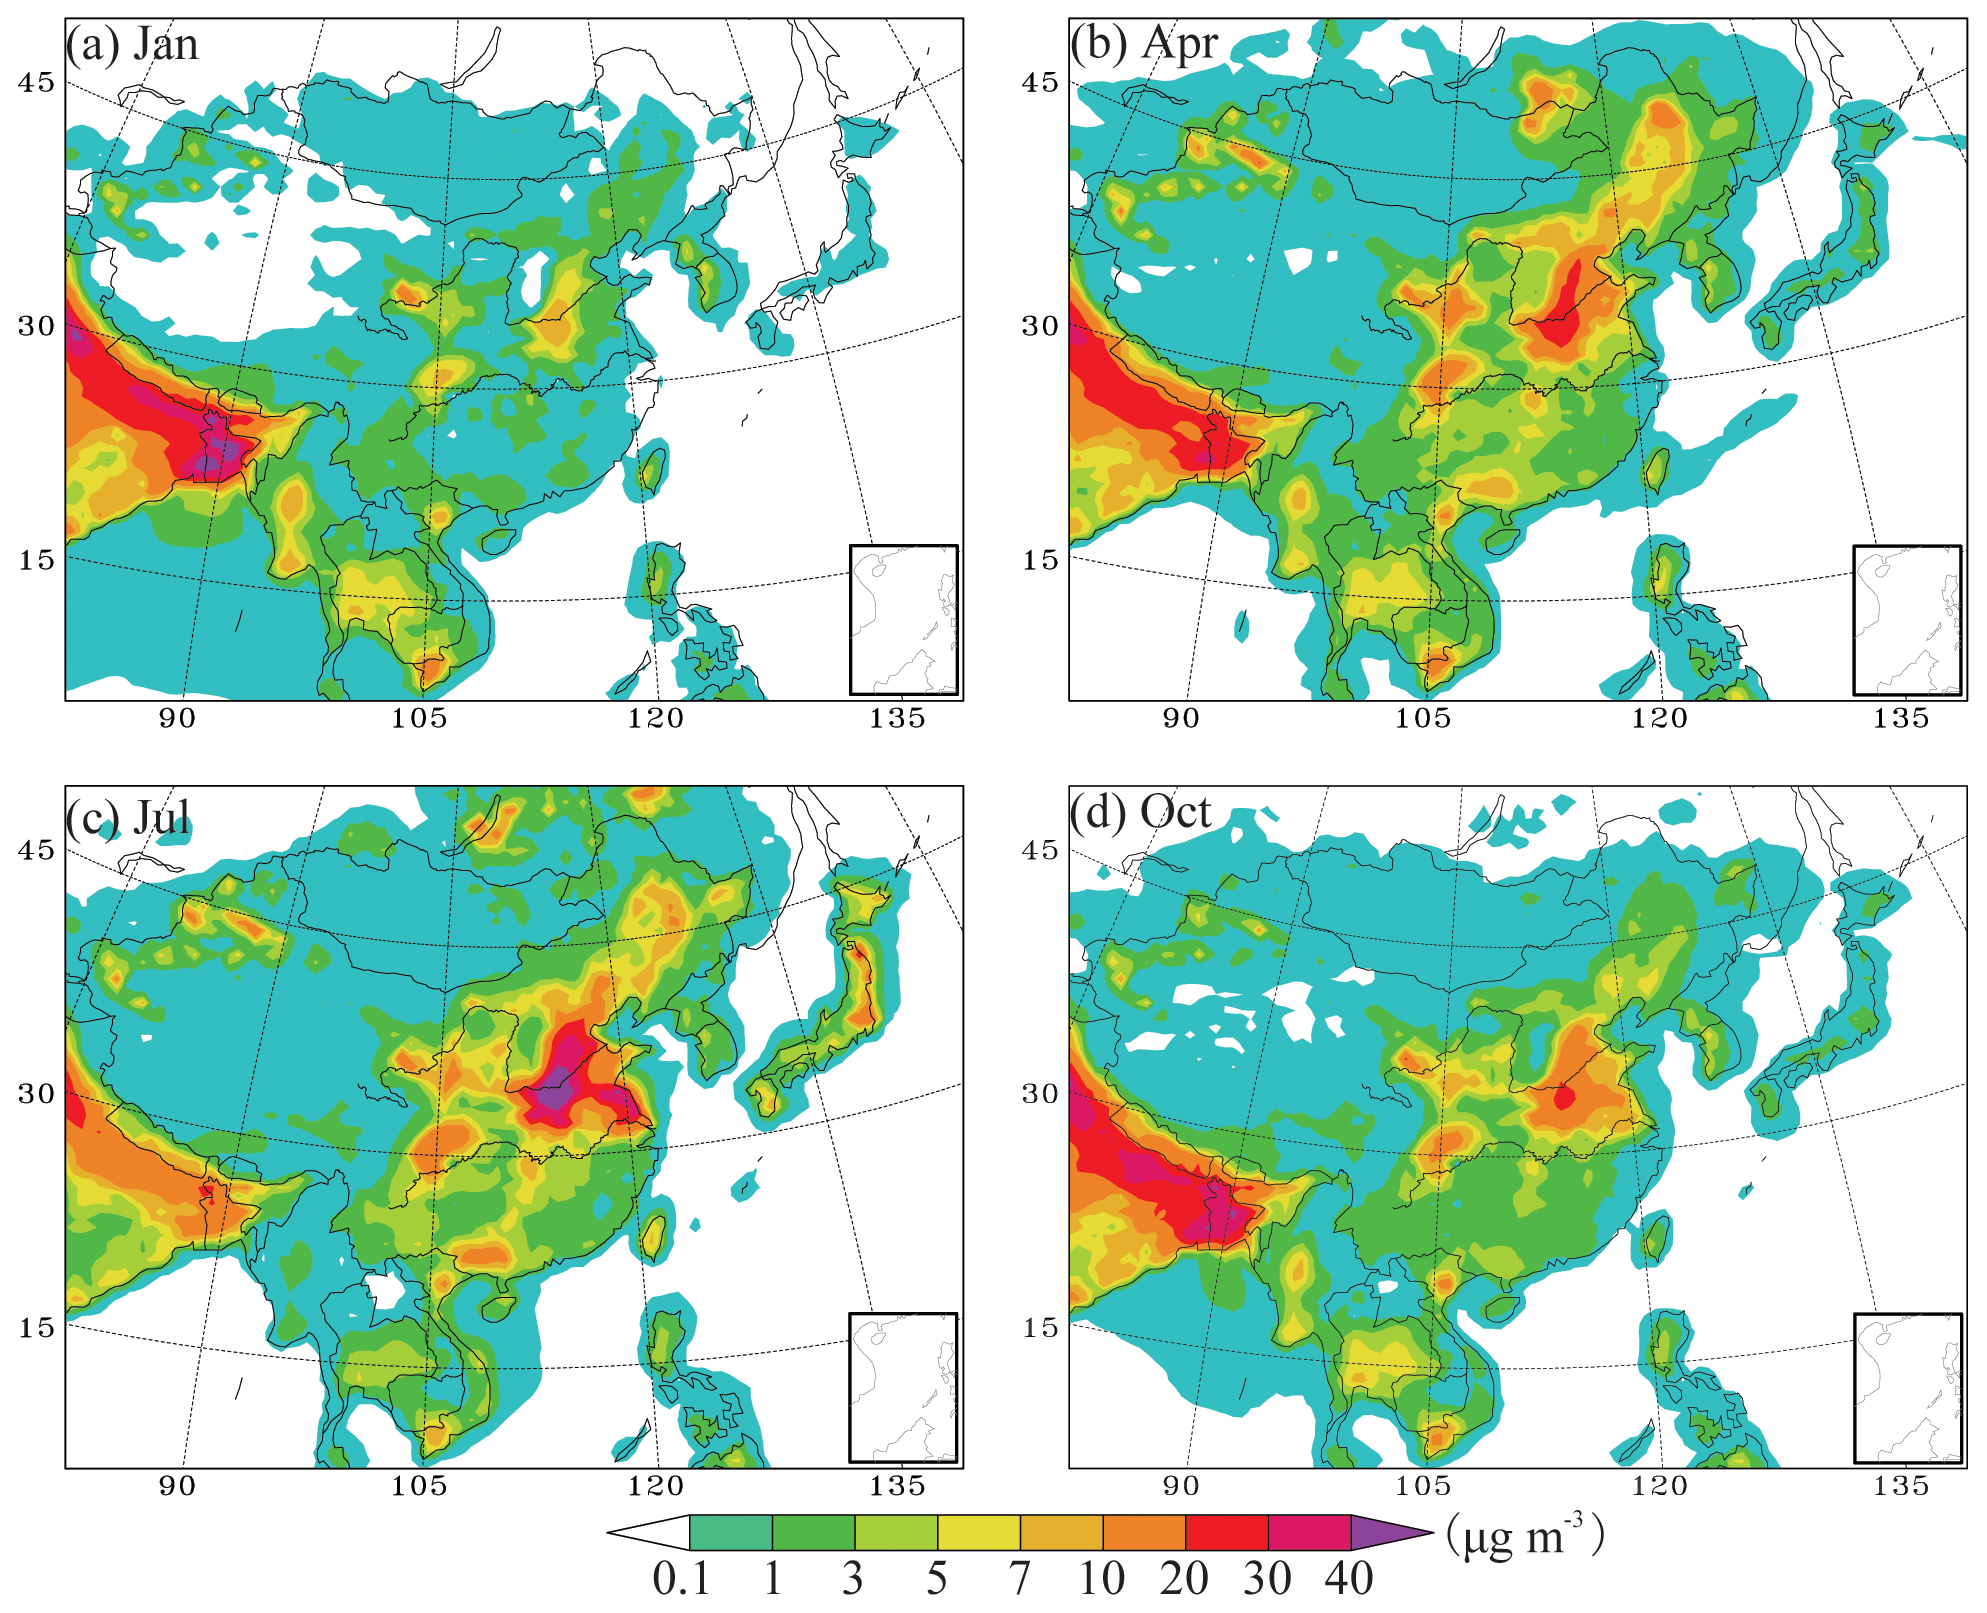
Figure 3The horizontal distributions of the modeled monthly NH3 mass concentration in January, April, July, and October in 2015.
The horizontal distributions of the modeled monthly NH3 mass concentration in January, April, July, and October in 2015 are shown in Fig. 3. Pan et al. (2018) provided the distributions of satellite NH3 total column distribution and the surface NH3 concentrations at several observation sites in Fig. 1 of their paper. Their results showed that the highest mass burden is concentrated in the North China Plain (NCP), Central China (CNC), Yangtze River Delta (YRD), and Sichuan Basin (SCB). The simulation results in this study broadly reflect these distribution features. The values of NH3 concentrations in these regions could reach 10–25 µg m3 in Pan et al. (2018); these results coincided well with the simulation results. However, some considerable deviation appeared in areas of the eastern part of Gansu Province. In this study, the modeled NH3 in these regions was slightly higher than those of the observations in Pan et al. (2018). L. Zhang et al. (2018) also presented the NH3 mass concentration in four seasons over China through simulation (horizontal distribution) and ground-based measurements (point values) in Fig. 9 of their paper. In addition to the regions maintained in Pan et al. (2018), the high mass burden of NH3 also appeared in Northeast China (NEC), as shown by the simulation and observation results in K. Zhang et al. (2018). Generally, this distribution feature should be reasonable because the Three River Plain located in NEC is an important agricultural base in China, and the NH3 emission in this region can be strong during spring and summer. The simulation results in this study also followed the seasonal variation feature of NH3 mass burden, as shown in L. Zhang et al. (2018); the feature was higher in summer and lower in winter, and the magnitudes were also close to each other. Thus, the modeled NH3 concentration measured by RAMS–CMAQ is reliable and can be applied for the analysis in this study.
The horizontal distributions of modeled monthly PM2.5 mass concentrations in January, April, July, and October in 2015 and the surface wind field are shown in Fig. 4. Over the eastern part of China, the heavy PM2.5 pollution happened in January, and the relatively high air quality appeared in July. The large PM2.5 mass burden exceeded 200 µg m3 in January and was mainly concentrated in the NCP, the Yangtze River Valley of CNC, and SCB; these observations broadly coincided with the regions covered by a high mass burden of NH3, as shown in Fig. 3. The wind speed in the regions mentioned above was relatively weak, implying that the diffusion condition was poor and that more aerosols can be trapped in these regions. In addition, the PM2.5 mass burden (50–150 µg m−3) in July was lower than that of other months. Considering that NH3 emission is mainly concerned with secondary inorganic aerosols (SNAs), such as sulfate, nitrate, and ammonium formation, the analysis hereafter mainly focuses on SNA. Figure 5 presents the modeled monthly SNA mass concentration in January, April, July, and October in 2015. The mass loading of SNA generally provided 40 %–60 % of the total PM2.5 in the eastern part of China; this result is comparable with previous studies (Cao et al., 2017; Chen et al., 2016; Lai et al., 2016; H. Wang et al., 2016). The distribution pattern and seasonal variation of SNA also followed the features of PM2.5, and the high mass concentration of SNA could exceed 100 µg m−3 in January.
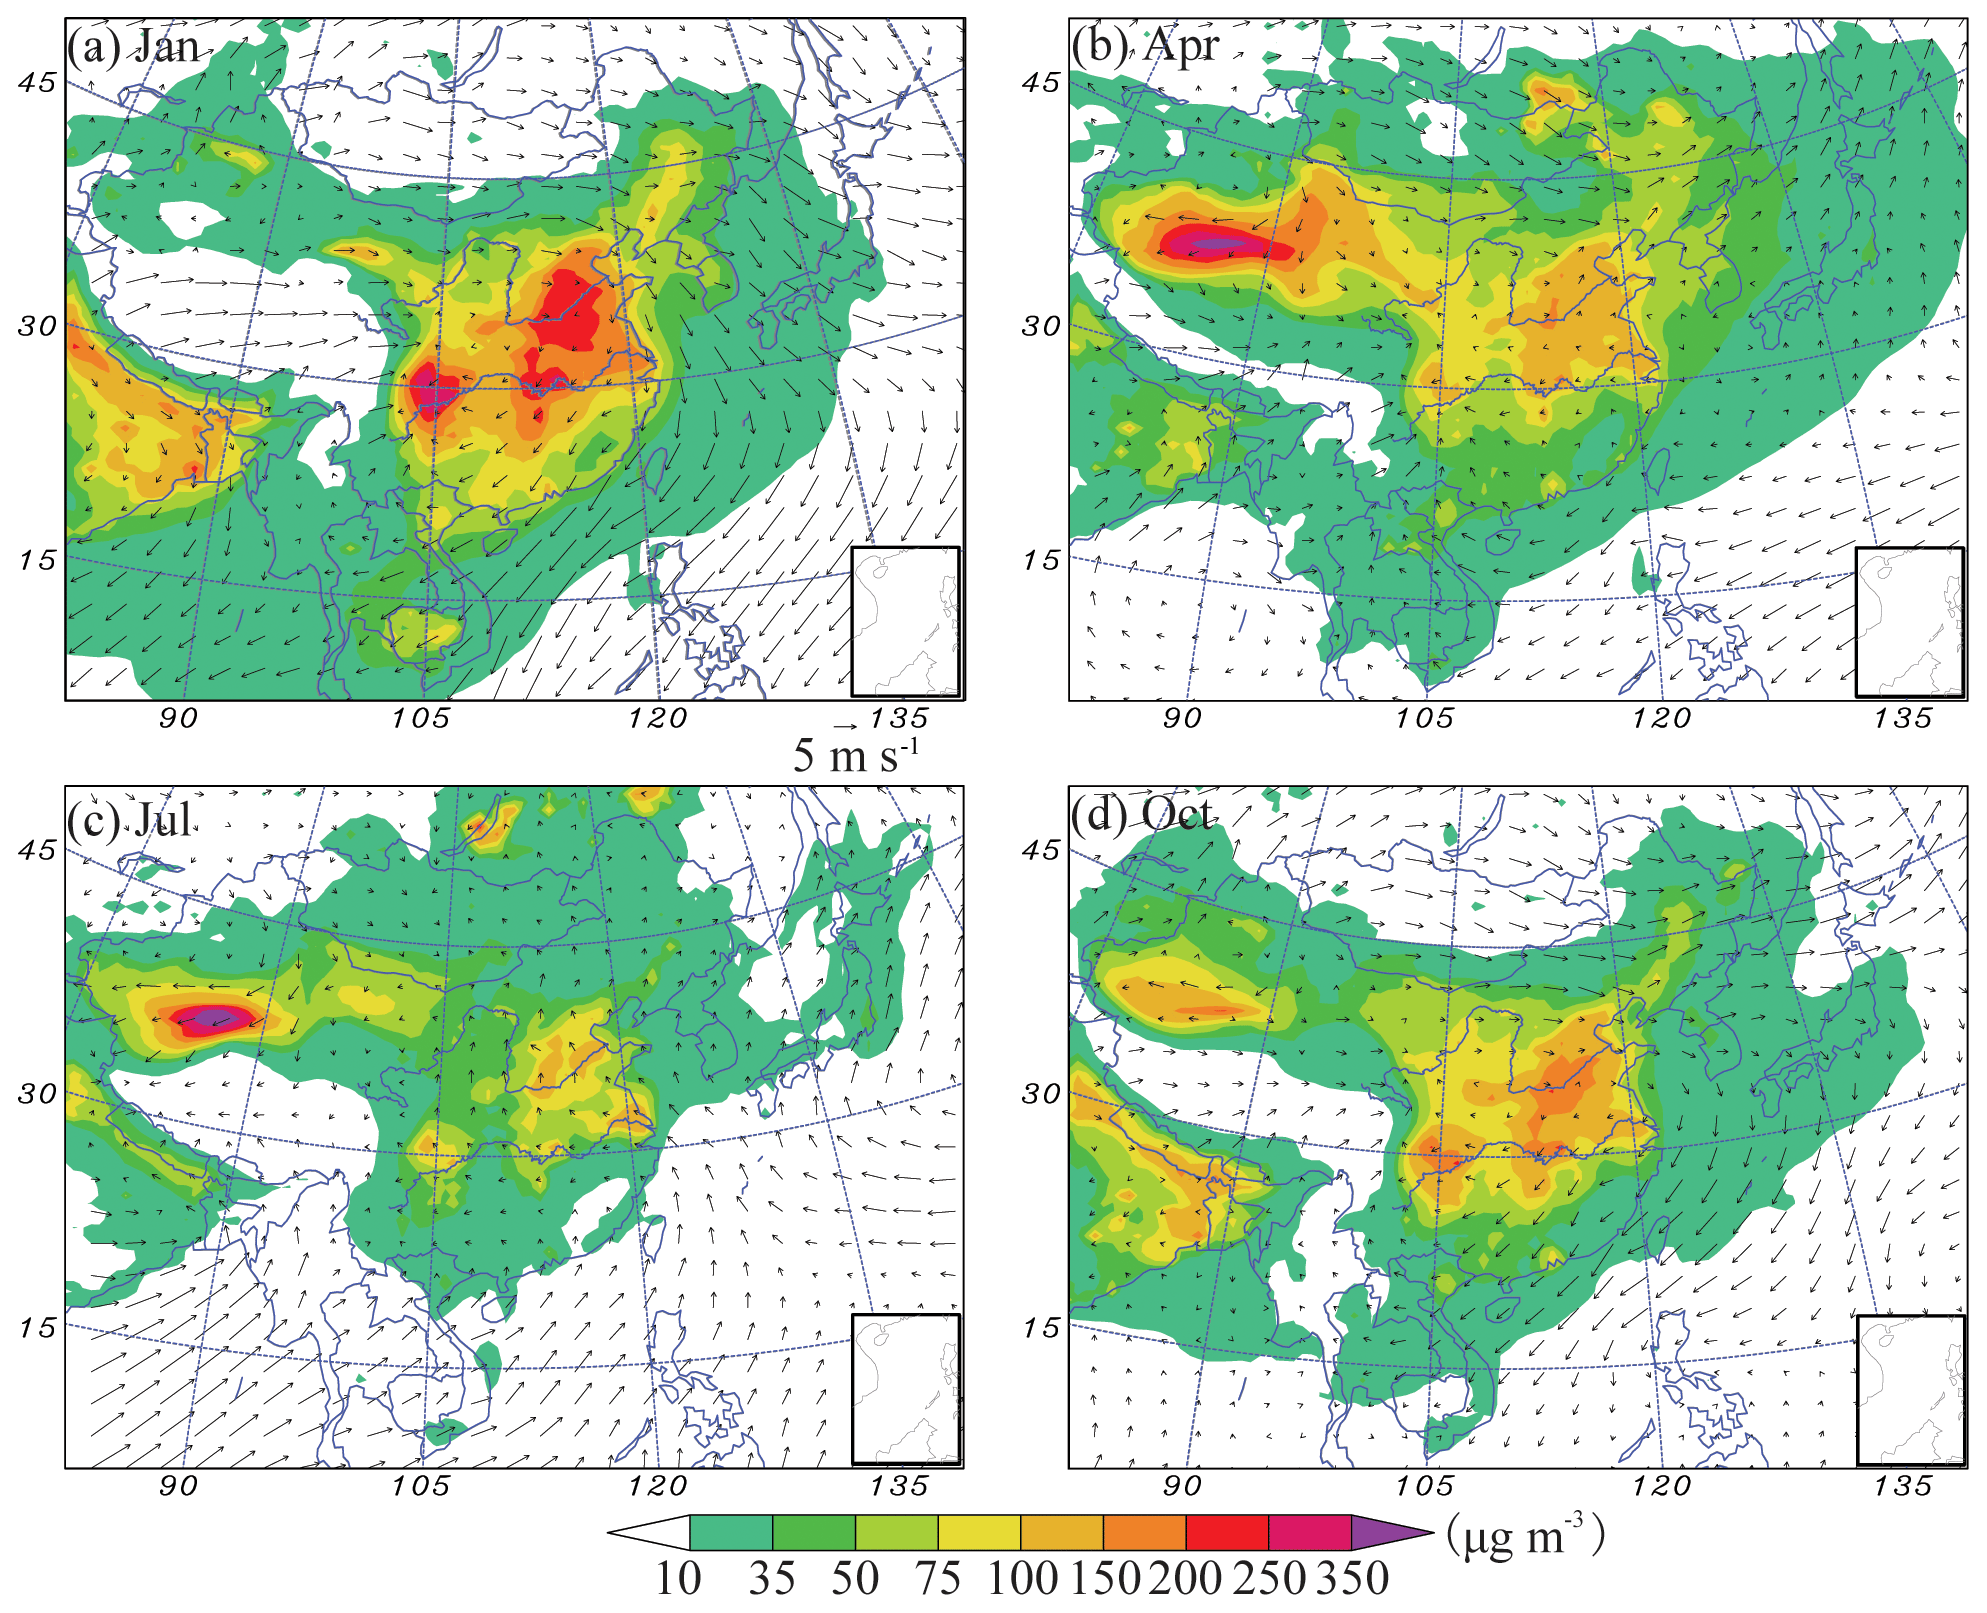
Figure 4The horizontal distributions of the modeled monthly PM2.5 mass concentration in January, April, July, and October in 2015. Also shown are the surface wind fields.
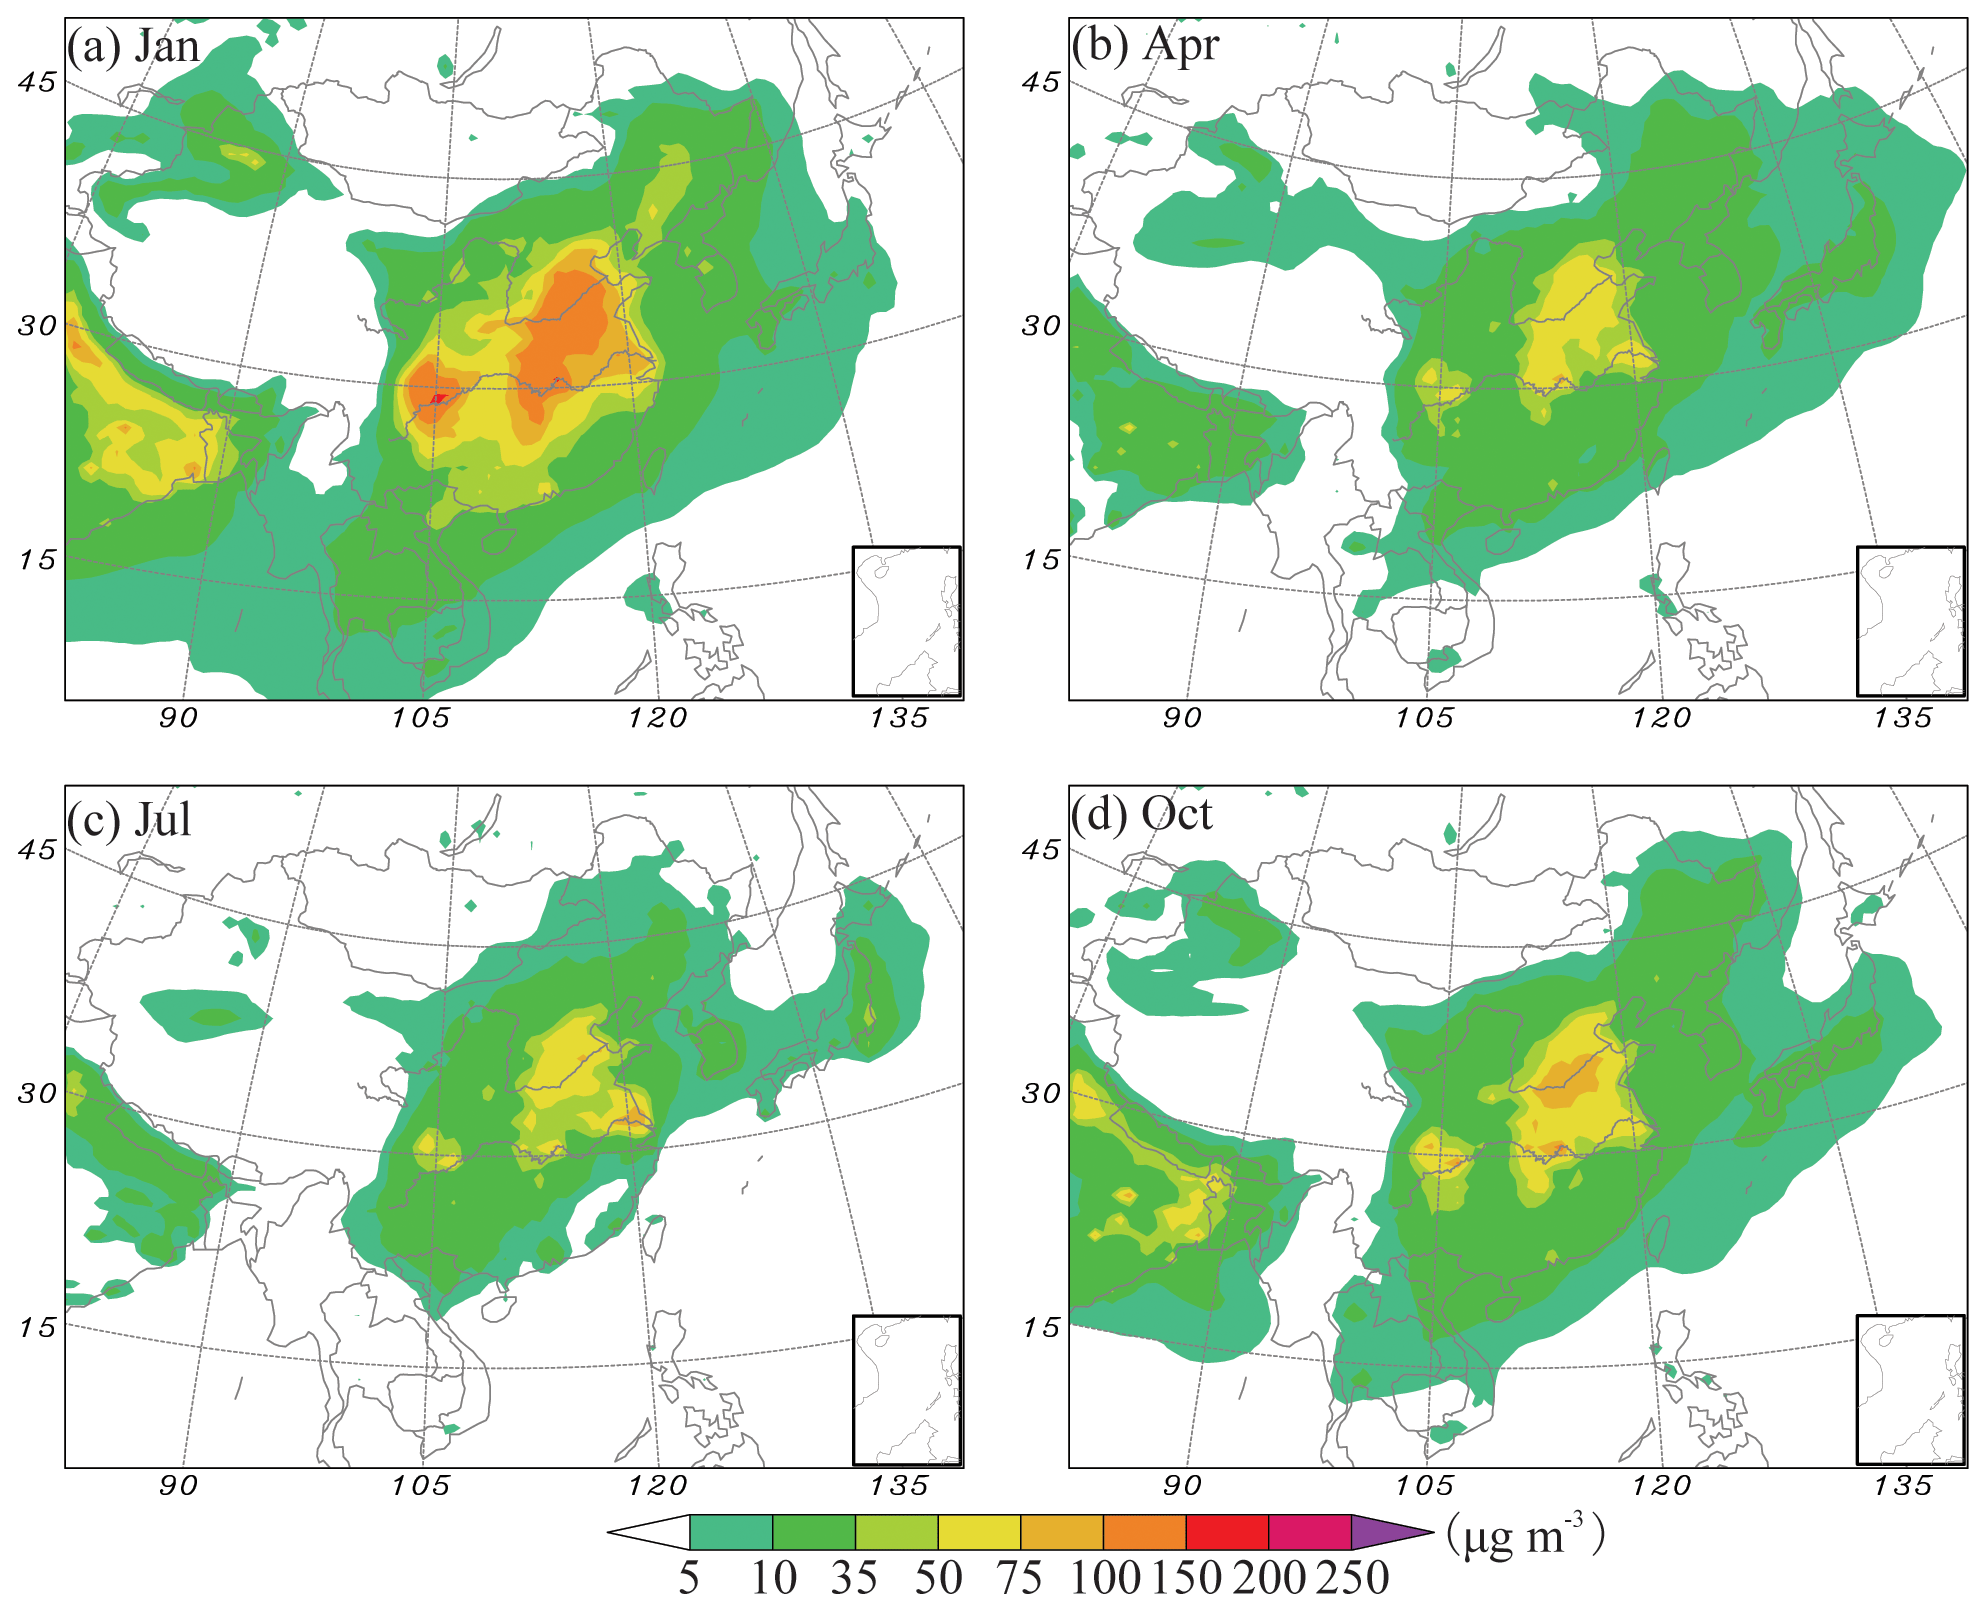
Figure 5The horizontal distributions of the modeled monthly SNA mass concentration in January, April, July, and October in 2015.
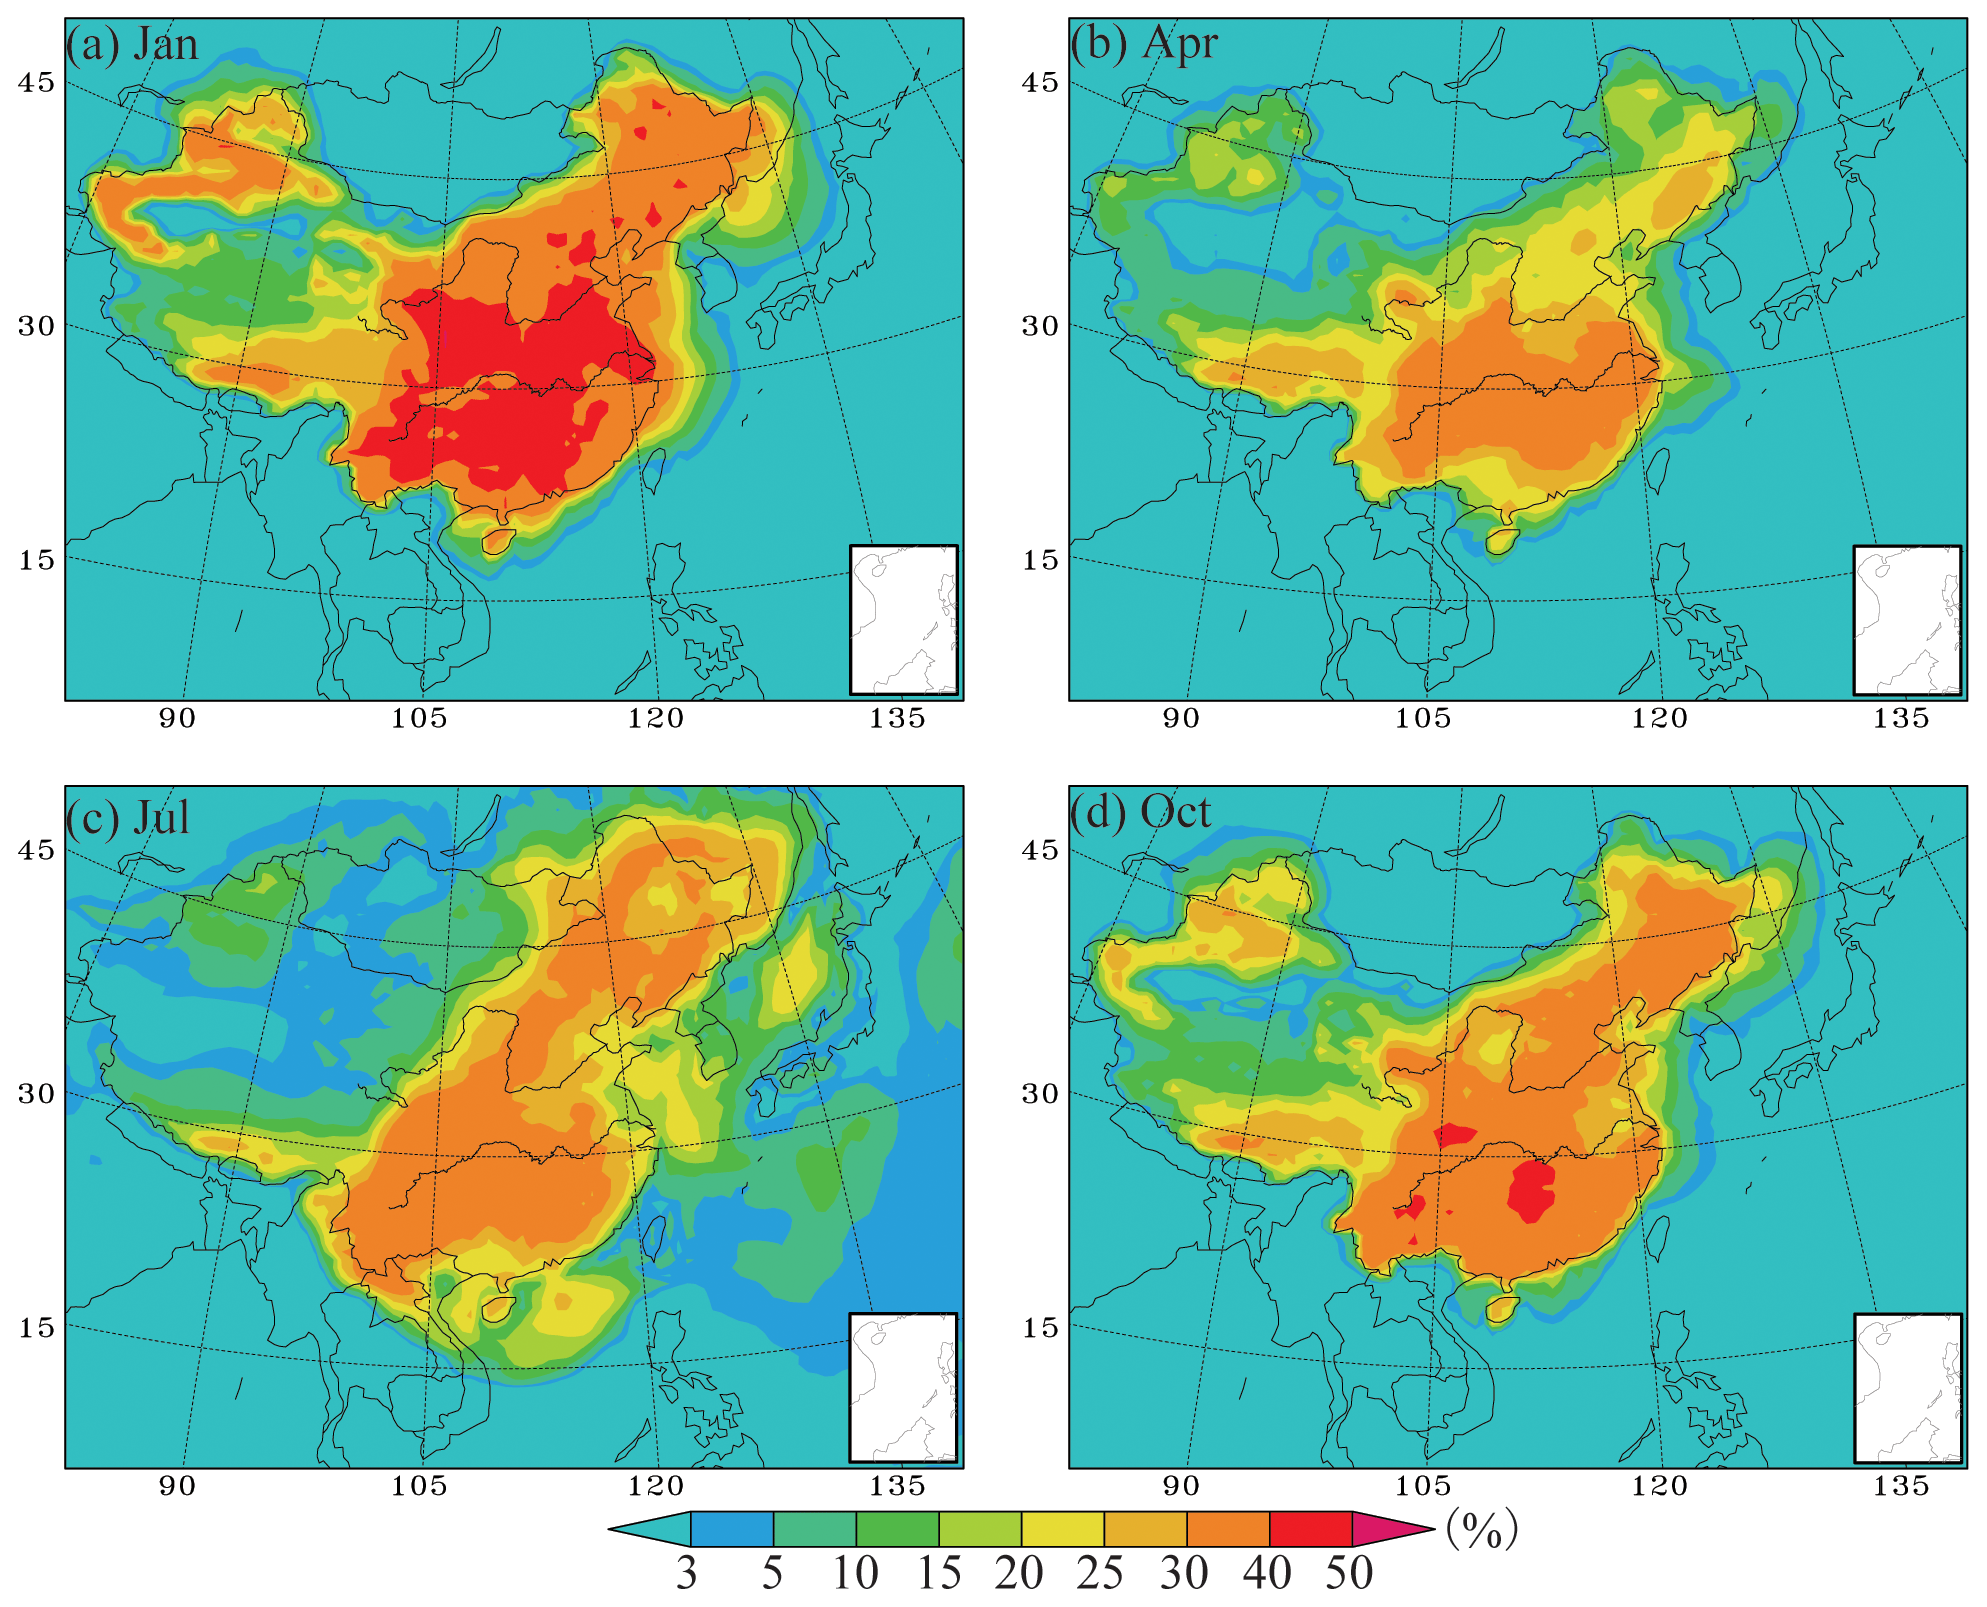
Figure 6The horizontal distributions of the contribution percentage of NH3 emissions to SNA mass concentration (%) in January, April, July, and October.
Then, the contributions of NH3 from multiple agricultural emissions (including fertilizer, husbandry, farmland ecosystems, livestock waste, crop residue burning, and excrement waste from rural populations) to aerosols were calculated using RAMS–CMAQ–ISAM; the monthly average contribution percentage of total agricultural activities (Tagr) in January, April, July, and October is shown in Fig. 6. Generally, the Tagr NH3 provided 30 %–50 % contribution to SNA in January and October and 20 %–40 % contribution in April and July over most parts of eastern China. The relatively low value mainly appeared in April.
Table 4The regional percent (%) of Tagr NH3 contribution to sulfate, nitrate, ammonium, and SNA mass concentration.
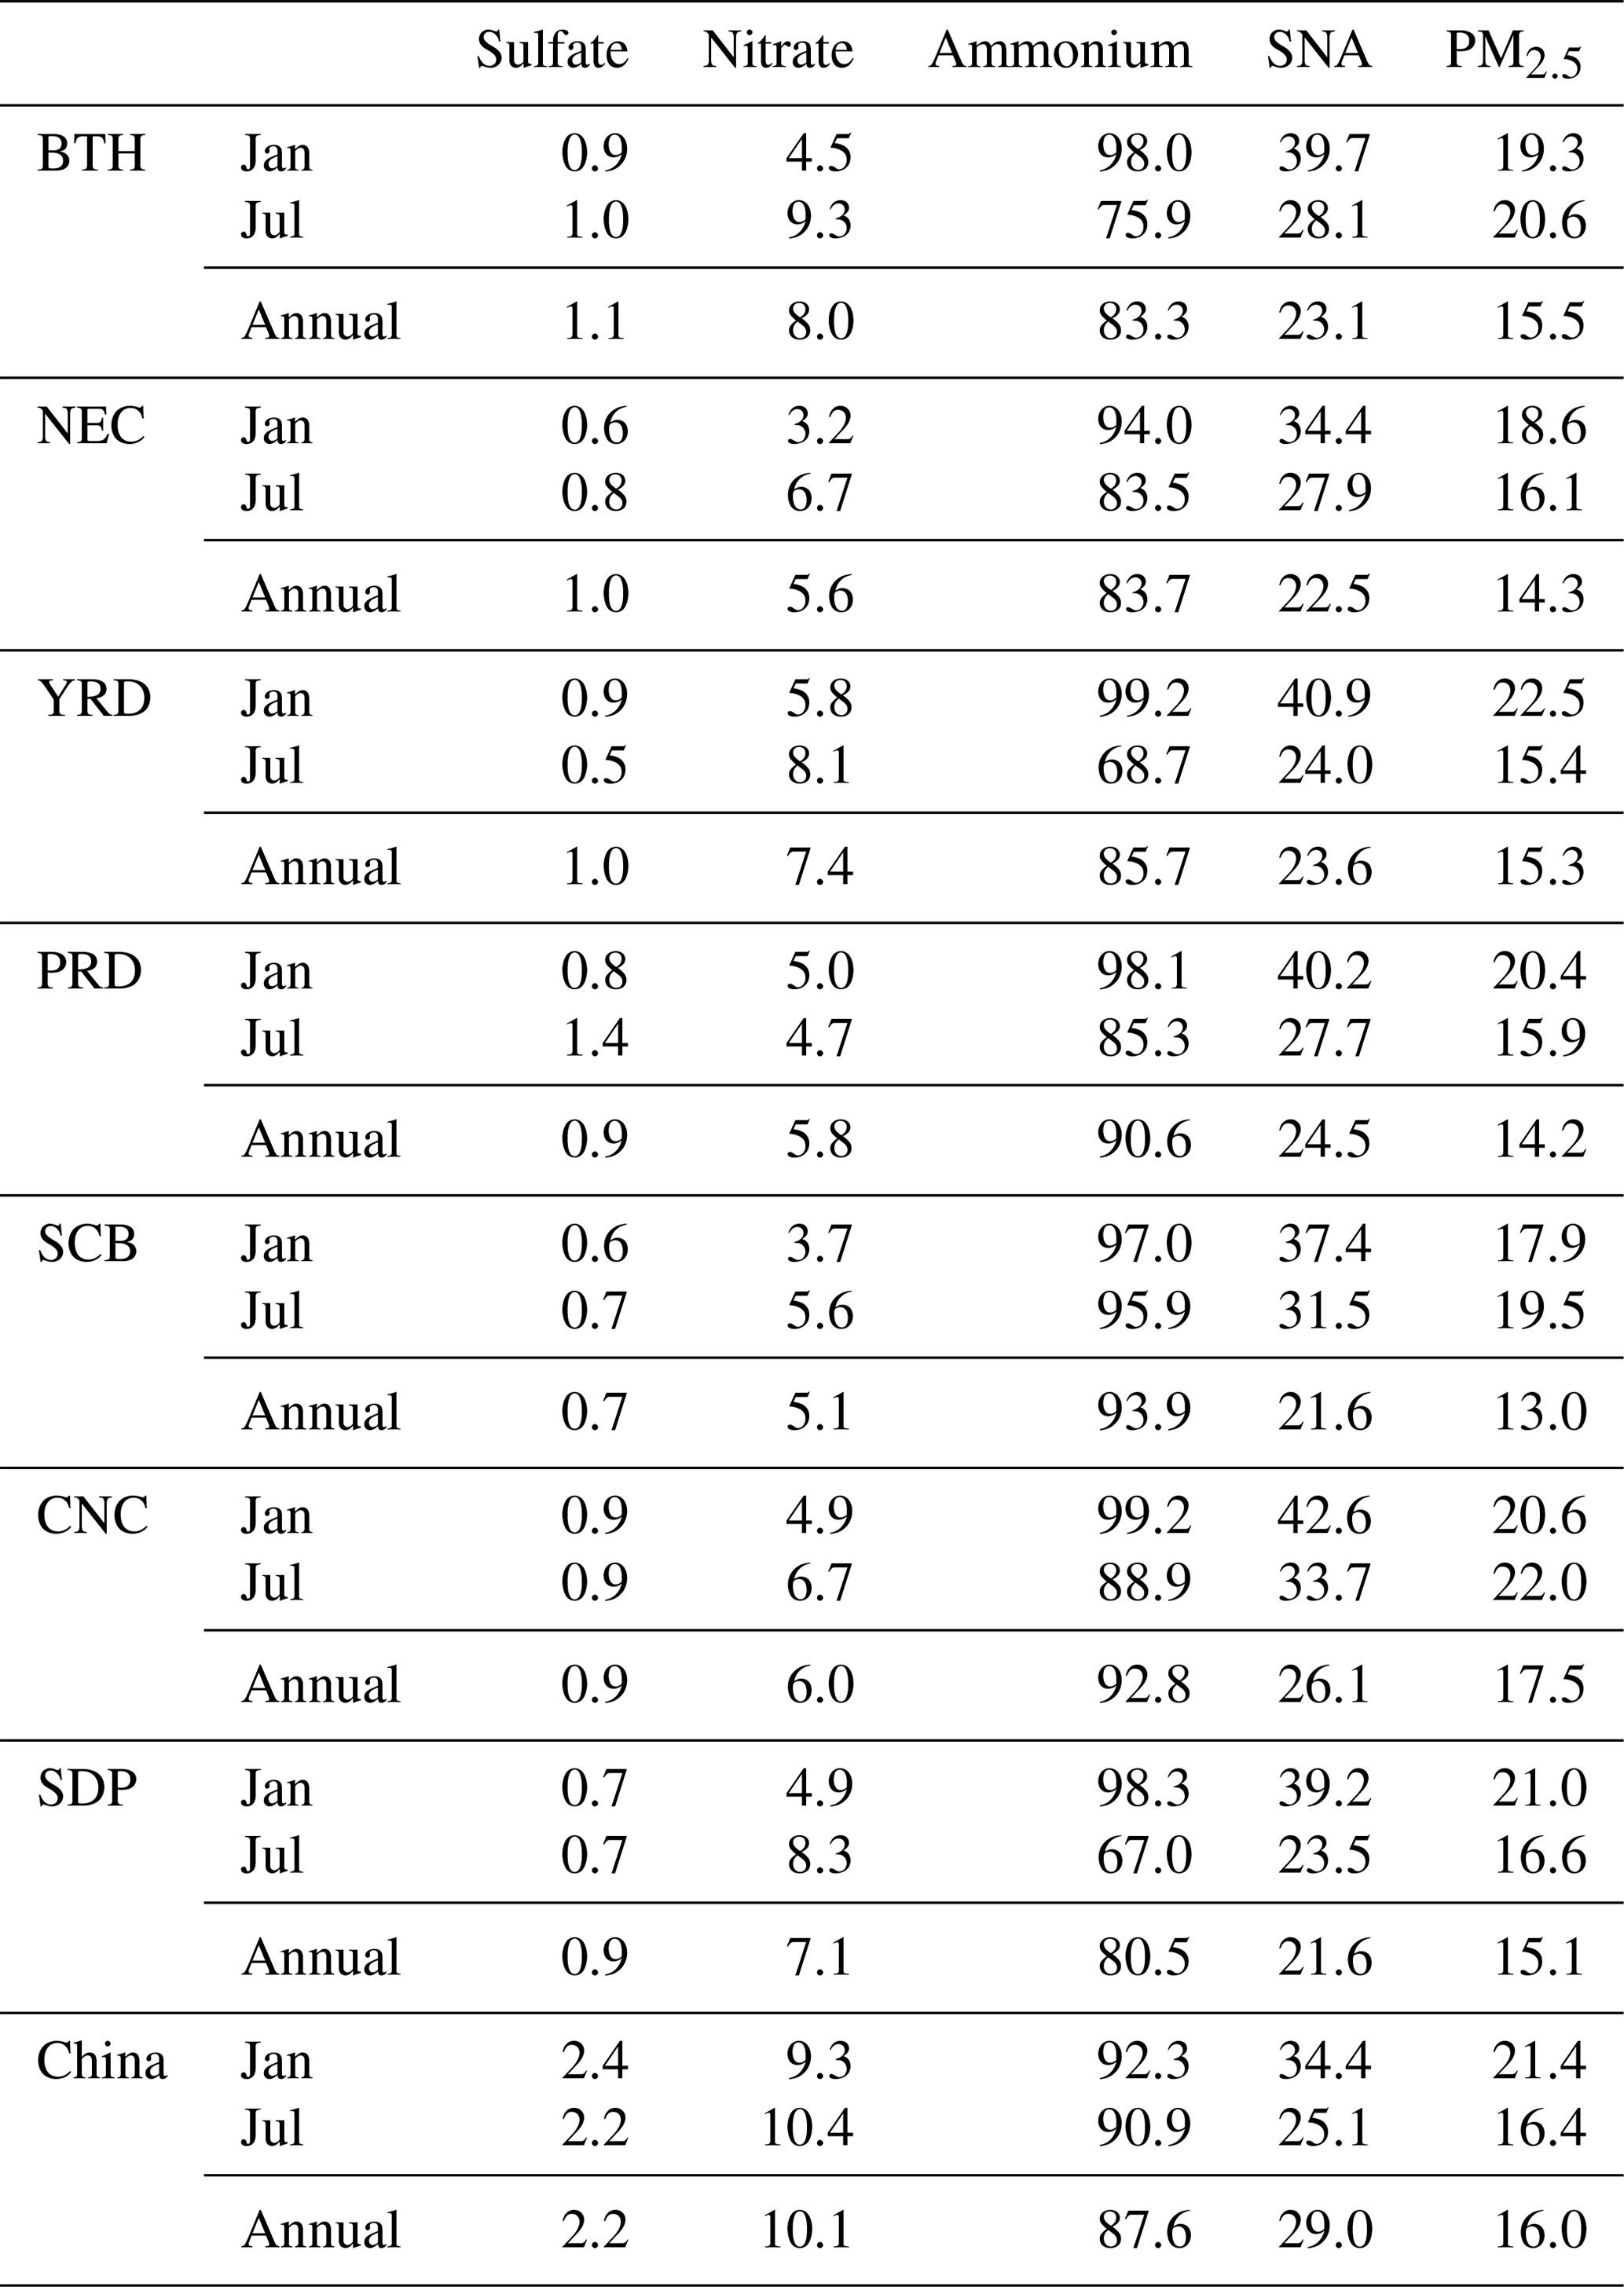
The regional average percentage of Tagr contribution to sulfate, nitrate, ammonium, SNA, and PM2.5 are shown in Table 4. As shown in this table, the annual average Tagr NH3 provided major contributions, which reached approximately 90 %, to ammonium and relatively small contributions (5 %–10 %) to nitrate mass burden. However, the contribution to sulfate was minimal because sulfate formation from SO2 can occur in various ways, in addition to neutralization by NH3, such as being oxidized by H2O2, O3, or peroxyacetic acid. The seasonal variation of ammonium was evident; it could be higher than 99 % in January but lower than 70 % in July. Most of the differences shown in Table 4 could exceed 10 % because the NH3 emitted from other sources (anthropogenic and natural sources) was substantial in these regions during summer. The annual average Tagr NH3 provided 20 %–40 % contribution to SNA mass concentration, and the contributions in January were larger than that in July. The seasonal variation and spatial features of Tagr NH3 contribution to PM2.5 mass concentration were similar to the features of SNA and generally provided approximately 14 %–22 % contribution to the total PM2.5 mass concentration in these places. By contrast, the annual contribution in China was higher than those in the regions mentioned above. This feature indicates that the Tagr NH3 provided a higher contribution compared to other sources over regions with weaker anthropogenic activities.
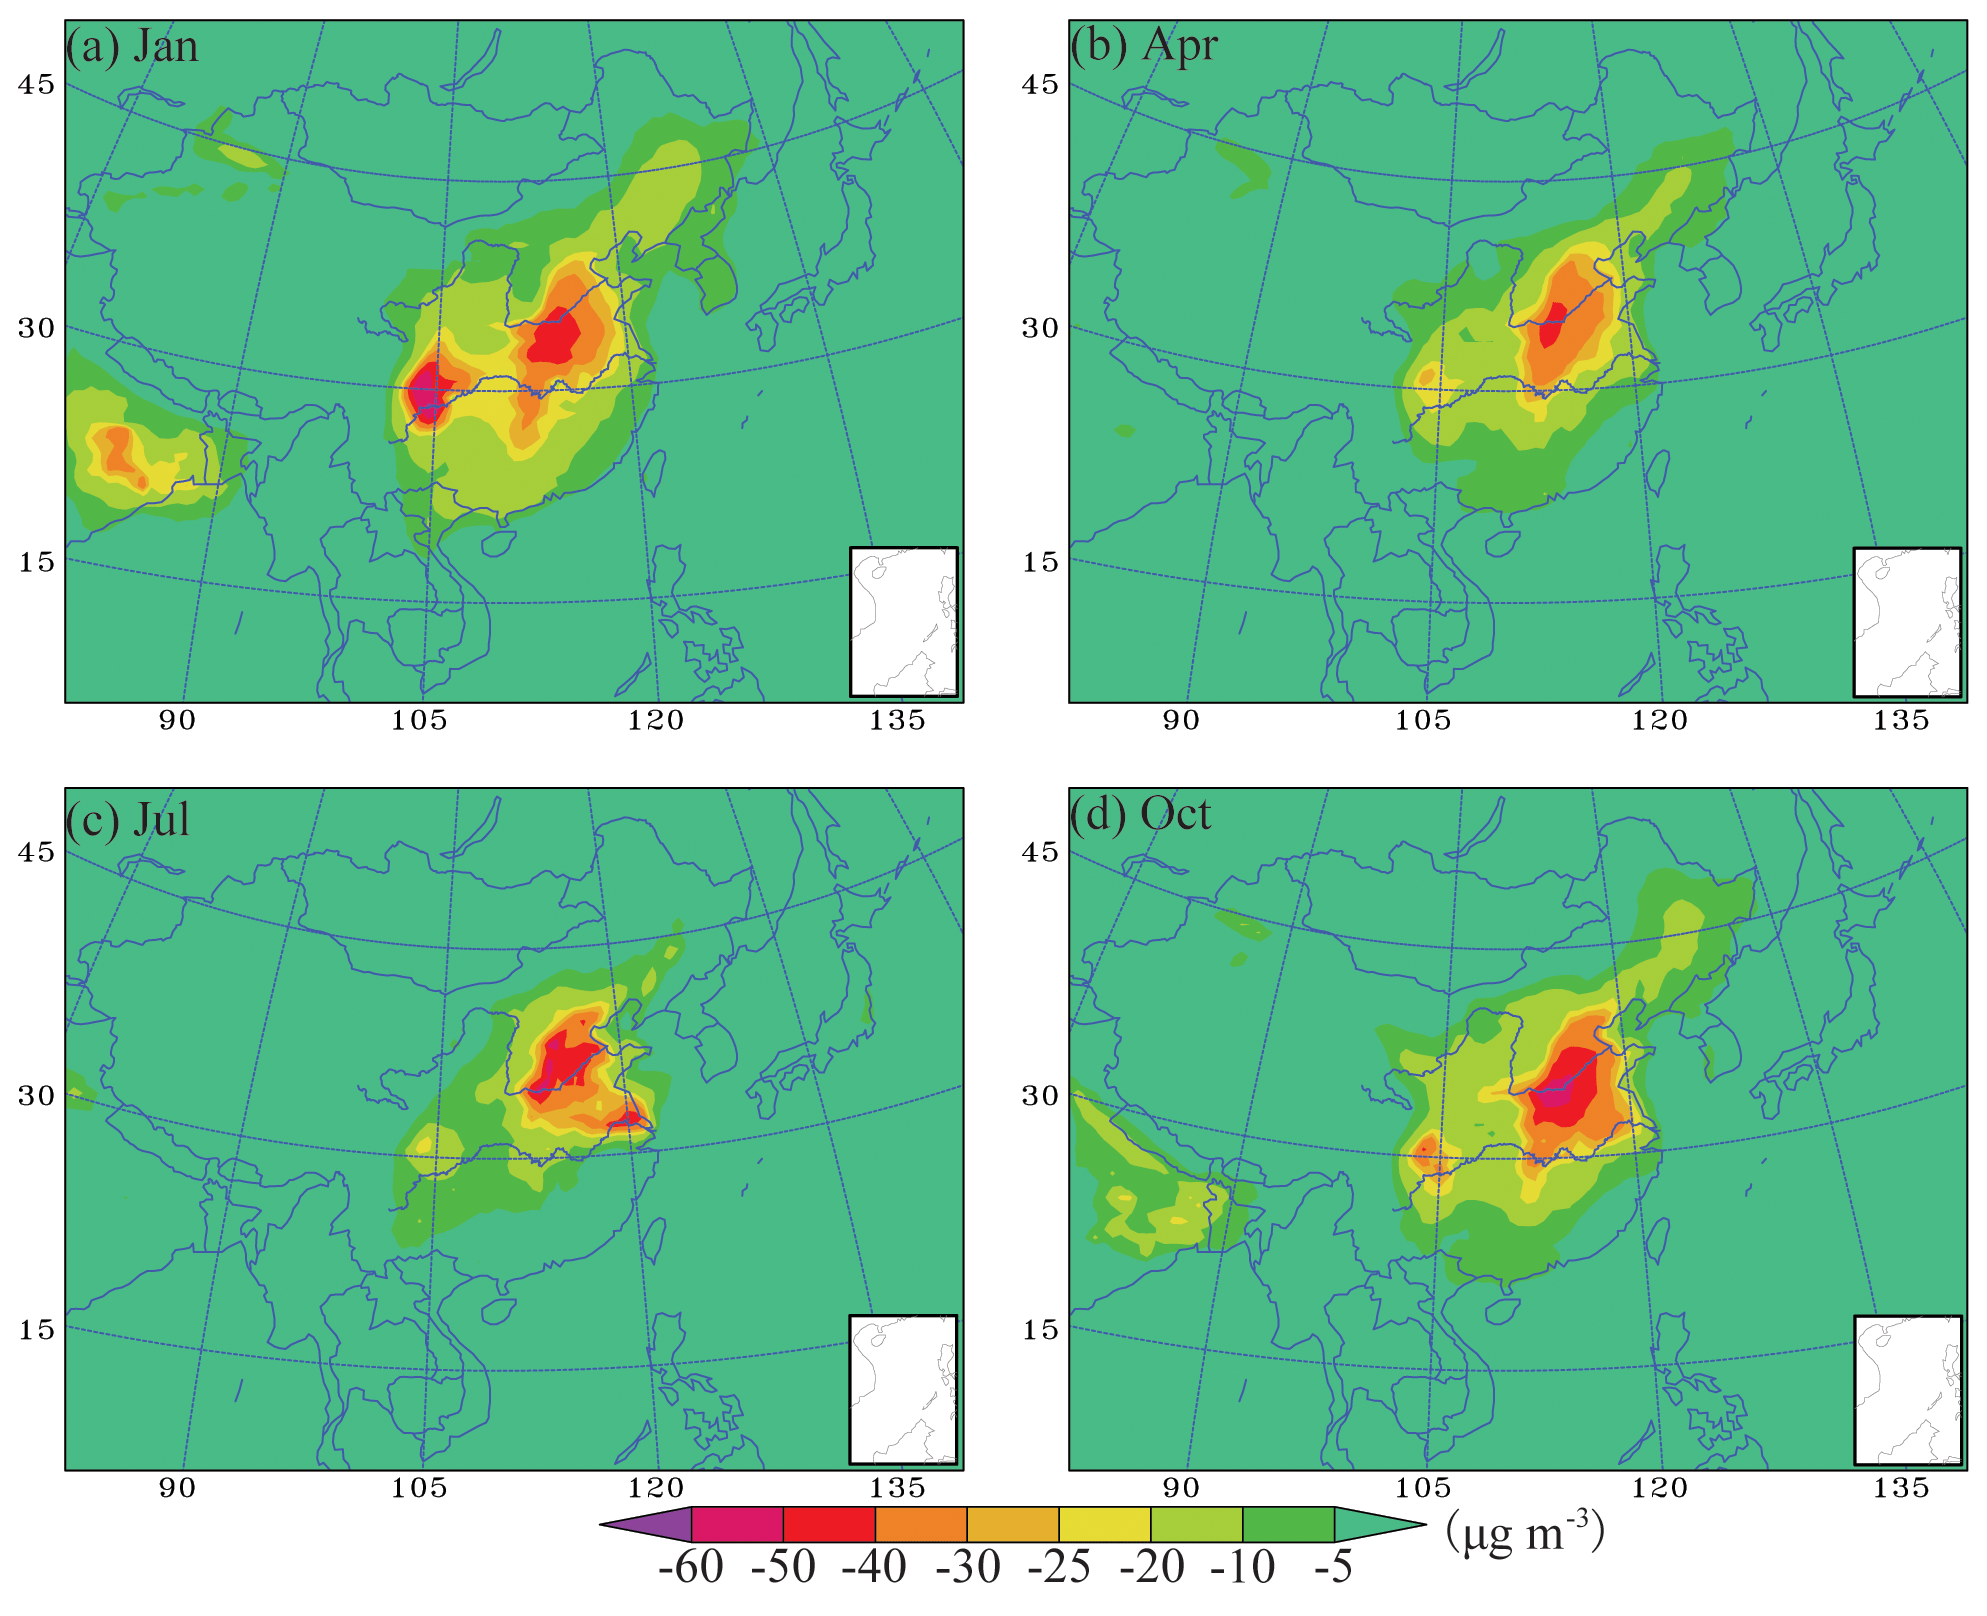
Figure 7The horizontal distributions of SNA mass concentration (µg m−3) variation associated with agriculture NH3 removal in January, April, July, and October.
Table 5The variation percentage (%) of sulfate, nitrate, ammonium, and SNA mass concentration associated with agriculture NH3 removal.
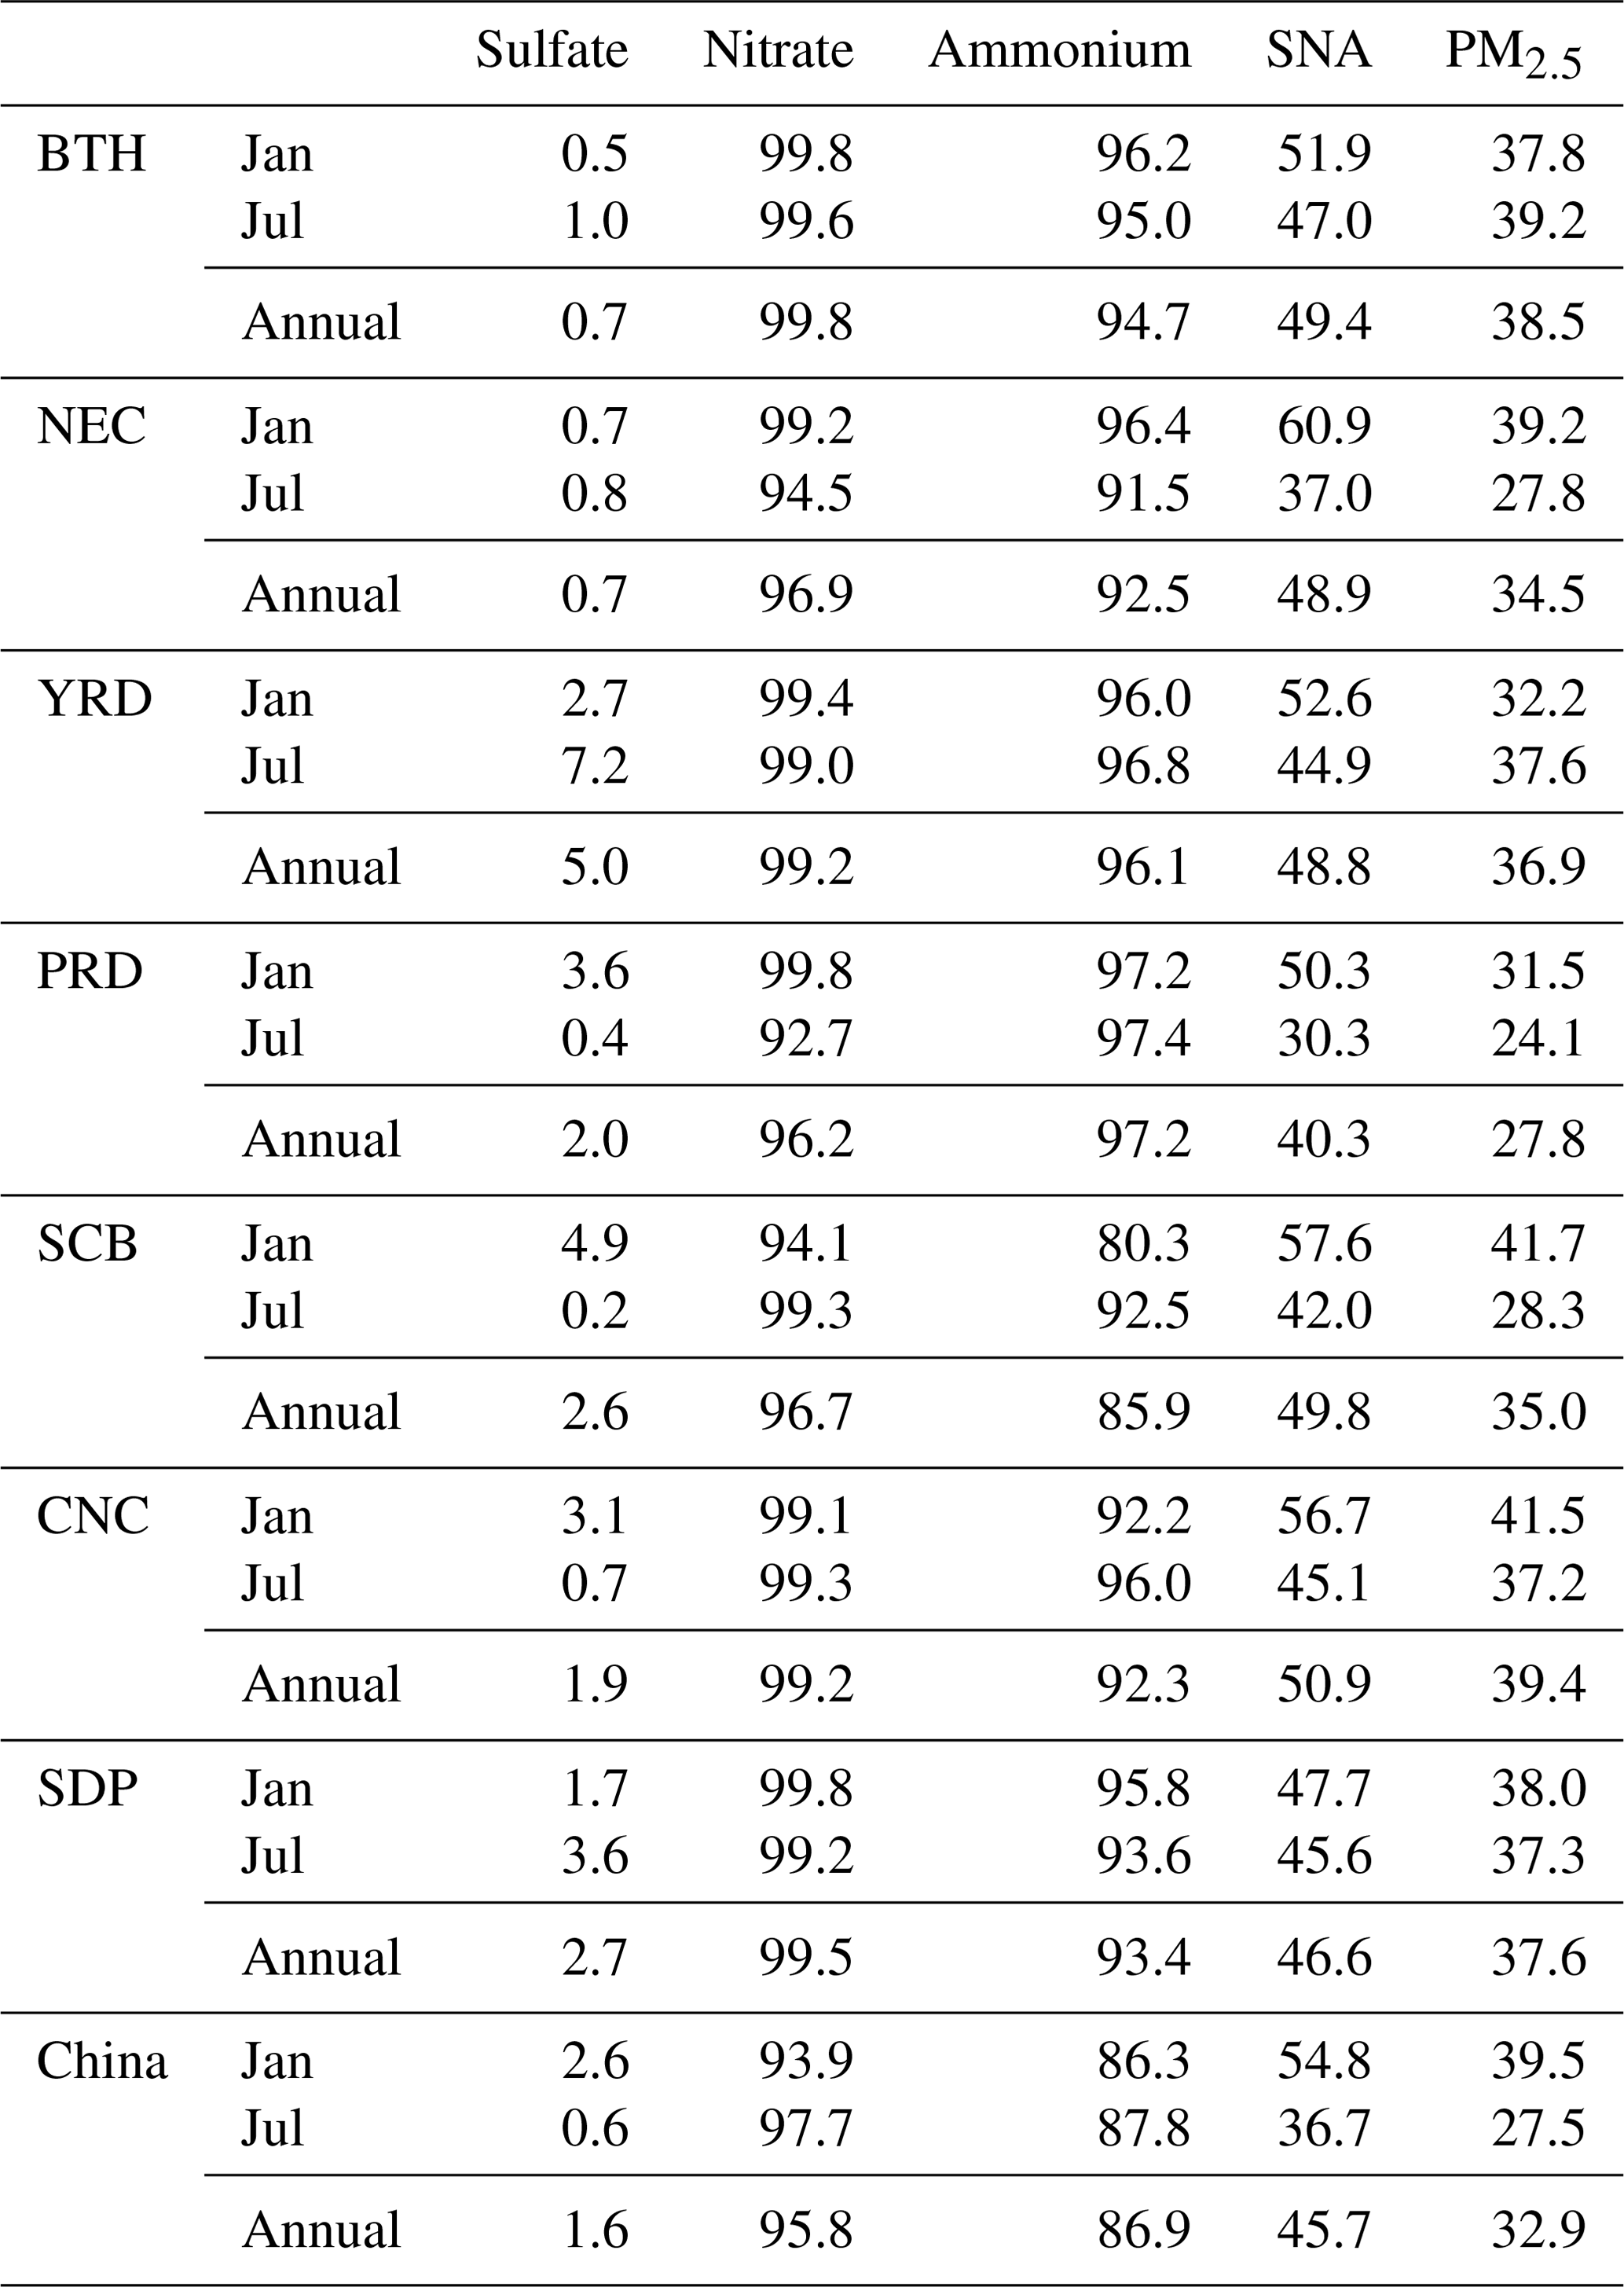
In addition, the brute-force method (zero-out sensitivity test), which can capture the effect of emission change on aerosol mass burden, was applied to investigate the impact of the removal of Tagr NH3 emission. In contrast to online source apportionment, the brute-force method mainly reflects the disparity of chemical balance caused by the emission change, which could considerably alter secondary pollutant formation. Several sensitivity tests were conducted, and the results are shown in Fig. 7 and Table 5. Figure 7 presents the mass burden variation of SNA associated with the Tagr NH3 removal. Figure 7 shows that the reduction pattern and seasonal variation of the aerosol were broadly followed by those of their mass burden. The considerable reduction of SNA mainly appeared in the high-concentration regions and generally exceeded 25 µg m−3. Table 5 shows the percentage of the variation of sulfate, nitrate, ammonium, SNA, and PM2.5. Compared with Table 4, the variation percentage of SNA and PM2.5 reached 30 %–60 % and 24 %–42 %, respectively, and they were approximately 2 times higher than those of the contribution percentage. This remarkable distinction was mainly caused by the variation of nitrate; that is, the contribution of Tagr NH3 to nitrate was generally below 10 %, as shown in Table 4, but the reduction of nitrate associated with removing Tagr NH3 emission could exceed 90 %, as shown in Table 5. This difference between the results of ISAM and brute-force tests was expected due to the high nonlinearity in the NOx chemistry. The nitrate formation could become more sensitive when the “rich NH3” environment shifts to a “poor NH3” environment, which means the decrease in nitrate mass burden would accelerate with NH3 emission reduction. Therefore, it can be deduced that the contribution of NH3 to nitrate should be remarkably lower under rich NH3 environments compared to that under poor NH3 environments. A similar phenomenon was also reported by some previous studies (Wang et al., 2011; Xu et al., 2016). To prove this point, more brute-force sensitivity tests were conducted. The variation of sulfate, nitrate, ammonium, and SNA mass burden associated with the reduction of NH3 emission (80 %, 50 %, 40 %, 30 %, 20 %, and 10 % Tagr NH3 emission, respectively) is shown in Fig. 8. The decline of nitrate mass concentration was more rapid than that of ammonium, and the trend became slightly faster with the reduction of NH3 emission (signified from rich NH3 to poor NH3 environments) in most regions. The acceleration of nitrate mass burden decline was substantial in regions with strong NH3 emission. Furthermore, this acceleration stopped when 20 % of NH3 emission remained, as shown in Fig. 8.
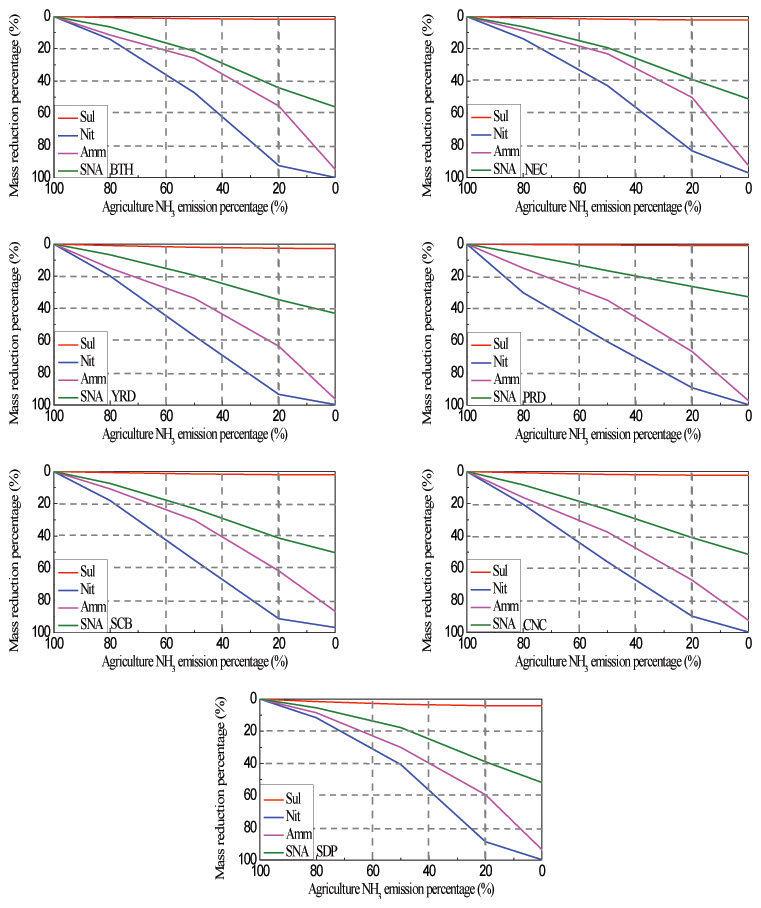
Figure 8The variation (%) of sulfate, nitrate, ammonium, and SNA mass burden associated with the NH3 emission reduction (%).
The emission budget of agricultural NH3 was huge and played an important role in regional particle pollution in China. As a precursor of the secondary aerosol, the reasonable estimation of the nonlinear processes of secondary aerosol formation should be the key point for capturing the contribution of NH3 to particle pollution. In this study, the air quality modeling system RAMS-CMAQ was applied to simulate the spatial–temporal distribution of trace gas and aerosols in 2015. In addition, the PKU-NH3 emission inventory, which was compiled on 1 km × 1 km horizontal resolution with monthly data, was applied to capture the features of agricultural NH3 emission in China accurately. Then, the source apportionment module ISAM was coupled into this modeling system to estimate the contribution of agricultural NH3 to PM2.5 mass burden quantitatively. Brute-force sensitivity tests were also conducted to discuss the impact of agricultural NH3 emission reduction. The meteorological factors and mass concentration of NH3, SO2, NO2, and PM2.5 from simulation were evaluated and showed consistency with the observation data. Some interesting results were explored and summarized as follows.
-
The high mass burden of NH3 could exceed 10 µg m−3 and mainly appeared in the NCP, CNC, YRD, and SCB. These regions had high coincidence with regions that are heavily covered with particle pollution. Therefore, it can be deduced that the influence of agricultural NH3 on the PM2.5 mass concentration is crucial.
-
The results from ISAM simulation showed that the Tagr NH3 provided 17 %–23 % and 15 %–22 % contribution to the PM2.5 in January and July, respectively, in most parts of eastern China, and the largest annual average contribution appeared in CNC (17.5 %). Specific to SNA components, the annual and regional average contributions of Tagr NH3 to ammonium, nitrate, and sulfate in China were 87.6 %, 10.1 %, and 2.2 %, respectively. Therefore, agricultural NH3 emission contributes considerably to ammonium formation but minimally to sulfate due to various means of sulfate formation.
-
The brute-force sensitive test could reflect the effect of changing Tagr NH3 emission on PM2.5 mass burden. The results indicated that the reduction percentage of PM2.5 mass burden due to removal Tagr NH3 emission could reach 24 %–42 % in most parts of eastern China; these values are approximately 2 times higher than the contribution. The nitrate reduction percentage that exceeded 90 % was the major reason for this remarkable difference. In addition, further analysis proved that the ambient NH3 mass burden could affect its contribution to SNA formation, that is, the NH3 contribution to nitrate should be low under rich NH3 environments and high under poor NH3 environments. Therefore, the influence of NH3 would be enhanced with the decrease in ambient NH3 mass concentration.
This study suggests that the NH3 influence on the PM2.5 mass burden is complex because of the nonlinearity of secondary aerosol formation. Substantial deviation exists between the results of the ISAM and brute-force methods; thus, these two kinds of results should be distinguished and applied to explain different issues: the contribution under the current scenario and the effect due to emission reduction. The modeling system is a versatile tool that allows us to investigate valuable information for choosing efficient strategies for reducing the impact of agricultural NH3 and improving air quality.
The daily average temperature, relative humidity, wind speed, and maximum wind direction in January, April, July, and October 2015 were compared with the surface shared data from the Chinese National Meteorological Center (http://data.cma.cn/, last access: 23 July 2020) at 9 stations. The comparison results are shown in Figs. A1–A4. These stations are located in the East China, where the high NH3 emission regions. Generally, the modeled temperature was in good agreement with the observed data, and can reflect the large fluctuation and seasonal variation of relative humidity as well, except that some of the extreme high or low values appeared abruptly. As shown in Fig. A3, most of the daily average wind speed was lower than 3 m s−1 at Zhengzhou, Miyun, Tianjin, and Baoding station (all located in the North China Plain), which means the diffusion condition was not good due to the stable weather. Otherwise, the relatively strong wind appeared at Nanjing, Chaoyang, Nanning, and Jinan. The modeled wind speed generally reproduced all these features. A direct comparison between observed and modeled wind direction that can be easily influenced by the surrounding surface features is difficult. Nevertheless, the prevailing wind direction in different seasons can be captured by the simulation results for all stations.
In addition, Fig. A5 presents the regional average NH3 emission flux (g s−1 per grid) of different sectors, including fertilizer, husbandry, biomass burning, farmland ecosystems, waste disposal, and other sectors over each region in January, April, July, and October. Furthermore, the percent (%) of each NH3 emission sector is shown in Fig. A6. All the information was obtained from the PKU-NH3 emission inventory directly. It can be seen that the emission flux was higher in summer and lower in winter. The strongest emission flux mainly appeared in BTH, SDP and CNC.
These features generally followed the distribution pattern of NH3 mass concentration as shown in Fig. 3. On the other hand, the major proportion was provided by husbandry and fertilizer and was relatively high in spring and summer.
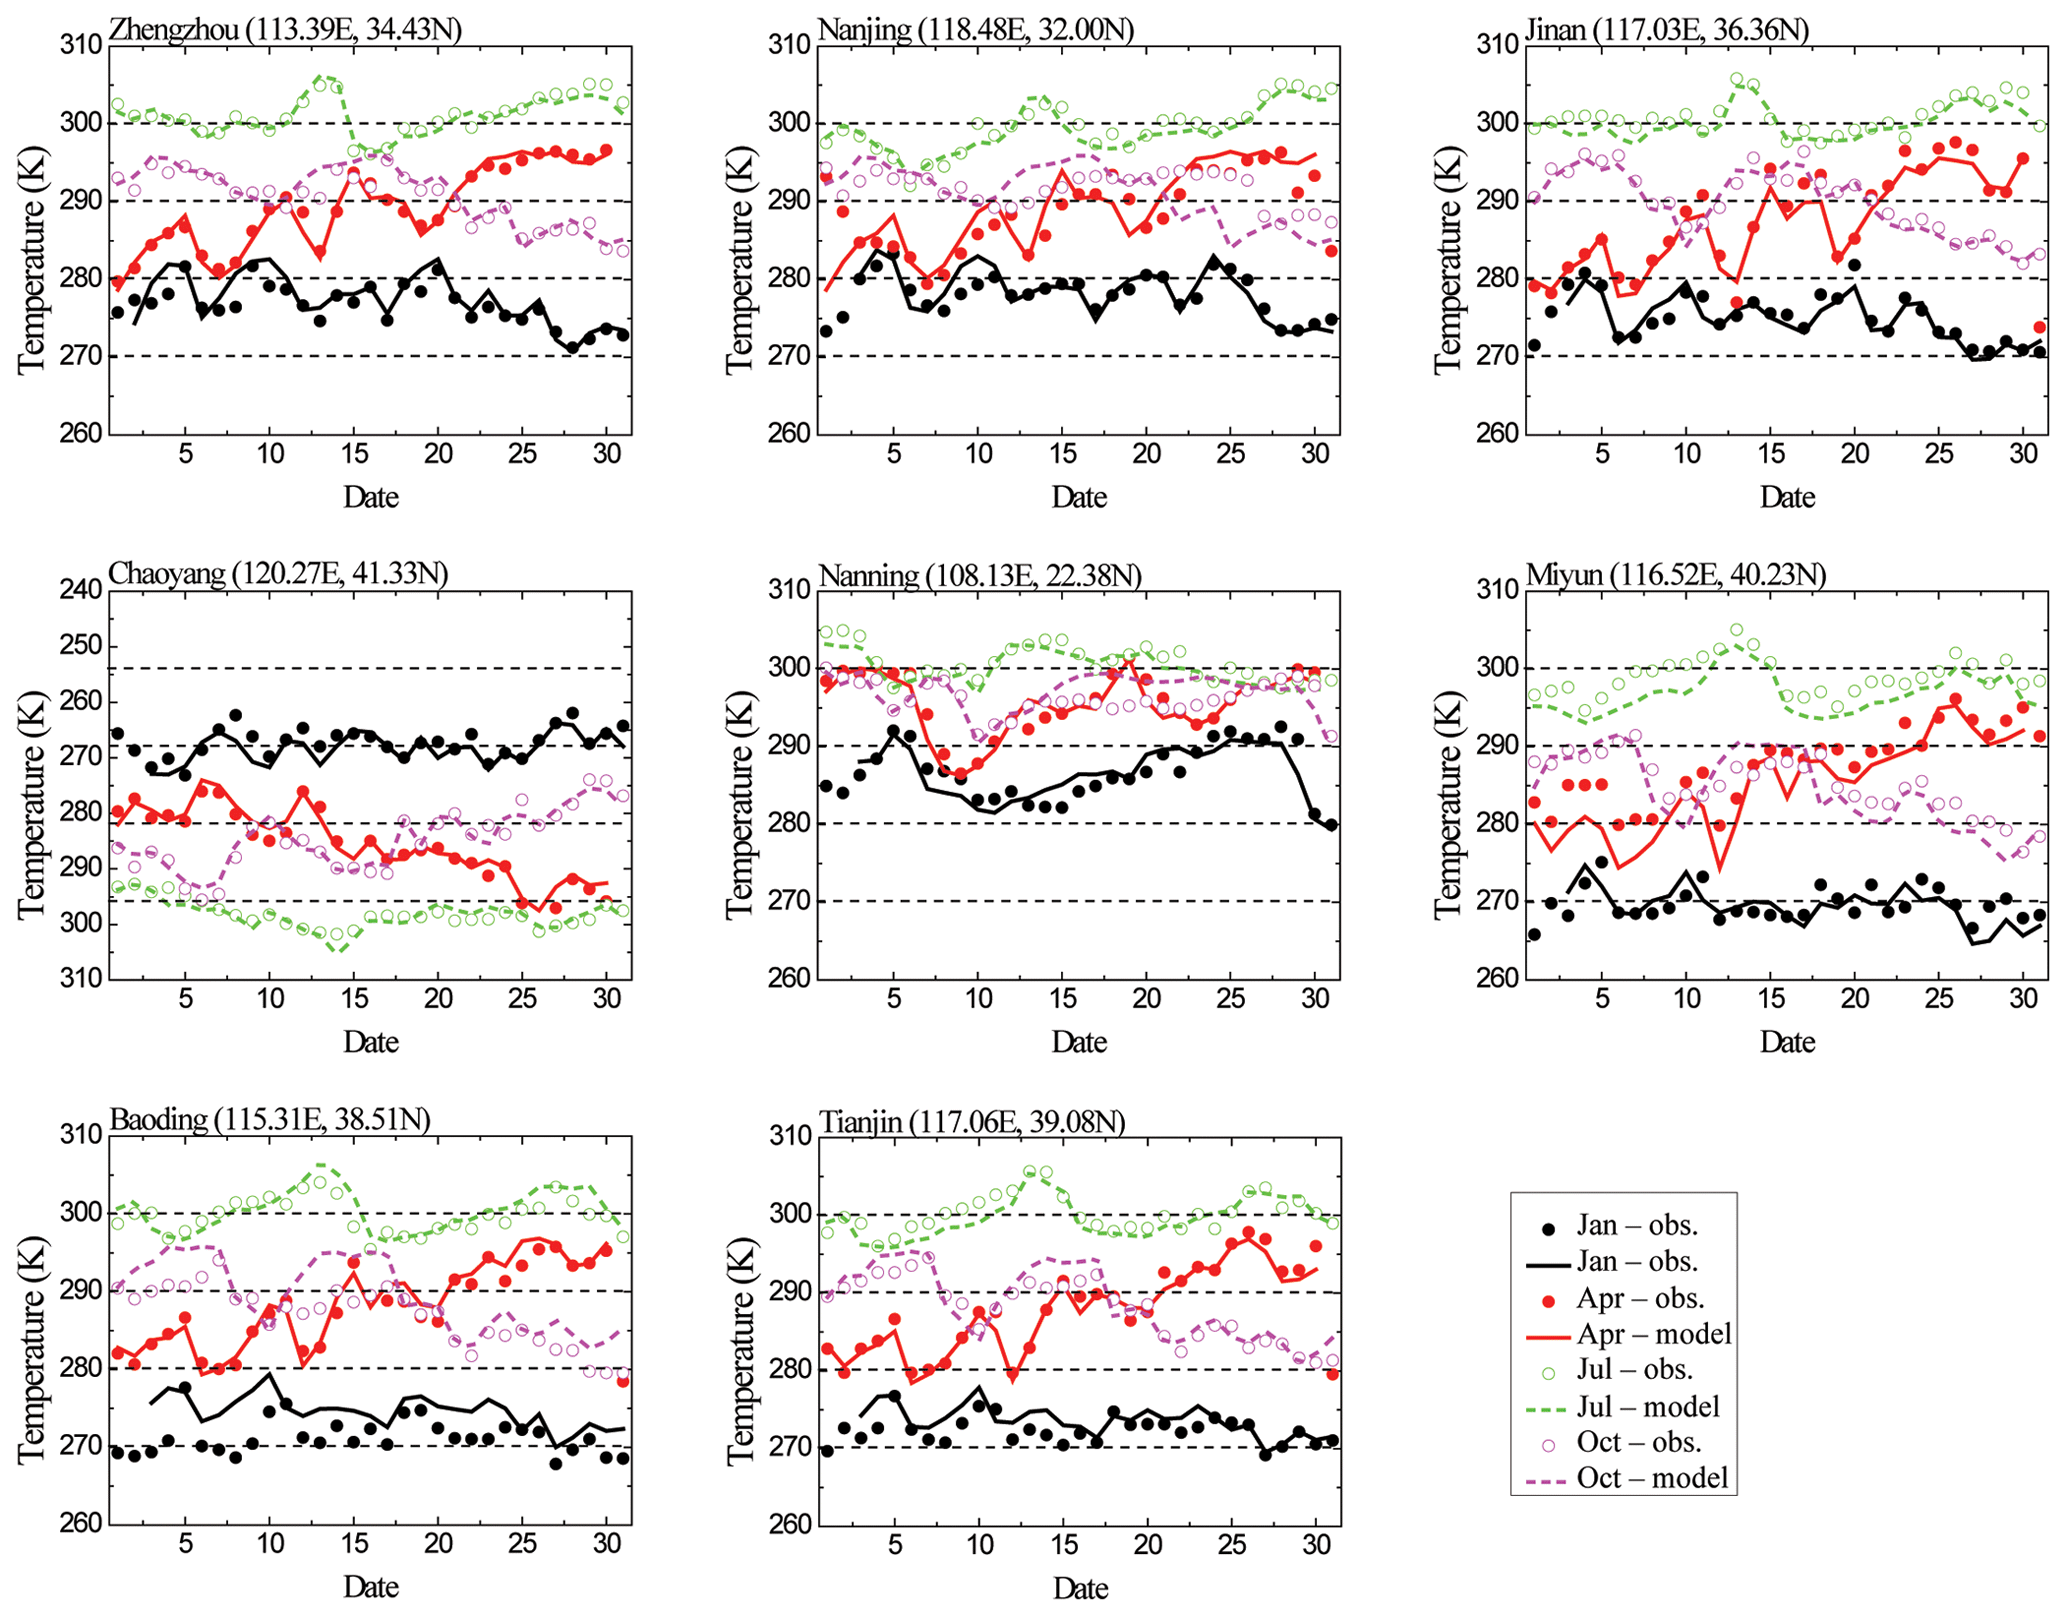
Figure A1Observed and modeled daily average temperatures (K) in January, April, July, and October 2015.
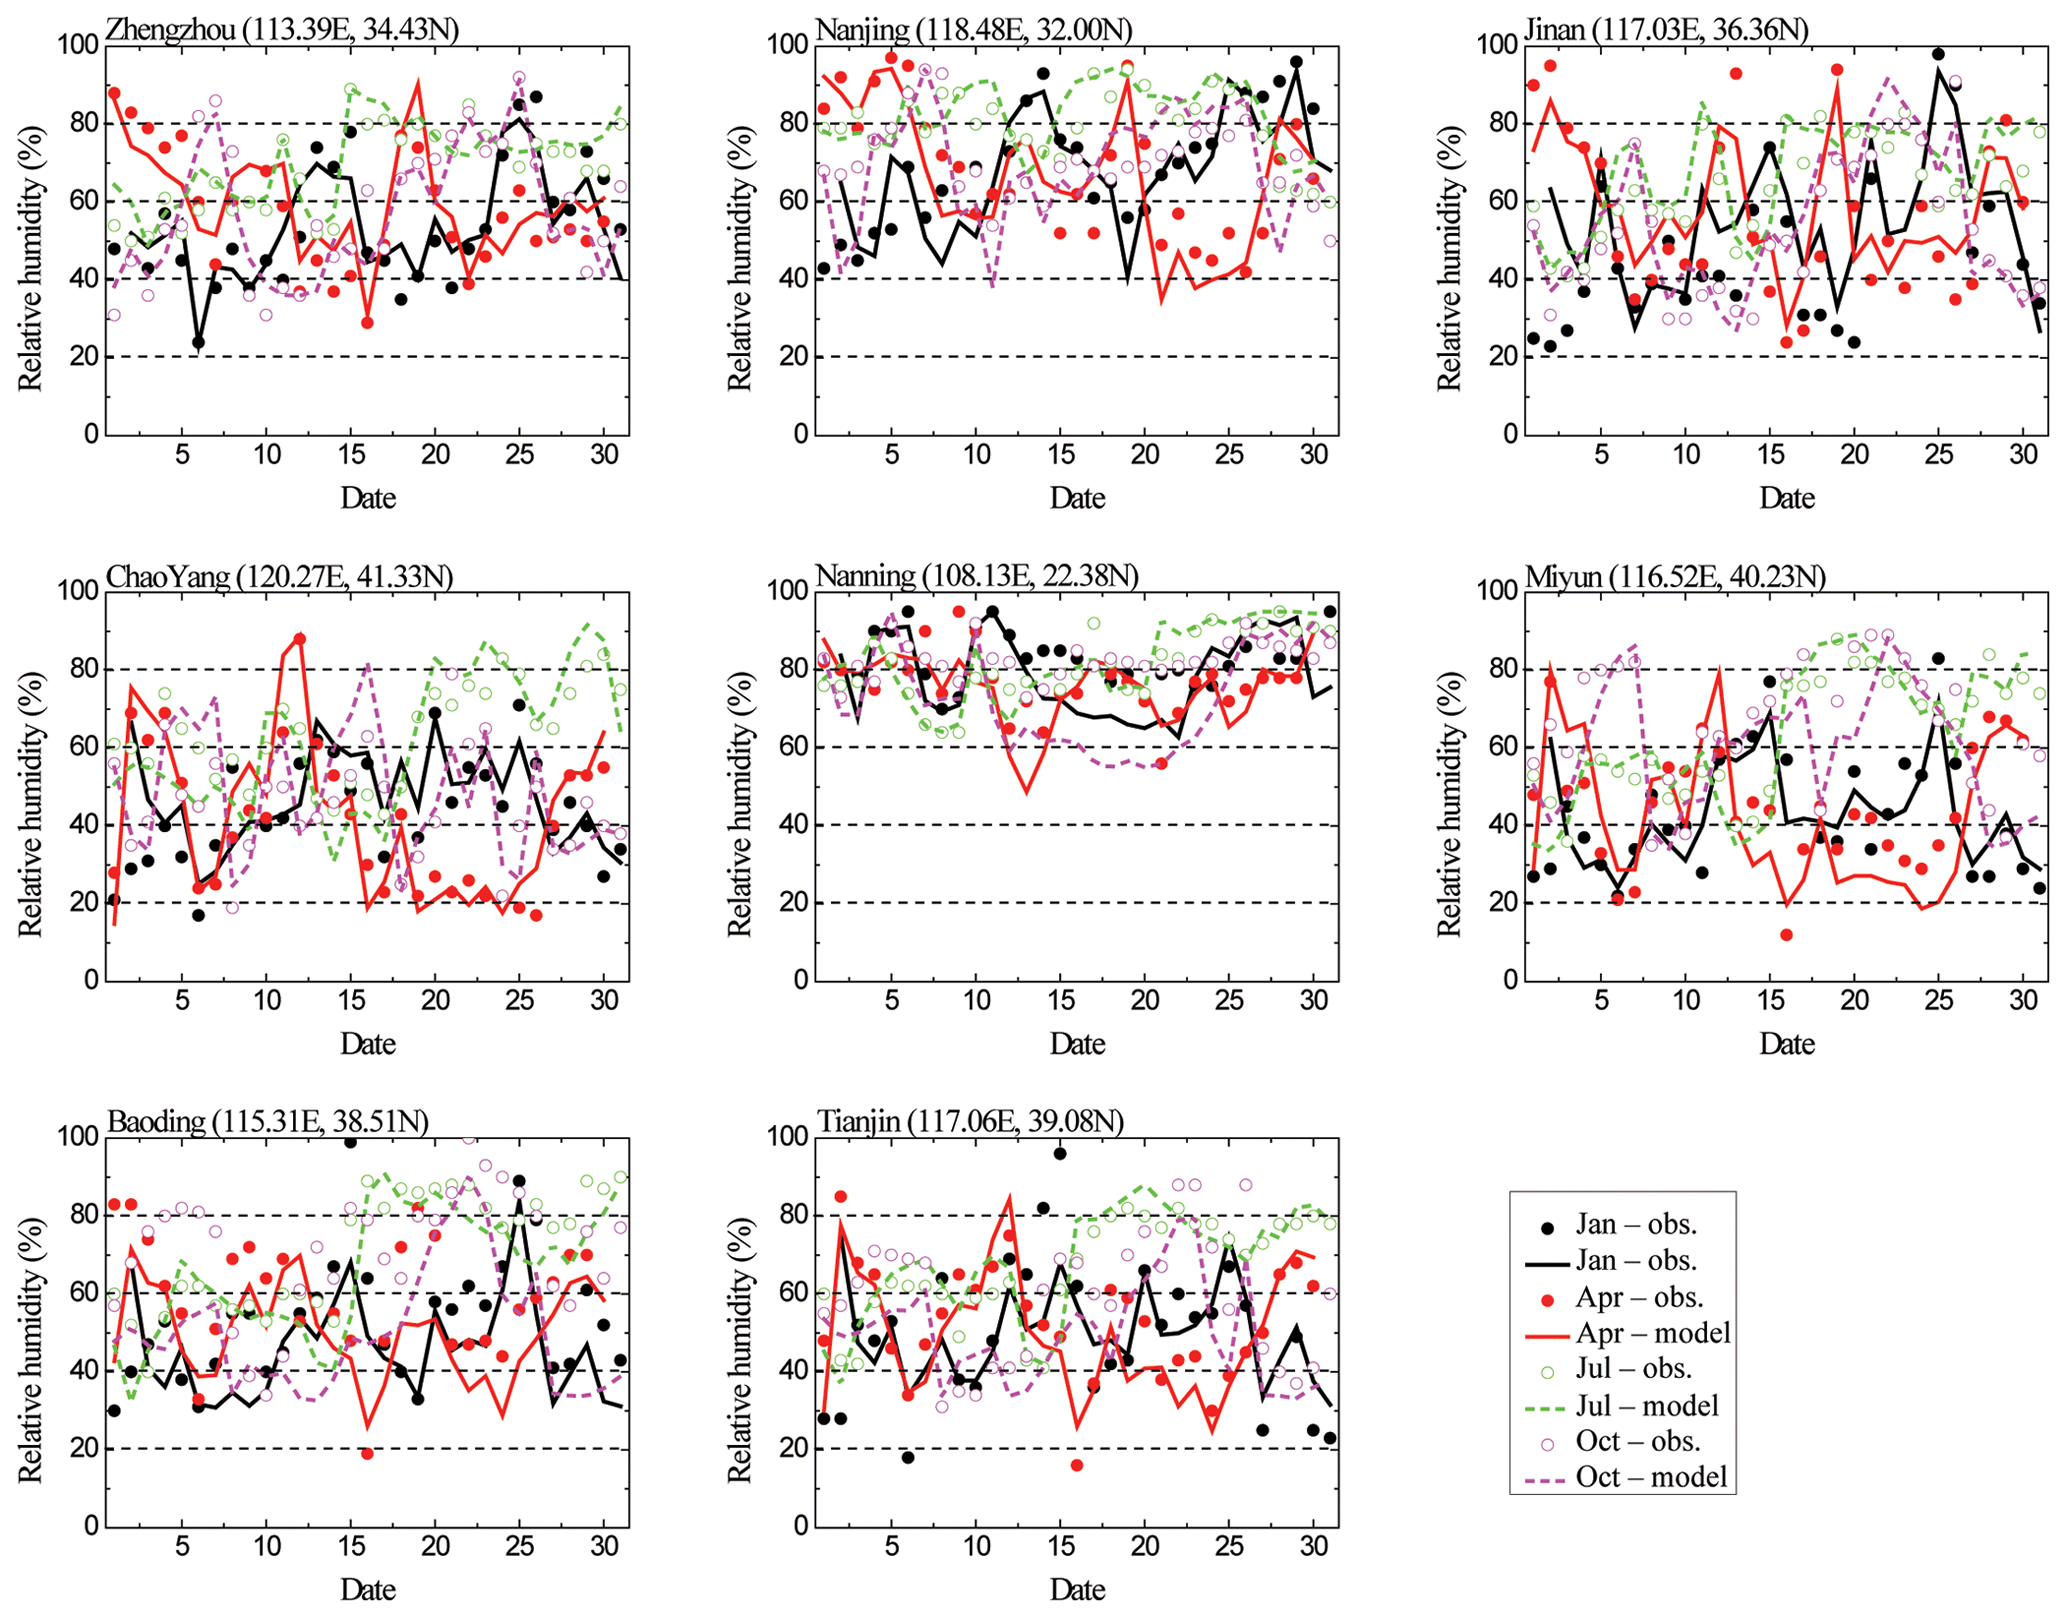
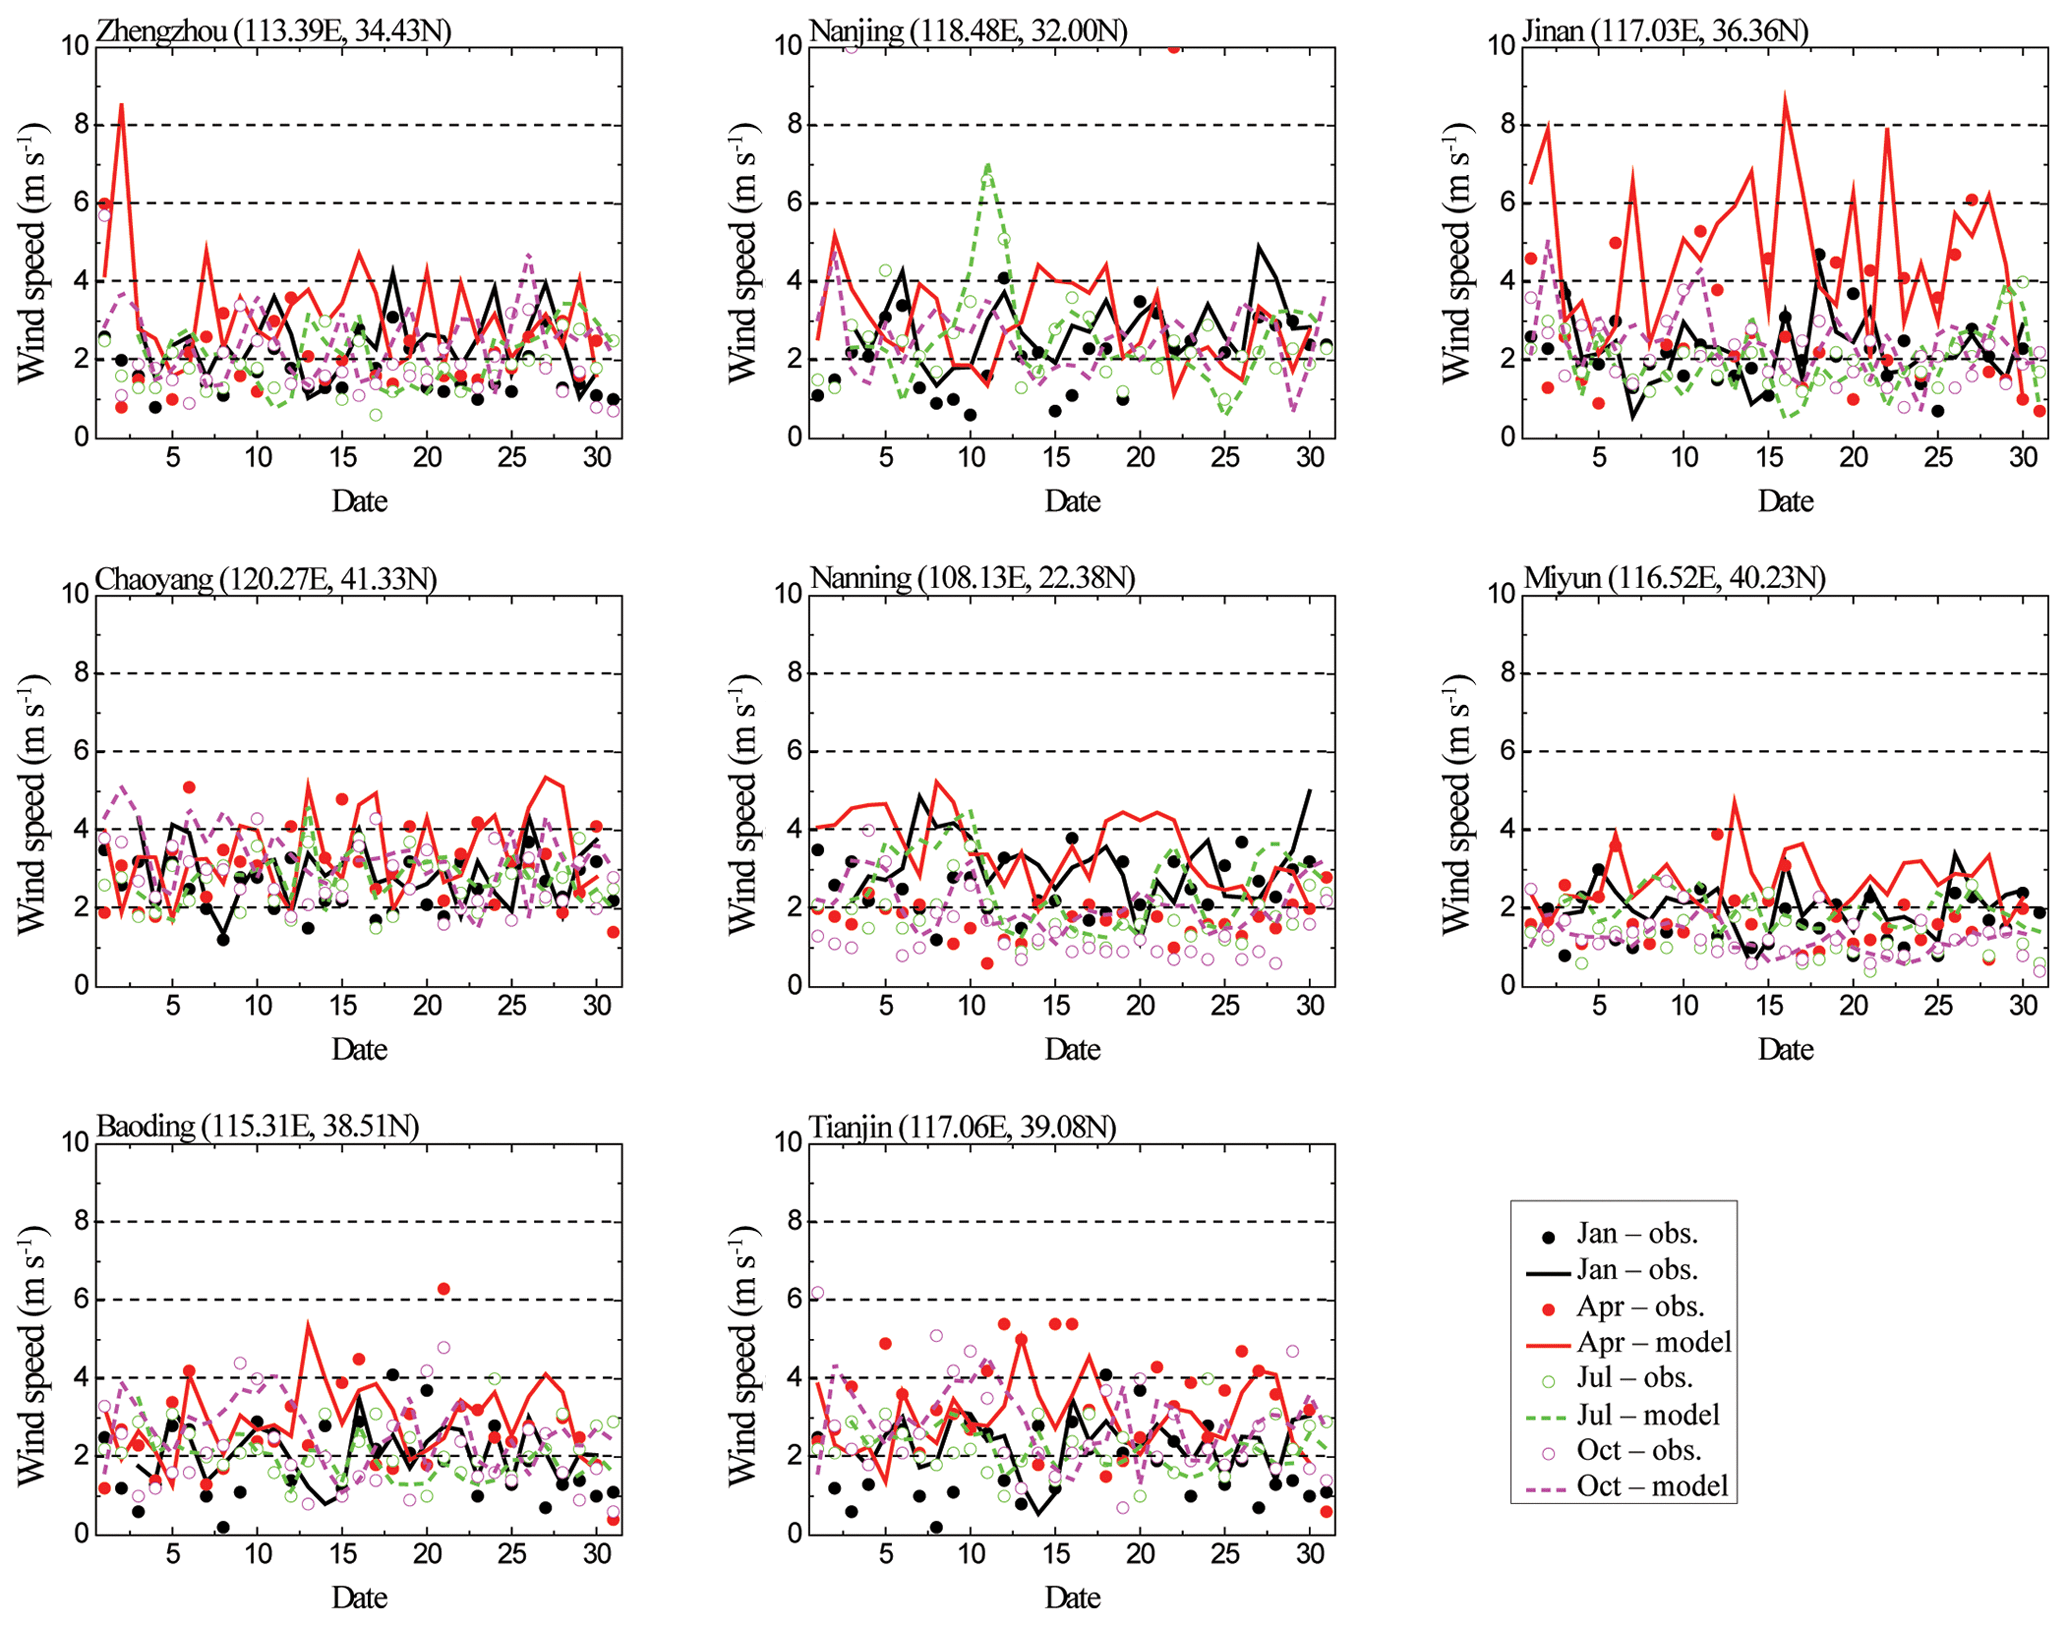
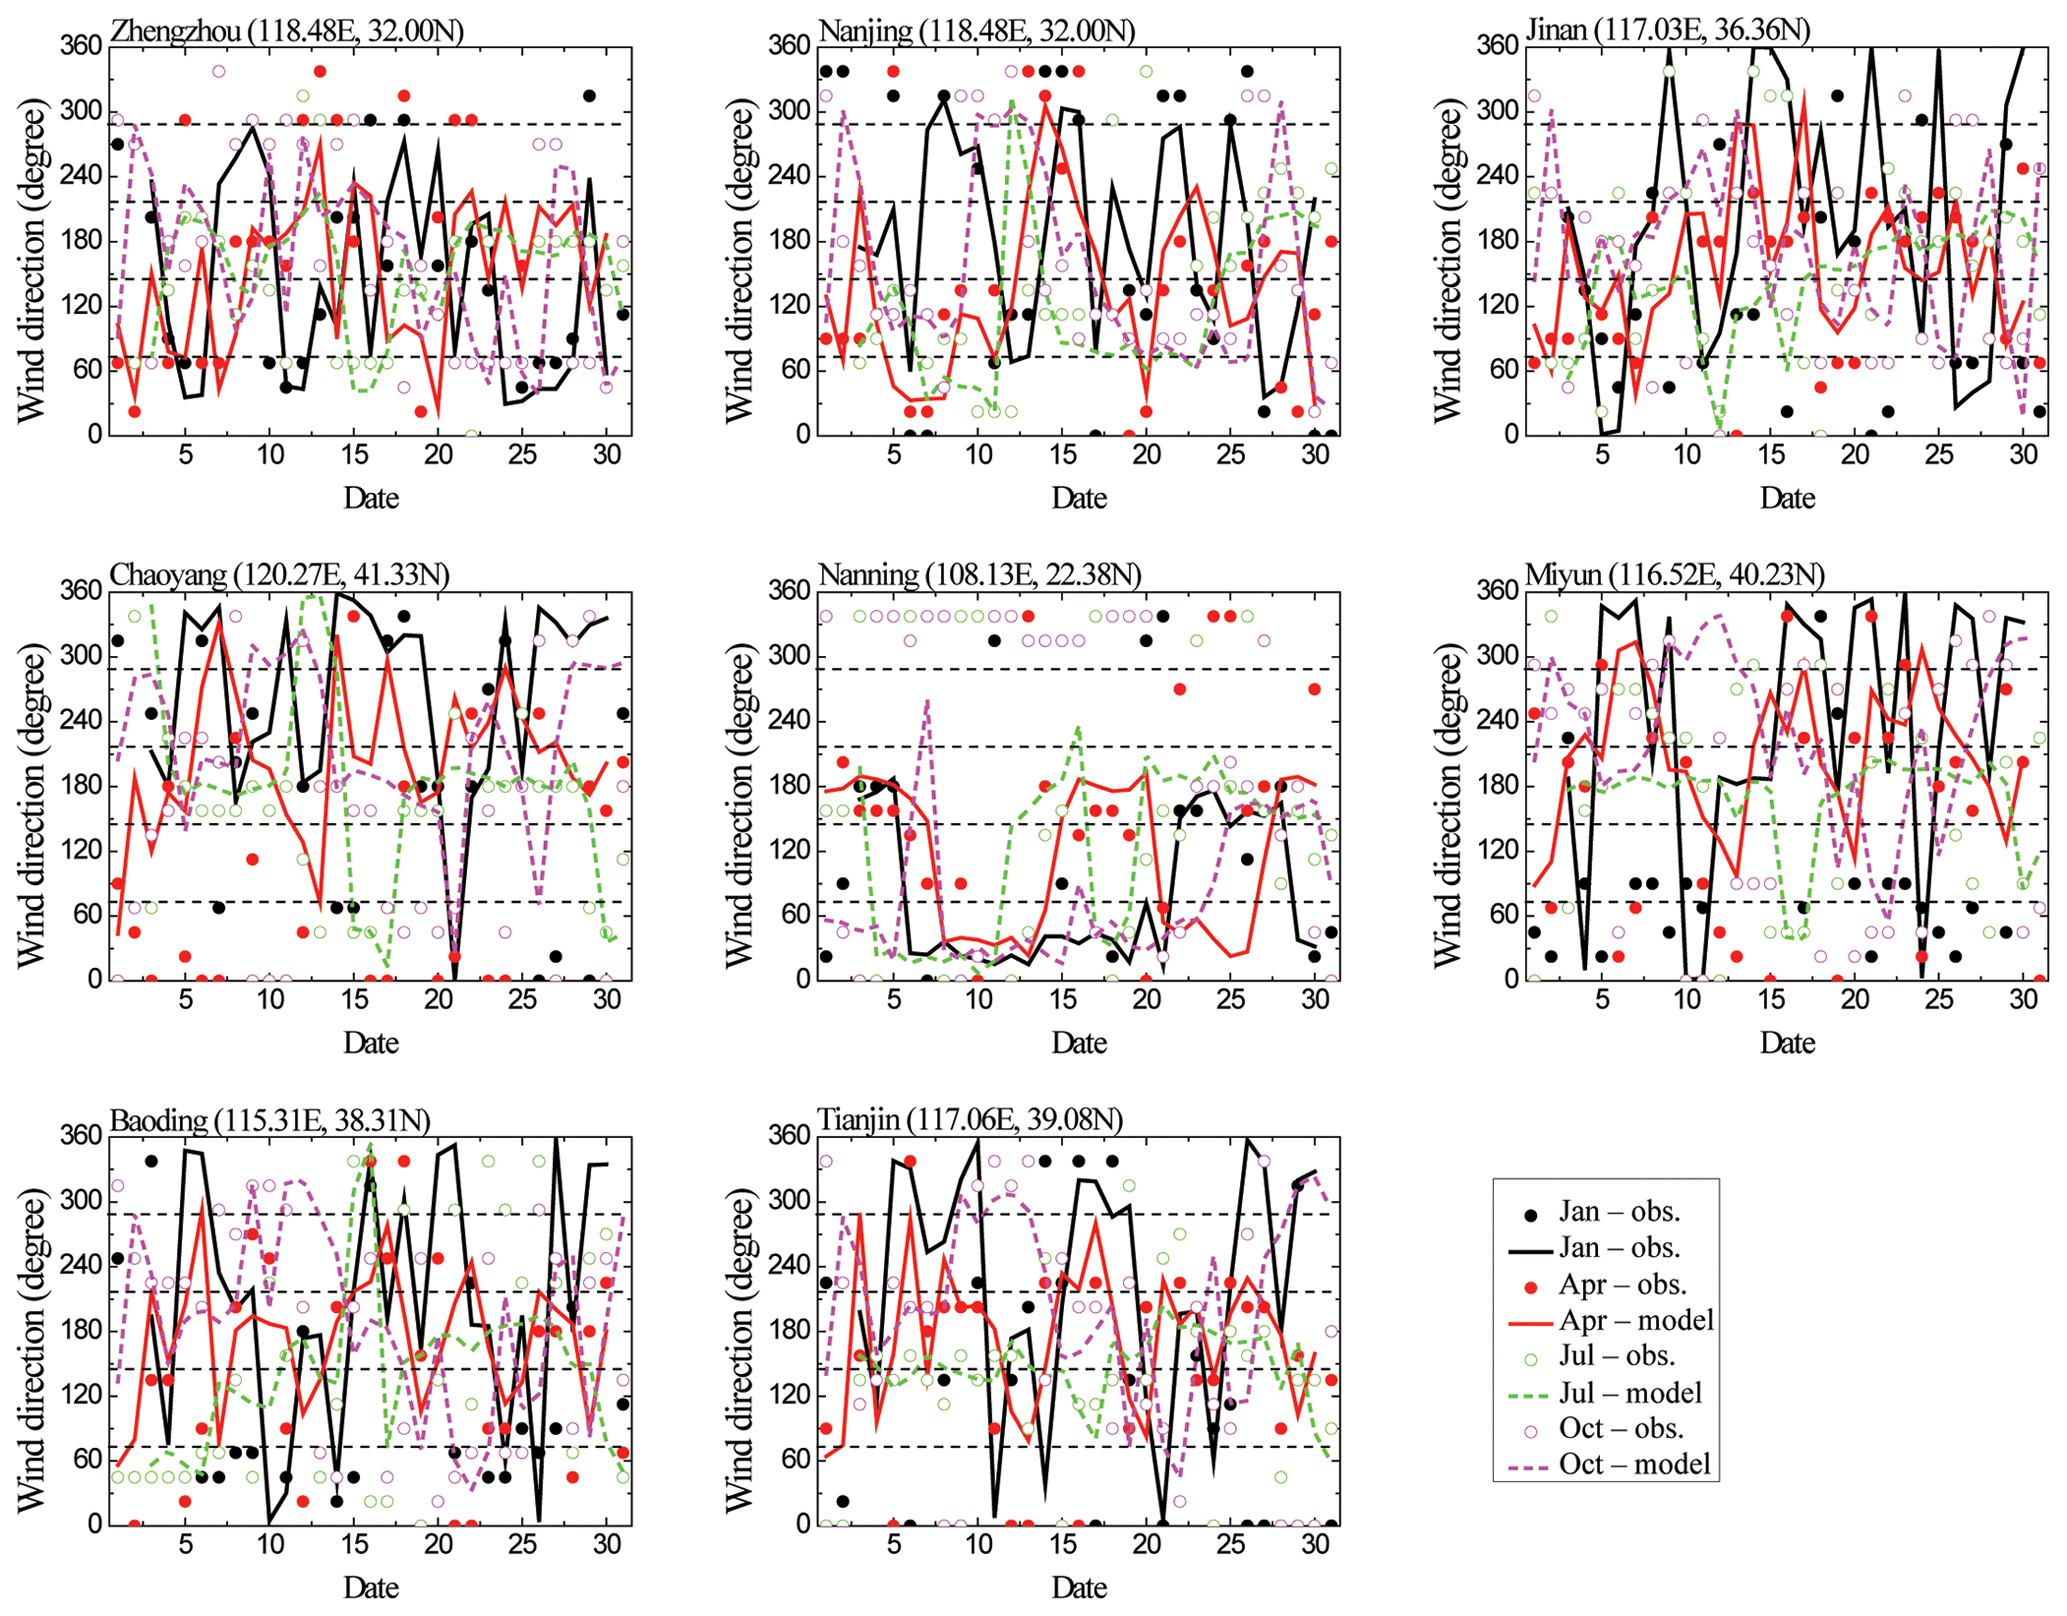
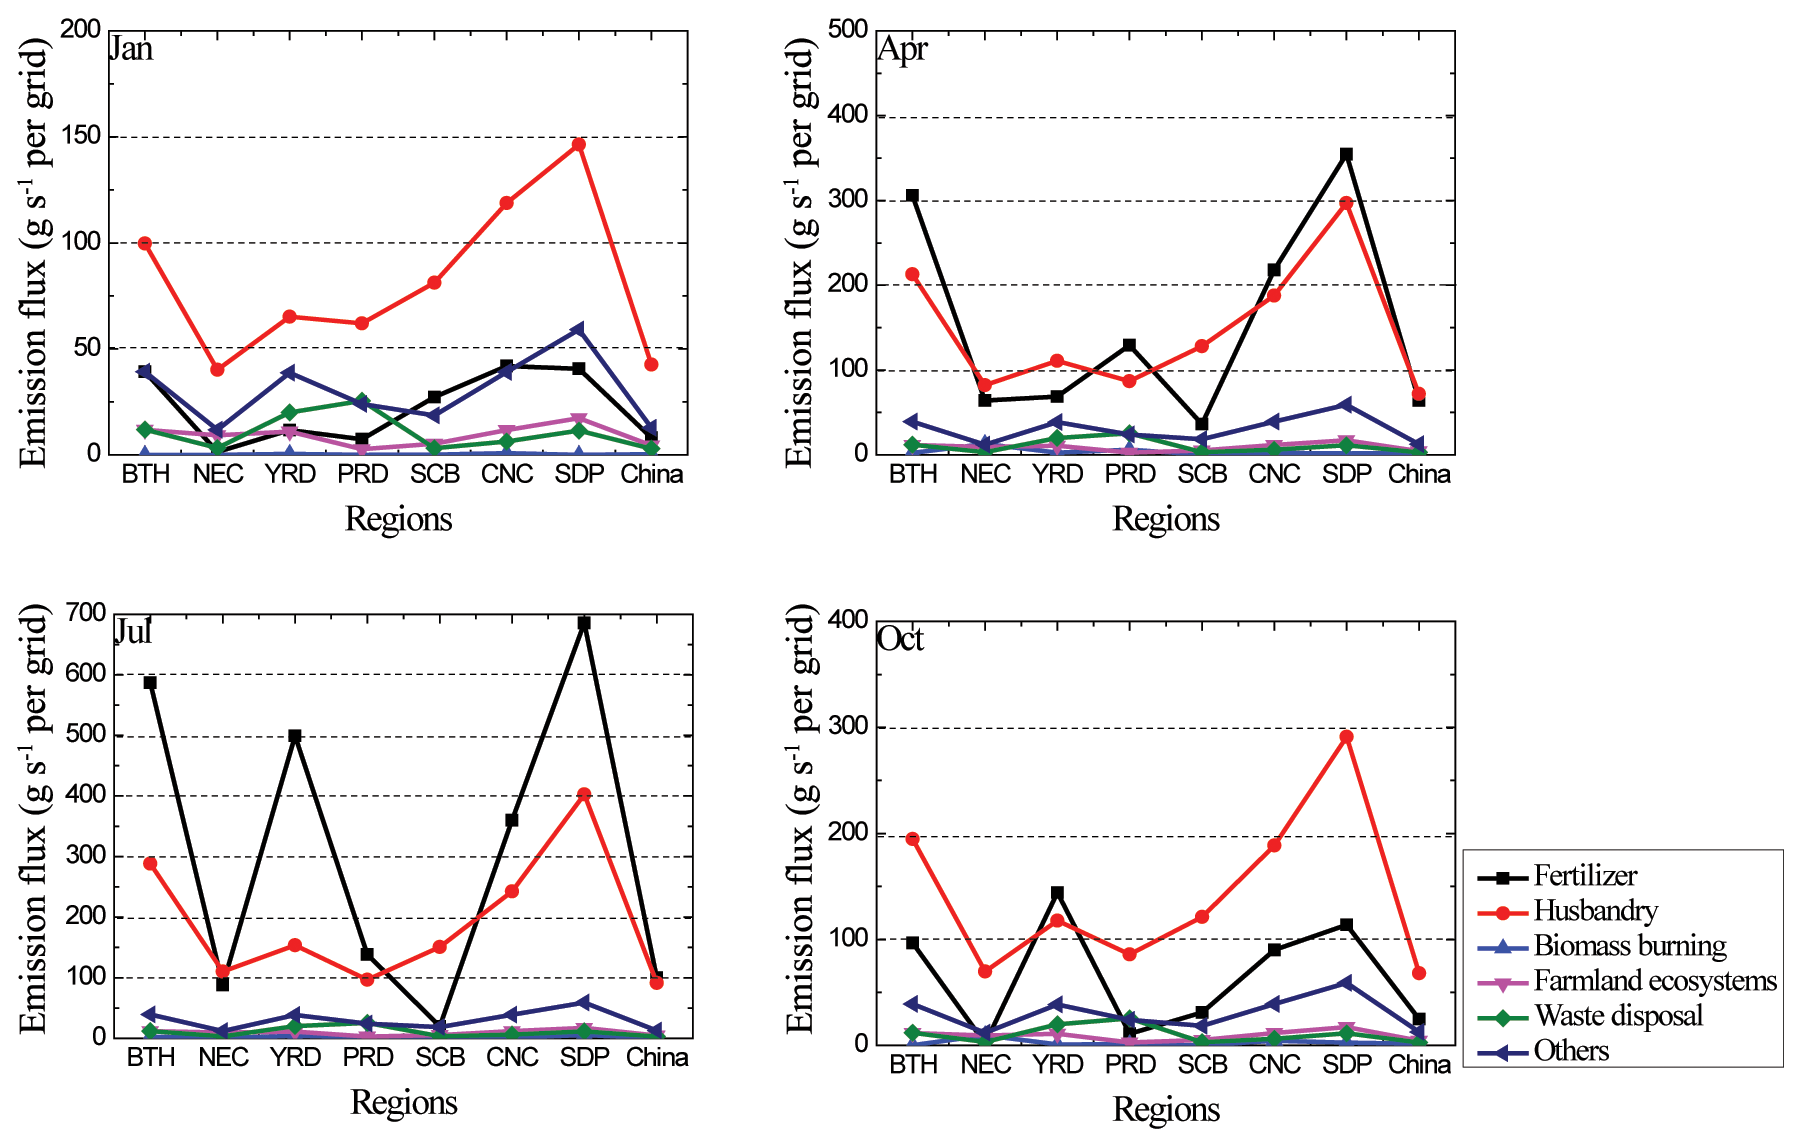
Figure A5The regional average NH3 emission flux (g s−1 per grid) of different agriculture sectors over each region in January, April, July, and October.

Figure A6The percent (%) of different NH3 emission sectors over each region in January, April, July, and October.
All data used in this paper are available upon request from the corresponding author Lingyun Zhu (zhlyun@126.com).
XH and LZ designed and performed this study. MZ co-designed the study and provided a lot of valuable advice about the model setting and operation. ML and YS provided the PKU-NH3 emission inventory.
The authors declare that they have no conflict of interest.
The Chinese National Meteorological Center and the China National Environmental Monitoring Centre are acknowledged for providing observational data sets used in this study.
This research has been supported by the National Key R&D Programs of China (grant no. 2017YFC0209803), the National Natural Science Foundation of China (grant no. 41830109), and the Strategic Priority Research Program of the Chinese Academy of Sciences (grant no. XDA19040204).
This paper was edited by Leiming Zhang and reviewed by two anonymous referees.
Babar, Z. B., Park, J., and Lim, H.: Influence of NH3 on secondary organic aerosols from the ozonolysis and photooxidation of a-pinene in a flow reactor, Atmos. Environ., 164, 71–84, https://doi.org/10.1016/j.atmosenv.2017.05.034, 2017.
Ball, S. M., Hanson, D. R., and Eisele, F. L.: McMurry, P. H. Laboratory studies of particle nucleation: Initial results for H2SO4, H2O, and NH3 vapors, J. Geophys. Res., 104, 23709–23718, https://doi.org/10.1029/1999JD900411, 1999.
Benson, D. R., Yu, J. H., Markovich, A., and Lee, S.-H.: Ternary homogeneous nucleation of H2SO4, NH3, and H2O under conditions relevant to the lower troposphere, Atmos. Chem. Phys., 11, 4755–4766, https://doi.org/10.5194/acp-11-4755-2011, 2011.
Brost, R. A., Delany, A. C., and Huebert, B. J.: Numerical modeling of concentrations and fluxes of HNO3, NH3, and NH4NO3 near the ground, J. Geophys. Res., 93, 7137–7152, https://doi.org/10.1029/JD093iD06p07137, 1988.
Cao, Z., Zhou, X., Ma, Y., Wang, L., Wu, R., Chen, B., and Wang, W.: The concentrations, formations, relationships and modeling of sulfate, nitrate and ammonium (SNA) aerosols over China, Aerosol Air Qual. Res., 17, 84–97, https://doi.org/10.4209/aaqr.2016.01.0020, 2017.
Chang, J.: The role of H2O and NH3 on the formation of NH4NO3 aerosol particles and De-NOx under the corona discharge treatment of combustion flue gases, J. Aerosol Sci., 20, 1087–1090, https://doi.org/10.1016/0021-8502(89)90768-4, 1989.
Chen, Y., Schleicher, N., Cen, K., Liu, X., Yu, Y., Zibat, V., Dietze, V., Fricker, M., Kaminski, U., Chen, Y., Chai, F., and Norra, S.: Evaluation of impact factors on PM2.5 based on long-term chemical components analyses in the megacity Beijing, China, Chemosphere, 155, 234–242, https://doi.org/10.1016/j.chemosphere.2016.04.052, 2016.
Cotton, W., Pielke, R., Walko, G., Liston, G., Tremback, C., Jiang, H., McAnelly, R., Harrington, J., Nicholls, M., Carrio, G., and McFadden, J.: RAMS 2001: current status and future directions, Meteorol, Atmos. Phys., 82, 5–29, https://doi.org/10.1007/s00703-001-0584-9, 2003.
De Foy, B., Lu, Z., and Streets, D. G.: Satellite NO2 retrievals suggest China has exceeded its NOx reduction goals from the twelfth five-year plan, Sci. Rep., 6, 35912, https://doi.org/10.1038/srep35912, 2016.
Eder, B. and Yu S.: A performance evaluation of the 2004 release of Models-3 CMAQ, Atmos. Environ., 40, 4811–4824, https://doi.org/10.1016/j.atmosenv.2005.08.045, 2006.
Fountoukis, C. and Nenes, A.: ISORROPIA II: a computationally efficient thermodynamic equilibrium model for K+–Ca2+–Mg2+––Na+–––Cl−–H2O aerosols, Atmos. Chem. Phys., 7, 4639–4659, https://doi.org/10.5194/acp-7-4639-2007, 2007.
Fu, X., Wang, S. X., Ran, L. M., Pleim, J. E., Cooter, E., Bash, J. O., Benson, V., and Hao, J. M.: Estimating NH3 emissions from agricultural fertilizer application in China using the bi-directional CMAQ model coupled to an agro-ecosystem model, Atmos. Chem. Phys., 15, 6637–6649, https://doi.org/10.5194/acp-15-6637-2015, 2015.
Fu, X., Wang, S., Xing, J., Zhang, X., Wang, T., and Hao, J.: Increasing Ammonia Concentrations Reduce the Effectiveness of Particle Pollution Control Achieved via SO2 and NOx Emissions Reduction in East China, Environ. Sci. Technol., 4, 221–227,https://doi.org/10.1021/acs.estlett.7b00143, 2017.
Huang, X., Song, Y., Li, J., Huo, Q., Cai, X., Zhu, T., Hu, M., and Zhang, H.: A high-resolution ammonia emission inventory in China, Global Biogeochem. Cy., 26, 1030–1044, https://doi.org/10.1029/2011GB004161, 2012.
Kang, Y., Liu, M., Song, Y., Huang, X., Yao, H., Cai, X., Zhang, H., Kang, L., Liu, X., Yan, X., He, H., Zhang, Q., Shao, M., and Zhu, T.: High-resolution ammonia emissions inventories in China from 1980 to 2012, Atmos. Chem. Phys., 16, 2043–2058, https://doi.org/10.5194/acp-16-2043-2016, 2016.
Koo, B., Wilson, G., Morris, R., Dunker, A., and Yarwood, G.: Comparison of Source Apportionment and Sensitivity Analysis in a Particulate Matter Air Quality Model, Environ. Sci. Technol., 43, 6669–6675, 2009.
Kulmala, M., Korhonen, P., Napari, I., Karlsson, A., Berresheim, H., and O'Dowd, C. D.: Aerosol formation during PARFORCE: Ternary nucleation of H2SO4, NH3, and H2O, J. Geophys. Res., 107, 1–11 https://doi.org/10.1029/2001JD000900, 2002.
Kurokawa, J., Ohara, T., Morikawa, T., Hanayama, S., Janssens-Maenhout, G., Fukui, T., Kawashima, K., and Akimoto, H.: Emissions of air pollutants and greenhouse gases over Asian regions during 2000–2008: Regional Emission inventory in ASia (REAS) version 2, Atmos. Chem. Phys., 13, 11019–11058, https://doi.org/10.5194/acp-13-11019-2013, 2013.
Lai, S., Zhao, Y., Ding, A., Zhang, Y., Song, T., Zheng, J., Ho, K. F., Lee, S., and Zhong, L.: Characterization of PM2.5 and the major chemical components during a 1-year campaign in rural Guangzhou, Southern China, Atmos. Res., 167, 208–215, https://doi.org/10.1016/j.atmosres.2015.08.007, 2016.
Lei, Y., Zhang, Q., He, K. B., and Streets, D. G.: Primary anthropogenic aerosol emission trends for China, 1990–2005, Atmos. Chem. Phys., 11, 931–954, https://doi.org/10.5194/acp-11-931-2011, 2011.
Liu, M., Huang, X., Song, Y., Tang, J., Cao, J., Zhang, X., Zhang, Q., Wang, S., Xu, T., Kang, L., Cai, X., Zhang, H., Yang, F., Wang, H., Yu, J., Lau, A., He, L., Huang, X., Duan, L., Ding, A., Xue, L., Gao, J., Liu, B., and Zhu, T.: Ammonia emission control in China would mitigate haze pollution and nitrogen deposition, but worsen acid rain, P. Natl. Acad. Sci. USA., 116, 7760–7765, https://doi.org/10.1073/pnas.1814880116, 2019.
Lu, Z., Zhang, Q., and Streets, D. G.: Sulfur dioxide and primary carbonaceous aerosol emissions in China and India, 1996–2010, Atmos. Chem. Phys., 11, 9839–9864, https://doi.org/10.5194/acp-11-9839-2011, 2011.
Mathur, R., Yu, S., Kang, D., and Schere, K.: Assessment of the winter-time performance of developmental particulate matter forecasts with the Eta-CMAQ modeling system, J. Geophys. Res., 113, D02303, https://doi.org/10.1029/2007JD008580, 2008.
McMurry, P. H., Takano, H., and Anderson, G. R.: Study of the ammonia (gas)-sulfuric acid (aerosol) reaction rate, Environ. Sci. Technol., 17, 347–352, https://doi.org/10.1021/es00112a008, 1983.
Pan, Y., Tian, S., Zhao, Y., Zhang, L., Zhu, X., Gao, J., Huang, W., Zhou, Y., Song, Y., Zhang, Q., and Wang, Y.: Identifying ammonia hotspots in China using a national observation network, Environ. Sci. Technol., 52, 3926–3934 https://doi.org/10.1021/acs.est.7b05235, 2018.
Paulot, F., Jacob, D. J., Pinder, R. W., Bash, J. O., Travis, K., and Henze, D. K.: Ammonia emissions in the United States, European Union, and China derived by high-resolution inversion of ammonium wet deposition data: Interpretation with a new agricultural emissions inventory (MASAGE_NH3), J. Geophys. Res., 119, 4343–4364, https://doi.org/10.1002/2013JD021130, 2014.
Quan, J., Tie, X., Zhang, Q., Liu, Q., Li, X., Gao, Y., and Zhao, D.: Characteristics of heavy aerosol pollution during the 2012–2013 winter in Beijing, China, Atmos. Environ., 88, 83–89, https://doi.org/10.1016/j.atmosenv.2014.01.058, 2014.
Ren, H., Zhang, L., and Hong, X.: Politic recommendations on strengthening reduction of air pollutant emissions in China, Environ. Sustain. Dev., 39, 4–13, 2014 (in Chinese).
Tanner, R. L., Leaderer, B. P., and Spengler, J. D., Acidity of atmospheric aerosols, Environ. Sci. Technol., 15, 1150–1153, https://doi.org/10.1021/es00092a003, 1981.
Tao, M., Chen, L., Xiong, X., Zhang, M., Ma, P., Tao, J., and Wang, Z.: Formation process of the widespread extreme haze pollution over northern China in January 2013: Implications for regional air quality and climate, Atmos. Environ., 98, 417–425, https://doi.org/10.1016/j.atmosenv.2014.09.026, 2014.
van der Werf, G. R., Randerson, J. T., Giglio, L., Collatz, G. J., Mu, M., Kasibhatla, P. S., Morton, D. C., DeFries, R. S., Jin, Y., and van Leeuwen, T. T.: Global fire emissions and the contribution of deforestation, savanna, forest, agricultural, and peat fires (1997–2009), Atmos. Chem. Phys., 10, 11707–11735, https://doi.org/10.5194/acp-10-11707-2010, 2010.
Wang, G., Zhang, R., Gomez, M. E., Yang, L., Levy Zamora, M., Hu, M., Lin, Y., Peng, J., Guo, S., Meng, J., Li, J., Cheng, C., Hu, T., Ren, Y., Wang, Y., Gao, J., Cao, J., An, Z., Zhou, W., Li, G., Wang, J., Tian, P., Marrero-Ortiz, W., Secrest, J., Du, Z., Zheng, J., Shang, D., Zeng, L., Shao, M., Wang, W., Huang, Y., Wang, Y., Zhu, Y., Li, Y., Hu, J., Pan, B., Cai, L., Cheng, Y., Ji, Y., Zhang, F., Rosenfeld, D., Liss, P. S., Duce, R. A., Kolb, C. E., and Molina, M. J.: Persistent sulfate formation from London Fog to Chinese haze, P. Natl. Acad. Sci. USA., 113, 13630–13635, https://doi.org/10.1073/pnas.1616540113, 2016.
Wang, H., Qiao, L., Lou, S., Zhou, M., Ding, A., Huang, H., Chen, J., Wang, Q., Tao, S., Chen, C., Li, L., and Huang, C.: Chemical composition of PM2.5 and meteorological impact among three years in urban Shanghai, China, J. Clean. Prod, 112, 1302–1311, https://doi.org/10.1016/j.jclepro.2015.04.099, 2016.
Wang, S., Xing, J., Jang, C., Zhu, Y., Fu, J., and Hao, J.: Impact Assessment of Ammonia Emissions on Inorganic Aerosols in East China Using Response Surface Modeling Technique, Environ. Sci. Technol., 45, 9293–9300, https://doi.org/10.1021/es2022347, 2011.
Wang, S., Zhang, Q., Martin, R.V., Philip, S., Liu, F., Li, M., Jiang, X., and He, K.: Satellite measurements oversee China's sulfur dioxide emission reductions from coal-fired power plants, Environ. Res. Lett., 10, 114015, https://doi.org/10.1088/1748-9326/10/11/114015, 2015.
Wang, Z., Chien, C., and Tonnesen, G.: Development of a tagged species source apportionment algorithm to characterize three-dimensional transport and transformation of precursors and secondary pollutants, J. Geophys. Res., 114, D21206, https://doi.org/10.1029/2008JD010846, 2009.
Whitten, G., Heo, G., Kimura, Y., McDonald-Buller, E., Allen, D., Carter, W. P. L., and Yarwwod, G.: A new condensed toluene mechanism for Carbon Bond: CB05-TU, Atmos. Environ., 44, 5346–5355, https://doi.org/10.1016/j.atmosenv.2009.12.029, 2010.
Wu, S., Hu, J., Zhang, Y., and Aneja, V. P.: Modeling atmospheric transport and fate of ammonia in North Carolina-Part II: Effect of ammonia emissions on fine particulate matter formation, Atmos. Environ., 42, 3437–3451, https://doi.org/10.1016/j.atmosenv.2007.04.022, 2008.
Xia, Y., Zhao, Y., and Nielsen, C. P.: Benefits of China's efforts in gaseous pollutant control indicated by the bottom-up emissions and satellite observations 2000-2014, Atmos. Environ., 136, 43–53, https://doi.org/10.1016/j.atmosenv.2016.04.013, 2016.
Xu, P., Liao, Y. J., Lin, Y. H., Zhao, C. X., Yan, C. H., Cao, M. N., Wang, G. S., and Luan, S. J.: High-resolution inventory of ammonia emissions from agricultural fertilizer in China from 1978 to 2008, Atmos. Chem. Phys., 16, 1207–1218, https://doi.org/10.5194/acp-16-1207-2016, 2016.
Xu, P., Koloutsou-Vakakis, S., Rood, M., and Luan, S.: Projections of NH3 emissions from manure generated by livestock production in China to 2030 under six mitigation scenarios, Sci. Total Environ., 31, 78–86, https://doi.org/10.1016/j.scitotenv.2017.06.258, 2017.
Yang, Y., Wilkinson, J., and Russell. A.: Fast, Direct Sensitivity Analysis of Multi-Dimensional Photochemical Models, Environ. Sci. Technol., 31, 2859–2868, https://doi.org/10.1021/es970117w, 1997.
Zhang, J. K., Sun, Y., Liu, Z. R., Ji, D. S., Hu, B., Liu, Q., and Wang, Y. S.: Characterization of submicron aerosols during a month of serious pollution in Beijing, 2013, Atmos. Chem. Phys., 14, 2887–2903, https://doi.org/10.5194/acp-14-2887-2014, 2014.
Zhang, K., Ma, Y., Xin, J., Liu, Z., Ma, Y., Gao, D., Wu, J., Zhang, W., Wang, Y., and Shen, P.: The aerosol optical properties and PM2.5 components over the world's largest industrial zone in Tangshan, North China, Atmos. Res., 201, 226–234, https://doi.org/10.1016/j.atmosres.2017.10.025, 2018.
Zhang, L., Chen, Y., Zhao, Y., Henze, D. K., Zhu, L., Song, Y., Paulot, F., Liu, X., Pan, Y., Lin, Y., and Huang, B.: Agricultural ammonia emissions in China: reconciling bottom-up and top-down estimates, Atmos. Chem. Phys., 18, 339–355, https://doi.org/10.5194/acp-18-339-2018, 2018.
Zhang, X. Y., Wang, Y. Q., Niu, T., Zhang, X. C., Gong, S. L., Zhang, Y. M., and Sun, J. Y.: Atmospheric aerosol compositions in China: spatial/temporal variability, chemical signature, regional haze distribution and comparisons with global aerosols, Atmos. Chem. Phys., 12, 779–799, https://doi.org/10.5194/acp-12-779-2012, 2012.
Zhao, Z., Bai, Z., Winiwarter, W., Kiesewetter, G., Heyes, C., and Ma, L.: Mitigating ammonia emission from agriculture reduces PM2.5 pollution in the Hai River Basin in China, Sci. Total Environ., 609, 1152–1160, https://doi.org/10.1016/j.scitotenv.2017.07.240, 2017.
Zhao, X. J., Zhao, P. S., Xu, J., Meng, W., Pu, W. W., Dong, F., He, D., and Shi, Q. F.: Analysis of a winter regional haze event and its formation mechanism in the North China Plain, Atmos. Chem. Phys., 13, 5685–5696, https://doi.org/10.5194/acp-13-5685-2013, 2013.
Zheng, B., Tong, D., Li, M., Liu, F., Hong, C., Geng, G., Li, H., Li, X., Peng, L., Qi, J., Yan, L., Zhang, Y., Zhao, H., Zheng, Y., He, K., and Zhang, Q.: Trends in China's anthropogenic emissions since 2010 as the consequence of clean air actions, Atmos. Chem. Phys., 18, 14095–14111, https://doi.org/10.5194/acp-18-14095-2018, 2018.
Zhou, F., Ciais, P., Hayashi, K., Galloway, J., Kim, D., Yang, L., Li, S., Liu, B., Shang, Z., and Gao, S.: Re-estimating NH3 emissions from Chinese cropland by a new nonlinear model, Environ. Sci. Technol., 50, 564–572, https://doi.org/10.1021/acs.est.5b03156, 2016.
Zhou, Y., Cheng, S., Lang, J., Chen, D., Zhao, B., Liu, C., Xu, R., and Li, T., A comprehensive ammonia emission inventory with high-resolution and its evaluation in the Beijing–Tianjin–Hebei (BTH) region, China, Atmos. Environ., 106, 305–317, https://doi.org/10.1016/j.atmosenv.2015.01.069, 2015.