the Creative Commons Attribution 4.0 License.
the Creative Commons Attribution 4.0 License.
 | 20 Aug 2020
Source characterization of volatile organic compounds measured by proton-transfer-reaction time-of-flight mass spectrometers in Delhi, India
Liwei Wang
Jay G. Slowik
Nidhi Tripathi
Deepika Bhattu
Pragati Rai
Varun Kumar
Pawan Vats
Rangu Satish
Urs Baltensperger
Dilip Ganguly
Neeraj Rastogi
Lokesh K. Sahu
André S. H. Prévôt
Characteristics and sources of volatile organic compounds (VOCs) were investigated with highly time-resolved simultaneous measurements by two proton-transfer-reaction time-of-flight mass spectrometers (PTR-ToF-MS) at an urban and a suburban site in New Delhi, India, from January to March 2018. During the measurement period, high mixing ratios of VOCs and trace gases were observed, with high nocturnal mixing ratios and strong day–night variations. The positive matrix factorization (PMF) receptor model was applied separately to the two sites, and six major factors of VOCs were identified at both sites, i.e., two factors related to traffic emissions, two to solid fuel combustion, and two secondary factors. At the urban site, traffic-related emissions comprising mostly mono-aromatic compounds were the dominant sources, contributing 56.6 % of the total mixing ratio, compared to 36.0 % at the suburban site. Emissions from various solid fuel combustion processes, particularly in the night, were identified as a significant source of aromatics, phenols and furans at both sites. The secondary factors accounted for 15.9 % of the total VOC concentration at the urban site and for 33.6 % at the suburban site. They were dominated by oxygenated VOCs and exhibited substantially higher contributions during daytime.
- Article
(4845 KB) - Full-text XML
-
Supplement
(1374 KB) - BibTeX
- EndNote


Volatile organic compounds (VOCs) are important trace gas constituents in the troposphere, impacting local and regional air quality, human health, and climate both directly and indirectly (IPCC, 2013). With the participation of NOx, oxidation of VOCs leads to the formation of tropospheric O3, causing regional photochemical smog (Atkinson, 2000; de Gouw et al., 2005). The chemical transformation of VOCs forms less-volatile compounds and can contribute to gas-to-particle partitioning either by new particle formation or condensation on existing particles (Hallquist et al., 2009; Ehn et al., 2014). In addition, many VOCs are toxic, such as aromatic compounds, and exposure to large amounts of VOCs may adversely affect human health, including acute and chronic effects on different systems and organs, and even cancer (Kampa and Castanas, 2008; Nurmatov et al., 2013).
VOCs originate from both natural and anthropogenic sources. Biogenic VOCs (BVOCs), mainly emitted by plants, are regarded as the largest source of VOCs globally (Atkinson and Arey, 2003; Hallquist et al., 2009). However, in urban areas, anthropogenic VOCs can be dominant (Borbon et al., 2013). Vehicular exhaust emissions have long been regarded as the dominant source of VOCs in many urban areas. Many of these compounds are reactive and thus contribute significantly to urban O3 pollution, photochemical smog, and secondary organic aerosol (SOA) formation (Fraser et al., 1998; Derwent et al., 2010; Müller et al., 2012). Biomass burning is considered the second largest source of VOCs worldwide (Crutzen and Andreae, 1990) and could be a major VOC source in some urban areas during biomass-burning events (Karl et al., 2007; Yokelson et al., 2009; Baudic et al., 2016; Languille et al., 2019). Compared to vehicular emissions, biomass-burning sources emit more oxygenated and high molecular-weight VOCs such as furans and phenols. Due to high atmospheric reactivity and higher SOA yield, these compounds can also contribute substantially to SOA formation (Sekimoto et al., 2018; Koss et al., 2018).
Air pollution in southern Asia has attracted more and more attention in recent years. This region is regarded as one of the most polluted regions in the world (e.g., Monks et al., 2009). Due to rapid urbanization and the lack of widespread advanced pollution control technologies in the industrial, energy, and transportation sectors (Mahata et al., 2018), air pollution has become an increasingly important issue across the region, particularly in large urban areas. The increasing emissions of air pollutants not only impact the local/regional air quality and human health, but also influence distant and pristine areas through transport (Bonasoni et al., 2010; Lawrence and Lelieveld, 2010; Mahata et al., 2018). Delhi, the capital city of India, with a population of 18.98 million (2012) people, is facing an air quality problem ranked as the worst among 1600 major cities in the world (WHO, 2014). The critical air quality problems have left India with high death rates from chronic obstructive pulmonary disease (COPD) and respiratory disease, e.g., asthma (WHO, 2014). Despite the severe air pollution in Delhi, information on pollution levels as well as an emission inventory of VOCs and their sources in Delhi are still lacking (Monks et al., 2009; Kumar et al., 2015). A few studies on BTEX (i.e., benzene, toluene, ethylbenzene, and xylene) in Delhi reported that vehicular emissions could be the dominant source in Delhi (Srivastava et al., 2005; Hoque et al., 2008). Several studies also identified motor vehicle emissions as a significant source of particulate matter (PM), with high contributions from solid fuel combustion and industrial emissions (Sahu et al., 2011; Sharma et al., 2014; Kumar et al., 2015). These studies reveal the importance of local anthropogenic sources. However, since previous studies mainly focused on certain families of VOCs or a few VOC species, a comprehensive investigation of the VOC pollution levels, specific emission sources, as well as their roles in the local tropospheric chemistry has not been reported previously. VOC source apportionment studies have been conducted only in a few Indian cities. For example, Srivastava studied 23 VOC compounds in Mumbai and pointed out the lack of evaporative and oceanic emissions (Srivastava, 2004). Sahu and Saxena (2015) studied 15 VOC species measured by proton-transfer-reaction time-of-flight mass spectrometers (PTR-ToF-MS) in urban Ahmedabad in winter. A recent study on 32 VOCs at Mohali (a suburban site in the northwestern Indo-Gangetic Plain) identified biofuel usage, biomass burning, and vehicular emissions as important primary sources and pointed out the lack of present emission inventories (Pallavi et al., 2019).
In this study, we report simultaneous online measurements of VOCs using two PTR-ToF-MS instruments at an urban and a suburban site of Delhi, India. The levels, composition, and source characteristics of different VOCs (158 ions at IITD and 90 ions at MRIU) were analyzed with the aid of the positive matrix factorization (PMF) model. Spatial and temporal comparisons between the two sites are discussed for both the sources and selected ions.
2.1 Measurement sites
Figure 1 shows the studied region and locations of the two measurement sites. The measurements were conducted from 18 January to 10 March 2018 at an urban site at the Indian Institute of Technology (IITD), New Delhi, and from 16 January to 8 March 2018 at a suburban site at Manav Rachna International University (MRIU), Faridabad (Fig. 1).
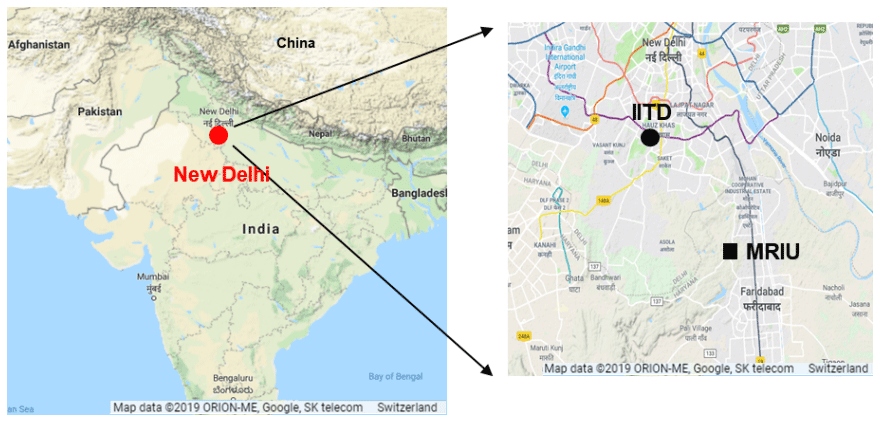
Figure 1Maps of the study region and the two sampling sites (from ©Google Maps). The black circle denotes the urban site at IITD and the black square the suburban site at MRIU.
At the urban site (28∘33′ N, 77∘12′ E), the inlet system was installed on the rooftop (∼20 m above the ground) of block VI (a four-story building), Centre for Atmospheric Sciences, on the campus of IITD (Gani et al., 2019; Rai et al., 2020). The IITD campus is located in the southern part of the city center and is surrounded by educational, commercial, and residential districts. The study site is approximately 80 m north of a busy street and is surrounded by several streets inside the campus as well. Thus, in addition to vehicular emissions, commercial and residential activities may also produce VOC emissions in the immediate vicinity. The sampling line of the PTR-ToF-MS was approximately 1.5 m long, and the inlet consisted of polyether ether ketone (PEEK) tubing, with an inner diameter of 0.075 mm.
The other measurement site, at MRIU, was located in a relatively open area in suburban Delhi, about 20 km southeast of the IITD site. Besides, the northeastern territory of MRIU is of a slightly higher elevation compared to the sampling site, as shown in Fig. 1. The suburban site is located inside a big campus, and it is surrounded by several small parks, with only a few narrow roads nearby. Although the site is not far from the main road, the traffic load and other anthropogenic activities nearby may be much less than that at IITD. The instruments were located on the first floor of a teaching building on the campus of MRIU. A similar PEEK inlet to that at IITD was used, with the sampling line approximately 2 m long.
2.2 Online instruments
Data collected in this study included the mixing ratios of VOCs, NOx, CO, and meteorological parameters. The involved monitors, analyzers, and sensors are described in detail in the following. Two PTR-ToF-MS 8000 (Ionicon Analytical GmbH, Innsbruck, Austria) were simultaneously deployed at the two sites. At both sites, the PTR-ToF-MS were operated in the H3O+ mode, where the sampled VOCs are protonated via non-dissociative proton transfer from H3O+ ions (Eq. 1):
The PTR-ToF-MS measure non-methane organic gases (NMOG) with a proton affinity higher than water, i.e., most of the common VOCs such as carbonyls, acids, and aromatic hydrocarbons, as well as alkanes with more than eight carbons and alkenes with more than two carbons. A detailed description of the instrument is found in Jordan et al. (2009) and Graus et al. (2010). For both sites, the time resolution was set to 30 s and the drift tube voltage was set to 600 V, with a drift temperature of 60 ∘C and a pressure of 2.2–2.3 mbar, resulting in a reduced electric field (E∕N) value of about 130 Td. Therefore, a similar fragmentation pattern is expected. Calibrations were performed twice at the IITD site and three times at the MRIU site by dynamic dilution of VOCs using a certified 15-compound gas standard (Ionimed Analytik GmbH, Austria, at ∼1 ppmv, with a stated accuracy better than 8 %). The calibration components were methanol, acetonitrile, acetaldehyde, ethanol, acrolein, acetone, isoprene, crotonaldehyde, 2-butanone, benzene, toluene, o-xylene, chlorobenzene, α-pinene, and 1, 2-dichlorobenzene. The background measurements were performed using a dry zero air cylinder every 2 weeks. The raw data were processed using the Tofware post-processing software (version 2.5.11, TOFWERK AG, Thun, Switzerland) with the PTR module as distributed by Ionicon Analytik GmbH (Innsbruck, Austria) running in the Igor Pro 6.37 environment (Wavemetrics Inc., Lake Oswego, OR, USA). Volume mixing ratios (in ppbv) were calculated based on the method described by de Gouw and Warneke (2007), and the literature reaction rates (k) of the ion with the H3O+ ion were applied when available (Cappellin et al., 2012). For ions where the reaction rate had not been measured, a rate constant of cm3 s−1 was assumed.
The mixing ratio of NOx was measured by chemiluminescence using the Serinus 40 Oxides of Nitrogen analyzer (Ecotech) at IITD and a Model 42i (TEC, USA) at MRIU. The CO mixing ratio was analyzed with the infrared radiation absorption method using a CO Analyzer (Serinus 30, Ecotech) at IITD and a Model 48i (TEC, USA) at MRIU.
2.3 Source apportionment
Source apportionment of VOCs was performed using the PMF receptor model (Paatero and Tapper, 1994), which represents the measured PTR-ToF-MS mass spectral time series as a linear combination of static factor profiles (characteristic of particular sources and/or atmospheric processes) and their time-dependent concentrations. This can be represented in matrix notation as follows:
where X, G, F, and E are matrices corresponding to the measured mass spectral time series (time × m∕z), factor time series (time × factor), factor profiles (factor × m∕z), and model residuals (time × m∕z), respectively. In this study, we used a total of 158 ions at IITD and 90 ions at MRIU measured by the PTR-ToF-MS (lists of ions utilized are shown in Tables S1 and S2 in the Supplement). Equation (2) is solved by minimizing the objective function, Q (Eq. 3), using a weighted least-squares algorithm:
Here, eij is the residuals (elements of E) and sij represents the corresponding measurement uncertainty.
As recommended by Paatero (2003), ions with a signal-to-noise ratio (SNR) lower than 0.2 were excluded from the input matrix and ions with a signal-to-noise ratio (SNR) between 0.2 and 2 were down-weighted by increasing their uncertainties by a factor of 2. In addition, in this study, a few ions such as methanol, acetaldehyde, acetone, and acetic acid with mixing ratios 3–4 times higher than the other ions were excluded from the input. Due to extremely high SNR compared to other compounds, inclusion of these ions in PMF leads to solutions where only these ions are well explained, and useful source information is not retrieved.
PMF was implemented as the Multilinear Engine (ME-2) (Paatero, 1999), with the Source Finder (SoFi) toolkit for Igor Pro (Wavemetrics, Inc., Portland; Canonaco et al., 2013) used for model configuration and post-analysis. As different combinations of G and F can yield mathematically similar solutions (i.e., similar Q), ME-2 enables intelligent rotational control to achieve reasonable solutions by involving constraints and external data. In this study, constraints were applied by combining a scalar a (usually between 0 and 1) and a reference profile (Canonaco et al., 2013). The a value determines the extent to which the resolved factors f′ and g′ are allowed to vary from the input reference elements of f and g according to Eq. (4):
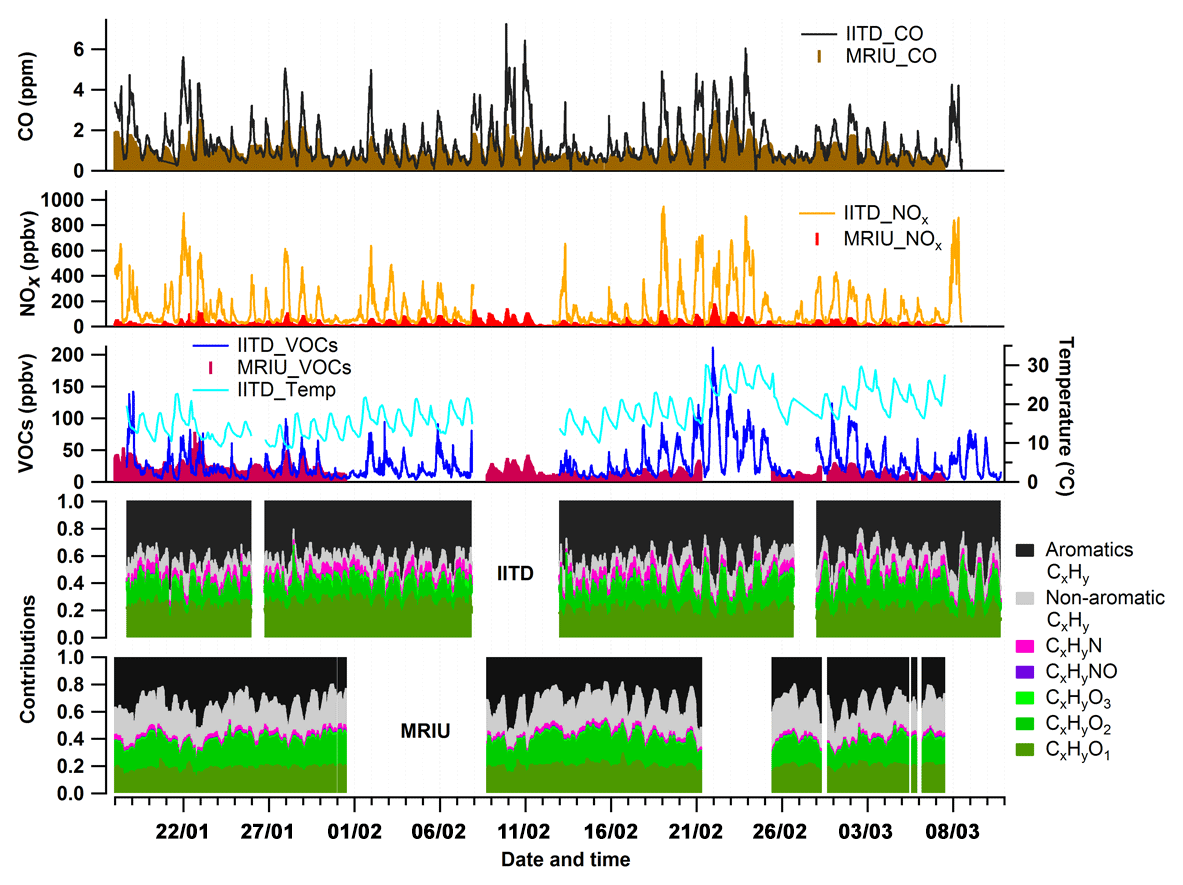
Figure 2Temporal variations of CO, NOx, analyzed VOC mixing ratios and temperature as well as the contributions of seven VOC families at the two sites.
3.1 Temporal and spatial variation
Figure 2 presents time series of the mixing ratios of CO and NOx as well as of the sum of all VOCs analyzed in the PMF model and temperature at the two sites. The fractional composition of VOCs in terms of the chemical formula-derived families is included as well. The mean mixing ratios of CO were 1.29 and 0.95 ppmv at IITD and MRIU, respectively. The average mixing ratio of NOx at IITD was 148.0 ppbv, 5 times higher than at MRIU (29.6 ppbv). Similarly, the summed VOC mixing ratio (i.e., all the ions included in PMF analysis; see Tables S1 and S2) was 27.6 ppbv at IITD, significantly higher than at MRIU (19.4 ppbv). The ambient temperature showed large variations during the campaign with an overall increasing trend after 21 February. Thus, the whole study period can be divided into two separate periods of relatively cold and warm temperatures. Figure S1 shows the box–whisker plots of temperature during the two periods at the two sites. As shown in Fig. S1, the average temperature was 17 ∘C during the cold period and 23 ∘C during the warm period at IITD. At MRIU, the average temperature was very similar when VOCs were measured, with the cold days averaging 16 ∘C and the warm periods 23 ∘C. During the warm period, the mean temperature reached the minimum at 06:00 LT, 1 h earlier than in the cold period. These differences in temperature along with other meteorological parameters are expected to have an impact on the emission profiles (e.g., Sekimoto et al., 2018) as well as the dilution and chemical transformation processes.
To investigate temporal and site-dependent changes in the relative composition of the VOCs, the measured signals of different ions were classified into seven families based on their identified chemical formulas, namely aromatic CxHy, non-aromatic CxHy, CxHyO1, CxHyO2, CxHyO3, CxHyN, and CxHyNOz compounds. Aromatic CxHy were classified due to their low H:C ratio, and oxidized aromatics are classified into the three CxHyOz families. Aromatic CxHy were the largest fraction at both sites, constituting about 45.4 % at IITD (averaged 13.9 ppbv) and 34.3 % at MRIU (averaged 7.0 ppbv). The high fractions of aromatic compounds indicate strong influences from anthropogenic emissions, mainly vehicle exhaust, at both sites. At IITD, the contributions of CxHyO1 (21.9 %, 5.6 ppbv on average) and CxHyO2 (13.6 %, 3.6 ppbv) were also significant, followed by non-aromatic CxHy (11.3 %, 3.5 ppbv), CxHyN (5.2 %, 1.2 ppbv), CxHyO3 (2.3 %, 0.6 ppbv), and CxHyNO (0.4 %, 0.5 ppbv). At MRIU, the VOC family composition was similar, with the exception of a higher fraction and concentration of non-aromatic CxHy (23.2 %, 4.2 ppbv), which was dominated by high C5H8 and C6H10 in the daytime compared to that at IITD. Besides, the averaged mixing ratios of the majority of the families were lower at MRIU than at IITD, except for non-aromatic CxHy and CxHyO2. The averaged mixing ratios of CxHyO1, CxHyO2, CxHyN, CxHyO3, and CxHyNO were 3.6, 3.4, 0.5, 0.2, and 0.09 ppbv, respectively.
Owing to the variation of planetary boundary layer height (PBLH) as well as emission sources, temperature, and solar radiation, the time series of the mixing ratios of VOCs, NOx, and CO exhibited substantial differences between day and night periods. Figure S2 in the Supplement shows the diurnal patterns of NOx, CO, and different VOC families at both sites. The nocturnal mixing ratios of most of the VOC families, as well as those of CO and NOx, were higher than during daytime, with much greater diurnal variation at IITD than at MRIU. The spatial difference in the diurnal variation may be due to a lower influence of local emissions at the suburban MRIU site because of lower population density and fuel consumption. In addition, the relative proportions of the VOC families varied over time, indicating different emission patterns and oxidation chemistry. For instance, substantial contributions and concentrations of aromatic compounds and CxHyNO1 were observed at night at IITD, indicating strong anthropogenic emissions in the urban area, such as traffic-related emissions and solid fuel combustion. Meanwhile, higher daytime contributions were found for the CxHyO1 and CxHyO2 families, and in particular the CxHyO3 family peaked around midday at IITD, indicating tropospheric aging and secondary formation during daytime. Moreover, the nocturnal concentrations of all the gas-phase species were higher at IITD compared to MRIU. During daytime, however, the concentrations of non-aromatic CxHy, CxHyO2, as well as CO at MRIU were higher compared to those at IITD.
3.2 VOC source apportionment
3.2.1 Solution selection
We evaluated unconstrained solutions from 4 to 11 factors individually for both sites, and solutions were selected based on interpretation of the spectra, reference information from the emission inventory, correlation of VOC factors with ancillary measurements, and mathematical diagnostics describing PMF performance. A six-factor solution was selected as the best representation of the data measured at both sites, which includes two traffic factors, two solid fuel combustion factors, and two secondary factors. An industrial factor is not presented in the results, as marker compounds typically originating from industrial emissions are either not measured (such as halogen compounds) or not included in this PMF analysis (such as methanol and acetone as described in Sect. 2.3). In terms of PMF performance, the Q∕Qexp did not show any step change with increasing factor number (Fig. S3). Solutions with less than six factors failed to provide reasonably separated sources, while solutions with more factors led to additional traffic or solid fuel combustion factors that did not improve the interpretability of the results. These additional factors were likely the result of minor variations across discrete instances of a given source (e.g., vehicle-to-vehicle variations in VOC composition) and slight differences in reactive history.
At IITD, the concentrations of several aromatics were very high, being 10–20 times higher than those of the major phenols and over 100 times higher than for the compounds with the lowest concentration. As a result, initial PMF results were over-weighted towards explaining aromatic variability. Thus, aromatics were apportioned to all the resolved factors, including factors that otherwise appear secondary and where such high attribution is not reasonable. To guide this mathematical artifact and the model towards environmentally reasonable results, constraints were applied to the IITD secondary factors as follows. First, PMF was performed with a new input matrix excluding the most abundant aromatic ions, namely C6H6H+, C7H8H+, C8H10H+, and C9H12H+ (PMF results with the new input are shown in Fig. S4). This yielded a reasonable five-factor solution from which the spectra of the two secondary factors were selected for use as reference profiles in the original dataset. PMF was then executed again on the full dataset (i.e., all 158 ions including the aromatics), with constraints applied to the two secondary factors using the a-value approach. Since we obtained the reference from the same dataset, the a value was set to a smaller range than the usual case. Here, solutions with the a value ranging from 0.1 to 0.3 were evaluated, and no significant differences in terms of the spectra and temporal variations were observed among all the results. In the following analysis, the solution with an a value =0.1 for both factors was selected as the IITD result, and the result with an a value =0.3 is presented in Fig. S5.
At MRIU, the lower aromatic concentrations meant that even the unconstrained PMF did not apportion significant aromatic mass to resolved secondary factors. For consistency, we also tested the constraint-based method described above, but the two methods did not yield significant differences at MRIU (see Fig. S6). Therefore, at MRIU the unconstrained solution was selected for further interpretation.
3.2.2 Factor identification
Figures 3 and 4 show the factor profiles (a), time series (b), and diurnal patterns (c) of the selected PMF solution at IITD and MRIU, respectively. In the following, we present a detailed discussion of the factor characteristics at IITD. The MRIU factors are qualitatively similar, and therefore a detailed discussion is not repeated, but rather a site comparison is presented in Sect. 3.3.
The first two factors are related to vehicle emissions and are denoted Traffic1 and Traffic2. Both are enhanced during the night and are relatively low during daytime. The mass spectra of both Traffic1 and Traffic2 are dominated by aromatic CxHy compounds, namely C6H6 (m∕z 79.054), C7H8 (m∕z 93.070), C8H10 (m∕z 107.086), C9H12 (m∕z 121.101), and C10H14 (m∕z 135.117). These ions are tentatively attributed to benzene, toluene, C8 aromatics, C9 aromatics, and C10 aromatics, which are well-studied markers for vehicular emissions (Yao et al., 2015; Cao et al., 2016). While Traffic1 is mostly composed of pure aromatics, Traffic2 includes relatively high contributions from non-aromatic hydrocarbons and some oxygenated compounds. As shown in Fig. 3b, both traffic factors exhibit temporal variations similar to NOx, which originates mainly from vehicle emissions in an urban area. The correlation of Traffic 2 with NOx (R2=0.76) is better than either Traffic1 with NOx (R2=0.55) or their sum (Traffic1 + Traffic2) with NOx (R2=0.67). To alleviate urban traffic congestion, heavy-duty vehicles are banned in Delhi during the rush hours and daytime (07:00–21:00 LT). As a result, most heavy-duty traffic in Delhi occurs overnight rather than during daytime. This difference in traffic patterns corresponds to the temporal differences in Traffic1 and Traffic2. As shown in Fig. S7, the ratio of Traffic2 to Traffic1 is very low during the daytime and starts to increase slightly from 16:00 LT. Although both Traffic1 and Traffic2 are high during the night, with their maximum concentrations around 21:00 LT, the Traffic2 ∕ Traffic1 ratio is as low as 0.6 at that time. The ratio increases overnight with a sharp increase during the early morning, reaching a maximum value of 1.4 at 07:00 LT, suggesting that Traffic1 is the dominant traffic source both day and night. This can be explained as cold-start emissions from gasoline vehicles emit high amounts of VOCs, while heavy-duty vehicles contribute much less to VOCs but more to BC and NOx (Platt et al., 2017). Further, the spectrum of Traffic2 is characterized by high fractions of high-mass aromatic compounds. For instance, the ratio of C8∕C7 aromatics is tripled in Traffic2 compared to that in Traffic1, which is similar to the ratio of the emission factors from previous studies (3.5 times, Gentner et al., 2013). Since the vehicle number in Delhi has increased dramatically in the past 2 decades (the registered vehicular population has tripled since 1994 and has reached 7.6 million), the related pollution is considered an increasingly significant source of atmospheric pollution. Overall, the sum of the two traffic factors is found to be the dominant VOC source in Delhi, with contributions of 33.8 % from Traffic1 and 22.8 % from Traffic2 to the total analyzed VOCs.
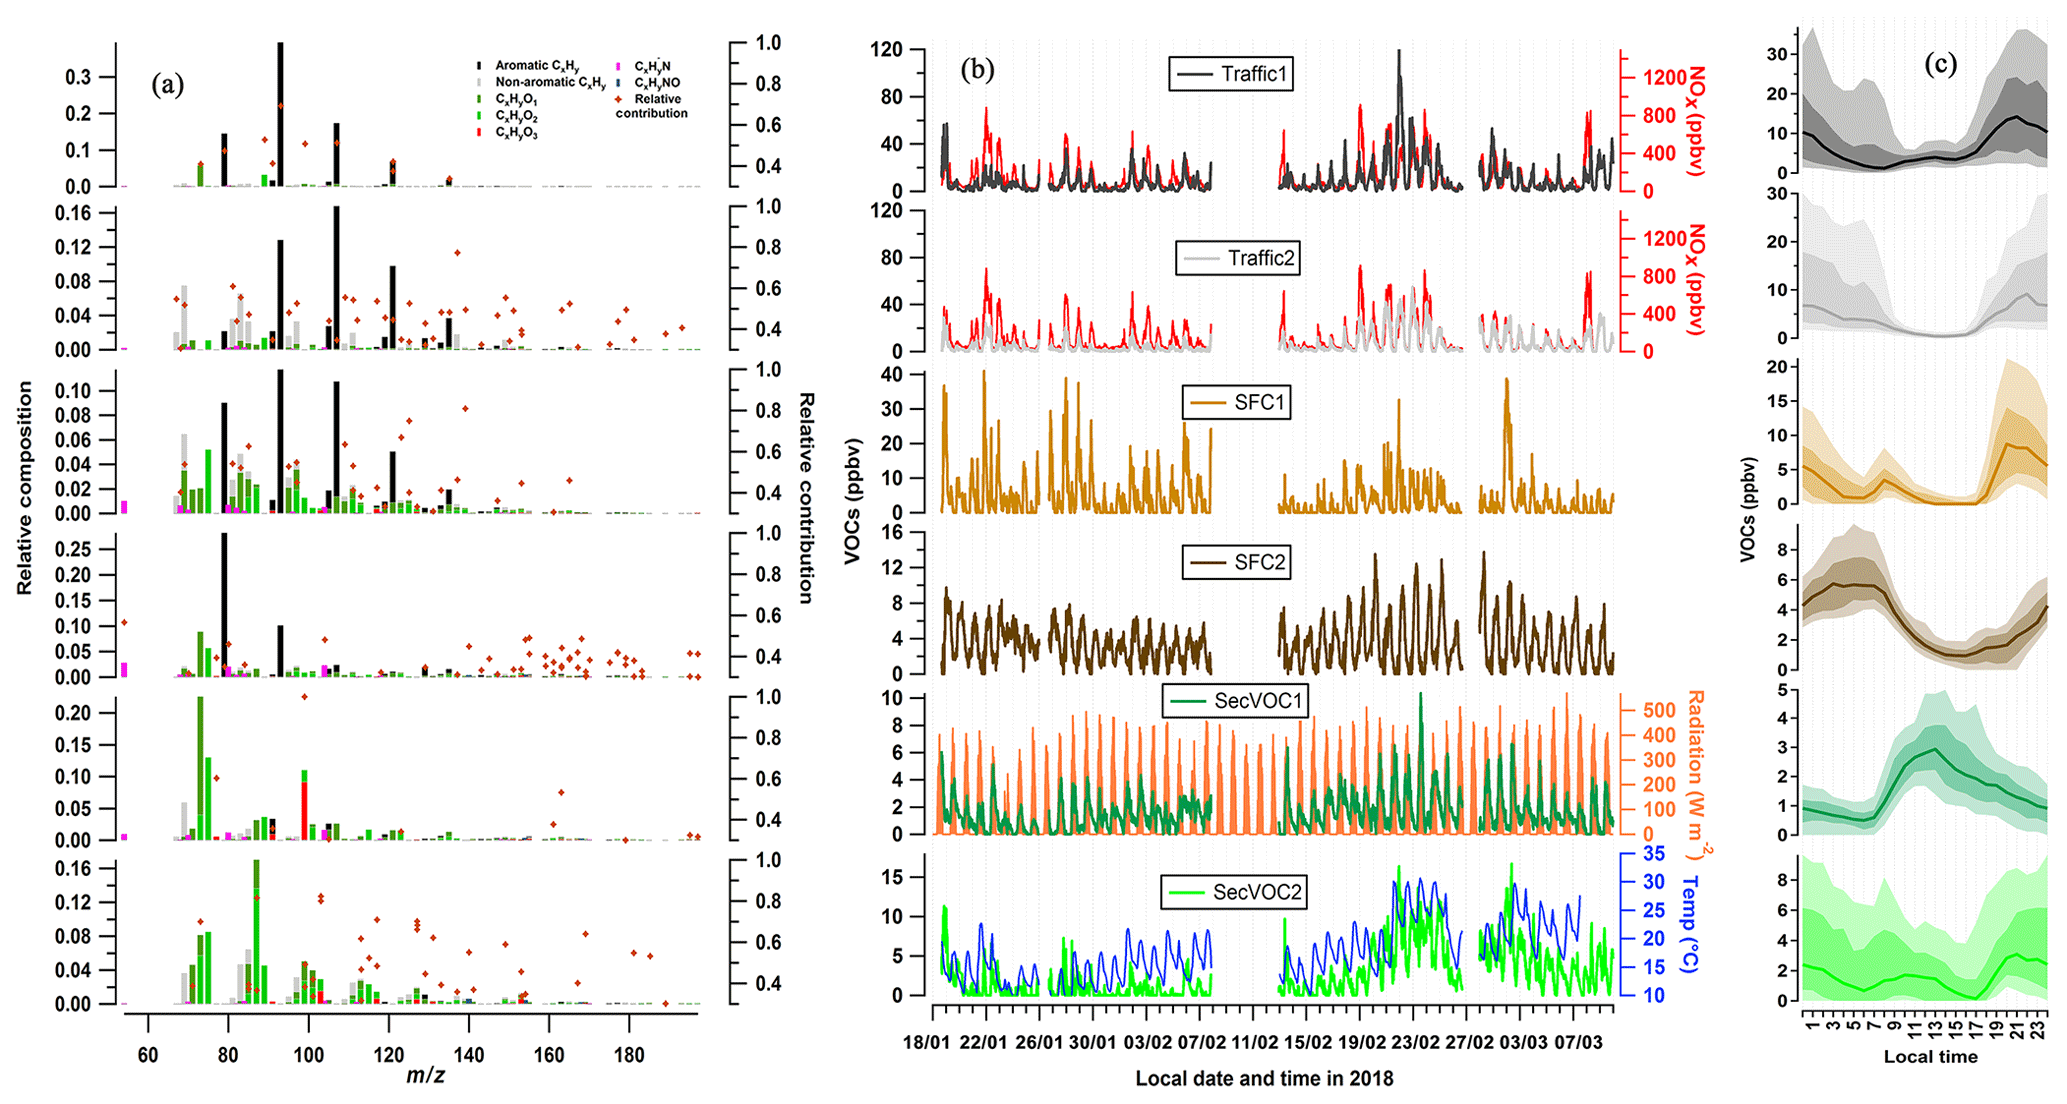
Figure 3PMF results at IITD, showing (a) factor profiles, (b) time series, and (c) diurnal patterns. In (a), the left axis for each factor profile is the relative composition of each factor (i.e., the horizontal sum is 1) and the right axis is the relative contribution of each factor to a given ion. Ions are colored based on the seven family classes as described in Sect. 3.1. (b) Temporal evolution of resolved factors at IITD, together with external reference data, e.g., NOx, CO, solar radiation, and temperature. (c) Medians of diurnal cycles of factors at IITD, shaded with interquartile ranges as well as the 10th and 90th percentiles.
Two other factors are found to be related to solid fuel combustion (SFC) and are named SFC1 and SFC2. SFC1 is characterized by high loadings of aromatics, as well as oxygenated ions, such as C6H6(CnH2n)O1, C6H6(CnH2n)O2, C4H4(CnH2n)O1, C4H4(CnH2n)O2, and C5H4O1−2. These ions are tentatively attributed to phenolic compounds and furans (Stockwell et al., 2015; Bruns et al., 2017). The relative fractions of emission factors (EF, in milligram per kilogram fuel) of C5H4O2 (100 mg kg−1), C6H6O (110 mg kg−1), and C6H6O2 (60 100 mg kg−1) are similar to their relative concentrations in SFC1 (i.e., C5H4O2 (m∕z 97.028, 0.019), C6H6O (m∕z 95.049, 0.021), and C6H6O2 – m∕z 111.044, 0.012), consistent with the identification of the factor. Besides, previous studies have reported that furans and phenols are emitted in high quantities by wood/biomass burning and coal combustion (Bruns et al., 2017; Klein et al., 2018) and thus are regarded as important markers for these combustion processes. In urban Delhi, the use of solid fuels is not limited to wood and coal but includes open combustion of many types of biomass and even waste. In addition, traditional stoves remain popular in some residential households and restaurants, and their VOC emission profiles are still not clear. SFC1 is identified as being more related to primary emissions from solid fuel combustion, which might include many types of biomass burning, coal combustion, and even trash combustion. The spectrum of the SFC2 factor is dominated by benzene and to a lesser extent toluene, while the more reactive phenols and furans are only present in small amounts, suggesting increased age. In addition, it includes a high mass fraction of N-containing compounds, such as C3H3N, C4H5N, and C7H5N. Although the chemical identification of these ions is not confirmed, these ions were reported in biomass burning as well (Stockwell et al., 2015; Sekimoto et al., 2018) and may be attributed to nitriles, which have longer OH lifetimes compared to furans and phenols (Meylan and Howard, 1993; Atkinson et al., 1989). SFC2 also explains a higher fraction of higher molecular-weight molecules, e.g., C6H5NO3 and C7H7NO3. These ions are attributed to nitrophenols, which are semivolatile compounds found in biomass-burning-related secondary organic aerosol (Mohr et al., 2013). As shown in Fig. 3c, SFC1 exhibits a diurnal pattern with a maximum value at 20:00 LT and a smaller peak at 08:00 LT, consistent with residential heating and/or cooking activities. SFC2 is also high at night, although it peaks several hours later than SFC1 (at 05:00 LT) and decreases strongly during daytime without any morning peak. This suggests that the nocturnal peak of SFC2 may be due to dark oxidation of emitted precursor VOCs, e.g., by nitrate radicals. Therefore, considering emissions, chemical transformation, and reactivity, SFC1 represents more primary emissions from various types of solid fuel combustion in central Delhi, while SFC2 is associated with more aged emissions from solid fuel combustion.
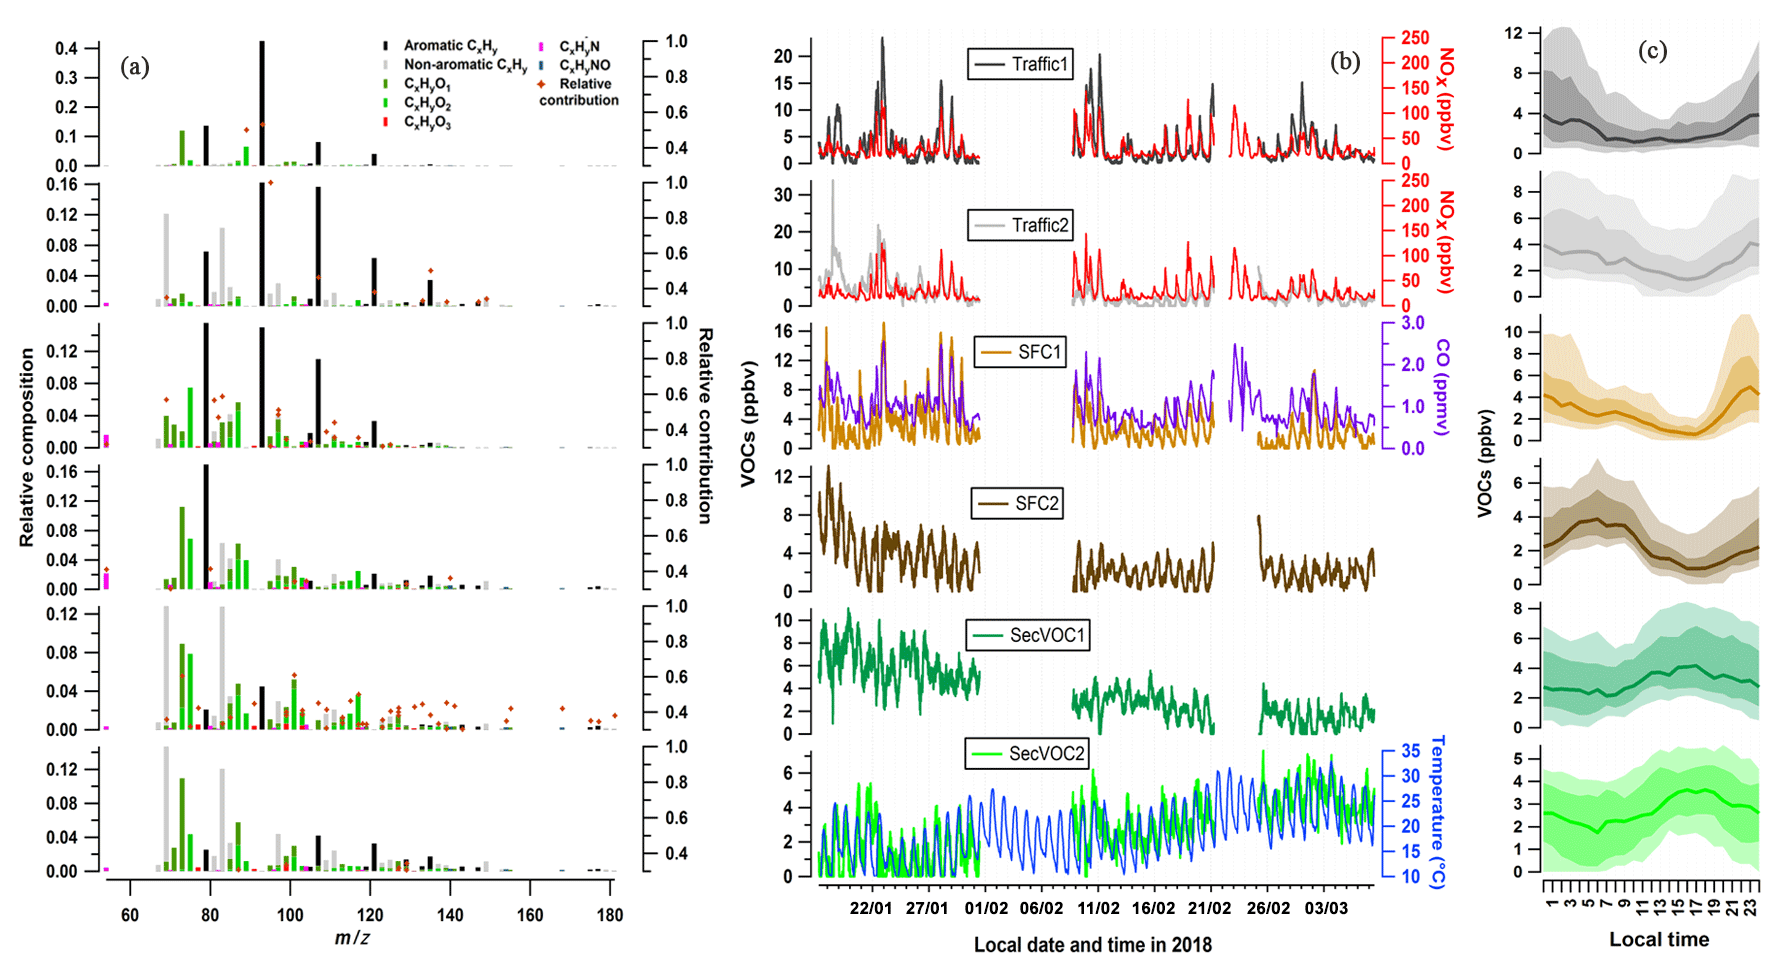
Figure 4PMF results at MRIU, showing (a) factor profiles, (b) time series, and (c) diurnal patterns. (a) Relative composition (left axis) and relative contribution (right axis) of each factor to a given ion. Ions are colored based on the seven family classes as described in Sect. 3.1. (b) Temporal evolution of resolved factors at MRIU, together with external reference data, e.g., NOx, CO, solar radiation, and temperature. (c) Medians of diurnal cycles of factors at MRIU, shaded with interquartile ranges as well as the 10th and 90th percentiles.
Finally, two secondary VOC factors are identified, the spectra of which are distinguished from the other factors by a strong presence of oxygenated compounds. Secondary VOC1 (denoted SecVOC1 in the following) contributes a large fraction of C2H4O3 and C4H2O3, and the spectrum is dominated by C4H8O, C3H4O2, C3H6O2, and C3H6O3, although the relative contributions to these ions are comparably lower than to C2H4O3 and C4H2O3. These ions are likely oxidation products from various photochemical processes and are not unique to specific precursors and oxidation processes. The time series of SecVOC1 follows that of the solar radiation, which has a regular contribution cycle during daytime. The diurnal of SecVOC1 shows a rapid enhancement starting from around 07:00 to 08:00 LT and declines continuously after 13:00 LT. This indicates that while many of these ions can be formed rapidly during daytime, they may have a short lifetime owing to partitioning to the condensed phase and/or heterogeneous processes. Secondary VOC2 (SecVOC2) has significant contributions from C3H4O2 and C3H6O2 as well, but the relative contributions to C3H4O2, C4H6O2−3, C6H6O2, C8H8O3, and C6H5NO3 are substantially higher than for SecVOC1. It also includes many oxygenated compounds with higher molecular weight, e.g., C5H10O1−2, C6H10O1−2, and C6H12O1−2. SecVOC2 (Fig. 3c) is not only high during daytime, with a slow rise in the morning and a peak around 10:00–12:00 LT, but is also high at night, reaching its nocturnal maximum from 20:00 LT to midnight. Major fractions of alkyl nitrates (RONO2) are detected as (ROH ⋅ H+) fragment ions by the PTR-ToF-MS (Aoki et al., 2007). Therefore, species such as C5H10O1−2, C6H10O1−2, and C6H12O1−2 may be partially attributed to fragments from organic nitrates, which contribute to the high nocturnal SecVOC2 mixing ratio. Therefore, it is likely that SecVOC1 is a mix of first-generation products and later-generation oxidation products, while SecVOC2 is possibly associated with second-generation products and nighttime chemistry.
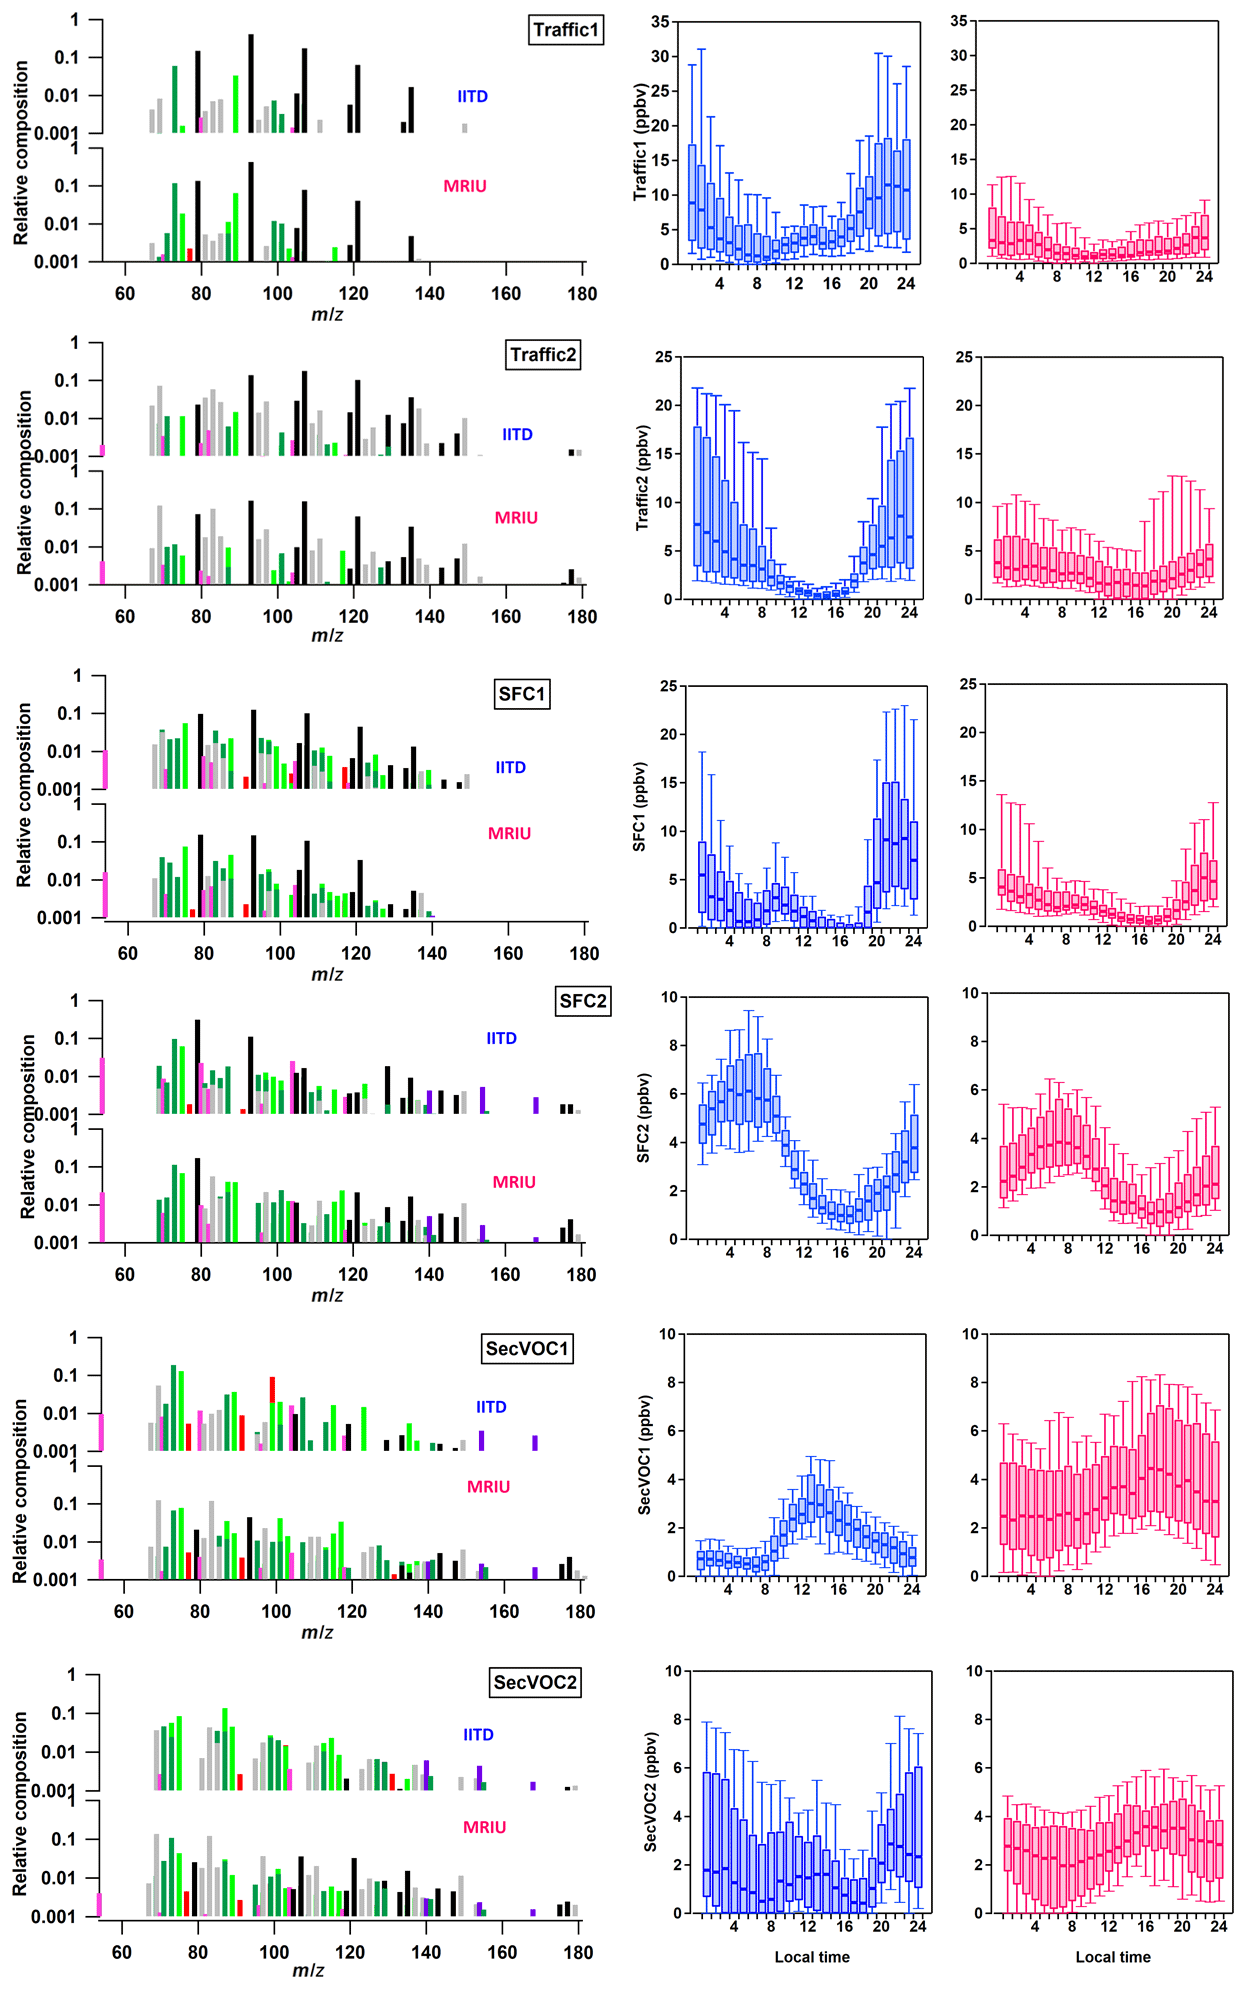
Figure 5Comparisons of averaged factor diurnal patterns and factor profiles at the two sites. The left-hand-side panels present the factor profiles with the IITD spectrum on top and the MRIU spectrum on bottom, color coded by the VOC families described in Sect. 3.1. The right-hand-side panels show the box and whisker plots of diurnal cycles at the two sites, with the blue panel representing IITD and the red panel MRIU.
3.3 Comparison of VOC sources
Figure 5 compares the diurnal cycles and mass spectra of the two Traffic and two SFC factors between the two sites. While the factor profiles are similar for the primary factors (i.e., Traffic1, Traffic 2, and SFC1 at both sites share the same major ions), their diurnal patterns are different. Higher nocturnal concentrations and day–night variations are observed at IITD than at MRIU for all three primary factors. For example, for Traffic1 the nocturnal maximum is 5.3 times higher than the daytime minimum at IITD and only 2.7 times higher at MRIU. For SFC1, the corresponding numbers are 36.8 at IITD and 6.9 at MRIU. This is possibly due to increased traffic density and more intense combustion activities in the highly populated urban areas. Besides, Fig. S8 presents concentration-weighted trajectory (CWT) plots of the six factors at both sites. Details of the back-trajectory and CWT analysis are shown in the Supplement. As shown in Fig. S8, high concentrations of primary factors are found both north and northwest of IITD, whereas high primary factors originate from southeast of MRIU, different from the direction of IITD.
Unlike the primary factors, the mass spectra of SFC2 differ between the two sites. At IITD, SFC2 is rich not only in benzene, but also in toluene. However, as shown in Fig. 5, toluene is much lower at MRIU, while the relative benzene concentration remains high. In addition, SFC2 at MRIU is richer in some oxygenated compounds, such as C6H12O1−2, C5H10O2, C6H10O2, and . These ions are the major ions found in the SecVOC2 factor at IITD. Because toluene has a much shorter photochemical lifetime than benzene, this suggests that SFC2 comprises less freshly emitted but more aged compounds at MRIU than at IITD. Although the SFC2 factors exhibit similar diurnal trends at the two sites, the time of the daily maximum is different. At MRIU, SFC2 reaches the maximum at 07:00 LT, which is approximately 2 h later than that at IITD. Further, the maximum averaged SFC2 mixing ratio at MRIU is 4.41 ppbv, lower than the peak value of 6.20 ppbv at IITD and consistent with the higher primary emission levels at IITD.
The two secondary VOC factors, in particular, show major differences between the two locations in terms of diurnal variations and spectra. On a simple level, the two SecVOC2 are considered to represent related factors because of their similar long-term trends with local temperature (Figs. 3 and 4). However, the mass spectra are different, indicating different aging mechanisms. As illustrated in Figs. 3 and 4, the spectrum of SecVOC1 is dominated by C4H2O3 and C2H4O3 at IITD but less so at MRIU for both SecVOC factors, especially in the case of C4H2O3. Further, the IITD SecVOC1 shows additional origins apart from the directions of primary factors, indicating influences from transport (Fig. S8). The SecVOC2 at IITD, however, is comparable to the MRIU SecVOC1 in terms of factor fingerprint (Fig. S9). The spectra of the two factors are both characterized by high contributions to C3H4O2, C4H6O2−3, C5H10O1−2, C6H10O1−2, and C6H12O1−2, with a relatively higher contribution to C4H2O3 and C2H4O3 by IITD SecVOC2. However, their time trends and diurnal variations are rather different. Although they both increase during daytime, the maximum is found about 4 h later at MRIU than at IITD, possibly due to less primary emission in the morning. The elevated periods of IITD SecVOC2 are not only related to higher temperature, but are also consistent with the periods with much stronger primary emissions (e.g., Traffic factors). Similarly, the time series of MRIU SecVOC1 is also high in January when all the primary factors are high compared to the rest of the periods. Besides, as shown in Fig. S8, SecVOC2 at IITD and SecVOC1 at MRIU exhibit similar geographical origins as the primary factors at the respective sites, suggesting local oxidation of primary emissions. The spectrum of MRIU SecVOC2 is also loaded with C4H2O3, C2H4O3, as well as high C4H8O and C3H4O2, but the contributions to these ions are much lower than SecVOC1. In addition, MRIU SecVOC2 exhibits a similar time series to that of local temperature, which increases in the warmer period of the campaign. The overall trend is quite different from the local primary factors but has some similarities to that of IITD SecVOC2. As shown in Fig. S8, high concentrations of MRIU SecVOC2 originate mainly from the northerly and northwesterly directions, consistent with the location of the IITD site. Therefore, it is possible that MRIU SecVOC2 represents oxidized VOCs on a relatively regional scale.
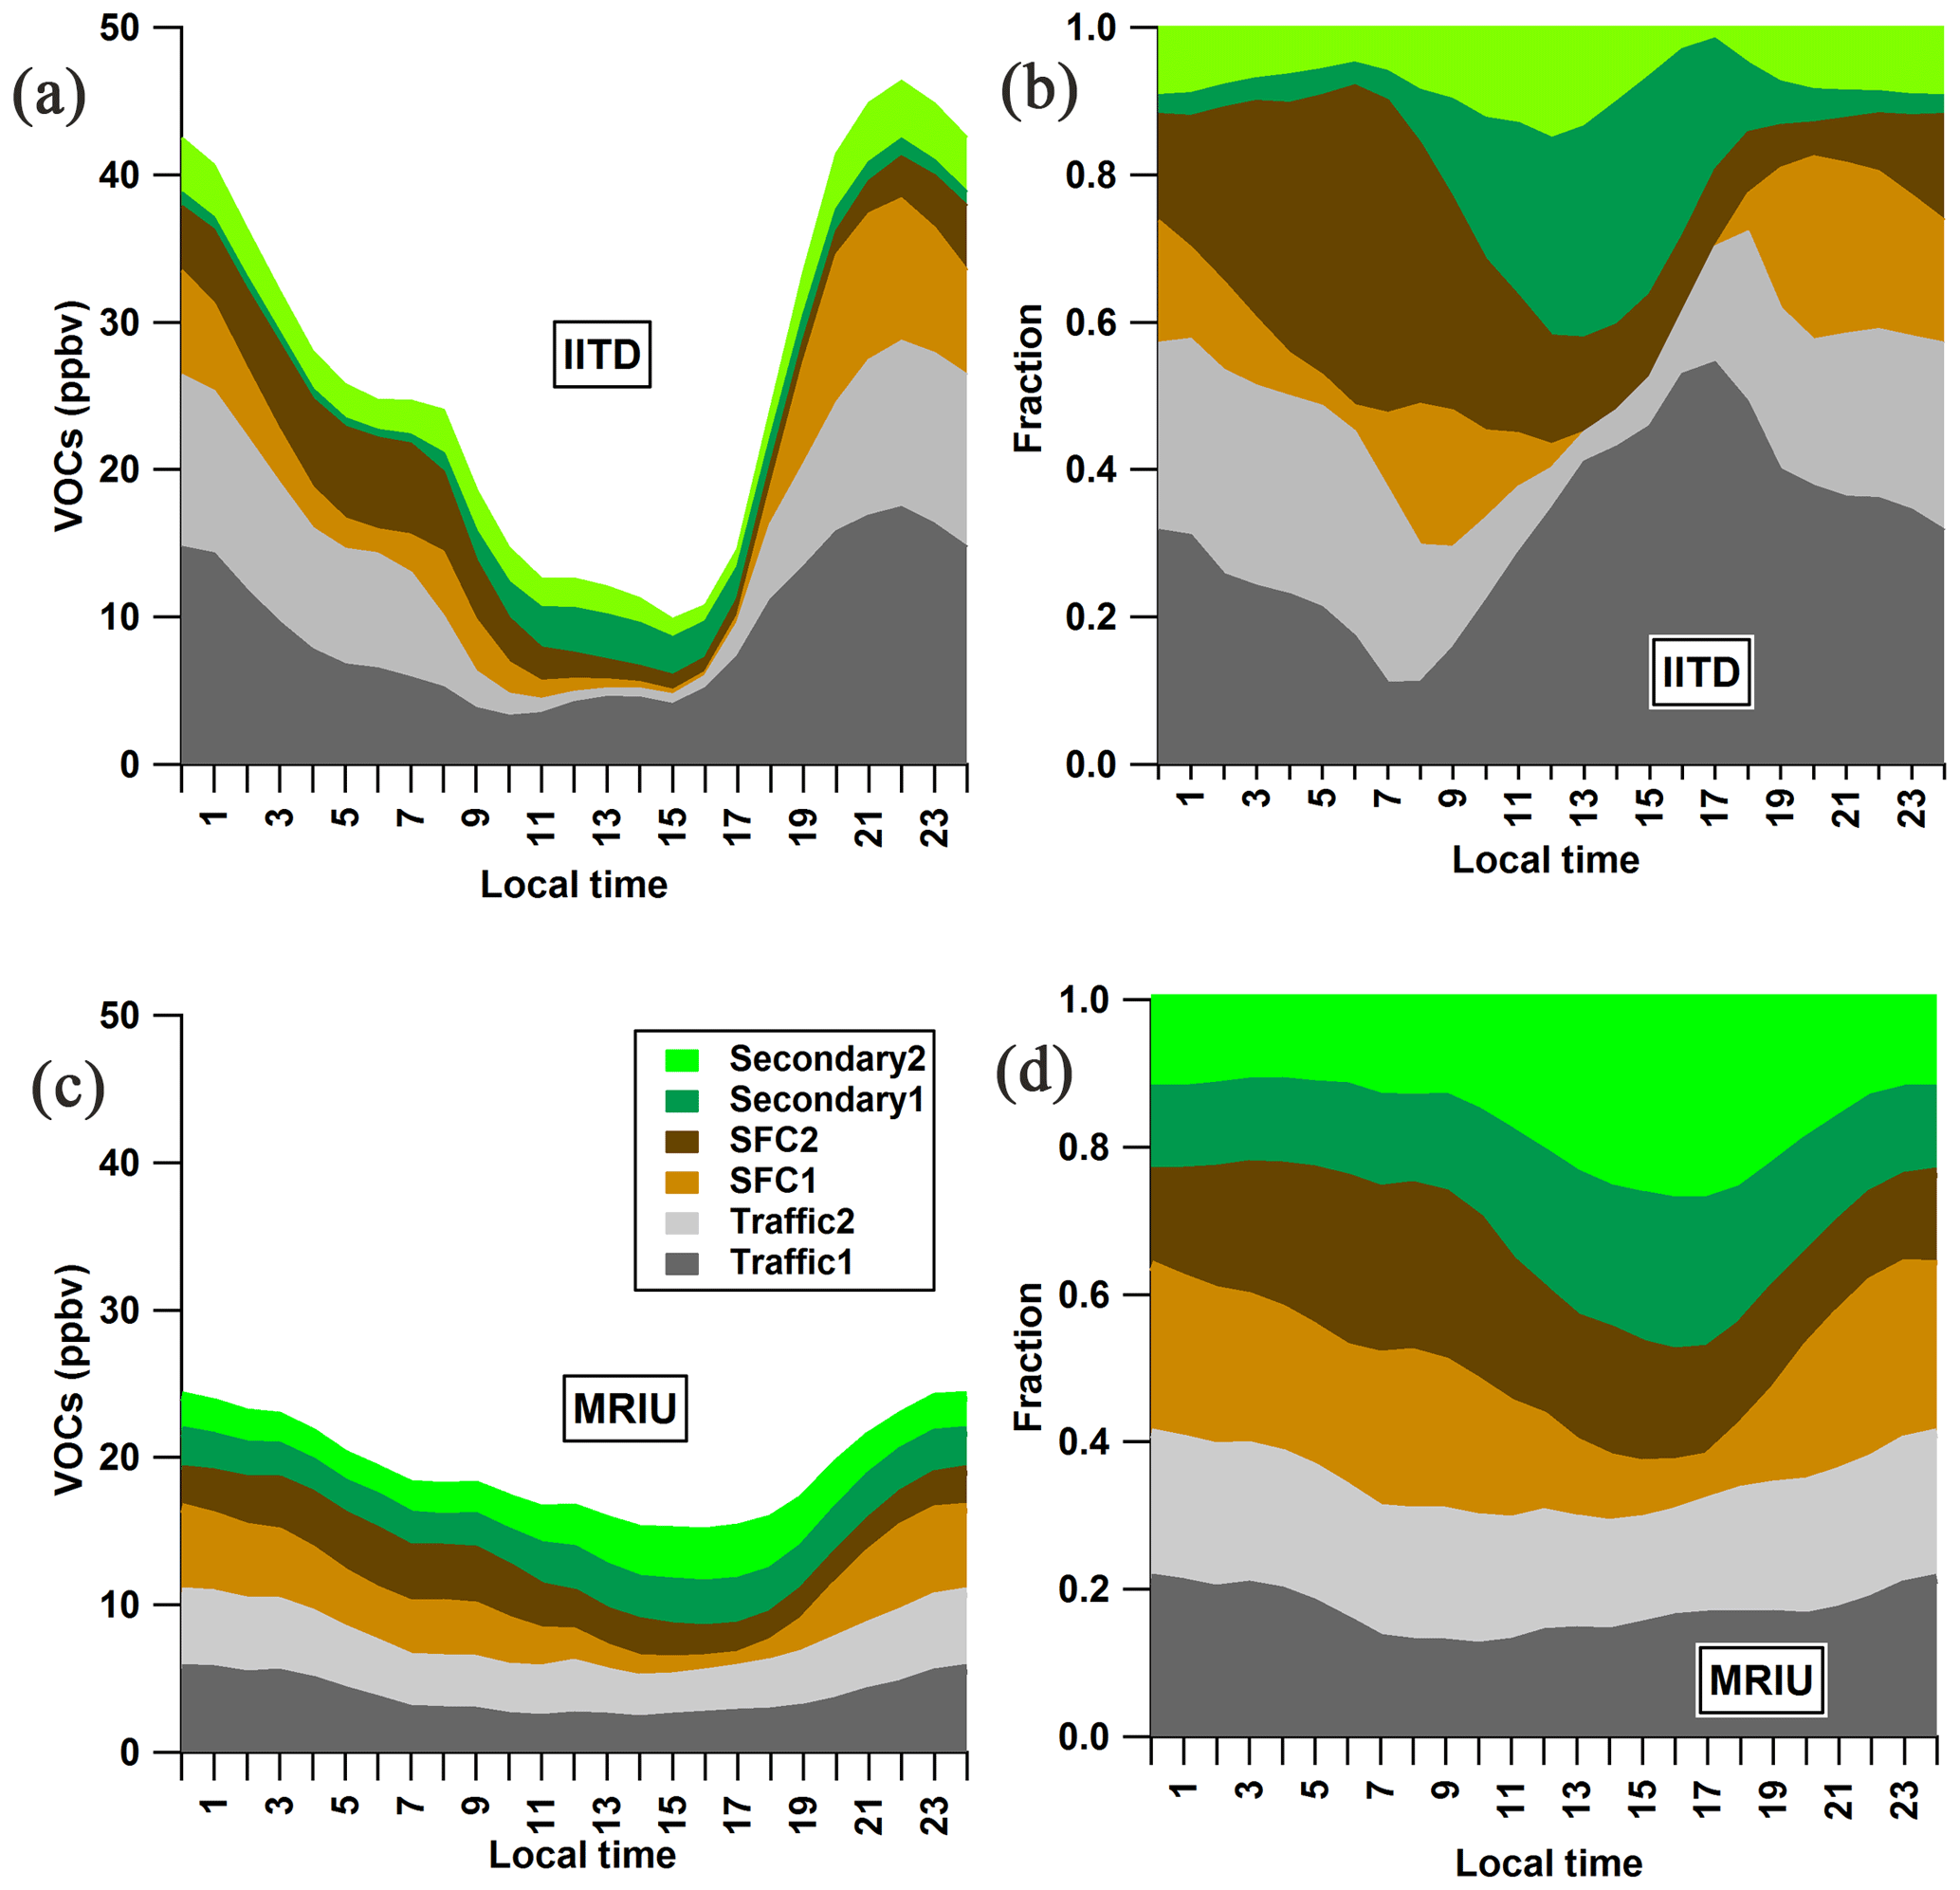
Figure 6(a, c) Diurnal patterns of factor mixing ratios at the two sites, color-coded by the six retrieved factors. (b, d) Diurnal patterns of the fractional contributions of the factors at the two sites.
Figure 6 presents the stacked factor diurnal patterns at the two sites. Much higher nocturnal mixing ratios of VOCs are observed at IITD than at MRIU, leading to pronounced day–night differences, while during daytime higher mixing ratios are found at MRIU than at IITD (with 15 ppbv at MRIU in the mid-afternoon compared to 10 ppbv at IITD). This can be explained by the fact that at IITD the VOC mixing ratio is dominated by primary emissions, especially during the night, while at MRIU the VOC mixing ratio is dominated by secondary formation, at least during the day. At IITD, primary factors contribute around 85 % before midnight, with large fractions coming from Traffic factors and SFC1. Afterwards, SFC2 gradually increases and contributes over 40 % of the total mixing ratio before sunrise, when other primary factors decrease to about 50 %. At the suburban MRIU site, although the nocturnal mixing ratios of primary VOCs are about half as high as that at IITD, they contribute around 70 % of the total VOC concentrations. In the daytime, however, the SecVOC contribution is as high as 54 %, compared to the maximum of 41 % at IITD. Generally, the MRIU SecVOC contributes about 15 %–20 % more than that at the IITD site throughout the day, mostly due to increased SecVOC1. This may be partially explained by the differences in rotation techniques we applied in running the model for the two secondary factors. As illustrated in Fig. S10, by applying the similar a-value approach to MRIU as used at IITD, the constrained MRIU SecVOC is around 1.5 ppb lower than the raw PMF result and contributes a maximum of 10 % less at around 14:00–15:00 LT. However, SecVOC contributes 31 % to the total analyzed VOC mixing ratio in the constrained MRIU solution instead of a contribution of 34 % from the unconstrained result as illustrated above. Both PMF solutions resolved at MRIU show much higher fractions of SecVOC compared to that at IITD (16 %). Therefore, the rotation techniques only play a minor part in the discrepancies between the two sites. More importantly, the difference in SecVOC is probably due to different oxidation conditions at the two sites. Owing to the high mixing ratio of NOx and the suppression of oxidants like OH radicals, the chemical oxidation of primary VOCs occurs to a greater extent downwind of urban emission sources. As shown in Fig. S8, high mixing ratios of SecVOC at MRIU originate from northwesterly directions, different from the origins of local primary factors (southeasterly). Besides, the longer oxidation time may be another reason for the higher SecVOC mixing ratios at MRIU. In addition, several ions below m∕z 60 that can be detected by the PTR-ToF-MS are excluded from PMF as discussed in Sect. 2.3, such as methanol, acetaldehyde, acetone, and acetic acids. These ions are 3–4 times higher than the dominant ions in the PMF analysis, possibly owing to much higher emission rates and natural abundance. Besides, other excluded compounds such as C1–C4 alkanes and C1–C4 alkenes which are not detectable by the PTR-ToF-MS are substantial contributors to the total VOC mixing ratio as well. However, these ions are minor contributors to SOA formation and only substantially contribute to the formation of ozone, which is a major issue in summer. Although the mixing ratio of the sum of VOCs in the PMF only accounts for 39.6 % at IITD and 24.2 % at MRIU (Fig. S11), many of these compounds are the dominant precursors in terms of SOA formation (Wu and Xie, 2017, 2018).
3.4 Evaluation of biogenic signatures
Biogenic VOCs, i.e., isoprene and monoterpenes, are not separated into a specific factor in this study. This is in part due to the small number of ions that can be unambiguously assigned to these sources. Specifically, the structure assignment and quantification of non-aromatic CxHy can be uncertain not only because of isomers, but also because of fragments from aldehydes, alcohols, and other long-chain aliphatic hydrocarbons. Therefore, C5H8 (m∕z 69.070) and the sum of C10H16 (m∕z 137.132) and C6H8 (m∕z 81.070, a major fragment of C10H16) can only serve as upper estimates of the actual isoprene and monoterpenes, respectively. The averaged mixing ratios of isoprene and monoterpenes are low during the campaign, with 0.8 and 0.46 ppbv, respectively, at IITD, and 1.2 and 0.32 ppbv, respectively, at MRIU. Figure 7 illustrates the explained variation of the two major biogenic markers (i.e., isoprene and monoterpenes) and several other ions possibly related to their oxidation products. Among them, C4H6O1−2 (m∕z 71.049, m∕z 87.044) and C5H8O1−2 (m∕z 85.065, m∕z 101.060) are found in the photooxidation of isoprene, and C9H14O (m∕z 139.112) and C10H14∕16O (m∕z 151.112, m∕z 153.127) are potential photochemical products from monoterpenes. Instead of being related to a specific secondary factor, the biogenic markers are largely explained by primary factors. There are several possible explanations. First, both isoprene and monoterpenes have been found in biomass-burning emissions from numerous laboratory and field studies (e.g., Bruns et al., 2017). Second, previous studies also indicated anthropogenic sources of isoprene from vehicular emissions (Borbon et al., 2001; Wagner and Kuttler, 2014). One recent paper showed that fragrances and personal care products may be an important emission source of urban monoterpenes and are correlated with traffic emissions (McDonald et al., 2018). Third, considerable amounts of these ions may be affected by isomers and fragments of larger ions originating from primary emissions. Finally, the two BVOCs are very reactive compounds, which have very short lifetimes especially during daytime and also during nighttime if NO3 is present. Therefore, large amounts of BVOCs can be degraded very quickly via photochemical oxidation during daytime, resulting in lower daytime BVOC mixing ratios despite stronger natural emissions. As shown in Fig. S12, both isoprene and monoterpene are high at night and very low during daytime, similar to the diurnal trends of the primary factors. The only exception is isoprene at MRIU, which may be due to strong daytime emissions or contributions from isomers/fragments.
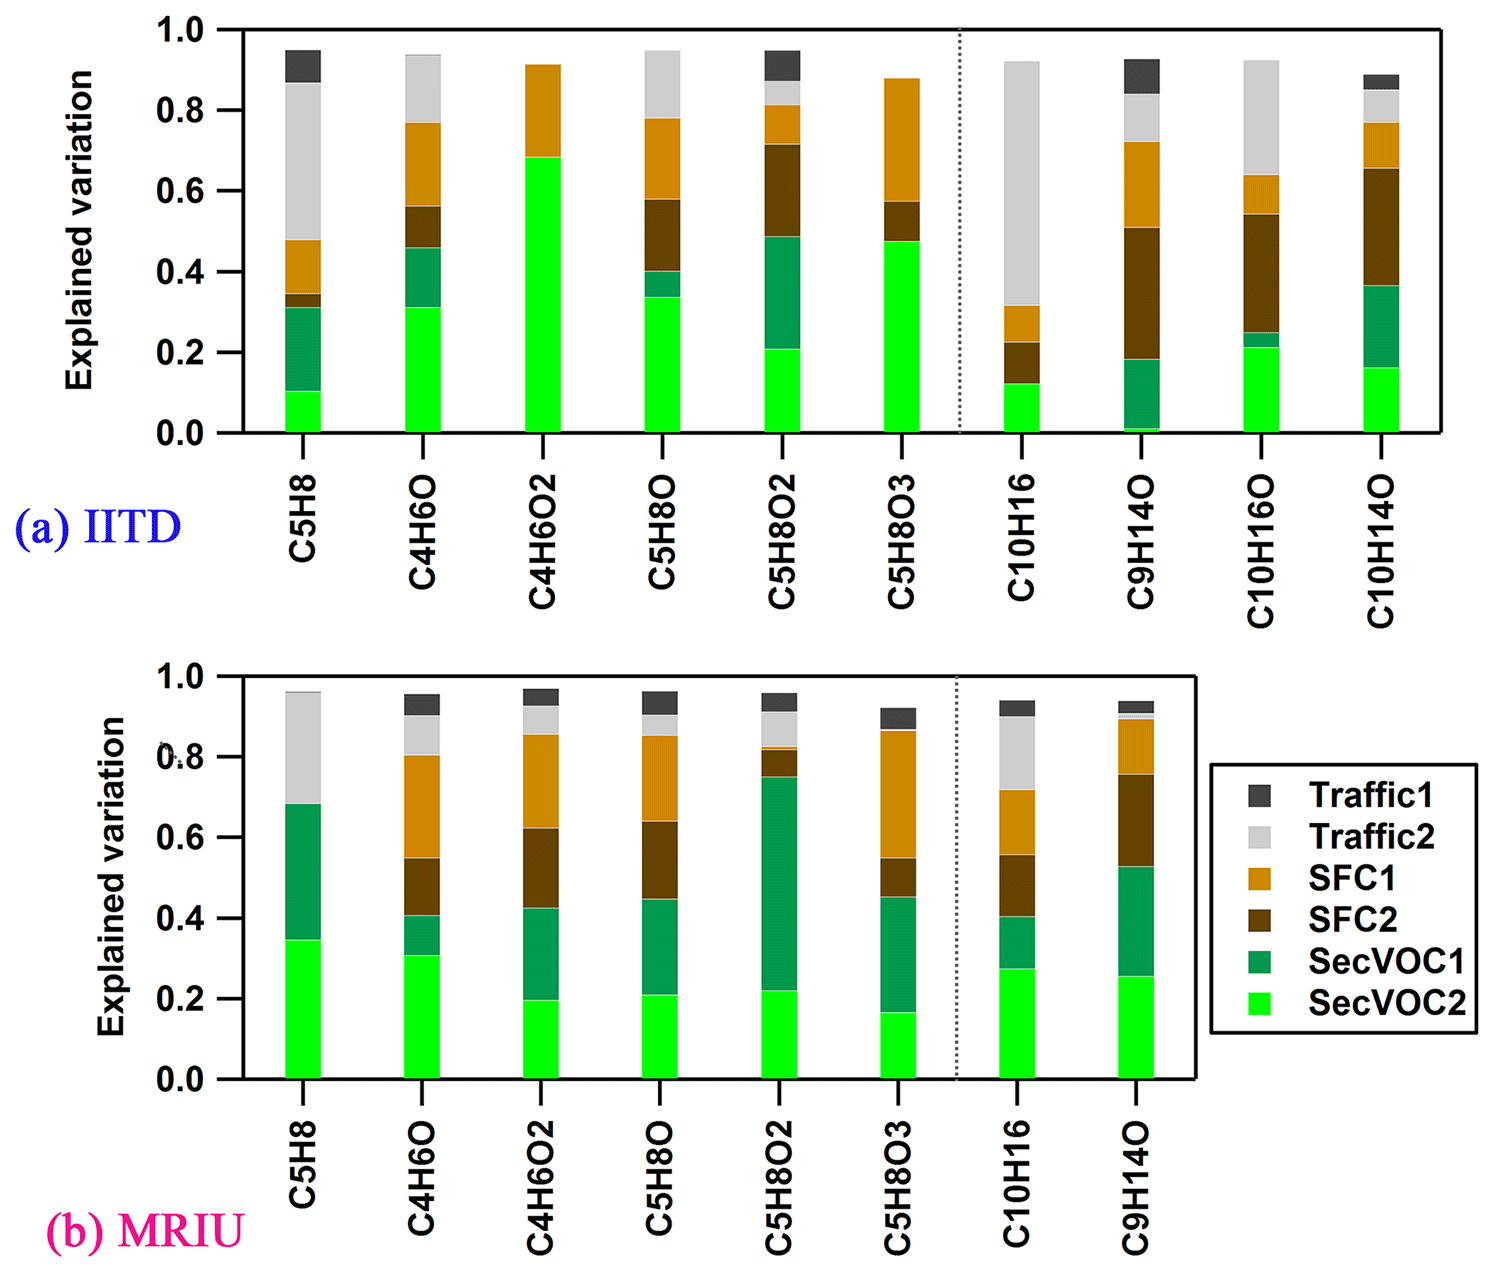
Figure 7Explained variations of selected ions at the two sites, stacked such that the sum is the total explained variation, color-coded by the six factors (a) at IITD and (b) at MRIU. Missing ions at MRIU were excluded from PMF analysis due to a low SNR. The possible candidates for these ions are isoprene (C5H8), MVK + MACR (C4H6O), 2,3-butanedione (C4H6O2), 3-methyl-3-butene-2-one (C5H8O), methyl methacrylate (C5H8O2), monoterpenes (C10H16), and camphor (C10H16O), respectively.
As shown in Fig. 7, the CxHyOz ions are explained partially by secondary factors, indicating possible secondary formation from biogenic precursors. However, at both sites, considerable amounts of these ions are also explained by emissions from SFC. Previous studies showed that the emission factors of C4H6O1−2 are comparable to that of benzene (200 mg kg−1), and the EFs for C5H8O1−2 and C10H16O are comparable to that of toluene (27 mg kg−1) in biomass-/wood-burning emissions (Bruns et al., 2017; Koss et al., 2018). Besides, as these small molecular weight ions are possible products from various precursors and chemical pathways, their structures and precursor definitions are uncertain. However, the explained variations can still provide information on the aging processes. In general, the fraction explained by the secondary factors increases as the ions become more oxygenated. In addition, at IITD SecVOC1 explains much higher fractions of the CxHyO1 ions compared to SecVOC2, while the CxHyO2−3 ions are to a great extent explained by SecVOC2. As some of these less oxygenated ions originate from both fast photochemical formation and later-generation production, they are explained by both secondary factors. For example, C4H6O, which can be attributed to MVK (methyl vinyl ketone) and MACR (methacrolein), is formed rapidly via isoprene OH oxidation but can also be found as second-generation products via several other oxidation pathways. Generally, both biogenic markers and their oxidation products are low during the measurement period, and these ions contribute only small amounts to the two secondary factors, indicating minor contributions from biogenic emissions at the two sites during the campaign.
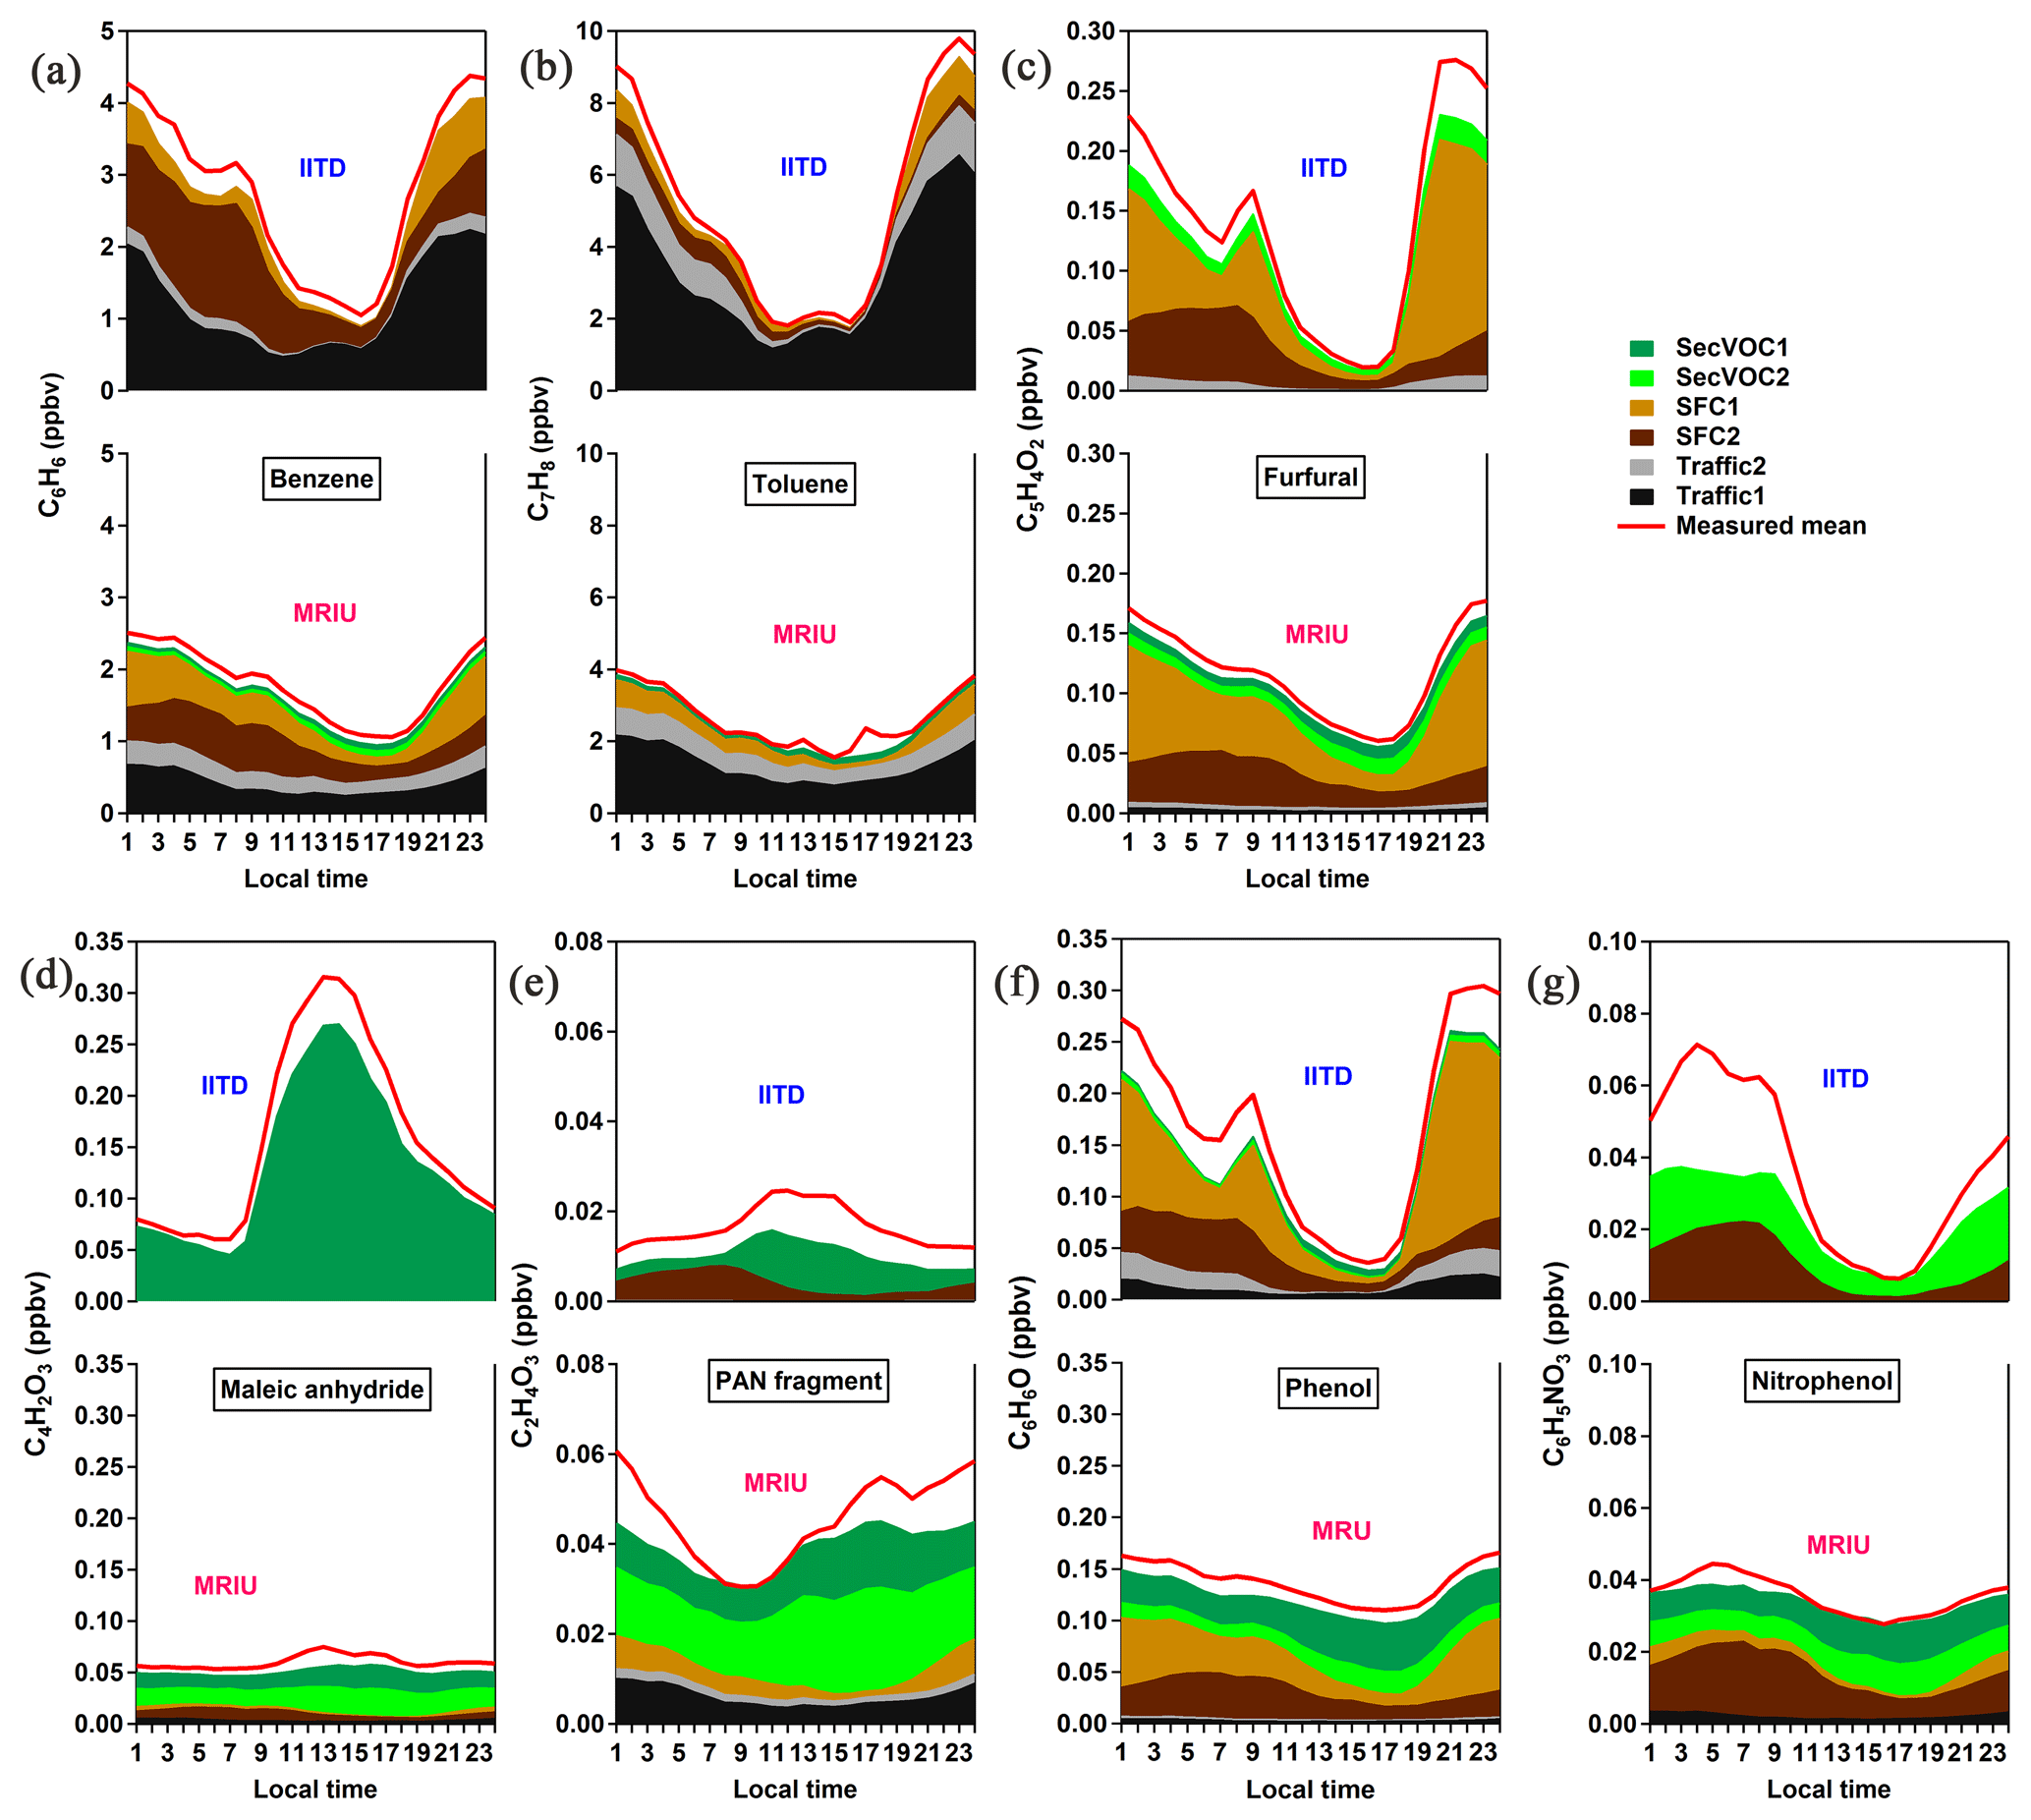
Figure 8Diurnal cycles of selected marker ions, stacked with explained variations by each factor, and the red line representing the measured average concentrations. Tentative structures assigned to the individual ions are denoted in each panel.
3.5 Characteristics of selected ions
Figure 8 shows the diurnal patterns of the explained variation of each PMF factor to selected ions measured at the two sites, stacked such that the height is the total modeled concentration. The red line in each plot represents the mean diurnal pattern of the measured mixing ratio. The model represents over 80 % of most of these selected ions and thus in general explains the variations of these ions well. The comparison of these diurnal patterns illustrates that distinct differences exist in the mixing ratios, variations, and source compositions of certain VOCs. The assignment of a specific compound structure to each ion can be ambiguous, particularly for the spectra obtained from ambient air due to the possibility of isomers and/or fragmentation. Still, we provide tentative candidates for the nine ions based on their molecular formulas and compounds found in previous fuel combustion and oxidation simulation studies. Structural assignments for aromatics and PAHs are more certain because the low H-to-C atomic ratio reduces the number of reasonable structures; therefore, C6H6, C7H8, and C10H8 are mainly attributed to benzene, toluene, and naphthalene, respectively. Also included in Fig. 8 are C5H4O2, C6H6O, C2H4O3, C4H2O3, and C6H5NO3; we suggest that the most likely structural assignments are furfural, phenol, a fragment of peroxyacetyl nitrate (PAN), maleic anhydride, and nitrophenol, respectively.
Benzene and toluene are well-interpreted aromatics, which contribute significantly to emissions from several combustion processes, including vehicle emissions, biomass burning, and coal combustion (Pieber et al., 2018; Bruns et al., 2017; Klein et al., 2018). As shown in Fig. 8a, at IITD benzene originates to a significant extent from traffic emissions (53 % on average) over the whole day and in addition from the SFC factors (47 % on average), largely at night. The traffic fraction is lowest (29 %) in the early morning and increases during daytime, with a maximum of 74 % around 17:00–18:00 LT, with the opposite trend for the SFC fraction. This suggests that the IITD site is dominated by pollution from vehicular emissions because of the highly trafficked streets nearby and is also influenced by strong solid fuel combustion due to the high population density. At MRIU, however, there are comparable benzene contributions by the Traffic1, SFC1, and SFC2 factors. Even though the sum of the SFC mixing ratios is lower at MRIU compared to IITD, the relative SFC contribution is higher at MRIU. Although the traffic fraction increases during daytime at both sites, it explains a maximum of 74 % at IITD and 49 % at MRIU around 17:00–18:00 LT, with the opposite behavior for the SFC fraction. Toluene displays a similar diurnal cycle and source contributions to benzene, characterized by significant contributions from primary sources, especially Traffic1. The traffic fraction is as high as 90 % around 18:00 LT and reaches a minimum of 67 % around 10:00 LT at IITD, which is much higher than that of benzene. The benzene ∕ toluene (B∕T) ratio of the traffic factor ranges from 0.34 to 0.40, which is comparable to the emission factors of benzene ∕ toluene for gasoline emissions (0.58, Gentner et al., 2013). Besides, the traffic fraction is lowest in the morning, which is associated with the strong emissions of SFC in the morning and high traffic emissions during the rush hour in the late afternoon. The B∕T is 3.4 for the SFC factors, which is in the reported range of 2–7 for residential biomass/wood burning (Bruns et al., 2017; Koss et al., 2018). Similarly, traffic is also the highest source of toluene at MRIU, ranging from 67 % to 77 %.
As mentioned above, phenolic compounds and substituted furans are found to be significant oxygen-containing compounds at the two sites. Furfural is an important marker from biomass burning, which arises from pyrolysis of cellulose and hemicellulose. Phenols are detected in biomass burning and coal combustion emissions as the most abundant oxygenated aromatic compounds (Stockwell et al., 2015; Klein et al., 2018; Bruns et al., 2017). Indeed, as shown in Fig. 8c, f, the majority of furfural and phenol are explained by the two SFC factors at both sites. The two SFC factors contribute 91 % to furfural and 85 % to phenol at IITD, while the corresponding contributions are 70 % and 57 % at MRIU. SFC1 contributes around 54 % and 39 % during the night and morning, respectively, with a higher night-to-day ratio at IITD, which captures both the characteristics of residential heating styles and urban/suburban usage differences due to population density. The SFC2-to-SFC1 ratio generally increases during the night. As described earlier, one possible explanation is that SFC2 results from the fast nocturnal evolution of primary SFC1 emissions probably driven by night chemistry under high NOx conditions (Tiitta et al., 2016). In addition to the SFC factors, at IITD around 8 % of furfural and 4 % of phenol are explained by the two SecVOC factors, compared to around 11 % and 25 % at MRIU, respectively.
Nitrated phenols are important biomass-burning tracers, in particular for secondary aerosol formation (Mohr et al., 2013; Bertrand et al., 2018). Here, the diurnal cycles of C6H5NO3 at the two sites illustrate contributions from both emission and atmospheric transformation. At both sites, SFC2 accounts for a large percentage of the nocturnal nitrophenol mixing ratios, while the SecVOC factors explain the remaining fraction. This is consistent with SFC2 representing nighttime aging of SFC emissions. It is worth noting that during the night there is a much larger unexplained fraction (around 35 %) at IITD than at MRIU, with a corresponding uncertainty in the source contributions. Still, the main difference at the two sites relates to the contributions of the SecVOC factors. At IITD, the SecVOC2 factor contributes more at night than during daytime, probably due to nocturnal formation including NO3 chemistry and the photolysis reactions of C6H5NO3 during daytime. At MRIU, both SecVOC1 and SecVOC2 contribute to C6H5NO3, indicating the combined influence from local and regional chemistry.
Maleic anhydride and PAN display distinct variation patterns at the two sites. Maleic anhydride is the product from the photo-oxidation of furans, unsaturated carbonyls, and aromatics (Bierbach et al., 1994; Yuan et al., 2017). The mixing ratio of maleic anhydride is about 5 times higher at IITD than that at MRIU during daytime and is only explained by SecVOC1. As shown in Fig. S13, high mixing ratios of maleic anhydride originate from north (primary emissions) and northwest of IITD, the same directions as SecVOC1. Similarly, high mixing ratios of maleic anhydride at MRIU originate from both the southeasterly (primary emissions) and northwesterly (IITD site) directions. During nighttime, the maleic anhydride mixing ratio at MRIU is similar to the one at IITD, with considerable amounts explained by SecVOC2 and SFC2. A recent study indicates that furans contributed over 90 % of maleic anhydride within the first 4 h of OH oxidation in biomass-burning plumes (Coggon et al., 2019). Therefore, the higher morning peak and nocturnal mixing ratios of furans may be the driver of much higher maleic anhydride at IITD. Besides, it is possible that under the conditions of high humidity and aerosol mass loading, maleic anhydride could react and/or condense away before the city plume reaching the suburban area. In contrast to maleic anhydride, C2H4O3 shows a higher mixing ratio at MRIU than at IITD. C2H4O3 is mainly attributed to a fragment of PAN; however, a small fraction is also related to primary factors at both sites (Fig. 8). This ion was reported in laboratory studies on primary biomass-burning emissions (Bruns et al., 2017). Possibly, small amounts of this ion might be attributed to unknown isomers, which are directly emitted or rapidly formed in combustion processes. PAN is formed in VOC oxidation with NOx (de Gouw and Warneke, 2007). Due to its long lifetime at low temperature, PAN can undergo long-range transport and then play an important role in tropospheric ozone formation in the remote areas when it decomposes (Fischer et al., 2014). As illustrated in Fig. S13, high mixing ratios of C2H4O3 originate from the north and far northwest, indicating influence of both local emission/oxidation formation and long-range transportation. At MRIU, however, high mixing ratios of C2H4O3 mainly originate from the northwest, suggesting the influence of transportation from the urban areas. Besides, PAN is mainly explained by SecVOC1 at IITD, and a much higher PAN mixing ratio is observed at the suburban MRIU, originating from both secondary VOC factors, indicating a longer oxidation time at this site.
Measurements of volatile organic compounds (VOCs) were performed simultaneously at two different sites in Delhi, India, using two PTR-ToF-MS instruments. Much higher mixing ratios of VOCs were observed at the urban IITD site, with higher nocturnal contributions from anthropogenic emissions than at the suburban MRIU site. Using positive matrix factorization, we found a six-factor solution at both sites, each consisting of two traffic factors, two solid fuel combustion factors, and two secondary factors. Anthropogenic activities were shown to be important VOC sources at both sites. Among them, traffic-related emissions comprised the dominant source, contributing 56.6 % at the urban IITD site and 36.0 % at the suburban MRIU site to the total analyzed VOC mixing ratio (excluding high-intensity VOCs as described in Sect. 2.3). Solid fuel combustion contributed 27.5 % at the urban IITD site and even 30.4 % at the suburban MRIU site. Secondary formation was the most important source of VOCs during daytime and contributed 15.9 % at IITD and 33.6 % at MRIU to the total concentration. Higher mixing ratios of oxygenated VOCs were found at the suburban site, likely due to suppression of oxidant levels in the urban atmosphere and longer aging time at the suburban site.
Comparison of the factor diurnals and profiles indicated that the anthropogenic sources were similar at two sites, even though the VOC mixing ratios at MRIU were much lower than at IITD. The secondary factors, however, were different at the two sites in terms of both diurnal variations and spectra. The two secondary VOC factors exhibited higher mixing ratios and contributions at the suburban site, in particular during daytime. At IITD, the two SecVOC factors indicated different aging process under strong primary emissions, while at the suburban MRIU they suggested local oxidation and regional aging. Besides, evaluation of biogenic markers indicated very small influence from biogenic emissions and their oxidation products.
This work highlights the crucial role that anthropogenic sources play in the pollution levels and variation characteristics of VOCs in the ambient atmosphere of Delhi, India. Further control measures to reduce emissions from traffic exhaust and solid fuel combustion are urgently needed to mitigate the severe pollution and the environmental impact of VOCs as well as aerosols (not investigated in this paper) in this region. Significant differences in the concentrations as well as the pollution sources stress the complexity of both emission and chemistry in this region. Long-term measurements of a set of VOCs, aerosols, and other oxidants would be ideal to obtain a more detailed understanding of the formation mechanisms during various conditions.
Data related to this article are available at https://doi.org/10.5281/zenodo.3931977 (Wang et al., 2020).
The supplement related to this article is available online at: https://doi.org/10.5194/acp-20-9753-2020-supplement.
LW, DB, PR, VK, PV, RS, NR, and DG performed the experimental work at IITD. NT and LKS performed experimental work at MRIU. LW and JGS processed and analyzed the data. ASHP, SNT, JGS, and UB designed the study and participated in the interpretation of the data. LW wrote the paper with contributions from all the co-authors.
The authors declare that they have no conflict of interest.
This work was supported by SNF projects 200021_169787 (SAOPSOAG), BSSGI0_155846 (IPR-SHOP), IZLCZ2_169986 (HAZECHINA), and 200021_162448/1 (China-XRF). SNT is grateful for the financial support provided by the Department of Biotechnology (DBT), Government of India, to conduct this research under grant no. BT/IN/UK/APHH/41/KB/2016-17 dated 19 July 2017 and for financial support provided by the Central Pollution Control Board (CPCB), Government of India, to conduct this research under grant no. AQM/Source apportionment_EPC Project/2017.
This research has been supported by the Swiss National Science Foundation (grant no. 200021_169787), the Swiss National Science Foundation (grant no. BSSGI0_155846), the Swiss National Science Foundation (grant no. IZLCZ2_169986), the Swiss National Science Foundation (grant no. 200021_162448/1), the Department of Biotechnology (DBT), Government of India (grant no. BT/IN/UK/APHH/41/KB/2016-17), and Central Pollution Control Board (CPCB), Government of India (grant no. AQM/Source apportionment_EPC Projekt/2017).
This paper was edited by Thomas Karl and reviewed by two anonymous referees.
Aoki, N., Inomata, S., and Tanimoto, H.: Detection of C1–C5 alkyl nitrates by proton transfer reaction time-of-flight mass spectrometry, Int. J. Mass Spectrom., 263, 12–21, https://doi.org/10.1016/j.ijms.2006.11.018, 2007.
Atkinson, R., Baulch, D. L., Cox, R. A., Jr., R. F. H., Kerr, J. A., and Troe, J.: Evaluated kinetic and Photochemical Data for Atmospheric Chemistry: Supplement III. IUPAC Subcommittee on Gas Kinetic Data Evaluation for Atmospheric Chemistry, J. Phys. Chem. Ref. Data, 18, 881–1097, https://doi.org/10.1063/1.555832, 1989.
Atkinson, R.: Atmospheric chemistry of VOCs and NOx, Atmos. Environ., 34, 2063–2101, https://doi.org/10.1016/S1352-2310(99)00460-4, 2000.
Atkinson, R. and Arey, J.: Atmospheric degradation of volatile organic compounds, Chem. Rev., 103, 4605–4638, 2003.
Baudic, A., Gros, V., Sauvage, S., Locoge, N., Sanchez, O., Sarda-Estève, R., Kalogridis, C., Petit, J. E., Bonnaire, N., Baisnée, D., Favez, O., Albinet, A., Sciare, J., and Bonsang, B.: Seasonal variability and source apportionment of volatile organic compounds (VOCs) in the Paris megacity (France), Atmos. Chem. Phys., 16, 11961–11989, https://doi.org/10.5194/acp-16-11961-2016, 2016.
Bertrand, A., Stefenelli, G., Jen, C. N., Pieber, S. M., Bruns, E. A., Ni, H. Y., Temime-Roussel, B., Slowik, J. G., Goldstein, A. H., El Haddad, I., Baltensperger, U., Prevot, A. S. H., Wortham, H., and Marchand, N.: Evolution of the chemical fingerprint of biomass burning organic aerosol during aging, Atmos. Chem. Phys., 10, 7607–7624, https://doi.org/10.5194/acp-18-7607-2018, 2018.
Bierbach, A., Barnes, I., Becker, K. H., and Wiesen, E.: Atmospheric Chemistry of Unsaturated Carbonyls: Butenedial, 4-Oxo-2-pentenal, 3-Hexene-2,5-dione, Maleic Anhydride, 3H-Furan-2-one, and 5-Methyl-3H-furan-2-one, Environ. Sci. Technol., 28, 715–729, https://doi.org/10.1021/es00053a028, 1994.
Bonasoni, P., Laj, P., Marinoni, A., Sprenger, M., Angelini, F., Arduini, J., Bonafè, U., Calzolari, F., Colombo, T., Decesari, S., Di Biagio, C., di Sarra, A. G., Evangelisti, F., Duchi, R., Facchini, M. C., Fuzzi, S., Gobbi, G. P., Maione, M., Panday, A., Roccato, F., Sellegri, K., Venzac, H., Verza, G. P., Villani, P., Vuillermoz, E., and Cristofanelli, P.: Atmospheric brown clouds in the Himalayas: first two years of continuous observations at the Nepal Climate Observatory-Pyramid (5079 m), Atmos. Chem. Phys., 10, 7515–7531, https://doi.org/10.5194/acp-10-7515-2010, 2010.
Borbon, A., Fontaine, H., Veillerot, M., Locoge, N., Galloo, J. C., and Guillermo, R.: An investigation into the traffic-related fraction of isoprene at an urban location, Atmos. Environ., 35, 3749–3760, https://doi.org/10.1016/S1352-2310(01)00170-4, 2001.
Borbon, A., Gilman, J. B., Kuster, W. C., Grand, N., Chevaillier, S., Colomb, A., Dolgorouky, C., Gros, V., Lopez, M., Sarda-Esteve, R., Holloway, J., Stutz, J., Petetin, H., McKeen, S., Beekmann, M., Warneke, C., Parrish, D. D., and de Gouw, J. A.: Emission ratios of anthropogenic volatile organic compounds in northern mid-latitude megacities: Observations versus emission inventories in Los Angeles and Paris, J. Geophys. Res.-Atmos., 118, 2041–2057, https://doi.org/10.1002/jgrd.50059, 2013.
Bruns, E. A., Slowik, J. G., El Haddad, I., Kilic, D., Klein, F., Dommen, J., Temime-Roussel, B., Marchand, N., Baltensperger, U., and Prévôt, A. S. H.: Characterization of gas-phase organics using proton transfer reaction time-of-flight mass spectrometry: fresh and aged residential wood combustion emissions, Atmos. Chem. Phys., 17, 705–720, https://doi.org/10.5194/acp-17-705-2017, 2017.
Canonaco, F., Crippa, M., Slowik, J. G., Baltensperger, U., and Prévôt, A. S. H.: SoFi, an IGOR-based interface for the efficient use of the generalized multilinear engine (ME-2) for the source apportionment: ME-2 application to aerosol mass spectrometer data, Atmos. Meas. Tech., 6, 3649–3661, https://doi.org/10.5194/amt-6-3649-2013, 2013.
Cao, X., Yao, Z., Shen, X., Ye, Y., and Jiang, X.: On-road emission characteristics of VOCs from light-duty gasoline vehicles in Beijing, China, Atmos. Environ., 124, 146–155, https://doi.org/10.1016/j.atmosenv.2015.06.019, 2016.
Cappellin, L., Karl, T., Probst, M., Ismailova, O., Winkler, P. M., Soukoulis, C., Aprea, E., Märk, T. D., Gasperi, F., and Biasioli, F.: On quantitative determination of volatile organic compound concentrations using proton transfer reaction time-of-flight mass spectrometry, Environ. Sci. Technol., 46, 2283–2290, https://doi.org/10.1021/es203985t, 2012.
Coggon, M. M., Lim, C. Y., Koss, A. R., Sekimoto, K., Yuan, B., Gilman, J. B., Hagan, D. H., Selimovic, V., Zarzana, K., Brown, S. S., Roberts, J. M., Müller, M., Yokelson, R., Wisthaler, A., Krechmer, J. E., Jimenez, J. L., Cappa, C., Kroll, J., de Gouw, J., and Warneke, C.: OH-chemistry of non-methane organic gases (NMOG) emitted from laboratory and ambient biomass burning smoke: evaluating the influence of furans and oxygenated aromatics on ozone and secondary NMOG formation, Atmos. Chem. Phys. Discuss., 2019, 1–42, https://doi.org/10.5194/acp-2019-516, 2019.
Crutzen, P. J. and Andreae, M. O.: Biomass Burning in the Tropics: Impact on Atmospheric Chemistry and Biogeochemical Cycles, Science, 250, 1669–1678, https://doi.org/10.1126/science.250.4988.1669, 1990.
de Gouw, J. and Warneke, C.: Measurements of volatile organic compounds in the earth's atmosphere using proton-transfer-reaction mass spectrometry, Mass Spectrom. Rev., 26, 223–257, https://doi.org/10.1002/mas.20119, 2007.
de Gouw, J. A., Middlebrook, A. M., Warneke, C., Goldan, P. D., Kuster, W. C., Roberts, J. M., Fehsenfeld, F. C., Worsnop, D. R., Canagaratna, M. R., Pszenny, A. A. P., Keene, W. C., Marchewka, M., Bertman, S. B., and Bates, T. S.: Budget of organic carbon in a polluted atmosphere: Results from the New England Air Quality Study in 2002, J. Geophys. Res., 110, D16305, https://doi.org/10.1029/2004JD005623, 2005.
Derwent, R. G., Jenkin, M. E., Utembe, S. R., Shallcross, D. E., Murrells, T. P., and Passant, N. R.: Secondary organic aerosol formation from a large number of reactive man-made organic compounds, Sci. Total Environ., 408, 3374–3381, https://doi.org/10.1016/j.scitotenv.2010.04.013, 2010.
Ehn, M., Thornton, J. A., Kleist, E., Sipilä, M., Junninen, H., Pullinen, I., Springer, M., Rubach, F., Tillmann, R., Lee, B., Lopez-Hilfiker, F., Andres, S., Acir, I.-H., Rissanen, M., Jokinen, T., Schobesberger, S., Kangasluoma, J., Kontkanen, J., Nieminen, T., Kurtén, T., Nielsen, L. B., Jørgensen, S., Kjaergaard, H. G., Canagaratna, M., Maso, M. D., Berndt, T., Petäjä, T., Wahner, A., Kerminen, V.-M., Kulmala, M., Worsnop, D. R., Wildt, J., and Mentel, T. F.: A large source of low-volatility secondary organic aerosol, Nature, 506, 476, https://doi.org/10.1038/nature13032, 2014.
Fischer, E. V., Jacob, D. J., Yantosca, R. M., Sulprizio, M. P., Millet, D. B., Mao, J., Paulot, F., Singh, H. B., Roiger, A., Ries, L., Talbot, R. W., Dzepina, K., and Pandey Deolal, S.: Atmospheric peroxyacetyl nitrate (PAN): a global budget and source attribution, Atmos. Chem. Phys., 14, 2679–2698, https://doi.org/10.5194/acp-14-2679-2014, 2014.
Fraser, M. P., Cass, G. R., and Simoneit, B. R. T.: Gas-Phase and Particle-Phase Organic Compounds Emitted from Motor Vehicle Traffic in a Los Angeles Roadway Tunnel, Environ. Sci. Technol., 32, 2051–2060, https://doi.org/10.1021/es970916e, 1998.
Gani, S., Bhandari, S., Seraj, S., Wang, D. S., Patel, K., Soni, P., Arub, Z., Habib, G., Hildebrandt Ruiz, L., and Apte, J. S.: Submicron aerosol composition in the world's most polluted megacity: the Delhi Aerosol Supersite study, Atmos. Chem. Phys., 19, 6843–6859, https://doi.org/10.5194/acp-19-6843-2019, 2019.
Gentner, D. R., Worton, D. R., Isaacman, G., Davis, L. C., Dallmann, T. R., Wood, E. C., Herndon, S. C., Goldstein, A. H., and Harley, R. A.: Chemical Composition of Gas-Phase Organic Carbon Emissions from Motor Vehicles and Implications for Ozone Production, Environ. Sci. Technol., 47, 11837–11848, https://doi.org/10.1021/es401470e, 2013.
Graus, M., Muller, M., and Hansel, A.: High resolution PTR-TOF: quantification and formula confirmation of VOC in real time, J. Am. Soc. Mass. Spectrom., 21, 1037–1044, https://doi.org/10.1016/j.jasms.2010.02.006, 2010.
Hallquist, M., Wenger, J. C., Baltensperger, U., Rudich, Y., Simpson, D., Claeys, M., Dommen, J., Donahue, N. M., George, C., Goldstein, A. H., Hamilton, J. F., Herrmann, H., Hoffmann, T., Iinuma, Y., Jang, M., Jenkin, M. E., Jimenez, J. L., Kiendler-Scharr, A., Maenhaut, W., McFiggans, G., Mentel, T. F., Monod, A., Prévôt, A. S. H., Seinfeld, J. H., Surratt, J. D., Szmigielski, R., and Wildt, J.: The formation, properties and impact of secondary organic aerosol: current and emerging issues, Atmos. Chem. Phys., 9, 5155–5236, https://doi.org/10.5194/acp-9-5155-2009, 2009.
Hoque, R. R., Khillare, P. S., Agarwal, T., Shridhar, V., and Balachandran, S.: Spatial and temporal variation of BTEX in the urban atmosphere of Delhi, India, Sci. Total Environ., 392, 30–40, https://doi.org/10.1016/j.scitotenv.2007.08.036, 2008.
IPCC: Climate Change 2013: The Physical Science Basis, Contribution of Working Group I to the Fifth Assessment Report of the Intergovernmental Panel on Climate Change, edited by: Stocker, T. F., Qin, D., Plattner, G.-K., Tignor, M., Allen, S. K., Boschung, J., Nauels, A., Xia, Y., Bex, V., and Midgley, P. M., Cambridge University Press, Cambridge, UK and New York, USA, 2013.
Jordan, A., Haidacher, S., Hanel, G., Hartungen, E., Märk, L., Seehauser, H., Schottkowsky, R., Sulzer, P., and Märk, T. D.: A high resolution and high sensitivity proton-transfer-reaction time-of-flight mass spectrometer (PTR-TOF-MS), Int. J. Mass Spectrom., 286, 122–128, https://doi.org/10.1016/j.ijms.2009.07.005, 2009.
Kampa, M. and Castanas, E.: Human health effects of air pollution, Environ. Pollut., 151, 362–367, https://doi.org/10.1016/j.envpol.2007.06.012, 2008.
Karl, T. G., Christian, T. J., Yokelson, R. J., Artaxo, P., Hao, W. M., and Guenther, A.: The Tropical Forest and Fire Emissions Experiment: method evaluation of volatile organic compound emissions measured by PTR-MS, FTIR, and GC from tropical biomass burning, Atmos. Chem. Phys., 7, 5883–5897, https://doi.org/10.5194/acp-7-5883-2007, 2007.
Klein, F., Pieber, S. M., Ni, H., Stefenelli, G., Bertrand, A., Kilic, D., Pospisilova, V., Temime-Roussel, B., Marchand, N., El Haddad, I., Slowik, J. G., Baltensperger, U., Cao, J., Huang, R.-j., and Prévôt, A. S. H.: Characterization of Gas-Phase Organics Using Proton Transfer Reaction Time-of-Flight Mass Spectrometry: Residential Coal Combustion, Environ. Sci. Technol., 52, 2612–2617, https://doi.org/10.1021/acs.est.7b03960, 2018.
Koss, A. R., Sekimoto, K., Gilman, J. B., Selimovic, V., Coggon, M. M., Zarzana, K. J., Yuan, B., Lerner, B. M., Brown, S. S., Jimenez, J. L., Krechmer, J., Roberts, J. M., Warneke, C., Yokelson, R. J., and de Gouw, J.: Non-methane organic gas emissions from biomass burning: identification, quantification, and emission factors from PTR-ToF during the FIREX 2016 laboratory experiment, Atmos. Chem. Phys., 18, 3299–3319, https://doi.org/10.5194/acp-18-3299-2018, 2018.
Kumar, P., Khare, M., Harrison, R. M., Bloss, W. J., Lewis, A. C., Coe, H., and Morawska, L.: New directions: Air pollution challenges for developing megacities like Delhi, Atmos. Environ., 122, 657–661, https://doi.org/10.1016/j.atmosenv.2015.10.032, 2015.
Languille, B., Gros, V., Petit, J.-E., Honoré, C., Baudic, A., Perrussel, O., Foret, G., Michoud, V., Truong, F., Bonnaire, N., Sarda-Estève, R., Delmotte, M., Feron, A., Maisonneuve, F., Gaimoz, C., Formenti, P., Kotthaus, S., Haeffelin, M., and Favez, O.: Wood burning: A major source of Volatile Organic Compounds during wintertime in the Paris region, Sci. Total Environ., 2020, 711, 135055, https://doi.org/10.1016/j.scitotenv.2019.135055, 2019.
Lawrence, M. G. and Lelieveld, J.: Atmospheric pollutant outflow from southern Asia: a review, Atmos. Chem. Phys., 10, 11017–11096, https://doi.org/10.5194/acp-10-11017-2010, 2010.
Mahata, K. S., Rupakheti, M., Panday, A. K., Bhardwaj, P., Naja, M., Singh, A., Mues, A., Cristofanelli, P., Pudasainee, D., Bonasoni, P., and Lawrence, M. G.: Observation and analysis of spatiotemporal characteristics of surface ozone and carbon monoxide at multiple sites in the Kathmandu Valley, Nepal, Atmos. Chem. Phys., 18, 14113–14132, https://doi.org/10.5194/acp-18-14113-2018, 2018.
Meylan, W. M. and Howard, P. H.: Computer estimation of the Atmospheric gas-phase reaction rate of organic compounds with hydroxyl radicals and ozone, Chemosphere, 26, 2293–2299, https://doi.org/10.1016/0045-6535(93)90355-9, 1993.
McDonald, B. C., de Gouw, J. A., Gilman, J. B., Jathar, S. H., Akherati, A., Cappa, C. D., Jimenez, J. L., Lee-Taylor, J., Hayes, P. L., McKeen, S. A., Cui, Y. Y., Kim, S.-W., Gentner, D. R., Isaacman-VanWertz, G., Goldstein, A. H., Harley, R. A., Frost, G. J., Roberts, J. M., Ryerson, T. B., and Trainer, M.: Volatile chemical products emerging as largest petrochemical source of urban organic emissions, Science, 359, 760–764, https://doi.org/10.1126/science.aaq0524, 2018.
Mohr, C., Lopez-Hilfiker, F. D., Zotter, P., Prévôt, A. S. H., Xu, L., Ng, N. L., Herndon, S. C., Williams, L. R., Franklin, J. P., Zahniser, M. S., Worsnop, D. R., Knighton, W. B., Aiken, A. C., Gorkowski, K. J., Dubey, M. K., Allan, J. D., and Thornton, J. A.: Contribution of Nitrated Phenols to Wood Burning Brown Carbon Light Absorption in Detling, United Kingdom during Winter Time, Environ. Sci. Technol., 47, 6316–6324, https://doi.org/10.1021/es400683v, 2013.
Monks, P. S., Granier, C., Fuzzi, S., Stohl, A., Williams, M. L., Akimoto, H., Amann, M., Baklanov, A., Baltensperger, U., Bey, I., Blake, N., Blake, R. S., Carslaw, K., Cooper, O. R., Dentener, F., Fowler, D., Fragkou, E., Frost, G. J., Generoso, S., Ginoux, P., Grewe, V., Guenther, A., Hansson, H. C., Henne, S., Hjorth, J., Hofzumahaus, A., Huntrieser, H., Isaksen, I. S. A., Jenkin, M. E., Kaiser, J., Kanakidou, M., Klimont, Z., Kulmala, M., Laj, P., Lawrence, M. G., Lee, J. D., Liousse, C., Maione, M., McFiggans, G., Metzger, A., Mieville, A., Moussiopoulos, N., Orlando, J. J., O'Dowd, C. D., Palmer, P. I., Parrish, D. D., Petzold, A., Platt, U., Pöschl, U., Prévôt, A. S. H., Reeves, C. E., Reimann, S., Rudich, Y., Sellegri, K., Steinbrecher, R., Simpson, D., ten Brink, H., Theloke, J., van der Werf, G. R., Vautard, R., Vestreng, V., Vlachokostas, C., and von Glasow, R.: Atmospheric composition change – global and regional air quality, Atmos. Environ., 43, 5268–5350, https://doi.org/10.1016/j.atmosenv.2009.08.021, 2009.
Müller, M., Graus, M., Wisthaler, A., Hansel, A., Metzger, A., Dommen, J., and Baltensperger, U.: Analysis of high mass resolution PTR-TOF mass spectra from 1,3,5-trimethylbenzene (TMB) environmental chamber experiments, Atmos. Chem. Phys., 12, 829–843, https://doi.org/10.5194/acp-12-829-2012, 2012.
Nurmatov, U. B., Tagieva, N., Semple, S., Devereux, G., and Sheikh, A.: Volatile organic compounds and risk of asthma and allergy: a systematic review and meta-analysis of observational and interventional studies, Pri. Care Resp. J., 22, PS9, https://doi.org/10.4104/pcrj.2013.00010, 2013.
Paatero, P. and Tapper, U.: Positive matrix factorization: A non-negative factor model with optimal utilization of error estimates of data values, Environmetrics, 5, 111–126, https://doi.org/10.1002/env.3170050203, 1994.
Paatero, P.: The Multilinear Engine—A Table-Driven, Least Squares Program for Solving Multilinear Problems, Including the n-Way Parallel Factor Analysis Model, J. Comput. Graph. Stat., 8, 854–888, https://doi.org/10.1080/10618600.1999.10474853, 1999.
Paatero, P. and Hopke, P. K.: Discarding or downweighting high-noise variables in factor analytic models, Anal. Chim. Acta, 490, 277–289, https://doi.org/10.1016/S0003-2670(02)01643-4, 2003.
Pallavi, Sinha, B., and Sinha, V.: Source apportionment of volatile organic compounds in the northwest Indo-Gangetic Plain using a positive matrix factorization model, Atmos. Chem. Phys., 19, 15467–15482, https://doi.org/10.5194/acp-19-15467-2019, 2019.
Pieber, S. M., Kumar, N. K., Klein, F., Comte, P., Bhattu, D., Dommen, J., Bruns, E. A., Kılıç, D., El Haddad, I., Keller, A., Czerwinski, J., Heeb, N., Baltensperger, U., Slowik, J. G., and Prévôt, A. S. H.: Gas-phase composition and secondary organic aerosol formation from standard and particle filter-retrofitted gasoline direct injection vehicles investigated in a batch and flow reactor, Atmos. Chem. Phys., 18, 9929–9954, https://doi.org/10.5194/acp-18-9929-2018, 2018.
Platt, S. M., El Haddad, I., Pieber, S. M., Zardini, A. A., Suarez-Bertoa, R., Clairotte, M., Daellenbach, K. R., Huang, R. J., Slowik, J. G., Hellebust, S., Temime-Roussel, B., Marchand, N., de Gouw, J., Jimenez, J. L., Hayes, P. L., Robinson, A. L., Baltensperger, U., Astorga, C., and Prévôt, A. S. H.: Gasoline cars produce more carbonaceous particulate matter than modern filter-equipped diesel cars, Sci. Rep., 7, 4926, https://doi.org/10.1038/s41598-017-03714-9, 2017.
Rai, P., Furger, M., El Haddad, I., Kumar, V., Wang, L., Singh, A., Dixit, K., Bhattu, D., Petit, J.-E., Ganguly, D., Rastogi, N., Baltensperger, U., Tripathi, S. N., Slowik, J. G., and Prévôt, A. S. H.: Real-time measurement and source apportionment of elements in Delhi's atmosphere, Sci. Total Environ., 742, 140332, https://doi.org/10.1016/j.scitotenv.2020.140332, 2020.
Sahu, L. K. and Saxena, P.: High time and mass resolved PTR-TOF-MS measurements of VOCs at an urban site of India during winter: Role of anthropogenic, biomass burning, biogenic and photochemical sources, Atmos. Res., 164–165, 84–94, https://doi.org/10.1016/j.atmosres.2015.04.021, 2015.
Sahu, S. K., Beig, G., and Parkhi, N. S.: Emissions inventory of anthropogenic PM2.5 and PM10 in Delhi during Commonwealth Games 2010, Atmos. Environ., 45, 6180–6190, https://doi.org/10.1016/j.atmosenv.2011.08.014, 2011.
Sekimoto, K., Koss, A. R., Gilman, J. B., Selimovic, V., Coggon, M. M., Zarzana, K. J., Yuan, B., Lerner, B. M., Brown, S. S., Warneke, C., Yokelson, R. J., Roberts, J. M., and de Gouw, J.: High- and low-temperature pyrolysis profiles describe volatile organic compound emissions from western US wildfire fuels, Atmos. Chem. Phys., 18, 9263-9281, 10.5194/acp-18-9263-2018, 2018.
Sharma, S. K., Mandal, T. K., Saxena, M., Rashmi, R., Sharma, A., and Gautam, R.: Source apportionment of PM10 by using positive matrix factorization at an urban site of Delhi, India, Urban Climate, 10, 656–670, https://doi.org/10.1016/j.uclim.2013.11.002, 2014.
Srivastava, A.: Source apportionment of ambient VOCs in Mumbai city, Atmos. Environ., 38, 6829–6843, https://doi.org/10.1016/j.atmosenv.2004.09.009, 2004.
Srivastava, A., Sengupta, B., and Dutta, S. A.: Source apportionment of ambient VOCs in Delhi City, Sci. Total Environ., 343, 207–220, https://doi.org/10.1016/j.scitotenv.2004.10.008, 2005.
Stockwell, C. E., Veres, P. R., Williams, J., and Yokelson, R. J.: Characterization of biomass burning emissions from cooking fires, peat, crop residue, and other fuels with high-resolution proton-transfer-reaction time-of-flight mass spectrometry, Atmos. Chem. Phys., 15, 845–865, https://doi.org/10.5194/acp-15-845-2015, 2015.
Tiitta, P., Leskinen, A., Hao, L., Yli-Pirilä, P., Kortelainen, M., Grigonyte, J., Tissari, J., Lamberg, H., Hartikainen, A., Kuuspalo, K., Kortelainen, A. M., Virtanen, A., Lehtinen, K. E. J., Komppula, M., Pieber, S., Prévôt, A. S. H., Onasch, T. B., Worsnop, D. R., Czech, H., Zimmermann, R., Jokiniemi, J., and Sippula, O.: Transformation of logwood combustion emissions in a smog chamber: formation of secondary organic aerosol and changes in the primary organic aerosol upon daytime and nighttime aging, Atmos. Chem. Phys., 16, 13251–13269, https://doi.org/10.5194/acp-16-13251-2016, 2016.
Wagner, P. and Kuttler, W.: Biogenic and anthropogenic isoprene in the near-surface urban atmosphere — A case study in Essen, Germany, Sci. Total Environ., 475, 104–115, https://doi.org/10.1016/j.scitotenv.2013.12.026, 2014.
Wang, L., Tripathi, S. N., and Prévôt, A. S. H.: Source characterization of volatile organic compounds measured by PTR-ToF-MS in Delhi, India, Zenodo, https://doi.org/10.5281/zenodo.3931977, 2020.
WHO, Ambient (outdoor) air pollution in cities database 2014, report, World Health Organization, Geneva, 2014.
Wu, R., and Xie, S.: Spatial Distribution of Ozone Formation in China Derived from Emissions of Speciated Volatile Organic Compounds, Environ. Sci. Technol., 51, 2574–2583, https://doi.org/10.1021/acs.est.6b03634, 2017.
Wu, R., and Xie, S.: Spatial Distribution of Secondary Organic Aerosol Formation Potential in China Derived from Speciated Anthropogenic Volatile Organic Compound Emissions, Environ. Sci. Technol., 52, 8146–8156, https://doi.org/10.1021/acs.est.8b01269, 2018.
Yao, Z., Shen, X., Ye, Y., Cao, X., Jiang, X., Zhang, Y., and He, K.: On-road emission characteristics of VOCs from diesel trucks in Beijing, China, Atmos. Environ., 103, 87–93, https://doi.org/10.1016/j.atmosenv.2014.12.028, 2015.
Yokelson, R. J., Crounse, J. D., DeCarlo, P. F., Karl, T., Urbanski, S., Atlas, E., Campos, T., Shinozuka, Y., Kapustin, V., Clarke, A. D., Weinheimer, A., Knapp, D. J., Montzka, D. D., Holloway, J., Weibring, P., Flocke, F., Zheng, W., Toohey, D., Wennberg, P. O., Wiedinmyer, C., Mauldin, L., Fried, A., Richter, D., Walega, J., Jimenez, J. L., Adachi, K., Buseck, P. R., Hall, S. R., and Shetter, R.: Emissions from biomass burning in the Yucatan, Atmos. Chem. Phys., 9, 5785–5812, https://doi.org/10.5194/acp-9-5785-2009, 2009.
Yuan, Y., Zhao, X., Wang, S., and Wang, L.: Atmospheric Oxidation of Furan and Methyl-Substituted Furans Initiated by Hydroxyl Radicals, J. Phys. Chem. A, 121, 9306–9319, 0.1021/acs.jpca.7b09741, 2017.