the Creative Commons Attribution 4.0 License.
the Creative Commons Attribution 4.0 License.
 | 18 Aug 2020
Quantifying the sensitivity of aerosol optical properties to the parameterizations of physico-chemical processes during the 2010 Russian wildfires and heatwave
Laura Palacios-Peña
Philip Stier
Raquel Lorente-Plazas
Pedro Jiménez-Guerrero
The impact of aerosol–radiation and aerosol–cloud interactions on the radiative forcing is subject to large uncertainties. This is caused by the limited understanding of aerosol optical properties and the role of aerosols as cloud condensation/ice nuclei (CCN/IN). On the other hand, aerosol optical properties and vertical distribution are highly related, and their uncertainties come from different processes. This work attempts to quantify the sensitivity of aerosol optical properties (i.e. aerosol optical depth; AOD) and their vertical distribution (using the extinction coefficient, backscatter coefficient, and concentrations' species profiles) to key processes. In order to achieve this objective, sensitivity tests have been carried out, using the WRF-Chem regional fully coupled model by modifying the dry deposition, sub-grid convective transport, relative humidity, and wet scavenging. The 2010 Russian heatwave–wildfires episode has been selected as case study.
Results indicate that AOD is sensitive to these key processes in the following order of importance: (1) modification of relative humidity, causing AOD differences of up to 0.6; (2) modification of vertical convection transport with AOD differences around −0.4; and (3) the dry deposition with AOD absolute differences of up to −0.35 and 0.3. Moreover, these AOD changes exhibit a nonlinear response. Both an increase and a decrease in the RH result in higher AOD values. On the other hand, both the increase and offset of the sub-grid convective transport lead to a reduction in the AOD over the fire area. In addition, a similar nonlinear response is found when reducing the dry deposition velocity; in particular, for the accumulation mode where the concentration of several species increases (while a decrease might be expected). These nonlinear responses are highly dependent on the equilibrium of the thermodynamics system sulfate–nitrate–SOA (secondary organic aerosol). In this sense, small changes in the concentration of one species can strongly affect others, finally affecting aerosol optical properties. Changes in this equilibrium could come from modifications in relative humidity, dry deposition, or vertical convective transport. By itself, dry deposition also presents a high uncertainty influencing the AOD representation.
- Article
(6722 KB) - Full-text XML
-
Supplement
(5096 KB) - BibTeX
- EndNote


Since the First Assessment Report of the Intergovernmental Panel on Climate Change (IPCC), a wide scientific consensus identifies atmospheric aerosols and clouds as one of the forcing agents with the largest uncertainty in the climate system (Charlson et al., 1992; Schimel et al., 1996; Penner et al., 2001; Randall et al., 2007; Forster et al., 2007; Boucher, 2015). Atmospheric aerosols modify the Earth's radiative budget through aerosol–radiation interactions (ARIs) and aerosol–cloud interactions (ACIs). ARIs lead to a redistribution of radiative energy in the atmosphere through scattering and absorption. In addition, ACIs modify cloud microphysical properties and precipitation regimes as well as cloud effects on radiation (Randall et al., 2007; Boucher et al., 2013).
ARIs and ACIs are strongly dependent on aerosol optical properties and the ability of aerosols to act as cloud condensation nuclei (CCN) or ice nuclei (IN), which are controlled by the spatio-temporal aerosol distribution, the aerosol size, composition and mixing state (Stier et al., 2005). Thus, to determine and constrain the uncertainty in aerosol optical properties is a key issue for a better assessment of the uncertainty in aerosol effects.
Numerical models are useful tools for understanding the different parameters influencing the atmospheric system, such as aerosol optical properties. The complexity of how aerosols are treated in models varies widely, since these models take into account processes as emission, transport, deposition, microphysics, and chemistry (Kipling et al., 2016). Differences in complexity primarily arise from representations of aerosol size distribution and mixing states. The most complex and realistic models are those considering the inclusion of ARIs and ACIs, since they allow a fully coupled interaction of aerosols, meteorology, radiation, and chemistry. One example of these numerical models is WRF-Chem (Grell et al., 2005), used in this work. Notwithstanding the complexity of aerosol treatment in these models, there are still high uncertainties in processes representing the aerosol optical properties.
As stated by previous works (e.g. Palacios-Peña et al., 2017, 2018, 2019a), uncertainties in aerosol optical properties may be influenced by a number of factors, namely emissions, aerosol mass concentration, particle size representation (Balzarini et al., 2015), vertical distribution and location with respect to other forcing agents as clouds (Kipling et al., 2016), dry deposition and CCN (Romakkaniemi et al., 2012; Lee et al., 2013; Forkel et al., 2015), relative humidity (RH; Yoon and Kim, 2006; Zhang et al., 2012; Altaratz et al., 2013; Weigum et al., 2016), and aerosol internal mixing rules (Curci et al., 2019; Zhang et al., 2012).
Precisely, aerosol vertical distribution is highly influenced by aerosol optical properties (Palacios-Peña et al., 2018, 2019a). Hence, Kipling et al. (2016) investigated the uncertainty in the vertical layering of aerosol particles for different parameters: convective transport, emissions injection, and size; vertical advection, boundary-layer mixing, entrainment into convective plumes, condensation, coagulation, nucleation, aqueous chemistry, ageing of insoluble particles, Aitken transition to accumulation mode, dry deposition, in-cloud and below-cloud scavenging, and re-evaporation. The convective transport and the in-cloud scavenging were found to be very important when controlling the vertical profile of all-aerosol components by mass and those with the highest influence on aerosol optical depth (AOD; Kipling et al., 2016).
The representation of CCN has been also identified as another second-order source of uncertainty in aerosol optical properties, such as AOD. An increase in downward solar radiation was found by Forkel et al. (2015) and Romakkaniemi et al. (2012) when ACIs were taken into account. This latter contribution found a relationship between a reduction in the AOD and CCN, because the inclusion of ACI in numerical models leads to a reduction in CCN by the condensation kinetics of water during cloud droplet formation. This induces a reduction of the cloud droplet number, the cloud liquid water, and, finally, an increase in downward solar radiation. In addition to AOD, CCN conditioned the uncertainty in ACI, as well as cloud occurrence and cloud-related processes (updraught speeds, precipitation processes, etc.). Because of that, the high uncertainty existing when modelling CCN was evaluated by Lee et al. (2013), finding that dry deposition was the most important process for this uncertainty over more than 28 model parameters selected by expert elicitation, including nucleation, aerosol ageing, pH of cloud drops, nucleation scavenging, dry deposition, modal with mode separation diameter, emissions, and production of secondary organic aerosols (SOA). These results, which are partly because wet deposition was not fully varied, were found in one model framework (with its own structural uncertainties).
Another source of uncertainty is the aerosol variability at scales smaller than the model's grid box, which can hamper the representation of aerosol optical properties. This fact was brought to light in Weigum et al. (2016), where the aerosol water uptake through aerosol–gas equilibrium reactions was established as one of the most affected processes by this variability. The inherent nonlinearities in these processes result in large changes in aerosol properties that are exaggerated by convective transport. The uncertainties in RH also contribute to those of aerosol optical properties due to their dependence in hygroscopic growth (Yoon and Kim, 2006; Zhang et al., 2012; Altaratz et al., 2013; Palacios-Peña et al., 2019a).
Bearing in mind the uncertainties described above, the aim of this work is to shed some light on the uncertainties when representing aerosol optical properties. In order to achieve this aim, this contribution quantifies the sensitivity of aerosol optical properties and their vertical distribution (which may condition aerosol radiative forcing) to several aerosol processes and parameters. This quantification has been estimated by sensitivity tests carried out using the WRF-Chem regional fully coupled model. Modified aerosol processes and parameters are dry deposition, sub-grid convective transport, relative humidity, and wet scavenging.
Sensitivity tests have been conducted to assess the impact of the most relevant processes for representing aerosol optical properties. For that, the WRF-Chem model (Grell et al., 2005) version 3.9.1.1 has been utilized. The 2010 Russian heatwave–wildfires episode has been selected as a case study because of the literature available referring to this episode (see Sect. 2.1). To achieve this objective, aerosol dry deposition velocity, sub-grid convective transport, aerosol water uptake, and wet scavenging were the processes scaled. The degree of impact of these processes is evaluated by analysing the AOD at 550 nm, different vertical profiles for extinction (α) and backscatter coefficient (β) at 532 nm, and the concentration profiles of different aerosol species. The AOD is defined as the vertical integral of extinction in the total atmospheric column.
2.1 The 2010 Russian wildfires and heatwave episode
The 2010 Russian wildfires and heatwave episode occurred approximately from 25 July to 15 August 2010 and lasted a total of 22 d. This was an anomalous heatwave, termed as “mega-heatwave” by Barriopedro et al. (2011), with a prolonged blocking anticyclone situation which favoured an increase in the summer temperature (close to 9∘ larger than 2002–2009 summers), promoting larger wildfires (Bondur, 2011). This prolonged blocking situation has been attributed to global warming leading to very high sea surface temperatures in several places around the world, due to the action of the ENSO (El Niño–Southern Oscillation), which altered the atmospheric circulation by forcing quasistationary Rossby waves (Sedlàček et al., 2011; Lau and Kim, 2012; Trenberth and Fasullo, 2012). In addition, according to Rahmstorf and Coumou (2011), the 2010 July heat record in Moscow was caused by climate warming with approximate 80 % probability.
With respect to air quality, this is a well-known and widely studied episode. Many of these works analysed the physico-chemical characteristics of the smoke from wildfires and the effects on air quality of the transport (both particles and trace gases) to surrounding areas (Zvyagintsev et al., 2011; Witte et al., 2011; van Donkelaar et al., 2011; Gorchakov et al., 2014; Safronov et al., 2015), medium-range transport (e.g. Finland) (Portin et al., 2012; Mielonen et al., 2013), or long-range transport, even reaching Greece (Diapouli et al., 2014).
Among all these reasons, this heatwave has been extensively investigated because of the particularly significant interactions between meteorology and chemistry/particles during this strong air pollution episode (Makar et al., 2015b, a; Kong et al., 2015). This episode was one of the case studies within the COST Action ES1004 EuMetChem (European framework for online integrated air quality and meteorology modelling; see http://www.eumetchem.info/, 13 July 2019) chosen from the previous experience of Phase 2 of the Air Quality Modelling Evaluation International Initiative (AQMEII; Galmarini et al., 2015).
The effects of air pollution on meteorology were evinced by Konovalov et al. (2011), Chubarova et al. (2012), and Wong et al. (2012), among others. These studies demonstrated changes in atmospheric regional conditions caused by a modification in the composition of atmospheric gases and also because of changes in optical and radiative characteristics of aerosols coming from the fire emissions. Gorchakov et al. (2014) detected a regional mean AOD of 1.02±0.02 and a single-scattering albedo of 0.95, and estimated a regional mean aerosol radiative forcing at the top and the bottom of the atmosphere of and W m−2, respectively.
When aerosol interactions were taken into account, a reduction of solar radiation on the ground of up to 50 W m−2 in diurnal averages and in the near-surface air temperature between 0.2 and 2.6 K was evaluated on a regional scale over most of eastern Europe. Similarly, a reduction in the planetary boundary layer (PBL) height from 13 % to 65 % and the vertical wind speed from 5 % to 80 % were found by Péré et al. (2014). Baró et al. (2017) reported similar results on surface winds caused by a decrease in the short-wave downwelling radiation at the surface, leading to a reduction of the 2 m temperature and hence reducing the turbulent flux and developing a more stable PBL. This cooling increases both the surface pressure over the Russian area and the RH (with values around +3.5 %). In the same case, Forkel et al. (2016) manifested a reduction between 10 and 100 W m−2 in the average downward short-wave radiation at the ground level and a drop in the mean 2 m temperature of almost 1 K over the area where the fires took place. On the other hand, Péré et al. (2015) evaluated the impact of aerosol solar extinction on the photochemistry, resulting in a reduction of the photolysis rates of NO2 and O3 by up to 50 % (daytime average) due to the aerosol extinction along the aerosol plume transported, as well as a reduction of the formation of secondary aerosols.
2.2 Model setup
As aforementioned, the version 3.9.1.1 of the fully coupled online WRF-Chem model (Grell et al., 2005) was used in order to simulate transport, mixing, and chemical transformation of trace gases and aerosols coupled to the meteorology (thus including ARI and ACI processes, among others).
Figure 1 displays the target domain of the simulations, which covered Europe with a horizontal resolution of ∼23 km. However, in order to focus on the aerosol effects, a smaller window covering between 40 and 65∘ N and 20 and 60∘ E (green box in Fig. 1) was defined.
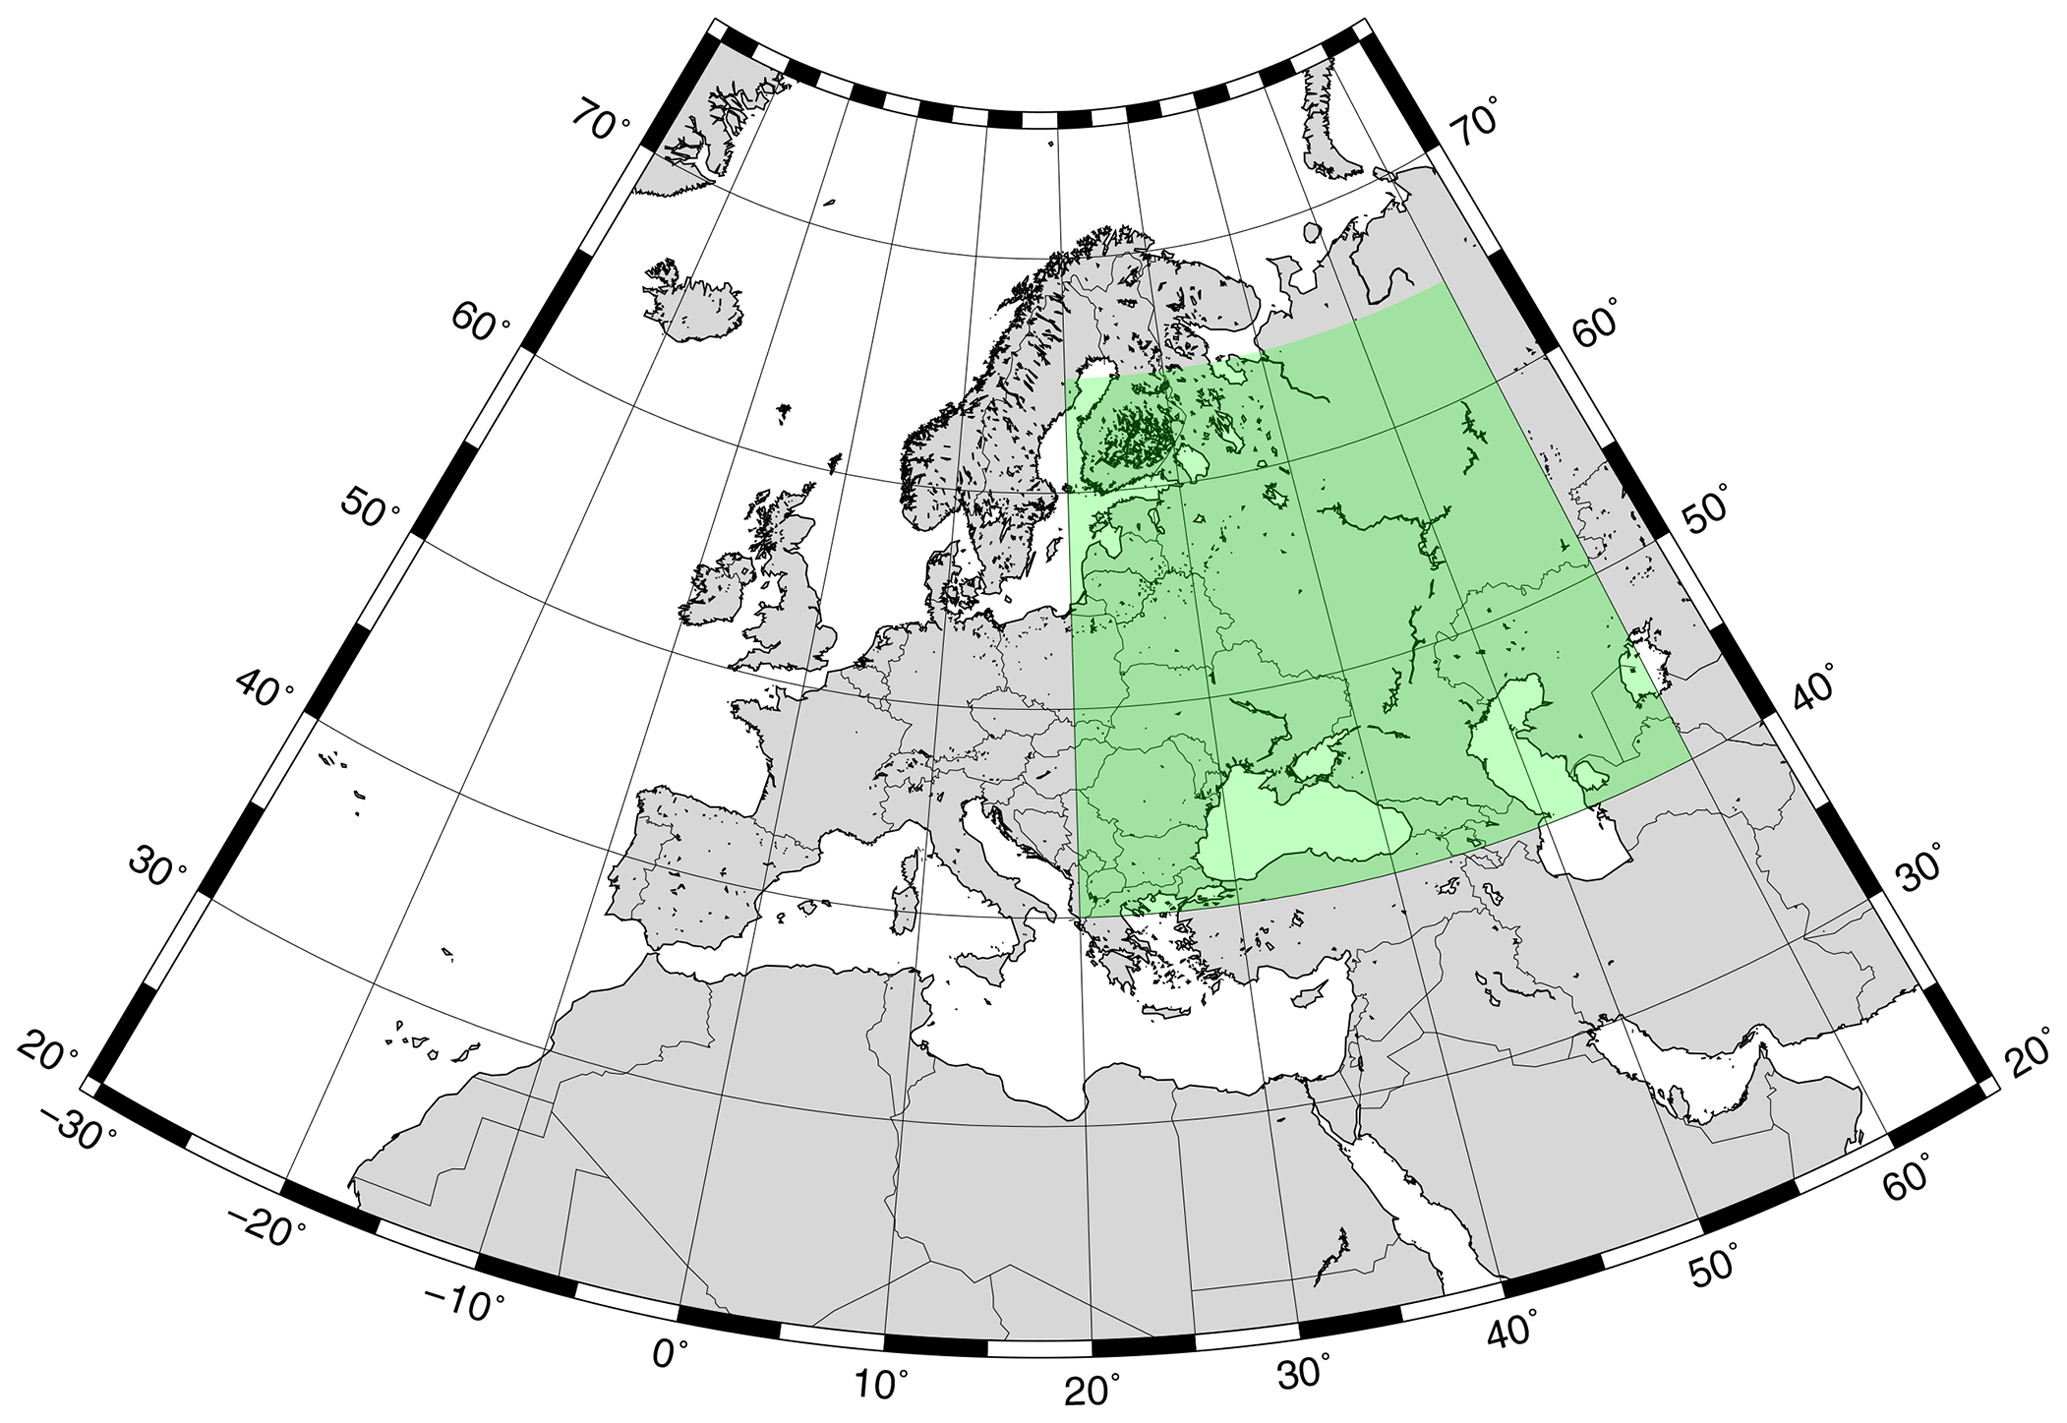
Figure 1Simulated domain (grey) and fire-affected target area (green box).
The definition of the modelling domain, initial and boundary meteorological and chemical conditions and different emissions has been built on the previous experiences of the COST Action EuMetChem and Phase 2 of the AQMEII initiative. However, in this case the simulations are continuous runs instead of reinitialized every 48 h (2 d time slices) as done in AQMEII and EuMetChem methodologies (Forkel et al., 2015). A spin-up period of 5 d has been considered for running the sensitivity tests.
Meteorological initial and boundary conditions (3-hourly data and 0.25∘ resolution) were provided by the European Centre for Medium-Range Weather Forecasts (ECMWF) operational archive. Chemistry boundary conditions (3-hourly data and 1.125∘ resolution) for the main trace gases and particulate matter concentrations were taken from the ECMWF Integrated Forecasting System – Model for Ozone and Related Chemical Tracers (IFS-MOZART) model run in the (MACC-II) project (Monitoring Atmospheric Composition and Climate-Interim Implementation; Inness et al., 2013).
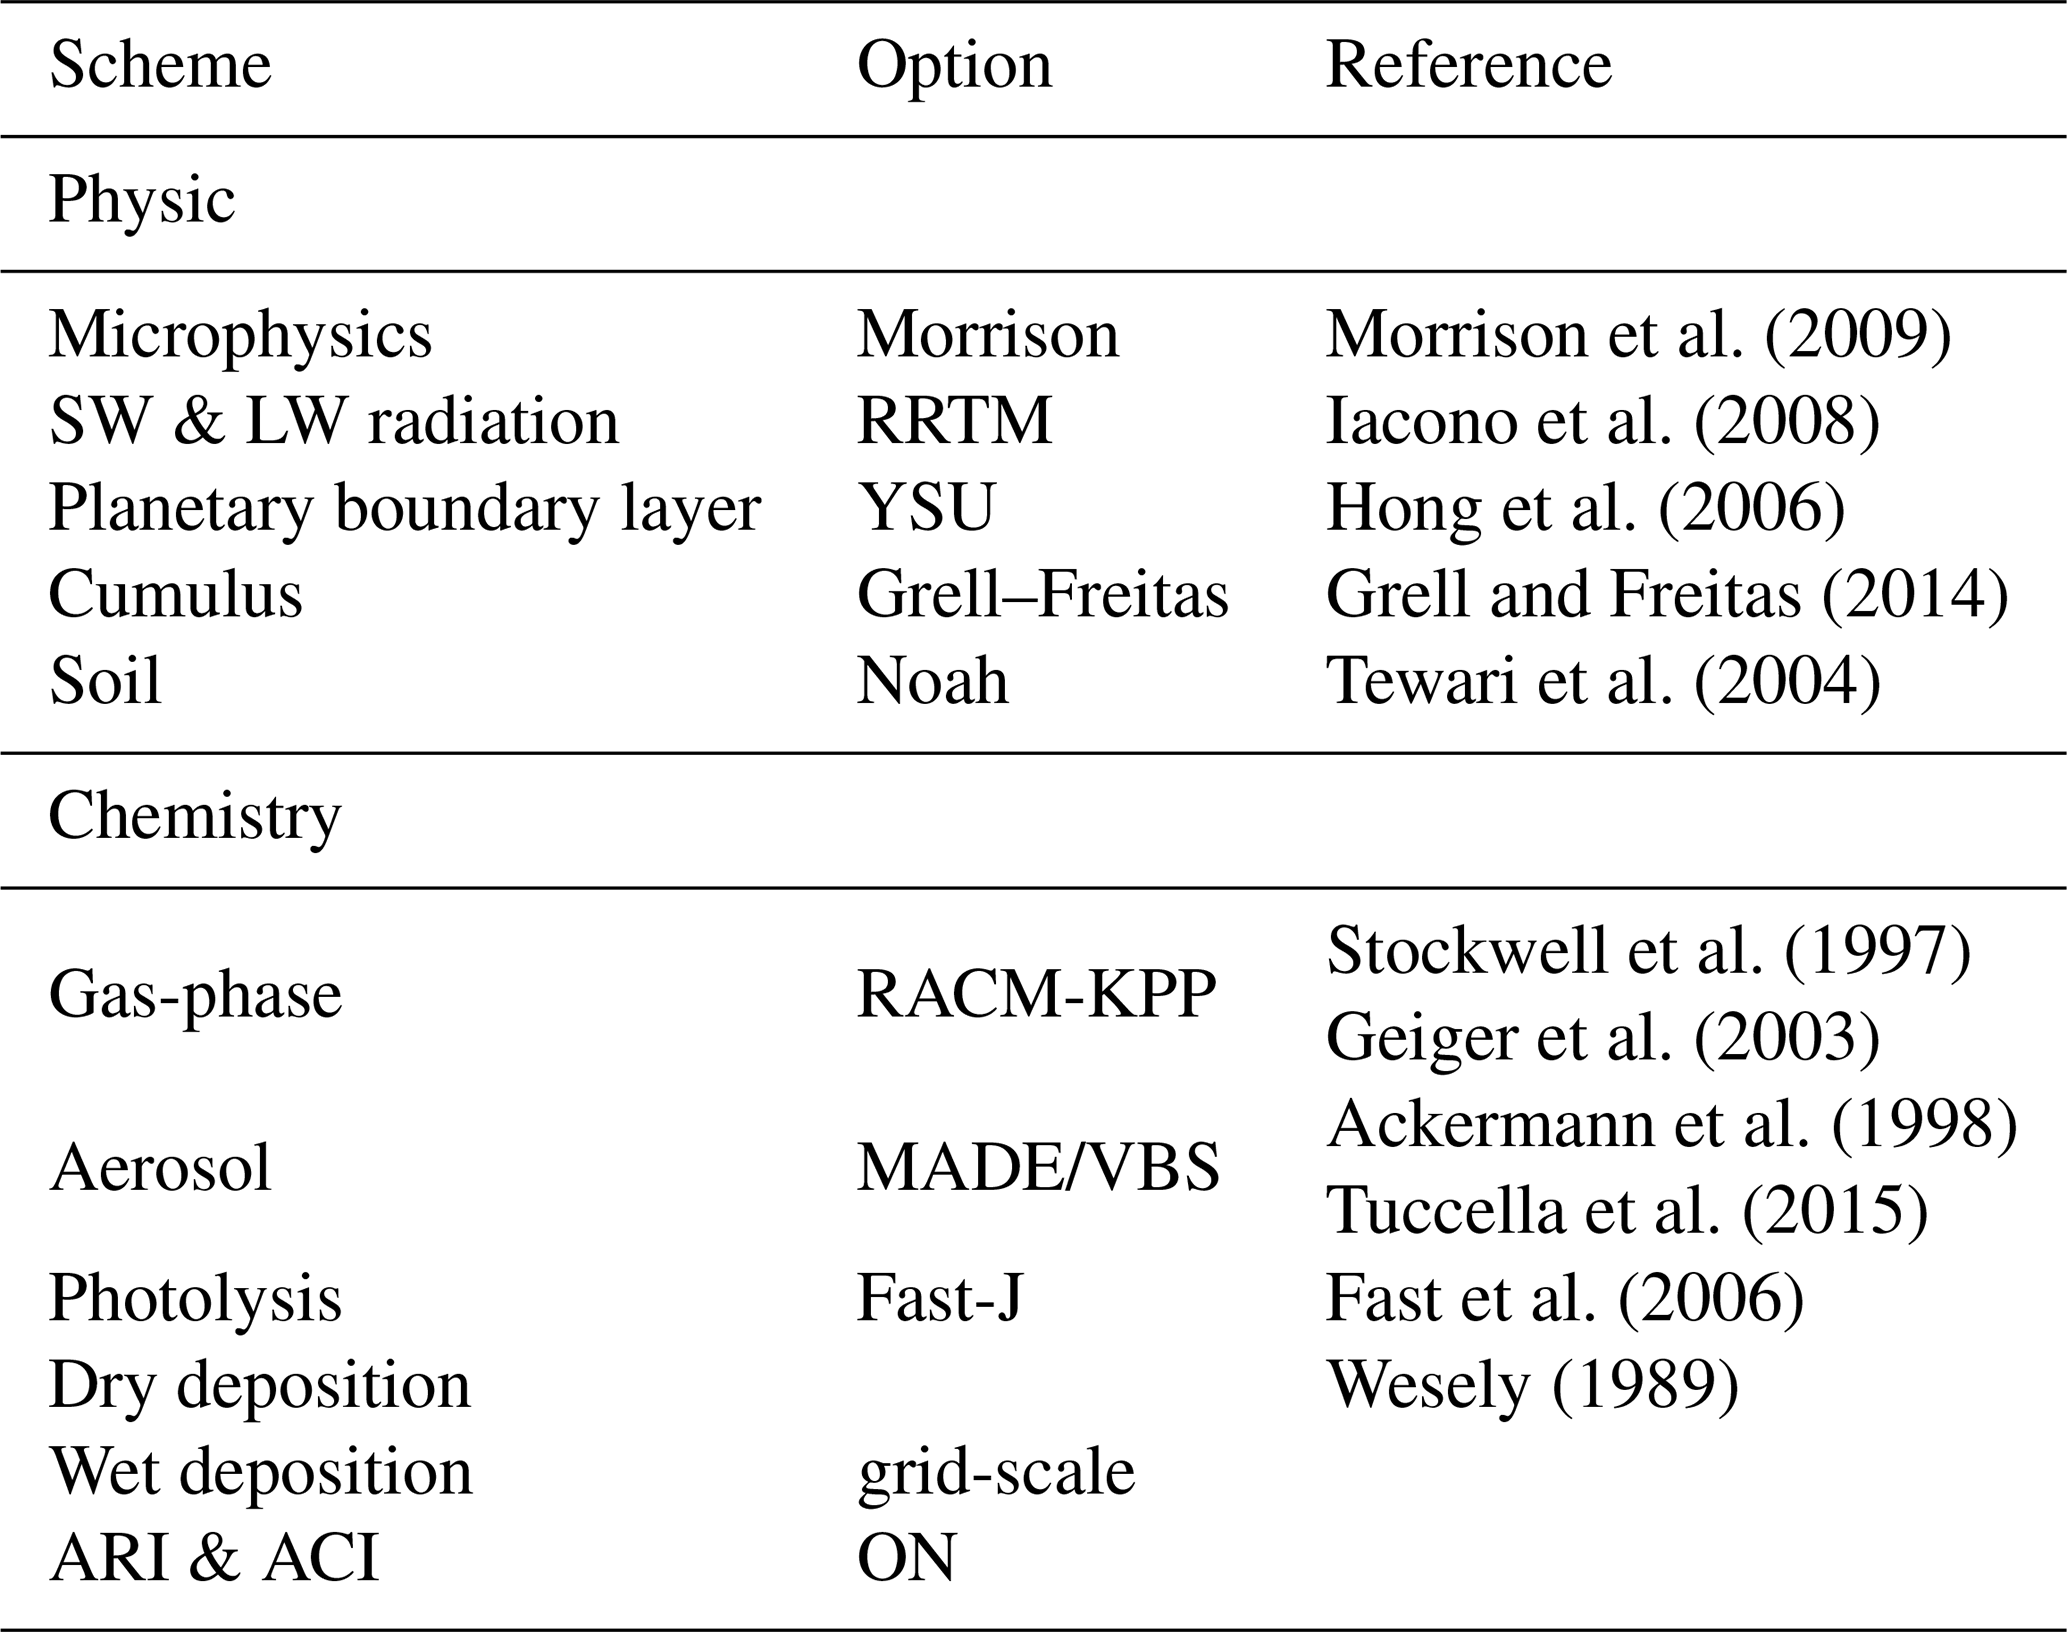
Annual anthropogenic emission (∼7 km resolution), whose details are described in Im et al. (2015a, b), came from the Netherlands Organization for Applied Scientific Research (TNO) MACC emissions inventory (Pouliot et al., 2012; Kuenen et al., 2014; Pouliot et al., 2015). CH4, CO, NH3, total non-methane volatile organic compounds (NMVOCs), NOx, PM (PM10 and PM2.5), and SO2 were available by 10 activity sectors. Schaap et al. (2005) provided temporal (diurnal, day-of-week, seasonal) and vertical emission profiles. Biomass burning emission data of the total PM emissions (daily data with a spatial resolution of 0.1∘) were derived from the project IS4FIRES (Integrated monitoring and modelling system for wild-land fires; Sofiev et al., 2009). As described by Soares et al. (2015) emissions were calculated from a reanalysis of the fire radiative power from MODIS on board Aqua and Terra satellites and calibration emission factors based on the comparison between observations and modelled data processed by the System for Integrated modeLing of Atmospheric coMposition (SILAM). Day and night vertical injection profiles were also provided. Finally, total PM emissions were transformed to WRF-Chem emission species following Andreae and Merlet (2001) and Wiedinmyer et al. (2011). No heat release due to the fires was considered. Uncertainties in this biomass burning emissions dataset were estimated by Soares et al. (2015) with an overestimation in-average of 20 %–30 % which could raise to about 50 % in specific episodes. This impacts on total emissions likely come from understated injection height, which can lead to overestimation of the near-surface concentration and reduction of elevated plumes; or a misinterpretation by MODIS of oil and gas flares and large industrial installation as fires. More details can be found in Soares et al. (2015). Table 1 summarizes the physico-chemical parameterizations and schemes used in the simulations.
Morrison et al. (2009)Iacono et al. (2008)Hong et al. (2006)Grell and Freitas (2014)Tewari et al. (2004)Stockwell et al. (1997)Geiger et al. (2003)Ackermann et al. (1998)Tuccella et al. (2015)Fast et al. (2006)Wesely (1989)Table 1WRF-Chem physical and chemical configuration used in the sensitivity tests.
The skills of the model to represent AOD during this episode have been evaluated in depth in Palacios-Peña et al. (2018, 2019a). The model skilfully represents low and mean AOD values but underestimates the high AOD over the Russian area due to two different hypotheses: (1) not considering the fire emissions from small fires (Toll et al., 2015; Wooster et al., 2005) or (2) a misrepresentation of the aerosol vertical profile based on the understated injection height of the total biomass burning emissions found by Soares et al. (2015).
2.3 Sensitivity tests
Table 2 summarizes the sensitivity tests carried out. As previously mentioned, the processes selected to be scaled include RH, dry deposition, sub-grid convective transport, and wet scavenging. They were chosen because they are considered as key sources of uncertainty when modelling atmospheric aerosol properties, and thus they are expected to impact the estimation of aerosol optical properties (e.g. Ackermann et al., 1998; Lee et al., 2013; Quan et al., 2016, among many others).
Table 2Description of the experiments carried out to perform the sensitivity tests of aerosol to different processes; changes of relative humidity (RH), dry deposition (DDV), convective transport, and wet scavenging.
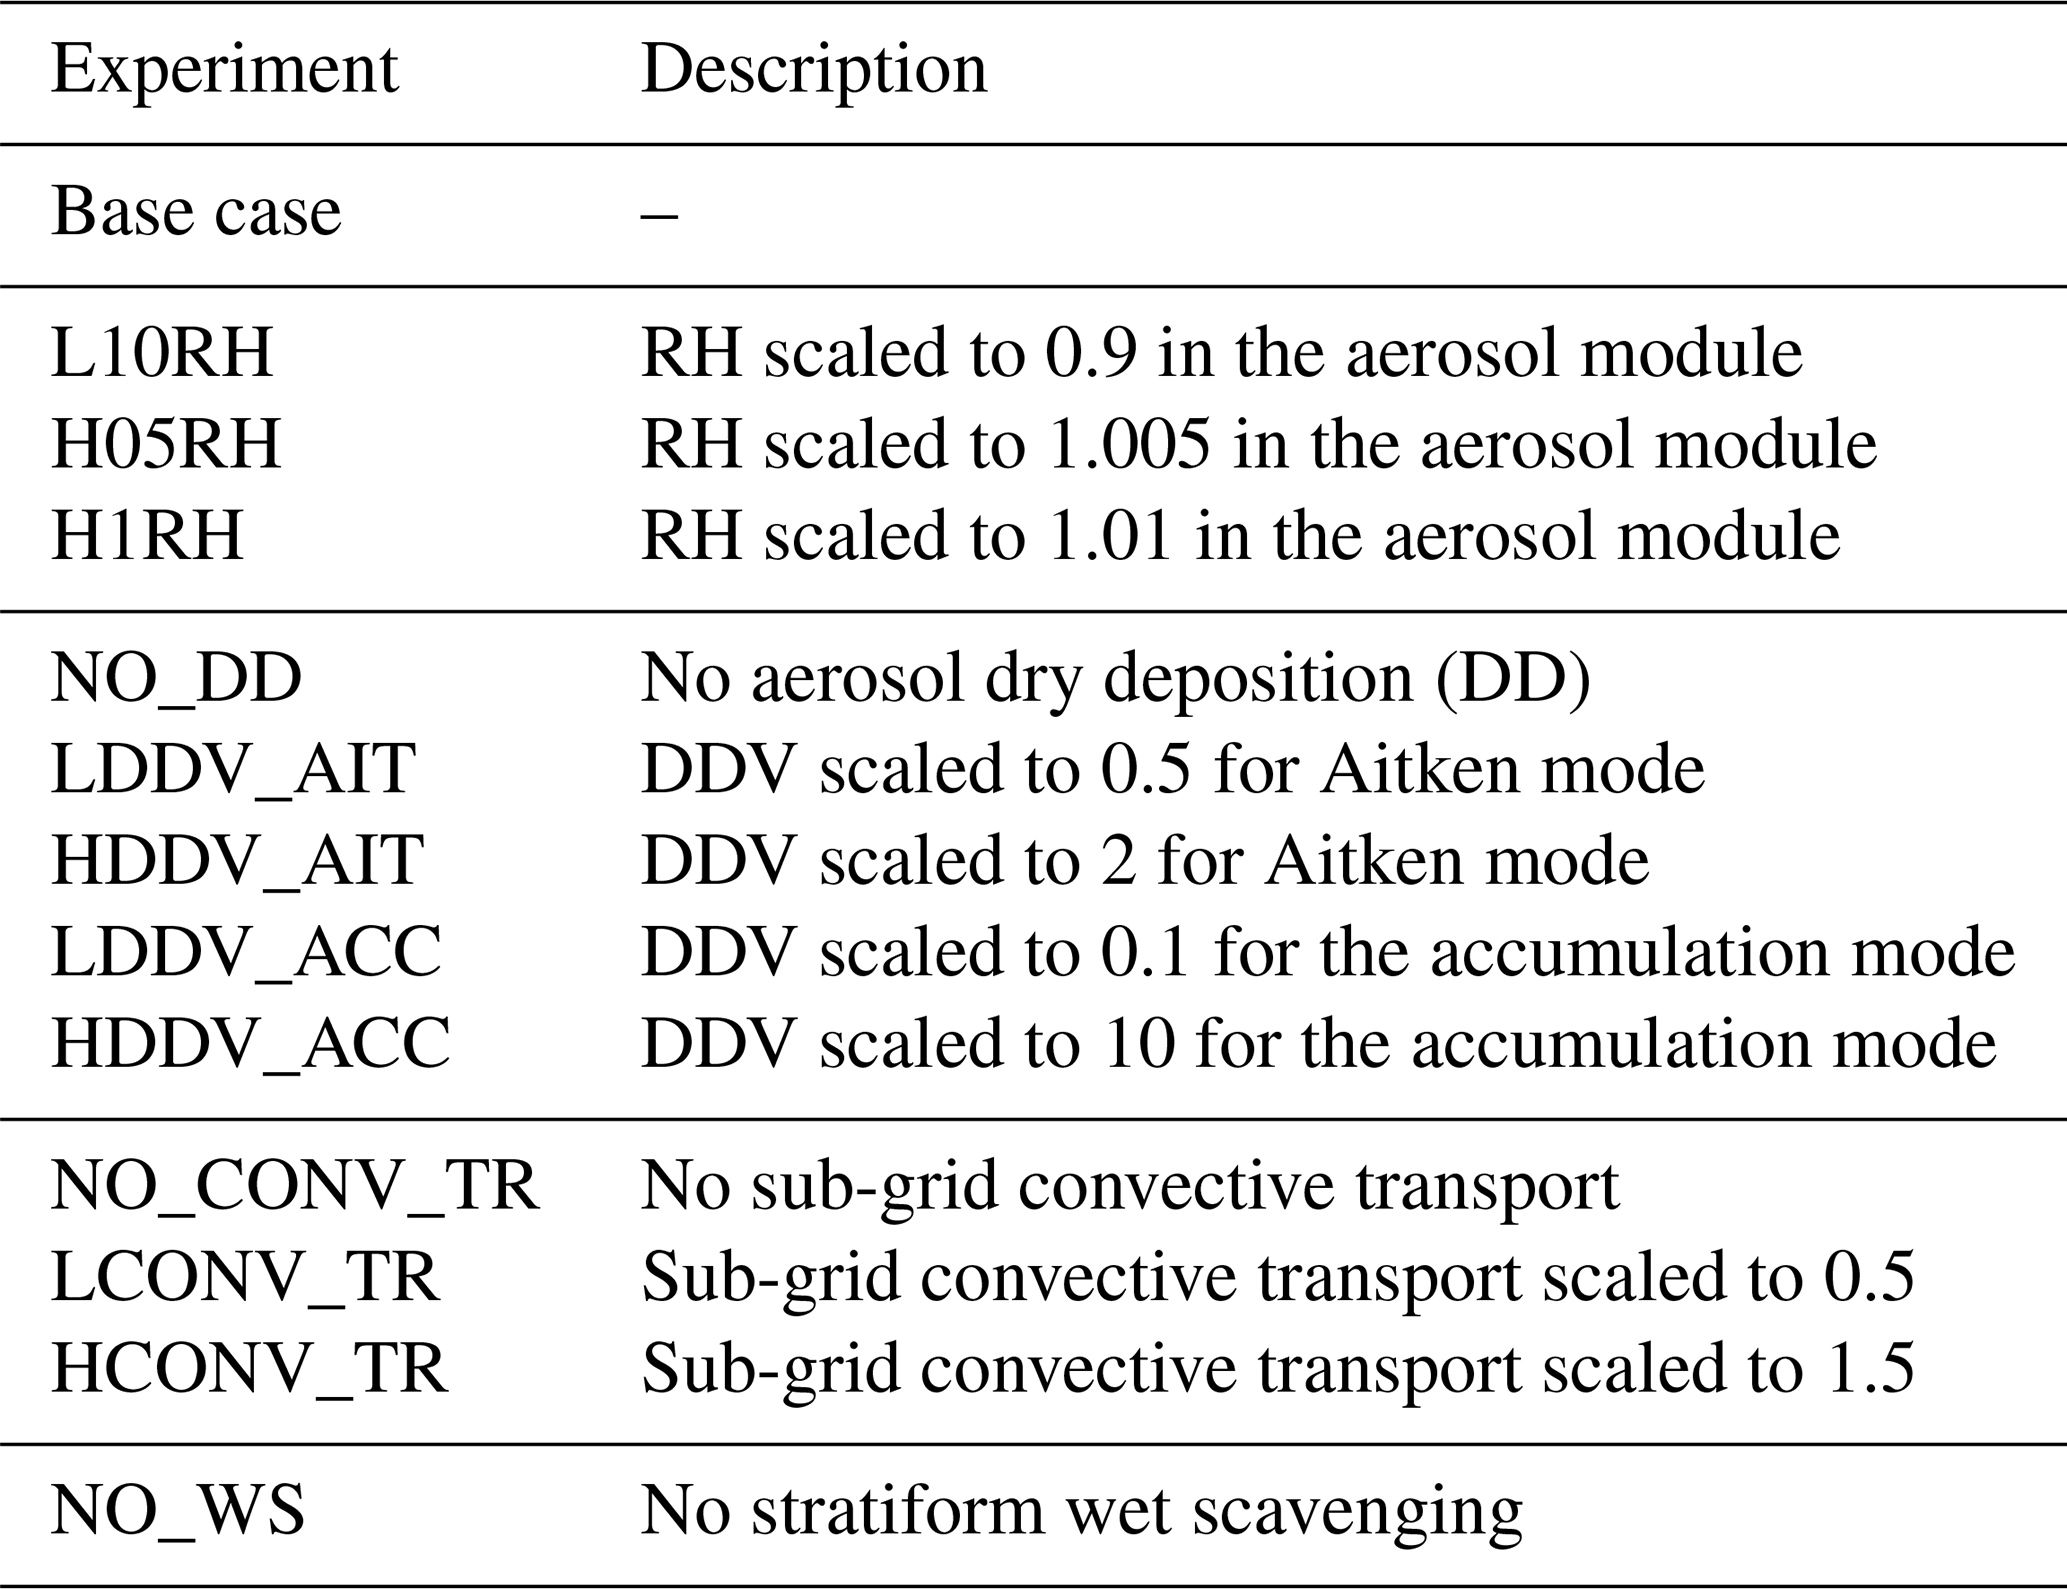
RH highly impacts aerosol properties by affecting several processes such as nucleation, chemistry, or uptake of water through aerosol–gas equilibrium reactions (Ackermann et al., 1998). Because of that, our sensitivity test for this variable modified the RH in the aerosol module of WRF-Chem (precisely, in the part of the code when RH enters the aerosol module). Hence, RH modification only affects aerosol properties and not meteorology. Following the evaluation of this meteorological variable conducted by Tuccella et al. (2012) and Žabkar et al. (2015), it was scaled to 0.9 (a reduction of 10 %). Although the translation into saturation only applies at saturation conditions, supersaturation values higher than 1 % are unlikely. Because of that, this variable could not be scaled by +10 % (to 1.1), and hence the chosen upper values were 1.005 and 1.01, that is, 0.5 % and 1 % supersaturation, respectively.
In this work, dry deposition velocity (DDV) is estimated by the MADE module (Ackermann et al., 1998) as in the Regional Particulate Model (RPM; Binkowski and Shankar, 1995). But in contrast to RPM, MADE calculates and applies deposition velocities separately for each mode (Aitken, accumulation and coarse). The method uses the aerodynamic resistance, the settling velocity and Brownian diffusivity; and then, the expressions from Slinn and Slinn (1980) and Pleim et al. (1984) are calculated by averaging the quantities over the kth moment of the distribution as in Kramm et al. (1992). The modification for our sensitivity test regarding dry deposition consists of scaling DDV by the values indicated in Table 2. Following Lee et al. (2013), DDV has been scaled to 0.5 and 2 for the Aitken mode and 0.1 and 10 for the accumulation mode, which are the two ends of the uncertainty range of these parameters. WRF-Chem configuration gives the opportunity to turn on/off the dry deposition of gases and aerosols. Thus, another sensitivity case corresponds to the WRF-Chem configuration with the dry deposition of aerosol turned off (aer_drydep_opt =0 in the namelist of the model).
Analogously to dry deposition, sub-grid convective transport in WRF-Chem can be turned on/off. This process is parametrized by a simple scheme (Grell and Dévényi, 2002) based on a convective parametrization developed by Grell (1993) and Grell et al. (1994). This scheme estimates the output temporal tendency (s−1) separately in the bottom layer and the rest of the layers. Afterwards this tendency is applied to the chemical concentration for each species in order to estimate the sub-grid convective transport. This tendency has been modified in our sensitivity test as indicated in Table 2. Following the evaluations carried out by Doherty et al. (2005) and Quan et al. (2016), the output temporal tendency has been scaled to ±50 %. Moreover, a case with sub-grid convective transport turned off (chem_conv_tr =0 in the model's namelist) has been run.
Aerosol wet scavenging in WRF-Chem follows the approach of Easter et al. (2004). This process is produced by impacting/interception and precipitation, when all aerosol species are assumed to be immediately wet-deposited. The model distinguishes between wet scavenging for large-scale and sub-grid stratiform and sub-grid convective clouds. Both stratiform (wetscav_onoff) and convective (conv_tr_wetscav) wet scavenging can be turned on/off in WRF-Chem. A case in which stratiform wet scavenging is turned off was run. This modification has been chosen because the evaluated episode was an anticyclonic situation without important convective clouds.
In this section the results of the sensitivity of AOD representation to changes in RH, DDV, wet scavenging, and convective transport are assessed, focusing on the Russian region affected by the heatwave–wildfires episode. Afterwards, a local evaluation of the vertical profiles is carried out in order to establish the influence of each process on aerosol vertical profiles.
3.1 Changes in total AOD
Figure 2, top left, displays the modelled AOD at 550 nm for the base case. The rest of the Fig. 2 depicts the differences between the sensitivity experiments and the base case. For the base case, high AOD values (up 0.5) are found over a large area of central Russia, including populated cities such as Moscow, Nizhny Novgorod, or Kazan. AOD values around 0.3, are found over a wider area close to the Finnish border (northwest of the domain) and over most of Belarus, Ukraine, and the Black Sea (south of the domain). The lowest values (around 0.1) are found over central Europe. The changes of AOD in the sensitivity experiments are shown in the other panels of Fig. 2
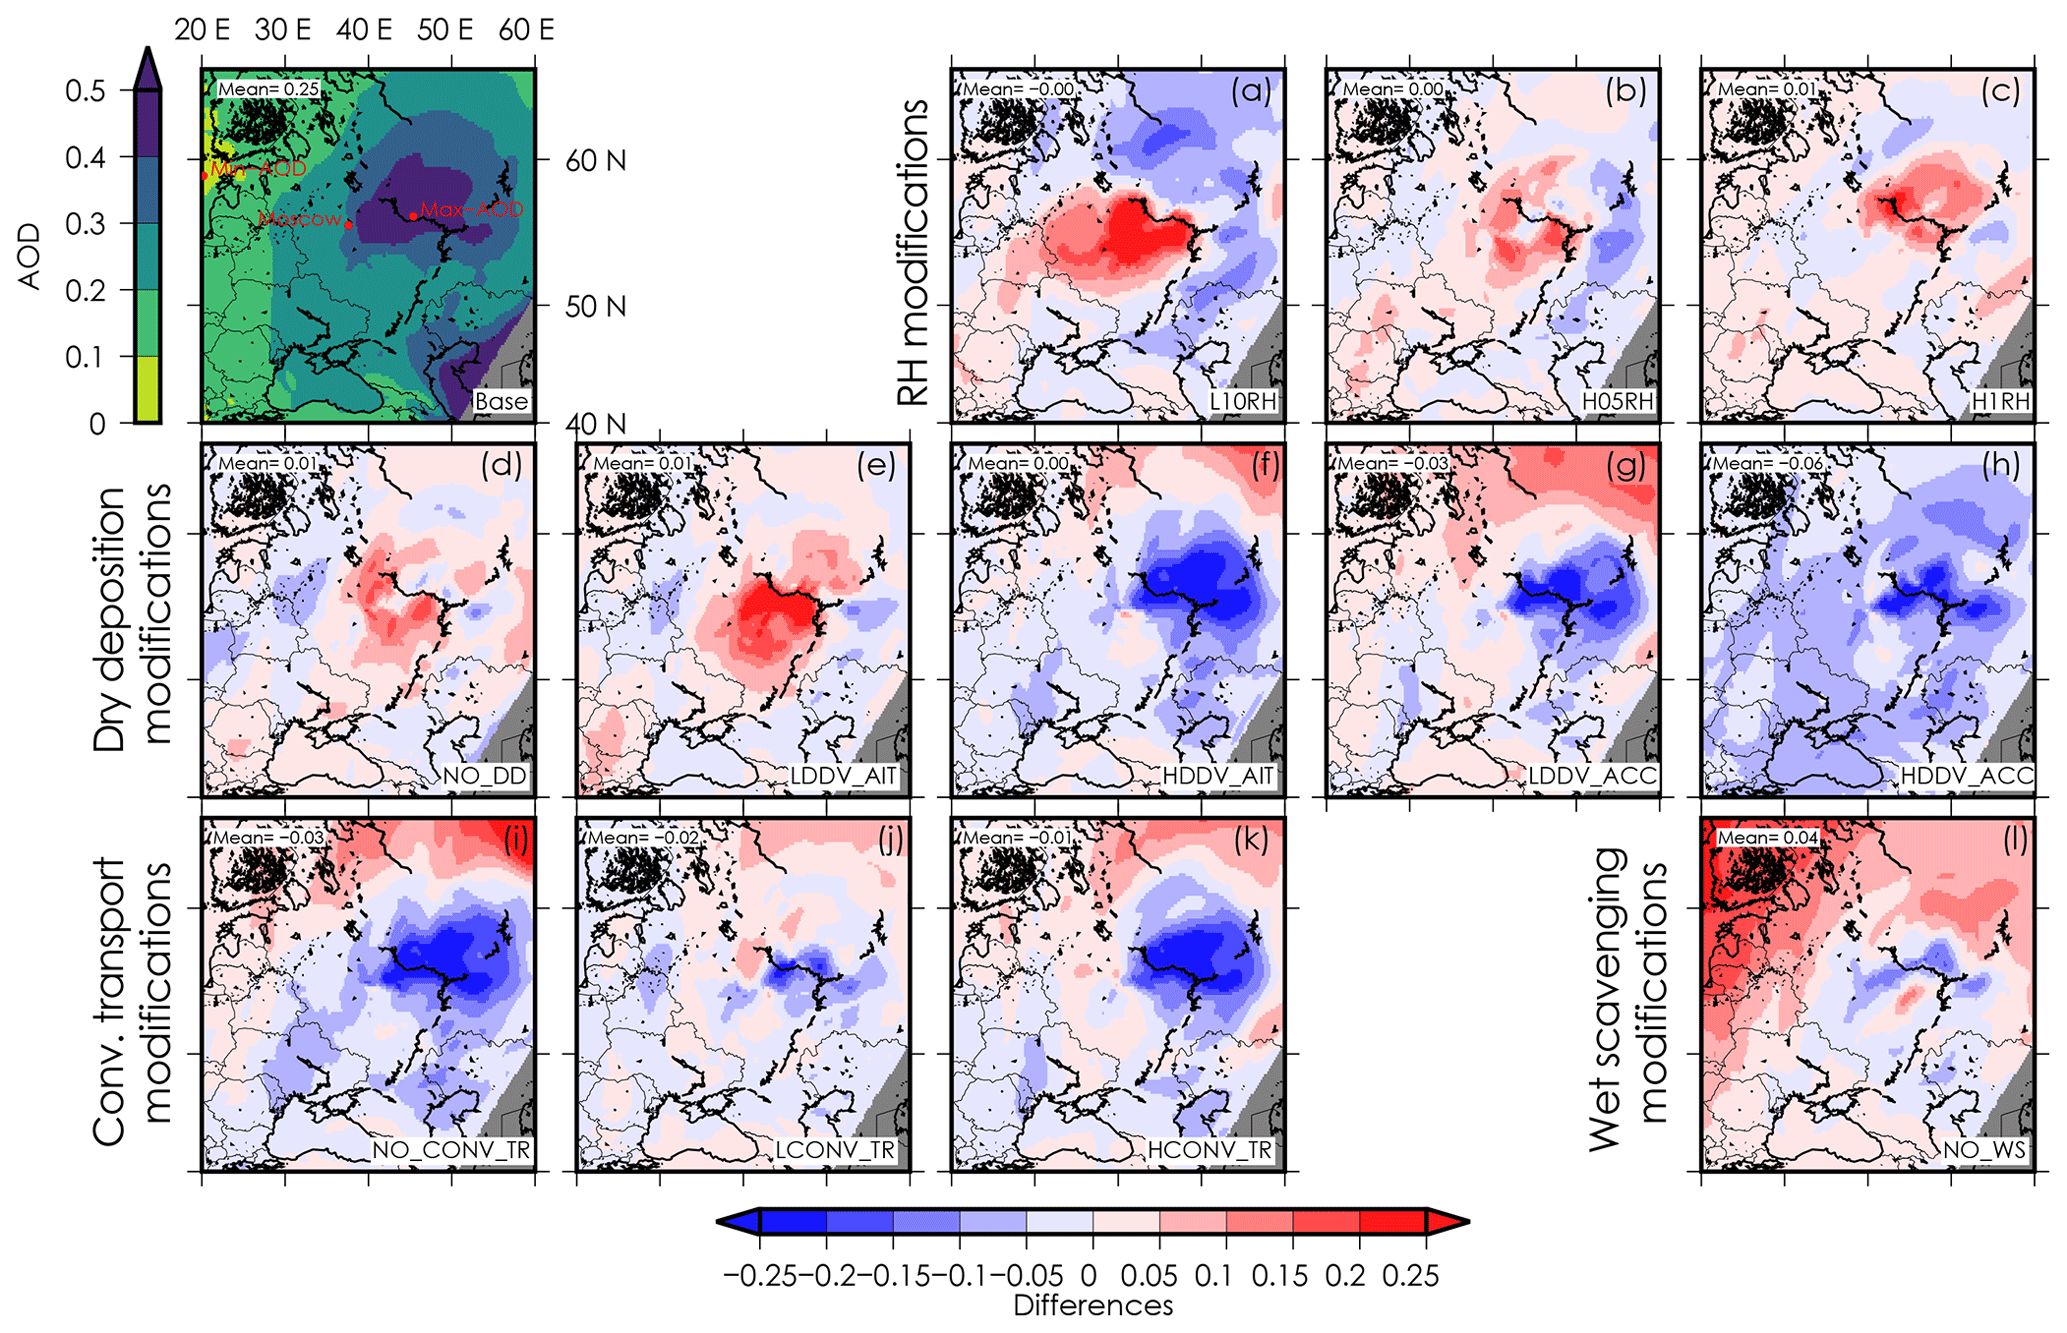
Figure 2Modelled AOD at 550 nm for the base case (top left) and mean bias differences between experiments and the base case. RH modifications at the top right: (a) scaled to 0.9 (L10RH), (b) scaled to 1.005 (H05RH), and (c) scaled to 1.01 (H1RH). Dry deposition modifications in the second row: (d) the suppression (NO_DD), (e) the low DDV for the Aitken mode (LDDV_AIT), (f) the high (HDDV_AIT), (g) the low DDV for the accumulation mode (LDDV_ACC), and (h) the high (HDDV_ACC). Sub-grid convective transport are in bottom-right row: (i) the suppression (NO_CONV_TRANS), (j) scaled to 0.5 (LCONV_TRANS), and (k) scaled to 1.5 (HCONV_TRANS). Bottom-left panel (l) is the suppression of the wet scavenging.
Figure 2a, b, and c represent the sensitivity to RH – a decrease of 10 % (L10RH), an increase of 0.5 % (H05RH), and an increase of 1 % (H1RH), respectively. As expected, a 10 % decrease of the RH leads to a stronger response compared with the experiments when RH increases, since the percentage of modification is lower in the latter sensitivity tests. The L10RH (Fig. 2a) experiment shows positive differences at the west of the Volga river, reaching values around +0.6. Oppositely, there are negative differences of −0.15 in the area east of the Volga. Meanwhile, the H05RH (Fig. 2b) experiment shows this positive/negative (west/east) dipole over the fire-affected area, but differences are lower than 0.15. The H1RH experiment (Fig. 2c) promotes an increase in AOD encompassing most of the fire-affected area with values around +0.2.
Figure 2d shows the no-dry deposition case (NO_DD); Fig. 2e and f are the experiments with low and high dry deposition for the Aitken mode, respectively (LDDV_AIT and HDDV_AIT); and Fig. 2g and h represent the tests modifying the accumulation mode (LDDV_ACC and HDDV_ACC). All the experiments related to changes in dry deposition (Fig. 2d–h) show their strongest response located over the wildfires area, but this response is less relevant than for other cases. Figure 2d, NO_DD, and e, LDDV_AIT, have a similar spatial pattern of differences with positive changes (up to +0.35 and +0.2, respectively) at the western Volga river. However, increasing the dry deposition in Aitken mode (Fig. 2f) and both increasing and decreasing the deposition in accumulation mode (Fig. 2g and h) provoke negative changes of AOD over the eastern Volga (around −0.3 in all of these cases). HDDV_ACC is the only test which produces a general reduction in AOD over most of the study area (temporal and spatial mean change in AOD of −0.06) but the differences are stronger over fire-affected areas and downwind.
Figure 2i shows the No sub-grid Convective Transport (NO_CONV_TR) case and Fig. 2k the High sub-grid Convective Transport (HCONV_TR) case. Both of them evidence negative differences (up to −0.39 and −0.43, respectively) over the fire-affected and downwind areas. However, the NO_CONV_TR case displays stronger positive differences over the northeastern part of the domain (up to +0.25), which do not occur for the HCONV_TR experiment. Figure 2j indicates that the low sub-grid convective transport case (LCONV_TR) has lower absolute differences. A dipole of positive and negative differences (which means higher and lower AOD than the base case) is found over all the domain, a bit stronger over the fire-affected area.
Finally, turning off the scavenging (Fig. 2l; NO_WS experiment) leads to positive differences over a large part of the area with values higher than +0.2 over the north and west zones of the target domain. Moreover, temporal and spatial mean AOD difference (0.04) is the second largest even though there are not many clouds in the studied domain (see Fig. S3 in Supplement). This implies that wet scavenging could be really important when there are clouds present.
3.2 Optical properties and concentration profiles of different species: disentangling the causes of AOD changes
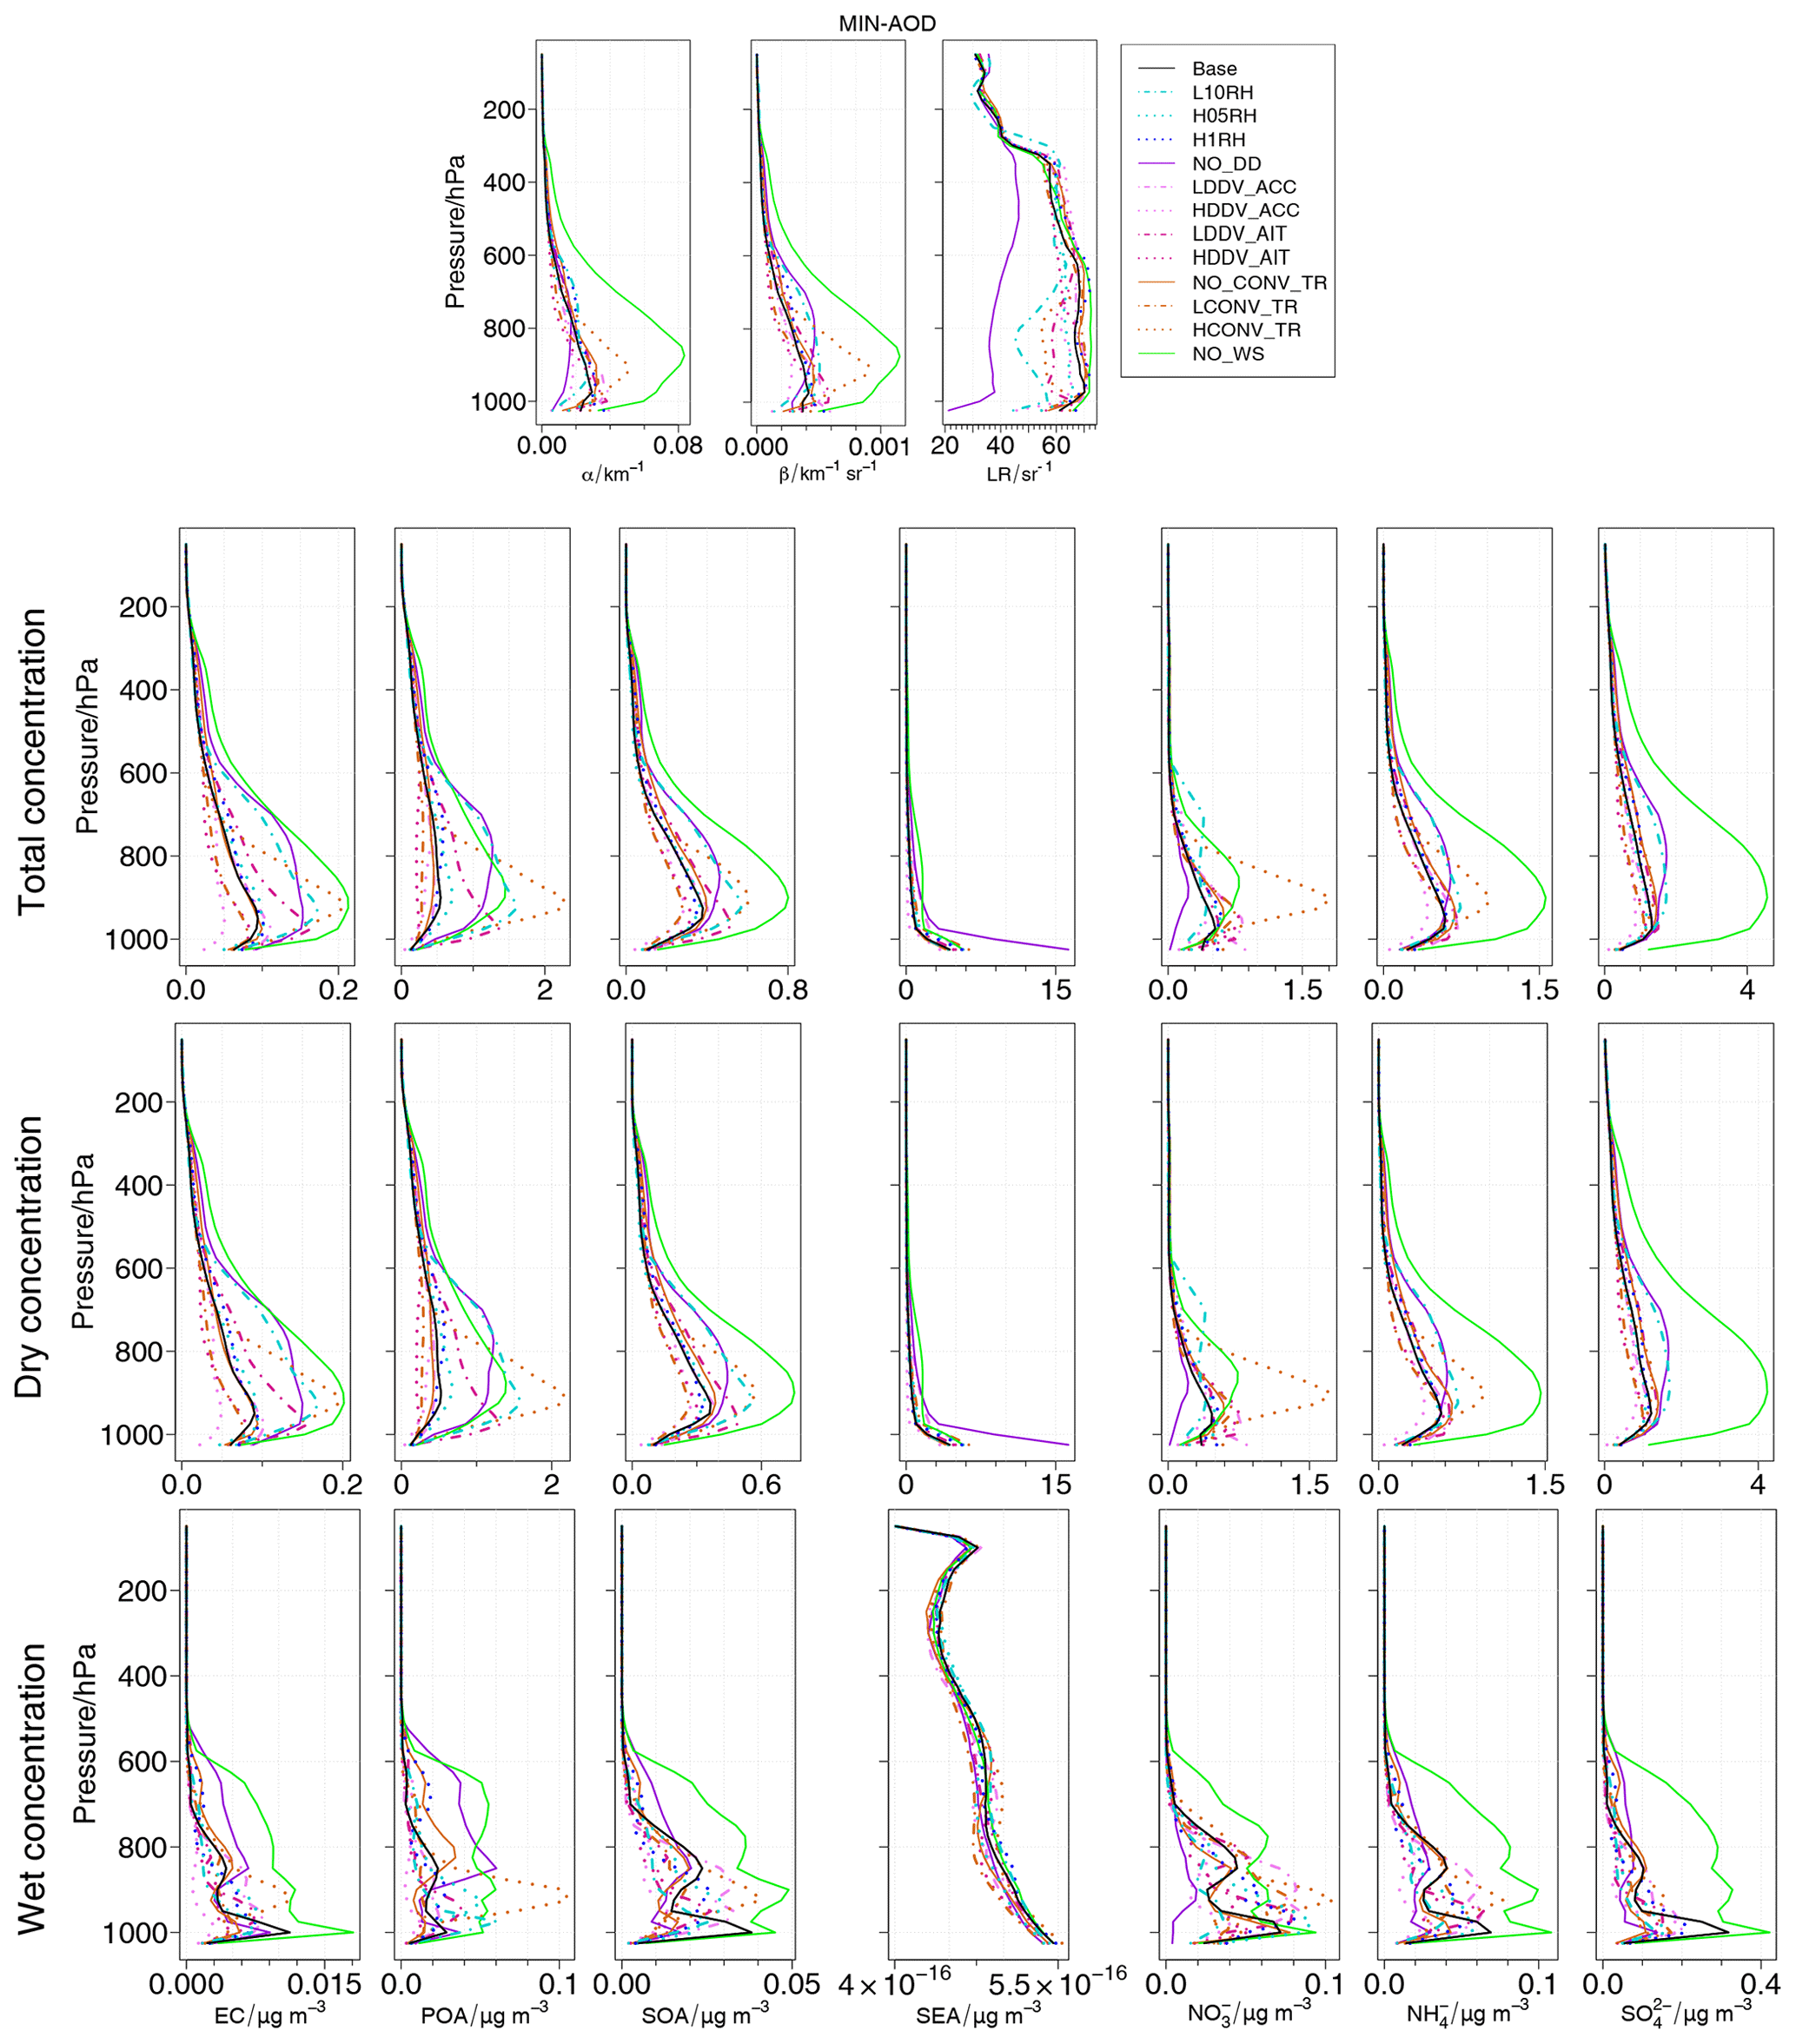
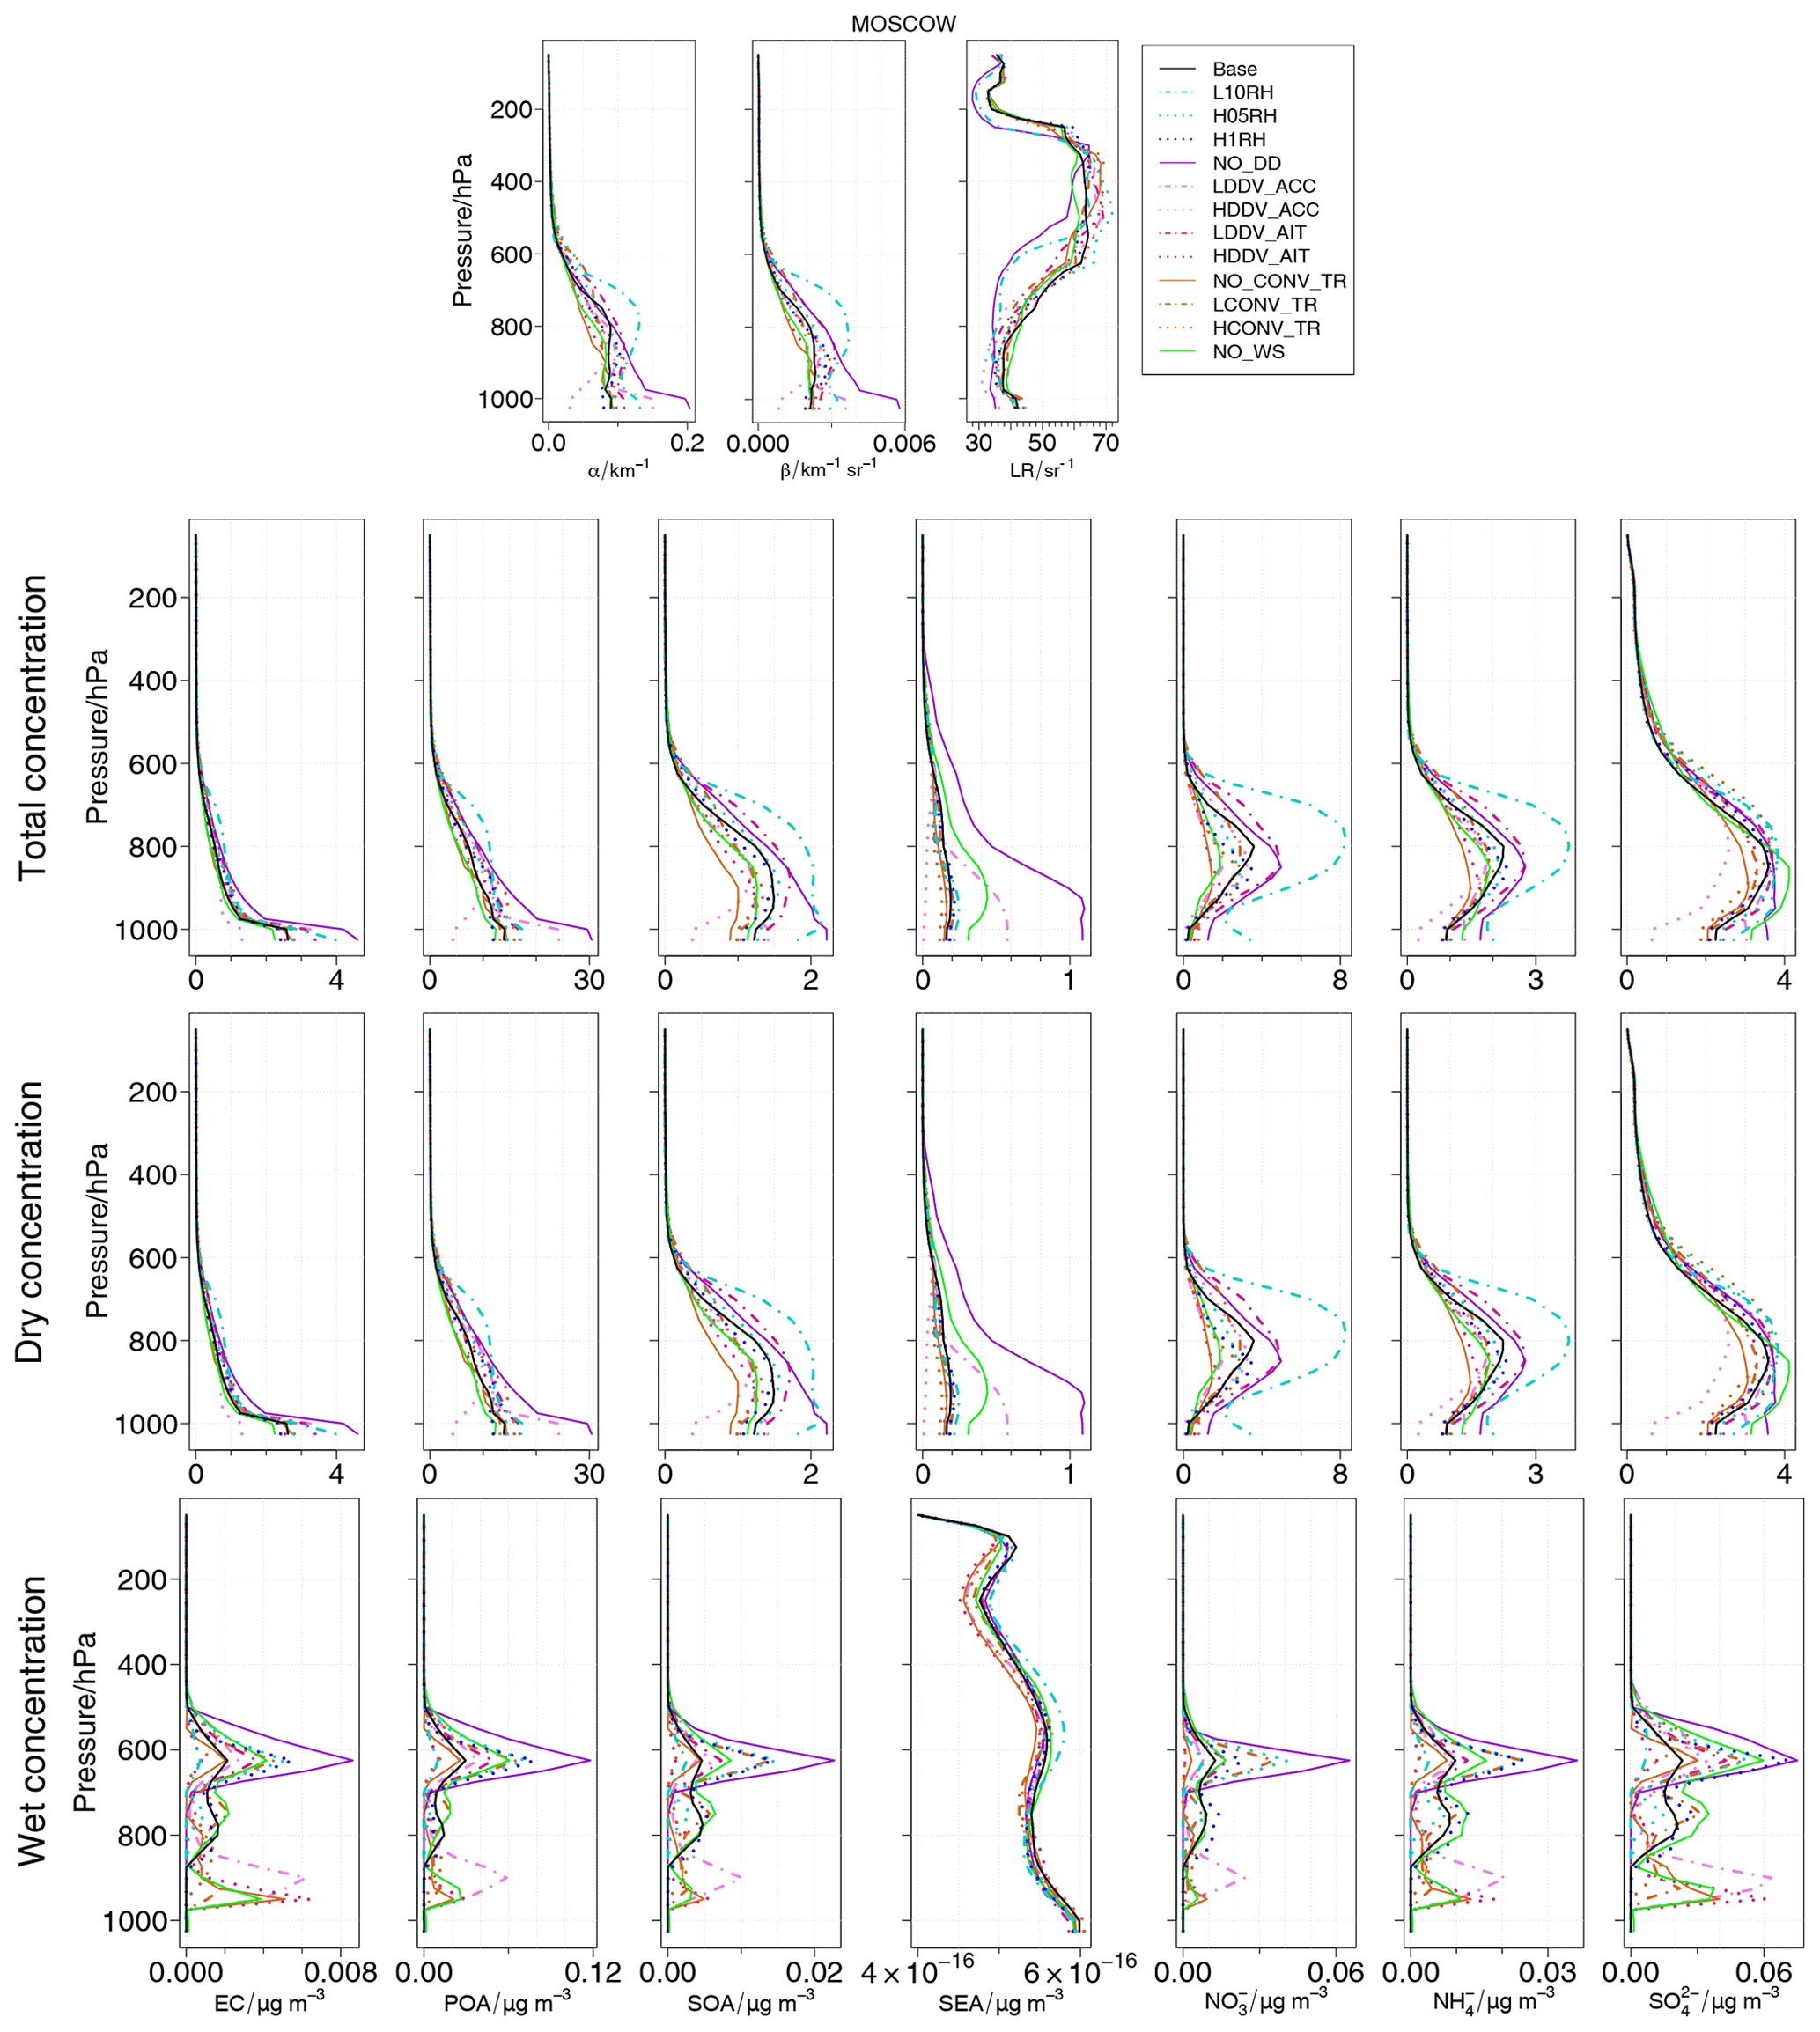
In order to disentangle the cause of the differences in the sensitivity tests, this section discusses the temporal mean of the vertical profiles of optical properties and concentration of several chemical species over specific locations of the target area. Figure 2, top left, displays the spot where the vertical profiles are estimated. The choice of these locations claims to bring light to the behaviour aloft over different places in the target area. Because of that, the locations where the temporal mean of AOD was minimum and maximum, respectively, were selected and named as Min-AOD and Max-AOD. A profile over Moscow, one of the most fire-affected cities, was also chosen to evaluate the fire plume effect downwind.
In addition to α, β, and lidar ratio (LR), concentrations for different species were evaluated, including elemental carbon (EC), primary organic aerosol (POA), secondary organic aerosol (SOA), sea salt (SEA), nitrate (), ammonia (), and sulfate ().
Vertical profiles over the Max-AOD location are shown in Fig. 3, and α and β have similar shapes. The base case shows a profile with high values (above 0.6 km−1 for α and below 0.02 km−1 sr−1 for β) at the surface. Both values decrease with height until around 0.2 km−1 for α and 0.005 km−1 sr−1 for β at 900 hPa. Afterwards, values increase again to 0.3 km−1 for α and 0.01 km−1 sr−1 for β at around 800 hPa (indicating the presence of aerosols associated with fire emissions aloft), where they hereafter decrease. Values are close to 0 above 600 hPa.

Figure 3Profiles over the Max-AOD location. Top row shows the α (left), β (centre), and LR (right). From second to bottom rows, columns display concentration of EC, POA, SOA, SEA, , , and . The second row is for total concentration, the third for dry, and the bottom for wet. The solid black line represents the base case. The blue colour is for RH sensitivity: the dotted dark is the high, in 1 % (H1RH); the dotted light is the high, in 0.5 % (H05RH); and the dotted–dashed light is the low, in 10 % (L10RH). The violet colour is for dry deposition. The solid dark is the no dry deposition (NO_DD). The remaining dark are for the modification of DDV in the Aitken mode: the dotted is the high (HDDV_AIT), and the dotted–dashed is the low (LDDV_AIT). Similar but in light violet is for the accumulation mode: the dotted is the high (HDDV_ACC), and the dotted–dashed is the low (DDV_ACC). The brown colour is for sub-grid convective transport: the solid is without it (NO_CONV_TR); the dotted is the high case (HCONC_TR); and the dotted–dashed is the low (LCONV_TR). The solid green represents the wet scavenging turned off (NO_WS).
LR represents the ratio of the extinction and the backscatter coefficients and is usually used to characterize the type of particles. This variable ranges from 1 to 100 sr−1 (Fernald et al., 1972). Following this definition, low LR values are expected for large and scattering particles, and high LRs are expected for absorbing particles. Typical LRs at 532 nm are 20–35 sr−1 for sea salt, 40–70 sr−1 for desert dust, 70–100 sr−1 for biomass burning aerosols, and 45–75 sr−1 for urban/continental aerosols (Müller et al., 2007). The vertical profile of LR displays low values of around 35 sr−1 at low heights. LR increases to values between 50 and 60 sr−1 around 700 hPa. Higher up, between 500 and 300 hPa, LR reaches values around 65 sr−1 which again, above 300 hPa, decrease to 35 sr−1. It is noticeable that LR values over the MIN-AOD location for most simulations (but NO_DD, where LR is close to 30–40 sr−1) are similar to those values expected by the scientific literature (e.g. Mielonen et al., 2013) for areas with biomass burning aerosols. However, it should be borne in mind that the MIN-AOD location is affected principally by sea salt, and therefore LR seems to be overestimated over the MIN-AOD location in most experiments. Moreover, extinction and backscatter modelling profile shapes are similar (rather constant at levels close to the surface), which is not found in most of the observed LR profiles. This could be ascribed to a model misrepresentation of extinction and backscatter modelling profiles. For example, Mielonen et al. (2013) measured the LR during the same forest-fire event in Finland. These authors found LR values of 60–70 sr−1 for layers below 2 km, pointing to a mixture of biomass burning aerosols and other less absorbing aerosols. Conversely, in the upper layers, the LRs were around 55 sr−1, which indicated the presence of polluted dust. This reveals the misrepresentation in the LRs by our simulations, which estimate LRs around 35 sr−1 (typical LR values for sea salt particles) over areas with a high concentration of biomass burning aerosols (LR should typically reach values higher than 60 sr−1).
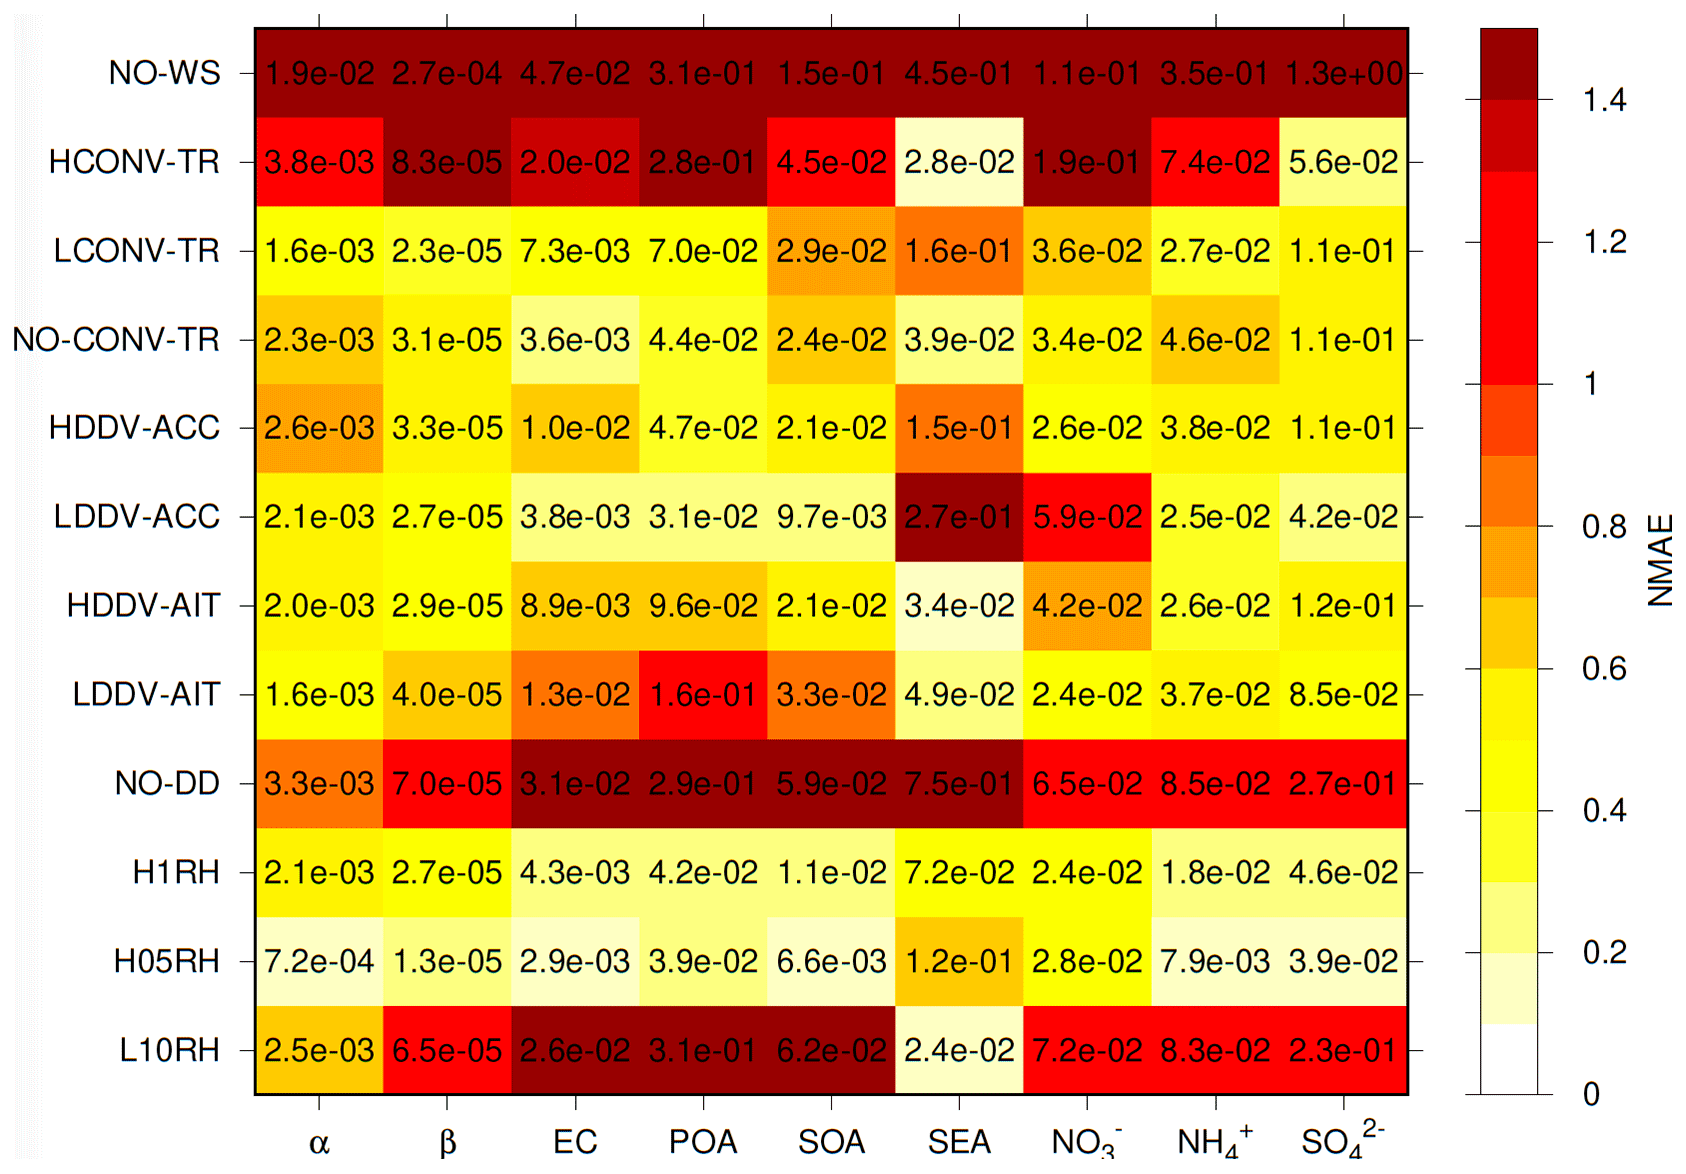
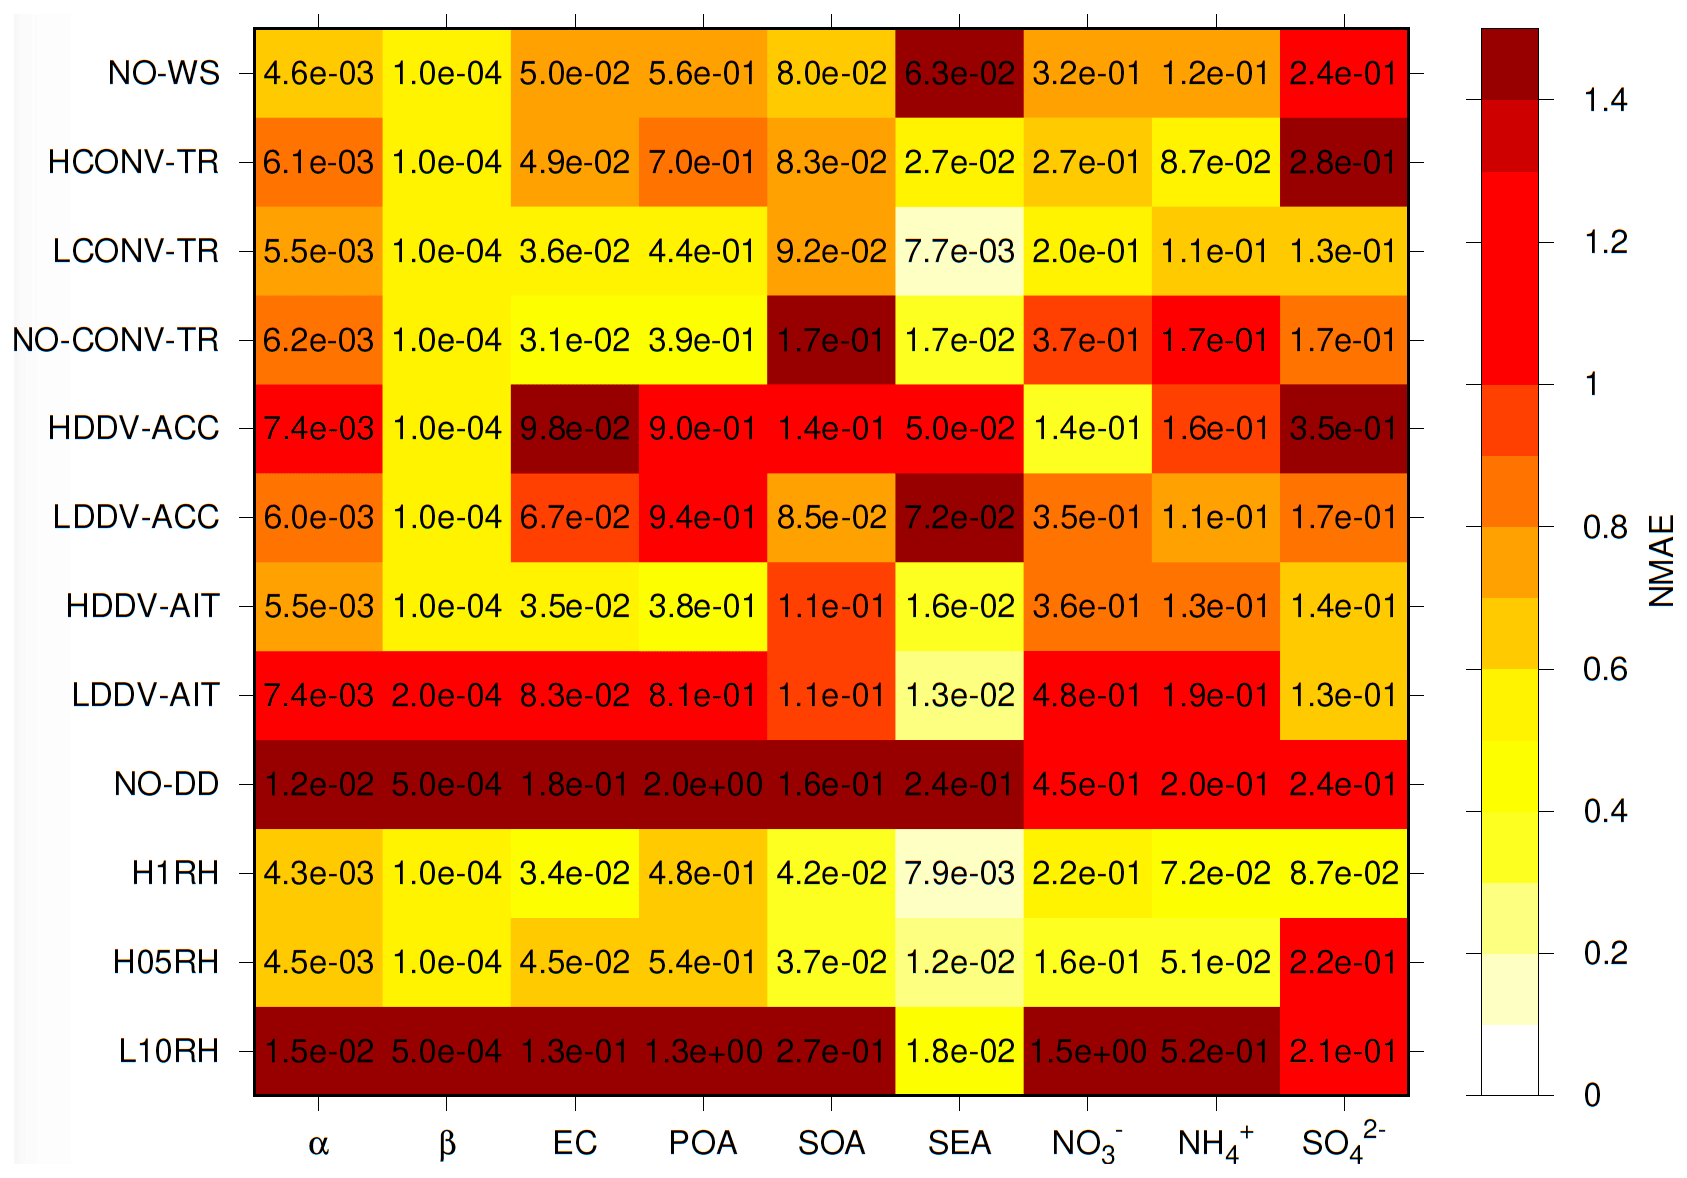
In order to assess which species has the strongest influence on α and β – and also which chemical species presents the highest sensitivity in the designed experiments – profiles for the different species are shown in Figs. 3, 5, and 7. Overall, total concentration is highly determined by the dry concentration, as expected for a heatwave episode. In addition, Figs. 4, 6, and 8 quantify the mean absolute error (MAE) of each experiment with respect to the base case and, in colours, the normalized MAE (NMAE). MAE has been estimated by averaging the absolute error of each experiment regarding the base case at each model level. NMAE is the absolute error divided by the base case at each level and then averaged along the column. The NMAE analysis illustrates the relative change of each species and optical properties and helps to the intercomparison between the sensitivity test.
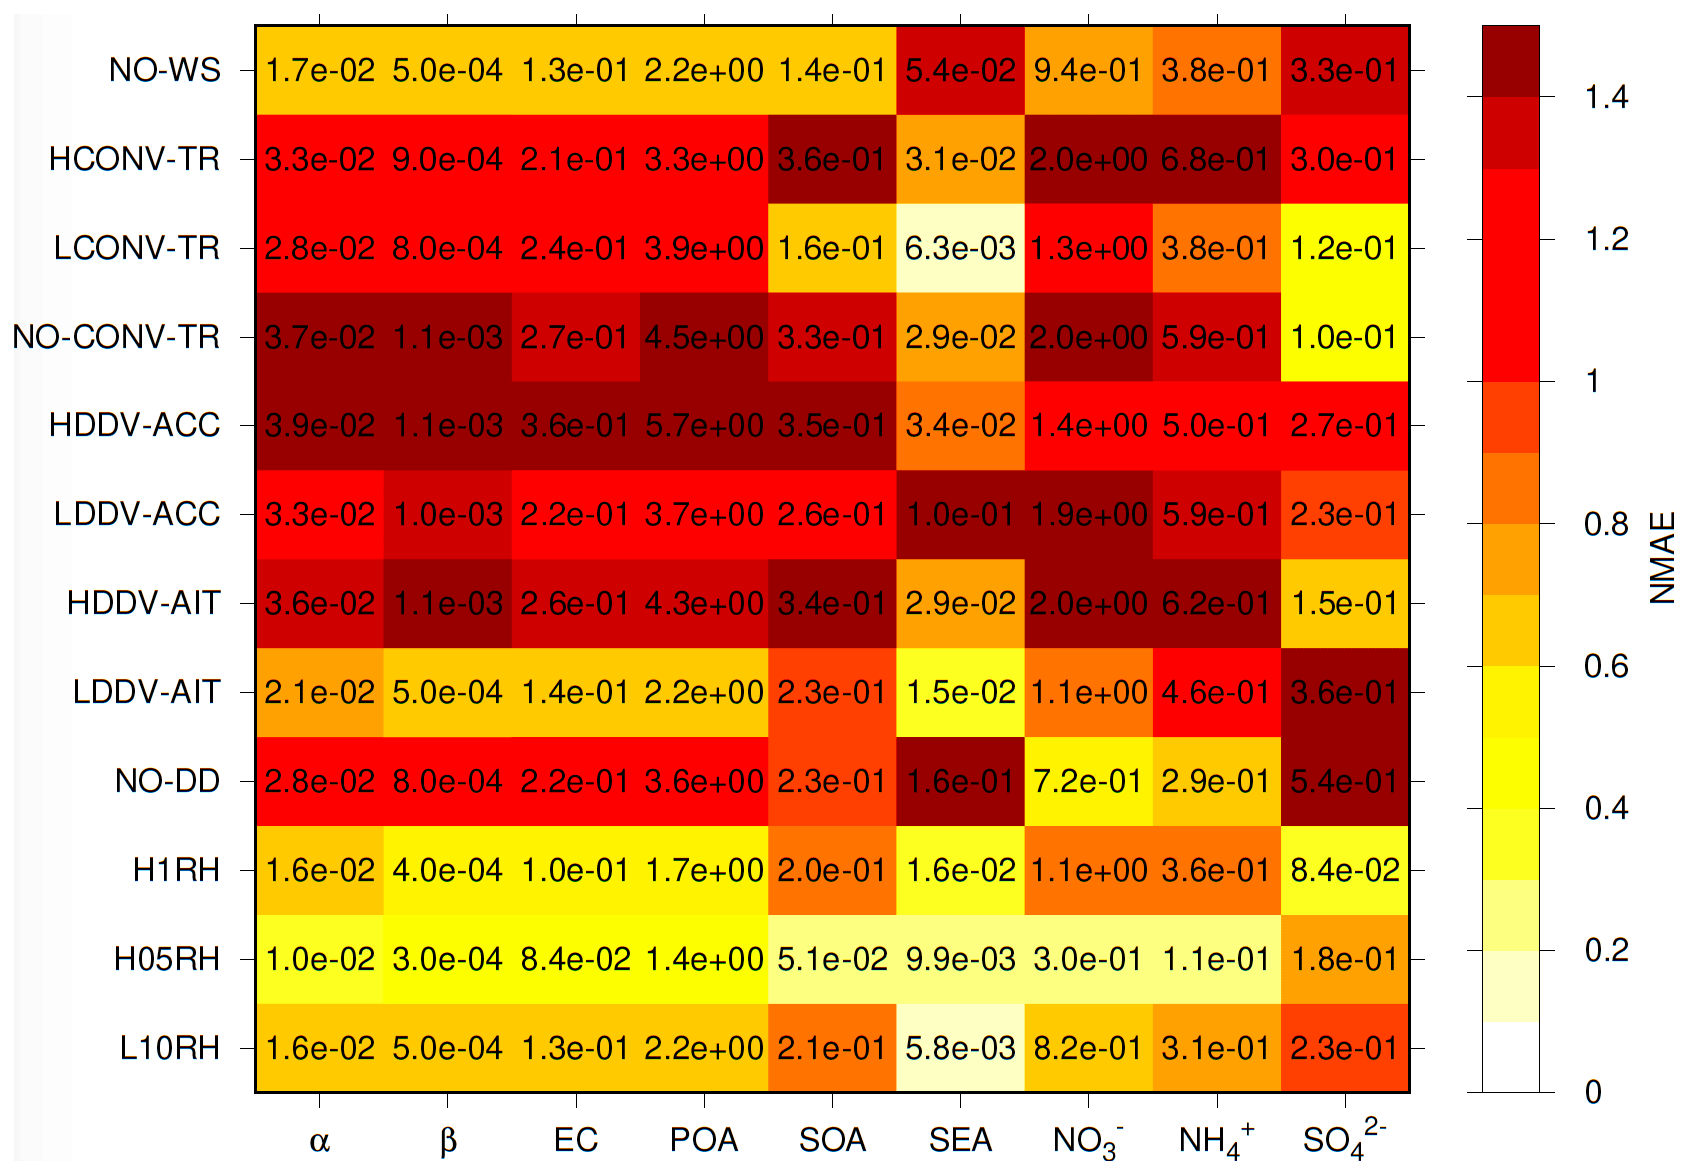
Figure 4Normalized absolute differences (colour) and absolute differences (numbers) between each experiment and the base case over the MAX-AOD location. Columns represent each variable and rows each experiment.
3.2.1 Sensitivity to the relative humidity
When the sensitivity tests are evaluated over the MAX-AOD location, the experiments changing the RH present a singular response. When RH increases (H05RH and H1RH), the profile of optical properties also increases, as well as the AOD. MAE for the profiles (Fig. 4) of α (β) are 0.0101 (0.0005) and 0.0159 (0.0004), for the case in which RH is scaled to 0.5 % (H05RH) and 1 % (H1RH), respectively, and NMAE are 0.4 (0.4) and 0.6 (0.5). These differences could be caused by the high dependence of AOD on water uptake, which finally depends on RH, as indicated by Ginoux et al. (2006), Yoon and Kim (2006), Altaratz et al. (2013), and Palacios-Peña et al. (2017, 2018, 2019a). Thus, an increase in RH affects the hygroscopic growth, resulting in larger particles. For this reason, a reduction of optical properties is expected when RH decreases (L10RH experiment). However, the results indicate an increase in AOD and profiles of extinction and backscatter coefficients (MAE of 0.0162 and NMAE of 0.6 for α; 0.0005 and 0.7 for β). This response is the result of an increase in (MAE of 0.8209 and NMAE of 0.6) and, in particular, in SOA (MAE: 0.2054; NMAE: 0.9). The concentrations of inorganic species are controlled by the so-called sulfate–ammonium–nitrate–water equilibrium (Seinfeld and Pandis, 2006). and present a deliquescence RH of approximately 60 % (Saxena et al., 1986). However, absorbs water at nearly all RH values. As exposed by Weigum et al. (2016), due to the RH absorption by the , the equilibrium is dominated by the reaction in which ammonia neutralizes sulfuric acid and drives the equilibrium towards the aerosol phase – (NH4)2SO4. Therefore, ammonia can neutralize nitrate, resulting in aerosol phase (NH4NO3) only when the total amount of sulfate has been neutralized (i.e. in areas with high concentrations of ammonia and/or low concentrations of sulfate). At this point, sulfate concentrations remain constant, and nitrate increases with aerosol water content.
This sulfate–ammonium—nitrate-water equilibrium explains the behaviour of the inorganic species. For the highest RH case (H1RH), concentration shows a considerable increase, while slightly increases. This could be influenced by an increase in the RH favouring the formation together with a high sulfate concentration for which most of the sulfate has been neutralized.
However, in the case with a reduction of the RH by 10 % (L10RH), displays a similar concentration as the base case at surface levels and around 800 hPa. Throughout the rest of the profile, concentration is higher than in the base case but not as higher as in the H1RH case. Meanwhile, concentrations are much higher than for the base case. Sulfate concentrations are favoured by its low deliquescence point, which promotes its formation. In spite of that, at higher levels, sulfate concentrations were at the point at which most of the sulfate has been neutralized, favouring formation, producing higher concentrations in the L10RH case.
The H05RH (RH scaled to 1.005) experiment shows optical properties and concentration profiles closer to the base case, which can be caused by the low-RH modification, so that inorganic species are not highly affected by this change.
Changes in the profiles of inorganic species do not clarify the results found for the modifications in the profiles of optical properties (and AOD). These modifications are led by changes in SOA. In both H1RH (RH scaled to 1.1) and L10RH (RH scaled to 0.9), SOA profiles depict an increase in their concentrations, resulting in an increase in α and hence AOD. Moreover, this increase is higher for the L10RH case. This positive variation in SOA profiles is explained by the use of the VBS mechanism (Ahmadov et al., 2012). As pointed out by Tuccella et al. (2015), in this mechanism volatile organic compounds (VOC) are oxidized by reactions with the hydroxyl radical (OH), O3, and nitrate radical (, producing organic mass in two different regimes of high and low NOx). In the former, organic peroxy radicals react with nitrogen monoxide (NO); conversely, in the latter organic peroxy radicals react with other organic peroxy radicals. The organic matter produced is partitioned into aerosol and gas phase assuming a pseudo-ideal partition.
Thus, SOA profiles for the RH case depict two different types of behaviour: (1) above 950 hPa (around the PBL height; see Fig. S1 in the Supplement) the shape of the NOx and SOA profiles are similar, and thus, at these vertical levels, variations in SOA concentrations may be due to an increase in NOx concentrations at low-NOx conditions (less than 30 ppb or around 55 µg m−3; Sarrafzadeh et al., 2016); (2) below 950 hPa the RH effect is added to the effect of NOx described above in (1). Therefore, in the H1RH case, SOA values are higher because the concentration of this species increases due to NOx oxidation and RH; meanwhile in the L10RH case the positive variation in the concentration of SOA caused by the RH is limited. That means that this variation depends more on RH modifications (see Fig. S2 in the Supplement) than NOx oxidation.
Over the MIN-AOD location, the RH scaled to 0.9 (L10RH; NMAE >0.6 except for SEA, 0.1) should be highlighted. Despite the fact that L10RH does not provoke a strong difference in AOD, changes in organic species are relatively strong and are similar to those changes in β profile. A reduction of RH may favour the increase in the concentration of these species. α profile is similar to . In this case, these changes could be due to the actions of the nitrate–ammonia–sulfate equilibrium.
Finally, to elucidate the response of the different experiments over a downwind location, profiles over Moscow are shown in Fig. 7. The response for most of the experiments is similar as over the MAX-AOD location; but in this case, the L10RH (RH scaled to 0.9) experiment shows a stronger response (NMAE >1.5 for most of the variables) due to higher concentrations. Over this location, RH is higher than over the MAX-AOD, favouring the formation of . POA displays higher concentrations for the L10RH case, likely due to a competition of SOA formation between and POA.
3.2.2 Sensitivity to dry deposition
Regarding dry deposition over the MAX-AOD location, the no dry deposition case (NO_DD) shows an increase in the AOD over the target area and displays higher α and β values than for the base case at near-surface levels. However, above 950 hPa (around the PBL height; see Fig. S1 in the Supplement), the optical profiles decrease to levels lower than those for the base case. Despite this decrease aloft, total AOD increases (Fig. 2), likely because the highest concentrations for chemical species are located at these levels. With respect to the different species, all of them present higher concentrations than the base case, in particular at levels below 950 hPa. MAE (NMAE) of α and β for this experiment are 0.0283 (1.1) and 0.0008 (1.1, Fig. 4).
Changes in dry deposition experiments occur in those modes where modifications were implemented (Fig. S4 in the Supplement). When modifying the deposition of the accumulation mode, the Aiken mode does not present important changes, and thus the observed variations come from the accumulation mode. However, when modifications are implemented in the deposition of the Aitken mode, both modes are affected, since particles in the Aitken mode quickly experience coagulation processes and turn into particles in the accumulation mode.
A higher AOD is also found for the LDDV_AIT case (low dry deposition velocity in the Aitken mode). For this experiment, α (MAE: 0.0205; NMAE: 0.8) and β (MAE: 0.0005; NMAE: 0.7) exhibit higher values at the surface (around 1000 hPa) and between 900 and above 600 hPa. With respect to the profile of the different species, those emitted directly into the atmosphere (primary species) present higher concentrations than the base case at surface levels (around 1000 and below 800 hPa, respectively). This is observed for POA (MAE: 2.1988; NMAE: 0.7) and SEA (MAE: 0.0154; NMAE: 0.4). However, secondary aerosols – which are not directly emitted and are products of atmospheric chemistry, such as SOA (NMAE >0.8; MAE: 0.2283) – and most of the secondary inorganic species have their concentrations peak at a higher altitude than those in the base case between 900 and 600 hPa. These two facts explain the response of the profiles for the optical properties.
As expected, both high DDV experiments (HDDV_AIT and HDDV_ACC, in the Aitken and the accumulation mode, respectively) exhibit a reduction of AOD, in particular over the fire area. The response of the profiles of optical properties is similar for both cases and for most of the species. For example, MAE (NMAE) values are 0.0365 (0.8) and 0.0392 (1.5) for α. Only SEA shows a different behaviour between the increase in DDV for Aitken (NMAE: 0.7) or accumulation mode (NMAE: 0.8). The reduction of the total concentration of SEA is higher when DDV is modified in the accumulation mode. This is produced because this species presents most of its concentrations in the Greenfield gap (particle radii in the range of 0.1–1 µm where Brownian motion is not large anymore and gravitational settling is not yet important; Greenfield, 1957; Ladino et al., 2011), the accumulation, and the coarse mode, not in Aitken. Regarding organic species (EC, POA, and SOA), concentrations are a bit lower when the DDV is modified in the accumulation mode, probably because most of the mass of these species is in this mode (NMAE around 1.4 for all of them). This response is similar to those experiments for , but it is the contrary for because of the action of the nitrate–sulfate–ammonium equilibrium.
The low dry deposition velocity in the accumulation mode (LDDV_ACC) experiment does not show the a priori expected response. AOD decreases over the fires; also optical properties profiles display lower values: MAE (NMAE) of 0.0331(1.3) for α and 0.001(1.3) for β. When the profiles are analysed, the response differs between species. EC, POA, and show a slight reduction in their concentration, and SOA exhibits a large reduction. Conversely, and SEA display higher concentrations, in particular, at near-surface levels. The response of these latter is the expected when DDV is decreased in the accumulation mode, but, despite this increase, the decrease in AOD is the result of the large reduction of SOA concentrations (NMAE: 1.1). These SOA reductions may occur due to the increase in concentrations (NMAE: 1). By modifying the DDV, concentrations increase; then the nitrate–sulfate–ammonium equilibrium results in a reduction of , which influences SOA formation (as explained above) by decreasing their concentration.
Due to the different behaviour over the MIN-AOD location with respect to those areas affected by wildfires, the no dry deposition (NO_DD; NMAE >0.9 for all the variables) experiment should be highlighted. For NO_DD, β profile is similar to the profiles of organic species (EC, POA, and SOA) as well as NH−4 and , while α is similar to . Organic species present a higher concentration when dry deposition is turned off, resulting in an increase in β. However, decreases, probably due to its competition with (which increases), leading to a decrease close to the surface of α. However, these changes in optical properties profiles are not highly represented by a strong modification of total AOD.
Over the Moscow location, the NO_DD experiment also displays a strong response (NMAE >1 for all the variables). This response is explained by an increase in the concentration of all the species, in particular, at the surface due to the effect of turning off dry deposition, resulting in an increase in α and β.
3.2.3 Sensitivity to sub-grid convective transport
When sub-grid convection is modified, in both experiments NO_CONV_TR (convective transport turned off) and HCONV_TR (scaled by 1.5) there is an AOD reduction over the fire area. This decrease is also reflected in optical properties over the MAX-AOD location and for most of the species (NMAE >0.8 in both experiments) except . For POA, EC and , the NO_CONV_TR experiment exhibits a concentration profile similar to the base case, with slightly higher concentrations at surface levels and lower at higher levels (NMAE: 0.4). The opposite behaviour is displayed by SEA concentrations. Moreover, SOA, NO−3, and NH−4 concentrations are constantly smaller than the base case. However, the concentration profile for the HCONV_TR experiment shows lower concentrations (NMAE: 1.2). Both responses could be caused by modifications in sub-grid convective transport. When this transport is turned off there is a decrease in the particle mixing in the atmosphere, and small differences with the base case are found. However, when this transport is increased, involving an increase in all-direction convective transport and not only updraught convection, there is a higher mixing of particles. This fact can favour the transport to levels closer to the surface and then enhance the deposition processes.
For the HCONV_TR experiment, the behaviour of is similar to the rest of the species. Thus, the modification in sub-grid convective transport controls the response of this experiment. However, for the NO_CONV_TR test, the rest of the species behave differently compared to . strongly decreases due to the effect of the nitrate–ammonium–sulfate equilibrium in which the sulfate is an obstacle for formation. This low concentration results in a decrease in the SOA formation and consequently its concentration. This finally leads to a decrease in α and AOD. The response of LCONV_TR (convective transport scaled to 0.5) shows a transition between the two extreme cases (NMAE around 1 for all of the variables except SEA, 0.1, and , 0.4).
Over the MIN-AOD location, the behaviour observed for the LCONV_TR experiment (convective transport scaled to 0.5) is also noteworthy, while NMAE does not have a strong response. AOD is not strongly modified, but the profiles of optical properties show a peak around the PBL height. This peak is due to an increase in the concentrations of EC, POA, SOA, and . For the organic species, this increase can be due to the modification in the sub-grid convective transport. The presence of these species at this level seems to favour the formation of instead of .
3.2.4 Sensitivity to wet scavenging
The modification of wet scavenging over the MAX-AOD location displays a slight reduction of AOD, which is the result of lower α and reduced concentration of species above the PBL (at 950 hPa). NMAE is <0.8 for most of the studied variables. This reduction is observed despite the inorganic species (SEA, , , and ) showing higher concentrations at the lowest levels. SOA also displays a higher concentration below 800 hPa but with smaller changes than for inorganic species. This highlights the high impact of organic species on optical properties. All the observed changes can be attributed to changes in the aqueous-phase reactions because over these locations stratiform clouds were not present.
To conduct the analysis where clouds were formed during the 2010 wildfires episode (see Fig. S3 in the Supplement), the MIN-AOD location is shown in Fig. 5. Over this location, the NO_WS experiment has the strongest response regarding optical properties profiles and concentrations for different species. NMAE is above 1.5 for all the studied variables. The profiles of optical properties depict much higher values than for the base case, which are also observed in all of the species. This could be due to the fact that over this area stratiform clouds were present, so the effect of wet scavenging is important over this location.
It should also be highlighted that the profile shape of EC and POA over the MIN-AOD and Moscow locations show larger differences than over the MAX-AOD area for the different experiments. These differences in the shapes of the profiles could be attributed to species which are not directly emitted over the MIN-AOD and Moscow areas; thus, the vertical distribution could be influenced by transport processes. Moreover, the farther the location is, the more different the shape of the vertical profile is.
The main finding of this work is the nonlinear response exhibited by AOD when characterizing its sensitivity to different key processes. This response is highly dependent on the thermodynamics equilibrium sulfate–nitrate–SOA, in which water and ammonia also play an important role. Moreover, and probably due to the nature of this episode (heatwave–wildfires), SOA shows a high impact on the representation of aerosol optical properties, as also found by Regayre et al. (2018) and Yoshioka et al. (2019). These works highlighted a large uncertainty in effective radiative forcing related to ARI because of the presence of carbonaceous aerosols in high-emission months and in regions close to emission sources. However, under other conditions, the global influence of anthropogenic sulfate aerosol presented a significant influence on AOD estimations (due not only to emission but also to transport or lifetime; Kasoar et al., 2016; Regayre et al., 2018; Yoshioka et al., 2019). This behaviour was also observed, to a lesser extent, for nitrate (Balzarini et al., 2015). Thus, a large effort should be devoted to the process-understanding of this nonlinear response from several key sources (RH, convective transport, dry deposition, and other aerosol processes) and the improvement of the representation of the equilibrium sulfate–nitrate–ammonia–water in models for reducing the uncertainty related to aerosols in online coupled models.
From a global point of view, different works identified the processes evaluated in this work as important sources of uncertainty when characterizing aerosol optical properties and/or radiative forcing (which is highly influenced by the former). Regayre et al. (2018) found the deposition rate of aerosols and aerosol precursors (gases) to be the most important causes of the uncertainty related to effective radiative forcing. Also, dry deposition was the most important process for global mean CCN uncertainty (Lee et al., 2013), a source of uncertainty in AOD representation (Romakkaniemi et al., 2012). Although this process presents large uncertainties when estimating AOD, its importance is limited over a fire-affected region. Thus, attention should be paid in the evaluation of the uncertainty in this process depending on the scale, since the impacts of this process would likely be stronger over other regions, making it important globally. As pointed out by Regayre et al. (2018), some causes of uncertainty in radiative forcing could be because they cause at least a small amount of uncertainty in nearly all regions or because they are the largest causes in some regions. Both Lee et al. (2013) and Regayre et al. (2018) used global models (GLOMAP-mode within the TOMCAT global 3-D offline chemistry transport model and HadGEM-UKCA model, respectively) during a whole year. Moreover, it should be highlighted that CCN uncertainty affects not only AOD representation but also radiative forcing uncertainties due to ACI (Lee et al., 2013).
Similar results were found by Kipling et al. (2016) for convective transport using the HadGEM3-UKCA model. This process was found to be very important when controlling the vertical profile of all aerosol components by mass. In addition, previous works such as Palacios-Peña et al. (2018) and Palacios-Peña et al. (2019a) found that a misrepresentation of aerosol vertical profile could lead to uncertainties in the representation of AOD. On the other hand, Croft et al. (2012) evaluated the uncertainty due to different assumptions for the wet scavenging of aerosol and found a 20 % to 35 % uncertainty in simulated global, annual mean of AOD using the ECAM5-HAM model. However, the findings in our work regarding wet scavenging were lower due to the type of episode selected (without extensive clouds).
Another source of uncertainty is that related to general circulation. In this sense, Nordling et al. (2019) demonstrated a significant uncertainty in regional climate responses due to differences in circulation even with perfect aerosol descriptions. In addition, Brunner et al. (2015) pointed out the need for improving the simulations of meteorological parameters relevant for air quality. On the other hand, other works found an effect on meteorological variables and, thus, in circulation responses when aerosol effects are taken into account. This source of error is more relevant during the summer and near large sources of pollution (Makar et al., 2015b; Baró et al., 2017), conditions that are similar to the episode analysed here. These works show an impact on short-wave downwelling radiation at the surface, temperature, RH, and PBL height due to the inclusion of aerosol effects which again could affect AOD uncertainties. Moreover, Kong et al. (2015) evidenced an improvement in the skill of meteorological variables when aerosol radiation effects were included. Thus, the uncertainties in the representation of the vertical distribution of aerosols and their optical properties revealed in this work could be limited to the influence of the regional circulation response, which in turn could again impact the aerosol distribution. Hence, a reduction in this aerosol uncertainty could at the same time reduce the uncertainty in the response of the circulation, and thus, the evaluation of uncertainty could be constrained only to uncertainties in circulations mechanisms, as pointed out by Nordling et al. (2019).
Other important sources of uncertainty in the representation of aerosol optical properties among those evaluated here are the aerosol emissions (Granier et al., 2011; Soares et al., 2015), representations of complex sub-grid processes (Weigum et al., 2016), aerosol processes (Croft et al., 2012), subsequent feedbacks on atmospheric dynamics (Booth et al., 2012; Bollasina et al., 2013; Villarini and Vecchi, 2013; Makar et al., 2015b; Baró et al., 2017; Nordling et al., 2019; Palacios-Peña et al., 2019b), aerosol mixing (Zhang et al., 2012; Curci et al., 2019), and aerosol size distribution (Tegen and Lacis, 1996; Claquin et al., 1998; Eck et al., 1999; Haywood and Boucher, 2000; Romakkaniemi et al., 2012; Obiso et al., 2017; Obiso and Jorba, 2018; Palacios-Peña et al., 2020). Another source of uncertainty is the choice of the aerosol–chemical mechanisms, which was pointed out by Balzarini et al. (2015) and Palacios-Peña et al. (2018, 2019a).
In order to simplify the approach, this study has been conducted using only one model; however, differences among models and how these represent the life cycle of aerosols should be kept in mind (Randles et al., 2013; Kim et al., 2014; Mann et al., 2014; Tsigaridis et al., 2014; Lacagnina et al., 2015; Pan et al., 2015; Ghan et al., 2016; Kipling et al., 2016; Koffi et al., 2016; Palacios-Peña et al., 2018, 2019a; Nordling et al., 2019), and similar studies with other modelling approaches are necessary for an overall knowledge of these uncertainties.
Aerosol optical properties (e.g. AOD) are highly influenced by the vertical distribution of atmospheric aerosols, which also condition the representation of ARI and ACI processes and their uncertainty. Thus, a key issue in climate modelling is the assessment of the uncertainty in the representation of aerosol optical properties. This work assesses the sensitivity of aerosol optical properties and the aerosol vertical distribution to several key physical processes. To achieve this objective, sensitivity runs modifying RH, dry deposition, sub-grid convective transport, and wet scavenging have been carried out for the 2010 Russian heatwave–wildfires episode with the WRF-Chem regional fully coupled model. The findings in this work could help in improving modelling strategies for aerosol representation, giving some initial guidelines about what parameters could be misrepresented or are the most sensitive to the vertical mixing.
Results indicate that there is a nonlinear response of AOD to different key processes. For example, both an increase and a decrease in the RH result in higher AOD values. A similar nonlinear response is found when reducing the dry deposition velocity; in particular, for the accumulation mode, where the concentration of several species increases (a decrease might be a priori expected). Also the modifications in the sub-grid convective transport exhibit a nonlinear response because both the increase and offset of this process lead to a reduction in the AOD over the fire area. Similar nonlinear responses were previously found, among others, by Lee et al. (2013) and Kipling et al. (2016) using different models and experiments and by Weigum et al. (2016) using the WRF-Chem model (as also done in this contribution).
With respect to the quantification of the sensitivity, modifying RH by a factor of 0.9 leads to the highest AOD differences (0.6). This high sensitivity is followed in relevance by scaling vertical convective transport (with AOD differences around −0.4) and dry deposition (AOD differences up to −0.35 and 0.3).
However, when RH increases (1.005 or 1.01 scaling factors), the response is weaker (AOD differences lower than 0.15) than when RH decreases. This is because the scaling to high RH values is smaller since an important supersaturation (above 1 %–2 %; Devenish et al., 2016) is not realistic in climate models. When the RH slightly increases, AOD changes are conditioned by the water uptake by particles, and hence the humidity contributes to the modification of the size of particles by hygroscopic growth (see H05RH experiment). In this case, no large changes in concentrations are found. Nevertheless, for larger increases in RH (H1RH), changes in AOD are dominated by changes in nitrate and SOA. These changes in SOA are controlled by two mechanisms of particle formation. (1) The first mechanism, the nitrate–ammonia–sulfate equilibrium, explains the changes found for and . Summarizing, the amount of sulfate dominates this equilibrium in which ammonia can neutralize nitrate only when there is a high concentration of ammonia and/or low concentrations of sulfate. Hence, if most of the concentration has been neutralized, an increase in RH favours formation. Moreover, in low-RH conditions, formation is possible only under low concentrations. (2) The second mechanism which controls SOA formation is the implemented VBS mechanism (Ahmadov et al., 2012; Tuccella et al., 2015). In our experiments, VOCs are oxidized by reactions with nitrate radical in the regime of low NOx, and SOA increases as concentrations, as described by Sarrafzadeh et al. (2016).
Dry deposition presents a higher impact for the accumulation mode (NMAE higher than 1.4) than for the Aitken mode (NMAE around 1.3) because a higher mass of fire particles is emitted into this mode. Over the MAX-AOD location, switching off the dry deposition does not have a strong impact on AOD, but it does over the rest of the domain. Over the MAX-AOD location, particles are directly emitted into the atmosphere, while over other locations transport phenomena govern the concentrations. In general, when dry deposition is suppressed or reduced, AOD increases, and conversely, when it is increased, AOD decreases. However, the response over the MAX-AOD location of the decrease in dry deposition for the accumulation mode is noticeable because a decrease in the dry deposition in this mode significantly increases concentrations. Thus, the nitrate–ammonia–sulfate equilibrium reduces , leading to a reduction of SOA and then AOD.
The suppression and the increase in the vertical convective transport also presents an impact on the aerosol vertical distribution. When the vertical convective transport is increased, all the species show a similar response. This modification implies an increase in the transport not only upwards but also in all directions, increasing the mixing of particles which can favour the transport from upper layers to the surface, hence enhancing deposition. However, when the sub-grid convective transport is suppressed, the nitrate–ammonia–sulfate equilibrium and the SOA formation mechanisms play an important role. A reduction in the vertical convective transport, which can reduce the mixing of particles, results in significant changes of AOD but over regions away from the sources (main emission areas), in particular, over the MIN-AOD spot.
Wet scavenging does not significantly impact the vertical aerosol mass due to the type of episode selected as case study (heatwave with clear skies). There is an impact over the MIN-AOD location because this is a cloudy area during the period of the episode.
Regarding the LR, simulated values of this variable are remarkably different from those observed in the scientific literature, mainly over fire-affected areas. In those areas where high LR are expected due to the presence of biomass burning particles, simulations estimate lower LR (and vice versa). It should be also pointed out that most of the species show relatively larger differences when they are considered far away from the emission areas. Thus, as pointed out by Lee et al. (2013), the uncertainty in aerosol microphysical processes becomes increasingly important in remote regions (far from the source of emissions).
To summarize, the sulfate–nitrate–SOA formation is the process with the largest sensitivity and hence the process whose uncertainty can have a larger impact on AOD representation. Changes in this process could come mainly from modifications in RH, dry deposition, or vertical convective transport. Alone, dry deposition also presents a high sensitivity which influences AOD representation.
Last, it should be noticed that the processes evaluated here are not the only processes that might condition the uncertainty in aerosol properties. The selection of these experiments has been based on their relevance according to the available literature, and their experimental design has been constrained by the high computational cost of these online coupled chemistry–meteorological simulations. In this sense, further studies addressing the reduction of the demonstrated uncertainties are needed. Reducing uncertainties in AOD and aerosol representation implies the reduction of uncertainties in the representation of aerosol effects, both ARI (by AOD) and ACI (by improvement in microphysical properties), providing more reliable weather predictions and climatic simulations.
The data are available upon contacting the corresponding author (pedro.jimenezguerrero@um.es.).
The supplement related to this article is available online at: https://doi.org/10.5194/acp-20-9679-2020-supplement.
LPP wrote the paper, with contributions from PJG. LPP and PS designed the experiments; LPP conducted the numerical simulations and compiled all the experiments, with the support of RLP. LPP did the analysis, with the support of PS, RLP, and PJG.
The authors declare that they have no conflict of interest.
The authors are thankful to the WRF-Chem development community and the G-MAR research group at the University of Murcia for the fruitful scientific discussions.
This study was supported by the Spanish Ministry of the Economy and Competitiveness and the European Regional Development Fund (ACEX- 85 CGL2017-87921-R project (ERDF/FEDER grant)). Laura Palacios-Peña is supported by a scholarship from the Spanish Ministry of Education, Culture and Sports (grant no. FPU14/05505) and the ERASMUS+ programme. Philip Stier was supported by the European Research Council (ERC) under the European Commission Horizon 2020 research and innovation programme (constRaining the EffeCts of Aerosols on Precipitation (RECAP) project (grant no. 724602)).
This paper was edited by Jianzhong Ma and reviewed by two anonymous referees.
Ackermann, I. J., Hass, H., Memmesheimer, M., Ebel, A., Binkowski, F. S., and Shankar, U.: Modal aerosol dynamics model for Europe: Development and first applications, Atmos. Environ., 32, 2981–2999, https://doi.org/10.1016/S1352-2310(98)00006-5, 1998. a, b, c, d
Ahmadov, R., McKeen, S. A., Robinson, A. L., Bahreini, R., Middlebrook, A. M., de Gouw, J. A., Meagher, J., Hsie, E.-Y., Edgerton, E., Shaw, S., and Trainer, M.: A volatility basis set model for summertime secondary organic aerosols over the eastern United States in 2006, J. Geophys. Res.-Atmos., 117, D06301, https://doi.org/10.1029/2011JD016831, 2012. a, b
Altaratz, O., Bar-Or, R. Z., Wollner, U., and Koren, I.: Relative humidity and its effect on aerosol optical depth in the vicinity of convective clouds, Environ. Res. Lett., 8, 034025, https://doi.org/10.1088/1748-9326/8/3/034025, 2013. a, b, c
Andreae, M. O. and Merlet, P.: Emission of trace gases and aerosols from biomass burning, Global Biogeochem. Cy., 15, 955–966, https://doi.org/10.1029/2000GB001382, 2001. a
Balzarini, A., Pirovano, G., Honzak, L., Ẑabkar, R., Curci, G., Forkel, R., Hirtl, M., San José, R., Tuccella, P., and Grell, G.: WRF-Chem model sensitivity to chemical mechanisms choice in reconstructing aerosol optical properties, Atmos. Environ., 115, 604–619, https://doi.org/10.1016/j.atmosenv.2014.12.033, 2015. a, b, c
Baró, R., Lorente-Plazas, R., Montávez, J. P., and Jiménez-Guerrero, P.: Biomass burning aerosol impact on surface winds during the 2010 Russian heat wave, Geophys. Res. Lett., 44, 1088–1094, https://doi.org/10.1002/2016GL071484, 2017. a, b, c
Barriopedro, D., Fischer, E. M., Luterbacher, J., Trigo, R. M., and García-Herrera, R.: The Hot Summer of 2010: Redrawing the Temperature Record Map of Europe, Science, 332, 220–224, https://doi.org/10.1126/science.1201224, 2011. a
Binkowski, F. S. and Shankar, U.: The regional particulate matter model: 1. Model description and preliminary results, J. Geophys. Res.-Atmos., 100, 26191–26209, https://doi.org/10.1029/95JD02093, 1995. a
Bollasina, M. A., Ming, Y., and Ramaswamy, V.: Earlier onset of the Indian monsoon in the late twentieth century: The role of anthropogenic aerosols, Geophys. Res. Lett., 40, 3715–3720, https://doi.org/10.1002/grl.50719, 2013. a
Bondur, V.: Satellite monitoring of wildfires during the anomalous heat wave of 2010 in Russia, Izvestiya, Atmos. Ocean. Phys., 47, 1039– 1048, https://doi.org/10.1134/S0001433811090040, 2011. a
Booth, B. B. B., Dunstone, N. J., Halloran, P. R., Andrews, T., and Bellouin, N.: Aerosols implicated as a prime driver of twentieth-century North Atlantic climate variability, Nature, 484, 228–232, https://doi.org/10.1038/nature10946, 2012. a
Boucher, O.: Atmospheric Aerosols: Properties and Climate Impacts, Springer Netherlands, xVII, 311 pp., https://doi.org/10.1007/978-94-017-9649-1, 2015. a
Boucher, O., Randall, D., Artaxo, P., Bretherton, C., Feingold, G., Forster, P., Kerminen, V.-M., Kondo, Y., Liao, H., Lohmann, U., Rasch, P., Satheesh, S., Sherwood, S., Stevens, B., and Zhang, X.: Clouds and aerosols, in: Climate Change 2013: The Physical Science Basis. Contribution of Working Group I to the Fifth Assessment Report of the Intergovernmental Panel on Climate Change, edited by: Stocker, T., Qin, D., Plattner, G.-K., Tignor, M., Allen, S., Boschung, J., Nauels, A., Xia, Y., Bex, V., and Midgley, P., Cambridge University Press, Cambridge University Press, Cambridge, United Kingdom and New York, NY, USA, 571 – 657, 2013. a
Brunner, D., Savage, N., Jorba, O., Eder, B., Giordano, L., Badia, A., Balzarini, A., Baró, R., Bianconi, R., Chemel, C., Curci, G., Forkel, R., Jiménez-Guerrero, P., Hirtl, M., Hodzic, A., Honzak, L., Im, U., Knote, C., Makar, P., Manders-Groot, A., van Meijgaard, E., Neal, L., Pérez, J. L., Pirovano, G., San José, R., Schröder, W., Sokhi, R. S., Syrakov, D., Torian, A., Tuccella, P., Werhahn, J., Wolke, R., Yahya, K., Zabkar, R., Zhang, Y., Hogrefe, C., and Galmarini, S.: Comparative analysis of meteorological performance of coupled chemistry-meteorology models in the context of AQMEII phase 2, Atmos. Environ., 115, 470–498, https://doi.org/10.1016/j.atmosenv.2014.12.032, 2015. a
Charlson, R. J., Schwartz, S. E., Hales, J. M., Cess, R. D., Coakley, J. A., Hansen, J. E., and Hofmann, D. J.: Climate Forcing by Anthropogenic Aerosols, Science, 255, 423–430, https://doi.org/10.1126/science.255.5043.423, 1992. a
Chubarova, N., Nezval', Ye., Sviridenkov, I., Smirnov, A., and Slutsker, I.: Smoke aerosol and its radiative effects during extreme fire event over Central Russia in summer 2010, Atmos. Meas. Tech., 5, 557–568, https://doi.org/10.5194/amt-5-557-2012, 2012. a
Claquin, T., Schulz, M., Balkanski, Y., and Boucher, O.: Uncertainties in assessing radiative forcing by mineral dust, Tellus B, 50, 491–505, https://doi.org/10.1034/j.1600-0889.1998.t01-2-00007.x, 1998. a
Croft, B., Pierce, J. R., Martin, R. V., Hoose, C., and Lohmann, U.: Uncertainty associated with convective wet removal of entrained aerosols in a global climate model, Atmos. Chem. Phys., 12, 10725–10748, https://doi.org/10.5194/acp-12-10725-2012, 2012. a, b
Curci, G., Alyuz, U., Barò, R., Bianconi, R., Bieser, J., Christensen, J. H., Colette, A., Farrow, A., Francis, X., Jiménez-Guerrero, P., Im, U., Liu, P., Manders, A., Palacios-Peña, L., Prank, M., Pozzoli, L., Sokhi, R., Solazzo, E., Tuccella, P., Unal, A., Vivanco, M. G., Hogrefe, C., and Galmarini, S.: Modelling black carbon absorption of solar radiation: combining external and internal mixing assumptions, Atmos. Chem. Phys., 19, 181–204, https://doi.org/10.5194/acp-19-181-2019, 2019. a, b
Devenish, B. J., Furtado, K., and Thomson, D. J.: Analytical Solutions of the Supersaturation Equation for a Warm Cloud, J. Atmos. Sci., 73, 3453–3465, https://doi.org/10.1175/JAS-D-15-0281.1, 2016. a
Diapouli, E., Popovicheva, O., Kistler, M., Vratolis, S., Persiantseva, N., Timofeev, M., Kasper-Giebl, A., and Eleftheriadis, K.: Physicochemical characterization of aged biomass burning aerosol after long-range transport to Greece from large scale wildfires in Russia and surrounding regions, Summer 2010, Atmos. Environ., 96, 393–404, https://doi.org/10.1016/j.atmosenv.2014.07.055, 2014. a
Doherty, R. M., Stevenson, D. S., Collins, W. J., and Sanderson, M. G.: Influence of convective transport on tropospheric ozone and its precursors in a chemistry-climate model, Atmos. Chem. Phys., 5, 3205–3218, https://doi.org/10.5194/acp-5-3205-2005, 2005. a
Easter, R. C., Ghan, S. J., Zhang, Y., Saylor, R. D., Chapman, E. G., Laulainen, N. S., Abdul-Razzak, H., Leung, L. R., Bian, X., and Zaveri, R. A.: MIRAGE: Model description and evaluation of aerosols and trace gases, J. Geophys. Res.-Atmos., 109, D20210, https://doi.org/10.1029/2004JD004571, 2004. a
Eck, T. F., Holben, B. N., Reid, J. S., Dubovik, O., Smirnov, A., O'Neill, N. T., Slutsker, I., and Kinne, S.: Wavelength dependence of the optical depth of biomass burning, urban, and desert dust aerosols, J. Geophys. Res.-Atmos., 104, 31333–31349, https://doi.org/10.1029/1999JD900923, 1999. a
Fast, J. D., Gustafson Jr., W. I., Easter, R. C., Zaveri, R. A., Barnard, J. C., Chapman, E. G., Grell, G. A., and Peckham, S. E.: Evolution of ozone, particulates, and aerosol direct radiative forcing in the vicinity of Houston using a fully coupled meteorology-chemistry-aerosol model, J. Geophys. Res.-Atmos., 111, D21305, https://doi.org/10.1029/2005JD006721, 2006. a
Fernald, F. G., Herman, B. M., and Reagan, J. A.: Determination of Aerosol Height Distributions by Lidar, J. Appl. Meteorol., 11, 482–489, https://doi.org/10.1175/1520-0450(1972)011<0482:DOAHDB>2.0.CO;2, 1972. a
Forkel, R., Balzarini, A., Baró, R., Bianconi, R., Curci, G., Jiménez-Guerrero, P., Hirtl, M., Honzak, L., Lorenz, C., Im, U., Pérez, J. L., Pirovano, G., San José, R., Tuccella, P., Werhahn, J., and Žabkar, R.: Analysis of the WRF-Chem contributions to AQMEII phase2 with respect to aerosol radiative feedbacks on meteorology and pollutant distributions, Atmos. Environ., 115, 630–645, https://doi.org/10.1016/j.atmosenv.2014.10.056, 2015. a, b, c
Forkel, R., Brunner, D., Baklanov, A., Balzarini, A., Hirtl, M., Honzak, L., Jiménez-Guerrero, P., Jorba, O., Pérez, J. L., San José, R., Schöder, W., Tsegas, G., Werhahn, J., Wolke, R., and Žabkar, R.: A Multi-model Case Study on Aerosol Feedbacks in Online Coupled Chemistry-Meteorology Models Within the COST Action ES1004 EuMetChem, in: Air Pollution Modeling and its Application XXIV, Springer Proceedings in Complexity, Springer, Cham, 23–28, 2016. a
Forster, P., Ramaswamy, V., Artaxo, P., Berntsen, T., Betts, R., Fahey, D., Haywood, J., Lean, J., Lowe, D., Myhre, G., Nganga, J., Prinn, R., Raga, G., Schulz, M., and Dorland, R. V.: Changes in Atmospheric Constituents and in Radiative Forcing, in: Climate Change 2013: The Physical Science Basis. Contribution of Working Group I to the Fouth Assessment Report of the Intergovernmental Panel on Climate Change, edited by: Solomon, S., Qin, D., Manning, M., Chen, Z., Marquis, M., Averyt, K., Tignor, M., and Miller, H., Cambridge University Press, Cambridge, United Kingdom and New York, NY, USA, 129–234, 2007. a
Galmarini, S., Hogrefe, C., Brunner, D., Makar, P., and Baklanov, A.: Preface, Atmos. Environ., 115, 340–344, https://doi.org/10.1016/j.atmosenv.2015.06.009, 2015. a
Geiger, H., Barnes, I., Bejan, I., Benter, T., and Spittler, M.: The tropospheric degradation of isoprene: an updated module for the regional atmospheric chemistry mechanism, Atmos. Environ., 37, 1503–1519, https://doi.org/10.1016/S1352-2310(02)01047-6, 2003. a
Ghan, S., Wang, M., Zhang, S., Ferrachat, S., Gettelman, A., Griesfeller, J., Kipling, Z., Lohmann, U., Morrison, H., Neubauer, D., Partridge, D. G., Stier, P., Takemura, T., Wang, H., and Zhang, K.: Challenges in constraining anthropogenic aerosol effects on cloud radiative forcing using present-day spatiotemporal variability, P. Natl. Acad. Sci. USA, 113, 5804–5811, https://doi.org/10.1073/pnas.1514036113, 2016. a
Ginoux, P., Horowitz, L. W., Ramaswamy, V., Geogdzhayev, I. V., Holben, B. N., Stenchikov, G., and Tie, X.: Evaluation of aerosol distribution and optical depth in the Geophysical Fluid Dynamics Laboratory coupled model CM2.1 for present climate, J. Geophys. Res.-Atmos., 111, D22210, https://doi.org/10.1029/2005JD006707, 2006. a
Gorchakov, G., Sitnov, S., Sviridenkov, M., Semoutnikova, E., Emilenko, A., Isakov, A., Kopeikin, V., Karpov, A., Gorchakova, I., Verichev, K., Kurbatov, G., and Ponomareva, T.: Satellite and ground-based monitoring of smoke in the atmosphere during the summer wildfires in European Russia in 2010 and Siberia in 2012, Int. J. Remote Sens., 35, 5698–5721, https://doi.org/10.1080/01431161.2014.945008, 2014. a, b
Granier, C., Bessagnet, B., Bond, T., D’Angiola, A., van Der Gon, H. D., Frost, G. J., Heil, A., Kaiser, J. W., Kinne, S., Klimont, Z., Kloster, S., Lamarque, J.-F., Liousse, C., Masui, T., Meleux, F., Mieville, A., Ohara, T., Raut, J.-C., Riahi, K., Schultz, M. G., Smith, S. J., Thompson, A., van Aardenne, J., van der Werf, G. R. and van Vuuren, D. P.: Evolution of anthropogenic and biomass burning emissions of air pollutants at global and regional scales during the 1980–2010 period, Climatic Change, 109, 163–190, https://doi.org/10.1007/s10584-011-0154-1, 2011. a
Greenfield, S. M.: Rain scavenging of radioactive particulate matter from the atmosphere, J. Meteorol., 14, 115–125, https://doi.org/10.1175/1520-0469(1957)014<0115:RSORPM>2.0.CO;2, 1957. a
Grell, G. A.: Prognostic Evaluation of Assumptions Used by Cumulus Parameterizations, Mon. Weather Rev., 121, 764–787, https://doi.org/10.1175/1520-0493(1993)121<0764:PEOAUB>2.0.CO;2, 1993. a
Grell, G. A. and Dévényi, D.: A generalized approach to parameterizing convection combining ensemble and data assimilation techniques, Geophys. Res. Lett., 29, 14, https://doi.org/10.1029/2002GL015311, 2002. a
Grell, G. A. and Freitas, S. R.: A scale and aerosol aware stochastic convective parameterization for weather and air quality modeling, Atmos. Chem. Phys., 14, 5233–5250, https://doi.org/10.5194/acp-14-5233-2014, 2014. a
Grell, G. A., Dudhia, J., and Stauffer, D. R.: A description of the fifth-generation Penn State/NCAR mesoscale model (MM5), Tech. rep., Mesoscale and Microscale Meteorology Division, National Center for Atmospheric Research, 121 pp., https://doi.org/10.5065/D60Z716B, 1994. a
Grell, G. A., Peckham, S. E., Schmitz, R., McKeen, S. A., Frost, G., Skamarock, W. C., and Eder, B.: Fully coupled “online” chemistry within the WRF model, Atmos. Environ., 39, 6957–6975, https://doi.org/10.1016/j.atmosenv.2005.04.027, 2005. a, b, c
Haywood, J. and Boucher, O.: Estimates of the direct and indirect radiative forcing due to tropospheric aerosols: A review, Rev. Geophys., 38, 513–543, https://doi.org/10.1029/1999RG000078, 2000. a
Hong, S.-Y., Noh, Y., and Dudhia, J.: A New Vertical Diffusion Package with an Explicit Treatment of Entrainment Processes, Mon. Weather Rev., 134, 2318–2341, https://doi.org/10.1175/MWR3199.1, 2006. a
Iacono, M. J., Delamere, J. S., Mlawer, E. J., Shephard, M. W., Clough, S. A., and Collins, W. D.: Radiative forcing by long-lived greenhouse gases: Calculations with the AER radiative transfer models, J. Geophys. Res.-Atmos., 113, D13103, https://doi.org/10.1029/2008JD009944, 2008. a
Im, U., Bianconi, R., Solazzo, E., Kioutsioukis, I., Badia, A., Balzarini, A., Baró, R., Bellasio, R., Brunner, D., Chemel, C., Curci, G., Flemming, J., Forkel, R., Giordano, L., Jiménez-Guerrero, P., Hirtl, M., Hodzic, A., Honzak, L., Jorba, O., Knote, C., Kuenen, J. J., Makar, P. A., Manders-Groot, A., Neal, L., Pérez, J. L., Pirovano, G., Pouliot, G., Jose, R. S., Savage, N., Schroder, W., Sokhi, R. S., Syrakov, D., Torian, A., Tuccella, P., Werhahn, J., Wolke, R., Yahya, K., Žabkar, R., Zhang, Y., Zhang, J., Hogrefe, C., and Galmarini, S.: Evaluation of operational on-line-coupled regional air quality models over Europe and North America in the context of AQMEII phase 2. Part I: Ozone, Atmos. Environ., 115, 404–420, https://doi.org/10.1016/j.atmosenv.2014.09.042, 2015a. a
Im, U., Bianconi, R., Solazzo, E., Kioutsioukis, I., Badia, A., Balzarini, A., Baró, R., Bellasio, R., Brunner, D., Chemel, C., Curci, G., van der Gon, H. D., Flemming, J., Forkel, R., Giordano, L., Jiménez-Guerrero, P., Hirtl, M., Hodzic, A., Honzak, L., Jorba, O., Knote, C., Makar, P. A., Manders-Groot, A., Neal, L., Pérez, J. L., Pirovano, G., Pouliot, G., Jose, R. S., Savage, N., Schroder, W., Sokhi, R. S., Syrakov, D., Torian, A., Tuccella, P., Wang, K., Werhahn, J., Wolke, R., Žabkar, R., Zhang, Y., Zhang, J., Hogrefe, C., and Galmarini, S.: Evaluation of operational online-coupled regional air quality models over Europe and North America in the context of AQMEII phase 2. Part II: Particulate matter, Atmos. Environ., 115, 421–441, https://doi.org/10.1016/j.atmosenv.2014.08.072, 2015b. a
Inness, A., Baier, F., Benedetti, A., Bouarar, I., Chabrillat, S., Clark, H., Clerbaux, C., Coheur, P., Engelen, R. J., Errera, Q., Flemming, J., George, M., Granier, C., Hadji-Lazaro, J., Huijnen, V., Hurtmans, D., Jones, L., Kaiser, J. W., Kapsomenakis, J., Lefever, K., Leitão, J., Razinger, M., Richter, A., Schultz, M. G., Simmons, A. J., Suttie, M., Stein, O., Thépaut, J.-N., Thouret, V., Vrekoussis, M., Zerefos, C., and the MACC team: The MACC reanalysis: an 8 yr data set of atmospheric composition, Atmos. Chem. Phys., 13, 4073–4109, https://doi.org/10.5194/acp-13-4073-2013, 2013. a
Kasoar, M., Voulgarakis, A., Lamarque, J.-F., Shindell, D. T., Bellouin, N., Collins, W. J., Faluvegi, G., and Tsigaridis, K.: Regional and global temperature response to anthropogenic SO2 emissions from China in three climate models, Atmos. Chem. Phys., 16, 9785–9804, https://doi.org/10.5194/acp-16-9785-2016, 2016. a
Kim, D., Chin, M., Yu, H., Diehl, T., Tan, Q., Kahn, R. A., Tsigaridis, K., Bauer, S. E., Takemura, T., Pozzoli, L., Bellouin, N., Schulz, M., Peyridieu, S., Chédin, A., and Koffi, B.: Sources, sinks, and transatlantic transport of North African dust aerosol: A multimodel analysis and comparison with remote sensing data, J. Geophys. Res.-Atmos., 119, 6259–6277, https://doi.org/10.1002/2013JD021099, 2014. a
Kipling, Z., Stier, P., Johnson, C. E., Mann, G. W., Bellouin, N., Bauer, S. E., Bergman, T., Chin, M., Diehl, T., Ghan, S. J., Iversen, T., Kirkevåg, A., Kokkola, H., Liu, X., Luo, G., van Noije, T., Pringle, K. J., von Salzen, K., Schulz, M., Seland, Ø., Skeie, R. B., Takemura, T., Tsigaridis, K., and Zhang, K.: What controls the vertical distribution of aerosol? Relationships between process sensitivity in HadGEM3–UKCA and inter-model variation from AeroCom Phase II, Atmos. Chem. Phys., 16, 2221–2241, https://doi.org/10.5194/acp-16-2221-2016, 2016. a, b, c, d, e, f, g
Koffi, B., Schulz, M., Bréon, F.-M., Dentener, F., Steensen, B. M., Griesfeller, J., Winker, D., Balkanski, Y., Bauer, S. E., Bellouin, N., Berntsen, T., Bian, H., Chin, M., Diehl, T., Easter, R., Ghan, S., Hauglustaine, D. A., Iversen, T., Kirkevȧg, A., Liu, X., Lohmann, U., Myhre, G., Rasch, P., Seland, O., Skeie, R. B., Steenrod, S. D., Stier, P., Tackett, J., Takemura, T., Tsigaridis, K., Vuolo, M. R., Yoon, J., and Zhang, K.: Evaluation of the aerosol vertical distribution in global aerosol models through comparison against CALIOP measurements: AeroCom phase II results, J. Geophys. Res.-Atmos., 121, 7254–7283, https://doi.org/10.1002/2015JD024639, 2016. a
Kong, X., Forkel, R., Sokhi, R. S., Suppan, P., Baklanov, A., Gauss, M., Brunner, D., Baró, R., Balzarini, A., Chemel, C., Curci, G., Jiménez-Guerrero, P., Hirtl, M., Honzak, L., Im, U., Pérez, J. L., Pirovano, G., San José, R., Schlünzen, K. H., Tsegas, G., Tuccella, P., Werhahn, J., Žabkar, R., and Galmarini, S.: Analysis of meteorology-chemistry interactions during air pollution episodes using online coupled models within AQMEII phase-2, Atmos. Environ., 115, 527–540, https://doi.org/10.1016/j.atmosenv.2014.09.020, 2015. a, b
Konovalov, I. B., Beekmann, M., Kuznetsova, I. N., Yurova, A., and Zvyagintsev, A. M.: Atmospheric impacts of the 2010 Russian wildfires: integrating modelling and measurements of an extreme air pollution episode in the Moscow region, Atmos. Chem. Phys., 11, 10031–10056, https://doi.org/10.5194/acp-11-10031-2011, 2011. a
Kramm, G., Beheng, K. D., and Müller, H.: Vertical transport of polydispersed aerosol particles in the atmospheric surface layer, in: Precipitation Scavenging and Atmosphere-Surface Exchange Processes, edited by: Schwartz, S. and Slinn, W., Hemisphere New York, vol. 2, 1125–1141, 1992. a
Kuenen, J. J. P., Visschedijk, A. J. H., Jozwicka, M., and Denier van der Gon, H. A. C.: TNO-MACC_II emission inventory; a multi-year (2003–2009) consistent high-resolution European emission inventory for air quality modelling, Atmos. Chem. Phys., 14, 10963–10976, https://doi.org/10.5194/acp-14-10963-2014, 2014. a
Lacagnina, C., Hasekamp, O. P., Bian, H., Curci, G., Myhre, G., van Noije, T., Schulz, M., Skeie, R. B., Takemura, T., and Zhang, K.: Aerosol single-scattering albedo over the global oceans: Comparing PARASOL retrievals with AERONET, OMI, and AeroCom models estimates, J. Geophys. Res.-Atmos., 120, 9814–9836, https://doi.org/10.1002/2015JD023501, 2015. a
Ladino, L., Stetzer, O., Hattendorf, B., Günther, D., Croft, B., and Lohmann, U.: Experimental Study of Collection Efficiencies between Submicron Aerosols and Cloud Droplets, J. Atmos. Sci., 68, 1853–1864, https://doi.org/10.1175/JAS-D-11-012.1, 2011. a
Lau, W. K. M. and Kim, K.-M.: The 2010 Pakistan Flood and Russian Heat Wave: Teleconnection of Hydrometeorological Extremes, J. Hydrometeorol., 13, 392–403, https://doi.org/10.1175/JHM-D-11-016.1, 2012. a
Lee, L. A., Pringle, K. J., Reddington, C. L., Mann, G. W., Stier, P., Spracklen, D. V., Pierce, J. R., and Carslaw, K. S.: The magnitude and causes of uncertainty in global model simulations of cloud condensation nuclei, Atmos. Chem. Phys., 13, 8879–8914, https://doi.org/10.5194/acp-13-8879-2013, 2013. a, b, c, d, e, f, g, h, i
Makar, P., Gong, W., Hogrefe, C., Zhang, Y., Curci, G., Žabkar, R., Milbrandt, J., Im, U., Balzarini, A., Baró, R., Bianconi, R., Cheung, P., Forkel, R., Gravel, S., Hirtl, M., Honzak, L., Hou, A., Jiménez-Guerrero, P., Langer, M., Moran, M., Pabla, B., Pérez, J., Pirovano, G., José, R. S., Tuccella, P., Werhahn, J., Zhang, J., and Galmarini, S.: Feedbacks between air pollution and weather, part 2: Effects on chemistry, Atmos. Environ., 115, 499–526, https://doi.org/10.1016/j.atmosenv.2014.10.021, 2015a. a
Makar, P., Gong, W., Milbrandt, J., Hogrefe, C., Zhang, Y., Curci, G., Žabkar, R., Im, U., Balzarini, A., Baró, R., Bianconi, R., Cheung, P., Forkel, R., Gravel, S., Hirtl, M., Honzak, L., Hou, A., Jiménez-Guerrero, P., Langer, M., Moran, M., Pabla, B., Pérez, J., Pirovano, G., San José, R., Tuccella, P., Werhahn, J., Zhang, J., and Galmarini, S.: Feedbacks between air pollution and weather, Part 1: Effects on weather, Atmos. Environ., 115, 442–469, https://doi.org/10.1016/j.atmosenv.2014.12.003, 2015b. a, b, c
Mann, G. W., Carslaw, K. S., Reddington, C. L., Pringle, K. J., Schulz, M., Asmi, A., Spracklen, D. V., Ridley, D. A., Woodhouse, M. T., Lee, L. A., Zhang, K., Ghan, S. J., Easter, R. C., Liu, X., Stier, P., Lee, Y. H., Adams, P. J., Tost, H., Lelieveld, J., Bauer, S. E., Tsigaridis, K., van Noije, T. P. C., Strunk, A., Vignati, E., Bellouin, N., Dalvi, M., Johnson, C. E., Bergman, T., Kokkola, H., von Salzen, K., Yu, F., Luo, G., Petzold, A., Heintzenberg, J., Clarke, A., Ogren, J. A., Gras, J., Baltensperger, U., Kaminski, U., Jennings, S. G., O'Dowd, C. D., Harrison, R. M., Beddows, D. C. S., Kulmala, M., Viisanen, Y., Ulevicius, V., Mihalopoulos, N., Zdimal, V., Fiebig, M., Hansson, H.-C., Swietlicki, E., and Henzing, J. S.: Intercomparison and evaluation of global aerosol microphysical properties among AeroCom models of a range of complexity, Atmos. Chem. Phys., 14, 4679–4713, https://doi.org/10.5194/acp-14-4679-2014, 2014. a
Mielonen, T., Aaltonen, V., Lihavainen, H., Hyvärinen, A.-P., Arola, A., Komppula, M., and Kivi, R.: Biomass Burning Aerosols Observed in Northern Finland during the 2010 Wildfires in Russia, Atmosphere, 4, 17–34, https://doi.org/10.3390/atmos4010017, 2013. a, b, c
Morrison, H., Thompson, G., and Tatarskii, V.: Impact of Cloud Microphysics on the Development of Trailing Stratiform Precipitation in a Simulated Squall Line: Comparison of One- and Two-Moment Schemes, Mon. Weather Rev., 137, 991–1007, https://doi.org/10.1175/2008MWR2556.1, 2009. a
Müller, D., Ansmann, A., Mattis, I., Tesche, M., Wandinger, U., Althausen, D., and Pisani, G.: Aerosol-type-dependent lidar ratios observed with Raman lidar, J. Geophys. Res.-Atmos., 112, D16202, https://doi.org/10.1029/2006JD008292, 2007. a
Nordling, K., Korhonen, H., Räisänen, P., Alper, M. E., Uotila, P., O'Donnell, D., and Merikanto, J.: Role of climate model dynamics in estimated climate responses to anthropogenic aerosols, Atmos. Chem. Phys., 19, 9969–9987, https://doi.org/10.5194/acp-19-9969-2019, 2019. a, b, c, d
Obiso, V. and Jorba, O.: Aerosol-radiation interaction in atmospheric models: Idealized sensitivity study of simulated short-wave direct radiative effects to particle microphysical properties, J. Aerosol Sci., 115, 46–61, https://doi.org/10.1016/j.jaerosci.2017.10.004, 2018. a
Obiso, V., Pandolfi, M., Ealo, M., and Jorba, O.: Impact of aerosol microphysical properties on mass scattering cross sections, J. Aerosol Sci., 112, 68–82, https://doi.org/10.1016/j.jaerosci.2017.03.001, 2017. a
Palacios-Peña, L., Baró, R., Guerrero-Rascado, J. L., Alados-Arboledas, L., Brunner, D., and Jiménez-Guerrero, P.: Evaluating the representation of aerosol optical properties using an online coupled model over the Iberian Peninsula, Atmos. Chem. Phys., 17, 277–296, https://doi.org/10.5194/acp-17-277-2017, 2017. a, b
Palacios-Peña, L., Baró, R., Baklanov, A., Balzarini, A., Brunner, D., Forkel, R., Hirtl, M., Honzak, L., López-Romero, J. M., Montávez, J. P., Pérez, J. L., Pirovano, G., San José, R., Schröder, W., Werhahn, J., Wolke, R., Žabkar, R., and Jiménez-Guerrero, P.: An assessment of aerosol optical properties from remote-sensing observations and regional chemistry–climate coupled models over Europe, Atmos. Chem. Phys., 18, 5021–5043, https://doi.org/10.5194/acp-18-5021-2018, 2018. a, b, c, d, e, f, g
Palacios-Peña, L., Jiménez-Guerrero, P., Baró, R., Balzarini, A., Bianconi, R., Curci, G., Landi, T. C., Pirovano, G., Prank, M., Riccio, A., Tuccella, P., and Galmarini, S.: Aerosol optical properties over Europe: an evaluation of the AQMEII Phase 3 simulations against satellite observations, Atmos. Chem. Phys., 19, 2965–2990, https://doi.org/10.5194/acp-19-2965-2019, 2019a. a, b, c, d, e, f, g, h
Palacios-Peña, L., Lorente-Plazas, R., Montávez, J. P., and Jiménez-Guerrero, P.: Saharan Dust Modeling Over the Mediterranean Basin and Central Europe: Does the Resolution Matter?, Front. Earth Sci., 7, 290, https://doi.org/10.3389/feart.2019.00290, 2019b. a
Palacios-Peña, L., Fast, J. D., Pravia-Sarabia, E., and Jiménez-Guerrero, P.: Sensitivity of aerosol optical properties to the aerosol size distribution over central Europe and the Mediterranean Basin, Geosci. Model Dev. Discuss., https://doi.org/10.5194/gmd-2020-68, in review, 2020. a
Pan, X., Chin, M., Gautam, R., Bian, H., Kim, D., Colarco, P. R., Diehl, T. L., Takemura, T., Pozzoli, L., Tsigaridis, K., Bauer, S., and Bellouin, N.: A multi-model evaluation of aerosols over South Asia: common problems and possible causes, Atmos. Chem. Phys., 15, 5903–5928, https://doi.org/10.5194/acp-15-5903-2015, 2015. a
Penner, J. E., Andreae, M. O., Annegarn, H., Barrie, L., Feichter, J., Hegg, D., Jayaraman, A., Leaitch, R., Murphy, D., Nganga, J., and Pitari, G.: Aerosols, their direct and indirect effects, in: Climate Change 2001: The Scientific Basis. Contribution of Working Group I to the Third Assessment Report of the Intergovernmental Panel on Climate Change, edited by: Houghton, J. T., Ding, Y., Griggs, D. J., Noguer, M., Linden, P. J. V. D., and Xiaosu, D., Cambridge University Press, Cambridge University Press, Cambridge, United Kingdom and New York, NY, USA, 289–348, 2001. a
Péré, J. C., Bessagnet, B., Mallet, M., Waquet, F., Chiapello, I., Minvielle, F., Pont, V., and Menut, L.: Direct radiative effect of the Russian wildfires and its impact on air temperature and atmospheric dynamics during August 2010, Atmos. Chem. Phys., 14, 1999–2013, https://doi.org/10.5194/acp-14-1999-2014, 2014. a
Péré, J. C., Bessagnet, B., Pont, V., Mallet, M., and Minvielle, F.: Influence of the aerosol solar extinction on photochemistry during the 2010 Russian wildfires episode, Atmos. Chem. Phys., 15, 10983–10998, https://doi.org/10.5194/acp-15-10983-2015, 2015. a
Pleim, J., Venkatram, A., and Yamartino, R.: ADOM/TADAP Model Development Program: The Dry Deposition Module, Atmos. Enviro., 14, 1013–1016, 1984. a
Portin, H., Mielonen, T., Leskinen, A., Arola, A., Pärjälä, E., Romakkaniemi, S., Laaksonen, A., Lehtinen, K., and Komppula, M.: Biomass burning aerosols observed in Eastern Finland during the Russian wildfires in summer 2010 – Part 1: In-situ aerosol characterization, Atmos. Environ., 47, 269–278, https://doi.org/10.1016/j.atmosenv.2011.10.067, 2012. a
Pouliot, G., Pierce, T., van der Gon, H. D., Schaap, M., Moran, M., and Nopmongcol, U.: Comparing emission inventories and model-ready emission datasets between Europe and North America for the AQMEII project, Atmos. Environ., 53, 4–14, https://doi.org/10.1016/j.atmosenv.2011.12.041, 2012. a
Pouliot, G., van der Gon, H. A. C. D., Kuenen, J., Zhang, J., Moran, M. D., and Makar, P. A.: Analysis of the emission inventories and model-ready emission datasets of Europe and North America for phase 2 of the AQMEII project, Atmos. Environ., 115, 345–360, https://doi.org/10.1016/j.atmosenv.2014.10.061, 2015. a
Quan, J., Di, Z., Duan, Q., Gong, W., Wang, C., Gan, Y., Ye, A., and Miao, C.: An evaluation of parametric sensitivities of different meteorological variables simulated by the WRF model, Q. J. Roy. Meteorol. Soc., 142, 2925–2934, https://doi.org/10.1002/qj.2885, 2016. a, b
Rahmstorf, S. and Coumou, D.: Increase of extreme events in a warming world, P. Natl. Acad. Sci. USA, 108, 17905–17909, https://doi.org/10.1073/pnas.1101766108, 2011. a
Randall, D. A., Wood, R. A., Bony, S., Colman, R., Fichefet, T., Fyfe, J., Kattsov, V., Pitman, A., Shukla, J., Srinivasan, J., Stouffer, R. J., Sumi, A., and Taylor, K. E.: Climate models and their evaluation, in: Climate Change 2013: The Physical Science Basis. Contribution of Working Group I to the Fouth Assessment Report of the Intergovernmental Panel on Climate Change, edited by: Solomon, S., Qin, D., Manning, M., Chen, A., Marquis, M., Averyt, K., Tignor, M., and Miller, H., Cambridge University Press, Cambridge University Press, Cambridge, United Kingdom and New York, NY, USA, 589–662, 2007. a, b
Randles, C. A., Kinne, S., Myhre, G., Schulz, M., Stier, P., Fischer, J., Doppler, L., Highwood, E., Ryder, C., Harris, B., Huttunen, J., Ma, Y., Pinker, R. T., Mayer, B., Neubauer, D., Hitzenberger, R., Oreopoulos, L., Lee, D., Pitari, G., Di Genova, G., Quaas, J., Rose, F. G., Kato, S., Rumbold, S. T., Vardavas, I., Hatzianastassiou, N., Matsoukas, C., Yu, H., Zhang, F., Zhang, H., and Lu, P.: Intercomparison of shortwave radiative transfer schemes in global aerosol modeling: results from the AeroCom Radiative Transfer Experiment, Atmos. Chem. Phys., 13, 2347–2379, https://doi.org/10.5194/acp-13-2347-2013, 2013. a
Regayre, L. A., Johnson, J. S., Yoshioka, M., Pringle, K. J., Sexton, D. M. H., Booth, B. B. B., Lee, L. A., Bellouin, N., and Carslaw, K. S.: Aerosol and physical atmosphere model parameters are both important sources of uncertainty in aerosol ERF, Atmos. Chem. Phys., 18, 9975–10006, https://doi.org/10.5194/acp-18-9975-2018, 2018. a, b, c, d, e
Romakkaniemi, S., Arola, A., Kokkola, H., Birmili, W., Tuch, T., Kerminen, V.-M., Räisänen, P., Smith, J. N., Korhonen, H., and Laaksonen, A.: Effect of aerosol size distribution changes on AOD, CCN and cloud droplet concentration: Case studies from Erfurt and Melpitz, Germany, J. Geophys. Res.-Atmos., 117, D07202, https://doi.org/10.1029/2011JD017091, 2012. a, b, c, d
Safronov, A. N., Fokeeva, E. V., Rakitin, V. S., Grechko, E. I., and Shumsky, R. A.: Severe Wildfires Near Moscow, Russia in 2010: Modeling of Carbon Monoxide Pollution and Comparisons with Observations, Remote Sensing, 7, 395–429, https://doi.org/10.3390/rs70100395, 2015. a
Sarrafzadeh, M., Wildt, J., Pullinen, I., Springer, M., Kleist, E., Tillmann, R., Schmitt, S. H., Wu, C., Mentel, T. F., Zhao, D., Hastie, D. R., and Kiendler-Scharr, A.: Impact of NOx and OH on secondary organic aerosol formation from β-pinene photooxidation, Atmos. Chem. Phys., 16, 11237–11248, https://doi.org/10.5194/acp-16-11237-2016, 2016. a, b
Saxena, P., Hudischewskyj, A. B., Seigneur, C., and Seinfeld, J. H.: A comparative study of equilibrium approaches to the chemical characterization of secondary aerosols, Atmos. Environ., 20, 1471–1483, https://doi.org/10.1016/0004-6981(86)90019-3, 1986. a
Schaap, M., Roemer, M., Sauter, F., Boersen, G., Timmermans, R., Builtjes, P. J. H., and Vermeulen, A. T.: LOTOS-EUROS: Documentation, Tech. rep., TNO, 57 pp., 2005. a
Schimel, D., Alves, D., Enting, I., Heimann, M., Joos, F., Raynaud, D., Wigley, T., Prather, M., Derwent, R., Ehhalt, D., Fraser, P., Sanhuenza, E., Zhou, X., Jonas, P., Charlson, R., Rodhe, H., Sadasivan, S., Shine, K. P., Fouquart, Y., Ramaswamy, V., Solomon, S., Srinivasan, J., Albritton, D., Isaksen, I., Lal, M., and Wuebbles, D.: Radiative forcing of climate change, in: Climate Change 1996, Contribution of Working Group I to the Second Assessment Report of the Intergovernmental Panel on Climate Change, edited by: Houghton, J. T., Meira Filho, L. G., Callander, B. A., Harris, N., Kattenberg, A., and Maskell, K., Cambridge University Press, Cambridge, United Kingdom and New York, NY, USA, 1996. a
Sedlàček, J., Martius, O., and Knutti, R.: Influence of subtropical and polar sea-surface temperature anomalies on temperatures in Eurasia, Geophys. Res. Lett., 38, L12803, https://doi.org/10.1029/2011GL047764, 2011. a
Seinfeld, J. H. and Pandis, S. N.: Atmospheric Chemistry and Physics: From Air Pollution to Climate Change, John Wiley & Sons, INC., 2nd Edn., 1225 pp., 2006. a
Slinn, S. and Slinn, W.: Predictions for particle deposition on natural waters, Atmos. Environ., 14, 1013–1016, https://doi.org/10.1016/0004-6981(80)90032-3, 1980. a
Soares, J., Sofiev, M., and Hakkarainen, J.: Uncertainties of wild-land fires emission in AQMEII phase 2 case study, Atmos. Environ., 115, 361–370, https://doi.org/10.1016/j.atmosenv.2015.01.068, 2015. a, b, c, d, e
Sofiev, M., Vankevich, R., Lotjonen, M., Prank, M., Petukhov, V., Ermakova, T., Koskinen, J., and Kukkonen, J.: An operational system for the assimilation of the satellite information on wild-land fires for the needs of air quality modelling and forecasting, Atmos. Chem. Phys., 9, 6833–6847, https://doi.org/10.5194/acp-9-6833-2009, 2009. a
Stier, P., Feichter, J., Kinne, S., Kloster, S., Vignati, E., Wilson, J., Ganzeveld, L., Tegen, I., Werner, M., Balkanski, Y., Schulz, M., Boucher, O., Minikin, A., and Petzold, A.: The aerosol-climate model ECHAM5-HAM, Atmos. Chem. Phys., 5, 1125–1156, https://doi.org/10.5194/acp-5-1125-2005, 2005. a
Stockwell, W. R., Kirchner, F., Kuhn, M., and Seefeld, S.: A new mechanism for regional atmospheric chemistry modeling, J. Geophys. Res.-Atmos., 102, 25847–25879, https://doi.org/10.1029/97JD00849, 1997. a
Tegen, I. and Lacis, A. A.: Modeling of particle size distribution and its influence on the radiative properties of mineral dust aerosol, J. Geophys. Res.-Atmos., 101, 19237–19244, https://doi.org/10.1029/95JD03610, 1996. a
Tewari, M., Chen, F., Wang, W., Dudhia, J., LeMone, M., Mitchell, K., Ek, M., Gayno, G., Wegiel, J., and Cuenca, R.: Implementation and verification of the unified NOAH land surface model in the WRF model, in: 20th conference on weather analysis and forecasting/16th conference on numerical weather prediction, 11–15, 2004. a
Toll, V., Reis, K., Ots, R., Kaasik, M., Männik, A., Prank, M., and Sofiev, M.: SILAM and MACC reanalysis aerosol data used for simulating the aerosol direct radiative effect with the NWP model HARMONIE for summer 2010 wildfire case in Russia, Atmos. Environ., 121, 75–85, https://doi.org/10.1016/j.atmosenv.2015.06.007, 2015. a
Trenberth, K. E. and Fasullo, J. T.: Climate extremes and climate change: The Russian heat wave and other climate extremes of 2010, J. Geophys. Res.-Atmos., 117, D17103, https://doi.org/10.1029/2012JD018020, 2012. a
Tsigaridis, K., Daskalakis, N., Kanakidou, M., Adams, P. J., Artaxo, P., Bahadur, R., Balkanski, Y., Bauer, S. E., Bellouin, N., Benedetti, A., Bergman, T., Berntsen, T. K., Beukes, J. P., Bian, H., Carslaw, K. S., Chin, M., Curci, G., Diehl, T., Easter, R. C., Ghan, S. J., Gong, S. L., Hodzic, A., Hoyle, C. R., Iversen, T., Jathar, S., Jimenez, J. L., Kaiser, J. W., Kirkevåg, A., Koch, D., Kokkola, H., Lee, Y. H., Lin, G., Liu, X., Luo, G., Ma, X., Mann, G. W., Mihalopoulos, N., Morcrette, J.-J., Müller, J.-F., Myhre, G., Myriokefalitakis, S., Ng, N. L., O'Donnell, D., Penner, J. E., Pozzoli, L., Pringle, K. J., Russell, L. M., Schulz, M., Sciare, J., Seland, Ø., Shindell, D. T., Sillman, S., Skeie, R. B., Spracklen, D., Stavrakou, T., Steenrod, S. D., Takemura, T., Tiitta, P., Tilmes, S., Tost, H., van Noije, T., van Zyl, P. G., von Salzen, K., Yu, F., Wang, Z., Wang, Z., Zaveri, R. A., Zhang, H., Zhang, K., Zhang, Q., and Zhang, X.: The AeroCom evaluation and intercomparison of organic aerosol in global models, Atmos. Chem. Phys., 14, 10845–10895, https://doi.org/10.5194/acp-14-10845-2014, 2014. a
Tuccella, P., Curci, G., Visconti, G., Bessagnet, B., Menut, L., and Park, R. J.: Modeling of gas and aerosol with WRF/Chem over Europe: Evaluation and sensitivity study, J. Geophys. Res.-Atmos., 117, D03303, https://doi.org/10.1029/2011JD016302, 2012. a
Tuccella, P., Curci, G., Grell, G. A., Visconti, G., Crumeyrolle, S., Schwarzenboeck, A., and Mensah, A. A.: A new chemistry option in WRF-Chem v. 3.4 for the simulation of direct and indirect aerosol effects using VBS: evaluation against IMPACT-EUCAARI data, Geosci. Model Dev., 8, 2749–2776, https://doi.org/10.5194/gmd-8-2749-2015, 2015. a, b, c
van Donkelaar, A., Martin, R. V., Levy, R. C., da Silva, A. M., Krzyzanowski, M., Chubarova, N. E., Semutnikova, E., and Cohen, A. J.: Satellite-based estimates of ground-level fine particulate matter during extreme events: A case study of the Moscow fires in 2010, Atmos. Environ., 45, 6225–6232, https://doi.org/10.1016/j.atmosenv.2011.07.068, 2011. a
Villarini, G. and Vecchi, G. A.: Projected Increases in North Atlantic Tropical Cyclone Intensity from CMIP5 Models, J. Climate, 26, 3231–3240, 2013. a
Weigum, N., Schutgens, N., and Stier, P.: Effect of aerosol subgrid variability on aerosol optical depth and cloud condensation nuclei: implications for global aerosol modelling, Atmos. Chem. Phys., 16, 13619–13639, https://doi.org/10.5194/acp-16-13619-2016, 2016. a, b, c, d, e
Wesely, M. L.: Parameterization of surface resistances to gaseous dry deposition in regional-scale numerical models, Atmos. Environ, 23, 1293–1304, https://doi.org/10.1016/0004-6981(89)90153-4, 1989. a
Wiedinmyer, C., Akagi, S. K., Yokelson, R. J., Emmons, L. K., Al-Saadi, J. A., Orlando, J. J., and Soja, A. J.: The Fire INventory from NCAR (FINN): a high resolution global model to estimate the emissions from open burning, Geosci. Model Dev., 4, 625–641, https://doi.org/10.5194/gmd-4-625-2011, 2011. a
Witte, J. C., Douglass, A. R., da Silva, A., Torres, O., Levy, R., and Duncan, B. N.: NASA A-Train and Terra observations of the 2010 Russian wildfires, Atmos. Chem. Phys., 11, 9287–9301, https://doi.org/10.5194/acp-11-9287-2011, 2011. a
Wong, D. C., Pleim, J., Mathur, R., Binkowski, F., Otte, T., Gilliam, R., Pouliot, G., Xiu, A., Young, J. O., and Kang, D.: WRF-CMAQ two-way coupled system with aerosol feedback: software development and preliminary results, Geosci. Model Dev., 5, 299–312, https://doi.org/10.5194/gmd-5-299-2012, 2012. a
Wooster, M. J., Roberts, G., Perry, G. L. W., and Kaufman, Y. J.: Retrieval of biomass combustion rates and totals from fire radiative power observations: FRP derivation and calibration relationships between biomass consumption and fire radiative energy release, J. Geophys. Res.-Atmos., 110, D24311, https://doi.org/10.1029/2005JD006318, 2005. a
Yoon, S.-C. and Kim, J.: Influences of relative humidity on aerosol optical properties and aerosol radiative forcing during ACE-Asia, Atmos. Environ., 40, 4328–4338, https://doi.org/10.1016/j.atmosenv.2006.03.036, 2006. a, b, c
Yoshioka, M., Regayre, L. A., Pringle, K. J., Johnson, J. S., Mann, G. W., Partridge, D. G., Sexton, D. M. H., Lister, G. M. S., Schutgens, N., Stier, P., Kipling, Z., Bellouin, N., Browse, J., Booth, B. B. B., Johnson, C. E., Johnson, B., Mollard, J. D. P., Lee, L., and Carslaw, K. S.: Ensembles of Global Climate Model Variants Designed for the Quantification and Constraint of Uncertainty in Aerosols and Their Radiative Forcing, J. Adv. Model. Earth Sy., 11, 3728–3754, https://doi.org/10.1029/2019MS001628, 2019. a, b
Zhang, K., O'Donnell, D., Kazil, J., Stier, P., Kinne, S., Lohmann, U., Ferrachat, S., Croft, B., Quaas, J., Wan, H., Rast, S., and Feichter, J.: The global aerosol-climate model ECHAM-HAM, version 2: sensitivity to improvements in process representations, Atmos. Chem. Phys., 12, 8911–8949, https://doi.org/10.5194/acp-12-8911-2012, 2012. a, b, c, d
Žabkar, R., Honzak, L., Skok, G., Forkel, R., Rakovec, J., Ceglar, A., and Žagar, N.: Evaluation of the high resolution WRF-Chem (v3.4.1) air quality forecast and its comparison with statistical ozone predictions, Geosci. Model Dev., 8, 2119–2137, https://doi.org/10.5194/gmd-8-2119-2015, 2015. a
Zvyagintsev, A. M., Blum, O. B., Glazkova, A. A., Kotel’nikov, S. N., Kuznetsova, I. N., Lapchenko, V. A., Lezina, E. A., Miller, E. A., Milyaev, V. A., Popikov, A. P., Semutnikova, E. G., TarasovaI, O. A., and Shalygina, Y.: Anomalies of trace gases in the air of the European part of Russia and Ukraine in summer 2010, Atmos. Ocean. Optics, 24, 536–542, https://doi.org/10.1134/S1024856011060145, 2011. a