the Creative Commons Attribution 4.0 License.
the Creative Commons Attribution 4.0 License.
 | 11 Aug 2020
Scattered coal is the largest source of ambient volatile organic compounds during the heating season in Beijing
Yuqi Shi
Ziyan Xi
Maimaiti Simayi
Jing Li
Shaodong Xie
We identified scattered coal burning as the largest contributor to ambient volatile organic compounds (VOCs), exceeding traffic-related emissions, during the heating season (the cold season when fossil fuel is burned for residential heating) in Beijing prior to the rigorous emission limitations enacted in 2017. However, scattered coal is underestimated in emission inventories generally because the activity data are incompletely recorded in official energy statistics. Results of positive matrix factorization (PMF) models confirmed that coal burning was the largest contributor to VOC mixing ratios prior to the emission limitations of 2017, and a reduction in scattered coal combustion, especially in the rural residential sector, was the primary factor in the observed decrease in ambient VOCs and secondary organic aerosol (SOA) formation potential in urban Beijing after 2017. Scattered coal burning was included in a corrected emission inventory, and we obtained comparable results between this corrected inventory and PMF analysis particularly for the non-control period. However, a refined source subclassification showed that passenger car exhaust, petrochemical manufacturing, gas stations, traffic evaporation, traffic equipment manufacturing, painting, and electronics manufacturing are also contributors to ambient VOCs. These sources should focus on future emission reduction strategies and targets in Beijing. Moreover, in other regions with scattered coal-based heating, scattered coal burning is still the key factor to improve the air quality in winter.
- Article
(3974 KB) - Full-text XML
-
Supplement
(2065 KB) - BibTeX
- EndNote


In Chinese cities, a severe deterioration in air quality has threatened human health (Han et al., 2018). Extremely poor air quality in cities such as Beijing, one of the world's largest and China's capital, is a result of growth in fossil-fuel economies, the expansion of industrial manufacturing, heavy traffic, and large-scale urban construction (Ru et al., 2015; Zeng et al., 2005; Liu and Wu, 2013; Tang, 2007). Within China, organizations such as the Joint Prevention and Control of Atmospheric Pollution (JPCAP) and Regional Atmospheric Pollution Control (RAPC) have identified volatile organic compounds (VOCs) as key air pollutants (Zhou and Elder, 2013). VOCs are precursors to secondary organic aerosols (SOAs), which are in turn related to particulate matter less than 2.5 µg (PM2.5) and photochemically produced ozone (O3) (Sillman, 1999; Pandis, 1997). The negative effects of VOCs on human health have received increased public attention (Logue et al., 2010; Zhang et al., 2012). Globally, natural sources are significant emitters of VOCs; however, anthropogenic sources are far more prevalent in urban areas (Guenther et al., 2006; Janssens-Maenhout et al., 2015) particularly in winter at northern latitudes when biological emissions are low (Li and Xie, 2014). Therefore, it is important to incorporate seasonality into our understanding of major anthropogenic sources of VOCs and in developing effective controls and mitigation measures for air pollution.
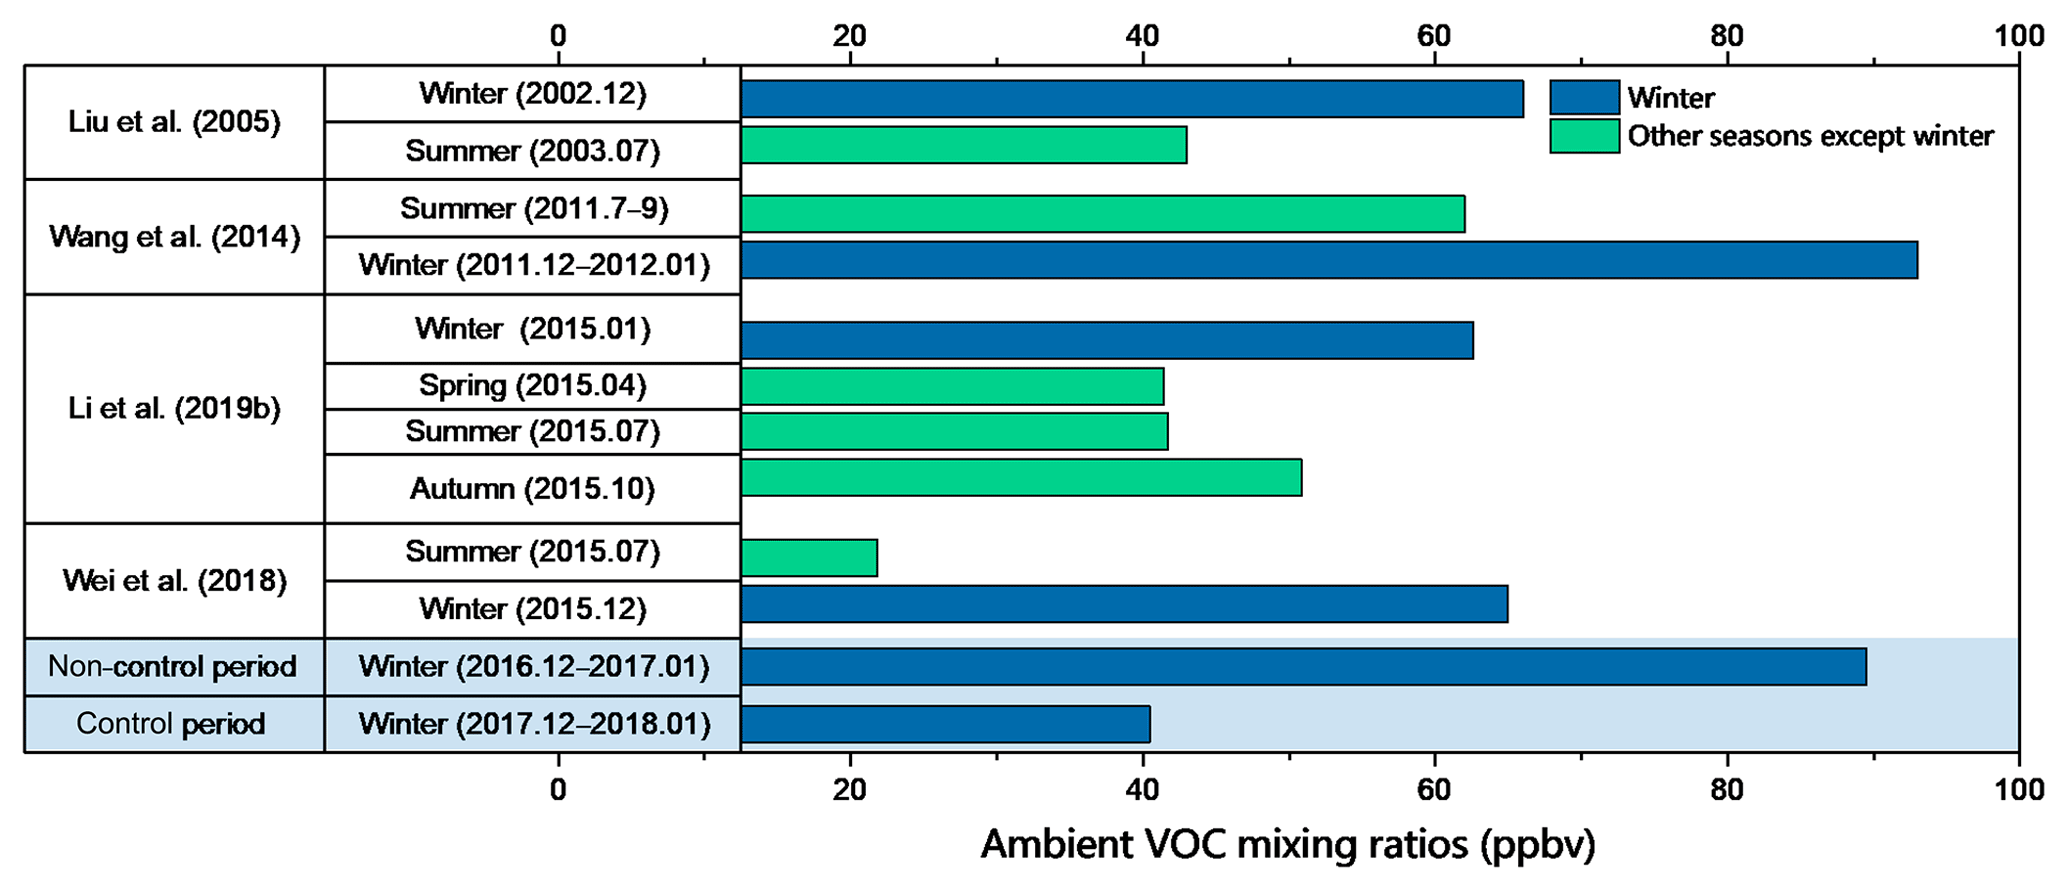
Ambient VOC mixing ratios in Beijing show significant seasonal variation and are highest during the heating season (November to March, the cold season when fossil fuel is burned for residential heating) (Liu et al., 2005; Wang et al., 2014; Wei et al., 2018). Satellite-derived emission inventories have suggested monthly variations in total VOC emissions with distinct highs during the heating season (J. Li et al., 2019). The results of source apportionment analyses have indicated differences in source contributions of VOCs seasonally, with high proportions coming from coal combustion during the heating season and traffic exhaust in the remaining months (Wang et al., 2014; M. Wang et al., 2013). However, most EF-based (emission factor) inventories do not include seasonal variation.
Scattered coal (SC) is defined as coal of poor quality which is used throughout the civil (households cooking and heating, commercial and public, rural production, etc.) and industrial sectors (small-scale industrial boilers and furnaces). The coal of poor quality, with a high content of ash, sulfur, and volatile matter, is widely used in the rural residential sector due to the low price; moreover, it is difficult to cover this decentralized coal use overall in official energy statistics (Cheng et al., 2017; Peng et al., 2019; Huo et al., 2018). In contrast to efficient centralized coal combustion such as power generation, heat supply, and large-scale industrial boilers, SC burning is a near-ground and nonpoint source; its low combustion efficiency and air pollution control deficiency result in a higher air pollutant emission intensity, which has a negative influence on ambient air and a more direct adverse impact on human health (Finkelman et al., 1999).
In particular, as a major ambient pollution source, household energy consumption has contributed to a large number of deaths especially in rural areas (Zhao et al., 2019) and attracts more and more public attention (J. Liu et al., 2016). It is undeniable that a reduction in conventional household solid fuel consumption has improved air quality and human health in northern China over recent decades (Zhao et al., 2018). Nevertheless, solid fuel combustion remains an important emission source. Moreover, rural residential coal combustion affects not only rural but urban air quality and has been contributing more in winter, especially in northern China, for a long time (Shen et al., 2019). However, a large proportion of residential coal use is overlooked in the China Energy Statistical Yearbook (CESY), which means that most EF-based inventories may poorly estimate coal consumption. Using field sampling and remote sensing, many studies have showed that the actual amount of rural and urban coal consumption is much higher than the statistical data in CESY. Peng et al. (2019) conducted a field survey in 2010 to obtain data for solid fuel consumption and use patterns in Chinese counties, and accordingly they were estimated to be 62 % higher than the coal consumption reported in CESY for the rural residential sector in China. Cheng et al. (2017) summarized the investigated coal consumption of several studies in rural areas, and estimated the residential coal consumption from 1996 to 2014 in the Beijing–Tianjin–Hebei (BTH) region, which triples the coal consumption reported in CESY. Cheng et al. (2016) also estimated Beijing's residential coal combustion at 4×10⁶ t in 2015. Previous research, combined with the prevalence of coal-based heating in northern China (M. Wang et al., 2013), suggests that coal combustion is an important contributor to ambient VOCs over winter, but the magnitude of this contribution is not yet understood. J. Li et al. (2019) showed similar positive matrix factorization (PMF) results in an evaluation of emissions in the winter of 2015 in Beijing, where fuel combustion contributed more than 50 % of ambient VOCs. They also proposed that the essential parts of fuel combustion might be the undocumented consumption of coal briquettes and chunks but did not give any further explicit evidence.
We focused on confirming SC burning as a critical anthropogenic VOC emission source contributing to high VOC mixing ratios during the heating season in Beijing. We discuss the efficacy of air pollution control periods in light of observed variations in emission intensities. We used the PMF model to quantify the contributions of different emission sources to observed VOC mixing ratio data. The contribution of coal burning was confirmed by examining variation among emission sources, control measures placed on sources, and emission intensities. We estimated a monthly corrected EF-based inventory for the heating season and compared these estimates to the PMF results. We calculated secondary organic aerosol potential (SOAP) values for different emission sources based on the results of the PMF and emission inventory to determine the largest contributor to total SOAP reduction. We further evaluate and discuss the control policies of 2017.
2.1 Site description
Air quality measurements were collected during two consecutive heating seasons, the first from December 2016 to January 2017, when air quality control measures were not heavily enforced (non-control period), and the second from December 2017 to January 2018, when air quality control measures were rigorously enforced (control period). Measurements were taken from the fifth story of a building on the Peking University (PKU) campus in northwestern Beijing (39.99∘ N, 116.33∘ E) at a height of approximately 12 m. The building was surrounded by several five- or six-story buildings and one side road to the east. This site is located approximately 700 m north of the 4th Ring Road (a major city traffic line) and 10 km from the center of Beijing (Fig. S1 in the Supplement). The surrounding area is primarily commercial and residential, and the major nearby emission source is road vehicles. This site is considered to be representative of a typical urban environment in Beijing.
2.2 Sampling and analyses
We used a continuous sampling and analysis method for ambient VOCs, which has been described in detail in previous studies (Wu et al., 2016b; J. Li et al., 2015). Automated, hourly sample collection was achieved using a custom-built online GC–MS/FID system (gas chromatography–mass spectrometry/flame ionization detector; TH-PKU 300B, Wuhan Tianhong Instrument Co. Ltd., China; GCMS-QP2010SE, Shimadzu, Japan). Details of the online system are shown in Sect. S1. Calibration curves were performed at six mixing ratios from 0.2 to 8 ppbv for each compound before and after sample analyses by bubbling a series of external calibrating gases. Two types of gases were used: a Photochemical Assessment Monitoring Station (PAMS) ozone precursor series (mixture of 57 non-methane hydrocarbons, NMHCs) and a gas series customized by the PKU National Key Laboratory (a mixture of 55 oxygenated VOCs and halocarbons). In addition, internal calibrating gases were pumped into the GC–MS system one time per sampling or calibration to reduce instrumental error. All four calibrating gases were obtained from Linde Electronics and Specialty Gases, USA. R2 (coefficient of determination) values of eligible calibration curves are greater than 0.99. VOC species can be quantified only if they have eligible calibration curves. Several VOC species also cannot be quantified because their mixing ratios were all below the method detection limit (MDL). Finally, a total of 91 VOC species were quantified (Supplement Table S5), not including formaldehyde, acetaldehyde, and alcohols. The MDL for each species quantified using this system ranged from 0.01 to 0.10 ppbv. We applied rigorous quality-assurance (QA) and quality-control (QC) procedures which included three main parts. First, daily maintenance and monitoring of the online GC–MS/FID system were performed to ensure the normal operation of the instrument. Second, the periodic supplement and replacement of consumable items were performed at least every 10 d to ensure the operation of automatic sampling and measuring. Third, periodic calibrations were performed every 5 d, and the calibration curve results of each target species with less than 10 % variation were considered acceptable relative to the actual values.
2.3 Source apportionment
The United States Environmental Protection Agency PMF model (version 5.0) has been applied to a wide range of data, including 24 h speciated PM2.5, size-resolved aerosols, deposition, air toxins, high time-resolution measurements such as those from aerosol mass spectrometers (AMSs), and VOC mixing ratios. As a receptor model, PMF is a mathematical approach. Composition or speciation is determined using analytical methods appropriate for the media. We applied this PMF model to determine source apportionment for measured ambient VOCs. A PMF requires two input files: a mixing ratio dataset comprising a suite of parameters measured across multiple samples and an uncertainty dataset comprising uncertainty values for each species and sample. According to the input files, the signal to noise ratio (S : N) was calculated for each species, and only mixing ratios that exceed the uncertainty contribute to the signal portion in the PMF version we used. Signal is the difference between mixing ratio and uncertainty, and noise is the uncertainty value.
We categorized VOC species as strong, weak, or bad. Strong was the default value for all species, weak indicates those with tripled uncertainty, and VOCs categorized as bad were removed from further analyses. A species is not appropriate for source apportionment if it is undetectable (less than the MDL) in most of the samples or its mixing ratio is always below the uncertainty (signal is equal to 0). Therefore, VOC species that were below the MDL in more than 50 % of samples or that showed were categorized as “bad” directly. Other species were categorized based on detailed knowledge of the source, sampling, and analytical uncertainties (Reff et al., 2007). For species without detailed information, as mentioned in the PMF user guide, we conservatively categorized them as “good” if , “bad” if , and “weak” if but >0.5. The final dataset comprised 1918 samples of 53 compounds (42 strong and 11 weak), which accounted for 90 % of the total mixing ratios. Modeling was performed using 4–11 factors, and the 8-factor solution was deemed to be the most representative. In profile analysis technology, ambient VOC mixing ratios can be considered the linear addition of VOC compositions derived from various sources. Characteristics of each pollution source can be used, to some extent, to resolve issues with collinearity in the source component spectrum.
2.4 VOC emission inventory
Through literature review, we found that, while anthropogenic VOC emission inventory methodologies are similar, source classification and EFs differ between studies. To promote the comparability of PMF and emission inventory results, we proposed and utilized a modified source classification system based on the existing four-level categorization (Wu et al., 2016a). Level 1 contains seven sublevels: coal burning, fuel oil and gas, traffic exhaust, petroleum-related evaporation, VOC-related industry, VOC-product utilization, and biomass burning. Level 2 represents further divisions of these sublevels. For example, coal burning was further divided into burning of SC and centralized coal. Level 3 again divided these categories, in which centralized coal burning was divided based on the consumption terminus, such as manufacturing, power generation, or heating. Level 3 divisions were further split in Level 4 categories based on highly detailed information. The detailed classification method is provided in Table S1.
VOC emission calculations were EF-based. EF and source profiles of on-road vehicles were calculated using the COPERT 5 (computer program to calculate emissions from road transport version 5; https://www.emisia.com/utilities/copert, last access: 5 August 2018), the methods for which have been explained in detail in previous studies (Cai and Xie, 2013). Input parameters included vehicle type, number of vehicles, and the average speed and annual mileage of different vehicle types, and the monthly ambient temperature and mileage degradation of vehicles were considered (Cai and Xie, 2009). Vehicle emissions included tailpipe exhaust and evaporation, which can be estimated separately by COPERT 5. For EFs and source profiles of other emission sources, we relied on multiple technical manuals about VOC emission estimation, which are mostly issued by the Ministry of Ecology and Environment of the People's Republic of China (MEE; http://www.mee.gov.cn/, last access: 5 August 2018) and the preestablished emission inventory for the BTH region (Bo et al., 2008).
Many studies have estimated the SC consumption in recent years (H. B. Liu et al., 2016; Cheng et al., 2017; Huo et al., 2018; Peng et al., 2019), but a few have estimated SC reductions in 2017 compared to 2016. In an effort to control coal consumption and promote clean energy sources, the Natural Resources Defense Council (NRDC), in collaboration with the government and other relevant organizations, launched the China Coal Consumption Cap Plan and Policy Research Project (COALCAP) in October 2013 (NRDC, 2013). Reports produced by this project provide estimated reductions in SC consumption in 2017 and reduction proportions among different terminal sectors. Therefore, a synthesis of previous studies (Peng et al., 2019; Cheng et al., 2017, 2016; Huo et al., 2018) and COALCAP reports provides the data required to estimate the VOC emissions from SC (both civil and industrial sectors). For monthly profiles, it was assumed that residential, commercial, and public SC consumption only occurs during the heating season, and consumption was averaged across the season. SC consumption for the rural production sector and industrial sector was averaged across the entire year. Monthly activity data and profiles for other sources were obtained, as described below.
Except SC, monthly data of other residential energy consumption were estimated based on household survey results (Wu and Xie, 2018). Most of the monthly data for industrial sector emissions were developed based on outputs of industrial products issued by the National Bureau of Statistics of China (NBS; http://www.stats.gov.cn/, last access: 5 August 2018) and Beijing Municipal Bureau of Statistics (BBS; http://tjj.beijing.gov.cn/, last access: 5 August 2018). Power plant data were derived from power-generation statistics (NBS). Heat supply data were averaged across the heating season. The monthly distribution of road vehicle emissions was derived from Li et al. (2017). The agricultural burning of crop residue was estimated based on moderate resolution imaging spectroradiometer (MODIS) fire counts in croplands (J. Li et al., 2016a). We assumed that emissions from other sources did not vary across months (Wu and Xie, 2018). Corresponding to the period when ambient VOC data were collected at PKU, we established a monthly emission inventory. The detailed monthly data are provided in Table S6.
2.5 SOAP contributions of each VOC source
The SOAP method has been widely used for the estimation of SOA formation potential based on emission inventories and observation data (Barthelmie and Pryor, 1997; Wu et al., 2017; Wu and Xie, 2018). Explicit chemical models and SOA yield models are two accepted methods used to calculate SOAP (Wu et al., 2017). The process of SOA formation from VOCs has been explored and summarized extensively, and it is affected by atmospheric or experimental conditions, such as water vapor, temperature, light, organic aerosol concentration, oxidant type, and the concentration of nitrogen oxides (NOx) (Hallquist et al., 2009; Warren, 2008). Complexities and uncertainty in the SOA reaction mechanism create difficulties in accurately modeling SOA formation in the atmosphere. Therefore, using parameters acquired under similar conditions is advantageous for regional estimates of SOAP. Here, SOAP-weighted mass contributions, as defined by Derwent et al. (2010) and cited in many research projects (Gilman et al., 2015; Redington and Derwent, 2013; J. Li et al., 2015), were used to evaluate precursor source contributions to and variation within different control periods on SOA formation. The definition of this SOAP method describes the mass of aerosol produced per mass of VOC reacted and expressed relative to toluene, which is different from the absolute SOA formation potential value (the mass of aerosol formed per mass of VOC reacted).
SOA potentials of this method were simulated under test conditions of high anthropogenic emissions of VOCs and NOx (Derwent et al., 1998). Due to the low contribution from natural emissions, anthropogenic SOAs are predominant in this scenario. Toluene was chosen as the basic compound for SOAP estimation because of its well-characterized man-made emission status and importance as an SOA precursor (Ng et al., 2007). The amount of SOAs formed is described using a toluene equivalent, and SOAPs of each compound are expressed as an index relative to toluene. The SOAP represents the propensity for an organic compound to form an SOA when an additional mass emission of that compound is added to the ambient atmosphere expressed relative to that SOA formed when the same mass of toluene is added (Derwent et al., 2010). We hypothesized that all VOC species would have an effect on SOA formation. SOAP-weighted mass contributions were calculated based on PMF results (where VOC units were converted from ppbv to micrograms per cubic meter, µg m−3) and the corrected emission inventory (Gg). The SOAP-weighted mass contribution of each VOC source can be calculated using Eq. (1):
where VOCi is the mass contribution of a VOC source to species i () and SOAPi is the SOA formation potential for species i (unitless). Table S2 shows a listing of the propensities for secondary organic aerosol formation expressed on a mass-emitted basis as SOAPs relative to toluene equal to 100 for 113 organic compounds.
This SOAP method removes issues associated with uncertainty in absolute SOA concentrations (J. Li et al., 2015). Moreover, this SOAP method is appropriate for conditions of high anthropogenic emissions of VOCs and NOx (Derwent et al., 1998). Although highly idealized, these conditions are comparable to those in urban Beijing during control and non-control periods.
3.1 Unprecedented air pollution control measures in China
In 2013, the State Council of the People's Republic of China, in determining that improving air quality was not only a human health issue but was also an important focus of economic growth and security, deployed the Action Plan of Air Pollution Prevention and Control (hereafter Action Plan) (http://www.gov.cn, last access: 5 August 2018). Emission control measures implemented in the Beijing Action Plan (2013–2017) were summarized by Cheng et al. (2019). The Action Plan mandated that the average annual concentration of PM2.5 had to be limited to 60 µg m−3 in Beijing and was reduced by over 25 % relative to a 2012 baseline in BTH by 2017. Since 2013, further plans and laws, namely the Air Pollution Prevention and Control Law of 2016, have been released to curb emissions and meet air quality targets. After 3 years of these efforts (2013–2016), air quality improvement was less than satisfactory. Hence, in early 2017, the Chinese government released 10 Enhanced Measures to Prevent and Control Air Pollution (hereafter 10 Measures) in Beijing. A detailed description of these enhanced control measures is shown in Table S3. Neighboring provinces, including Tianjin, Hebei, Shandong, Shanxi, and Henan, cooperated with Beijing to increase the effectiveness of these measures. Further, the municipal government of Beijing promoted a 2017 revision of the Emergency Plan for Air Pollution in an effort to confront future heavy pollution periods. These enhanced measures had demonstrable effects on air quality and PM2.5, and Beijing has since met the targets laid out in the Action Plan. In 2017, the mean concentration of PM2.5 was 58 µg m−3 with a year-on-year reduction of 20.5 %. This effort was a huge success, and a series of research associated with the impact of these clean air actions has been launched (B. Zheng et al., 2018; Geng et al., 2019; H. Li et al., 2019; Xue et al., 2019; Zhang et al., 2019). Most of them paid attention to the improvement of air quality and health benefits, the transition of PM2.5 chemical composition and contributors, and the trend of anthropogenic emissions; but nonetheless, sufficiently detailed information on ambient VOC mixing ratios and chemical compositions, as well as variations in emission sources after controls were established, have not been reported.

Figure 1VOC emission factor (g kg−1 fuel) and consumption (million tons) of different fuel types (a) for consumption in the non-control period (December 2016–January 2017) and (b) for consumption in the control period (December 2017–January 2018). LPG is liquefied petroleum gas, NG is natural gas, and LNG is liquified natural gas.
Vehicle exhaust, gasoline evaporation, fuel combustion, solvent utilization, and industrial production are the most prevalent sources of VOCs in Beijing particularly during hazy days (Wu et al., 2016b; Guo et al., 2012; Sheng et al., 2018). These five sources were all indicated as controlled objects under the 10 Measures, and SC burning and high-pollution industries were the most stringently controlled objects. Compared to 2016, the reduction in civil SC consumption in Beijing exceeded 2 million tons in 2017 (CESY, 2017, 2018; COALCAP reports, 2017, 2018). Rural and urban residential sectors contributed 74 % and 15 % of reduction, respectively, followed by the commercial and public sectors (6 %) and the rural production sector (5 %). A large proportion of civil SC (greater than 90 %) is used for heating in winter. As shown in Fig. 1, compared with other fuel types, SC is consumed more in winter (CESY, 2017, 2018; COALCAP reports, 2017, 2018), and has greater VOC emissions per unit combustion (see Table S1 for details). As for industrial SC burning, a sustained clampdown of coal-fired boilers was put into action in Beijing from 2013, and 99.8 % of them had been banned before late 2017. These banned boilers contributed nearly 9 million tons of SC reductions, and more than half of them were eradicated in 2017. Therefore, a lot of VOC emissions from SC burning would be prohibited during the heating season in Beijing.

Figure 2Quantities and variations of industries above a designated size and high-pollution industries from late 2012 to early 2018 (bridge figure) and industrial added value from 2012 to 2018 (line).
From 2013 to 2017, 1992 high-pollution industries were phased out in Beijing, including chemical engineering, furniture manufacturing, printing, and non-metal mineral product industries. At the municipal level, 11 000 small, clustered, and polluting factories that did not meet efficiency, environmental, or safety standards were either regulated or closed by the end of 2017, according to the Beijing Municipal Bureau of Economy and Information Technology. Meanwhile, a large number of high-pollution industries as stipulated by Beijing Municipal Ecology and Environment Bureau (BMEE; http://sthjj.beijing.gov.cn/, last access: 5 August 2018) were removed from Beijing year by year. The annual variations of industries above a designated size (BBS), high-pollution industries (BMEE), and the annual benefits from industry (BBS) in Beijing are summarized in Fig. 2. An industry above a designated size is defined as an industry with an annual main business income of more than 20 million yuan. Industrial added value refers to the sum of added value of all industrial units in Beijing. In addition, efforts to increase the quality of gasoline and diesel fuels began in January 2017; these efforts could lead to a marked decrease in traffic emissions.
Over the course of the study period, control measures were differentially enacted. December 2017 was the most tightly controlled period, wherein SC burning and substandard coal-fired boilers were forbidden in an effort to meet the targets identified in the Action Plan. In January 2018, residents were allowed to burn some SC to ensure their well-being. Therefore, we divided our study into three time periods: non-control (December 2016–January 2017), strict-control (December 2017), and eased-control (January 2018). Cold temperatures and a low mixing layer are related to increased emissions and the accumulation of gaseous pollutants during winter months (Zhang et al., 2015). In addition, we discussed several meteorological parameters in Beijing during the study period (Table S4). Temperature, wind speed, and wind direction data were acquired from the National Oceanic and Atmospheric Administration (https://www.noaa.gov/, last access: 5 August 2018), and snowfall and relative humidity data were from the China Meteorological Administration (http://www.cma.gov.cn/, last access: 5 August 2018). Little snowfall and low speed (≤3 m s−1) and northerly winds were dominant during both the non-control and control periods, and the differences of average temperature and average wind speed between the two periods were 1.2 ∘C and 0.7 m s−1, respectively, indicating the minor influence from meteorological variability on the change in VOC mixing ratios. Thus, this time period represents an ideal opportunity to assess the contributions and effects of various emission sources in Beijing by analyzing ambient VOCs.
3.2 Ambient VOC mixing ratios and source contributions
The implementation of federal and municipal control policies led to significant changes in emission intensity for several sources, which was reflected in ambient VOC characteristics. Figure 3 shows the ambient VOC mixing ratios, reported from multiple studies, across seasons in Beijing, where winter generally has the highest values (Liu et al., 2005; Wang et al., 2014; Wei et al., 2018; J. Li et al., 2019). Mixing ratios and the chemical composition of VOC groups, as well as the average volume mixing ratios of 91 measured species at PKU, are summarized in Table S5.
Correlations and characteristic ratios between individual VOC species and environmental levels of VOC tracers have been widely used to identify emission sources (Barletta et al., 2005; Liu et al., 2008b). The ratio of benzene and toluene (B:T) can be used to identify VOC sources (Perry and Gee, 1995). An average value of 0.6±0.2 (wt ∕ wt) of B:T is characteristic of vehicular emissions in China; this ratio is estimated to be 0.67 in Beijing (Barletta et al., 2005). A higher B:T indicates a greater influence from biomass and/or fossil fuel combustion (Santos et al., 2004; Andreae, 2019). Lower B:T values are related to solvent utilization due to the abundant use of toluene for painting and printing (Yuan et al., 2010). We estimated B:T (wt ∕ wt) ratios of 0.88, 0.69, and 0.77 for the non-control, strict-control, and eased-control periods, respectively. We suggest that a indicates a significant role of coal combustion for heating, which is similar to the results reported previously (M. Wang et al., 2013). B:T estimations provided in prior research or observations, as well as in this study, are shown in Fig. 4 (J. Li et al., 2019, 2015, 2016b; L. Y. Li et al., 2015). The B:T reference values for residential coal burning and traffic exhaust and evaporation are 1.24 ± 0.20 and 0.52 ± 0.06, respectively (Liu et al., 2008a). B:T values reported for the summer months are closer to the characteristic values for traffic exhaust and evaporation, and those in winter are closer to the characteristic value for coal burning. Results from the strict-control period may represent illegal SC, coal-to-gas, and coal-to-electricity use, and we observed an increase in B:T during the eased-control period relative to the strict-control period.
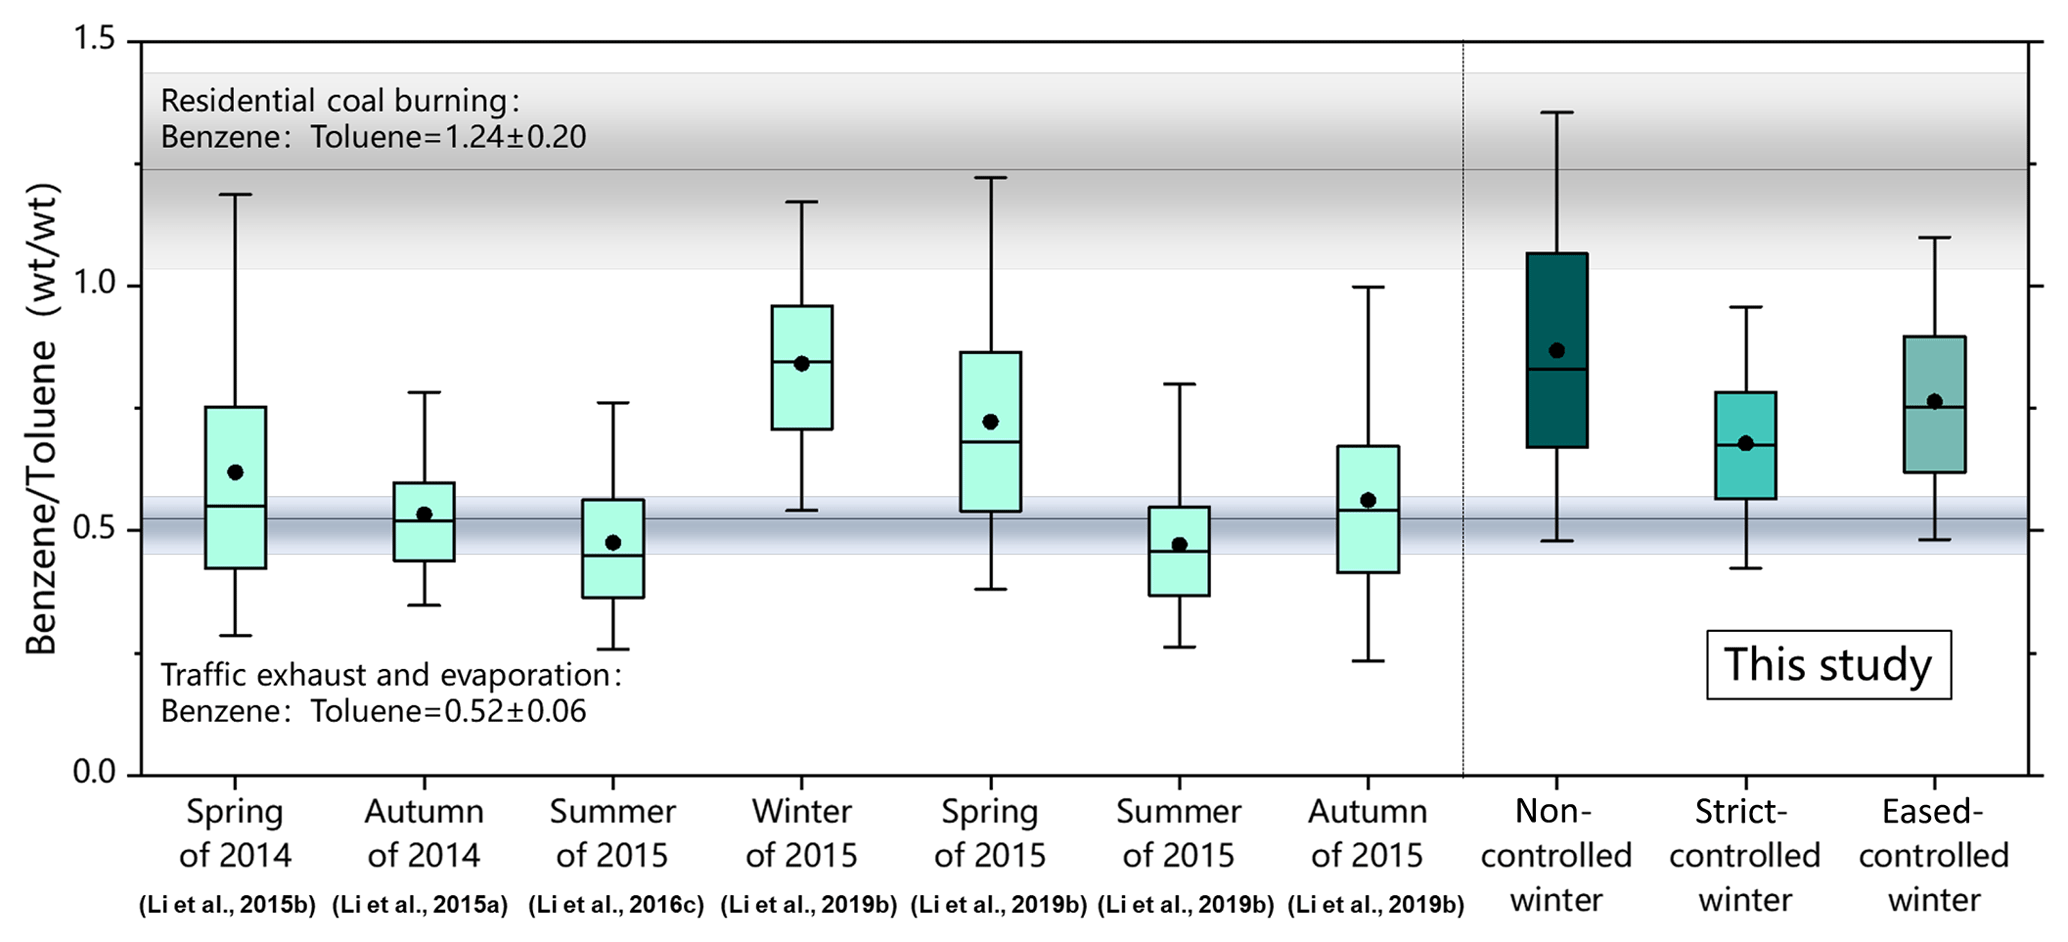
Figure 4The ratios of benzene and toluene in different seasons (previous studies) and different control periods (this study).
Analyses of variation in tracers can reflect changes in emission sources. We observed a significant decline in methyl tertiary butyl ether (MTBE, a common gasoline additive), 2,2-dimethylbutane, 3-methylpentane, methyl cyclopentane, 2-methylhexane, and 3-methylhexane (all common components in gasoline evaporation and tailpipe exhaust) during the control period (Chang et al., 2006). Acetonitrile, an inert tracer, can reflect the intensity of biomass burning (Sinha et al., 2014). We estimated no significant changes in biomass burning by comparing the acetonitrile mixing ratio between the three periods. Freon 113 is typically used to estimate background levels. We found that the mixing ratio of Freon 113 was constant around 0.09–0.11 ppbv, indicating a consistent background contribution.
Table 1The 20 VOC species which declined the most following emission controls during strict-control and eased-control periods.

The 20 VOC species which declined the most following emission controls are listed in Table 1. During the strict-control period, mixing ratios of the tracers of incomplete burning (e.g., ethylene, acetylene, benzene, styrene, and 1,2-dichloropropane) decreased by more than 60 %. Tracers of industrial- and vehicle-related sources decreased by 50 %, including some chlorinated hydrocarbons, esters, and aromatics (J. Li et al., 2016b; Hellen et al., 2006; Barletta et al., 2009). We observed a precipitous decline in methacrolein (MACR) and methyl vinyl ketone (MVK), which are the major oxidation products of isoprene (Xie et al., 2008). Terrestrial vegetation is typically the main contributor of isoprene in the environment. However, heavy traffic in megacities contributes to a large proportion of isoprene emissions particularly after leaf drop (Song et al., 2007). Ethyl acetate is a widely used industrial solvent, and propene is a characteristic product of internal combustion engines (Scheff and Wadden, 1993). Some aromatics, such as styrene and benzene, are found in high concentrations in petrochemical plants (Liu et al., 2008a). Benzene, toluene, ethylbenzene, and xylenes (BTEX) are also major components of vehicle and solvent utilization (Seila et al., 2001). During the eased-control period, we observed differences in the top declining species and their respective reductions, particularly for tracers of vehicle exhaust, which had relatively small reductions. Indicator species of oil-refining and fuel burning emissions became more prevalent during this period, including styrene, C2–C4 alkenes, C3–C10 alkanes, and acetylene. Fuel evaporation is often indicated by iso/n-pentane and cyclopentane (H. Zheng et al., 2018), both of which showed an obvious decline during the eased-control period. In both the strict- and eased-control periods, acetylene, a tracer for vehicular and other combustion processes (Baker et al., 2008), decreased by more than 60 %. Secondary products from primary anthropogenic VOCs, including ketones and aldehydes, were also reduced (Yuan et al., 2012).
PMF, a receptor-based source apportionment method, was used to estimate temporal variation in source contributions. Eight appropriate factors were determined. Profiles from the literature were referenced in identifying the factor profiles which were recognized as follows: (1) coal burning, (2) fuel oil and gas usage, (3) traffic exhaust, (4) petroleum-related evaporation, (5) VOC-related industry, (6) VOC-product utilization, (7) biomass burning, and (8) transmitted/long-lived species. Modeled source profiles (ppbv ppbv−1), together with the relative contributions of individual sources to each parsed species, are shown in Fig. S2. Diurnal and 24 h variation in mixing ratios of all eight sources during the non-control and control periods are also shown in Figs. S2 and S3. Reconstructed diurnal variation and 24 h mixing ratios of controlled sources were lower during the control periods.
Table 2Source contributions to ambient VOC mixing ratios (ppbv) and their contributions to total reduction compared with the non-control period (ratio) derived by PMF analysis.
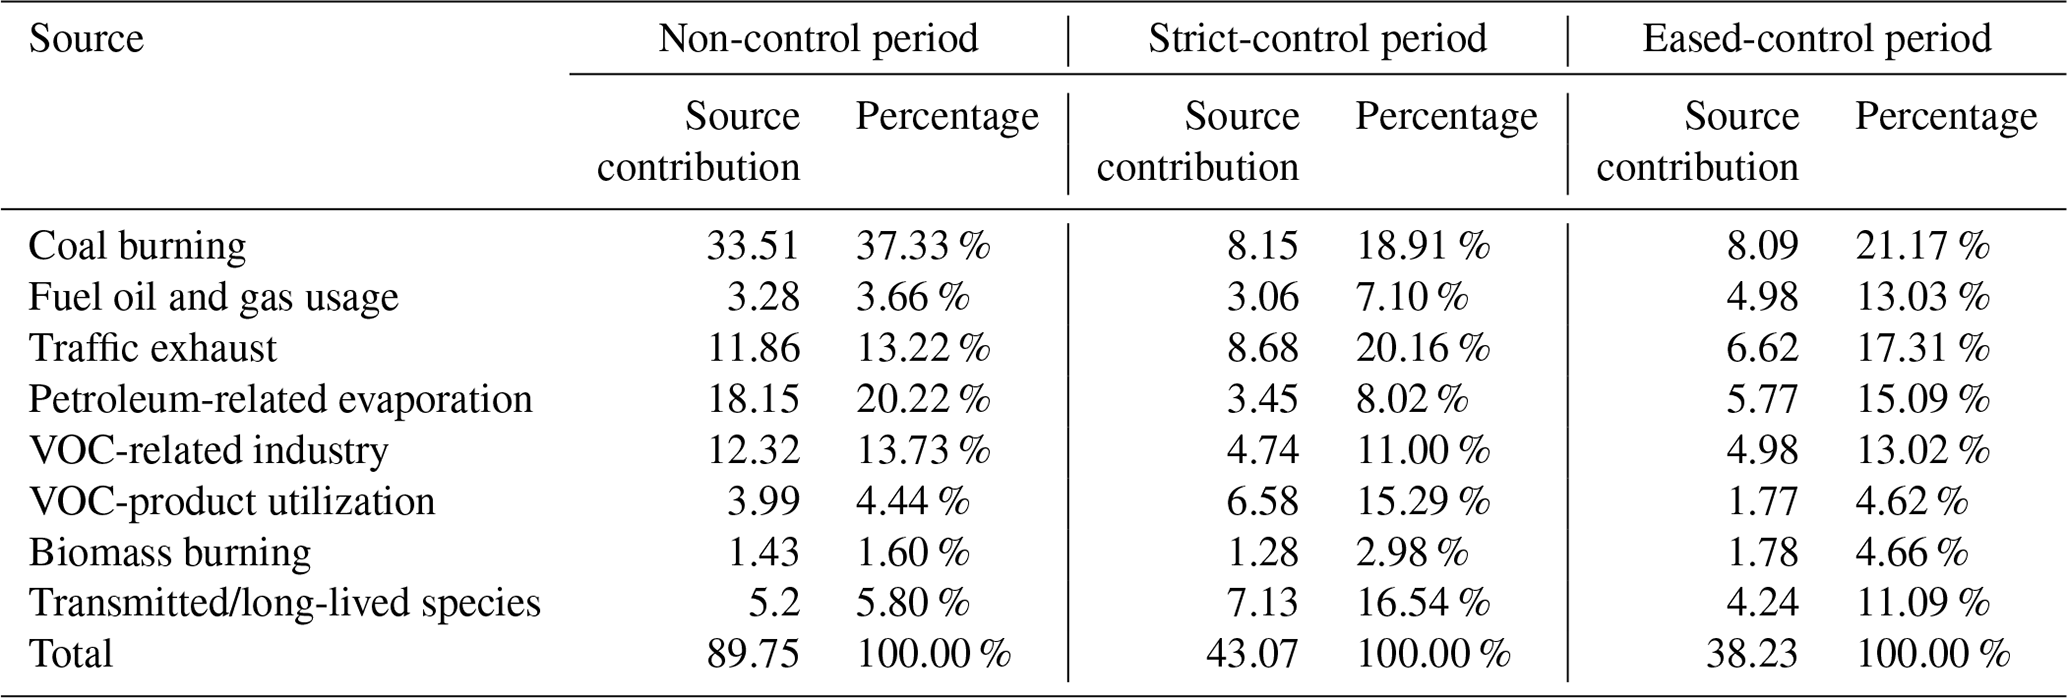
Source contributions (ppbv) and proportions, determined by PMF analysis, are shown in Table 2. Source reduction contributions during strict- and eased-control periods relative to the non-control period are shown in Fig. 5.
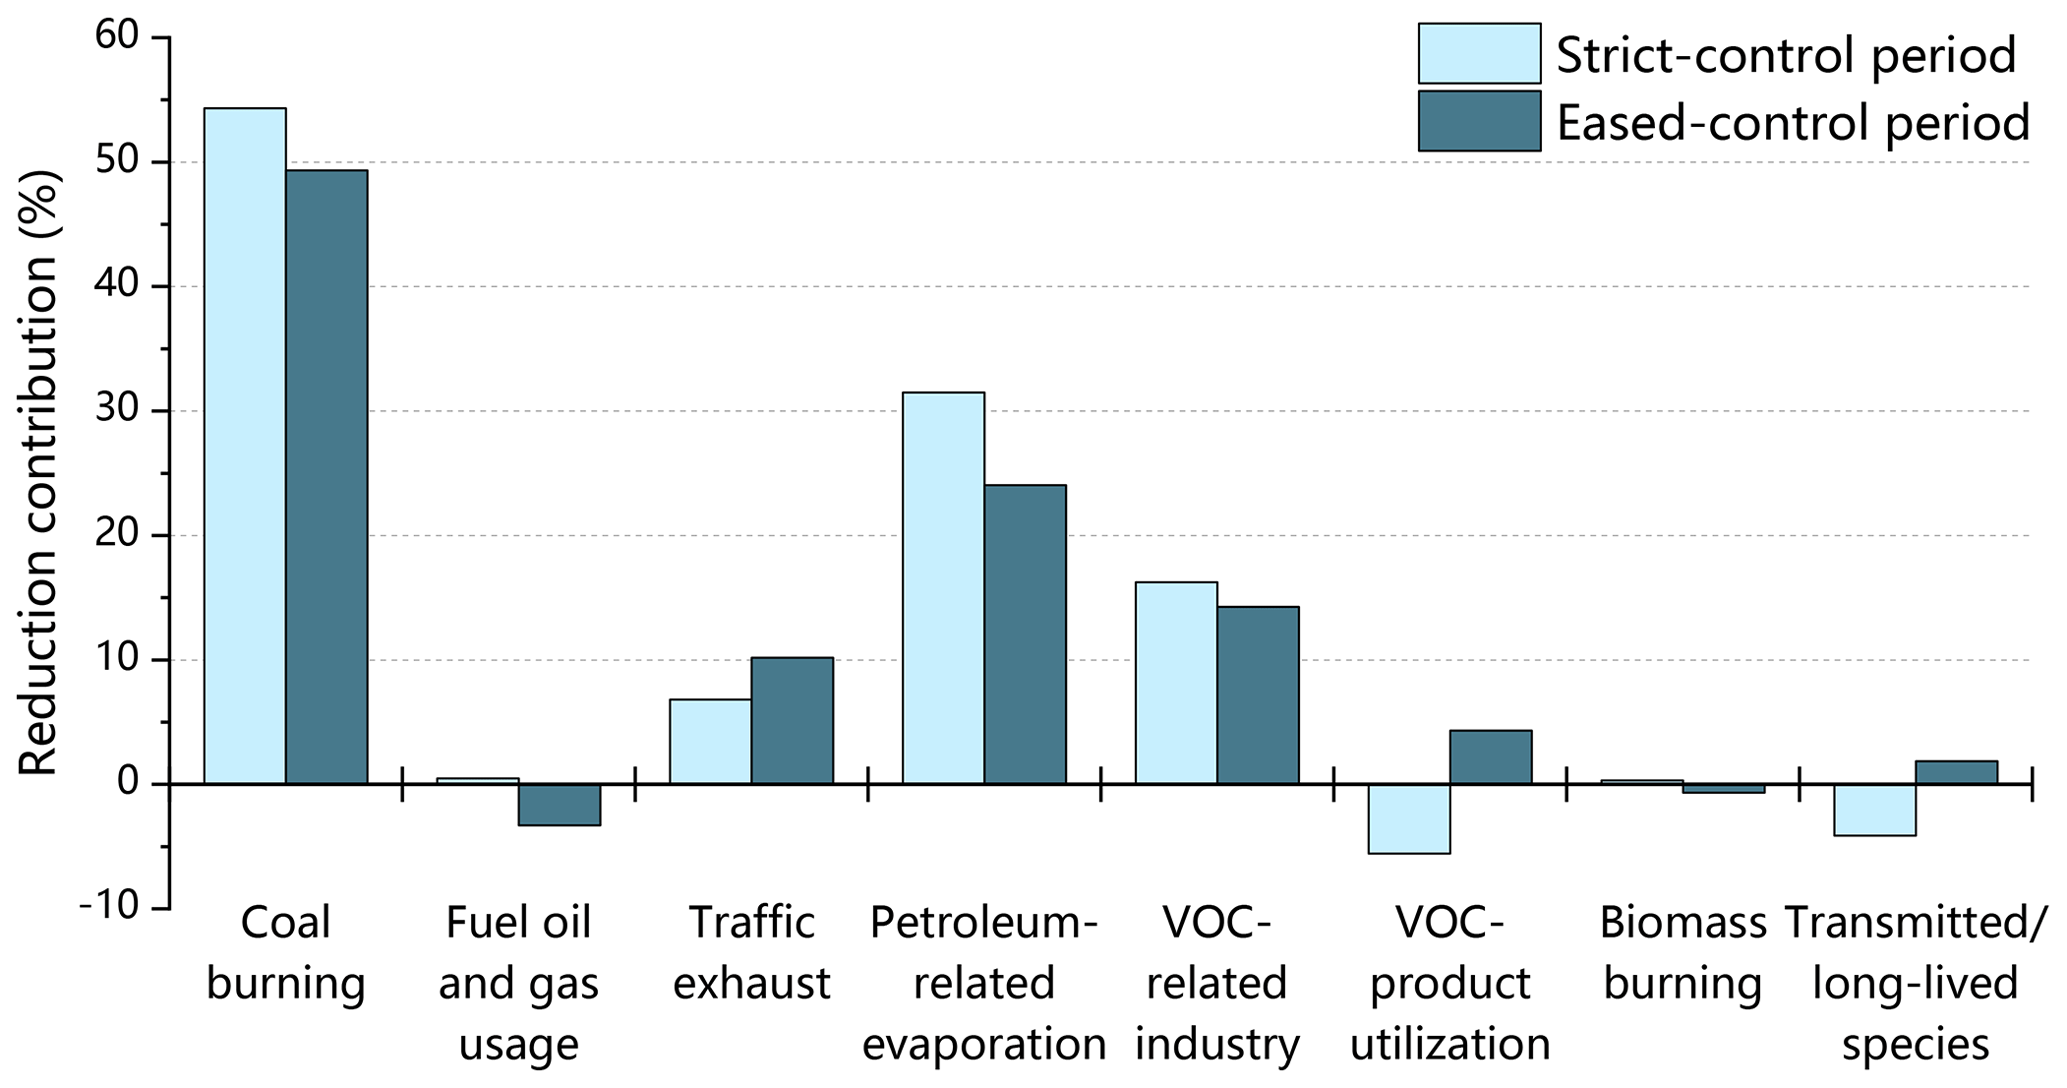
Figure 5Different source contributions of the strict- and eased-control periods to total reduction compared with the non-control period (ratio) derived by PMF analysis.
PMF is a widely used method for identifying emission sources and their contributions (Yuan et al., 2009; Simayi et al., 2020), but its results have some subjectivity and cannot be determined to be absolutely accurate. For this reason, PMF results are usually mutually corroborated with the actual situation, which is the implementation of control measures in this study. During the strict-control period, coal burning had the greatest reduction contribution (54.33 %) relative to the non-control period, followed by petroleum-related evaporation (31.49 %) and VOC-related industry (16.25 %). During the eased-control period, coal burning contributed 49.33 % of the total reduction relative to the non-control period, petroleum-related evaporation 24.03 %, and VOC-related industry 14.26 %. The consistent trend between the intensity of the control measures and the proportion of coal burning and other sources supports the credibility of the PMF results. Another supporting argument is the comparison of the PMF results in this study and PMF analyses from other studies conducted in Beijing, which is summarized by J. Li et al. (2019). A comparison of the relative contributions of VOC emission sources in Beijing calculated by the PMF model of this study and results from the other studies during different seasons is listed in Table S8. Other studies show that fuel combustion, mainly composed of coal combustion, was the largest VOC contributor in winter. The contribution proportion of fuel combustion in winter ranged from 45 % to 55 % (J. Li et al., 2015, 2019; Yang et al., 2018), which is even higher than but still comparable to that of the non-control period in this study (37 %). Other studies in Table S8 show that the vehicle-related source is the largest VOC contributor in Beijing, especially in summer and autumn, with the contribution ranging from 50 % to 57 % and 33 % to 49 %, respectively. The smaller and comparable contribution of the vehicle-related source in winter is reflected among other studies and this study. During the non-control period, coal burning contributed 37 % (33.5 ppbv) of the total ambient VOCs, far surpassing the contributions of other emission sources and even the combined influence of traffic exhaust and petroleum-related evaporation (33 %, 30.0 ppbv).
The terminal sectors of the burned coal include centralized coal burning (power generation, heat supply, large-scale industrial boilers) and scattered coal burning (rural and urban residential consumption, rural production, commercial and public consumption, small-scale industrial boilers). Of the overall coal burning in PMF results, SC burning, whose emission factors are far above centralized coal burning, could contribute much higher emissions than the centralized part. Residential and industrial sectors were the majority of SC burning in Beijing, which collectively contributed more than 90 % of all SC consumption. Generally, residential SC burning is mostly concentrated during the heating season, and most urban families are supplied heating centrally without SC consumption. It makes residential sectors, especially the rural residential sector, more significant in winter than the industrial sector. The monthly distribution of the industrial sector is relatively average throughout the year; therefore, SC used in small-scale industrial boilers and furnaces is much less than residential sectors in winter. Furthermore, higher combustion efficiency and lower VOC emission factors in industrial rather than civil sector utilization may make its emission contribution lower (Bo et al., 2008; Cheng et al., 2017). A small contribution of coal burning in summer, which is held up by the PMF results of other studies in Table S8, corroborates the important effect of residential SC burning. A detailed estimation of emissions from coal burning is given in Sect. 3.3.
3.3 Corrected emission inventory for VOCs
The EF-based emission inventory is calculated based on statistical activity data and emission factors, both of which have a high degree of uncertainty (C. Li et al., 2016), but still it has been widely used to quantify VOC emissions and sort out major emission sources (Simayi et al., 2019; Wu et al., 2016a). J. Li et al. (2019) verified an EF-based VOC emission inventory through ambient measurements and satellite retrievals and found that the vehicle-related VOC emissions are reliable and the emissions of NMHCs are accurate but that the emissions from fuel combustion sources, especially in winter, are largely underestimated. Based on the EF-based method and the modified source classification system, we established a monthly emission inventory for the non-control period (December 2016–January 2017), strict-control period (December 2017), and eased-control period (January 2018). After adding the undocumented SC consumption, which was obtained from existing research on SC consumption estimations and control measures for SC burning, errors in coal burning in the emission inventory were eliminated, and the estimation of coal burning contributions in the emission inventory was much closer to the PMF results (Fig. 6). The reduction in SC burning in December 2018 was reflected in both the emission inventory and PMF results. Industrial SC consumption was estimated in the emission inventory but with high uncertainty (Table S6); however, its relatively small proportion of the total SC consumption in Beijing during the heating season would largely reduce its influence on the estimations of total emissions from SC burning.
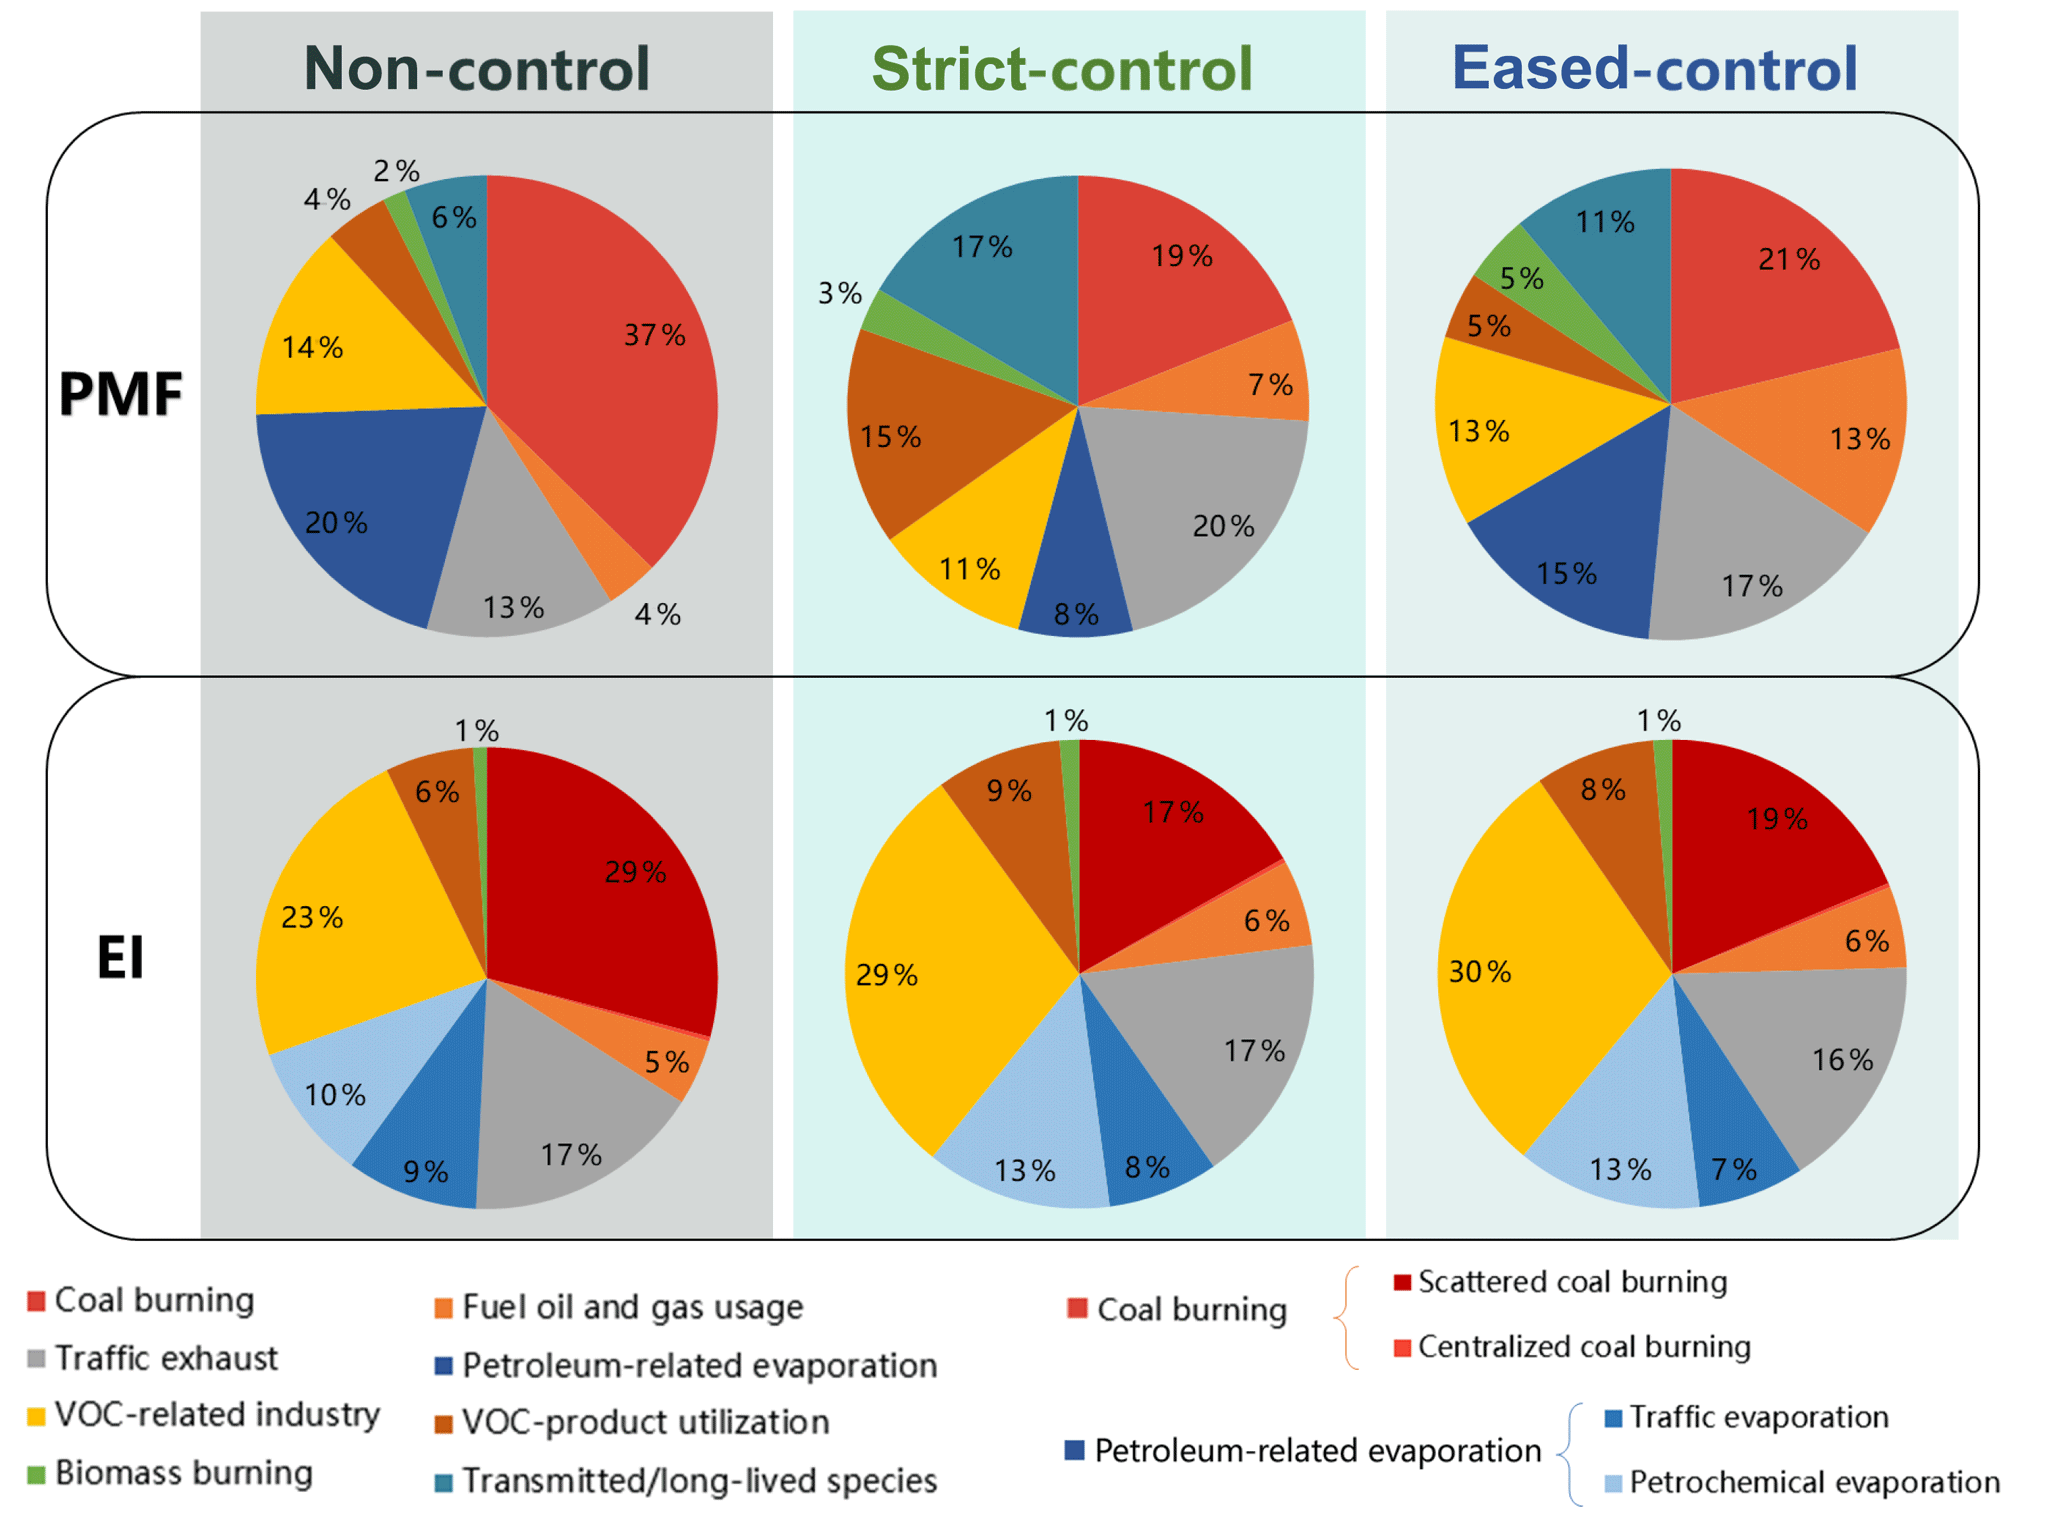
Figure 6The comparison of the PMF result and the corrected emission inventory of different control periods.
Based on the PMF results and the estimated emissions of other sources, coal burning contributed 36.2±10.4 and 14.7±8.6 Gg of anthropogenic VOC emissions in Beijing during the non-control and control periods, respectively. However, at least 80 % of the VOC emissions from coal burning were not considered in most existing emission inventory studies (J. Li et al., 2019; M. Li et al., 2019; Wu and Xie, 2018). Calculated emissions of SC burning in the corrected emission inventory were 23.7 and 10.5 Gg during the non-control and control periods, respectively, which are comparable to but lower than the estimations calculated using PMF. We note that uncertainty in heating demand and coal quality is a potential reason for these differences.
The corrected emission inventory had a more comparable proportional distribution to that of the PMF results during the non-control period. However, during the strict- and eased-control periods, we observed poor consistency between the PMF and emission inventory results particularly for VOC-related industry and petroleum-related evaporation. This could be the result of neglected factors, such as changes in industrial petrochemical and chemical production during air pollution alerts, and the shutdown of many polluting industries in 2017. We therefore suggest that the emission inventory results for the non-control period are reliable, but VOC-related industry and petrochemical evaporation are overestimated for the control periods.
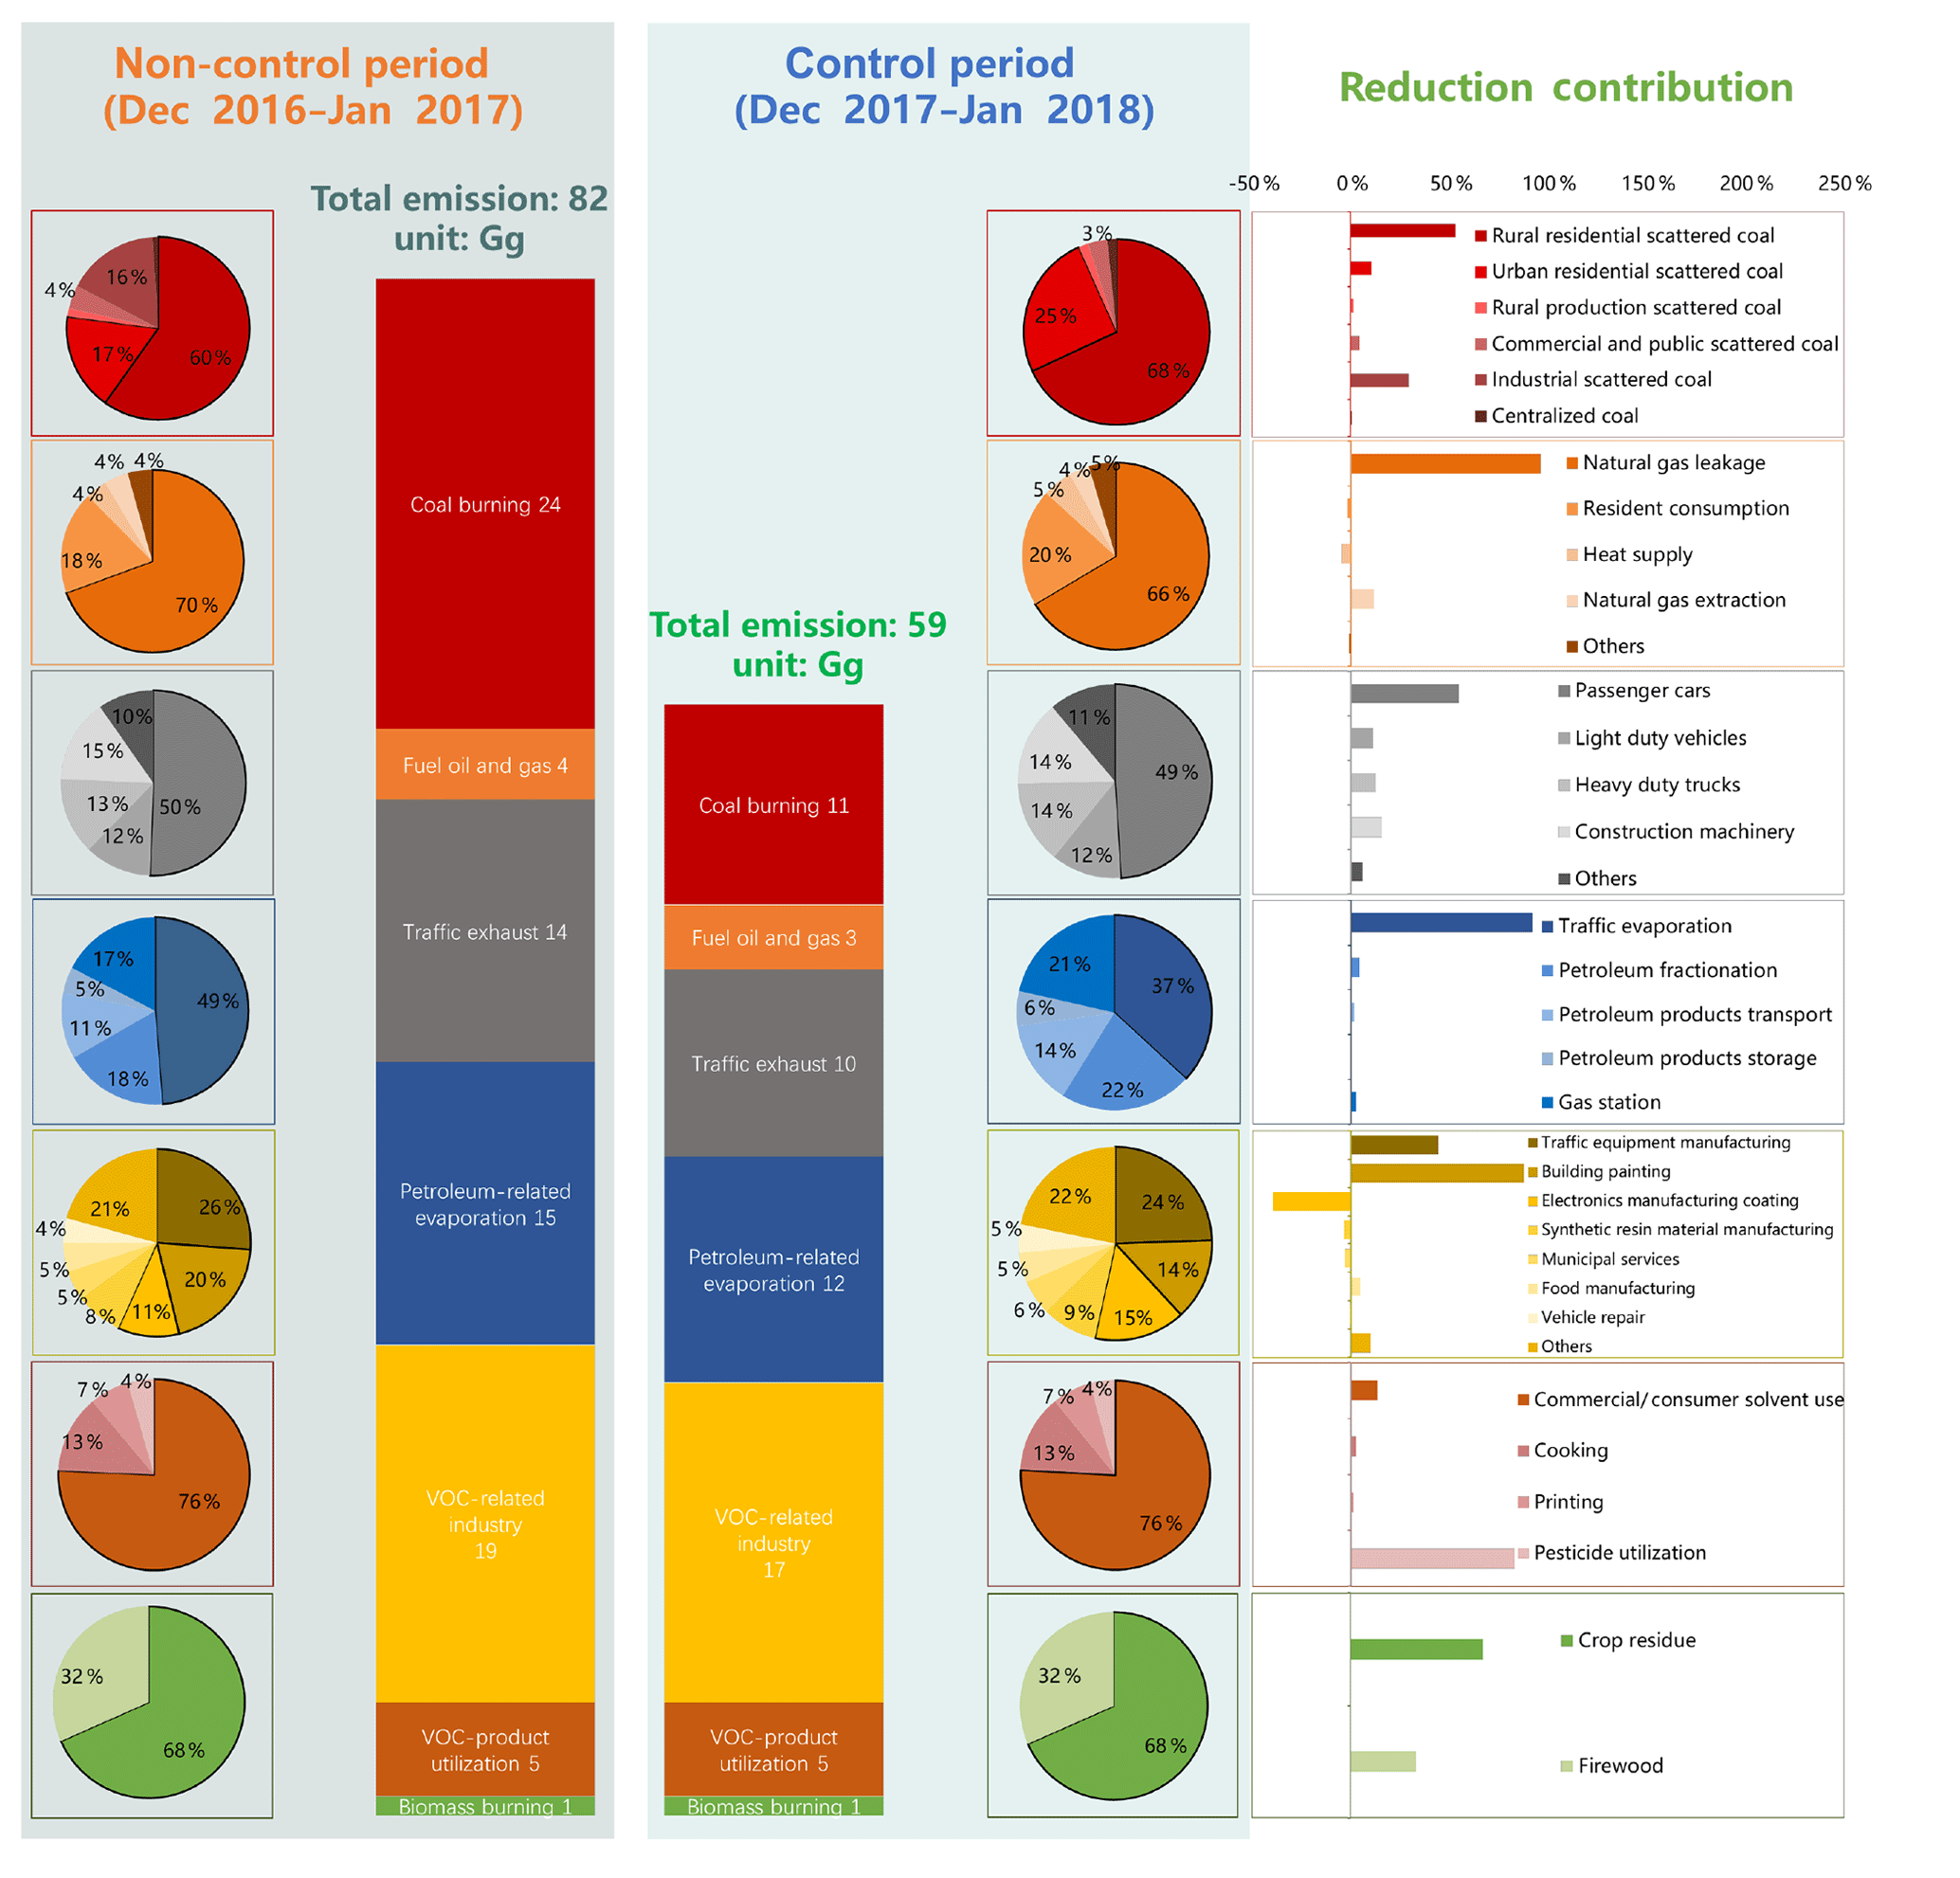
Figure 7Emissions (Gg) of seven sublevel anthropogenic sources of Level 1, major refined sub-contributors of each anthropogenic source, and reduction contribution of each refined sub-contributor from non-control to control periods.
Total emissions during the non-control period amounted to 82 Gg and decreased to 59 Gg during the control period. The largest sublevel source, coal burning, had the largest reduction (19 Gg), and the reduction was mostly contributed by rural residential SC burning. Other sublevel sources also contributed to the overall decline in emissions, such as fuel oil and gas usage (1 Gg), traffic exhaust (4 Gg), petroleum-related evaporation (3 Gg), and VOC-related industry (2 Gg). Emissions from VOC-product utilization and biomass burning did not change significantly between the non-control and control periods. Of the total coal burning during non-control and control periods, rural residential SC burning contributed 60 % and 68 %, respectively; urban residential SC burning contributed 17 % and 25 %, respectively; industrial SC burning contributed 16 % and 0 %, respectively; and centralized coal burning only contributed 1 % and 2 %, respectively. Emissions of seven sublevel anthropogenic sources of Level 1, major refined sub-contributors of each anthropogenic source, and reduction contributions of each refined sub-contributor from non-control to control periods are shown in Fig. 7.
3.4 SOAP calculations based on PMF results and the corrected emission inventory
In urban areas, anthropogenic-produced VOCs are major precursors to SOAs (Lin et al., 2009). The formation of SOAs from VOCs occurs through varied and complex physical and chemical processes. These are broadly categorized under three main theories within the literature: mechanisms related to photooxidation, nucleation processes, and condensation, gas–particle partition, and heterogeneous reactions (Hallquist et al., 2009; Kroll and Seinfeld, 2008).
Organic gaseous compounds can condense on primary particles, of which the greatest number are within 0.1–1 µm. Primary particles rarely coagulate but do undergo species (including VOC species) exchange in the gas phase. The transformation of organic vapors to a liquid or solid phase is promoted when the equilibrium vapor pressure is above that of the aerosol surface (Raes et al., 2000). Generally, molecular clusters tend to evaporate owing to the stronger Kelvin effect, but fulminic nucleation will occur under suitable conditions. Zhang et al. (2004) suggested that nucleation (new particle formation, NPF) is greatly enhanced by an interaction between organic and sulfuric acids particularly in an atmosphere polluted by heavy coal burning. Two types of NPF events, sulfate-dominated and organic-dominated, have been identified on the North China Plain (Ma et al., 2016). Condensation and self-coagulation begin, and thus promote growth, around 0.1 µm. Continuous growth of nucleation-mode particles over several days would lead to haze in Beijing, which has more abundant precursors in the atmosphere (Guo et al., 2014; Z. B. Wang et al., 2013). NPF has been recognized as an important process contributing to the formation of cloud condensation nuclei (CCN), concentrations of which have increased by 0.4 to 6 times in and around Beijing (Yue et al., 2011). Typically, organic matter contributes significantly to the mass growth which is characteristic of newly formed SOAs (Pennington et al., 2013). In Beijing, organic matter is likely the dominant chemical contributor facilitating the conversion of newly formed particles to CCN.
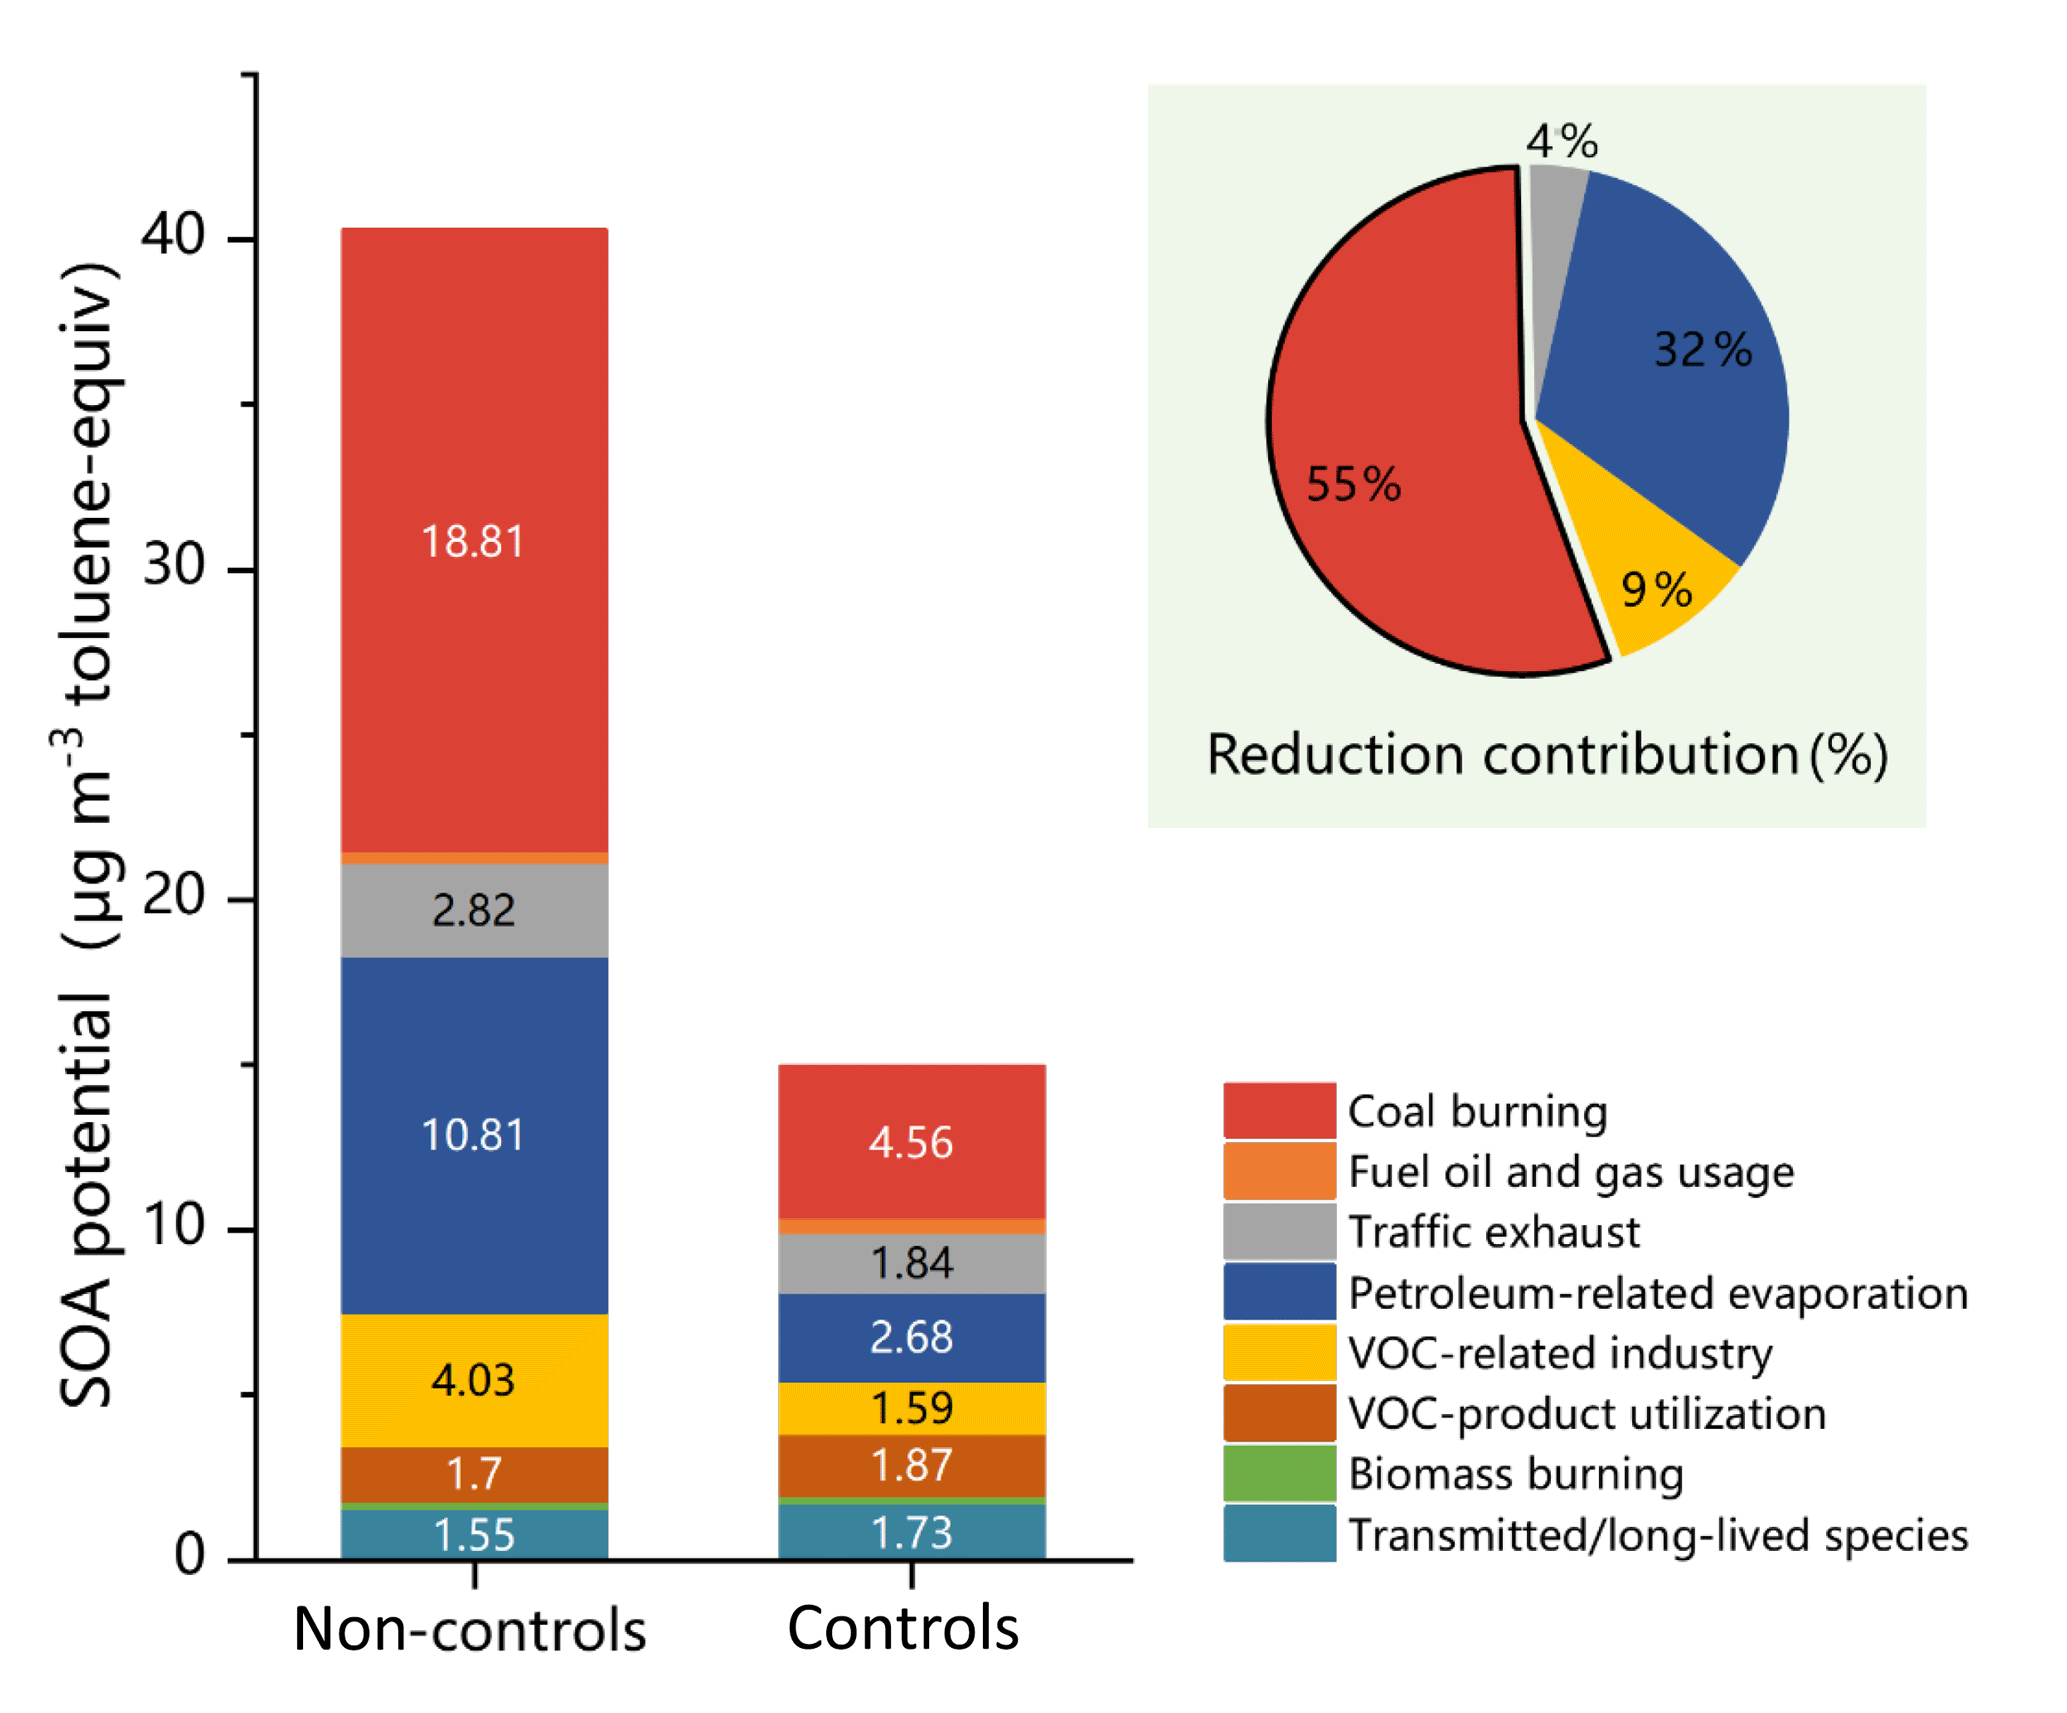
Figure 8SOAP-weighted mass contributions of different sources and their contribution to total reduction (%) based on PMF results.
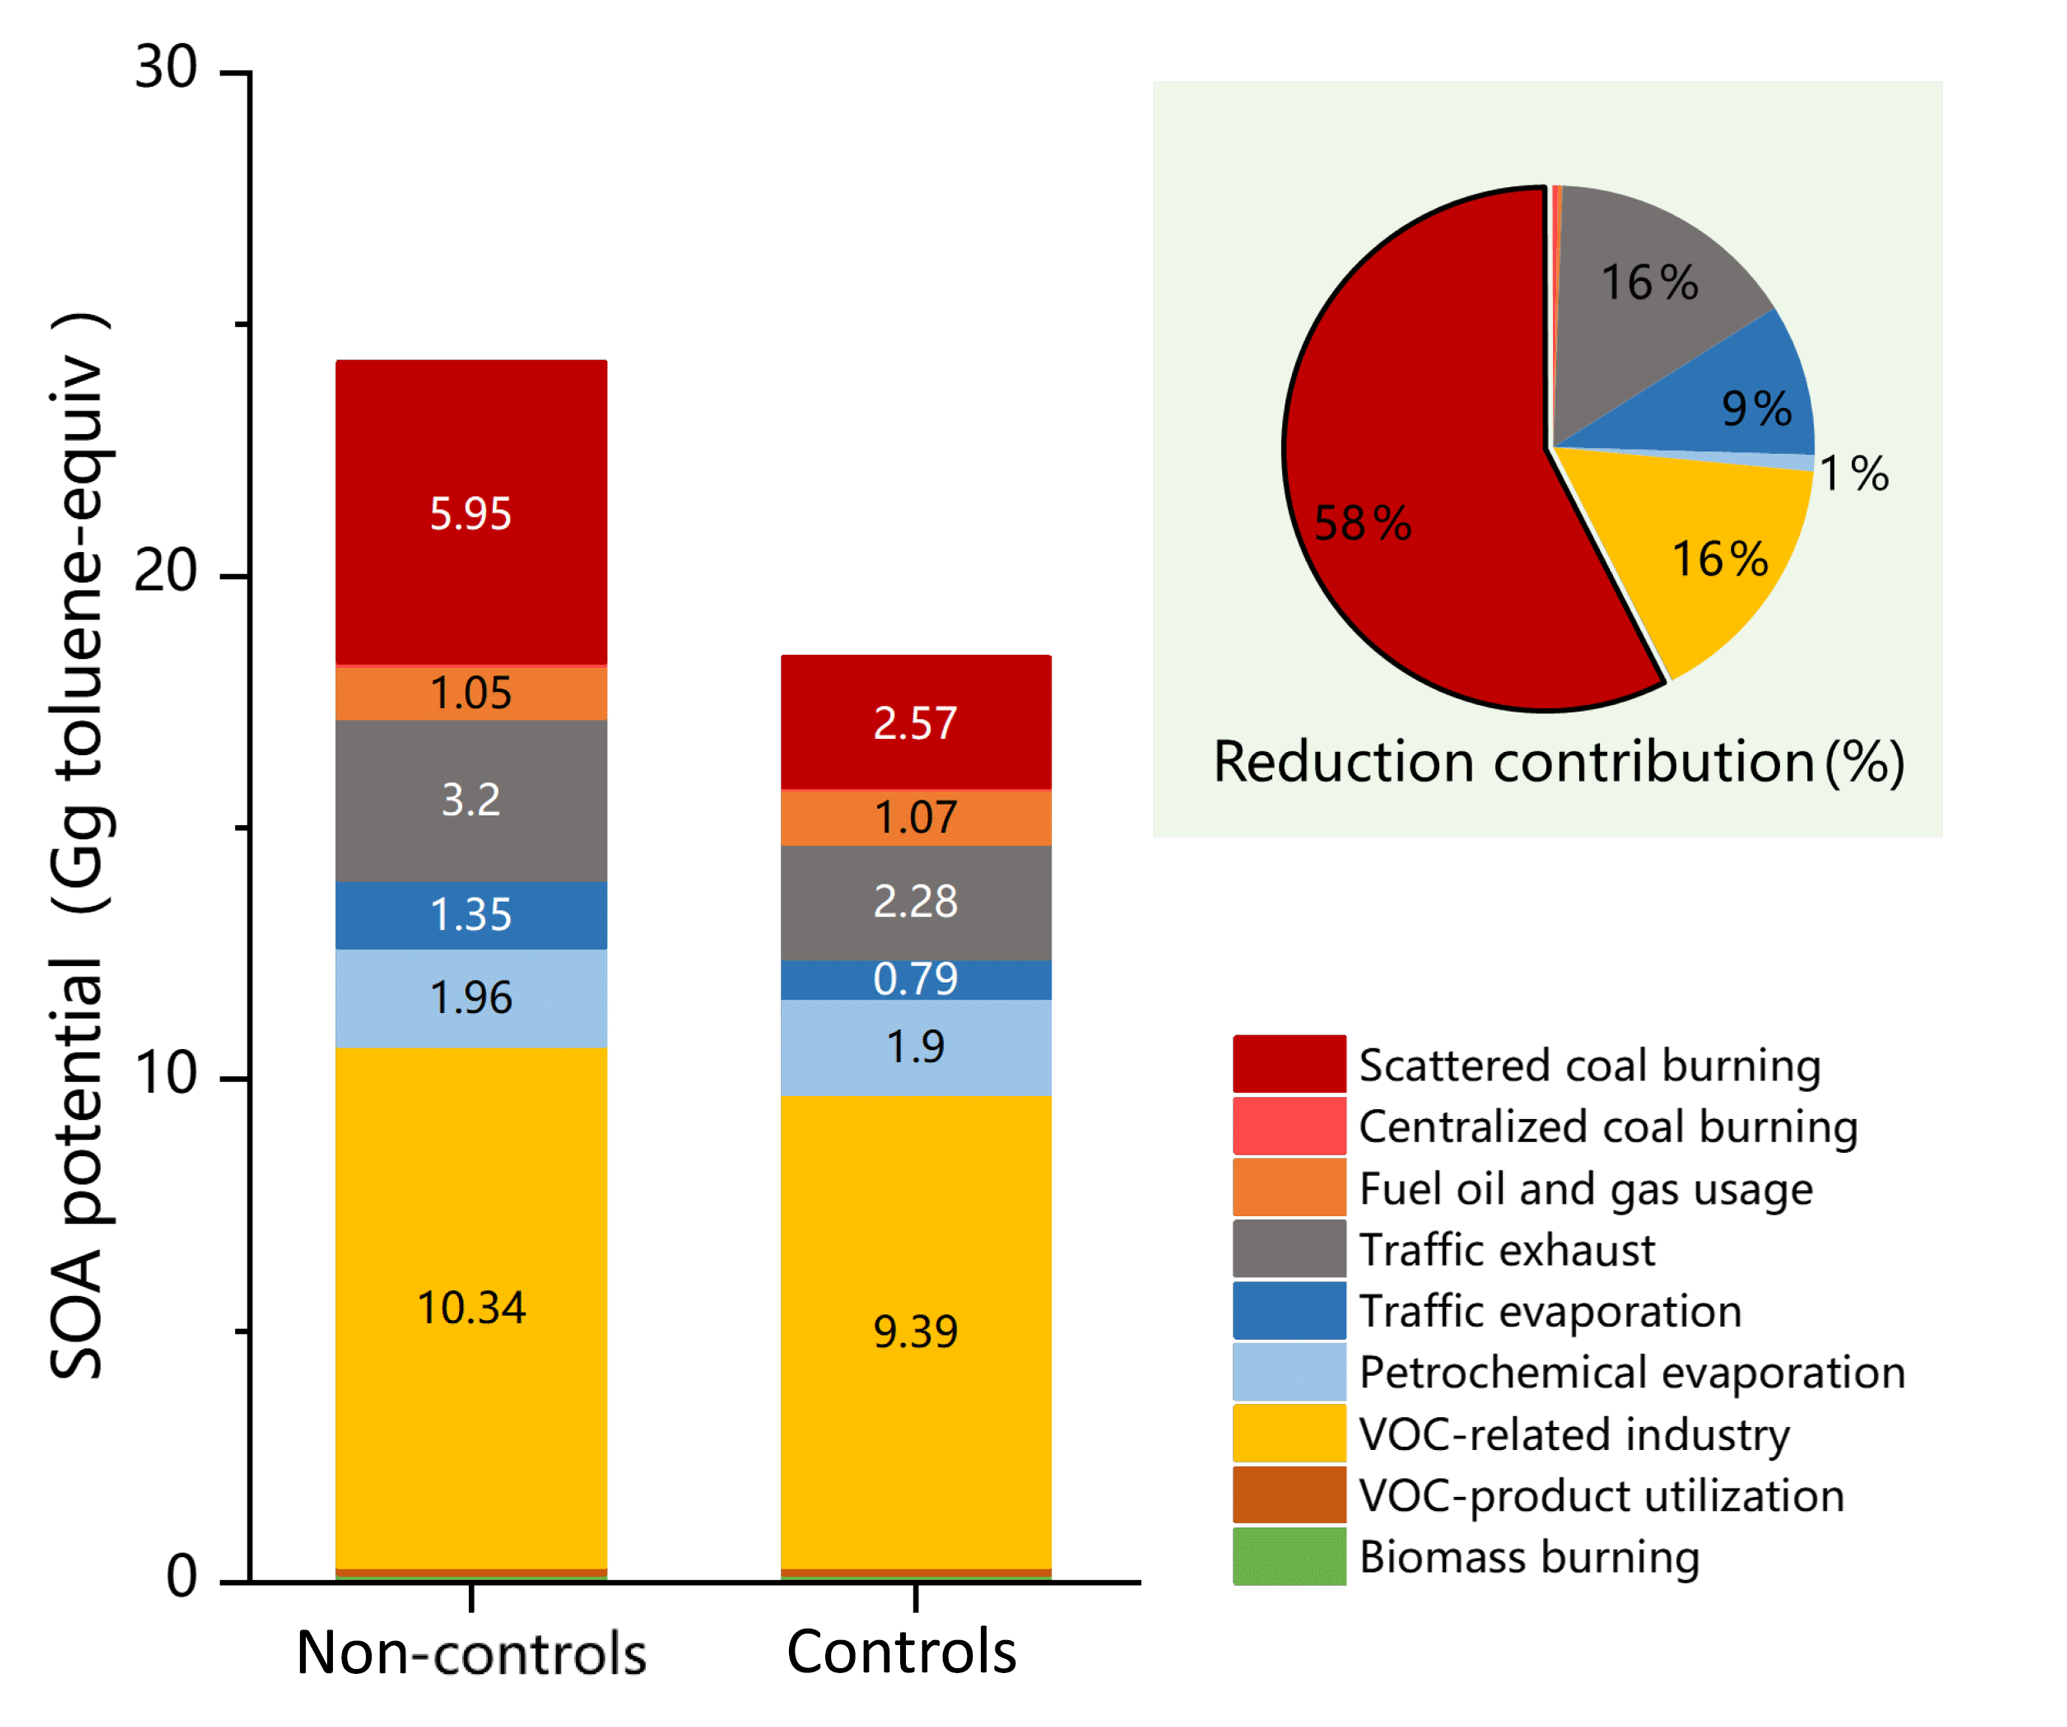
Figure 9SOAP-weighted mass contributions of different sources and their contribution to total reduction (%) based on emission inventory.
We used the SOAP approach to determine the effectiveness of the air quality control period as it pertained to a reduction in VOC emissions. We note that because SOA formation processes are poorly understood, SOAP was computed to understand the potential for SOA formation from VOC species, but we could not estimate the actual formation under specific atmospheric conditions. The concentration of PM2.5 was reportedly reduced in 2017 (Beijing Municipal Environmental Protection Bureau, http://sthjj.beijing.gov.cn/, last access: 5 August 2018). The observed large reduction in VOCs may have resulted in the reduction in SOAs and thereby contributed to the reduction in PM2.5. SOAP-weighted mass contributions of each VOC source were used to estimate the influence of precursor emissions on SOAs. SOAP-weighted mass contributions based on PMF results and the corrected emission inventory are shown in Figs. 8 and 9. According to the factor profiles of PMF results, styrene, toluene, benzene, and xylene, as the major contributors of SOAP, were largely attributed to coal burning (about 40 % on average), which accounted for 27 % of ambient VOCs but contributed 40 % of total SOAP during the whole study period. Moreover, according to the corrected emission inventory, 47 % of benzene, 27 % of toluene, and 10 % of xylene were attributed to coal burning as well.
The greatest contributor to SOAP reduction was coal burning, according to the results of both the PMF and the emission inventory, despite differences in their respective raw values. PMF results indicated that coal burning was the greatest contributor to SOAP at 18.81 µg m−3, accounting for 47 % during the non-control period. After control measures were enacted, the contribution of coal burning decreased to 4.56 µg m−3 and accounted for 30 % of the total. The reduction in coal burning contributed approximately 55 % of the total reduction. Petroleum-related evaporation and VOC-related industry contributed 25 % and 10 % of the total SOAP reduction prior to the establishment of control measures, respectively, and emissions from both sources were reduced over the control period.
Emission inventory results indicated that VOC-related industry was the largest contributor to the total SOAP-weighted mass during both the non-control and control periods. SC burning was the next largest contributor during the non-control period, contributing 64 % of the total.
3.5 Evaluation of control policies
The idea that reducing residential coal burning will improve air quality in Beijing has been well accepted within the scientific community (Cheng et al., 2016). J. Liu et al. (2016) proposed that reductions in residential emissions may have a greater benefit to air quality in Beijing than reductions from other emitters during the heating season and that promoting alternative fuels may be an effective solution. Our study confirmed that coal burning is the greatest contributor to VOC emissions (see PMF results), and we inferred that a large proportion of emissions was the result of SC burning during the heating season in non-control periods (see corrected emission inventory). The contributions of identified VOC sources decreased significantly after the control period, which means that VOC-related control measures were highly effective. The sharp decrease in SC burning between the non-control and control periods related to a reduction in the contribution of coal burning to ambient VOC mixing ratios. Multiple related measures were enacted during the control period, including the prohibition of SC burning in the countryside, deactivation of coal-fired units in thermal power plants, and conversion of decentralized coal-fired boilers to gas-fired boilers. Coal burning increased slightly between the strict- and eased-control periods, reflecting the allowance of residential SC burning in January 2018. Petroleum-related evaporation in PMF results was sharply reduced by controlling high-emission vehicles and reducing leakage from petrochemical industries. We accordingly confirmed that the contribution of coal burning to ambient VOC mixing ratios exceeded that of traffic-related sources prior to the strict-control period and that coal burning was the greatest contributor to higher VOC mixing ratios observed in winter. During and after the strict-control period, VOC mixing ratios decreased and vehicle exhaust became the main contributor again.
The limitations set by federal and municipal governments on coal burning played a significant role in improving air quality during Beijing's winters. According to the statistics of CESY, the total coal consumption of Beijing reached its highest point at over 30 million tons in 2005, then it kept going down to 4.9 million tons in 2017. The percentage of coal occupied in primary energy consumption dropped sharply from at least 30 % to less than 6 % in the past decade. It is reported by State Grid Beijing that Beijing has been implementing the “switching from coal to electricity” project for residential heating in winter since 2003 and had provided electric heating for more than 1.2 million families by 2018. Although significant effects have been achieved in Beijing, civil SC consumption is still prevalent nationwide.
For Beijing city, we corrected the SC consumption of both civil and industrial sectors, whose emission factors and monthly activity data are presented in Tables S1 and S6, respectively. But for the nationwide SC estimation, consumption from the industrial sector was difficult to count in most areas, and only data of civil sectors were available. Hence, only civil SC (rural residential, urban residential, rural production, commercial, and public sectors) was discussed (Huo et al., 2018). In 2016, total civil SC consumption was 311.4 million tons in China, and nearly 65 % of this came from the rural residential sector. Due to the unprecedented air pollution control measures, civil SC consumption in 2017 achieved a reduction of 18.7 million tons, and rural residential sector took up over 74 % of all SC consumption (Tables S9 and S10). BTH and the surrounding provinces, including Beijing, Tianjin, Hebei, Shanxi, Shandong, Henan, and Neimenggu, contributed 95 % of the total reduction (17.8 million tons). However, after the centralized limitation, BTH and the surrounding provinces are still areas with the highest civil SC consumption; Heilongjiang, Guizhou, Hunan, and Xinjiang are also provinces with high amounts of civil SC consumption (Fig. 10). To achieve global Sustainable Development Goals (SDGs) (Carter et al., 2020), the control of civil SC consumption is a significant topic to improve air quality, and the emission reduction in industrial SC combustion is also worth attention.
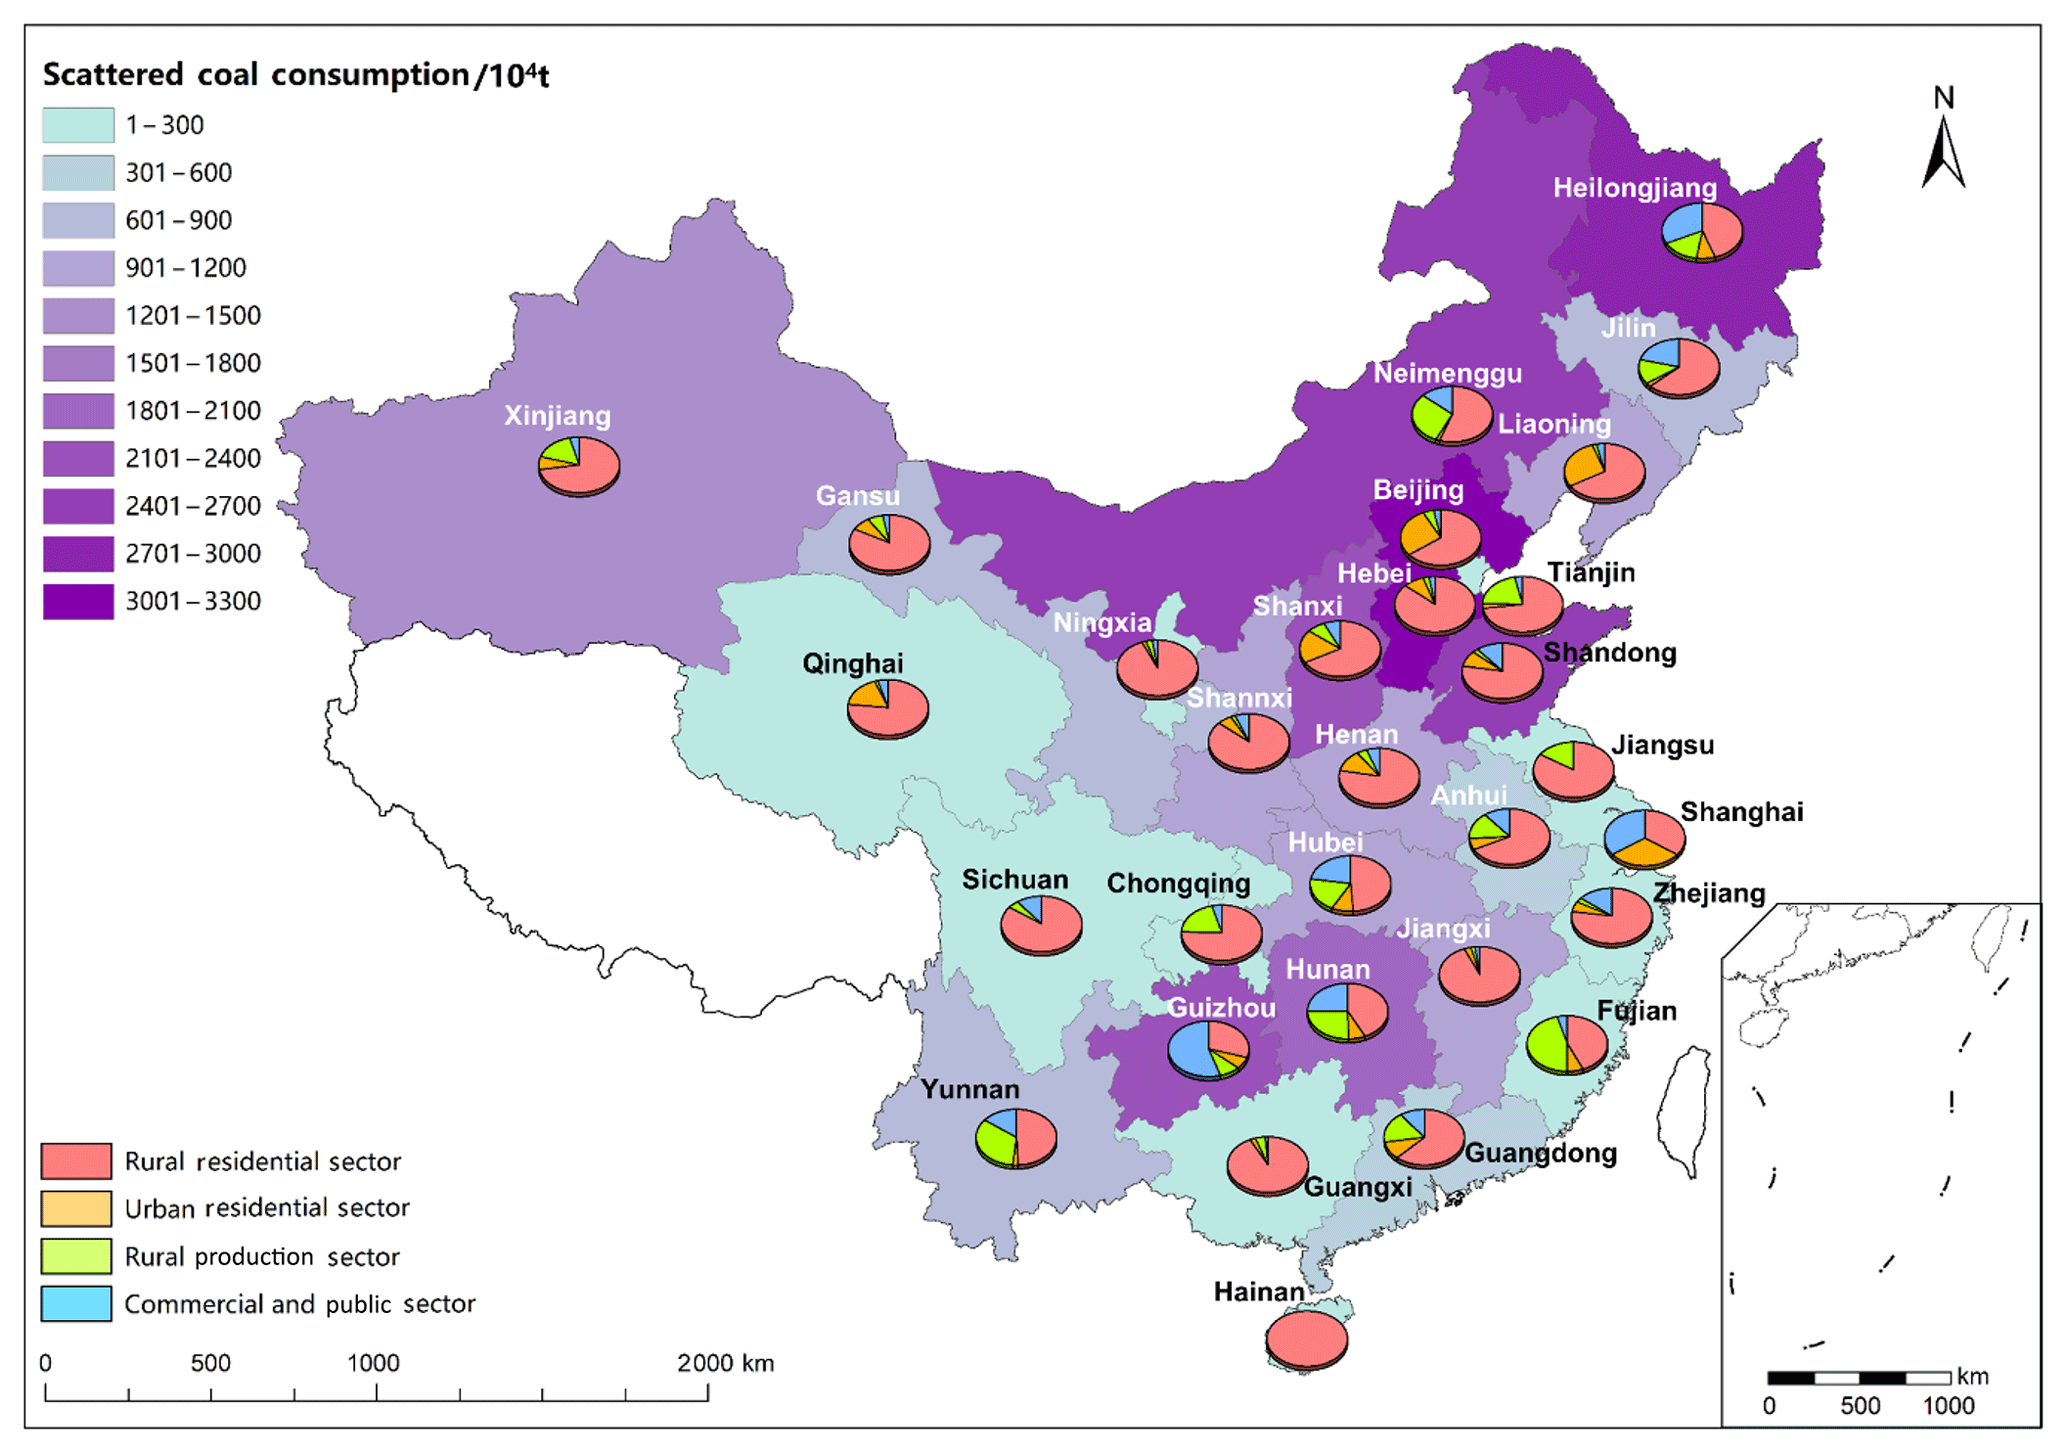
Figure 10Map of provincial civil SC consumption in mainland China in 2017 and proportion of different terminal sectors (lack of data in Tibet).
Petroleum-related evaporation and VOC-related industry were also significant contributors to VOC and SOAP reductions. Reductions in these sources were mainly driven by restrictions on petrochemical production and shutting down or regulating high-pollution industries and small factories. We note that vehicle tailpipe exhaust had a relatively small contribution to the overall reduction in VOCs, indicating that traffic controls for on-road vehicles had a limited impact. The promotion of higher-quality gasoline and diesel fuels may have contributed to the observed reduction in contributions from petroleum-related evaporation.
Several initiatives had been proposed to reduce direct coal burning particularly uncontrolled and inefficient household SC burning during the heating season. For example, a “switching from coal to natural gas” project was proposed by the Chinese government to reduce air pollution from coal-fired boilers and associated premature mortality, and its air quality, health, and climate implications were also assessed in detail (Qin et al., 2017, 2018). Lu et al. (2019) suggested that deploying coal–bioenergy gasification systems with carbon capture and storage may provide a promising opportunity for China to realize its carbon mitigation and air-pollution abatement goals simultaneously. These initiatives could contribute to the development of future policies aimed at supporting sustainable energy transitions, improving urban air quality, and protecting public health.
The mixing ratios and chemical compositions of 91 VOC species were measured during two sequential winters at PKU in Beijing, China. Three control periods were defined based on the enforcement of air quality control measures. The results of PMF analyses over these three periods are discussed based on the intensities of source emissions and the strength of control measures during the heating period. A corrected monthly EF-based inventory was compared to the PMF results, and this comparison suggested that coal burning, which had been identified as a large contributor of primary particles, was responsible for a large proportion of the total VOC emissions and total SOA potential during the winter months in Beijing. Coal burning was the largest contributor during the non-control period, exceeding vehicle-related sources, and SC burning accounted for more than 98 % of all coal burning emissions. Vehicle exhaust was the greatest contributor during the strict-control period when regulations on SC burning were enforced. The contribution from coal burning increased again during the eased-control period as SC was allowed as a residential heating source. On all accounts, differences in the results of PMF analyses and the emission inventory in preceding studies were mainly due to a gap in the estimation of SC burning, which had not previously been quantified. Mainly affected by the enhanced limitation on SC consumption, the VOC emissions in Beijing have been significantly cut down during heating seasons, and sustained shifting of cleaner energy use patterns will help to further improve air quality. Moreover, passenger car exhaust, petrochemical manufacturing, gas stations, traffic evaporation, traffic equipment manufacturing, painting, and electronics manufacturing are also contributors to ambient VOCs, which need to be focused on in future emission reduction strategies and targets in Beijing.
Although the SC burning has been cut down in Beijing, our detailed discussion of the effect of control measures in this study can provide valuable reference for the haze control in other regions where civil SC consumption prevails especially in winter. Those regions which rely on SC and biomass as their primary civil heating fuels nowadays should gradually promote a clean energy transformation in accordance with the level of local economic development and the living standards of local residents (Carter et al., 2019). The improvement of fossil fuel combustion efficiency and the popularization of clean energy use will be propitious to air quality and people's health and will help to achieve sustainable development in China.
The datasets that include the measurements and emissions can be accessed by contacting the corresponding author (Shaodong Xie; sdxie@pku.edu.cn).
The supplement related to this article is available online at: https://doi.org/10.5194/acp-20-9351-2020-supplement.
SDX designed the study. YS performed the data analyses and wrote the paper. ZX contributed to the development of the emission inventory. MS participated in data collection. JL assisted with the online measurements. All authors assisted with the interpretation of the results and the writing of the paper.
The authors declare that they have no conflict of interest.
This article is part of the special issue “In-depth study of air pollution sources and processes within Beijing and its surrounding region (APHHc-Beijing) (ACP/AMT inter-journal SI)”. It is not associated with a conference.
This work was supported by the National Air Pollution Prevention Joint Research Center of China for “The research of characteristics, emission reduction and regulatory system of volatile organic compounds in key sectors” (grant no. DQGG0204).
This research has been supported by the National Air Pollution Prevention Joint Research Center of China (grant no. DQGG0204).
This paper was edited by Lisa Whalley and reviewed by two anonymous referees.
Andreae, M. O.: Emission of trace gases and aerosols from biomass burning – an updated assessment, Atmos. Chem. Phys., 19, 8523–8546, https://doi.org/10.5194/acp-19-8523-2019, 2019.
Baker, A. K., Beyersdorf, A. J., Doezema, L. A., Katzenstein, A., Meinardi, S., Simpson, I. J., Blake, D. R., and Rowland, F. S.: Measurements of nonmethane hydrocarbons in 28 United States cities, Atmos. Environ., 42, 170–182, https://doi.org/10.1016/j.atmosenv.2007.09.007, 2008.
Barletta, B., Meinardi, S., Rowland, F. S., Chan, C. Y., Wang, X. M., Zou, S. C., Chan, L. Y., and Blake, D. R.: Volatile organic compounds in 43 Chinese cities, Atmos. Environ., 39, 5979–5990, https://doi.org/10.1016/j.atmosenv.2005.06.029, 2005.
Barletta, B., Meinardi, S., Simpson, I. J., Atlas, E. L., Beyersdorf, A. J., Baker, A. K., Blake, N. J., Yang, M., Midyett, J. R., Novak, B. J., McKeachie, R. J., Fuelberg, H. E., Sachse, G. W., Avery, M. A., Campos, T., Weinheimer, A. J., Rowland, F. S., and Blake, D. R.: Characterization of volatile organic compounds (VOCs) in Asian and north American pollution plumes during INTEX-B: identification of specific Chinese air mass tracers, Atmos. Chem. Phys., 9, 5371–5388, https://doi.org/10.5194/acp-9-5371-2009, 2009.
Barthelmie, R. and Pryor, S.: Secondary organic aerosols: Formation potential and ambient data, Sci. Total Environ., 205, 167–178, https://doi.org/10.1016/S0048-9697(97)00200-3, 1997.
Bo, Y., Cai, H., and Xie, S. D.: Spatial and temporal variation of historical anthropogenic NMVOCs emission inventories in China, Atmos. Chem. Phys., 8, 7297–7316, https://doi.org/10.5194/acp-8-7297-2008, 2008.
Cai, H. and Xie, S. D.: Tempo-spatial variation of emission inventories of speciated volatile organic compounds from on-road vehicles in China, Atmos. Chem. Phys., 9, 6983–7002, https://doi.org/10.5194/acp-9-6983-2009, 2009.
Cai, H. and Xie, S. D.: Temporal and spatial variation in recent vehicular emission inventories in China based on dynamic emission factors, J. Air Waste Manage., 63, 310–326, https://doi.org/10.1080/10962247.2012.755138, 2013.
Carter, E., Yan, L., Fu, Y., Robinson, B., Kelly, F., Elliott, P., Wu, Y., Zhao, L., Ezzati, M., Yang, X., Chan, Q., and Baumgartner, J.: Household transitions to clean energy in a multiprovincial cohort study in China, Nature Sustainability, 3, 42–50, https://doi.org/10.1038/s41893-019-0432-x, 2020.
CESY: China Energy Statistical Yearbook, China Statistics Press, available at: https://tongji.oversea.cnki.net/chn/navi/YearBook.aspx?id=N2018070147&floor=1 (last access: 15 September 2019), 2017.
CESY: China Energy Statistical Yearbook, China Statistics Press, available at: http://www.stats.gov.cn/tjsj/tjcbw/201909/t20190924_1699094.html (last access: 15 September 2019), 2018.
COALCAP report: Report of China Coal Consumption Cap Plan and Policy Research Project, Natural Resources Defense Council (NRDC), available at: http://coalcap.nrdc.cn/datum/info?id=68&type=1 (last access: 23 October 2018), 2017.
COALCAP report: Report of China Coal Consumption Cap Plan and Policy Research Project, Natural Resources Defense Council (NRDC), available at: http://coalcap.nrdc.cn/datum/info?id=79&type=1 (last access: 23 October 2018), 2018.
Chang, C. C., Wang, J. L., Liu, S. C., and Lung, S. C. C.: Assessment of vehicular and non-vehicular contributions to hydrocarbons using exclusive vehicular indicators, Atmos. Environ., 40, 6349–6361, https://doi.org/10.1016/j.atmosenv.2006.05.043, 2006.
Cheng, J., Su, J., Cui, T., Li, X., Dong, X., Sun, F., Yang, Y., Tong, D., Zheng, Y., Li, Y., Li, J., Zhang, Q., and He, K.: Dominant role of emission reduction in PM2.5 air quality improvement in Beijing during 2013–2017: a model-based decomposition analysis, Atmos. Chem. Phys., 19, 6125–6146, https://doi.org/10.5194/acp-19-6125-2019, 2019.
Cheng, M. M., Zhi, G. R., Tang, W., Liu, S. J., Dang, H. Y., Guo, Z., Du, J. H., Du, X. H., Zhang, W. Q., Zhang, Y. J., and Meng, F.: Air pollutant emission from the underestimated households' coal consumption source in China, Sci. Total Environ., 580, 641–650, https://doi.org/10.1016/j.scitotenv.2016.12.143, 2017.
Cheng, N., Zhang, D., Li, Y., and Fan, M.: Residential emissions in Beijing: About 400×104 t, P. Natl. Acad. Sci. USA, 113, E5778–E5779, https://doi.org/10.1073/pnas.1613118113, 2016.
Derwent, R. G., Jenkin, M. E., Saunders, S. M., and Pilling, M. J.: Photochemical ozone creation potentials for organic compounds in northwest Europe calculated with a master chemical mechanism, Atmos. Environ., 32, 2429–2441, https://doi.org/10.1016/s1352-2310(98)00053-3, 1998.
Derwent, R. G., Jenkin, M. E., Utembe, S. R., Shallcross, D. E., Murrells, T. P., and Passant, N. R.: Secondary organic aerosol formation from a large number of reactive man-made organic compounds, Sci. Total Environ., 408, 3374–3381, https://doi.org/10.1016/j.scitotenv.2010.04.013, 2010.
Finkelman, R. B., Belkin, H. E., and Zheng, B. S.: Health impacts of domestic coal use in China, P. Natl. Acad. Sci. USA, 96, 3427–3431, https://doi.org/10.1016/s0140-6701(01)80683-4, 1999.
Geng, G., Xiao, Q., Zheng, Y., Tong, D., Zhang, Y., Zhang, X., Zhang, Q., He, H., and Liu, Y.: Impact of China's Air Pollution Prevention and Control Action Plan on PM2.5 chemical composition over eastern China, Sci. China Earth Sci., 62, 1872–1884, https://doi.org/10.1007/s11430-018-9353-x, 2019.
Gilman, J. B., Lerner, B. M., Kuster, W. C., Goldan, P. D., Warneke, C., Veres, P. R., Roberts, J. M., de Gouw, J. A., Burling, I. R., and Yokelson, R. J.: Biomass burning emissions and potential air quality impacts of volatile organic compounds and other trace gases from fuels common in the US, Atmos. Chem. Phys., 15, 13915–13938, https://doi.org/10.5194/acp-15-13915-2015, 2015.
Guenther, A., Karl, T., Harley, P., Wiedinmyer, C., Palmer, P. I., and Geron, C.: Estimates of global terrestrial isoprene emissions using MEGAN (Model of Emissions of Gases and Aerosols from Nature), Atmos. Chem. Phys., 6, 3181–3210, https://doi.org/10.5194/acp-6-3181-2006, 2006.
Guo, S. J., Tan, J. H., Duan, J. C., Ma, Y. L., Yang, F. M., He, K. B., and Hao, J. M.: Characteristics of atmospheric non-methane hydrocarbons during haze episode in Beijing, China, Environ. Monit. Assess., 184, 7235–7246, https://doi.org/10.1007/s10661-011-2493-9, 2012.
Guo, S., Hu, M., Zamora, M. L., Peng, J. F., Shang, D. J., Zheng, J., Du, Z. F., Wu, Z., Shao, M., Zeng, L. M., Molina, M. J., and Zhang, R. Y.: Elucidating severe urban haze formation in China, P. Natl. Acad. Sci. USA, 111, 17373–17378, https://doi.org/10.1073/pnas.1419604111, 2014.
Hallquist, M., Wenger, J. C., Baltensperger, U., Rudich, Y., Simpson, D., Claeys, M., Dommen, J., Donahue, N. M., George, C., Goldstein, A. H., Hamilton, J. F., Herrmann, H., Hoffmann, T., Iinuma, Y., Jang, M., Jenkin, M. E., Jimenez, J. L., Kiendler-Scharr, A., Maenhaut, W., McFiggans, G., Mentel, Th. F., Monod, A., Prévôt, A. S. H., Seinfeld, J. H., Surratt, J. D., Szmigielski, R., and Wildt, J.: The formation, properties and impact of secondary organic aerosol: current and emerging issues, Atmos. Chem. Phys., 9, 5155–5236, https://doi.org/10.5194/acp-9-5155-2009, 2009.
Han, L., Zhou, W., Pickett, S. T., Li, W., and Qian, Y.: Multicontaminant air pollution in Chinese cities, B. World Health Organ., 96, 233–242, https://doi.org/10.2471/BLT.17.195560, 2018.
Hellen, H., Hakola, H., Pirjola, L., Laurila, T., and Pystynen, K. H.: Ambient air concentrations, source profiles, and source apportionment of 71 different C2–C10 volatile organic compounds in urban and residential areas of Finland, Environ. Sci. Technol., 40, 103–108, https://doi.org/10.1021/es051659d, 2006.
Huo, M. L., Zhao, J., Xu, Z., Shan, B. G., and Jia, D. X.: China Scattered Coal Consumption Map and Influence Factors, Electric Power, 051, 139–146, 2018.
Janssens-Maenhout, G., Crippa, M., Guizzardi, D., Dentener, F., Muntean, M., Pouliot, G., Keating, T., Zhang, Q., Kurokawa, J., WankmÜller, R., Denier van der Gon, H., Kuenen, J. J. P., Klimont, Z., Frost, G., Darras, S., Koffi, B., and Li, M.: HTAP_v2.2: a mosaic of regional and global emission grid maps for 2008 and 2010 to study hemispheric transport of air pollution, Atmos. Chem. Phys., 15, 11411–11432, https://doi.org/10.5194/acp-15-11411-2015, 2015.
Kroll, J. H. and Seinfeld, J. H.: Chemistry of secondary organic aerosol: Formation and evolution of low-volatility organics in the atmosphere, Atmos. Environ., 42, 3593–3624, https://doi.org/10.1016/j.atmosenv.2008.01.003, 2008.
Li, C., Yuan, Z., Ou, J., Fan, X., Ye, S., Xiao, T., Shi, Y., Huang, Z., Ng, S. K. W., Zhong, Z., and Zheng, J.: An AIS-based high-resolution ship emission inventory and its uncertainty in Pearl River Delta region, China, Sci. Total Environ., 573, 1–10, https://doi.org/10.1016/j.scitotenv.2016.07.219, 2016.
Li, H., Cheng, J., Zhang, Q., Zheng, B., Zhang, Y., Zheng, G., and He, K.: Rapid transition in winter aerosol composition in Beijing from 2014 to 2017: response to clean air actions, Atmos. Chem. Phys., 19, 11485–11499, https://doi.org/10.5194/acp-19-11485-2019, 2019.
Li, J., Xie, S. D., Zeng, L. M., Li, L. Y., Li, Y. Q., and Wu, R. R.: Characterization of ambient volatile organic compounds and their sources in Beijing, before, during, and after Asia-Pacific Economic Cooperation China 2014, Atmos. Chem. Phys., 15, 7945–7959, https://doi.org/10.5194/acp-15-7945-2015, 2015.
Li, J., Li, Y. Q., Bo, Y., and Xie, S. D.: High-resolution historical emission inventories of crop residue burning in fields in China for the period 1990–2013, Atmos. Environ., 138, 152–161, https://doi.org/10.1016/j.atmosenv.2016.05.002, 2016a.
Li, J., Wu, R. R., Li, Y. Q., Hao, Y. F., Xie, S. D., and Zeng, L. M.: Effects of rigorous emission controls on reducing ambient volatile organic compounds in Beijing, China, Sci. Total Environ., 557, 531–541, https://doi.org/10.1016/j.scitotenv.2016.03.140, 2016b.
Li, J., Hao, Y., Simayi, M., Shi, Y., Xi, Z., and Xie, S.: Verification of anthropogenic VOC emission inventory through ambient measurements and satellite retrievals, Atmos. Chem. Phys., 19, 5905–5921, https://doi.org/10.5194/acp-19-5905-2019, 2019.
Li, L. Y. and Xie, S. D.: Historical variations of biogenic volatile organic compound emission inventories in China, 1981–2003, Atmos. Environ., 95, 185–196, https://doi.org/10.1016/j.atmosenv.2014.06.033, 2014.
Li, L. Y., Xie, S. D., Zeng, L. M., Wu, R. R., and Li, J.: Characteristics of volatile organic compounds and their role in ground-level ozone formation in the Beijing-Tianjin-Hebei region, China, Atmos. Environ., 113, 247–254, https://doi.org/10.1016/j.atmosenv.2015.05.021, 2015.
Li, M., Zhang, Q., Kurokawa, J.-I., Woo, J.-H., He, K., Lu, Z., Ohara, T., Song, Y., Streets, D. G., Carmichael, G. R., Cheng, Y., Hong, C., Huo, H., Jiang, X., Kang, S., Liu, F., Su, H., and Zheng, B.: MIX: a mosaic Asian anthropogenic emission inventory under the international collaboration framework of the MICS-Asia and HTAP, Atmos. Chem. Phys., 17, 935–963, https://doi.org/10.5194/acp-17-935-2017, 2017.
Li, M., Zhang, Q., Zheng, B., Tong, D., Lei, Y., Liu, F., Hong, C., Kang, S., Yan, L., Zhang, Y., Bo, Y., Su, H., Cheng, Y., and He, K.: Persistent growth of anthropogenic non-methane volatile organic compound (NMVOC) emissions in China during 1990–2017: drivers, speciation and ozone formation potential, Atmos. Chem. Phys., 19, 8897–8913, https://doi.org/10.5194/acp-19-8897-2019, 2019.
Lin, P., Hu, M., Deng, Z., Slanina, J., Han, S., Kondo, Y., Takegawa, N., Miyazaki, Y., Zhao, Y., and Sugimoto, N.: Seasonal and diurnal variations of organic carbon in PM2.5 in Beijing and the estimation of secondary organic carbon, J. Geophys. Res.-Atmos., 114, D00G11, https://doi.org/10.1029/2008jd010902, 2009.
Liu, H. B., Kong, S. F., Wang, W., and Yan, Q.: Emission inventory of heavy metals in fine particles emitted from residential coal burning in China, Environ. Sci., 37, 2823–2835, https://doi.org/10.13227/j.hjkx.2016.08.002, 2016.
Liu, J., Mauzerall, D. L., Chen, Q., Zhang, Q., Song, Y., Peng, W., Klimont, Z., Qiu, X. H., Zhang, S. Q., Hu, M., Lin, W. L., Smith, K. R., and Zhu, T.: Air pollutant emissions from Chinese households: A major and underappreciated ambient pollution source, P. Natl. Acad. Sci. USA, 113, 7756–7761, https://doi.org/10.1073/pnas.1604537113, 2016.
Liu, L. C. and Wu, G.: Relating five bounded environmental problems to China's household consumption in 2011–2015, Energy, 57, 427–433, https://doi.org/10.1016/j.energy.2013.05.043, 2013.
Liu, Y., Shao, M., Zhang, J., Fu, L. L., and Lu, S. H.: Distributions and source apportionment of ambient volatile organic compounds in Beijing city, China, J. Environ. Sci. Heal. A, 40, 1843–1860, https://doi.org/10.1080/10934520500182842, 2005.
Liu, Y., Shao, M., Fu, L. L., Lu, S. H., Zeng, L. M., and Tang, D. G.: Source profiles of volatile organic compounds (VOCs) measured in China: Part I, Atmos. Environ., 42, 6247–6260, https://doi.org/10.1016/j.atmosenv.2008.01.070, 2008a.
Liu, Y., Shao, M., Lu, S., Chang, C.-C., Wang, J.-L., and Chen, G.: Volatile Organic Compound (VOC) measurements in the Pearl River Delta (PRD) region, China, Atmos. Chem. Phys., 8, 1531–1545, https://doi.org/10.5194/acp-8-1531-2008, 2008b.
Logue, J. M., Small, M. J., Stern, D., Maranche, J., and Robinson, A. L.: Spatial Variation in Ambient Air Toxics Concentrations and Health Risks between Industrial-Influenced, Urban, and Rural Sites, J. Air Waste Manage., 60, 271–286, https://doi.org/10.3155/1047-3289.60.3.271, 2010.
Lu, X., Cao, L., Wang, H. K., Peng, W., Xing, J., Wang, S. X., Cai, S. Y., Shen, B., Yang, Q., Nielsen, C. P., and McElroy, M. B.: Gasification of coal and biomass as a net carbon-negative power source for environment-friendly electricity generation in China, P. Natl. Acad. Sci. USA, 116, 8206–8213, https://doi.org/10.1073/pnas.1812239116, 2019.
Ma, N., Zhao, C., Tao, J., Wu, Z., Kecorius, S., Wang, Z., GrÖß, J., Liu, H., Bian, Y., Kuang, Y., Teich, M., Spindler, G., MÜller, K., van Pinxteren, D., Herrmann, H., Hu, M., and Wiedensohler, A.: Variation of CCN activity during new particle formation events in the North China Plain, Atmos. Chem. Phys., 16, 8593–8607, https://doi.org/10.5194/acp-16-8593-2016, 2016.
NRDC – Natural Resources Defense Council, Launching China Coal Cap Project: available at: http://nrdc.cn/news/newsinfo?id=58&cook=2 (last access: 5 August 2018), 2013.
Ng, N. L., Kroll, J. H., Chan, A. W. H., Chhabra, P. S., Flagan, R. C., and Seinfeld, J. H.: Secondary organic aerosol formation from m-xylene, toluene, and benzene, Atmos. Chem. Phys., 7, 3909–3922, https://doi.org/10.5194/acp-7-3909-2007, 2007.
Pandis, S. N.: Formation and properties of secondary atmospheric aerosol: from the laboratory to the supercomputer, J. Aerosol Sci., 28, S367–S370, https://doi.org/10.1016/S0021-8502(97)85184-1, 1997.
Peng, L. Q., Zhang, Q., Yao, Z. L., Mauzerall, D. L., Kang, S. C., Du, Z. Y., Zheng, Y. X., Xue, T., and He, K. B.: Underreported coal in statistics: A survey-based solid fuel consumption and emission inventory for the rural residential sector in China, Appl. Energ., 235, 1169–1182, https://doi.org/10.1016/j.apenergy.2018.11.043, 2019.
Pennington, M. R., Bzdek, B. R., DePalma, J. W., Smith, J. N., Kortelainen, A.-M., Hildebrandt Ruiz, L., PetÄjÄ, T., Kulmala, M., Worsnop, D. R., and Johnston, M. V.: Identification and quantification of particle growth channels during new particle formation, Atmos. Chem. Phys., 13, 10215–10225, https://doi.org/10.5194/acp-13-10215-2013, 2013.
Perry, R. and Gee, I. L.: Vehicle Emissions in Relation to Fuel Composition, Sci. Total Environ., 169, 149–156, https://doi.org/10.1016/0048-9697(95)04643-f, 1995.
Qin, Y., Wagner, F., Scovronick, N., Peng, W., Yang, J. N., Zhu, T., Smith, K. R., and Mauzerall, D. L.: Air quality, health, and climate implications of China's synthetic natural gas development, P. Natl. Acad. Sci. USA, 114, 4887–4892, https://doi.org/10.1073/pnas.1703167114, 2017.
Qin, Y., Höglund-Isaksson, L., Byers, E., Feng, K., Wagner, F., Peng, W., and Mauzerall, D. L.: Air quality–carbon–water synergies and trade-offs in China's natural gas industry, Nature Sustainability, 1, 505–511, https://doi.org/10.1038/s41893-018-0136-7, 2018.
Raes, F., Van Dingenen, R., Vignati, E., Wilson, J., Putaud, J. P., Seinfeld, J. H., and Adams, P.: Formation and cycling of aerosols in the global troposphere, Atmos. Environ., 34, 4215–4240, https://doi.org/10.1016/s1352-2310(00)00239-9, 2000.
Redington, A. L. and Derwent, R. G.: Modelling secondary organic aerosol in the United Kingdom, Atmos. Environ., 64, 349–357, https://doi.org/10.1016/j.atmosenv.2012.09.074, 2013.
Reff, A., Eberly, S. I., and Bhave, P. V.: Receptor modeling of ambient particulate matter data using positive matrix factorization: Review of existing methods, J. Air Waste Manage., 57, 146–154, https://doi.org/10.1080/10473289.2007.10465319, 2007.
Ru, M., Tao, S., R Smith, K., Shen, G., Shen, H., Huang, Y., Chen, H., Chen, Y., Chen, X., Liu, J., Li, B., Wang, X., and He, C.: Direct Energy Consumption Associated Emissions by Rural-to-Urban Migrants in Beijing, Environ. Sci. Technol., 49, 13708–13715, https://doi.org/10.1021/acs.est.5b03374, 2015.
Santos, C. Y. M., Azevedo, D. D., and Aquino Neto, F. R.: Atmospheric distribution of organic compounds from urban areas near a coal-fired power station, Atmos. Environ., 38, 1247–1257, https://doi.org/10.1016/j.atmosenv.2003.11.026, 2004.
Scheff, P. A. and Wadden, R. A.: Receptor modeling of volatile organic compounds. 1. Emission inventory and validation, Environ. Sci. Technol., 27, 617–625, https://doi.org/10.1021/es00041a005, 1993.
Seila, R. L., Main, H. H., Arriaga, J. L., Martinez, G., and Ramadan, A.: Atmospheric volatile organic compound measurements during the 1996 Paso del Norte Ozone Study, Sci. Total Environ., 276, 153–169, https://doi.org/10.1016/s0048-9697(01)00777-x, 2001.
Shen, G. F., Ru, M. Y., Du, W., Zhu, X., Zhong, Q. R., Chen, Y. L., Shen, H. Z., Yun, X., Meng, W. J., Liu, J. F., Cheng, H. F., Hu, J. Y., Guan, D. B., and Tao, S.: Impacts of air pollutants from rural Chinese households under the rapid residential energy transition, Nat. Commun., 10, 3405, https://doi.org/10.1038/s41467-019-11453-w, 2019.
Sheng, J. J., Zhao, D. L., Ding, D. P., Li, X., Huang, M. Y., Gao, Y., Quan, J. N., and Zhang, Q.: Characterizing the level, photochemical reactivity, emission, and source contribution of the volatile organic compounds based on PTR-TOF-MS during winter haze period in Beijing, China, Atmos. Res., 212, 54–63, https://doi.org/10.1016/j.atmosres.2018.05.005, 2018.
Sillman, S.: The relation between ozone, NOx and hydrocarbons in urban and polluted rural environments, Atmos. Environ., 33, 1821–1845, https://doi.org/10.1016/s1352-2310(98)00345-8, 1999.
Simayi, M., Hao, Y., Li, J., Wu, R., Shi, Y., Xi, Z., Zhou, Y., and Xie, S.: Establishment of county-level emission inventory for industrial NMVOCs in China and spatial-temporal characteristics for 2010–2016, Atmos. Environ., 211, 194–203, https://doi.org/10.1016/j.atmosenv.2019.04.064, 2019.
Simayi, M., Shi, Y., Xi, Z., Li, J., Yu, X., Liu, H., Tan, Q., Song, D., Zeng, L., Lu, S., and Xie, S.: Understanding the sources and spatiotemporal characteristics of VOCs in the Chengdu Plain, China, through measurement and emission inventory, Sci. Total Environ., 714, 136692, https://doi.org/10.1016/j.scitotenv.2020.136692, 2020.
Sinha, V., Kumar, V., and Sarkar, C.: Chemical composition of pre-monsoon air in the Indo-Gangetic Plain measured using a new air quality facility and PTR-MS: high surface ozone and strong influence of biomass burning, Atmos. Chem. Phys., 14, 5921–5941, https://doi.org/10.5194/acp-14-5921-2014, 2014.
Song, Y., Shao, M., Liu, Y., Lu, S. H., Kuster, W., Goldan, P., and Xie, S. D.: Source apportionment of ambient volatile organic compounds in Beijing, Environ. Sci. Technol., 41, 4348–4353, https://doi.org/10.1021/es0625982, 2007.
Tang, X.: An Overview of Air Pollution Problem in Megacities and City Clusters in China, AGU Spring Meeting Abstracts, 03, American Geophysical Union, 1 May 2007.
Wang, M., Shao, M., Lu, S. H., Yang, Y. D., and Chen, W. T.: Evidence of coal combustion contribution to ambient VOCs during winter in Beijing, Chinese Chem. Lett., 24, 829–832, https://doi.org/10.1016/j.cclet.2013.05.029, 2013.
Wang, M., Shao, M., Chen, W., Yuan, B., Lu, S., Zhang, Q., Zeng, L., and Wang, Q.: A temporally and spatially resolved validation of emission inventories by measurements of ambient volatile organic compounds in Beijing, China, Atmos. Chem. Phys., 14, 5871–5891, https://doi.org/10.5194/acp-14-5871-2014, 2014.
Wang, Z. B., Hu, M., Sun, J. Y., Wu, Z. J., Yue, D. L., Shen, X. J., Zhang, Y. M., Pei, X. Y., Cheng, Y. F., and Wiedensohler, A.: Characteristics of regional new particle formation in urban and regional background environments in the North China Plain, Atmos. Chem. Phys., 13, 12495–12506, https://doi.org/10.5194/acp-13-12495-2013, 2013.
Warren, B.: Influence of environmental parameters on secondary organic aerosol formation, PhD thesis, University of California, Riverside, Dissertation Abstracts International, 69–06, p. 3783., 186 pp., 2008.
Wei, W., Li, Y., Wang, Y. T., Cheng, S. Y., and Wang, L. T.: Characteristics of VOCs during haze and non-haze days in Beijing, China: Concentration, chemical degradation and regional transport impact, Atmos. Environ., 194, 134–145, https://doi.org/10.1016/j.atmosenv.2018.09.037, 2018.
Wu, R. R. and Xie, S. D.: Spatial Distribution of Secondary Organic Aerosol Formation Potential in China Derived from Speciated Anthropogenic Volatile Organic Compound Emissions, Environ. Sci. Technol., 52, 8146–8156, https://doi.org/10.1021/acs.est.8b01269, 2018.
Wu, R. R., Bo, Y., Li, J., Li, L. Y., Li, Y. Q., and Xie, S. D.: Method to establish the emission inventory of anthropogenic volatile organic compounds in China and its application in the period 2008–2012, Atmos. Environ., 127, 244–254, https://doi.org/10.1016/j.atmosenv.2015.12.015, 2016a.
Wu, R. R., Li, J., Hao, Y. F., Li, Y. Q., Zeng, L. M., and Xie, S. D.: Evolution process and sources of ambient volatile organic compounds during a severe haze event in Beijing, China, Sci. Total Environ., 560, 62–72, https://doi.org/10.1016/j.scitotenv.2016.04.030, 2016b.
Wu, W. J., Zhao, B., Wang, S. X., and Hao, J. M.: Ozone and secondary organic aerosol formation potential from anthropogenic volatile organic compounds emissions in China, J. Environ. Sci., 53, 224–237, https://doi.org/10.1016/j.jes.2016.03.025, 2017.
Xie, X., Shao, M., Liu, Y., Lu, S. H., Chang, C. C., and Chen, Z. M.: Estimate of initial isoprene contribution to ozone formation potential in Beijing, China, Atmos. Environ., 42, 6000–6010, https://doi.org/10.1016/j.atmosenv.2008.03.035, 2008.
Xue, T., Liu, J., Zhang, Q., Geng, G., Zheng, Y., Tong, D., Liu, Z., Guan, D., Bo, Y., Zhu, T., He, H., and Hao, J.: Rapid improvement of PM2.5 pollution and associated health benefits in China during 2013–2017, Sci. China Earth Sci., 62, 1847–1856, https://doi.org/10.1007/s11430-018-9348-2, 2019.
Yang, W., Zhang, Y., Wang, X., Li, S., Zhu, M., Yu, Q., Li, G., Huang, Z., Zhang, H., Wu, Z., Song, W., Tan, J., and Shao, M.: Volatile organic compounds at a rural site in Beijing: influence of temporary emission control and wintertime heating, Atmos. Chem. Phys., 18, 12663–12682, https://doi.org/10.5194/acp-18-12663-2018, 2018.
Yuan, B., Shao, M., Lu, S. H., and Wang, B.: Source profiles of volatile organic compounds associated with solvent use in Beijing, China, Atmos. Environ., 44, 1919–1926, https://doi.org/10.1016/j.atmosenv.2010.02.014, 2010.
Yuan, B., Shao, M., de Gouw, J., Parrish, D. D., Lu, S. H., Wang, M., Zeng, L. M., Zhang, Q., Song, Y., Zhang, J. B., and Hu, M.: Volatile organic compounds (VOCs) in urban air: How chemistry affects the interpretation of positive matrix factorization (PMF) analysis, J. Geophys. Res.-Atmos., 117, D24302, https://doi.org/10.1029/2012jd018236, 2012.
Yuan, Z., Lau, A. K. H., Shao, M., Louie, P. K. K., Liu, S. C., and Zhu, T.: Source analysis of volatile organic compounds by positive matrix factorization in urban and rural environments in Beijing, J. Geophys. Res.-Atmos., 114, D00G15, https://doi.org/10.1029/2008jd011190, 2009.
Yue, D. L., Hu, M., Zhang, R. Y., Wu, Z. J., Su, H., Wang, Z. B., Peng, J. F., He, L. Y., Huang, X. F., Gong, Y. G., and Wiedensohler, A.: Potential contribution of new particle formation to cloud condensation nuclei in Beijing, Atmos. Environ., 45, 6070–6077, https://doi.org/10.1016/j.atmosenv.2011.07.037, 2011.
Zeng, S. X., Tam, C. M., Tam, V. W. Y., and Deng, Z. M.: Towards implementation of ISO 14001 environmental management systems in selected industries in China, J. Clean. Prod., 13, 645–656, https://doi.org/10.1016/j.jclepro.2003.12.009, 2005.
Zhang, H. L., Wang, Y. G., Hu, J. L., Ying, Q., and Hu, X. M.: Relationships between meteorological parameters and criteria air pollutants in three megacities in China, Environ. Res., 140, 242–254, https://doi.org/10.1016/j.envres.2015.04.004, 2015.
Zhang, Q., Zheng, Y., Tong, D., Shao, M., Wang, S., Zhang, Y., Xu, X., Wang, J., He, H., Liu, W., Ding, Y., Lei, Y., Li, J., Wang, Z., Zhang, X., Wang, Y., Cheng, J., Liu, Y., Shi, Q., and Hao, J.: Drivers of improved PM2.5 air quality in China from 2013 to 2017, P. Natl. Acad Sci. USA, 116, 24463–24469, https://doi.org/10.1073/pnas.1907956116, 2019.
Zhang, R. Y., Suh, I., Zhao, J., Zhang, D., Fortner, E. C., Tie, X. X., Molina, L. T., and Molina, M. J.: Atmospheric new particle formation enhanced by organic acids, Science, 304, 1487–1490, https://doi.org/10.1126/science.1095139, 2004.
Zhang, Y. J., Mu, Y. J., Liu, J. F., and Mellouki, A.: Levels, sources and health risks of carbonyls and BTEX in the ambient air of Beijing, China, J. Environ. Sci., 24, 124–130, https://doi.org/10.1016/S1001-0742(11)60735-3, 2012.
Zhao, B., Zheng, H., Wang, S., Smith, K. R., Lu, X., Aunan, K., Gu, Y., Wang, Y., Ding, D., Xing, J., Fu, X., Yang, X., Liou, K.-N., and Hao, J.: Change in household fuels dominates the decrease in PM2.5 exposure and premature mortality in China in 2005–2015, P. Natl. Acad. Sci. USA, 115, 12401–12406, https://doi.org/10.1073/pnas.1812955115, 2018.
Zhao, H. Y., Geng, G. N., Zhang, Q., Davis, S. J., Li, X., Liu, Y., Peng, L. Q., Li, M., Zheng, B., Huo, H., Zhang, L., Henze, D. K., Mi, Z. F., Liu, Z., Guan, D. B., and He, K. B.: Inequality of household consumption and air pollution-related deaths in China, Nat. Commun., 10, 4337, https://doi.org/10.1038/s41467-019-12254-x, 2019.
Zheng, B., Tong, D., Li, M., Liu, F., Hong, C., Geng, G., Li, H., Li, X., Peng, L., Qi, J., Yan, L., Zhang, Y., Zhao, H., Zheng, Y., He, K., and Zhang, Q.: Trends in China's anthropogenic emissions since 2010 as the consequence of clean air actions, Atmos. Chem. Phys., 18, 14095–14111, https://doi.org/10.5194/acp-18-14095-2018, 2018.
Zheng, H., Kong, S., Xing, X., Mao, Y., Hu, T., Ding, Y., Li, G., Liu, D., Li, S., and Qi, S.: Monitoring of volatile organic compounds (VOCs) from an oil and gas station in northwest China for 1 year, Atmos. Chem. Phys., 18, 4567–4595, https://doi.org/10.5194/acp-18-4567-2018, 2018.
Zhou, X., and Elder, M.: Regional air quality management in China: The 2010 Guideline on Strengthening Joint Prevention and Control of Atmospheric Pollution, Int. J. Sust. Soc., 5, 232–249, https://doi.org/10.1504/IJSSOC.2013.054713, 2013.